Journal of Chromatography A, 1216 (2009) 6400–6409 Contents lists available at ScienceDirect Journal of Chromatography A journal homepage: www.elsevier.com/locate/chroma Liquid chromatography–negative ion atmospheric pressure photoionization tandem mass spectrometry for the determination of brominated flame retardants in environmental water and industrial effluents Alessandro Bacaloni, Luciano Callipo, Eleonora Corradini, Piero Giansanti, Riccardo Gubbiotti, Roberto Samperi, Aldo Laganà ∗ Department of Chemistry, “La Sapienza” University, Piazzale Aldo Moro 5, 00185 Rome, Italy article info Article history: Received 15 May 2009 Received in revised form 14 July 2009 Accepted 22 July 2009 Available online 29 July 2009 Keywords: Brominated flame retardants LC–MS Atmospheric pressure photoionization Water analysis Solid-phase extraction Liquid–liquid extraction abstract We describe the development of a liquid chromatography with negative-ion atmospheric pressure photoionization tandem mass spectrometric (LC/NI-APPI/MS/MS) method for the simultaneous deter- mination of tetrabromobisphenol A (TBBP-A) and five polybrominated diphenyl ethers (BDE-47, BDE-99, BDE-100, BDE-153 and BDE-154) in water. A mobile phase methanol/acetone/water was used, where acetone acts also as dopant. NI-APPI produced precursor ions corresponding to [M−H] − for TBBP-A, [M−Br+O] − , and [M−2Br+O] − for the BDE congeners studied. Each compound was quantified operat- ing in multiple reaction monitoring mode. Linearity was observed in the range 0.025–10ng injected for all compounds. Coefficients of determination R 2 ranged from 0.9934 to 0.9982. BDEs were poorly retained by solid-phase extraction (SPE) from river water and sewage treatment plant effluent, thus liquid–liquid extraction (LLE) by n-hexane should be used for these samples. The recoveries of TBBP-A and PBDEs from tap water (SPE), river water and industrial wastewater (LLE) were in the range of 81–88%, 78–92%, and 43–99%, respectively, with relative standard deviations below 17%. The limits of detection, based on signal-to-noise ratio of 3, ranged from 0.004 to 0.1ng injected, and method quantification limits were 0.2–3.3 ng L −1 but BDE47 (20.3 ng L −1 ). Only TBBP-A was found in a treated industrial sewage at 4 ng L −1 , while BDE-99 and BDE-100 were detected on suspended solids. © 2009 Published by Elsevier B.V. 1. Introduction Brominated flame retardants (BFRs) are exploited as additives in a variety of commercial application (such as plastics, textiles, electronic equipment and building materials) to prevent ignition and minimize fire damage. BFRs include hexabromocyclododecane (HBCD) stereoisomers, tetrabromobisphenol-A (TBBP-A) and poly- brominated diphenyl ethers (PBDEs), these last sold on the market in mixtures containing more congeners called tetraBDE, pentaBDE, octaBDE and decaBDE. Among BFRs, PBDEs have received partic- ular attention because, due to their environmental persistence and lypophilic nature, they show the tendency to bioaccumula- tion in wildlife and humans [1–6]. Concentrations in environmental samples and human tissues have been reported to increase expo- nentially over time, doubling approximately every five years [7]. Generally, BFRs have low acute toxicity, but they are linked to adverse physiological effects. In laboratory studies, this class of ∗ Corresponding author at: Dipartimento di Chimica, Università “La Sapienza”, Piazzale Aldo Moro 5, 00185 Rome, Italy. Tel.: +39 06 49913679; fax: +39 06 490631. E-mail address: [email protected] (A. Laganà). chemicals has been shown to elicit unfavorable effects on the endocrine system [8–13]. The PBDE congeners typically measured in human tissues are associated primarily with the pentaBDE mixture, and to some extent with the octaBDE mixture. As less brominated congeners, such as penta- and tetra-BDEs, are more toxic and bioavailable than more highly brominated congeners, such as octa-BDEs and deca-BDE [14], the European Directive 2003/11/EC completely banned the use of penta and octa-BDEs since 2004. Several states in the United States (CA, WA, ME) also banned penta- and octa-BDEs and, owing to growing apprehension, the main US chemical producer voluntarily agreed to stop manufac- turing these two PBDE commercial mixtures as from January 2005. However, there are a number of products still in use today that con- tain these mixtures: before these bans, the world market demand for PBDEs was estimated at approximately 70,000 metric tons/year [15]. Because of their persistence and still current use in some coun- tries, the fate of PBDEs will probably need to be monitored for many years to come. In addition, the fully brominated deca-BDE continues to be used [16], and PBDEs can be debrominated under anaerobic conditions by dehalogenating bacteria [17,18] or, for highly bromi- nated congeners, under exposure to UV lights [1]. Thus, in addition 0021-9673/$ – see front matter © 2009 Published by Elsevier B.V. doi:10.1016/j.chroma.2009.07.039

Welcome message from author
This document is posted to help you gain knowledge. Please leave a comment to let me know what you think about it! Share it to your friends and learn new things together.
Transcript

Ltr
ARD
a
ARRAA
KBLAWSL
1
iea(biouatsnGa
P
0d
Journal of Chromatography A, 1216 (2009) 6400–6409
Contents lists available at ScienceDirect
Journal of Chromatography A
journa l homepage: www.e lsev ier .com/ locate /chroma
iquid chromatography–negative ion atmospheric pressure photoionizationandem mass spectrometry for the determination of brominated flameetardants in environmental water and industrial effluents
lessandro Bacaloni, Luciano Callipo, Eleonora Corradini, Piero Giansanti,iccardo Gubbiotti, Roberto Samperi, Aldo Laganà ∗
epartment of Chemistry, “La Sapienza” University, Piazzale Aldo Moro 5, 00185 Rome, Italy
r t i c l e i n f o
rticle history:eceived 15 May 2009eceived in revised form 14 July 2009ccepted 22 July 2009vailable online 29 July 2009
eywords:rominated flame retardantsC–MS
a b s t r a c t
We describe the development of a liquid chromatography with negative-ion atmospheric pressurephotoionization tandem mass spectrometric (LC/NI-APPI/MS/MS) method for the simultaneous deter-mination of tetrabromobisphenol A (TBBP-A) and five polybrominated diphenyl ethers (BDE-47, BDE-99,BDE-100, BDE-153 and BDE-154) in water. A mobile phase methanol/acetone/water was used, whereacetone acts also as dopant. NI-APPI produced precursor ions corresponding to [M−H]− for TBBP-A,[M−Br+O]−, and [M−2Br+O]− for the BDE congeners studied. Each compound was quantified operat-ing in multiple reaction monitoring mode. Linearity was observed in the range 0.025–10 ng injected forall compounds. Coefficients of determination R2 ranged from 0.9934 to 0.9982. BDEs were poorly retained
tmospheric pressure photoionizationater analysis
olid-phase extractioniquid–liquid extraction
by solid-phase extraction (SPE) from river water and sewage treatment plant effluent, thus liquid–liquidextraction (LLE) by n-hexane should be used for these samples. The recoveries of TBBP-A and PBDEsfrom tap water (SPE), river water and industrial wastewater (LLE) were in the range of 81–88%, 78–92%,and 43–99%, respectively, with relative standard deviations below 17%. The limits of detection, based onsignal-to-noise ratio of 3, ranged from 0.004 to 0.1 ng injected, and method quantification limits were0.2–3.3 ng L−1 but BDE47 (20.3 ng L−1). Only TBBP-A was found in a treated industrial sewage at 4 ng L−1,
0 we
while BDE-99 and BDE-10. Introduction
Brominated flame retardants (BFRs) are exploited as additivesn a variety of commercial application (such as plastics, textiles,lectronic equipment and building materials) to prevent ignitionnd minimize fire damage. BFRs include hexabromocyclododecaneHBCD) stereoisomers, tetrabromobisphenol-A (TBBP-A) and poly-rominated diphenyl ethers (PBDEs), these last sold on the market
n mixtures containing more congeners called tetraBDE, pentaBDE,ctaBDE and decaBDE. Among BFRs, PBDEs have received partic-lar attention because, due to their environmental persistencend lypophilic nature, they show the tendency to bioaccumula-ion in wildlife and humans [1–6]. Concentrations in environmental
amples and human tissues have been reported to increase expo-entially over time, doubling approximately every five years [7].enerally, BFRs have low acute toxicity, but they are linked todverse physiological effects. In laboratory studies, this class of∗ Corresponding author at: Dipartimento di Chimica, Università “La Sapienza”,iazzale Aldo Moro 5, 00185 Rome, Italy. Tel.: +39 06 49913679; fax: +39 06 490631.
E-mail address: [email protected] (A. Laganà).
021-9673/$ – see front matter © 2009 Published by Elsevier B.V.oi:10.1016/j.chroma.2009.07.039
re detected on suspended solids.© 2009 Published by Elsevier B.V.
chemicals has been shown to elicit unfavorable effects on theendocrine system [8–13]. The PBDE congeners typically measuredin human tissues are associated primarily with the pentaBDEmixture, and to some extent with the octaBDE mixture. As lessbrominated congeners, such as penta- and tetra-BDEs, are moretoxic and bioavailable than more highly brominated congeners,such as octa-BDEs and deca-BDE [14], the European Directive2003/11/EC completely banned the use of penta and octa-BDEssince 2004. Several states in the United States (CA, WA, ME) alsobanned penta- and octa-BDEs and, owing to growing apprehension,the main US chemical producer voluntarily agreed to stop manufac-turing these two PBDE commercial mixtures as from January 2005.However, there are a number of products still in use today that con-tain these mixtures: before these bans, the world market demandfor PBDEs was estimated at approximately 70,000 metric tons/year[15].
Because of their persistence and still current use in some coun-
tries, the fate of PBDEs will probably need to be monitored for manyyears to come. In addition, the fully brominated deca-BDE continuesto be used [16], and PBDEs can be debrominated under anaerobicconditions by dehalogenating bacteria [17,18] or, for highly bromi-nated congeners, under exposure to UV lights [1]. Thus, in addition
atogr.
tf
msteudd(b
ipedeft1mtpfrstpsfiaeu(csrtAapc[2m(wtnc
s[tp
pisspoaba
A. Bacaloni et al. / J. Chrom
o the POPs officially recognized, in early 2007 they were consideredor inclusion in a future UNEP and UNECE protocol.
In general, PBDEs are amenable to gas chromatography. Deter-ination has been performed by gas chromatography–mass
pectrometry (GC–MS) by using chemical ionization [19], elec-ron ionization [20] and negative chemical ionization [21]. Thelectron capture detector (ECD) has also been employed [22]. Liq-id chromatography (HPLC) coupled to variable wavelength UVetector [23] and, for selective and sensitive determination, to tan-em MS with the atmospheric pressure photoionization sourceHPLC–APPI–MS/MS) [24–28], represent a valid alternative to GCased methods.
Although mainly accumulated in biota or adsorbed by sed-ments and dust, PBDEs, especially the most dangerous tetra-,enta- and hexa-bromine congeners, may be present in sewage andnvironmental waters. Nevertheless, literature regarding PBDEsetermination in water samples is rather scarce. Liquid–liquidxtraction (LLE) is the simplest approach for the BFRs extractionrom aqueous samples. However, due to their hydrophobic charac-er and consequently low concentration in water, volumes up to000 mL are typically required for enrichment [29]. Alternatively,icrowave assisted extraction (MAE) has been used for quantita-
ive recovery of tri- to hexa-BDEs preconcentrated in low-densityolyethylene semipermeable membrane devices (SPMDs) deployed
or 20 h in a sewage treatment plant [30]. The MAE method providedecoveries of 72–91% with relative standard deviations (RSDs) <13. Ahortcoming of MAE is the co-extraction of large amounts of poten-ially interfering components from the SPMDs. To overcome thisroblem, gel permeation chromatography (GPC) combined with aelective detection by GC–ion trap-MS/MS was used [30]. Hollow-ber microporous membrane liquid–liquid extraction was used aslow solvent volume LLE technique [31]. The authors claimed 1 h
xtraction time gave 80–113% recoveries and no matrix effect bysing PCB 209 as internal standard. Solid-phase microextractionSPME) has been also evaluated for the analysis of PBDEs [32]. Since,ontrarily to what would be expected from their low vapour pres-ures, higher recoveries were achieve by sampling the headspaceather than by direct immersion, the method seems to be limited upo penta-BDE congeners [32]. Recoveries were >87% and RSDs <19%.
closely related technique, stir bar sorption extraction (SBSE) onpolydimethylsiloxane stir bar, has been used for the quantitativereconcentration of tri- to hexa-BDEs from 100 mL of surface waterontaminated by the effluents from a plastic-production company29]. 20% methanol (v/v) was added to the water sample, and a5 h preconcentration time was used. Then, the analytes were ther-ally desorbed in a GC injection port, resulting in limits of detection
LODs) of 0.4–10 ng/L. A rather long preconditioning of the stir baras also necessary to avoid cross contamination. As can be infer,
he extraction of PBDEs from water samples is a challenge, andone of the proposed methods fulfil all the required characteristicsontemporaneously.
TBBP-A is the largest BFR in terms of production: the annual con-umption worldwide has been estimated as 119,600 tons in 200133]; 80% of TBBP-A is used as a reacted flame retardant in elec-rical and electronic equipment and 20% is used as an additive tolastics.
The main use in the reactive applications is for epoxy resins ofrinted circuit boards. As an additive flame retardant it is used
n acrylonitrile butadiene styrene resins, used for example in TVets. At present there are no limitations for the use of this sub-tance. On June 18, 2008 The Official Journal of the European Union
ublished as “Commission Communication and Commission Rec-mmendation” the results of a risk assessment study [34]. The riskssessment showed that risks to human health are not expected,ut there is need for further information and testing for the aquaticnd terrestrial ecosystem.A 1216 (2009) 6400–6409 6401
In spite of the amount produced, TBBP-A is not frequently ana-lyzed in environmental laboratories, probably because its bioaccu-mulation potential is lower than that of the PBDEs. TBBP-A has beenanalyzed by GC–MS after derivatization [35], however, at present,the determination by HPLC–ESI–MS/MS, appears to be the simplest,most attractive option [36–39]. APPI source has been also testedshowing low performances [25]. Although rarely determined inwater samples [40], TBBP-A seems amenable for extraction by SPE.
The aim of this work was to develop a fast and reliableLC–APPI–MS/MS method for determining TBBP-A and PBDE con-geners of primary interest in water. The BFRs of major concernand whose chemical properties cause them to be more abundantin environmental samples such as two tetra-bromine (TBBP-A andBDE-47), two penta-bromine (BDE-99 and BDE-100) and two hexa-bromine (BDE-153 and BDE-154) were selected. Two extractionmethods, LLE and SPE, were compared for extraction from envi-ronmental waters.
2. Experimental
2.1. Chemicals and reagents
PBDE, 2,2′,4,4′-tetrabromo diphenyl ether (BDE-47), 2,2′,4,4′,5-pentabromo diphenyl ether (BDE-99), 2,2′,4,4′,6-pentabromodiphenyl ether (BDE-100), 2,2′,4,4′,5,5′-hexabromo diphenyl ether(BDE-153), 2,2′,4,4′,5,6′-hexabromo diphenyl ether (BDE-154) andtetrabromobisphenol A (TBBP-A) were purchased from Sigma(Milan, Italy). Structures, acronyms and molecular weights of theselected compounds are reported in Table 1.
Individual stock standards were prepared at 50 �g mL−1 inmethanol and stored in the dark at −20 ◦C. Working standardsolutions of each compound were prepared by diluting the stockstandard in methanol to achieve a concentration of 1 �g mL−1. Com-posite working standard solutions were prepared by combiningaliquots of each of the individual stock solutions and diluting themwith methanol to obtain the required concentration. All the abovesolutions were kept at +4 ◦C, in dark vials, and allowed to equilibrateat room temperature before use.
All organic solvents were HPLC grade from Carlo Erba (Milan,Italy) and were used as received. Ultrapure water was producedfrom distilled water using a Milli-Q system (Millipore Corp., Biller-ica, MA, USA).
2.2. Solid-phase extraction apparatus
Three SPE adsorbents were tested: Oasisis® HLB cartridges, 6 mL,200 mg; (Waters, Milford, MA, USA), LC-18 cartridges, 6 mL, 250 mg;(Supelco, Bellefonte, PA, USA) and Carbograph-1 (LARA, Rome,Italy); Carbograph-1 is a graphitized carbon black (GCB) with a sur-face area of 120 m2 g−1 and particle size range of 120–400 mesh.Carbograph-1 cartridges were prepared by filling 6 mL polypropy-lene tubes with 250 mg of the adsorbent placed between twopolyethylene frits.
The SPE cartridges were fitted into a side-arm filtration flask, andconditioned with 5 mL of dichloromethane:methanol 80:20 (v/v),followed by 5 mL methanol and 5 mL of ultrapure water beforeextraction. Water samples were forced through the cartridges byvacuum (water pump).
2.3. Water samples
Tiber river water samples were collected in 3 different months,at a single station (41◦47′53′′N, 12◦24′42′′E); river Aniene, a heavilypolluted tributary of the Tiber (BOD5 >15 mg L−1, COD >25 mg L−1,years 2006–2008) [41], was sampled in the same days (41◦93′16′′N,12◦67′33′′E). The samples were taken at the centre of the river, and

6402 A. Bacaloni et al. / J. Chromatogr. A 1216 (2009) 6400–6409
Table 1Structures, acronyms and molecular weights of investigated compounds.
Chemical name Acronym Molecular weight CAS no. Chemical structure
Tetrabromo bisphenol A TBBP-A 543.87 79-94-7
2,2′ ,4,4′-Tetrabromo diphenyl ether BDE-47 485.79 5436-43-1
2,2′ ,4,4′ ,5-Pentabromo diphenyl ether BDE-99 564.69 60348-60-9
2,2′ ,4,4′ ,6-Pentabromo diphenyl ether BDE-100 564.69 189084-64-8
2,2′ ,4,4′ ,5,5′-Hexabromo diphenyl ether BDE-153 643.58 68631-49-2
2,2′ ,4,4′ ,5,6′-Hexabromo diphenyl ether BDE-154 643.58 207122-15-4
kasb(
tft
tci
2
seae
ept at +4 ◦C in 1 L dark glass bottles. To avoid possible sample alter-tion, the samples were extracted within 2 days. Before processing,uspended particulate matter was removed from water samplesy filtration with a 125 mm diameter GF/C glass microfiber filterWhatman, Maidstone, UK).
Wastewater samples were collected from the outlet of a sewagereatment plant from a factory assembling and painting woodenurniture; again suspended particulate matter was removed by fil-ration before the extraction procedure.
Drinking water samples were collected from the laboratory tap;o eliminate sediments and gas pockets in the pipes, water wasollected after flushing for about 10 min and hypochlorite was elim-nated by the addition of sodium thiosulphate (0.5 g L−1).
.4. Sample extraction method
Water samples (1 L each) were extracted by SPE cartridges. Afterampling, cartridges were washed with 10 mL of Milli-Q water toliminate residual salts, followed by methanol (250 �L for OASISnd LC-18, 500 �L for GCB) to remove residual water withoutluting the analytes. Then, the elution was performed with 7 mL
of dichloromethane:methanol 80:20 (v/v), for OASIS and LC-18and 7 mL dichloromethane:methanol:acetic acid 88:10:2 (v/v/v) forGCB cartridges. The solvent was evaporated to dryness in a ther-mostatic bath at 37 ◦C under a nitrogen stream; then 500 �L ofmethanol were added to the residue and the extract was transferredin a dark vial.
Water samples (1 L each) were also extracted by LLE. In this caseto improve recovery, 20 g of NaCl were added and filtered watersamples were extracted with 100 mL of n-hexane. After extraction,6 g of anhydrous sodium sulphate were used to remove residualwater. The solvent, separated from sodium sulphate, was evapo-rated to dryness by a rotavapor at 60 ◦C; then 500 �L of methanolwere added to the residue and the extract transferred in a dark vial.For analysis, 25 �L of samples were injected into the LC column.
2.5. LC–MS analysis
2.5.1. Liquid chromatography conditionsLiquid chromatography was performed by using a series 200
PerkinElmer (Norwalk, CT, USA) apparatus consisting of a binaryLC micropump and a vacuum degasser. The analytes were chro-

A. Bacaloni et al. / J. Chromatogr. A 1216 (2009) 6400–6409 6403
Table 2CID-MRM conditions for the analysis by LC–APPI–MS/MS.
Analyte Retention windows (min) Q1 mass (m/z) Precursor ion type Q3 mass (m/z) DP (V) CE (V)
TBBP-A 0–6.5 542.9 [M−H]− 78.8, 80.8 −70 −90BDE-47 6.5–9.4 420.8 [M−Br+O]− 78.8, 80.8 −30 −50B [M−Br+O]− 78.8, 80.8 −70 −70B [M−2Br+O]− 78.8, 80.8 −70 −90B [M−Br+O]− 78.8, 80.8 −70 −90B [M−2Br+O]− 78.8, 80.8 −70 −80
m5G(
(l
2
mPAd
qsHU0
bcM2sdwCga
iMa
3
3
a
Table 3Recovery and precision of analytes from pure water, spiked with 50 ng L−1 for BDE-47and 10 ng L−1 for other analytes, by different SPE cartridges.
Analyte Recoverya, % (RSDb, %)
GCB OASIS LC-18
TBBP-A 99 (3) 93 (6) 92 (5)BDE-47 98 (6) 82 (12) 83 (8)BDE-99 95 (8) 76 (9) 68 (18)BDE-100 89 (5) 73 (14) 71 (9)BDE-153 89 (8) 68 (11) 58 (22)BDE-154 90 (9) 67 (11) 59 (20)
[42]; thus, on the whole, results reported in Table 3 may be com-
TRc
A
TBBBBB
DE-99 9.4–13 500.8DE-100 9.4–13 418.8DE-153 13–18.5 578.5DE-154 13–18.5 498.8
atographed on an Alltima C18 column, 250 mm × 2.1 mm i.d.,�m particle size, from Alltech (Deerfield, IL, USA) with a Security-uard ODS, 4 mm × 2 mm i.d. precolumn supplied by Phenomenex
Torrace, CA, USA).An isocratic mobile phase of methanol:water:acetone 85:5:10
v/v/v) at 200 �L min−1 produced baseline resolution of the ana-ytes studied.
.5.2. APPI–MS/MS analysisAn Applied Biosystems/MDS SCIEX Q TRAP linear ion trap
ass spectrometer (Concord, Ontario, Canada), coupled with ahotoSprayTM source was operated in the negative ion mode.pplied Biosystems Analyst software, version 1.4.1, was used forata acquisition and processing.
Mass calibrations and resolution adjustments on the resolvinguadrupoles were performed automatically using a 10−5 mol L−1
olution of PPG (polypropylene glycol) introduced via a model 11arvard infusion pump (Harvard Apparatus Inc., Holliston, MA,SA). The peak-width was set on both resolving quadrupoles at m/z.7 (measured at half height) for all MS and MS/MS experiments.
Source and compound-dependent parameters were optimizedy Flow Injection Analysis (FIA). Each analyte was prepared at aoncentration of 1 �g mL−1 in methanol and 25 �L were injected.obile phase was methanol:water 95:5 (v/v) at flow rate of
00 �L min−1. Dopant (toluene or acetone) was delivered by ayringe pump in the flow rate range of 2–30 �L min−1 to theopant port of the APPI source. Optimized source parametersere as follows: dopant flow rate = 20 �L min−1, curtain gas = 20 psi,AD gas = medium, APPI probe nebulizer gas = 60 psi, auxiliaryas = 30 psi, APPI probe temperature = 350 ◦C, ion transfer volt-ge = −1300 V.
Quantitative analysis was performed in multiple reaction mon-toring (MRM) mode, and four MRM periods were included in the
S method. Periods, MRM transitions, declustering potential (DP),nd collision energy (CE) are reported in Table 2.
. Results and discussion
.1. Extraction procedure optimization
The extraction method was optimized using 1 L of water sampless a compromise between the low analyte concentrations expected
able 4ecovery and precision of the SPE–LC–APPI–MS/MS method for the determination of selecartridge.
nalyte Recoveryb, % (RSDc, %)
Tap watera River watera (filtered 1 �m)
BBP-A 86 (1) 72 (7)DE-47 86 (6) 47 (11)DE-99 81 (2) 39 (19)DE-100 88 (5) 40 (2)DE-153 86 (13) 11 (3)DE-154 85 (1) 28 (11)
a Sample volume was 1 L, spiked with 50 ng L−1 for BDE-47 and 10 ng L−1 for other analb Mean values from four replications.c RSD: relative standard deviation.
a Mean values from five replications.b RSD: relative standard deviation.
(BFRs, except TBBP-A have a marked hydrophobic character) andextraction time.
3.1.1. Solid-phase extractionThree sorbents were tested for the BFRs extraction from water.
The extraction efficiency was evaluated by spiking 1 L of ultrapurewater at a concentration of 50 ng L−1 for BDE-47 and 10 ng L−1 forother analytes. After spiking, the sample was vigorously agitatedfor 2 min and left to equilibrate for 1 h before extraction followingthe procedure reported in the Experimental section. The evapora-tion process did not produce analyte loss (data not reported). BFRrecoveries obtained by varying the sorbent material are reported inTable 3.
The results show that GCB allowed the highest recovery for theanalytes. In spite of the fact that for both OASIS and LC-18 part of theanalyte amounts lost were recovered from the effluent by samplingit with a new cartridge, a typical breakthrough phenomenon can beexcluded, considering that recoveries decrease as the hydrophobicnature of the compounds increases. In addition, it is well known thatGCB macroporous surface allows a very fast adsorption equilibrium
patible with a scenario in which the more hydrophobic compoundsare dispersed rather than solubilized in the water sample.
The optimized extraction procedure was tested for tap waterand river water (Tiber). Experiments were done in quadruplicateand results are reported in Table 4 (first and second columns).
ted compound in different matrices. SPE was carried out by a 250 mg Carbograph-1
River watera (filtered 0.45 �m) Pure watera (20 mg L−1 humic acids)
76 (6) 71 (8)49 (8) 51 (14)35 (21) 10 (15)39 (2) 32 (7)13 (2) 24 (27)27 (10) 6 (10)
ytes.
6404 A. Bacaloni et al. / J. Chromatogr.
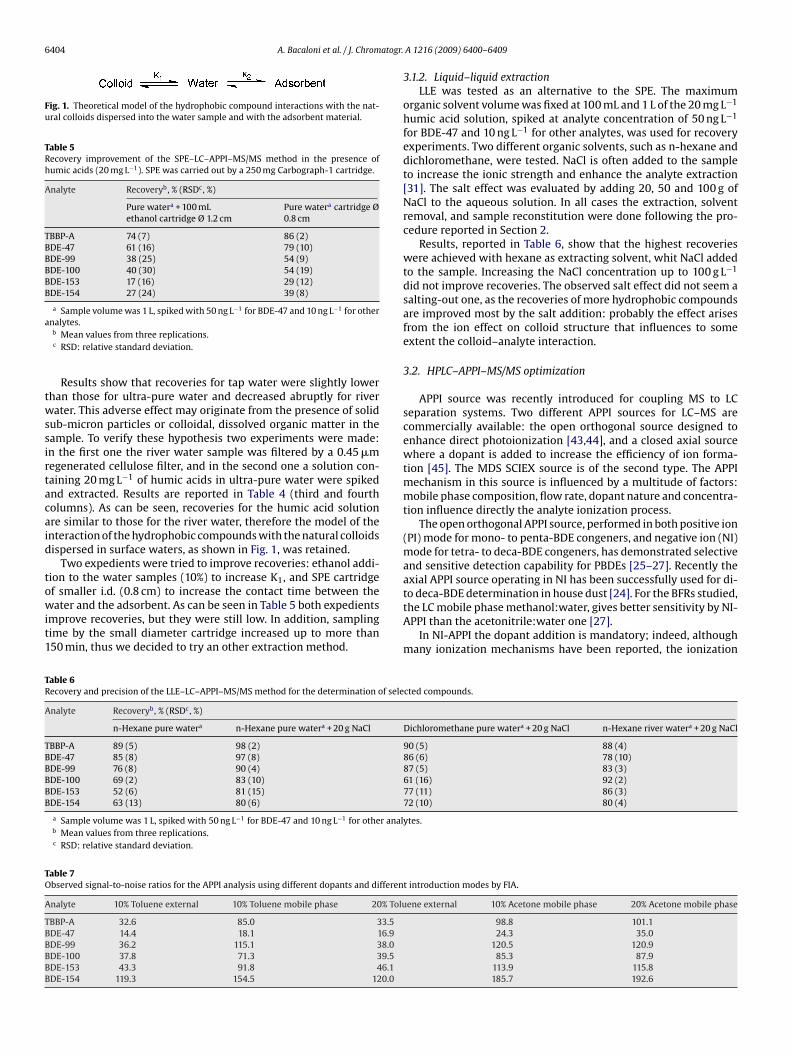
Fig. 1. Theoretical model of the hydrophobic compound interactions with the nat-ural colloids dispersed into the water sample and with the adsorbent material.
Table 5Recovery improvement of the SPE–LC–APPI–MS/MS method in the presence ofhumic acids (20 mg L−1). SPE was carried out by a 250 mg Carbograph-1 cartridge.
Analyte Recoveryb, % (RSDc, %)
Pure watera + 100 mLethanol cartridge Ø 1.2 cm
Pure watera cartridge Ø0.8 cm
TBBP-A 74 (7) 86 (2)BDE-47 61 (16) 79 (10)BDE-99 38 (25) 54 (9)BDE-100 40 (30) 54 (19)BDE-153 17 (16) 29 (12)BDE-154 27 (24) 39 (8)
a Sample volume was 1 L, spiked with 50 ng L−1 for BDE-47 and 10 ng L−1 for othera
twssirtacaid
towit1
to deca-BDE determination in house dust [24]. For the BFRs studied,
TR
A
TBBBBB
TO
A
TBBBBB
nalytes.b Mean values from three replications.c RSD: relative standard deviation.
Results show that recoveries for tap water were slightly lowerhan those for ultra-pure water and decreased abruptly for riverater. This adverse effect may originate from the presence of solid
ub-micron particles or colloidal, dissolved organic matter in theample. To verify these hypothesis two experiments were made:n the first one the river water sample was filtered by a 0.45 �megenerated cellulose filter, and in the second one a solution con-aining 20 mg L−1 of humic acids in ultra-pure water were spikednd extracted. Results are reported in Table 4 (third and fourtholumns). As can be seen, recoveries for the humic acid solutionre similar to those for the river water, therefore the model of thenteraction of the hydrophobic compounds with the natural colloidsispersed in surface waters, as shown in Fig. 1, was retained.
Two expedients were tried to improve recoveries: ethanol addi-ion to the water samples (10%) to increase K1, and SPE cartridgef smaller i.d. (0.8 cm) to increase the contact time between the
ater and the adsorbent. As can be seen in Table 5 both expedientsmprove recoveries, but they were still low. In addition, samplingime by the small diameter cartridge increased up to more than50 min, thus we decided to try an other extraction method.
able 6ecovery and precision of the LLE–LC–APPI–MS/MS method for the determination of sele
nalyte Recoveryb, % (RSDc, %)
n-Hexane pure watera n-Hexane pure watera + 20 g NaCl
BBP-A 89 (5) 98 (2)DE-47 85 (8) 97 (8)DE-99 76 (8) 90 (4)DE-100 69 (2) 83 (10)DE-153 52 (6) 81 (15)DE-154 63 (13) 80 (6)
a Sample volume was 1 L, spiked with 50 ng L−1 for BDE-47 and 10 ng L−1 for other analb Mean values from three replications.c RSD: relative standard deviation.
able 7bserved signal-to-noise ratios for the APPI analysis using different dopants and differen
nalyte 10% Toluene external 10% Toluene mobile phase 20% Tolu
BBP-A 32.6 85.0 33.5DE-47 14.4 18.1 16.9DE-99 36.2 115.1 38.0DE-100 37.8 71.3 39.5DE-153 43.3 91.8 46.1DE-154 119.3 154.5 120.0
A 1216 (2009) 6400–6409
3.1.2. Liquid–liquid extractionLLE was tested as an alternative to the SPE. The maximum
organic solvent volume was fixed at 100 mL and 1 L of the 20 mg L−1
humic acid solution, spiked at analyte concentration of 50 ng L−1
for BDE-47 and 10 ng L−1 for other analytes, was used for recoveryexperiments. Two different organic solvents, such as n-hexane anddichloromethane, were tested. NaCl is often added to the sampleto increase the ionic strength and enhance the analyte extraction[31]. The salt effect was evaluated by adding 20, 50 and 100 g ofNaCl to the aqueous solution. In all cases the extraction, solventremoval, and sample reconstitution were done following the pro-cedure reported in Section 2.
Results, reported in Table 6, show that the highest recoverieswere achieved with hexane as extracting solvent, whit NaCl addedto the sample. Increasing the NaCl concentration up to 100 g L−1
did not improve recoveries. The observed salt effect did not seem asalting-out one, as the recoveries of more hydrophobic compoundsare improved most by the salt addition: probably the effect arisesfrom the ion effect on colloid structure that influences to someextent the colloid–analyte interaction.
3.2. HPLC–APPI–MS/MS optimization
APPI source was recently introduced for coupling MS to LCseparation systems. Two different APPI sources for LC–MS arecommercially available: the open orthogonal source designed toenhance direct photoionization [43,44], and a closed axial sourcewhere a dopant is added to increase the efficiency of ion forma-tion [45]. The MDS SCIEX source is of the second type. The APPImechanism in this source is influenced by a multitude of factors:mobile phase composition, flow rate, dopant nature and concentra-tion influence directly the analyte ionization process.
The open orthogonal APPI source, performed in both positive ion(PI) mode for mono- to penta-BDE congeners, and negative ion (NI)mode for tetra- to deca-BDE congeners, has demonstrated selectiveand sensitive detection capability for PBDEs [25–27]. Recently theaxial APPI source operating in NI has been successfully used for di-
the LC mobile phase methanol:water, gives better sensitivity by NI-APPI than the acetonitrile:water one [27].
In NI-APPI the dopant addition is mandatory; indeed, althoughmany ionization mechanisms have been reported, the ionization
cted compounds.
Dichloromethane pure watera + 20 g NaCl n-Hexane river watera + 20 g NaCl
90 (5) 88 (4)86 (6) 78 (10)87 (5) 83 (3)61 (16) 92 (2)77 (11) 86 (3)72 (10) 80 (4)
ytes.
t introduction modes by FIA.
ene external 10% Acetone mobile phase 20% Acetone mobile phase
98.8 101.124.3 35.0
120.5 120.985.3 87.9
113.9 115.8185.7 192.6

atogr. A 1216 (2009) 6400–6409 6405
pdaii
turiwdampf(mmhfidttg
d[ft[si
A. Bacaloni et al. / J. Chrom
rocess is assumed to be initiated by thermal electrons formeduring the dopant photo-ionization process [46]. Efficient dopantgents must have ionization energy lower than VUV Krypton lamponization. Toluene and acetone, the two most frequently used dop-ng agents for APPI [45,47], were tested.
Toluene was the dopant chosen in previous works dealing withhe determination of BFRs [24–27]; however, the advantages ofsing acetone in some circumstances have been reported in aecent paper [48]. In reversed phase LC, usually toluene must bentroduced by a pump into APPI source through an external port,
hereas, owing to its miscibility with water, acetone may be intro-uced in two different modes: by external pump and directly asLC mobile phase component. As toluene was miscible with 95:5ethanol:water at 10% level, a test was made adding it to the mobile
hase. The comparison between the two dopants and the two dif-erent modes of introduction was made on signal-to-noise ratioS/N) achieved by FIA-MRM analysis. As shown in Table 7, acetone
ixed in the mobile phase gave the best S/N. The noise decreaseainly accounted for this increase and probably it was due to the
omogeneous distribution of the dopant inside the source [48]. Dif-erently from what was reported by Lagalante and Oswald [24],n our experiment the response of compounds maximized at 10%opant concentration, kept constant at 20%, and the S/N values forhe tetrabromodiphenylether (BDE-47 congener) remained abouten times lower than that for the most responsive BDE-154 con-ener.
As previously reported, neither the molecular ion [M•−] nor theeprotonated molecule [M−H]− were formed. The phenoxide ionsM−Br+O]− were observed for all PBDEs, although the [M−2Br+O]−
ragments were the most intense ions for BDE-100 and BDE-154 athe DP value giving the most intense precursor ion. Kauppila et al.46] formulate the hypothesis that the phenoxide ion formation byubstitution reaction may originate from the presence of O2 tracesn the source as shown in Fig. 2. Although ultra-pure nitrogen and
Fig. 3. Enhanced Product Ion spec
Fig. 2. Possible reactions in negative ion APPI.
solvent degassing were used, O2 traces may come from the sur-rounding environment, or may be still dissolved into solvents, ormay originate from solvent molecules break down catalyzed by themetallic surfaces present in the source.
For PBDE compounds Lagalante and Oswald [24], report thishypothesis, while other authors [25,28] suggest that the substi-tution reaction may start with a dissociative resonance capturemechanism leading to [M−Br]− ion and Br• radical, then [M−Br]−
reacts with the oxygen molecules present in the source. So theionization process is not yet unequivocally explicated.
The formation mechanism of the deprotonated molecule[M−H]− for TBBP-A has already been discussed [28]: it is pro-duced by means of slow electrons emitted by the dopant duringthe APPI ionization process. According to these authors, the depro-tonated molecule formed from TBBP-A was produced trough a H•
loss resulting from a dissociative electron capture process.For the selection of fragment ions the Enhanced Product Ion
mode was used, using the linear ion trap. In this way it was possibleto identify some fragment ions for each of the analytes, as shownon Fig. 3 for the BDE-153 ion at m/z 578.5.
However, during the CE optimization for the MRM analysis, weobserved a characteristic behaviour in all the compounds, as shownon Fig. 4, again for BDE-153.
By increasing CE, the XIC of 578.5 → 79Br and 578.5 → 81Br tran-
sitions showed a rise of intensity, while the other XIC signals wereminimized. Although the transitions giving as unique fragment thebromine anion were class-distinctive, but not compound-specific,the gain in terms of S/N was about factor 3–5, depending from thetrum of BDE-153, m/z 578.5.

6406 A. Bacaloni et al. / J. Chromatogr. A 1216 (2009) 6400–6409
F r BDEC
cwrs
3
tsms8(L
cwBasc
i
ig. 4. Optimization of collision energy (V) in multi-reaction monitoring mode foE = −90.
ompound; so we decided to choose these transitions. This factould not represent a drawback if isomeric compounds were sepa-
ated by chromatography, as brominated compounds showing theame m/z and retention time are very unlikely to occur.
.3. Method performance
On the ground of the recovery experiments, we suggest to selecthe simpler SPE method for tap water, and the LLE method forurface water and wastewater. The accuracy and precision of theethod were evaluated from the recovery studies. Although a
uitable internal standard could not be found, recoveries ranged0–86% with a RSD of 1–13% for tap water by using the SPE methodTable 4), and 78–92% with a RSD 2–10% for river water by using theLE method (Table 6).
The suppression of mass spectrometric ion signal intensity byoeluted matrix components was evaluated by analyzing a riverater sample. The sample was extracted by LLE, spiked with 50 ng ofDE-47 and 10 ng of the other analytes after extraction and the peak
reas for the compounds were compared with the peak areas of atandard solution. No matrix effect was evidenced, thus externalalibration was used for quantitation.Amounts of each analyte, varying from 0.025 to 25 ng, werenjected from suitably prepared standard solutions into the LC col-
-153, m/z 578.5, by FIA. (1) CE = −30; (2) CE = −50; (3) CE = −70; (4) CE = −80; (5)
umn, and three replicate measurements were made. Signal againstamount-injected curves were then constructed for each analyteby the peak area resulting from the sum of two selected transi-tions. Two different mobile phase, such as methanol:acetone 90:10(v/v), and methanol:water:acetone 85:5:10 (v/v/v) were used. Fig. 5shows the regression line for BDE-99 obtained with the first mobilephase (broken line), with the second mobile phase (continuousline), and the line obtained by forcing the second mobile phase lineto pass from the axes’ origin (dotted line). Although the R2 of theregression line calculated for the first regression line by using allthe experimental points was 0.9958, it appears that the response ofthe system was linearly related to injected amounts of the analytesonly up to 2.5 ng injected. Indeed when the LC mobile phase wasmodified with 5% water the linear rage increase, and the responsecould be kept linear up to 10 ng with R2 ranging between 0.9982and 0.9994 for the compounds tested.
A possible explanation for this phenomenon may be theincreased amount of O2 carried by water which, as discussed inSection 3.2, may increase the phenoxyde ion formation rate.
Reproducibility of the retention time made it possible to dividethe mass spectrometry acquisition into periods (see Table 2), thusincreasing the S/N ratio. Instrumental limits of detection (LODs)were estimated by the LC–MS/MS MRM chromatogram resultingfrom the analysis of 0.025 ng (0.125 ng BDE-47) injected from a

A. Bacaloni et al. / J. Chromatogr. A 1216 (2009) 6400–6409 6407
FC
ctswwptfst
Table 8LC–APPI–MS/MS limits of detection, and method identification and quantificationlimits in water with the two different developed methods.
Analyte LODa, nginjected
Tap water River water
MILb, ng L−1 MQLc, ng L−1 MILd, ng L−1 MQLe, ng L−1
TBBP-A 0.005 0.2 0.3 0.2 0.3BDE-47 0.1 10.9 11.9 12.0 20.3BDE-99 0.008 1.1 1.9 1.4 3.3BDE-100 0.009 0.8 1.2 0.9 1.4BDE-153 0.014 0.5 1.1 0.6 1.3BDE-154 0.004 0.1 0.2 0.1 0.2
a LOD: instrumental limit of detection.b MIL: method identification limit (S/N = 3 of MRM transition giving the worst
S/N), estimated analyzing tap water sample fortified with the analytes.c MQL: method quantification limit (S/N = 10) estimated analyzing tap water sam-
ple fortified with the analytes.d MIL: method identification limit (S/N = 3 of MRM transition giving the worst
FB
ig. 5. Comparison of regression lines for BDE-99 using CH3OH and 95:5 (v/v)H3OH:H2O as mobile phase.
omposite standard solution. After extracting the selected transi-ions for each compound from the data set, the resulting traces weremoothed twice by applying the smoothing method (Analyst soft-are). Then, the peak height-to-averaged background noise ratioas measured, and the background noise estimate was based on theeak-to-peak baseline near the analyte peak. Using low resolution
andem mass spectrometry, usually two transitions are requiredor unambiguous identification, therefore the first condition to beatisfied for ascertaining the presence of the targeted compound ishat both selected transitions produce a signal distinguishable fromig. 6. LC–APPI–MS/MS chromatogram (MRM mode) obtained by analyzing a spiked rivDE-153 and BDE-154 5 ng L−1.
S/N), estimated analyzing river water sample fortified with the analytes.e MQL: method quantification limit (S/N = 10) estimated analyzing river water
sample fortified with the analytes.
the background ion current. Accordingly, a definition of LOD as theanalyte amount giving an S/N ratio = 3 for the transition giving theworst S/N ratio was adopted.
Method identification limits (MILs) were estimated in the sameway by analyzing, using LLE as extraction method, a river watersample and, using SPE as extraction method, a tap water sam-ple, both fortified at a concentration of 25 ng L−1 of BDE-47 and5 ng L−1 of other analytes. On the same sample, method quantifica-tion limits (MQLs) were evaluated as the concentrations giving an
S/N ratio = 10 for the sum of the two selected transitions for MRM.All these data are reported in Table 8. A typical HPLC–MS/MS MRMmass chromatogram resulting from this sample analysis is shownin Fig. 6.er water sample. Spiked levels were: BDE-47 25 ng L−1; TBBP-A, BDE-99, BDE-100,
6408 A. Bacaloni et al. / J. Chromatogr. A 1216 (2009) 6400–6409
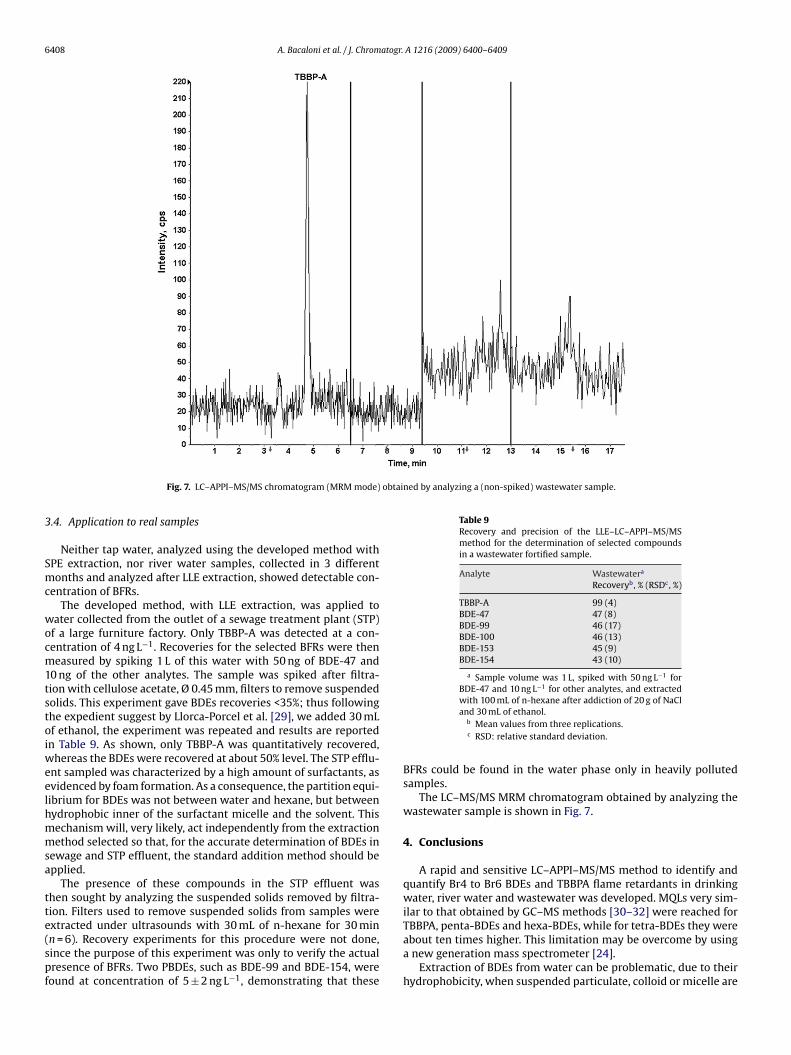
obtained by analyzing a (non-spiked) wastewater sample.
3
Smc
wocm1tstoiweelhmmsa
tte(spf
Table 9Recovery and precision of the LLE–LC–APPI–MS/MSmethod for the determination of selected compoundsin a wastewater fortified sample.
Analyte Wastewatera
Recoveryb, % (RSDc, %)
TBBP-A 99 (4)BDE-47 47 (8)BDE-99 46 (17)BDE-100 46 (13)BDE-153 45 (9)BDE-154 43 (10)
a Sample volume was 1 L, spiked with 50 ng L−1 forBDE-47 and 10 ng L−1 for other analytes, and extracted
Fig. 7. LC–APPI–MS/MS chromatogram (MRM mode)
.4. Application to real samples
Neither tap water, analyzed using the developed method withPE extraction, nor river water samples, collected in 3 differentonths and analyzed after LLE extraction, showed detectable con-
entration of BFRs.The developed method, with LLE extraction, was applied to
ater collected from the outlet of a sewage treatment plant (STP)f a large furniture factory. Only TBBP-A was detected at a con-entration of 4 ng L−1. Recoveries for the selected BFRs were theneasured by spiking 1 L of this water with 50 ng of BDE-47 and
0 ng of the other analytes. The sample was spiked after filtra-ion with cellulose acetate, Ø 0.45 mm, filters to remove suspendedolids. This experiment gave BDEs recoveries <35%; thus followinghe expedient suggest by Llorca-Porcel et al. [29], we added 30 mLf ethanol, the experiment was repeated and results are reported
n Table 9. As shown, only TBBP-A was quantitatively recovered,hereas the BDEs were recovered at about 50% level. The STP efflu-
nt sampled was characterized by a high amount of surfactants, asvidenced by foam formation. As a consequence, the partition equi-ibrium for BDEs was not between water and hexane, but betweenydrophobic inner of the surfactant micelle and the solvent. Thisechanism will, very likely, act independently from the extractionethod selected so that, for the accurate determination of BDEs in
ewage and STP effluent, the standard addition method should bepplied.
The presence of these compounds in the STP effluent washen sought by analyzing the suspended solids removed by filtra-ion. Filters used to remove suspended solids from samples were
xtracted under ultrasounds with 30 mL of n-hexane for 30 minn = 6). Recovery experiments for this procedure were not done,ince the purpose of this experiment was only to verify the actualresence of BFRs. Two PBDEs, such as BDE-99 and BDE-154, wereound at concentration of 5 ± 2 ng L−1, demonstrating that these
with 100 mL of n-hexane after addiction of 20 g of NaCland 30 mL of ethanol.
b Mean values from three replications.c RSD: relative standard deviation.
BFRs could be found in the water phase only in heavily pollutedsamples.
The LC–MS/MS MRM chromatogram obtained by analyzing thewastewater sample is shown in Fig. 7.
4. Conclusions
A rapid and sensitive LC–APPI–MS/MS method to identify andquantify Br4 to Br6 BDEs and TBBPA flame retardants in drinkingwater, river water and wastewater was developed. MQLs very sim-ilar to that obtained by GC–MS methods [30–32] were reached for
TBBPA, penta-BDEs and hexa-BDEs, while for tetra-BDEs they wereabout ten times higher. This limitation may be overcome by usinga new generation mass spectrometer [24].Extraction of BDEs from water can be problematic, due to theirhydrophobicity, when suspended particulate, colloid or micelle are

atogr.
pcSw
oRAcpwt
R
[
[[
[[
[[
[
[
[
[[[[
[
[
[
[
[
[
[
[
[[
[
[
[
[[[
A. Bacaloni et al. / J. Chrom
resent in the samples. Water samples with low humic substanceontent, such as ground water, may be conveniently extracted byPE, whereas LLE is more appropriate for the extraction of the otherater samples.
None of these compounds was detected either in the Tiber riverr in its heavily polluted tributary Aniene samples collected insideome. In a treated sewage from a large furniture factory only TBBP-(4 ng L−1) in the aqueous phase, while suspended solids were
ontaminated by BDE-99 and BDE-154. Since MILs of these com-ounds were lower than 1 ng L−1, these results may suggest thatater does not play a remarkable role in the biota accumulation of
hese compounds.
eferences
[1] C.A. de Wit, Chemosphere 46 (2002) 583.[2] R.A. Hites, Environ. Sci. Technol. 38 (2004) 945.[3] C.A. de Wit, M. Alaee, D.C.G. Muir, Chemosphere 64 (2006) 209.[4] R.C. Hale, M.J. La Guardia, E. Harvey, M.O. Gaylor, T.M. Mainor, Chemosphere 64
(2006) 181.[5] R.J. Norstrom, M. Simon, J. Moisey, B. Wakeford, D.V.C. Weseloh, Environ. Sci.
Technol. 36 (2002) 4783.[6] A. Sjodin, R.S. Jones, J.F. Focant, C. Lapeza, R.Y. Wang, E.E. McGahee, Y.L. Zhang,
W.E. Turner, B. Slazyk, L.L. Needham, D.G. Patterson, Environ. Health Perspect.112 (2004) 654.
[7] K. Norén, D. Meironyté, Chemosphere 40 (2000) 1111.[8] H. Viberg, A. Fredriksson, E. Jakobsson, U. Orn, P. Eriksson, Toxicol. Sci. 76 (2003)
112.[9] L.S. Birnbaum, D.F. Staskal, Environ. Health Perspect. 112 (2004) 9.10] I. Meerts, J.J. van Zanden, E.A.C. Luijks, I. van Leeuwen-Bol, G. Marsh, E. Jakobs-
son, A. Bergman, A. Brouwer, Toxicol. Sci. 56 (2000) 95.11] T. Zhou, M.M. Taylor, M.J. DeVito, K.A. Crofton, Toxicol. Sci. 66 (2002) 105.12] K.J. Fernie, J.L. Shutt, G. Mayne, D. Hoffman, R.J. Letcher, K.G. Drouillard, I.J.
Ritchie, Toxicol. Sci. 88 (2005) 375.13] H. Viberg, A. Fredriksson, P. Eriksson, Environ. Toxicol. Pharmacol. 17 (2004) 61.14] P.O. Darnerud, G.S. Eriksen, T. Johannesson, P.B. Larsen, M. Viluksela, Environ.
Health Perspect. 109 (2001) 49.
15] M. Alaee, P. Arias, A. Sjodin, A. Bergman, Environ. Int. 29 (2003) 683.16] BSER, EU chemicals assessment authorities confirm no restrictions on deca-BDEand support ongoing science, Brussels, Belgium, http://bsef.com, 2007.17] A.C. Gerecke, P.C. Hartmann, N.V. Heeb, H.P. Kohler, W. Giger, P. Schmid, M.
Zennegg, M. Kohler, Environ. Sci. Technol. 39 (2005) 1078.18] J. He, K.R. Robrock, L. Alvarez-Cohen, Environ. Sci. Technol. 40 (2006) 4429.
[[
[
A 1216 (2009) 6400–6409 6409
[19] T.M. Cahill, D. Groskova, M.J. Charles, J.R. Sanborn, M.S. Denison, L. Baker, Envi-ron. Sci. Technol. 41 (2007) 6370.
20] Z. Xie, R. Ebinghaus, R. Lohmann, O. Heemken, A. Caba, W. Puttmann, Anal.Chim. Acta 584 (2007) 333.
[21] B. Gevao, M. Al-Bahloul, A.N. Al-Ghadban, A. Al-Omair, L. Ali, J. Zafar, M. Helaleh,Chemosphere 64 (2006) 603.
22] J. Wang, D. Jiang, Z. Gu, X. Yan, J. Chromatogr. A 1137 (2006) 8.23] Y. Li, G. Wei, J. Hu, X. Liu, X. Zhao, X. Wang, Anal. Chim. Acta 615 (2008) 96.24] A.F. Lagalante, T.D. Oswald, Anal. Bioanal. Chem. 391 (2008) 2249.25] L. Debrauwer, A. Riu, M. Jouahri, E. Rathahao, I. Jouanin, J. Antignac, R. Cariou,
B. Le Bizec, D. Zalko, J. Chromatogr. A 1082 (2005) 98.26] R. Cariou, J. Antignac, L. Debrauwer, D. Maume, M. Fabrice, D. Zalko, B. Le Bizec,
F. Andre, J. Chromatogr. Sci. 44 (2006) 489.27] A. Riu, D. Zalko, L. Debrauwer, Rapid Commun. Mass Spectrom. 20 (2006)
2133.28] E. Basso, E. Marotta, R. Seraglia, M. Tubaro, P. Traldi, J. Mass Spectrom. 38 (2003)
1113.29] J. Llorca-Porcel, G. Martínez-Sánchez, B. Álvarez, M.A. Cobollo, I. Valor, Anal.
Chim. Acta 569 (2006) 113.30] V. Yusa, A. Pastor, M. de la Guardia, Anal. Chim. Acta 565 (2006) 103.
[31] N. Fontanals, T. Barri, S. Bergström, J.Å. Jönsson, J. Chromatogr. A 1133 (2006)41.
32] M. Polo, G. Gómez-Noya, J.B. Quintana, M. Llompart, C. García-Jares, R. Cela,Anal. Chem. 76 (2004) 1054.
33] BSEF, Major Brominated Flame Retardants Volume Estimates–Total MarketDemand By Region in 2001, www.bsef.com, 2003.
34] Commission Communication 2008/C 152/02, Commission Recommendation2008/454/EC, OJ 51 (2008) C 152 11-20, L 158 62-64.
35] U. Berger, D. Herzke, T.M. Sandanger, Anal. Chem. 76 (2004) 441.36] R. Saint-Louis, E. Pelletier, Analyst 129 (2004) 724.
[37] S. Chu, G.D. Haffner, R.J. Letcher, J. Chromatogr. A 1097 (2005) 25.38] T. Hayama, H. Yoshida, S. Onimaru, S. Yonekura, H. Kuroki, K. Todoroki, H. Nohta,
M. Yamaguchi, J. Chromatogr. B 809 (2004) 131.39] S. Morris, C.R. Allchin, B.N. Zegers, J.J.H. Haftka, J.P. Boon, C. Belpaire, P.E.G.
Leonards, S.P.J. van Leeuwen, J. de Boer, Environ. Sci. Technol. 38 (2004) 5497.40] A. Hasegawa, S. Suzuki, J. Environ. Chem. 14 (2004) 73.
[41] Lazio region environmental protection agency, 2008 internal report.42] C. Borra, A. Di Corcia, M. Marchetti, R. Samperi, Anal. Chem. 58 (1986) 2048.43] J.A. Syage, M.D. Evans, K.A. Hanold, Am. Lab. 32 (2000) 24.44] K.A. Hanold, S.M. Fisher, P.H. Cormia, C.E. Miller, J.A. Syage, Anal. Chem. 76
(2004) 2842.
45] D.B. Robb, T.R. Covey, A.P. Bruins, Anal. Chem. 72 (2000) 3653.46] T.J. Kauppila, T. Kotiaho, R. Kostiainen, A.P. Bruins, J. Am. Soc. Mass Spectrom.15 (2004) 203.[47] A. Raffaelli, A. Saba, Mass Spectrom. Rev. 22 (2003) 318.48] C. Cavaliere, P. Foglia, E. Pastorini, R. Samperi, A. Laganà, J. Chromatogr. A 1101
(2006) 69.
Related Documents