Journal of Chromatography B, xxx (2006) xxx–xxx Liquid chromatography–mass spectrometry/mass spectrometry method development for drug metabolism studies: Examining lipid matrix ionization effects in plasma James L. Little ∗ , Michael F. Wempe, Charles M. Buchanan Eastman Chemical Company, Building 150 Kingsport, TN 37662-5150, USA Received 5 November 2005; accepted 2 February 2006 Abstract Glycerophosphocholines (GPCho’s) are known to cause liquid chromatography–mass spectrometry/mass spectrometry (LC–MS/MS) matrix ionization effects during the analysis of biological samples (i.e. blood, plasma). We have developed a convenient new method, which we refer to as “in-source multiple reaction monitoring” (IS-MRM), for detecting GPCho’s during LC–MS/MS method development. The approach uses high energy in-source collisionally induced dissociation (CID) to yield trimethylammonium-ethyl phosphate ions (m/z 184), which are formed from mono- and disubstituted GPCho’s. The resulting ion is selected by the first quadrupole (Q1), passed through the collision cell (Q2) in the presence of collision gas at low energy to minimize fragmentation, and m/z 184 selected by the third quadrupole. This approach can be combined with standard multiple reaction monitoring (MRM) transitions with little compromise in sensitivity during method development and sample analysis. Hence, this approach was used to probe ionization matrix effects in plasma samples. The resulting information was employed to develop LC–MS/MS analyses for drugs and their metabolites with cycle times less than 5 min. © 2006 Published by Elsevier B.V. Keywords: LC–MS/MS; Plasma; Phospholipids; Lecithin; Glycerophosphocholines; Matrix suppression; Drug discovery; Pharmaceutical analysis; Electrospray mass spectrometry; Matrix effects 1. Introduction Offering very high selectivity and sensitivity, liquid chromatography–mass spectrometry/mass spectrometry (LC–MS/MS) is the preferred method for drug metabolism studies. However, matrix effects may lead to significant ana- lytical errors [1]. The Guidance for Industry on Bioanalytical Method Validation [2] states that “In the case of LC–MS and LC–MS/MS based procedures, matrix effects should be investigated to ensure that precision, selectivity, and sensitivity will not be compromised.” The specific methods to evaluate matrix effects are not specified; the approaches to expose matrix effects are left to the discretion of the investigator. In this regard, many researchers have described methods to probe and/or control matrix effects [1,3–15]. ∗ Corresponding author. Tel.: +1 423 229 8685; fax: +1 423 229 4558. E-mail address: [email protected] (J.L. Little). Phospholipids are extremely abundant in biological mem- branes [16] and are formed from glycerol (phosphoglycerides) or sphingosine (sphingomyelins). Phosphoglycerides are com- posed of glycerol, one or two fatty acid ester chains, and a phos- phorylated alcohol; whereas sphingomyelin is composed of sph- ingosine, an amide linked fatty acid, and a phosphatidyl choline. The glycerophosphocholines (GPCho’s) constitute the major phospholipids in plasma [17,18] and are known to cause signifi- cant LC–MS/MS matrix ionization effects [1,6–8] in the positive ion electrospray mode (+ESI). The glycerine group in these GPCho’s can be either 1-mono (2-lyso) or 1,2-disubstituted (diradyl). The 1,2-disubstituted GPCho (phosphatidylcholine) is commonly referred to as lecithin. We have developed a new approach [19], which we refer to as “in-source multiple reaction monitoring” (IS-MRM) for monitoring GPCho’s. Our method simultaneously monitors all GPCho’s using only one channel in an MRM LC–MS/MS experiment. A similar approach can be employed in selected ion recording mode utilizing a single quadrupole mass spec- 1570-0232/$ – see front matter © 2006 Published by Elsevier B.V. doi:10.1016/j.jchromb.2006.02.011 CHROMB-14384; No. of Pages 12

Welcome message from author
This document is posted to help you gain knowledge. Please leave a comment to let me know what you think about it! Share it to your friends and learn new things together.
Transcript

Journal of Chromatography B, xxx (2006) xxx–xxx
Liquid chromatography–mass spectrometry/mass spectrometry methoddevelopment for drug metabolism studies: Examining lipid
matrix ionization effects in plasma
James L. Little∗, Michael F. Wempe, Charles M. BuchananEastman Chemical Company, Building 150 Kingsport, TN 37662-5150, USA
Received 5 November 2005; accepted 2 February 2006
Abstract
Glycerophosphocholines (GPCho’s) are known to cause liquid chromatography–mass spectrometry/mass spectrometry (LC–MS/MS) matrixionization effects during the analysis of biological samples (i.e. blood, plasma). We have developed a convenient new method, which we refer toas “in-source multiple reaction monitoring” (IS-MRM), for detecting GPCho’s during LC–MS/MS method development. The approach uses highem presence ofc andardm ence, thisa S analysesf©
K lectrosprm
1
c(slMaiwmmta
em-es)com-hos-sph-line.ajor
ifi-
eseutedline)
rors all
Sctedpec-
1d
nergy in-source collisionally induced dissociation (CID) to yield trimethylammonium-ethyl phosphate ions (m/z 184), which are formed fromono- and disubstituted GPCho’s. The resulting ion is selected by the first quadrupole (Q1), passed through the collision cell (Q2) in the
ollision gas at low energy to minimize fragmentation, andm/z 184 selected by the third quadrupole. This approach can be combined with stultiple reaction monitoring (MRM) transitions with little compromise in sensitivity during method development and sample analysis. Hpproach was used to probe ionization matrix effects in plasma samples. The resulting information was employed to develop LC–MS/M
or drugs and their metabolites with cycle times less than 5 min.2006 Published by Elsevier B.V.
eywords: LC–MS/MS; Plasma; Phospholipids; Lecithin; Glycerophosphocholines; Matrix suppression; Drug discovery; Pharmaceutical analysis; Eayass spectrometry; Matrix effects
. Introduction
Offering very high selectivity and sensitivity, liquidhromatography–mass spectrometry/mass spectrometryLC–MS/MS) is the preferred method for drug metabolismtudies. However, matrix effects may lead to significant ana-ytical errors[1]. The Guidance for Industry on Bioanalytical
ethod Validation [2] states that “In the case of LC–MSnd LC–MS/MS based procedures, matrix effects should be
nvestigated to ensure that precision, selectivity, and sensitivityill not be compromised.” The specific methods to evaluateatrix effects are not specified; the approaches to exposeatrix effects are left to the discretion of the investigator. In
his regard, many researchers have described methods to probend/or control matrix effects[1,3–15].
∗ Corresponding author. Tel.: +1 423 229 8685; fax: +1 423 229 4558.E-mail address: [email protected] (J.L. Little).
Phospholipids are extremely abundant in biological mbranes[16] and are formed from glycerol (phosphoglyceridor sphingosine (sphingomyelins). Phosphoglycerides areposed of glycerol, one or two fatty acid ester chains, and a pphorylated alcohol; whereas sphingomyelin is composed ofingosine, an amide linked fatty acid, and a phosphatidyl choThe glycerophosphocholines (GPCho’s) constitute the mphospholipids in plasma[17,18]and are known to cause signcant LC–MS/MS matrix ionization effects[1,6–8]in the positiveion electrospray mode (+ESI). The glycerine group in thGPCho’s can be either 1-mono (2-lyso) or 1,2-disubstit(diradyl). The 1,2-disubstituted GPCho (phosphatidylchois commonly referred to as lecithin.
We have developed a new approach[19], which we refeto as “in-source multiple reaction monitoring” (IS-MRM) fmonitoring GPCho’s. Our method simultaneously monitorGPCho’s using only one channel in an MRM LC–MS/Mexperiment. A similar approach can be employed in seleion recording mode utilizing a single quadrupole mass s
570-0232/$ – see front matter © 2006 Published by Elsevier B.V.
oi:10.1016/j.jchromb.2006.02.011CHROMB-14384; No. of Pages 12

2 J.L. Little et al. / J. Chromatogr. B xxx (2006) xxx–xxx
trometer. Thus, this approach is conveniently employed todevelop LC–MS/MS or LC–MS methods for the analysis ofdrugs and/or drug metabolites in protein-precipitated plasmasamples that avoid deleterious matrix ionization effects fromGPCho’s. However, there are a variety of other exogenousand endogenous chemical species in plasma samples that yieldmatrix ionization effects and require additional strategies forevaluation[1].
2. Experimental
2.1. Standards and reagents
Tamoxifen (>99%) and itraconazole (≥98%) standardswere obtained from Apin Chemicals, Ltd. (Abingdon,Oxon, UK). Diphenhydramine hydrochloride (≥98%) and 4-hydroxytamoxifen (98% Z-isomer, remainder primarily E-isomer) standards were acquired from Sigma–Aldrich (St. Louis,MO, USA). N-desmethyltamoxifen (>98%) was obtained fromToronto Research Chemicals Inc. (North York, Ont., Canada).Itraconazole-d3 (97.8%) and hydroxyitraconazole (98.6%) wereacquired from SynFine Research Inc. (Richmond Hill, Ont.,Canada). GPCho’s, GPEtn’s, and GPSer’s standards were pur-chased from Avanti Polar Lipids Inc. (Alabaster, AL, USA).Xanax (99%, Alprazolam) was obtained as a methanol (MeOH)solution from Cerilliant (Round Rock, TX, USA).
; ra( NewZ ma– Y,U overi oki-n diesT acid( diesr
H,a ck-s A).W ca-t ake( asp
2
pleq UltraP dd g thW Fost etera ). AH , PAU urg,G es foL
2.3. Preparation of plasma samples for LC–MS/MSanalyses
The methods for preparing rat plasma calibration standards(calibrators) and study samples are briefly described within thispaper. A very detailed method description may be found in theliterature[21]. Shown to be optimal for protein precipitation[10], the method used 2.5:1 organic solvent:plasma. All solventratios are v/v.
Plasma samples from PK studies (100�L) were mixed with2:1 ACN:water (25�L) in a 96-well plate and vortexed at800 rpm (4 min). Proteins were precipitated by adding ACN(250�L) containing internal standard (IS), diphenhydraminehydrochloride (20 ng/mL) and vortexed at 800 rpm (4 min).Samples were centrifuged at 1509× g for 10 min. The cali-brators were prepared in a similar manner, addition of 25�Lworking standard solutions in 2:1 ACN:water to blank plasma(100�L) purchased from Bioreclamation Inc. The resultingsolutions were handled in the same manner as the study sam-ples. All operations were performed at room temperature. Theplasma supernatants were directly analyzed using an autosam-pler syringe collecting above the protein pellet.
The itraconazole sample preparation was very similar to thatemployed for the tamoxifen study. Itraconazole is more solublein a 50:50 mixture of ACN:MeOH. Therefore, a 25�L mix-ture of 1:1:1 of ACN:MeOH:water was used in the first step forpo le-d wasn ver-s ffectww
2
tan-d ultsa itatedp eluent( mna
allG pec-t ergyo di cand agesw them t at3
allG ed ad , andc ely.T s-i oyed
Pooled gender plasma samples – mouse (CD-1)Sprague–Dawley, Fischer 344, and Hanover-Wistar);ealand rabbit; dog (beagle); cynomolgous monkey; and huwere obtained from Bioreclamation Inc. (Hicksville, N
SA). Because the anticoagulant can affect analyte reces [20], anticoagulants in the plasma for the pharmacetic (PK) studies matched those employed in the rat sturi-potassium and tri-sodium ethylenediaminetetraaceticEDTA) were used for the tamoxifen and itraconazole stuespectively.
HPLC grade solvents including isopropanol (IPA), MeOnd acetonitrile (ACN) were obtained from Burdick and Jaon (B&J Brand, High Purity Solvent, Muskegon, MI, USater was purified in-house using a Millipore water purifi
ion system. Formic acid (88%) was purchased from J.T. BPhillipsburg, NJ, USA). Ammonium formate (99.995%+) wurchased from Sigma–Aldrich (St. Louis, MO).
.2. Analytical equipment and instrumentation
A Waters LC–MS/MS system included a Quattro Micro triuadrupole mass spectrometer and an Acquity UPLC (erformance LC) System (Milford, MA, USA). All methoevelopment and sample analyses were conducted usinaters system. The Applied Biosystems instrumentation (
er City, CA, USA) included a 4000 Q TRAP mass spectromnd a PEAK Scientific gas generator (Bedford, MA, USAeraeus Labofuge 400R centrifuge (VWR, West ChesterSA) and an Eppendorf Thermomixer R vortexer (Hambermany) were used to prepare the rat PK plasma samplC–MS/MS analyses.
t
n
-
.
,
r
e-
,
r
reparation of samples and calibrators. Then a 250�L mixturef 50:50 ACN:MeOH containing 100 ng/mL of IS (itraconazo3) was used for protein precipitation. A different responseoted for hydroxyitraconazole in the Bioreclamation plasmaus the blank rat plasma from the PK study. This matrix eas mitigated by the dilution[1] of the study samples (25�L)ith Bioreclamation plasma (75�L).
.4. Parameters for IS-MRM mass spectrometry experiment
The IS-MRM parameters were optimized using GPCho sards from Avanti Polar Lipids Inc. However, comparable resre obtained employing supernatants from a protein-preciplasma sample. The GPCho responses at 100% organic0.4 mL/min) were significantly enhanced by the post-coluddition of buffered aqueous eluent (10�L/min).
The primary method for simultaneously detectingPCho’s on the Quattro Micro triple quadrupole mass s
rometer employed a cone voltage of 90 V and collision enf 7 V. The mass transition ofm/z 184→ 184 was monitore
n the positive ion electrospray mode with dwell and interselay times of 0.05 and 0.03 s, respectively. Similar voltere employed for monitoring the 2-lyso-GPCho’s using/z 104→ 104 transition. The collision gas (argon) was se× 10−3 Torr.The primary method for simultaneously detecting
PCho’s on the Applied Biosystems 4000 Q TRAP employeclustering potential, entrance potential, collision energyollision cell exit potential of 165, 10, 7, and 5 V, respectivhe mass transition ofm/z 184→ 184 was monitored in the po
tive ion electrospray mode. Similar parameters were empl

J.L. Little et al. / J. Chromatogr. B xxx (2006) xxx–xxx 3
for monitoring 2-lyso GPCho’s via them/z 104→ 104 transition.The collision gas (nitrogen) pressure was set to medium.
2.5. Standard gradient method for the analysis of tamoxifenand its metabolites
The samples were analyzed on the Waters Quattro Microsystem using positive ion electrospray ionization in the MRMmode. The argon collision gas was set at 3× 10⁻³ Torr. Thefollowing MRM transitions were monitored:m/z 256→ 167,m/z 388→ 72, m/z 372→ 72, andm/z 358→ 58 for diphen-hydramine hydrochloride (IS), 4-hydroxytamoxifen, tamoxifen,and desmethyltamoxifen, respectively. The calibration data wasfit to a 1/x2 weighted linear regression with 10 standard concen-trations from 0.5 to 1000 ng/mL. All quantitative data processingwas performed with Waters QuanLynx software.
The LC separations were performed with a precolumn (Var-ian, MetaGuard) coupled to an analytical column (Varian,MonoChrom C18, 3�m, 50 mm× 2.0 mm). The same analyticalcolumn was employed for all sample analyses, but the precolumnwas excluded in many methods due to problems with productconsistency. The MonoChrom column was found to yield goodretention of basic drugs and excellent peak shape[22]. A stain-less steel frit (0.5�m) was placed before the precolumn in astainless steel holder and changed after ca. 100–200 injectionswhen the column backpressure increased ca. 100 psi. SolventA mL;1a ep-a wasM r-a
ara-t n,0 in,1 in,0 at4 ine,t ere1 floww ana )w ing1 of7 after3 ns bb inw Thec with1
2t
ctio2 Ms od
was modified. The following linear gradient was used for theseparation: 80% A for 0.2 min, 0.4 mL/min; 50% A at 0.3 min,0.4 mL/min; 0% A at 1.3 min, 0.4 mL/min; 0% A at 1.8 min,0.4 mL/min; 80%A at 1.81 min, 0.8 mL/min; 80% A at 2.25 min,0.8 mL/min; and 80% A at 2.26 min, 0.4 mL/min. Analyte elu-tion times were the same as those noted in Section2.5.
2.7. Steady-state isocratic method for the analysis oftamoxifen and its metabolites without elution of GPCho’s
Many conditions used were the same as those in Section2.5. An additional IS-MRM transition was added to the MRMsequence form/z 184→ 184 and the HPLC method was mod-ified. The isocratic method used 25% solvent A with a totalacquisition time of 1.5 min. The elution times for IS, tamoxifen,4-hydroxytamoxifen, and desmethyltamoxifen were 0.58, 1.60,0.85, and 1.24 min, respectively.
2.8. Standard gradient method for the analysis ofitraconazole and its metabolite
Many conditions used were the same as those in Sec-tion 2.5. The following MRM transitions were monitored:m/z705→ 392, m/z 708→ 395, andm/z 721→ 408 for itracona-zole, itraconazole-d3 (IS), and hydroxyitraconazole. Becauseitraconazole-d response varied with the itraconazole response[ inedb 1/q 2.5t
ate( off asa was5 l-u
ep-a in,0 in,0 in,1 Aa ole,i and1 them
2i
hosei edtf PLCm lventA fort sec
was a mixture of aqueous ammonium formate (10000 mM, pH adjusted to ca. 4.5 with ca. 10�L of formic acid)nd MeOH (30 mL). The pH adjustment was critical for the sration of tamoxifen from desmethyltamoxifen. Solvent BeOH. The column temperature was 40◦C, the sample tempeture was 4◦C, and the injection volume was 5�L.
The following linear gradient was used for the sepion: 80% A for 0.2 min, 0.4 mL/min; 50% A at 0.3 mi.4 mL/min; 0% A at 1.3 min, 0.4 mL/min; 0% A at 1.9 m.2 mL/min; 0% A at 3.51 min, 1.2 mL/min; 80% A at 3.52 m.8 mL/min; 80% A at 4.0 min, 0.8 mL/min; and 80% A.01 min, 0.4 mL/min. The elution times for diphenhydram
amoxifen, 4-hydroxytamoxifen, and desmethyltamoxifen w.19, 1.73, 1.47, and 1.63 min, respectively. The solventas diverted from the mass spectrometer before 1.0 minfter 1.9 min. The strong autosampler solvent[23] wash (0.5 mLas a 1:1:1:1 mixture of ACN:MeOH:IPA:water contain% formic acid. The weak solvent (0.5 mL) was a mixture5:12.5:12.5 water:MeOH:ACN. Columns were cleaned00–500 protein-precipitated plasma supernatant injectioackflushing with 10 column volumes of 1% formic acidater and 10 column volumes of 1% formic acid in MeOH.olumns were then washed in the normal direction of flow0 column volumes of MeOH.
.6. Steady-state gradient method for the analysis ofamoxifen and its metabolites without elution of GPCho’s
Many conditions employed were the same as those in Se.5. An additional IS-MRM transition was added to the MRequence form/z 184→ 184 and the gradient HPLC meth
d
y
n
324], the hydroxyitraconazole concentrations were determy external standard. The calibration data was fit to ax2
uadratic regression with 10 standard concentrations fromo 1500 ng/mL.
Solvent A was a mixture of aqueous ammonium form1000 mL; 10 mM, pH adjusted to ca. 3.5 with ca. 0.6 mLormic acid) and 50:50 MeOH:ACN (30 mL). Solvent B w
mixture of 50:50 MeOH:ACN. The column temperature0◦C, the sample temperature was 4◦C, and the injection vome was 5�L.
The following linear gradient was employed for the sration: 70% A for 0.2 min, 0.4 mL/min; 25% A at 0.3 m.4 mL/min; 17% A at 1.7 min, 0.4 mL/min; 17% A at 2.1 m.4 mL/min; 0% A at 2.2 min, 1.6 mL/min; 0% A at 3.0 m.6 mL/min; 70% A at 3.01 min, 0.4 mL/min; and 70%t 4.0 min, 0.4 mL/min. The elution times for itraconaz
traconazole-d3, and hydroxyitraconazole were 1.45, 1.45,.16 min, respectively. The solvent flow was diverted fromass spectrometer before 1.0 min and after 1.7 min.
.9. Steady-state isocratic method for the analysis oftraconazole without elution of GPCho’s
Many of the conditions employed were the same as tn Section2.8. An additional IS-MRM transition was addo the MRM sequence form/z 184→ 184. Them/z transitionor hydroxyitraconazole was removed, and the gradient Hethod was modified. The isocratic method used 25% sowith a total acquisition time of 1.5 min. The elution times
he itraconazole and itraconazole-d3 were 1.17 min and theomponents were separated from hydroxyitraconazole.

4 J.L. Little et al. / J. Chromatogr. B xxx (2006) xxx–xxx
Fig. 1. Structures for GPCho’s and in-source CID fragments noted.
3. Results and discussion
3.1. Monitoring choline-containing phospholipids viaIS-MRM
As summarized inFig. 1, there is a wide variety of GPCho’sfound in plasma (mouse, rat, rabbit, dog, monkey, and human).The lipid alkyl, acyl, and 1-alkenyl ester group chain lengthsmay vary from 16–22 carbons and contain from 0 to 6 sites ofunsaturation[17,25]. Consequently, monitoring all ion transi-tions for these individual components in an MRM experimentis not practical. The large number of required transitions woulddecrease the method’s sensitivity.
We have developed a method[19] that we call IS-MRM.This MRM approach allows all GPCho’s to be monitored byjust one transition in an MRM experiment. Our approach uti-lizes in-source collisionally induced dissociation (CID) to yielda common GPCho fragment ion (trimethylammonium-ethylphosphate ion;m/z 184). The resulting ion is then selected byquadrupole 1 (Q1), passed at low energy through collision cell(Q2) gas to avoid further fragmentation, and finally selected byquadrupole 3 (Q3). Since only voltage changes are employed,this IS-MRM experiment may be utilized as part of a tradi-tional MRM experiment to monitor drugs and metabolites withinsignificant sensitivity loss.
In-source CID[13,26] is used to obtain fragmentation infor-m eteT singt cona . Tho in at ripleq spetb ed it lar tot upolc1 hg
atersQ ass
spectrometers. Detailed parameters for both instruments arelisted in the Section2. For convenience, only the experimen-tal parameters for the Quattro Micro are discussed in detail inthe following paragraphs.
Routinely, using the Quattro Micro electrospray interface inpositive ion mode, ion adducts characteristic of the component’smolecular weight (MH+) are obtained with a cone (skimmer)voltage between 15 and 25 V. A cone voltage of 90 V is foundto yield optimal results for in-source CID fragment ions (m/z184 and 104). An MRM transition is setup with a cone volt-age at 90 V, Q1 and Q3 were both set to transmitm/z 184,and the collision cell, Q2, was set at 7 V. The voltage in Q2is set at a very low voltage to optimize the transmittance ofm/z 184 and thus avoid further fragmentation. This voltage ismuch lower than the 25–60 V typically used for generating frag-ment ions in Q2. The argon gas in the collision cell is keptat the same pressure (3× 10⁻³ Torr) used in a standard MRMexperiment. The MRM transition form/z 184→ 184 is addedto MRM’s being employed for drug(s) and metabolite(s) dur-ing LC–MS/MS method development. Because only one MRMtransition is required to monitor all lipids of interest, there is littlecompromise in method sensitivity. If desired, an additional tran-sition form/z 104→ 104 can be monitored to define the elutionprofile of 2-lyso-GPCho’s.
The results from the combination of our IS-MRM approachwith the widely accepted post-column approach[4] for prob-i er MRMt antf d byL onf ft ht rs anal-y tainedc
asei on-iu ro.L ran-
ation in either a single or triple quadrupole mass spectromhe fragmentation is accomplished by significantly increa
he voltage in the high pressure region between the samplend skimmer in an atmospheric pressure ionization sourcebserved fragments are often very similar to those noted
andem spectrum obtained in the collision cell, Q2, of a tuadrupole mass spectrometer. Examples of in-source CID
ra for both a 2-lyso and a diacyl GPCho are shown inFig. 2a and, respectively. In our analyses, the fragment ions observ
he in-source CID spectra for these GPCho’s were very simihose noted in tandem spectra obtained in the triple quadrollision cell [25,27]. As shown inFigs. 1 and 2, the ion atm/z84 is formed for both species while the ion atm/z 104 was mucreater for 2-lyso GPCho’s.
This IS-MRM approach was demonstrated using both Wuattro Micro and Applied Biosystems 4000 Q TRAP m
r.
ee
c-
n
e
ng matrix effects is shown inFig. 3a and b.Fig. 3a shows thesponse as xanax was infused post-column employing anransition ofm/z 309→ 281. Simultaneously, the supernatrom protein-precipitated plasma was injected and analyzeC–MS/MS. Fig. 3b shows the trace of the MRM transiti
or our IS-MRM experiment;m/z 184→ 184. The majority ohe ion suppression noted for xanax inFig. 3a correlates withe elution of the GPCho’s monitored inFig. 3b. The only otheignificant ion suppression observed at the beginning of thesis is due to the presence of salts and various other non-reomponents.
The IS-MRM approach may be modified slightly to increts specificity. The GPCho’s and 2-lysos GPCho’s can be mtored with eitherm/z 184→ 125 orm/z 184→ 86 transitionssing a Q2 collision energy of 20 V on the Quattro Micikewise, the 2-lyso GPCho’s can be monitored with a t

J.L. Little et al. / J. Chromatogr. B xxx (2006) xxx–xxx 5
Fig. 2. In-source CID spectra for GPCho’s at 90 V cone voltage on Quattro Micro mass spectrometer: (a) 2-lyso GPCho; (b) diacyl GPCho.
Fig. 3. Matrix ionization effects shown for GPCho’s with post column infusion of Xanax (180 ng/mL, 5�L/min) and LC–MS/MS analysis of protein-precipitatedrat plasma: (a) MRM transition for Xanax,m/z 309→ 281; (b) IS-MRM transition for GPCho’s,m/z 184→ 184.

6 J.L. Little et al. / J. Chromatogr. B xxx (2006) xxx–xxx
Fig. 4. General sphingomyelin (SM) structure showing in-source CID fragmen-tation.
sition of m/z 104→ 60 at a Q2 collision energy of 17 V. Thisapproach is not applicable to method development employingselected ion recording experiments with a single quadrupoleLC–MS.
3.2. Detecting other phospholipids in plasma
Relative to GPCho’s, other phospholipids such as sphin-gomyelins (SM’s), glycerophosphoethanolamines (GPEtn’s),and glycerophosphoserines (GPSer’s) are present at lower lev-els in plasma[18]. We also evaluated the IS-MRM approach indetecting these species. As illustrated inFig. 4, SM’s are easilydetected by this approach since they too form them/z 184 ionvia in-source CID; the major fragmentation mechanism noted inSM tandem spectra[25,27]. Hence, the SM’s present in plasmaare also detected in the same IS-MRM transition used to monitoGPCho’s. Only a small response was noted for the SM’s. Themost significant SM was the hexadecanoyl substituted specie(M + H+ and M + Na+; m/z 703 and 725, respectively) whichcoeluted with a diradyl-GPCho (seeFig. 3b).
On the other hand, GPEtn’s and GPSer’s could not be detecteusing an IS-MRM experiment. As presented inFig. 5, thesephospholipids lose their polar head groups as neutral loss (NLfragments via in-source CID. They can be detected as classeof compounds employing tandem NL experiments of 141 and1 -t s thI ot bep
3.3. Analyses of plasma from different species with IS-MRM
Protein-precipitated supernatants from a variety of differentmammals – mouse, rat (three different strains; Sprague–Dawley,Fischer, and Hanover-Wistar), rabbit, dog, monkey, and human– were examined by them/z 184→ 184 IS-MRM method. Theconcentrations and diversity of GPCho’s in these plasma samplesvaried significantly, but the retention time windows were verysimilar.
3.4. Standard gradient method development using IS-MRMexperiment
The utility of an IS-MRM approach during chromatographicmethod development is demonstrated in the quantitation oftamoxifen and two of its metabolites, 4-hydroxytamoxifen anddesmethyltamoxifen. Protein precipitation of rat plasma matrixemploying ACN was used for sample preparation and diphen-hydramine hydrochloride was used as the IS. Our goal was todevelop a chromatographic separation with a total cycle time ofless than 5 min; one that eluted GPCho’s from the column yetchromatographically resolved them from the analytes and IS.
GPCho’s are very hydrophobic species and require a signifi-cant amount of time to completely elute from a reversed-phaseHPLC column. We first studied the factors that decreased theselipids’ elution times. The major factors that decreased their elu-t flowr ’se rpris-i o’s,s hases heo pureMu herfl mix-t
e ofG ours epa-r ardst lutiont res-
lycer
85 amu’s for GPEtn’s and GPSer’s, respectively[25]. This neural loss approach is not as convenient or as sensitive aS-MRM method; the neutral loss tandem experiment cannerformed as an integral part of an MRM sequence.
Fig. 5. General glycerophosphoethanolamines (GPEtn’s) and g
r
s
d
)s
e
ion time were choice of organic solvent, temperature, andate. As presented inFig. 6, solvent selection will effect GPCholution from the reversed-phase column. It is somewhat su
ng that pure MeOH was the most effective for eluting GPChince ACN is normally considered a stronger reversed-polvent than MeOH[29]. Depending upon the specificity of trganic solvent required for the analytes of interest, eithereOH or MeOH/ACN mixtures containing≥25% MeOH weresed in all our methods. A problem with pure MeOH, at higow rates, is the high column backpressures generated byures of MeOH and water[28,30].
Flow rate can also significantly decrease the elution timPCho’s. The initial part of the solvent program in most
eparations employs a flow rate of 0.4 mL/min for optimal sation. The flow rates are then increased to >1.2 mL/min towhe end of our separations to significantly decrease the eimes of the GPCho’s. In order to keep the column backp
ophosphoserines (GPSer’s) structures showing neutral loss (NL) fragments.

J.L. Little et al. / J. Chromatogr. B xxx (2006) xxx–xxx 7
Fig. 6. Comparison of solvent composition for the elution of GPCho’s from reverse phase HPLC column employing the same gradient elution for all separationsutilizing MeOH and ACN as the organic eluents.
sure in an acceptable range, we found that the flow rate mustbe decreased during the return of the column to its initial sol-vent composition. This was necessary due to the high columnbackpressure which maximizes at a MeOH:water compositionof ∼50:50[28,30]. To minimize contamination of the electro-spray source, the flow was diverted from the mass spectrometerafter the elution of the analytes and during the first minute whensalts and other species eluted. Some care needs to be taken whenincreasing the flow rate during the time that the analytes of inter-est are being eluted since flow rate affects the gradient retentionfactor (k* ) and the selectivity (α) of the separation[29].
The other major factor that decreased lipid elution time wastemperature.Fig. 7 shows the effects that column temperaturehad on lipid elution. The upper temperature limit for this columnwas 60◦C. Higher temperatures would decrease the lipid elutiontime, but will severely shorten the lifetime of the column.
A pH range (3.5–7.0) had little effect on the retention timesof GPCho’s, but was critical in the separation of desmethyl-tamoxifen and tamoxifen. At pH 3.5, the desmethyltamoxifenand tamoxifen coeluted, but were baseline resolved at pH∼4.5.Fig. 8 shows the final separation of tamoxifen and its metabo-lites. The method had a cycle time of 4.5 min which included30 s for the autosampler injection sequence. The method was
used for a PK study of over 1000 rat plasma samples and con-formed to the standards outlined in the FDA guidelines[2] forcalibrator and quality control samples. The details of the methodare listed within Section2.
Many other variables could be evaluated to shorten the cycletime for the analysis including other stationary phases, supportsother than silica, other organic solvents or solvent mixtures,column switching, etc. However, the variation of MeOH orMeOH/ACN mixtures, temperature, and flow rate with a C-18reversed-phase column satisfied our current cycle time require-ments.
3.5. Steady-state gradient method without elution of lipids
A significant amount of time is wasted in eluting the GPCho’sfrom the column after the analytes elute. A method was eval-uated where the column was recycled to the initial gradientconditions after the analytes eluted from the column withoutlipid elution. This decreased the total cycle time from 4.5 to2.8 min. After three injections of the supernatant from protein-precipitated plasma, a significant amount of the GPCho’s fromearlier injections began to break-through and elute from thecolumn. After five to six plasma injections, the IS-MRM sig-

8 J.L. Little et al. / J. Chromatogr. B xxx (2006) xxx–xxx
Fig. 7. Comparison of column temperature on the elution of GPCho’s from reverse phase HPLC column employing the same gradient for all separations utilizing50:50 mixture of MeOH:ACN for Solvent B and ammonium formate buffer at pH 3.5 for solvent A.
Fig. 8. LC–MS/MS separation of tamoxifen and its metabolites, 25 ng/mL calibrator, GPCho’s fully eluted from column after each analysis and divertedfrom MS,4.5 min analysis cycle time; experimental details in Section2.5.
J.L. Little et al. / J. Chromatogr. B xxx (2006) xxx–xxx 9
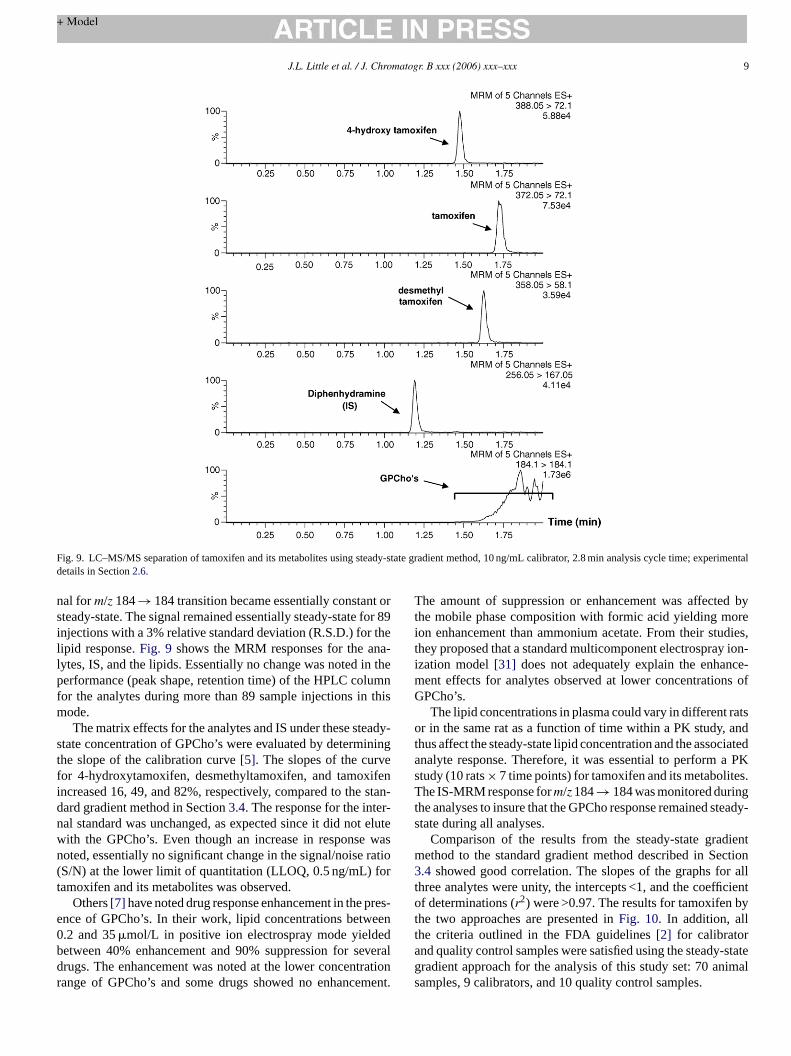
Fig. 9. LC–MS/MS separation of tamoxifen and its metabolites using steady-state gradient method, 10 ng/mL calibrator, 2.8 min analysis cycle time; experimentaldetails in Section2.6.
nal form/z 184→ 184 transition became essentially constant orsteady-state. The signal remained essentially steady-state for 89injections with a 3% relative standard deviation (R.S.D.) for thelipid response.Fig. 9 shows the MRM responses for the ana-lytes, IS, and the lipids. Essentially no change was noted in theperformance (peak shape, retention time) of the HPLC columnfor the analytes during more than 89 sample injections in thismode.
The matrix effects for the analytes and IS under these steady-state concentration of GPCho’s were evaluated by determiningthe slope of the calibration curve[5]. The slopes of the curvefor 4-hydroxytamoxifen, desmethyltamoxifen, and tamoxifenincreased 16, 49, and 82%, respectively, compared to the stan-dard gradient method in Section3.4. The response for the inter-nal standard was unchanged, as expected since it did not elutewith the GPCho’s. Even though an increase in response wasnoted, essentially no significant change in the signal/noise ratio(S/N) at the lower limit of quantitation (LLOQ, 0.5 ng/mL) fortamoxifen and its metabolites was observed.
Others[7] have noted drug response enhancement in the pres-ence of GPCho’s. In their work, lipid concentrations between0.2 and 35�mol/L in positive ion electrospray mode yieldedbetween 40% enhancement and 90% suppression for severaldrugs. The enhancement was noted at the lower concentrationrange of GPCho’s and some drugs showed no enhancement.
The amount of suppression or enhancement was affected bythe mobile phase composition with formic acid yielding moreion enhancement than ammonium acetate. From their studies,they proposed that a standard multicomponent electrospray ion-ization model[31] does not adequately explain the enhance-ment effects for analytes observed at lower concentrations ofGPCho’s.
The lipid concentrations in plasma could vary in different ratsor in the same rat as a function of time within a PK study, andthus affect the steady-state lipid concentration and the associatedanalyte response. Therefore, it was essential to perform a PKstudy (10 rats× 7 time points) for tamoxifen and its metabolites.The IS-MRM response form/z 184→ 184 was monitored duringthe analyses to insure that the GPCho response remained steady-state during all analyses.
Comparison of the results from the steady-state gradientmethod to the standard gradient method described in Section3.4 showed good correlation. The slopes of the graphs for allthree analytes were unity, the intercepts <1, and the coefficientof determinations (r2) were >0.97. The results for tamoxifen bythe two approaches are presented inFig. 10. In addition, allthe criteria outlined in the FDA guidelines[2] for calibratorand quality control samples were satisfied using the steady-stategradient approach for the analysis of this study set: 70 animalsamples, 9 calibrators, and 10 quality control samples.

10 J.L. Little et al. / J. Chromatogr. B xxx (2006) xxx–xxx
Fig. 10. Comparison of tamoxifen concentrations obtained with steady-stategradient method vs. standard gradient method.
Time delays between injections could be problematic if thesteady-state concentration of GPCho’s changed. The change inconcentration would lead to changes in analyte response fac-tor. A study was performed where the lipid concentrations hadreached steady-state; afterwards, a 1 h delay was inserted intothe analysis sequence. During this delay, the column was held atthe initial gradient conditions. Injection of plasma samples afterthis delay yielded a steady-state concentration for the lipid sig-
nal which was essentially the same as before the delay. Hence,reasonable delays between sample analyses are not expected tocause a change in the calibration of the analysis since the lipidsof interest remained focused on the HPLC column.
3.6. Isocratic steady-state method example without elutionof lipids
Studies were performed to determine if an isocratic methodcould be employed for the tamoxifen analyses. Isocratic methodsdo not require the gradient equilibration times after each analysisresulting in shorter cycle times, and can be performed on muchless costly and complex HPLC instrumentation.
A 2.5 min isocratic run was performed with 70% organic elu-ent. These conditions did not elute the lipids of interest duringthe first analysis. After six to seven plasma injections, the lipidresponses became somewhat steady-state as shown inFig. 11.The profile of the curve was reasonably reproducible over 90injections; however, the overall response for the lipids (R.S.D.12%) varied considerably more than that (R.S.D. 3%) notedfor the steady-state gradient approach described in Section3.5.The responses for all the analytes including the internal stan-dard were increased. The S/N at the LLOQ of 0.5 ng/mL for4-hydroxytamoxifen was essentially the same as that noted withthe steady-state and standard gradient methods. The S/N at
Fd
ig. 11. LC–MS/MS separation of tamoxifen and its metabolites using steady-etails in Section2.7.
state isocratic method, 10 ng/mL calibrator, 2.5 min analysis cycle time; experimental

J.L. Little et al. / J. Chromatogr. B xxx (2006) xxx–xxx 11
the LLOQ of 0.5 ng/mL for desmethyltamoxifen and tamoxifenwere decreased somewhat due to their increased peakwidths inthe isocratic separation.
The tamoxifen study samples were analyzed by the isocraticapproach and the resulting values compared to those obtainedfrom the standard gradient method in Section3.4. The val-ues for tamoxifen were similar in both methods but the valueswere about 25% greater for both desmethyltamoxifen and 4-hydroxytamoxifen in the standard gradient method compared tothis isocratic method. Furthermore, the criteria outlined in theFDA guidelines[2] for calibrator and quality control sampleswere not satisfied for this isocratic steady-state method. Thus,an isocratic method was not found to be acceptable for this par-ticular analysis due to significant biases, quality control errors,and calibration problems.
The problems noted in this approach are probably related tothe fact that GPCho’s are continually being flushed from theHPLC column under steady-state isocratic conditions. This isin contrast to the focusing of GPCho’s noted in the steady-stategradient method discussed in Section3.5. Indeed, the lipids con-centrated on the column in six to seven injections will be flushedfrom the column in approximately 30–40 min.
3.7. Isocratic steady-state method usingstable-isotope-labeled IS without elution of lipids
ds isa ects[ mea r thu in thsu ver-t s eao ouno ther rang[
na-z nem lutet seco d noe
azoli thm ines[ 80s comp 0.96r nterc luesf typot viaba of thb
4. Conclusions
A wide variety of strategies are needed to evaluateLC–MS/MS matrix ionization effects resulting from endoge-nous and exogenous chemical species in plasma[1]. We foundour IS-MRM approach to be a useful new tool for probing thematrix ionization effects of endogenous GPCho’s. Depending onthe positive ion electrospray and chromatographic conditions,these GPCho’s can either suppress or enhance ionization. Ourapproach was utilized to develop reliable LC–MS/MS methodsfor the analysis of several drugs and their metabolites in PKstudies employing protein-precipitated plasma. Cycle times of<5 min were obtained which separated the GPCho’s from theanalytes; the very hydrophobic lipids were completely elutedfrom the column after each analysis.
The complete elution of the GPCho’s after each analysisappears to be the safest approach. This standard gradient methodis currently employed in our laboratories since the cycle times of<5 min meet our current sample load demands. However, otherapproaches in which the GPCho’s are not eluted from the columnafter each analysis could significantly decrease cycle times. Forexample, the steady-state gradient approach was shown to be aviable method for the analysis of tamoxifen and its metabolitesand decreased the analysis cycle time by∼40% with essen-tially no bias in results when compared to the standard gradientmethod. Attempts to develop a steady-state isocratic methodf d ISw zolee iasesi
A
dis-c ids,a
R
rugapter
art-tion,le at
) 3.ss
em.
med.
ietyy and
sso-Lake/
The utilization of stable-isotope-labeled internal standarvery good approach for overcoming matrix ionization eff
1]. Theoretically, the labeled IS will experience the samount of matrix suppression or enhancement as that fonlabeled analyte. It was hoped that the problems notedteady-state isocratic method for tamoxifen in Section3.6withnlabeled IS could be overcome with this approach. Ne
heless, the analyte and isotope-labeled IS can suppresthers response in electrospray ionization. Thus, the amf isotope-labeled IS must be properly chosen to keepesponse factor constant over the desired quantitation24].
We developed two methods for the analysis of itracoole employing itraconazole-d3 as an internal standard. Oethod was a standard gradient method that completely e
he GPCho’s after every analysis (4.5 min cycle time). Thend method was a steady-state isocratic method which dilute the GPCho’s after every analysis (2 min cycle time).
The two approaches were employed to analyze itraconn rat plasma (8 rats× 10 time points). The results from bo
ethods satisfied all the criteria outlined in the FDA guidel2] for calibrator and quality control samples; analysis ofamples, 10 calibrators, and 12 quality control samples. Aarison of the results showed a very good correlation (slope2 0.96) between the two methods. However, a large offset (iept∼12 ng/mL, range of values 0.5–250 ng/mL) in the vaor the isocratic versus the gradient method indicates somef interference for either itraconazole or itraconazole-d3. Thus,
he use of stable-isotope-labeled IS does appear to be approach, but more studies need to determine the sourceias.
ee
cht
e
d-t
e
-,
-
e
lee
or tamoxifen and its metabolites employing an unlabeleere unsuccessful. However, a similar method for itraconamploying a stable-isotope-labeled IS showed promise if b
n the results can be resolved.
cknowledgements
We gratefully acknowledge John W. Dolan for valuableussions, William W. Christie for literature references on lipnd Stephen K. Haynes for sample preparation.
eferences
[1] H. Mei, in: W. Korfmacher (Ed.), Using Mass Spectrometry for DMetabolism Studies, CRC Press, Boca Raton, FL, 2005, p. 103, Ch4.
[2] Guidance for Industry, Bioanalytical Methods Validation, U.S. Depment of Health and Human Services, Food and Drug AdministraCenter for Drug Evaluation and Research (CDER), 2001, availabhttp://www.fda.gov/cder/guidance/4252fnl.htm.
[3] S. Zhou, Q. Song, Y. Tang, W. Naidong, Curr. Pharm. Anal. I (2005[4] R. Bonfiglio, R.C. King, T.V. Olah, K. Merkle, Rapid Commun. Ma
Spectrom. 13 (1999) 1175.[5] B.K. Matuszewski, M.L. Constanzer, C.M. Chavez-Eng, Anal. Ch
75 (2003) 3019.[6] J.X. Shen, R.J. Motyka, J.P. Roach, R.N. Hayes, J. Pharm. Bio
Anal. 37 (2005) 359.[7] M. Ahnoff, H. Hagelin, Proceedings of the 52nd American Soc
for Mass Spectrometry (ASMS) Conference on Mass SpectrometrAllied Topics, May 2004, Nashville, TN, 2004.
[8] P.K. Bennett, K.C. Van Horne, Proceedings from American Aciation of Pharmaceutical Scientists (ASPS) Conference, SaltCity, UT, USA, October 2003, available athttp://www.tandemlabs.comcapabilitiespublications.html.

12 J.L. Little et al. / J. Chromatogr. B xxx (2006) xxx–xxx
[9] S. Hua, N. Weng, Pharm. Technol. (2003) 74.[10] C. Polson, P. Sarkar, B. Incledon, V. Raguvaran, R. Grant, J. Chromatogr.
B 785 (2003) 263.[11] K. Jean-Philippe Antigna, F. de Wasch, H. Monteau, F. De Brabander,
B. Andre, Le Bizec, Anal. Chim. Acta 529 (2005) 129.[12] R. Dams, M.A. Huestis, W.E. Lambert, C.M. Murphy, J. Am. Soc. Mass
Spectrom. 14 (2003) 1290.[13] C. Muller, P. Schafer, M. Stortzel, S. Vogt, W. Weinmann, J. Chromatogr.
B 773 (2002) 47.[14] B.K. Matuszewski, M.L. Constanzer, C.M. Chavez-Eng, Anal. Chem.
70 (1998) 882.[15] H. Mei, Y. Hsieh, C. Nardo, X. Xu, S. Wang, K. Ng, W.A. Korfmacher,
Rapid Commun. Mass Spectrom. 17 (2003) 97.[16] B. Alberts, A. Johnson, J. Lewis, M. Raff, K. Roberts, P. Walter, Molec-
ular Biology of the Cell, Garland Science, New York, NY, 2002 (Chapter10), p. 583.
[17] J.J. Myher, A. Kukis, S. Pind, Lipids 24 (1989) 408.[18] G.B. Phillips, J.T. Dodge, J. Lipid Res. 8 (1967) 676.[19] J.L. Little, Proceedings of the 53rd American Society for Mass Spec-
trometry (ASMS) Conference on Mass Spectrometry and Allied Topics,San Antonio, TX, June, 2005.
[20] J. Ke, M. Yancey, S. Zhang, S. Lowes, J.D. Henion, J. Chromatogr. B742 (2000) 369.
[21] L. Yang, N. Wu, R.P. Clement, P.J. Rudewicz, J. Chromatogr. B 799(2004) 271.
[22] D. Humphries, K. Ruterbories, C. Chan, R. Narayanan, J. Chromatogr.B 810 (2004) 229.
[23] N. Ellor, Personal Communication, Waters Corp., 2005.[24] H.R. Liang, R.L. Foltz, M. Meng, P. Bennett, Rapid Commun. Mass
Spectrom. 17 (2003) 2815.[25] R.C. Murphy, Mass Spectrometry of Phospholipids: Tables of Molecular
and Product Ions, Illuminati Press, Denver, CO, 2002.[26] C. Bure, C. Lange, Curr. Org. Chem. 7 (2003) 1613.[27] J.L. Kerwin, A.R. Tuininga, L.H. Ericsson, J. Lipid Res. 35 (1994) 1102.[28] J.M. Miller, Chromatograhy: Concepts and Contrasts, in: Wiley-
Interscience Publications, 198, John Wiley & Sons, New York, NY,1988, p. 211.
[29] L.R. Snyder, J.J. Kirkland, J.L. Glajch, Practical HPLC Method Devel-opment, 239, second ed., John Wiley & Sons Inc., New York, NY, 1997,p. 350.
[30] S. Van der Wal, Chromatographia 20 (1985) 274.[31] L. Tand, P. Kebarle, Anal. Chem. 65 (1993) 3654.
Related Documents


