MARINE ECOLOGY PROGRESS SERIES Mar Ecol Prog Ser Vol. 286: 57–68, 2005 Published February 2 INTRODUCTION Continental margins are particularly important for carbon cycling. Globally, ~45% of buried organic mat- ter occurs in shelf areas (Hedges & Keil 1995). They are generally highly productive and the shallow water column reduces the opportunity for remineralization. More surface primary production reaches the seabed in shallower water (Tyler 1995) because particle fluxes decrease with depth as would be expected if particles are remineralized or disaggregated during settling (Asper et al. 1992). One question that remains is the variability in the nature of the material arriving in coastal sediments (Goñi et al. 2000). Lipids are an important component of the productiv- ity of shelf areas. They are carbon-rich with a very high energy value and are thus important metabolic fuels. Certain constituents of lipids such as polyunsaturated fatty acids (PUFA) are also essential nutrients for ani- mals. Marine invertebrates require PUFA with be- tween 2 and 6 double bonds for survival and growth (Xu et al. 1994, Pond et al. 1996, Milke et al. 2004). In this lipid biogeochemistry study, cruises were undertaken in Conception Bay, Newfoundland, to sample a sinking spring bloom. Conception Bay is one of several large fjord-like bays on the Atlantic coast of Newfoundland. In order to measure the transfer of bloom material to the benthos we used sediment traps. While traps are the usual means of determining water column fluxes, problems with microbial activity and the use of poisons in traps (Lee et al. 1992) or with dis- solution of trapped particles (Kortzinger et al. 1994) are © Inter-Research 2005 · www.int-res.com *Email: [email protected] Lipid classes and fatty acids in plankton and settling matter during the spring bloom in a cold ocean coastal environment Christopher C. Parrish*, Raymond J. Thompson, Don Deibel Ocean Sciences Centre, Memorial University of Newfoundland, St. John’s, Newfoundland and Labrador, A1C 5S7, Canada ABSTRACT: Lipid concentration and composition were measured in net-tow and sediment trap sam- ples during the spring diatom bloom in Conception Bay, Newfoundland, to determine the quantity and quality of material settling from the upper mixed layer into the benthic food web. An experiment was also conducted to estimate trap accuracy and precision, in which trap poisoning was found to reduce bacterially mediated dissolution, but to increase variability in particulate lipid data. Total lipid concentrations in plankton reached a maximum of 6.3 ± 2.5% dry weight (mean ± SD) at the height of the bloom in April. Bacterial fatty acid markers were at their lowest during the bloom period (2.0 to 2.8% of total fatty acids), while polyunsaturated fatty acids (PUFA) were at their highest from the beginning of the bloom onwards (44 to 53%). The maximum fluxes of total lipids (75 ± 0.7 mg m –2 d –1 ) in non-poisoned traps at 80 m depth occurred at the bloom maximum while those at 220 m (35 ± 1.7 mg m –2 d –1 ) occurred 16 d later. The lipid and PUFA supply to the benthos was over 10 times that accumulated by important amphipod and mysid populations in Conception Bay. In the deep traps, PUFA were maintained at high levels (33 to 35%) throughout the bloom period while bacterial mark- ers were at their lowest (2.3 to 2.9%). A comparison of fluxes showed that over half the PUFA sur- vived transit from 80 to 220 m during the bloom period. These data indicate a rapid transfer of highly nutritious material to the benthos during the spring bloom in Conception Bay. KEY WORDS: Lipids · Pigments · CHN · Net-tows · Sediment traps · Integrated fluxes Resale or republication not permitted without written consent of the publisher

Welcome message from author
This document is posted to help you gain knowledge. Please leave a comment to let me know what you think about it! Share it to your friends and learn new things together.
Transcript
MARINE ECOLOGY PROGRESS SERIESMar Ecol Prog Ser
Vol. 286: 57–68, 2005 Published February 2
INTRODUCTION
Continental margins are particularly important forcarbon cycling. Globally, ~45% of buried organic mat-ter occurs in shelf areas (Hedges & Keil 1995). They aregenerally highly productive and the shallow watercolumn reduces the opportunity for remineralization.More surface primary production reaches the seabedin shallower water (Tyler 1995) because particle fluxesdecrease with depth as would be expected if particlesare remineralized or disaggregated during settling(Asper et al. 1992). One question that remains is thevariability in the nature of the material arriving incoastal sediments (Goñi et al. 2000).
Lipids are an important component of the productiv-ity of shelf areas. They are carbon-rich with a very high
energy value and are thus important metabolic fuels.Certain constituents of lipids such as polyunsaturatedfatty acids (PUFA) are also essential nutrients for ani-mals. Marine invertebrates require PUFA with be-tween 2 and 6 double bonds for survival and growth(Xu et al. 1994, Pond et al. 1996, Milke et al. 2004).
In this lipid biogeochemistry study, cruises wereundertaken in Conception Bay, Newfoundland, tosample a sinking spring bloom. Conception Bay is oneof several large fjord-like bays on the Atlantic coast ofNewfoundland. In order to measure the transfer ofbloom material to the benthos we used sediment traps.While traps are the usual means of determining watercolumn fluxes, problems with microbial activity andthe use of poisons in traps (Lee et al. 1992) or with dis-solution of trapped particles (Kortzinger et al. 1994) are
© Inter-Research 2005 · www.int-res.com*Email: [email protected]
Lipid classes and fatty acids in plankton andsettling matter during the spring bloom in a cold
ocean coastal environment
Christopher C. Parrish*, Raymond J. Thompson, Don Deibel
Ocean Sciences Centre, Memorial University of Newfoundland, St. John’s, Newfoundland and Labrador, A1C 5S7, Canada
ABSTRACT: Lipid concentration and composition were measured in net-tow and sediment trap sam-ples during the spring diatom bloom in Conception Bay, Newfoundland, to determine the quantityand quality of material settling from the upper mixed layer into the benthic food web. An experimentwas also conducted to estimate trap accuracy and precision, in which trap poisoning was found toreduce bacterially mediated dissolution, but to increase variability in particulate lipid data. Total lipidconcentrations in plankton reached a maximum of 6.3 ± 2.5% dry weight (mean ± SD) at the heightof the bloom in April. Bacterial fatty acid markers were at their lowest during the bloom period (2.0 to2.8% of total fatty acids), while polyunsaturated fatty acids (PUFA) were at their highest from thebeginning of the bloom onwards (44 to 53%). The maximum fluxes of total lipids (75 ± 0.7 mg m–2 d–1)in non-poisoned traps at 80 m depth occurred at the bloom maximum while those at 220 m (35 ±1.7 mg m–2 d–1) occurred 16 d later. The lipid and PUFA supply to the benthos was over 10 times thataccumulated by important amphipod and mysid populations in Conception Bay. In the deep traps,PUFA were maintained at high levels (33 to 35%) throughout the bloom period while bacterial mark-ers were at their lowest (2.3 to 2.9%). A comparison of fluxes showed that over half the PUFA sur-vived transit from 80 to 220 m during the bloom period. These data indicate a rapid transfer of highlynutritious material to the benthos during the spring bloom in Conception Bay.
KEY WORDS: Lipids · Pigments · CHN · Net-tows · Sediment traps · Integrated fluxes
Resale or republication not permitted without written consent of the publisher
Mar Ecol Prog Ser 286: 57–68, 2005
well known. In a 3 d sediment trap deployment in Trin-ity Bay, Newfoundland, we had previously found thatthe amount of dissolved lipids could often be as high asone third the amount of particulate lipids in the bottomof sediment traps (Parrish 1998). However, by applyingthe principles of equilibrium chemistry we hypothe-sized that losses of lipid material due to dissolutionwould become proportionately less of a concern as theperiod of trap deployment increased (Budge & Parrish1998).
Our research site, Conception Bay, provides a uni-que opportunity to study cold ocean processes at mid-latitudes. The inshore branch of the Labrador Currentmaintains sub-zero temperatures below 150 m year-round and surface waters are seasonally as cold (Stead& Thompson 2003). However, modelling of over 10 yrof biological and physical data has revealed that thetiming of the initiation of the spring phytoplanktonbloom is independent of temperature (Tian et al. 2003),while bacteria and especially zooplankton growth maybe suppressed in the spring (Pomeroy et al. 1991). Con-sequently hyperbenthic and benthic animals are therecipients of significant portions of the productivity(Choe et al. 2003, Stead & Thompson 2003). The qual-ity of the settling material should be high, as polarmicroalgae produce high levels of PUFA (Skerratt et al.1995, Henderson et al. 1998). Thus in this study wesought to measure the nature and quantity of springbloom lipids produced at low temperatures and todetermine their flux through the water column. Wealso evaluated the sampling process used to measurethis lipid transfer to the benthos.
MATERIALS AND METHODS
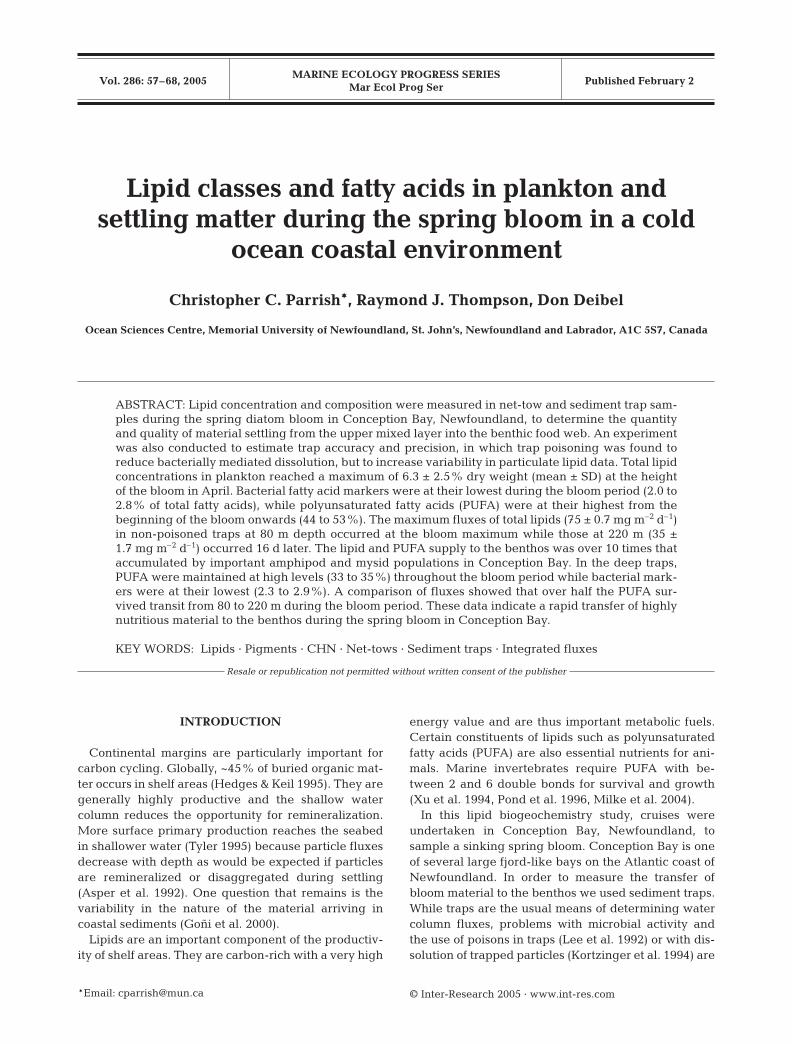
Water and sediment trap samples were taken nearthe deepest part of Conception Bay in 248 m of waterat ~18 d intervals from 6 March to 9 July 1996 (Fig. 1).Conception Bay is ~100 km long and 30 km wide, witha maximum depth of ~300 m and a sill depth of 170 m.
Water sampling. Conductivity-temperature-depthcasts were conducted throughout the sampling periodusing a Seabird SBE 25 CTD fitted with a SeaTechfluorometer. Nitrate, silicate and phosphate concentra-tions were determined in an EnviroFlow 3500 nutrientanalyser (Perstorp Analytical) from Niskin bottle sam-ples that were filtered through 0.45 µm cellulose ace-tate filters. Nitrate and nitrite were measured togethersince we have previously found that nitrite concentra-tions are approximately 1% of the nitrate + nitrite con-centrations in Newfoundland waters (Parrish 1998).Plankton was sampled by towing a 20 µm mesh netvertically from 80 m to the surface. In these waters, thissampling procedure collects diatoms, dinoflagellates
and copepod nauplii (Budge & Parrish 1998). Planktonin the cod end were poured into plastic containers andkept in darkness on ice until subsampling for lipid andweight determination in the laboratory within 5 h.
Sampling settling matter. Samples of settling matterwere collected in a manner very similar to that used ina previous study in Trinity Bay (Parrish 1998). On6 March 1996 a sediment trap mooring was deployedin 248 m of water in Conception Bay at Stn BRLP5(47°32.6’N 53°07.9’W). Each trap consisted of a 60 cmPVC pipe, sealed at one end and fitted with a spigotplaced at about the bottom 1 l mark. Four traps wereset at each of 80 and 220 m with 2 at each depth being
58
Fig. 1. Station location (X) in Conception Bay on the southeast coast of the island of Newfoundland
Parrish et al.: Sinking of spring bloom lipids
poisoned with 5 g l–1 HgCl2 in 40 ppt NaCl(aq), the other2 having only 40 ppt NaCl solution placed in the bot-tom at the time of deployment. On 27 March 1996, thetraps were recovered, samples were taken and thetraps were redeployed. Subsamples for lipid,chloropigment, CHN and weight determination werefiltered onto pre-combusted Whatman GF/C glass-fibre filters. This procedure was then repeated at ~18 dintervals until 9 July 1996.
Trap performance. In April 1998 an experiment wasconducted to evaluate trap accuracy. A mooring wasdeployed at Stn BRLP5 in 248 m of water in ConceptionBay for 15 d. Four traps were set at each of 50, 75 and100 m with 2 at each depth being poisoned with 5 g l–1
HgCl2 in 40 ppt NaCl(aq), the other 2 having only 40 pptNaCl solution placed in the bottom at the time ofdeployment. On the day of deployment and recovery5 l Go-Flo bottles were used to collect seawater at thesame depths as used for trap deployment. The trapswere sampled in the usual manner on recovery exceptthat the entire contents of one 50 m non-poisoned andone 50 m poisoned trap were also sampled in 1 laliquots. In the laboratory all samples were filteredthrough 47 mm Whatman GF/C glass-fibre filters toobtain both dissolved and particulate fractions fromboth within and outside the traps. Observations weremade on the size and number of zooplankton ‘swim-mers’ visible on the filters before their removal.
Lipid analyses. Samples were extracted and ana-lysed based on Parrish (1999). Briefly, samples wereextracted in chloroform-methanol (2:1) using a modi-fied Folch procedure. Extracts were analysed with theChromarod-Iatroscan TLC/FID system for lipid classes(Parrish 1987a). Lipid classes were scanned on the rodsin 3 steps with different scan lengths for each step:Iatroscan settings of PPS (partial pyrolysis selection) 22and 11 for the first 2 chromatograms, and a full scanfor the last one. To determine individual fatty acids bygas chromatography, samples were derivatized at85°C with 10% BF3/MeOH. Water was then added andthe upper, organic layer was withdrawn and placed ina 2 ml vial. The sample was concentrated to 0.5–1.0 mlunder nitrogen and 1 µl was injected into a Varian3400 gas chromatograph using a Varian 8100 Auto-Sampler. Fatty acids were identified mainly with theuse of a comprehensive standard (Supelco 37 compo-nent FAME mix) and by careful reference to Ackman(1986).
Pigment analyses. Pigments were extracted fromsediment trap samples in 90% acetone at –20°C.Chloropigments were separated on a 5 µm reversephase column in a Beckman HPLC using 2 methanol-based solvent systems (Redden 1994).
Carbon, nitrogen, dry and ash weight determina-tions. For organic carbon and nitrogen determination,
samples were dried at 60°C and combusted in aPerkin-Elmer 240A CHN analyser. Weights were mea-sured on samples that had been washed with 5 to 10 mlof 3% ammonium formate before drying for 16 to 18 hat 80°C. These samples were then combusted at 450°Cto determine weight loss.
RESULTS AND DISCUSSION
Hydrographic conditions
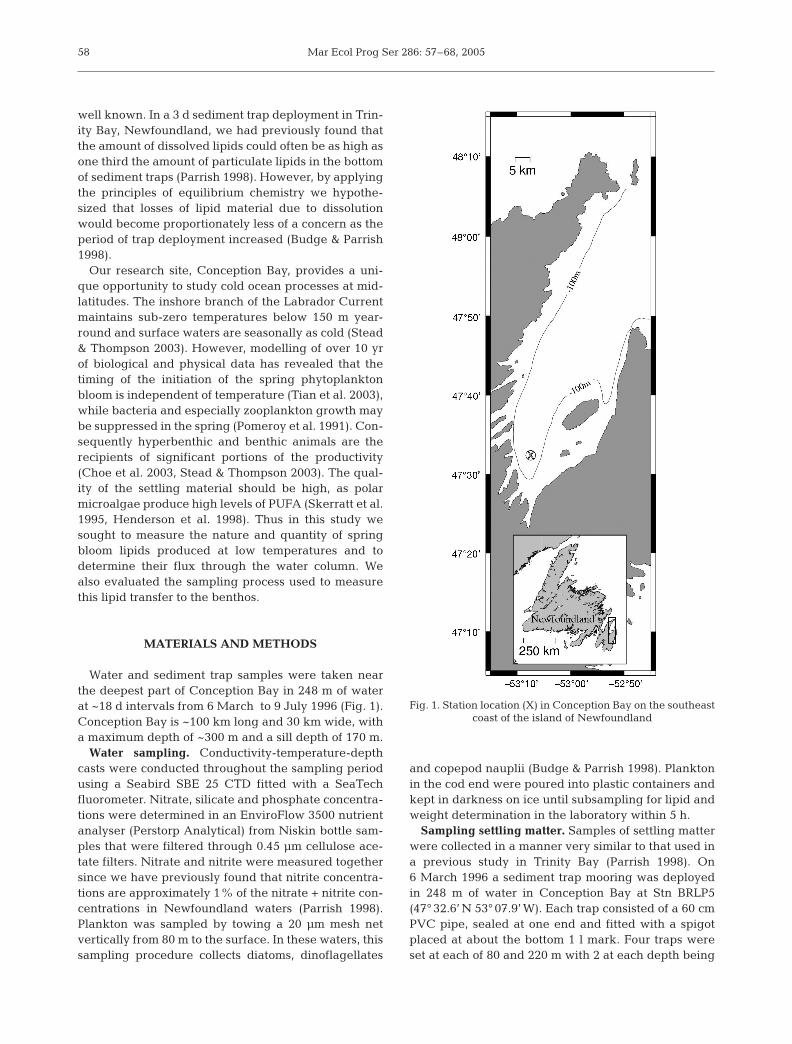
In March 1996, the temperature was below zerothroughout the water column at the mooring station inConception Bay (Fig. 2), and it remained sub-zerobelow 75 m until mid-August. Below 180 m, salinityand density were greater than 32.8 and 26.4 respec-tively throughout the sampling period. Salinity anddensity data suggest a mixing event down to ~100 m atthe beginning of April. A strong pycnocline developednear the end of June when salinities and densitiesdropped below 32.0 and 25.0 respectively in the top15 m of the water column.
59
Dep
th (m
)
020406080
100120140160180200220240
-0.5
0.0 0.51.02.04.0
6.08.0
10.012.0
-1.0
-0.5
-0.5
-0.5
-1.0 -0.5 0.0 0.5 1.0 2.0 4.0 6.0 8.0 10.0 12.0 14.0
Dep
th (m
)
020406080
100120140160180200220240
32.8
32.6
32.432.2
32.0
33.033.0
32.2
32.2
32.0 32.2 32.4 32.6 32.8 33.0 33.2 33.4 33.6 33.8 34.0
Dep
th (m
)
020406080
100120140160180200220240
26.4
26.2
26.0 25.8 25.625.4
25.225.025.8
25.0 25.2 25.4 25.6 25.8 26.0 26.2 26.4 26.6
(a)
(b)
(c)
oC
PSU
σθ
29 Feb 30 Mar 29 Apr 29 May 28 June 28 Jul 27 Aug
Fig. 2. Temperature (°C), salinity (psu) and density (sigma-θ)during the 1996 spring diatom increase in Conception Bay,
Newfoundland. Arrows indicate dates of casts
Mar Ecol Prog Ser 286: 57–68, 2005
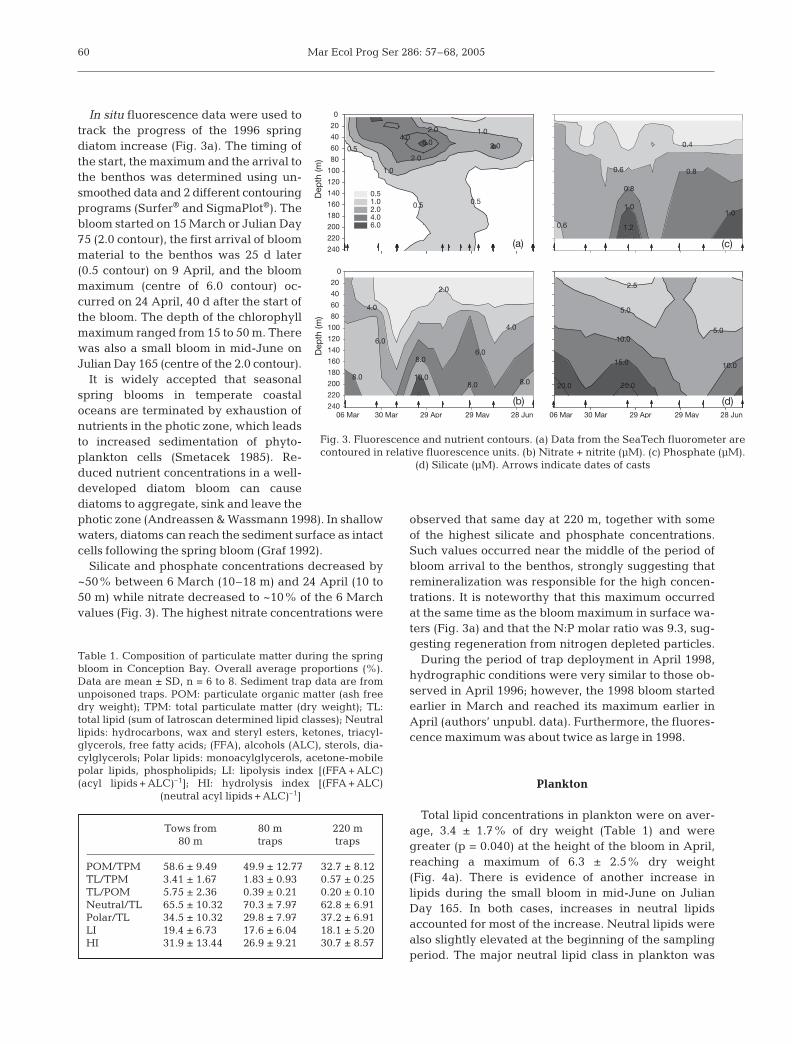
In situ fluorescence data were used totrack the progress of the 1996 springdiatom increase (Fig. 3a). The timing ofthe start, the maximum and the arrival tothe benthos was determined using un-smoothed data and 2 different contouringprograms (Surfer® and SigmaPlot®). Thebloom started on 15 March or Julian Day75 (2.0 contour), the first arrival of bloommaterial to the benthos was 25 d later(0.5 contour) on 9 April, and the bloommaximum (centre of 6.0 contour) oc-curred on 24 April, 40 d after the start ofthe bloom. The depth of the chlorophyllmaximum ranged from 15 to 50 m. Therewas also a small bloom in mid-June onJulian Day 165 (centre of the 2.0 contour).
It is widely accepted that seasonalspring blooms in temperate coastaloceans are terminated by exhaustion ofnutrients in the photic zone, which leadsto increased sedimentation of phyto-plankton cells (Smetacek 1985). Re-duced nutrient concentrations in a well-developed diatom bloom can causediatoms to aggregate, sink and leave thephotic zone (Andreassen & Wassmann 1998). In shallowwaters, diatoms can reach the sediment surface as intactcells following the spring bloom (Graf 1992).
Silicate and phosphate concentrations decreased by~50% between 6 March (10–18 m) and 24 April (10 to50 m) while nitrate decreased to ~10% of the 6 Marchvalues (Fig. 3). The highest nitrate concentrations were
observed that same day at 220 m, together with someof the highest silicate and phosphate concentrations.Such values occurred near the middle of the period ofbloom arrival to the benthos, strongly suggesting thatremineralization was responsible for the high concen-trations. It is noteworthy that this maximum occurredat the same time as the bloom maximum in surface wa-ters (Fig. 3a) and that the N:P molar ratio was 9.3, sug-gesting regeneration from nitrogen depleted particles.
During the period of trap deployment in April 1998,hydrographic conditions were very similar to those ob-served in April 1996; however, the 1998 bloom startedearlier in March and reached its maximum earlier inApril (authors’ unpubl. data). Furthermore, the fluores-cence maximum was about twice as large in 1998.
Plankton
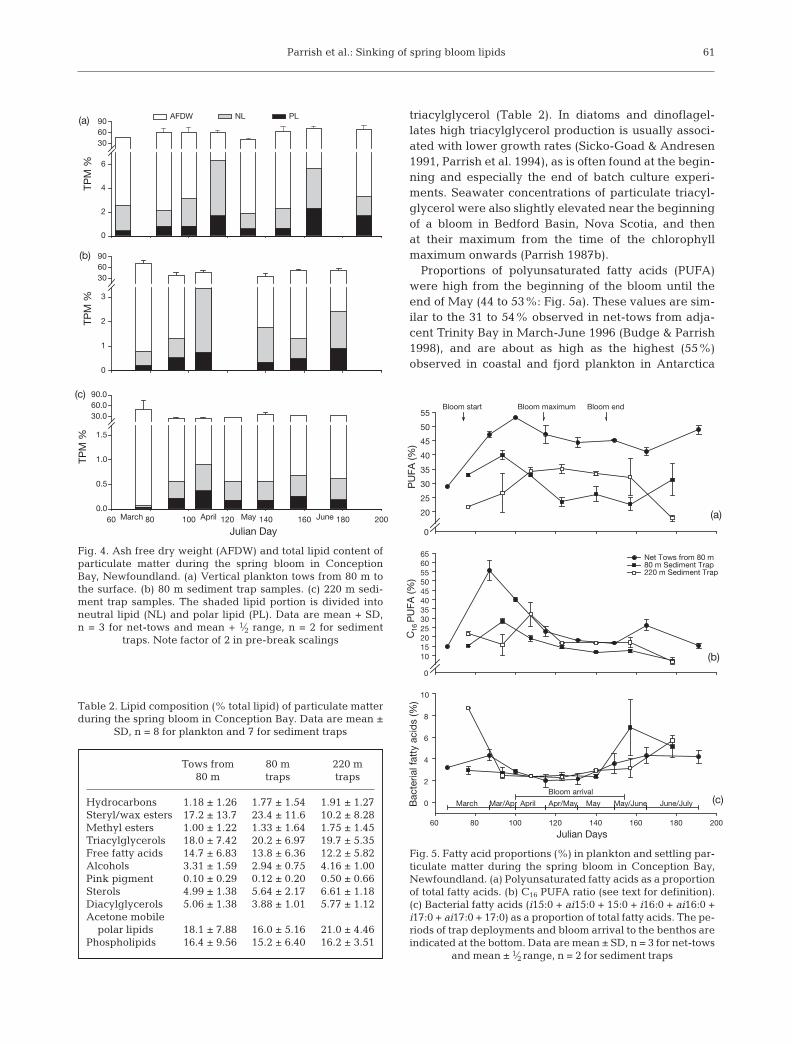
Total lipid concentrations in plankton were on aver-age, 3.4 ± 1.7% of dry weight (Table 1) and weregreater (p = 0.040) at the height of the bloom in April,reaching a maximum of 6.3 ± 2.5% dry weight(Fig. 4a). There is evidence of another increase inlipids during the small bloom in mid-June on JulianDay 165. In both cases, increases in neutral lipidsaccounted for most of the increase. Neutral lipids werealso slightly elevated at the beginning of the samplingperiod. The major neutral lipid class in plankton was
60
Dep
th (m
)
0
20
40
60
80
100
120
140
160
180
200
220
240
0.5 1.0 2.0 4.0 6.0
(a)
Dep
th (m
)
0
20
40
60
80
100
120
140
160
180
200
220
240 (b)
(c)
(d)30 Mar 29 Apr 29 May 28 Jun30 Mar 29 Apr 29 May 28 Jun
0.5
1.0
2.0
6.0
2.0 1.0
0.50.5
4.02.0 0.4
0.6
0.8
0.8
1.01.0
0.6 1.2
2.5
5.0
5.010.0
10.015.0
20.0 20.0
2.0
4.0
4.0
6.0
6.0
8.0
8.0
10.08.0 8.0
06 Mar 06 Mar
Fig. 3. Fluorescence and nutrient contours. (a) Data from the SeaTech fluorometer arecontoured in relative fluorescence units. (b) Nitrate + nitrite (µM). (c) Phosphate (µM).
(d) Silicate (µM). Arrows indicate dates of casts
Table 1. Composition of particulate matter during the springbloom in Conception Bay. Overall average proportions (%).Data are mean ± SD, n = 6 to 8. Sediment trap data are fromunpoisoned traps. POM: particulate organic matter (ash freedry weight); TPM: total particulate matter (dry weight); TL:total lipid (sum of Iatroscan determined lipid classes); Neutrallipids: hydrocarbons, wax and steryl esters, ketones, triacyl-glycerols, free fatty acids; (FFA), alcohols (ALC), sterols, dia-cylglycerols; Polar lipids: monoacylglycerols, acetone-mobilepolar lipids, phospholipids; LI: lipolysis index [(FFA + ALC)(acyl lipids + ALC)–1]; HI: hydrolysis index [(FFA + ALC)
(neutral acyl lipids + ALC)–1]
Tows from 80 m 220 m 80 m traps traps
POM/TPM 58.6 ± 9.49 49.9 ± 12.77 32.7 ± 8.12TL/TPM 3.41 ± 1.67 1.83 ± 0.93 0.57 ± 0.25TL/POM 5.75 ± 2.36 0.39 ± 0.21 0.20 ± 0.10Neutral/TL 65.5 ± 10.32 70.3 ± 7.97 62.8 ± 6.91Polar/TL 34.5 ± 10.32 29.8 ± 7.97 37.2 ± 6.91LI 19.4 ± 6.73 17.6 ± 6.04 18.1 ± 5.20HI 31.9 ± 13.44 26.9 ± 9.21 30.7 ± 8.57
Parrish et al.: Sinking of spring bloom lipids
triacylglycerol (Table 2). In diatoms and dinoflagel-lates high triacylglycerol production is usually associ-ated with lower growth rates (Sicko-Goad & Andresen1991, Parrish et al. 1994), as is often found at the begin-ning and especially the end of batch culture experi-ments. Seawater concentrations of particulate triacyl-glycerol were also slightly elevated near the beginningof a bloom in Bedford Basin, Nova Scotia, and thenat their maximum from the time of the chlorophyllmaximum onwards (Parrish 1987b).
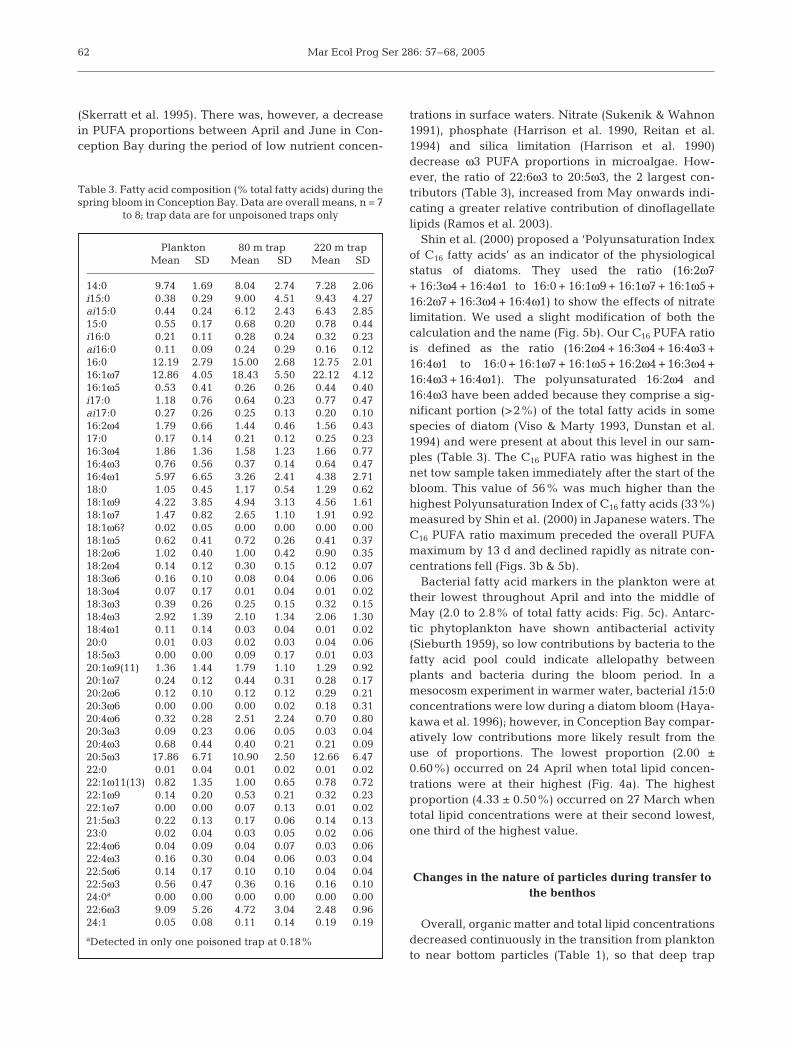
Proportions of polyunsaturated fatty acids (PUFA)were high from the beginning of the bloom until theend of May (44 to 53%: Fig. 5a). These values are sim-ilar to the 31 to 54% observed in net-tows from adja-cent Trinity Bay in March-June 1996 (Budge & Parrish1998), and are about as high as the highest (55%)observed in coastal and fjord plankton in Antarctica
61
TPM
%
0
2
4
6
306090(a)
TPM
%
0
1
2
3
306090
AFDW NL PL
(b)
Julian Day60 80 100 120 140 160 180 200
TPM
%
0.0
0.5
1.0
1.5
30.060.090.0(c)
March April May June
Fig. 4. Ash free dry weight (AFDW) and total lipid content ofparticulate matter during the spring bloom in ConceptionBay, Newfoundland. (a) Vertical plankton tows from 80 m tothe surface. (b) 80 m sediment trap samples. (c) 220 m sedi-ment trap samples. The shaded lipid portion is divided intoneutral lipid (NL) and polar lipid (PL). Data are mean + SD,n = 3 for net-tows and mean + 1⁄2 range, n = 2 for sediment
traps. Note factor of 2 in pre-break scalings
Table 2. Lipid composition (% total lipid) of particulate matterduring the spring bloom in Conception Bay. Data are mean ±
SD, n = 8 for plankton and 7 for sediment traps
Tows from 80 m 220 m 80 m traps traps
Hydrocarbons 1.18 ± 1.26 1.77 ± 1.54 1.91 ± 1.27Steryl/wax esters 17.2 ± 13.7 23.4 ± 11.6 10.2 ± 8.28Methyl esters 1.00 ± 1.22 1.33 ± 1.64 1.75 ± 1.45Triacylglycerols 18.0 ± 7.42 20.2 ± 6.97 19.7 ± 5.35Free fatty acids 14.7 ± 6.83 13.8 ± 6.36 12.2 ± 5.82Alcohols 3.31 ± 1.59 2.94 ± 0.75 4.16 ± 1.00Pink pigment 0.10 ± 0.29 0.12 ± 0.20 0.50 ± 0.66Sterols 4.99 ± 1.38 5.64 ± 2.17 6.61 ± 1.18Diacylglycerols 5.06 ± 1.38 3.88 ± 1.01 5.77 ± 1.12Acetone mobile
polar lipids 18.1 ± 7.88 16.0 ± 5.16 21.0 ± 4.46Phospholipids 16.4 ± 9.56 15.2 ± 6.40 16.2 ± 3.51
PU
FA (%
)
0
20
25
30
35
40
45
50
55
Net Tows from 80 m80 m Sediment Trap220 m Sediment Trap
C16
PU
FA (%
)
0
101520253035404550556065
Julian Days60 80 100 120 140 160 180 200
Bac
teria
l fat
ty a
cid
s (%
)
0
2
4
6
8
10
Bloom arrival
March Mar/Apr April Apr/May May May/June June/July
Bloom start Bloom maximum Bloom end
(a)
(b)
(c)
Fig. 5. Fatty acid proportions (%) in plankton and settling par-ticulate matter during the spring bloom in Conception Bay,Newfoundland. (a) Polyunsaturated fatty acids as a proportionof total fatty acids. (b) C16 PUFA ratio (see text for definition).(c) Bacterial fatty acids (i15:0 + ai15:0 + 15:0 + i16:0 + ai16:0 +i17:0 + ai17:0 + 17:0) as a proportion of total fatty acids. The pe-riods of trap deployments and bloom arrival to the benthos areindicated at the bottom. Data are mean ± SD, n = 3 for net-tows
and mean ± 1⁄2 range, n = 2 for sediment traps
Mar Ecol Prog Ser 286: 57–68, 2005
(Skerratt et al. 1995). There was, however, a decreasein PUFA proportions between April and June in Con-ception Bay during the period of low nutrient concen-
trations in surface waters. Nitrate (Sukenik & Wahnon1991), phosphate (Harrison et al. 1990, Reitan et al.1994) and silica limitation (Harrison et al. 1990)decrease ω3 PUFA proportions in microalgae. How-ever, the ratio of 22:6ω3 to 20:5ω3, the 2 largest con-tributors (Table 3), increased from May onwards indi-cating a greater relative contribution of dinoflagellatelipids (Ramos et al. 2003).
Shin et al. (2000) proposed a ‘Polyunsaturation Indexof C16 fatty acids’ as an indicator of the physiologicalstatus of diatoms. They used the ratio (16:2ω7+ 16:3ω4 + 16:4ω1 to 16:0 + 16:1ω9 + 16:1ω7 + 16:1ω5 +16:2ω7 + 16:3ω4 + 16:4ω1) to show the effects of nitratelimitation. We used a slight modification of both thecalculation and the name (Fig. 5b). Our C16 PUFA ratiois defined as the ratio (16:2ω4 + 16:3ω4 + 16:4ω3 +16:4ω1 to 16:0 + 16:1ω7 + 16:1ω5 + 16:2ω4 + 16:3ω4 +16:4ω3 + 16:4ω1). The polyunsaturated 16:2ω4 and16:4ω3 have been added because they comprise a sig-nificant portion (>2%) of the total fatty acids in somespecies of diatom (Viso & Marty 1993, Dunstan et al.1994) and were present at about this level in our sam-ples (Table 3). The C16 PUFA ratio was highest in thenet tow sample taken immediately after the start of thebloom. This value of 56% was much higher than thehighest Polyunsaturation Index of C16 fatty acids (33%)measured by Shin et al. (2000) in Japanese waters. TheC16 PUFA ratio maximum preceded the overall PUFAmaximum by 13 d and declined rapidly as nitrate con-centrations fell (Figs. 3b & 5b).
Bacterial fatty acid markers in the plankton were attheir lowest throughout April and into the middle ofMay (2.0 to 2.8% of total fatty acids: Fig. 5c). Antarc-tic phytoplankton have shown antibacterial activity(Sieburth 1959), so low contributions by bacteria to thefatty acid pool could indicate allelopathy betweenplants and bacteria during the bloom period. In amesocosm experiment in warmer water, bacterial i15:0concentrations were low during a diatom bloom (Haya-kawa et al. 1996); however, in Conception Bay compar-atively low contributions more likely result from theuse of proportions. The lowest proportion (2.00 ±0.60%) occurred on 24 April when total lipid concen-trations were at their highest (Fig. 4a). The highestproportion (4.33 ± 0.50%) occurred on 27 March whentotal lipid concentrations were at their second lowest,one third of the highest value.
Changes in the nature of particles during transfer tothe benthos
Overall, organic matter and total lipid concentrationsdecreased continuously in the transition from planktonto near bottom particles (Table 1), so that deep trap
62
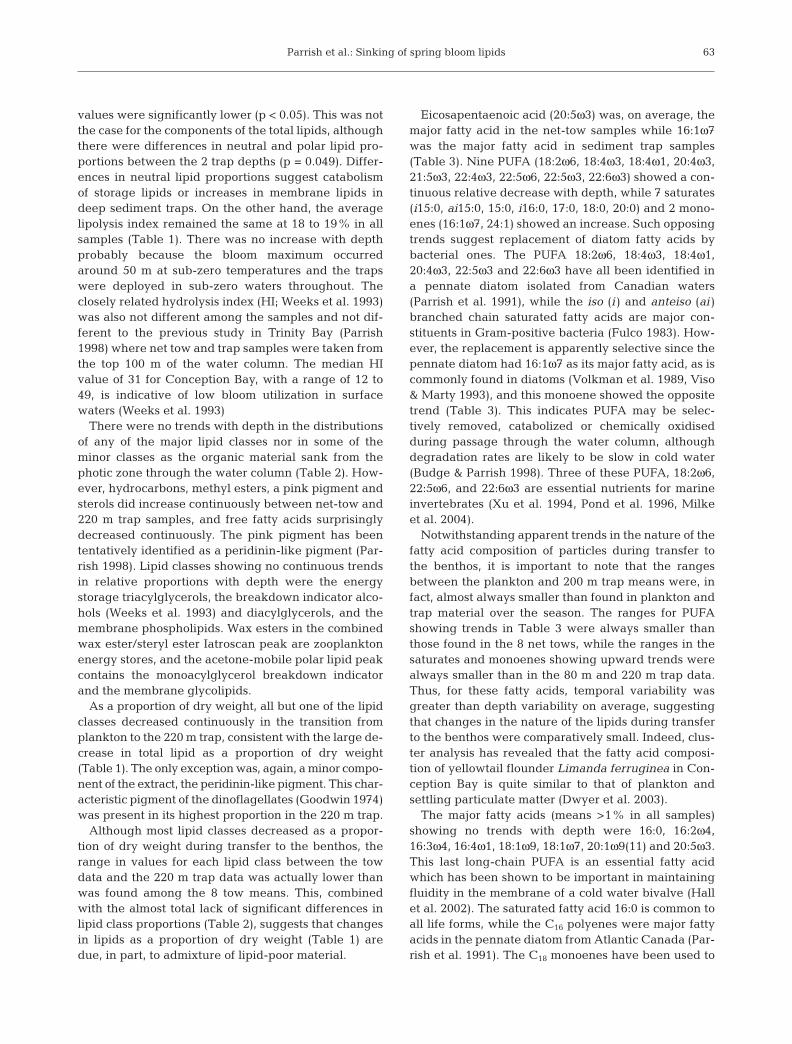
Table 3. Fatty acid composition (% total fatty acids) during thespring bloom in Conception Bay. Data are overall means, n = 7
to 8; trap data are for unpoisoned traps only
Plankton 80 m trap 220 m trapMean SD Mean SD Mean SD
14:0 9.74 1.69 8.04 2.74 7.28 2.06i15:0 0.38 0.29 9.00 4.51 9.43 4.27ai15:0 0.44 0.24 6.12 2.43 6.43 2.8515:0 0.55 0.17 0.68 0.20 0.78 0.44i16:0 0.21 0.11 0.28 0.24 0.32 0.23ai16:0 0.11 0.09 0.24 0.29 0.16 0.1216:0 12.19 2.79 15.00 2.68 12.75 2.0116:1ω7 12.86 4.05 18.43 5.50 22.12 4.1216:1ω5 0.53 0.41 0.26 0.26 0.44 0.40i17:0 1.18 0.76 0.64 0.23 0.77 0.47ai17:0 0.27 0.26 0.25 0.13 0.20 0.1016:2ω4 1.79 0.66 1.44 0.46 1.56 0.4317:0 0.17 0.14 0.21 0.12 0.25 0.2316:3ω4 1.86 1.36 1.58 1.23 1.66 0.7716:4ω3 0.76 0.56 0.37 0.14 0.64 0.4716:4ω1 5.97 6.65 3.26 2.41 4.38 2.7118:0 1.05 0.45 1.17 0.54 1.29 0.6218:1ω9 4.22 3.85 4.94 3.13 4.56 1.6118:1ω7 1.47 0.82 2.65 1.10 1.91 0.9218:1ω6? 0.02 0.05 0.00 0.00 0.00 0.0018:1ω5 0.62 0.41 0.72 0.26 0.41 0.3718:2ω6 1.02 0.40 1.00 0.42 0.90 0.3518:2ω4 0.14 0.12 0.30 0.15 0.12 0.0718:3ω6 0.16 0.10 0.08 0.04 0.06 0.0618:3ω4 0.07 0.17 0.01 0.04 0.01 0.0218:3ω3 0.39 0.26 0.25 0.15 0.32 0.1518:4ω3 2.92 1.39 2.10 1.34 2.06 1.3018:4ω1 0.11 0.14 0.03 0.04 0.01 0.0220:0 0.01 0.03 0.02 0.03 0.04 0.0618:5ω3 0.00 0.00 0.09 0.17 0.01 0.0320:1ω9(11) 1.36 1.44 1.79 1.10 1.29 0.9220:1ω7 0.24 0.12 0.44 0.31 0.28 0.1720:2ω6 0.12 0.10 0.12 0.12 0.29 0.2120:3ω6 0.00 0.00 0.00 0.02 0.18 0.3120:4ω6 0.32 0.28 2.51 2.24 0.70 0.8020:3ω3 0.09 0.23 0.06 0.05 0.03 0.0420:4ω3 0.68 0.44 0.40 0.21 0.21 0.0920:5ω3 17.86 6.71 10.90 2.50 12.66 6.4722:0 0.01 0.04 0.01 0.02 0.01 0.0222:1ω11(13) 0.82 1.35 1.00 0.65 0.78 0.7222:1ω9 0.14 0.20 0.53 0.21 0.32 0.2322:1ω7 0.00 0.00 0.07 0.13 0.01 0.0221:5ω3 0.22 0.13 0.17 0.06 0.14 0.1323:0 0.02 0.04 0.03 0.05 0.02 0.0622:4ω6 0.04 0.09 0.04 0.07 0.03 0.0622:4ω3 0.16 0.30 0.04 0.06 0.03 0.0422:5ω6 0.14 0.17 0.10 0.10 0.04 0.0422:5ω3 0.56 0.47 0.36 0.16 0.16 0.1024:0a 0.00 0.00 0.00 0.00 0.00 0.0022:6ω3 9.09 5.26 4.72 3.04 2.48 0.9624:1 0.05 0.08 0.11 0.14 0.19 0.19
aDetected in only one poisoned trap at 0.18%
Parrish et al.: Sinking of spring bloom lipids
values were significantly lower (p < 0.05). This was notthe case for the components of the total lipids, althoughthere were differences in neutral and polar lipid pro-portions between the 2 trap depths (p = 0.049). Differ-ences in neutral lipid proportions suggest catabolismof storage lipids or increases in membrane lipids indeep sediment traps. On the other hand, the averagelipolysis index remained the same at 18 to 19% in allsamples (Table 1). There was no increase with depthprobably because the bloom maximum occurredaround 50 m at sub-zero temperatures and the trapswere deployed in sub-zero waters throughout. Theclosely related hydrolysis index (HI; Weeks et al. 1993)was also not different among the samples and not dif-ferent to the previous study in Trinity Bay (Parrish1998) where net tow and trap samples were taken fromthe top 100 m of the water column. The median HIvalue of 31 for Conception Bay, with a range of 12 to49, is indicative of low bloom utilization in surfacewaters (Weeks et al. 1993)
There were no trends with depth in the distributionsof any of the major lipid classes nor in some of theminor classes as the organic material sank from thephotic zone through the water column (Table 2). How-ever, hydrocarbons, methyl esters, a pink pigment andsterols did increase continuously between net-tow and220 m trap samples, and free fatty acids surprisinglydecreased continuously. The pink pigment has beententatively identified as a peridinin-like pigment (Par-rish 1998). Lipid classes showing no continuous trendsin relative proportions with depth were the energystorage triacylglycerols, the breakdown indicator alco-hols (Weeks et al. 1993) and diacylglycerols, and themembrane phospholipids. Wax esters in the combinedwax ester/steryl ester Iatroscan peak are zooplanktonenergy stores, and the acetone-mobile polar lipid peakcontains the monoacylglycerol breakdown indicatorand the membrane glycolipids.
As a proportion of dry weight, all but one of the lipidclasses decreased continuously in the transition fromplankton to the 220 m trap, consistent with the large de-crease in total lipid as a proportion of dry weight(Table 1). The only exception was, again, a minor compo-nent of the extract, the peridinin-like pigment. This char-acteristic pigment of the dinoflagellates (Goodwin 1974)was present in its highest proportion in the 220 m trap.
Although most lipid classes decreased as a propor-tion of dry weight during transfer to the benthos, therange in values for each lipid class between the towdata and the 220 m trap data was actually lower thanwas found among the 8 tow means. This, combinedwith the almost total lack of significant differences inlipid class proportions (Table 2), suggests that changesin lipids as a proportion of dry weight (Table 1) aredue, in part, to admixture of lipid-poor material.
Eicosapentaenoic acid (20:5ω3) was, on average, themajor fatty acid in the net-tow samples while 16:1ω7was the major fatty acid in sediment trap samples(Table 3). Nine PUFA (18:2ω6, 18:4ω3, 18:4ω1, 20:4ω3,21:5ω3, 22:4ω3, 22:5ω6, 22:5ω3, 22:6ω3) showed a con-tinuous relative decrease with depth, while 7 saturates(i15:0, ai15:0, 15:0, i16:0, 17:0, 18:0, 20:0) and 2 mono-enes (16:1ω7, 24:1) showed an increase. Such opposingtrends suggest replacement of diatom fatty acids bybacterial ones. The PUFA 18:2ω6, 18:4ω3, 18:4ω1,20:4ω3, 22:5ω3 and 22:6ω3 have all been identified ina pennate diatom isolated from Canadian waters(Parrish et al. 1991), while the iso (i ) and anteiso (ai )branched chain saturated fatty acids are major con-stituents in Gram-positive bacteria (Fulco 1983). How-ever, the replacement is apparently selective since thepennate diatom had 16:1ω7 as its major fatty acid, as iscommonly found in diatoms (Volkman et al. 1989, Viso& Marty 1993), and this monoene showed the oppositetrend (Table 3). This indicates PUFA may be selec-tively removed, catabolized or chemically oxidisedduring passage through the water column, althoughdegradation rates are likely to be slow in cold water(Budge & Parrish 1998). Three of these PUFA, 18:2ω6,22:5ω6, and 22:6ω3 are essential nutrients for marineinvertebrates (Xu et al. 1994, Pond et al. 1996, Milkeet al. 2004).
Notwithstanding apparent trends in the nature of thefatty acid composition of particles during transfer tothe benthos, it is important to note that the rangesbetween the plankton and 200 m trap means were, infact, almost always smaller than found in plankton andtrap material over the season. The ranges for PUFAshowing trends in Table 3 were always smaller thanthose found in the 8 net tows, while the ranges in thesaturates and monoenes showing upward trends werealways smaller than in the 80 m and 220 m trap data.Thus, for these fatty acids, temporal variability wasgreater than depth variability on average, suggestingthat changes in the nature of the lipids during transferto the benthos were comparatively small. Indeed, clus-ter analysis has revealed that the fatty acid composi-tion of yellowtail flounder Limanda ferruginea in Con-ception Bay is quite similar to that of plankton andsettling particulate matter (Dwyer et al. 2003).
The major fatty acids (means >1% in all samples)showing no trends with depth were 16:0, 16:2ω4,16:3ω4, 16:4ω1, 18:1ω9, 18:1ω7, 20:1ω9(11) and 20:5ω3.This last long-chain PUFA is an essential fatty acidwhich has been shown to be important in maintainingfluidity in the membrane of a cold water bivalve (Hallet al. 2002). The saturated fatty acid 16:0 is common toall life forms, while the C16 polyenes were major fattyacids in the pennate diatom from Atlantic Canada (Par-rish et al. 1991). The C18 monoenes have been used to
63
Mar Ecol Prog Ser 286: 57–68, 2005
indicate feeding behaviour in cold water benthos(Graeve et al. 1997), and the monoene 20:1ω9 (in thecombined 20:1ω9 + 20:1ω11 GC peak) is prominent incold water herbivorous copepods (Albers et al. 1996).Sometimes 20:1ω9 and 20:1ω11 were separately identi-fiable with an average ω9/ω11 ratio of ~2 in net-towlipids and 10 in sediment trap lipids. Likewise, on 2occasions the other long-chain monoenes 22:1ω11 and22:1ω13 were separately identifiable in sediment traplipids with ω11/ω13 ratios of 3 and 5. Among the minorfatty acids 3 multiple branched fatty acids were tenta-tively identified in some samples at proportionsbetween 0.1 and 0.8% each in net-tows and between0.1 and 1.1% each in sediment traps. These were4,8,12-trimethyltetradecanoic acid and pristanic andphytanic acids, all believed to be derived from thephytol side-chain of chlorophyll (Ackman et al. 1966,Ackman 1986).
Fluxes of particulate matter
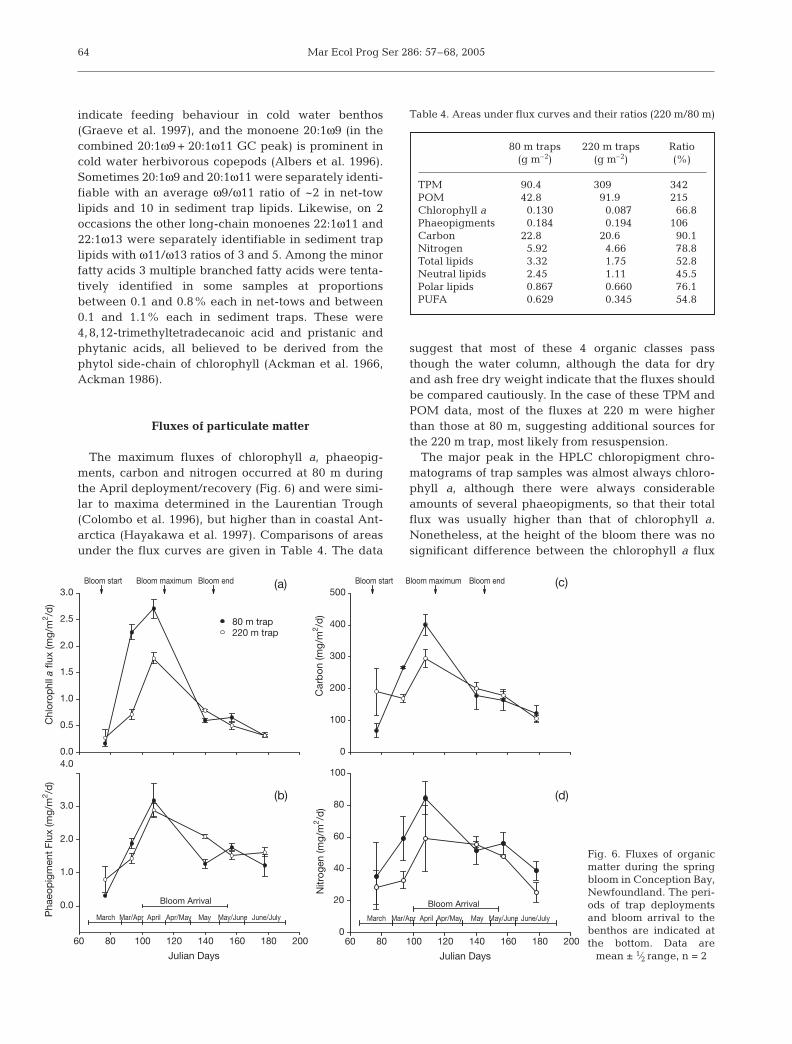
The maximum fluxes of chlorophyll a, phaeopig-ments, carbon and nitrogen occurred at 80 m duringthe April deployment/recovery (Fig. 6) and were simi-lar to maxima determined in the Laurentian Trough(Colombo et al. 1996), but higher than in coastal Ant-arctica (Hayakawa et al. 1997). Comparisons of areasunder the flux curves are given in Table 4. The data
suggest that most of these 4 organic classes passthough the water column, although the data for dryand ash free dry weight indicate that the fluxes shouldbe compared cautiously. In the case of these TPM andPOM data, most of the fluxes at 220 m were higherthan those at 80 m, suggesting additional sources forthe 220 m trap, most likely from resuspension.
The major peak in the HPLC chloropigment chro-matograms of trap samples was almost always chloro-phyll a, although there were always considerableamounts of several phaeopigments, so that their totalflux was usually higher than that of chlorophyll a.Nonetheless, at the height of the bloom there was nosignificant difference between the chlorophyll a flux
64 C
hlor
ophl
l a fl
ux (m
g/m
2 /d)
0.0
0.5
1.0
1.5
2.0
2.5
3.0
80 m trap220 m trap
Julian Days
60 80 100 120 140 160 180 200
Pha
eop
igm
ent
Flux
(mg/
m2 /d
)
0.0
1.0
2.0
3.0
4.0
March Mar/Apr April Apr/May May May/June June/July
Bloom Arrival
Bloom start Bloom maximum Bloom end
Car
bon
(mg/
m2 /d
)
0
100
200
300
400
500Bloom start Bloom maximum Bloom end
Julian Days
60 80 100 120 140 160 180 200
Nitr
ogen
(mg/
m2 /d
)
0
20
40
60
80
100
Bloom Arrival
March Mar/Apr April Apr/May May May/June June/July
(a)
(b)
(c)
(d)
Fig. 6. Fluxes of organicmatter during the springbloom in Conception Bay,Newfoundland. The peri-ods of trap deploymentsand bloom arrival to thebenthos are indicated atthe bottom. Data are
mean ± 1⁄2 range, n = 2
Table 4. Areas under flux curves and their ratios (220 m/80 m)
80 m traps 220 m traps Ratio(g m–2) (g m–2) (%)
TPM 90.4 309 342POM 42.8 91.9 215Chlorophyll a 0.130 0.087 66.8Phaeopigments 0.184 0.194 106Carbon 22.8 20.6 90.1Nitrogen 5.92 4.66 78.8Total lipids 3.32 1.75 52.8Neutral lipids 2.45 1.11 45.5Polar lipids 0.867 0.660 76.1PUFA 0.629 0.345 54.8
Parrish et al.: Sinking of spring bloom lipids
and the phaeopigment flux at 80 m (Fig. 6a,b). Overthe bloom period, 67% of the undegraded chlorophylla passing through 80 m reached 220 m (Table 4) pre-sumably in intact phytoplankton cells and chains. Theproportion was higher for phaeopigments, suggestingtransport in fast sinking faecal pellets or additionalchlorophyll breakdown in transit.
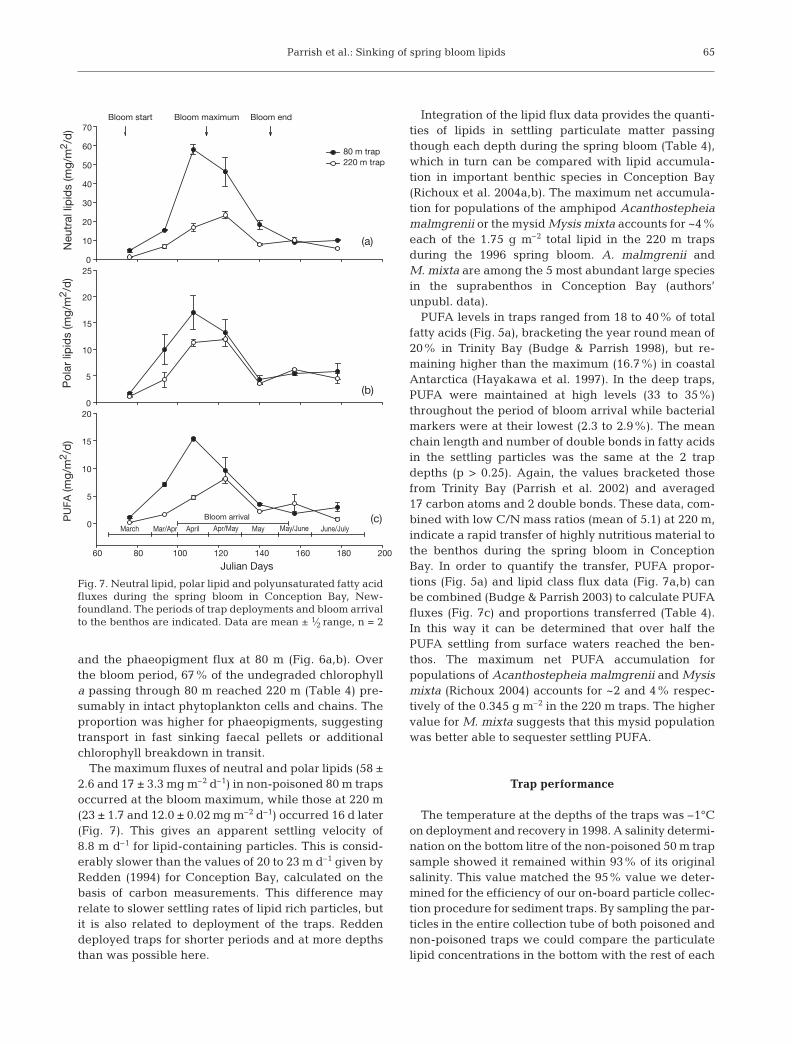
The maximum fluxes of neutral and polar lipids (58 ±2.6 and 17 ± 3.3 mg m–2 d–1) in non-poisoned 80 m trapsoccurred at the bloom maximum, while those at 220 m(23 ± 1.7 and 12.0 ± 0.02 mg m–2 d–1) occurred 16 d later(Fig. 7). This gives an apparent settling velocity of8.8 m d–1 for lipid-containing particles. This is consid-erably slower than the values of 20 to 23 m d–1 given byRedden (1994) for Conception Bay, calculated on thebasis of carbon measurements. This difference mayrelate to slower settling rates of lipid rich particles, butit is also related to deployment of the traps. Reddendeployed traps for shorter periods and at more depthsthan was possible here.
Integration of the lipid flux data provides the quanti-ties of lipids in settling particulate matter passingthough each depth during the spring bloom (Table 4),which in turn can be compared with lipid accumula-tion in important benthic species in Conception Bay(Richoux et al. 2004a,b). The maximum net accumula-tion for populations of the amphipod Acanthostepheiamalmgrenii or the mysid Mysis mixta accounts for ~4%each of the 1.75 g m–2 total lipid in the 220 m trapsduring the 1996 spring bloom. A. malmgrenii andM. mixta are among the 5 most abundant large speciesin the suprabenthos in Conception Bay (authors’unpubl. data).
PUFA levels in traps ranged from 18 to 40% of totalfatty acids (Fig. 5a), bracketing the year round mean of20% in Trinity Bay (Budge & Parrish 1998), but re-maining higher than the maximum (16.7%) in coastalAntarctica (Hayakawa et al. 1997). In the deep traps,PUFA were maintained at high levels (33 to 35%)throughout the period of bloom arrival while bacterialmarkers were at their lowest (2.3 to 2.9%). The meanchain length and number of double bonds in fatty acidsin the settling particles was the same at the 2 trapdepths (p > 0.25). Again, the values bracketed thosefrom Trinity Bay (Parrish et al. 2002) and averaged17 carbon atoms and 2 double bonds. These data, com-bined with low C/N mass ratios (mean of 5.1) at 220 m,indicate a rapid transfer of highly nutritious material tothe benthos during the spring bloom in ConceptionBay. In order to quantify the transfer, PUFA propor-tions (Fig. 5a) and lipid class flux data (Fig. 7a,b) canbe combined (Budge & Parrish 2003) to calculate PUFAfluxes (Fig. 7c) and proportions transferred (Table 4).In this way it can be determined that over half thePUFA settling from surface waters reached the ben-thos. The maximum net PUFA accumulation forpopulations of Acanthostepheia malmgrenii and Mysismixta (Richoux 2004) accounts for ~2 and 4% respec-tively of the 0.345 g m–2 in the 220 m traps. The highervalue for M. mixta suggests that this mysid populationwas better able to sequester settling PUFA.
Trap performance
The temperature at the depths of the traps was –1°Con deployment and recovery in 1998. A salinity determi-nation on the bottom litre of the non-poisoned 50 m trapsample showed it remained within 93% of its originalsalinity. This value matched the 95% value we deter-mined for the efficiency of our on-board particle collec-tion procedure for sediment traps. By sampling the par-ticles in the entire collection tube of both poisoned andnon-poisoned traps we could compare the particulatelipid concentrations in the bottom with the rest of each
65
Julian Days60 80 100 120 140 160 180 200
PU
FA (m
g/m
2 /d
)
0
5
10
15
20
Bloom start Bloom maximum Bloom end
Neu
tral
lip
ids
(mg/
m2 /
d)
0
10
20
30
40
50
60
70
80 m trap 220 m trap
Pol
ar li
pid
s (m
g/m
2 /d
)
0
5
10
15
20
25
Bloom arrival
March Mar/Apr April Apr/May May May/June June/July
(a)
(b)
(c)
Fig. 7. Neutral lipid, polar lipid and polyunsaturated fatty acidfluxes during the spring bloom in Conception Bay, New-foundland. The periods of trap deployments and bloom arrivalto the benthos are indicated. Data are mean ± 1⁄2 range, n = 2

Mar Ecol Prog Ser 286: 57–68, 2005
trap (Fig. 8). Almost all the particulate lipids in the col-lection tube were found in the bottom litre, the part of thetube that we would normally sample.
At the top of the trap, both dissolved and particulatelipid concentrations were similar to those found out-side the trap, except for dissolved total lipids in thenon-poisoned trap, which appear to be greater (Fig. 8,inset). At the bottom of the trap these concentrationsare clearly greater and a statistical analysis of theentire sediment trap array revealed that concentra-tions of dissolved lipids were indeed significantlyhigher (p = 0.018) in non-poisoned than in poisonedtrap bottom layers. By considering the sum of the dis-
solved and particulate lipids in the trap bottom (Fig. 9)it can be seen that particulate lipids represent asmaller proportion of the total in the non-poisonedtraps. For the entire sediment trap array, particulatelipids accounted for 86 ± 7% of the total in non-poisoned traps, which was significantly less (p = 0.016)than the 95 ± 4% of the total in poisoned traps. The evi-dence that poisoning is important in the reduction ofbacterially mediated dissolution during long-termdeployments is supported by the fact that proportionsof bacterial fatty acid markers in filtrates were 7 timeshigher in the bottom layer of non-poisoned traps. How-ever, as expected for low solubility compounds, theratio of dissolved to particulate lipids was much lowerthan in short-term deployments (Parrish 1998).
While poisoning reduced lipid dissolution by 9%,this advantage may be outweighed by the consider-able increase in variability in particulate lipid values(Figs. 8 & 9). This greater variability, together with thegreater lipid content in poisoned traps, also occurredthroughout the 1996 sampling season, both at 80 andat 220 m (Ramos et al. 2003). The large and variablewax ester/steryl ester content in poisoned traps (Fig. 9)indicates one reason for this. We observed many moreswimmers (mainly copepods) in poisoned samples andare unlikely to have been able to remove all animals,or parts thereof, from all samples.
CONCLUSIONS
The 1996 Conception Bay spring bloom started inmid-March at 0°C in the top 40 m of the water column.The C16 PUFA ratio reached a very high maximum of56% in plankton 12 d later, thereafter this indicator ofnutrient sufficient diatoms declined rapidly as surfacenitrate concentrations decreased by 90%. Forty daysafter the bloom started, deep water nutrient concentra-tions peaked and N:P ratios indicated regenerationfrom nitrogen depleted particles.
Total PUFA proportions reached a maximum in theplankton 25 d after the start of the bloom, and total andneutral lipid concentrations peaked 15 d later whenthe chlorophyll maximum had sunk to 50 m. Samplesof settling particulate matter were collected using un-poisoned sediment traps, which may underestimatelipid fluxes by ~14% due to dissolution in the trap. Inaddition, there was evidence of admixture of lipid poormaterial near the bottom of Conception Bay from con-centrations in 80 and 220 m traps and from integratedflux comparisons at each depth.
There were small changes in the average lipid classand fatty acid composition among the plankton andsettling particle samples, suggesting some selectiveremoval of PUFA between their synthesis in the photic
66
μg/l Total lipid0 10000 20000 30000 40000 50000
Insi
de
Trap
Particulate non-poisonedDissolved poisonedParticulate poisonedDissolved non-poisonedSeawater particulateSeawater dissolved
1st litre
2nd litre
3rd litre
4th litre
0 50 100 150 200 250 300 350
1st l
2nd l
Outside
Fig. 8. Dissolved and particulate lipid concentrations withinentire sediment traps set at 50 m for 15 d in April 1998. Filledsymbols represent particulate samples; open symbols repre-sent dissolved samples. Non-poisoned samples are repre-sented by triangles, poisoned samples by squares. Samplestaken outside the trap on the day of recovery are represented
by circles. Data for the bottom litre are mean ± 1⁄2 range
Am
ount
in tr
ap b
otto
m (μ
g)
0500
10000
15000
20000
25000
ParticulateDissolved
Am
ount
in tr
ap b
otto
m (μ
g)
0500
1500
2000
2500
3000
3500
4000
Non-poisoned
Non-poisonedPoisoned Poisoned
Total lipids Wax ester/steryl ester
Fig. 9. Dissolved and particulate lipid content in the bottomof 50 m sediment traps following a 15 d deployment inApril 1998. Total lipid and wax/steryl ester data are mean+ 1⁄2 range for dissolved lipids and mean – 1⁄2 range for parti-
culate lipids
Parrish et al.: Sinking of spring bloom lipids
zone and arrival at the benthos. There was little offsetin the timing of maximum lipid concentrations amongthe net-tow, 80 and 220 m trap samples, indicating arapid transfer. Overall, half of the total lipids, neutrallipids and PUFA passing through 80 m reached 220 m,and the lipid and PUFA supply were more than 10times that required by important amphipod and mysidpopulations in Conception Bay. This efficient flow ofenergy and essential nutrients remains to be comparedwith lipid requirements of other large abundantspecies in the depositional zone.
Acknowledgements. This work was funded by an NSERCCollaborative Project Grant. We thank J. Wells, M. Riehl, E.Hatfield and P. Warren for technical assistance.
LITERATURE CITED
Ackman RG (1986) WCOT (capillary) gas-liquid chromatog-raphy. In: Hamilton RJ, Rossell JB (eds) Analysis of oilsand fats. Elsevier, New York, p 137–206
Ackman RG, Sipos JC, Tocher CS (1966) Some linear, iso,anteiso, and multiple-branched fatty acids of marine ori-gin: analyses on packed and open-tubular gas-liquid chro-matographic columns with particular reference to pris-tanic and phytanic acids. J Fish Res Board Can 24:635–650
Albers CS, Kattner G, Hagen W (1996) The compositions ofwax esters, triacylglycerols and phospholipids in Arcticand Antarctic copepods: evidence of energetic adapta-tions. Mar Chem 55:347–358
Andreassen IJ, Wassmann P (1998) Vertical flux of phyto-plankton and particulate biogenic matter in the marginalice zone of the Barents Sea in May 1993. Mar Ecol ProgSer 170:1–14
Asper VL, Deuser WG, Knauer GA, Lohrenz SE (1992) Rapidcoupling of sinking particle fluxes between surface anddeep ocean waters. Nature 357:670–672
Budge SM, Parrish CC (1998) Lipid biogeochemistry of plank-ton, settling matter and sediments in Trinity Bay, New-foundland. II. Fatty acids. Org Geochem 29:1547–1559
Budge SM, Parrish CC (2003) FA determination in cold watermarine samples. Lipids 38:781–791
Choe N, Deibel D, Thompson RJ (2003) Seasonal variation inthe biochemical composition of the chaetognath Para-sagitta elegans from the hyperbenthic zone of ConceptionBay, Newfoundland. Mar Ecol Prog Ser 251:191–200
Colombo JC, Silverberg N, Gearing JN (1996b) Biogeochem-istry of organic matter in the Laurentian Trough, I. Com-position and vertical fluxes of rapidly settling particles.Mar Chem 51:277–293
Dunstan GA, Volkman JK, Barrett SM, Leroi JM, Jeffrey SW(1994) Essential polyunsaturated fatty acids from 14species of diatom (Bacillariophyceae). Phytochemistry 35:155–161
Dwyer KS, Parrish CC, Brown JA (2003) Lipid composition ofyellowtail flounder (Limanda ferruginea) in relation todietary lipid intake. Mar Biol 143:659–667
Fulco AJ (1983) Fatty acid metabolism in bacteria. Prog LipidRes 22:133–160
Goñi MA, Yunker MB, Macdonald RW, Eglinton TI (2000)Distribution and sources of organic biomarkers in arcticsediments from the Mackenzie River and Beaufort Shelf.Mar Chem 71:23–51
Goodwin TW (1974) Carotenoids and biliproteins. In: StewartWDP (ed) Algal physiology and biochemistry. Universityof California Press, Berkeley, p 176–205
Graeve M, Kattner G, Piepenburg D (1997) Lipids in Arcticbenthos: does the fatty acid and alcohol compositionreflect feeding and trophic interactions? Polar Biol 18:53–61
Graf G (1992) Benthic-pelagic coupling: a benthic view.Oceanogr Mar Biol Annu Rev 30:149–190
Hall JM, Parrish CC, Thompson RJ (2002) Eicosapentaenoicacid regulates scallop (Placopecten magellanicus) mem-brane fluidity in response to cold. Biol Bull 202:201–203
Harrison PJ, Thompson PA, Calderwood GS (1990) Effects ofnutrient and light limitation on the biochemical composi-tion of phytoplankton. J Appl Phycol 2:45–56
Hayakawa K, Handa N, Kawanobe K, Wong CS (1996) Fac-tors controlling the temporal variation of fatty acids in par-ticulate matter during a phytoplankton bloom in a marinemesocosm. Mar Chem 52:233–244
Hayakawa K, Handa N, Fukuchi M (1997) Changes in thefatty acid composition of sinking particles during a phyto-plankton bloom in the Austral summer in Breid Bay,Antarctica. Proc NIPR Symp Polar Biol 10:39–49
Hedges JI, Keil RG (1995) Sedimentary organic matter preser-vation: an assessment and speculative synthesis. MarChem 49:81–115
Henderson RJ, Hegseth EN, Park MT (1998) Seasonal varia-tion in lipid and fatty acid composition of ice algae fromthe Barents Sea. Polar Biol 20:48–55
Kortzinger A, Schulz-Bull DE, Petrick G, Duinker JC (1994)Evidence for dissolution of fatty acids in sediment traps:Impact on flux estimates. J Geophys Res 99:3407–3415
Lee C, Hedges JI, Wakeham SG, Zhu N (1992) Effectivenessof various treatments in retarding microbial activity insediment trap material and their effects on the collectionof swimmers. Limnol Oceanogr 37:117–130
Milke LM, Bricelj VM, Parrish CC (2004) Growth of postlarvalsea scallops, Placopecten magellanicus, on microalgaldiets, with emphasis on the nutritional role of lipids andfatty acids. Aquaculture 234:293–317
Parrish CC (1987a) Separation of aquatic lipid classes byChromarod thin-layer chromatography with measurementby Iatroscan flame ionization detection. Can J Fish AquatSci 44:722–731
Parrish CC (1987b) Time series of particulate and dissolvedlipid classes during spring phytoplankton blooms in Bed-ford Basin, a marine inlet. Mar Ecol Prog Ser 35:129–139
Parrish CC (1998) Lipid biogeochemistry of plankton, settlingmatter and sediments in Trinity Bay, Newfoundland. I.Lipid classes. Org Geochem 29:1531–1545
Parrish CC (1999) Determination of total lipid, lipid classes,and fatty acids in aquatic samples. In: Arts MT, WainmanBC (eds) Lipids in freshwater ecosystems. Springer-Verlag, New York, p 4–20
Parrish CC, deFreitas ASW, Bodennec G, Macpherson EJ,Ackman RG (1991) Lipid composition of the toxic marinediatom, Nitzschia pungens. Phytochemistry 30:113–116
Parrish CC, Bodennec G, Gentien P (1994) Time courses ofintracellular and extracellular lipid classes in batch cul-tures of the toxic dinoflagellate, Gymnodinium cf.nagasakiense. Mar Chem 48:71–82
Parrish CC, Abrajano TA, Budge SM, Favaro YL, Helleur RJ,Hudson E, Pulchan K (2002) The marine environment:past and present inputs to Trinity Bay. In: Ommer RE (ed)The resilient outport: ecology, economy and society inrural Newfoundland. ISER Books, St. John’s, Newfound-land, p 40–72
67

Mar Ecol Prog Ser 286: 57–68, 2005
Pomeroy LR, Wiebe WJ, Deibel D, Thompson RJ, Rowe GT,Pakulski JD (1991) Bacterial responses to temperature andsubstrate concentration during the Newfoundland springbloom. Mar Ecol Prog Ser 75:143–159
Pond D, Harris R, Head R, Harbour D (1996) Environmentaland nutritional factors determining seasonal variability inthe fecundity and egg viability of Calanus helgolandicusin coastal waters off Plymouth, UK. Mar Ecol Prog Ser 143:45–63
Ramos CS, Parrish CC, Quibuyen TAO, Abrajano TA (2003)Molecular and carbon isotopic variations in lipids inrapidly settling particles during a spring phytoplanktonbloom. Org Geochem 34:195–207
Redden AM (1994) Grazer-mediated chloropigment degrada-tion and the vertical flux of spring bloom production inConception Bay, Newfoundland. PhD thesis, MemorialUniversity of Newfoundland
Reitan KI, Rainuzzo JR, Olsen Y (1994) Effect of nutrient limi-tation on fatty acid and lipid content of marine microalgae.J Phycol 30:972–979
Richoux NB (2004) Population dynamics and seasonal lipidcycles in hyperbenthic crustaceans from a cold-ocean en-vironment (Conception Bay, Newfoundland): Mysis mixta(Mysidacea) and Acanthostepheia malmgreni (Amphi-poda). PhD thesis, Memorial University of Newfoundland
Richoux NB, Thompson RJ, Deibel D, Parrish CC (2004a) Sea-sonal and developmental variation in the lipids of Acan-thostepheia malmgreni (Amphipoda) from the hyper-benthos of a cold water environment (Conception Bay,Newfoundland). J Mar Biol Assoc UK 184:1189–1197
Richoux NB, Deibel D, Thompson RJ, Parrish CC (2004b) Sea-sonal changes in the lipids of Mysis mixta (Mysidacea)from the hyperbenthos of a cold water environment (Con-ception Bay, Newfoundland). Can J Fish Aquat Sci 61:1940–1953
Shin KH, Hama T, Yoshie N, Noriki S, Tsunogai S (2000)Dynamics of fatty acids in newly biosynthesized phyto-plankton cells and seston during a spring bloom off the westcoast of Hokkaido Island, Japan. Mar Chem 70:243–256
Sicko-Goad L, Andresen, NA (1991) Effect of growth andlight/dark cycles on diatom lipid content and composition.J Phycol 27:710–718
Sieburth JMcN (1959) Antibacterial activity of Antarcticmarine phytoplankton. Limnol Oceanogr 4:419–424
Skerratt JH, Nichols PD, McMeekin TA, Burton H (1995) Sea-sonal and inter-annual changes in planktonic biomass andcommunity structure in eastern Antarctica using signaturelipids. Mar Chem 51:93–113
Smetacek VS (1985) Role of sinking in diatom life-historycycles: ecological, evolutionary and geological signifi-cance. Mar Biol 84:239–251
Stead RA, Thompson RJ (2003) The effect of the sinkingspring diatom bloom on digestive processes of the cold-water protobranch Yoldia hyperborea. Limnol Oceanogr48:157–167
Sukenik A, Wahnon R (1991) Biochemical quality of marineunicellular algae with special emphasis on lipid composi-tion. I. Isochrysis galbana. Aquaculture 97:61–72
Tian RC, Deibel D, Thompson RJ, Rivkin RB (2003) Modelingof climate forcing on a cold-ocean ecosystem, ConceptionBay, Newfoundland. Mar Ecol Prog Ser 262:1–17
Tyler PA (1995) Conditions for the existence of life at thedeep-sea floor: an update. Oceanogr Mar Biol Annu Rev33:221–244
Viso AC, Marty JC (1993) Fatty acids from 28 marine micro-algae. Phytochemistry 34:1521–1533
Volkman JK, Jeffrey SW, Nichols PD, Rogers GI, Garland CD(1989) Fatty acid and lipid composition of 10 species ofmicroalgae used in mariculture. J Exp Mar Biol Ecol 128:219–240
Weeks A, Conte MH, Harris RP, Bedo A and 10 others (1993)The physical and chemical environment and changes incommunity structure associated with bloom evolution: theJoint Global Flux Study North Atlantic Bloom Experiment.Deep-Sea Res II 40:347–368
Xu XL, Ji WJ, Castell JD, O’Dor RK (1994) Essential fatty acidrequirement of the Chinese prawn, Penaeus chinensis.Aquaculture 127:29–40
68
Editorial responsibility: Otto Kinne (Editor-in-Chief), Oldendorf/Luhe, Germany
Submitted: March 8, 2004; Accepted: August 31, 2004Proofs received from author(s): January 11, 2005

Parrish et al.: Sinking of spring bloom lipids 69
Related Documents