This article appeared in a journal published by Elsevier. The attached copy is furnished to the author for internal non-commercial research and education use, including for instruction at the authors institution and sharing with colleagues. Other uses, including reproduction and distribution, or selling or licensing copies, or posting to personal, institutional or third party websites are prohibited. In most cases authors are permitted to post their version of the article (e.g. in Word or Tex form) to their personal website or institutional repository. Authors requiring further information regarding Elsevier’s archiving and manuscript policies are encouraged to visit: http://www.elsevier.com/copyright

Welcome message from author
This document is posted to help you gain knowledge. Please leave a comment to let me know what you think about it! Share it to your friends and learn new things together.
Transcript

This article appeared in a journal published by Elsevier. The attachedcopy is furnished to the author for internal non-commercial researchand education use, including for instruction at the authors institution
and sharing with colleagues.
Other uses, including reproduction and distribution, or selling orlicensing copies, or posting to personal, institutional or third party
websites are prohibited.
In most cases authors are permitted to post their version of thearticle (e.g. in Word or Tex form) to their personal website orinstitutional repository. Authors requiring further information
regarding Elsevier’s archiving and manuscript policies areencouraged to visit:
http://www.elsevier.com/copyright

Author's personal copy
Linking spatial patterns of soil organic carbon to topography — A case study fromsouth-eastern Spain
Wolfgang Schwanghart a,⁎, Thomas Jarmer b,c
a Physical Geography and Environmental Change, Department of Environmental Sciences, University of Basel, Klingelbergstr. 27, 4056 Basel, Switzerlandb Transportation & GeoInformation Engineering Unit, Faculty of Civil & Environmental Engineering, Technion, Israel Institute of Technology, Haifa 32000, Israelc Institute for Geoinformatics and Remote Sensing, University of Osnabrueck, Barbarastrasse 22b, 49076 Osnabrueck, Germany
a b s t r a c ta r t i c l e i n f o
Article history:Received 28 September 2009Received in revised form 12 November 2010Accepted 18 November 2010Available online 25 November 2010
Keywords:Soil organic carbonSpatial predictionSemi-arid regionsHyperspectral remote sensingDigital terrain analysisTerrain classification
A key uncertainty in our understanding of the global carbon cycle is the lateral movement of carbon throughthe terrestrial system. Soils are the major storage of carbon in the terrestrial biosphere and the inventory ofsoil organic carbon (SOC) is required for greenhouse gas inventories and carbon mitigation projects. The aimof this study is to characterize spatial patterns of the concentrations of topsoil total organic carbon (TOC) in asemi-arid Mediterranean area in south-eastern Spain and to assess their relationship to topography.We adopta remote sensing based approach for the spectral determination and quantification of TOC with a completecoverage of bare soil surfaces. Digital terrain analysis and geostatistical techniques are applied to analyze thespatial patterns of TOC at different spatial scales. We show that accumulation of topsoil SOC is dependent ontopographic position at the landscape scale with highest values found in valley bottoms. At the hill-slopescale, differences among terrain classes exist regarding the topographic controls on SOC. While positivecorrelation between the topographic wetness index (TWI) and TOC can be observed on steep slopes, thatcorrelation is not significant on wide pediments. Small scale spatial variability is large on ridges, steep slopesand valley bottoms, while SOC distribution on pediments is relatively homogeneous. These differences aremost likely governed by the presence of vegetation patches and variable runoff and sediment transport ratesamong the terrain classes. The successful application of hyperspectral remote sensing for the spatialestimation of SOC concentrations suggests that it is a promising technique to advance SOC inventories insemi-arid and arid regions.
© 2010 Elsevier B.V. All rights reserved.
1. Introduction
A key uncertainty in our understanding of the global carbon cycleis the lateral movement of carbon through the terrestrial system(Stallard, 1998; Kuhn et al., 2009). Soils account for the largest pool ofactively cycling carbon in terrestrial ecosystems (WBGU, 1998;Jobbágy and Jackson, 2000; Janzen, 2004, and the inventory of soilorganic matter (SOM) and the assessment of processes involving itstransport are required for greenhouse gas inventories and carbonmitigation projects (Ravindranath and Ostwald, 2008). The uncer-tainties concerning the spatial variability of SOM can largely beattributed to two factors – (1) the multitude and complexity ofprocesses affecting the spatial distribution of SOM (Smith et al., 2001)and (2) the difficulties in monitoring and spatially assessing SOM insoils (Harper and Gilkes, 2001; Kimble et al., 2001; Goidts et al., 2009).
SOM is amixtureof recognizable plant and animal parts andmaterialthat has beenaltered to the degree that it no longer possesses its original
structural organization (Oades, 1989; Amundson, 2001). Soil organiccarbon (SOC) is the main element present in SOM (48–60 wt.%) and isused as measurable basis for SOM estimation (Rossell et al., 2001). SOCenrichment in soils is primarily governed by net primary production ofplants that enters soil upon senescence.Heterotrophic respiration bysoilmicroorganisms and fire return a large amount of SOC back to theatmosphere. At the same time, erosion and transport of soil derivedmaterial redistribute SOC laterally (Kimble et al., 2001; Smith et al.,2001; Quinton et al., 2006; Yoo et al., 2006; Alewell et al., 2009).
Lateral redistribution of SOC leads to SOC accumulation and burialat depositional sites (Burke et al., 1999; Belnap et al., 2005; Van Oostet al., 2007). The enrichment of SOC in the upper soil profile exerts apositive feedback mechanism on soil structure, water infiltration andnutrient availability, thus promoting plant growth and litter fall. SOCis particularly important in semi-arid areas since it sustains soilfertility, increases soil moisture storage and mitigates droughts(Tiessen et al., 1994). Erosional sites in contrast face SOC depletionand are placed under increased nutrient strain (Moorman et al., 2004;Quinton et al., 2010).
Earth surface is the template onwhich nutrient fluxes occur and itsshape has been proposed as indicator for the processes governing the
Geomorphology 126 (2011) 252–263
⁎ Corresponding author. Tel.: +41 61 26 70737; fax: +41 61 26 70740.E-mail address: [email protected] (W. Schwanghart).
0169-555X/$ – see front matter © 2010 Elsevier B.V. All rights reserved.doi:10.1016/j.geomorph.2010.11.008
Contents lists available at ScienceDirect
Geomorphology
j ourna l homepage: www.e lsev ie r.com/ locate /geomorph

Author's personal copy
lateral distribution of SOC (Glatzel and Sommer, 2005; Yoo et al.,2006; Berhe et al., 2008; Hoffmann et al., 2009). Thus, digital terrainanalysis has been successfully used to explain spatial patterns of SOCdepletion or accumulation in temperate regions (Moorman et al.,2004). In arid and semi-arid areas, however, episodic rainfall events,highly variable infiltration rates and vegetation patches producespatially discontinuous runoff patterns, generating erosional anddepositional features independently of topography e.g. slope position(Cammeraat, 2002; Yair and Raz-Yassif, 2004). Thus, it is questionableif SOC storage patterns and their observed dependence on topo-graphic parameters (Moorman et al., 2004; Yoo et al., 2006; Berheet al., 2008) can be transferred to arid and semi-arid areas.
Soils are essential to ecosystems, human life and society and, thus,there is growing interest in soil degradation monitoring, particular inquantifying SOC stocks (Morvan et al., 2008;Goidts et al., 2009). Yet, theinventory andmonitoring of SOC are challenging owing to its variabilityin three spatial dimensions and time, making region-wide spatialpredictions challenging (Webster and Oliver, 2001; Cammeraat, 2002).As such,monitoring techniques are required that generate reliable, area-wide data of SOC distribution.
A relatively new technique to measure SOC is the application ofhyperspectral remote sensing. Typically soil reflectance decreases withincreasing SOC in the wavelength range 0.4–2.5 μm (Baumgardneret al., 1985) and differentmodelling techniques are used to predict SOCfrom continuous reflectance spectra or derivatives (Ben-Dor and Banin,1994, 1995; Reeves et al., 2002; Udelhoven et al., 2003; vanWaes et al.,2005; Brown et al., 2006; Viscarra Rossel et al., 2006). The transfer ofprediction models to airborne or satellite remote sensing data hasonly rarely been conducted (Hill and Schütt, 2000; Gomez et al.,2008; Jarmer et al., 2010), although the approach has promise to obtainarea-wide estimates of SOC distribution and support regional carboninventories.
The aim of this study is to characterize spatial patterns of thetopsoil (the uppermost layer of soil, ~2 cm depth) SOC concentrationsin a semi-arid Mediterranean area in south-eastern Spain. We adoptand assess a remote sensing approach for the spectral determinationof SOC of unvegetated soils. We then analyze the spatial patterns ofSOC concentrations and their relation to topography using digitalterrain analysis, explorative data analysis and geostatistical techni-ques. The patterns found are subsequently discussed in the context ofthe dominant hydrological and geomorphological process domain ofthe study area.
2. Study site
The study site (37.80–37.85°N, 1.81–1.86°W) is located in south-eastern Spain in the upper watershed of the Rio Guadalentin (Fig. 1).Mean annual rainfall in the lowlands of the Guadalentin basin totals270 mm a−1 with a potential evapotranspiration of 880 mm a−1
(Navarro-Hervás, 1991; Cerdà, 1997). Three quarters of rainfall eventsare less than 4 mm and storm cells have limited extent. Hence, rainfallevents usually generate runoff locally depending on areal distributionof infiltration and crusting properties and hardly reach the slope base(Puigdefabregas et al., 1998, 1999; Ruiz-Sinoga et al., 2010). Inaddition, in-channel sediments cause transmission losses and furtherreduce hydrological connectivity (Kirkby et al., 2005). Severe flood-ings originate from large rainfalls in relatively small areas (b10 km2)with high hydrological connectivity owing to active channel incisionand strong flow convergence (Kirkby et al., 2005).
The area is situated in the Subbetic zone of the Betic Cordillera andis characterized by rolling hills and wide pediments intermitted bymountainous terrain such as the ‘Cigarrones’ or the ‘Sierra del Pinoso’in the south (Fig. 1). Bedrock is dominated by Eocene to Miocenelimestone (ridges) and Cenomanian to Micoene marly strata, oftencovered with Quaternary slope and alluvial deposits (lower slopesections and valley bottoms). Wide pediments are attached to the
rounded limestone hills. Following the FAO classification scheme, soilsare mainly Lithosols and Calcaric Regosols. Soils under cultivationvary in thickness from 10 cm on convex slopes to N1 m in valley floors,and are characterized by low organic matter contents, low aggregatestability and high stone content (Cammeraat and Imeson, 1998; Quineet al., 1999; van Wesemael et al., 2000).
Landuse is dominated by rainfed cultivation of cereals and tree crops(almonds and olives). Almond plantations have been expanded ontosteeper slopes since 1970, facilitated by increasing mechanisation andsupported by subsidies from the European Common Agricultural Policy(van Wesemael et al., 2000). Water supply to trees is achieved byremoval of all potentially competing ground vegetation thus makingsoils susceptible to water and wind erosion (Garcá-Ruiz, 2010). Tillageerosion provoked by stronger mechanisation leads to high rates of soiltranslocation (Quine et al., 1999; vanWesemael et al., 2006). Traditionalsoil and water conservation structures such as terraces and check damswere often removed to enlarge field size or are left to degrade (Bellinet al., 2009).
Unfarmed areas mostly consist of tussock grassland and openshrubland, with Stipa tenacissima and Rosmarinus officinalis asdominant species. Pine forests (Pinus halepensis) with dense under-growth of various bushes and grasses are mainly found at higheraltitudes and north-exposed hillsides. Their occurrence on upperslopes mainly results from massive reforestation programmes duringthe 2nd half of the last century.
3. Methods
In the following text SOC refers to the substance while TOC (= totalorganic carbon) is used as quantitative variable that describes the SOCconcentration in wt.% in the topsoil.
3.1. Field sampling and chemical analysis
Soil sampling was performed during dry weather conditions inSeptember 2003. In order to assess the spatial variability of TOC in thetopsoil 61 samples were taken along sampling transects (Fig. 7). Ateach sample position, an integrative sample was taken from the upper2 cm of the soil profile representing an area of about 1 m2. Thesampling transects were arranged so that north- and south-facingridges and valley bottoms were crossed.
After air-drying in the laboratory, soil samples were gentlycrushed in order to pass a 2 mm-sieve and carefully homogenized.TOC was measured using furnace ramping between 200 °C and 600 °Cwith a Leco-RC 412 analyzer. The precision of the measurements isspecified to 1.5% of the detected amount, with a detection limit of0.02% (Hill and Schütt, 2000).
3.2. Reflectance measurements
The bi-directional reflectance measurements of the soil sampleswere acquired in the laboratory with an ASD FieldSpec-II spectro-radiometer (Analytical Spectral Devices). Spectral readings weretaken at 1 nm steps between 350 and 2500 nm using a reflectancestandard of known reflectivity (Spectralon©). The optical head of thespectroradiometer was mounted on a tripod in nadir position with adistance of 10 cm to the sample. A 1000 W quartz-halogen lamp wasset in a distance of 30 cm and an illumination angle of 30° was used toilluminate reference panel and samples.
Absolute bi-directional reflectance spectra were calculated bymultiplication of raw reflectance spectra by the certified reflectivity ofthe Spectralon panel. Subsequently, spectra were resampled toHyMap spectral resolution using linear interpolation.
253W. Schwanghart, T. Jarmer / Geomorphology 126 (2011) 252–263

Author's personal copy
3.3. Pre-processing of HyMap data
Hyperspectral image data were acquired by a HyMap airborneimaging sensor on June 29th, 2000. The sensor recorded spectra in thewavelength range from 0.42 to 2.48 μm in 126 spectral bands with aground resolution at nadir of approximately 6 m. Two parallel stripeswere recorded and geo-rectified using the parametric geocodingapproach implemented by the PARGE software package (Schläpferand Richter, 2002). In total 47 ground control points were collected byGPS measurements in the field to geocode the images. Positionalaccuracy of individual pixel centers in the resulting data sets wasestimated to be within about 7 m in easting and northing for bothimages. Subsequently, the images were resampled to a cell size of 6 mandmerged to produce one single image of larger coverage for furtheranalysis.
AtCPro radiative transfer code was employed for the radiometriccorrection of the HyMap data (Hill and Sturm, 1991; Hill et al., 1995).The approach is based on the radiative transfer formulation by Tanréet al. (1990) and provides corrections for atmospheric absorption,scattering and pixel adjacency effects. Atmospheric extinctionprocesses in the reflective optical domain were treated as a functionof sensor and terrain altitude, and absorbing atmospheric gases wererepresented according to MODTRAN (Berk et al., 1999) gaseoustransmittance data.
Noisy bands of the HyMap data (e.g., those near the main watervapor absorption features at 1.4 and 1.9 μm) were discarded and theremaining 110 spectral bands were used for further analysis. Spectralunmixing analysis (e.g. Adams et al., 1989; Roberts et al., 1993) wasused to determine fractions of vegetation, crop residuals and soil.Based on these results a soil mask was generated by determination ofa threshold value (less than 10% vegetation and crop residuals intotal) to include only baresoil in the further analysis.
3.4. Statistical analysis and model assessment
Partial least-square (PLS) regression was used to examinecorrelations between TOC and laboratory reflectance spectra of soil
samples at HyMap spectral resolution. PLS is a technique in structuralequation modeling that combines features from principal componentanalysis and multiple regression (Haenlein and Kaplan, 2004). PLSperforms particularly well in situations when the number of indicatorvariables becomes large compared to the number of samples (Chinand Newsted, 1999) by employing latent variables and weightrelations.
ParLeS v2.0 (Viscarra Rossel, 2008) was used to calculate the PLSregression. The maximum of latent exogenous variables used in PLSregression was limited to ten. Cross-validation of PLS models wasperformed according to the ‘leave-one-out-method’. The coefficient ofdetermination of the cross-validation and the root mean squarederror (RMSE) were calculated to assess the prediction accuracy. Theoptimum number of latent variables used for the regression wasdetermined by comparing the RMSE of predictions obtained frommodels with different numbers of latent variables.
The resulting PLS model was applied to HyMap data to allowspatial prediction of TOC. To assess accuracy of the spatiallydistributed estimates, TOC obtained from the image data werecompared to TOC of soil samples taken in the field. This comparisonis affected by both the difference in spatial averaging by the HyMappixels (36 m2 pixel size) and our sampling scheme (integrativesamples of 1 m2), and positional accuracy, yet it provides a means ofobtaining a rough measure of prediction accuracy.
3.5. Terrain analysis
The digital elevation model (DEM) used was derived fromdigitizing elevation points and contours of topographic maps(1:25,000) and interpolation using the TopoToRaster algorithm(Hutchinson, 1989) in ArcGIS 9.3.1. We chose TopoToRaster since itproduces smooth DEMs with continuous flow paths. The resultingDEM has 10×10 m cell size and the grid with predicted TOC wasresampled from 6 to 10 m with linear interpolation to facilitatecombined grid operations.
To assess the spatial covariance of TOC and topography at thelandscape scale, we used a terrain classification approach to delineate,
Fig. 1. Location of the study site and panchromatic band of Landsat 7 (acquisition date: 8. August, 2000, path: 199, row: 34, downloaded from ftp://ftp.glcf.umiacs.umd.edu/glcf/Landsat) draped over digital elvation model (three times height exaggeration). The white box refers to the extent of HyMap-imagery used in this study (extent: E–W 4 km, S–N5.8 km).
254 W. Schwanghart, T. Jarmer / Geomorphology 126 (2011) 252–263

Author's personal copy
non-overlapping geomorphological and hydrological process domains(MacMillan and Shary, 2009; Goidts et al., 2009). Seven primary andsecondary topographic attributes were calculated from the DEM andincluded in an unsupervised terrain classification: gradient (β),upslope area (A, based on multiple flow direction d∞; (Moore et al.,1993), topographic wetness index (TWI=ln(A/tan β); Beven andKirkby, 1979), profile and planform curvature, slope length anddistance from streams (D, euclidean distance to nearest stream pixel).
TWI was originally developed to predict zones of surfacesaturation but is also used as a local estimate of the capacity toaccumulate runoff (Puigdefabregas et al., 1998; van Wesemael et al.,2003; Cantón et al., 2004). A threshold of A=0.1 km2 was found to bea good indication for stream initiation as indicated by the topographicmaps, yet we cannot exclude flow concentrations below thisthreshold owing to the relatively coarse grid resolution and scale ofthe map. DEM cells identified as streams were excluded from theanalysis. Further, we manipulated the distance from stream raster sothat it contains only maximum values of 50 m (D=min(D,50). Allterrain attributes and statistical analyses were calculated usingTopoToolbox version 1.05 (Schwanghart and Kuhn, 2010).
We used K-means clustering as unsupervised classificationprocedure (Burrough et al., 2000). Since all variables should haveequal weight in the classification procedure, we computed thestandard scores for each variable prior to classification. To determinethe optimal number of terrain classes, a Q-mode principal componentanalysis (Davis, 1986) was calculated. Since five components explain99.4% of the inter-object variability (Fig. 2), we computed the K-means clustering with five cluster centroids. Subsequently, thederived terrain classes were mapped and smoothed with a 3×3majority filter to obtain spatially coherent terrain classes.
Terraces on slopes and check dams in channels are foundthroughout the study site and are likely to exert control onhydrological and geomorphological processes. The severity of thiscontrol, however, is difficult to assess since we found many of the soiland water conservations structures in bad condition or destroyedduring our field campaign (Bellin et al., 2009). In addition, theirtopography is not captured by the available DEM. Based on ouravailable HyMap data and Google Earth, terraces and check damswere visually identified and digitized. Subsequently, we masked thedownslope area of these features using the flow direction matrix ofthe DEM. Based on this mask, pixels of the TOC map were set to amissing value indicator. The following analysis is thus restricted to
areas in the study site that are not influenced by upslope located soiland water conservation structures.
3.6. Assessment of spatial variability of SOC concentrations
Exploratory data analysis techniques were applied to assess thespatial variability of TOC and its relation to terrain. We focused onidentifying patterns at different spatial scales. Landscape scalevariability was assessed by comparing it to TOC between differentterrain classes using boxplots. Spatial correlations of TOC withtopographic attributes within each terrain class were investigatedusing regression analysis and subsequently the variability at finerscales that superimposes observed trends in the terrain classes wasanalyzed using variograms on directed graphs (digraphs).
Spatial variability and autocorrelation are usually assessed usinggeostatistical methods that invoke the (semi-)variogram. The vario-gram provides a mathematical model to characterize dispersionprocesses (Matheron, 1963). The faint banded patterns of TOCindicated in our data suggest a dominant influence of advectiveprocesses following water flow paths on the relatively widepediments in the study site. Hence, in order to investigate the spatialvariability of TOC we reformulated the equation for calculating theexperimental variogram to explicitly address variability along thedominant drainage direction at every location.
Recently, geostatistical methods have been developed thatincorporate stream direction and distance (e.g. Ver Hoef et al., 2006;Skoien et al., 2006). We adapt the approach developed by Bailly et al.(2006) who calculate the variogram on digraphs of drainage networksusing following equation:
γ⁎ hð Þ = 12Nh
∑sα−sβ≃h
z sαð Þ−z sβ� �� �2 ð1Þ
where z(s) is the value of a variable at location s, Nh denotes thenumber of location pairs (sα, sβ) separated approximately by the lagh and such as sβ belongs to Γα which indicates the downstream set oflocations of α. This is a modification of the standard variogramequation: γ(h)=1/(2N)∑(zi−zi+h)2.
Herewe transferred this approach to flow patterns on gridded datasets. The calculation of values of the variogram on digraphsincorporates the single flow direction matrix M introduced bySchwanghart and Kuhn (2010). In graph theoretic terms M is theadjacencymatrix of the acyclic digraph that describes the connectivityof each pixel in the DEM to the next pixel along the steepestdownward gradient. The distance from each pixel to its downstreamlocated neighbor h is calculated by
h kð Þ = Mkd−d ð2Þ
where d is a column vector with the flow distance as calculated withthe function flow distance and k is a positive integer value.Exponentiating M with k identifies for each pixel the contributingpixels along a path length of k pixels. The differences z′ of the variablez between two location separated by k pixels are calculated by
z′ kð Þ = Mkz−z ð3Þ
Subsequently γ⁎(h) is obtained by binning the distances in h to hb
and aggregating values in z′ such that
γ⁎ hbð Þ = 12Nhb
z′ hbð ÞTz′ hbð Þ� �
ð4Þ
where z′(hb)T refers to the transpose of z′(hb). This procedure wasconducted with z containing the mapped TOC values and was
Fig. 2. Explained inter-object variability using a Q-mode principal component analysis.The sharp drop after five principal components (PC) suggests the extraction of fiveterrain classes in a subsequent, unsupervised K-means terrain classification.
255W. Schwanghart, T. Jarmer / Geomorphology 126 (2011) 252–263

Author's personal copy
repeated for increments of k so that values of γ⁎ were obtained for amaximum distance along flow paths of 200 m.
4. Results
Soil development in the study area is limited due to the lowaverage rainfall amount restricting vegetation growth and accumu-lation of organic matter. As a result soil samples are characterized byrelatively low TOC which are 0.67% on average (min: 0.24%; max:1.13%; std.-dev.: 0.25%).
TOC negatively correlates with spectral reflectance for the entirewavelength range investigated. The highest correlations are found forthe visible spectral domain between 0.5 and 0.7 μm. Correlationbetween TOC and spectral reflectance decreases with increasingwavelengths (Fig. 3). This is well in line with most other studies thatobserved a dominant influence of organic carbon in the visiblespectral domain (e.g. Krishnan et al., 1980; Konen et al., 2003; Willset al., 2007; Jarmer et al., 2010).
The PLS regression model fitted to the spectral reflectance dataexplains the variance of TOC in the topsoil samples very well(r2=0.878) and cross-validation indicates that the predictionsobtained from the model are very reliable (Fig. 4). The regressionline between TOC estimates and measured values has a slope of 0.982and is close to the 1:1-line with an insignificant offset of 0.012.
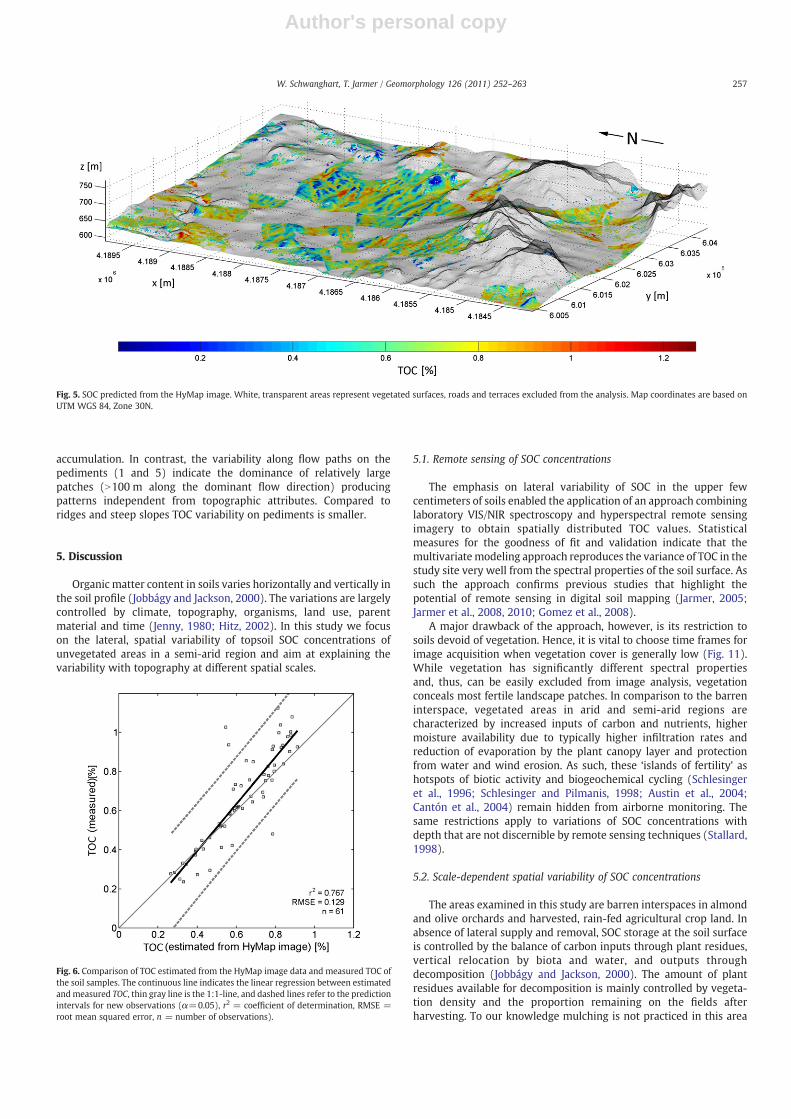
Bare soil surfaces account for 35.6% of the area covered by theaquired HyMap image. TOC estimates for these areas are obtained byapplying the PLS model to the spectral pixel vectors of the HyMapimage (Fig. 5). TOC estimates range between 0.02% and 1.27% and thusindicate that the field samples represent the full range of the spectralproperties present in the area.
The comparison of single pixel values with soil samples analyzedin the laboratory shows that samples with TOC N0.6% are under-estimated from the image data while samples with SOC concentra-tions lower than 0.4% are slightly overestimated (Fig. 6). This maypartly reflect up-scaling effects since soil samples were collected inthe field at an area of approximately 1 m2 while one HyMap pixelaverages out over 36 m2, and thus smooths spatial TOC maxima andminima.
Five terrain classes were obtained from K-means clustering ofterrain attributes (Fig. 7). Based on visual assessment of the spatialpatterns of the class values, terrain classes are interpreted to reflecthydrologically and geomorphologically relevant process regions.
Convex mid and lower slope sections (class 1) occupy the largestportion of the area. Class 2 represents steep upper slope sections thatoccur mainly in the southern and eastern parts of the study site andare most downslope located to ridges (class 3). Valley bottoms withvarying widths are indicated by class 4 and concave mid and lowerslope section are represented by class 5. In the following text, terrainclasses 1 and 5 are often subsumed by the term pediments.
Seven percent of the area covered by the HyMap image constitutebare soil surfaces that are not affected by upslope located check damsor terraces and the following analysis refers to this data (sample sizeN=16,778). The distribution of TOC within each terrain class isshown in Fig. 8b. The highest median TOC is found in the valleybottoms, followed by pediments where both convex and concaveareas have similar distributions of TOC. Lower values are found onsteep slopes and on ridges. Despite significant differences in the TOCmedians observed in the terrain classes (Fig. 8a) strong scatter can beobserved in all terrain classes.
In order to explain the within-terrain class variability theexplanatory power of several primary and secondary topographicattributes (slope, curvature, slope length, upslope area and TWI) wasinvestigated. Among all attributes TWI proved to best narrow thescatter in all terrain classes. Differences in the regression coefficientsand coefficients of determination, however, are observed among theclasses (Fig. 9). While TWI has some explanatory power in areasclassified as steep slope sections and valley bottom, it is a very weakindicator for the variability of TOC observed in remaining terrainclasses. Fig. 9 shows that high TOC values mainly occur on north- andeast-exposed slopes steeper than 5°. However, this effect appears lessstrong when restricting the analysis to steeper slope sections (notshown) suggesting that the control of exposition is relatively weak.
The spatial TOC estimates obtained from the HyMap image (Fig. 5)indicate the existence of banded patterns of SOC accumulation on thepediments classified as lower convex and concave slope sections. Inorder to analyze these patterns we calculated variograms for theregression residuals of the TOC estimates (Fig. 9) along flow pathsderived from the DEM. The variograms (Fig. 10) were calculatedseparately for each terrain class since we hypothesize differentpatterns in each terrain class. The results support our hypothesis sincethey indicate that the spatial variability along flow paths is high onridges (terrain class 3), steep slope sections (2) and valley bottoms (4)pointing at the existence of relatively small spatial patches of SOC
Fig. 3. Correlation spectrum for TOC and reflectance (values are only determined forHyMap bands (black dots) but discrete values were joined for interpretation ingraphical design).
Fig. 4. Cross-validation of TOC values predicted by the partial least squares regressionmodel. The bold black line displays the regression line (see equation in plot), and thegray line denotes the 1:1 line. Dashed lines indicate the 95% confidence intervals of theregression line. r2 = coefficient of determination of cross-validation, RMSE = rootmean squared error of cross-valdiation, n = number of observations.
256 W. Schwanghart, T. Jarmer / Geomorphology 126 (2011) 252–263
Author's personal copy
accumulation. In contrast, the variability along flow paths on thepediments (1 and 5) indicate the dominance of relatively largepatches (N100 m along the dominant flow direction) producingpatterns independent from topographic attributes. Compared toridges and steep slopes TOC variability on pediments is smaller.
5. Discussion
Organic matter content in soils varies horizontally and vertically inthe soil profile (Jobbágy and Jackson, 2000). The variations are largelycontrolled by climate, topography, organisms, land use, parentmaterial and time (Jenny, 1980; Hitz, 2002). In this study we focuson the lateral, spatial variability of topsoil SOC concentrations ofunvegetated areas in a semi-arid region and aim at explaining thevariability with topography at different spatial scales.
5.1. Remote sensing of SOC concentrations
The emphasis on lateral variability of SOC in the upper fewcentimeters of soils enabled the application of an approach combininglaboratory VIS/NIR spectroscopy and hyperspectral remote sensingimagery to obtain spatially distributed TOC values. Statisticalmeasures for the goodness of fit and validation indicate that themultivariatemodeling approach reproduces the variance of TOC in thestudy site very well from the spectral properties of the soil surface. Assuch the approach confirms previous studies that highlight thepotential of remote sensing in digital soil mapping (Jarmer, 2005;Jarmer et al., 2008, 2010; Gomez et al., 2008).
A major drawback of the approach, however, is its restriction tosoils devoid of vegetation. Hence, it is vital to choose time frames forimage acquisition when vegetation cover is generally low (Fig. 11).While vegetation has significantly different spectral propertiesand, thus, can be easily excluded from image analysis, vegetationconceals most fertile landscape patches. In comparison to the barreninterspace, vegetated areas in arid and semi-arid regions arecharacterized by increased inputs of carbon and nutrients, highermoisture availability due to typically higher infiltration rates andreduction of evaporation by the plant canopy layer and protectionfrom water and wind erosion. As such, these ‘islands of fertility’ ashotspots of biotic activity and biogeochemical cycling (Schlesingeret al., 1996; Schlesinger and Pilmanis, 1998; Austin et al., 2004;Cantón et al., 2004) remain hidden from airborne monitoring. Thesame restrictions apply to variations of SOC concentrations withdepth that are not discernible by remote sensing techniques (Stallard,1998).
5.2. Scale-dependent spatial variability of SOC concentrations
The areas examined in this study are barren interspaces in almondand olive orchards and harvested, rain-fed agricultural crop land. Inabsence of lateral supply and removal, SOC storage at the soil surfaceis controlled by the balance of carbon inputs through plant residues,vertical relocation by biota and water, and outputs throughdecomposition (Jobbágy and Jackson, 2000). The amount of plantresidues available for decomposition is mainly controlled by vegeta-tion density and the proportion remaining on the fields afterharvesting. To our knowledge mulching is not practiced in this area
Fig. 5. SOC predicted from the HyMap image. White, transparent areas represent vegetated surfaces, roads and terraces excluded from the analysis. Map coordinates are based onUTM WGS 84, Zone 30N.
Fig. 6. Comparison of TOC estimated from the HyMap image data and measured TOC ofthe soil samples. The continuous line indicates the linear regression between estimatedandmeasured TOC, thin gray line is the 1:1-line, and dashed lines refer to the predictionintervals for new observations (α=0.05), r2 = coefficient of determination, RMSE =root mean squared error, n = number of observations).
257W. Schwanghart, T. Jarmer / Geomorphology 126 (2011) 252–263

Author's personal copy
which contributes to SOC enrichment of the topsoil (García-Oreneset al., 2009).
Topography affects SOC storage in the topsoil by adding lateralcomponents to the aforementioned processes. First, topographyinfluences the water balance by facilitating lateral water exchangeby surface runoff, generating areas with favorablemoisture conditionsfor vegetation growth and thus plant litter accumulation (Belnapet al., 2005). In addition, surface runoff and runon directly affect thefrequency and amplitude of wet–dry cycles in the soil that largelydetermine SOC turnover (Austin et al., 2004). Second, soil materialdetached from rill and interrill erosion is transported by surface runoffand can laterally be relocated in the landscape (Burke et al., 1999;Belnap et al., 2005; Yoo et al., 2006; Martínez-Mena et al., 2008). Ourresults indicate that spatial patterns in SOC distribution exist, andpoint towards an influence of topography on the lateral distributionSOC at various scales. Yet, from our data we cannot directly attributethe findings to specific processes that accumulate or deplete SOC inthe topsoil. Instead, our results are discussed with respect to findingson hydrological and geomorphological processes obtained by otherstudies in this area.
At the landscape scale, the highest TOC in the topsoil are found inthe valley bottoms. Similar findings are reported both in humid andsemi-arid areas (Burke et al., 1999; Belnap et al., 2005). While waterlogging and associated decreased mineralization of SOC constitute theunderlying mechanisms promoting higher concentrations in concavesituations in humid areas (Stevenson, 1994), higher moistureavailability in concave situations in semi-arid areas due to theaccumulation of surface runoff and lower depth of the groundwatertable promotes plant growth and litter fall (Schlesinger and Pilmanis,1998; Cammeraat and Imeson, 1999; Bird et al., 2002; Cammeraat,2002;Martínez-Mena et al., 2002). This effect of landscape position onsoil moisture distribution has been shown to be particularlyimportant during themore humid seasons of the year (Puigdefabregaset al., 1998).
Fig. 7.Mapwith terrain classes obtained from K-means classification of primary and secondary topographic attributes. Detailed sections enable a visual comparison of the location ofterrain classes and spatial TOC variability.
Fig. 8. Landscape scale variability of SOC. a) Boxplots of TOC estimated from the HyMapdata groupedby terrain class (1: convexmid and lower slope sections, 2: steepupper slopesections, 3: ridges, 4: valley bottoms, 5: concave mid and lower slope section). Boxplotnotches denote comparison intervals. Two medians are significantly different at the 5%significance level if their intervals do not overlap. b) Sample size in each terrain class.
258 W. Schwanghart, T. Jarmer / Geomorphology 126 (2011) 252–263

Author's personal copy
In contrast, various studies provide evidence that topographyplays a marginal role in controlling surface runoff and soil watercontent in semi-arid areas. Since the major part of runoff occurs as
infiltration-excess overland flow (Martínez-Mena et al., 1998), it ishighly dependent on soil surface characteristics such as texture, stonecontent, surface crusts and lichen cover (Beven, 2002; Cantón et al.,
Fig. 9. Hillslope scale variability of SOC. Linear regression analysis suggest differential control of the topographic wetness index (TWI) on TOC in terrain classes 1–5 (1: convex midand lower hillslopes, 2: steep upper hillslope sections, 3: ridges, 4: valley bottom, 5: concave mid and lower hillslopes). The polar plot shows the distribution of TOC in all terrainclasses in relation to exposition of slopes steeper than 5°.
Fig. 10. Small scale variability of TOC described by variograms on digraphs of drainage patterns. Variograms are plotted separately for the terrain classes 1–5 (1: convex mid andlower hillslopes, 2: steep upper hillslope sections, 3: ridges, 4: valley bottom, 5. concave mid and lower hillslopes).
259W. Schwanghart, T. Jarmer / Geomorphology 126 (2011) 252–263

Author's personal copy
2004; Yair and Raz-Yassif, 2004; Buis and Veldkamp, 2008). Thespatial configuration of these factors often implies that downstreamareas may not benefit from runoff generated by low or mediumintensity rainfall events (Bracken and Kirkby, 2005; Kirkby et al.,2005).
Higher TOC at the valley bottoms can also be explained by thedominance of deep and fine textured soils in the valley bottom andwide concave areas (Poesen et al., 1997; van Wesemael et al., 2003).They contrast shallow soils with high rock contents on hillslopes andmay result from lithological differences between marls in the valleybottoms and limestone on ridges and steep upper slope sections. Inaddition, deeper and fine textured soils in the valley bottom are aresult of longterm downhill transport of fine textured soil material bysurface wash processes enforced by past landuse practices (Puigde-fabregas et al., 1998, 1999; Ruiz-Sinoga et al., 2010). Deeper soils inconcave areas (Boer et al., 1996) produce more stable moistureconditions than shallow soils (van Wesemael et al., 2000) and highcontents of clay and silt particles protect SOC against microbialdegradation (Hassink, 1997; Sanderman and Amundson, 2003).
At the hillslope scale our results show a significant correlationbetween TOC and specific topographic attributes in some terrain unitsonly. While TOC variance on ridges and pediments is hardly explainedby TWI (andother terrain indices such as slope and curvature), asignificant influence is observed on steep hillslope sections and thevalley bottom. Latter may be associated to the nearness to watercourses and related to favorable moisture conditions generated bygroundwater recharge by channel transmission losses (Kirkby et al.,2005). The positive relation of TWI and TOC on steep, upper hillslopesections is rather caused by the effect of larger upslope area than bylower gradient (gradient is uncorrelated to TOC in this terrain class)suggesting the accumulation of surface runoff as a dominant processin governing SOC accumulation in this terrain class. Since rates ofrill and interrill erosion are higher on steep slopes (Fox and Bryan,1999), downslope transport of fines and SOC by surface runoff may bean important process accumulating SOC at the foot of these slopesections and runon may increase local water availability and favorplant growth.
Topsoil TOC in planform concave and convex slope sections(pediments) shows only minor covariance with TWI. Visual compar-ison of drainage patterns and mapped TOC values suggests thatdrainage patterns largely coincide with elevated TOC values (Fig. 7),yet a quantitative comparison (Fig. 9) suggests that increasing TWIdoes not result in higher TOC values. The lack of correlation showsthat the landscape-scale model of how topography governs does notapply at smaller scales. Thismay be explained by the coverage of smalltopographic concavities by rock-fragment mulch that decreasing thedetectable amount of topsoil SOC in these areas. The high surface rockcontent is explained by the break-up of bedrock induced by tillage
leading to stony soils and spatial redistribution of rocks (vanWesemael et al., 2000). The large scatter around the regression linescan also result from the derivation of the DEM from topographiccontour data. Its relatively coarse resolution may lead to a deficientflow path representation in flat to slightly inclined terrain (Reuteret al., 2009).
Our results indicate a minor influence of slope exposition on TOCin the topsoil. In contrast, various studies highlight the importance ofaspect for soil moisture in semi-arid areas particularly during thewinter months when better moisture availability favors plant growthon north-exposed slopes (e.g. Calvo-Cases et al., 2003). Thus, theinfluence of slope aspect is mainly on the density of the vegetationcover that can be sustained, while it appears to have relatively littleimpact on the SOC concentrations of the bare soil patches between thevegetation.
In order to characterize small scale variability, spatial autocorre-lation of the residuals from the regression analysis (Fig. 9) wasassessed using variogram analysis on digraphs (Fig. 10). The resultssuggest that patches tend to be smallest on ridges, steep slopes andthe valley bottom while longer ranges (N100 m) of autocorrelationalong flow paths are observed on the pediments. The areas identifiedas ridges and steep slopes have relatively small extent and areintertwined by tussock grassland and shrubland. The variability invegetation cover in these terrain classes is generally higher than onthe pediments and valley bottoms (Fig. 11). Hence, we argue that thehigh spatial variability of vegetation cover on ridges and steep slopesis associated with a high variability of runoff generation at the smallscale owing to generation of preferential infiltration zones (Puigde-fabregas et al., 1999; Wilcox et al., 2003; Belnap et al., 2005). Thisleads to a low hydrological and sediment connectivity in these terrainclasses and generates small alternating patches of high and lowtopsoil TOC (Cammeraat and Imeson, 1999; Cammeraat, 2002;Bracken and Kirkby, 2005; Bracken and Croke, 2007).
Our data suggest that the spatial SOC distribution within convexand concave, mid to lower slope sections is characterized by largepatches. Yet, the variability along flow paths is much less compared tothe other terrain classes with relatively homogeneous conditions. Thehomogeneous conditions in the large undissected areas of thepediments are likely a result of generally low runoff and geomorpho-logical process rates and tillage (see below). Kirkby and Bull (2000)surmise that the pediments experience mainly depositional activityand Cerdà (1997) showed that infiltration rates are high and erosionalresponse to runoff events is very low in these areas. In addition,vegetation cover is extremely low compared to the unfarmed ridgesand steep slopes so that loci of biotic activity are largely missing(Schlesinger et al., 1996).
5.3. Processes and factors not covered by this study
In addition to the relation of topography and spatial patterns ofSOC at various scales highlighted here, there are various processes andfactors not covered in this study. Check dams and terraces areimportant, man-made features governing runoff and sedimentconnectivity (Bellin et al., 2009; Lesschen et al., 2009) but their effectwas not taken into account owing to their mostly degraded state andthus functioning. Tillage is commonly practiced in the study area andits effects on the translocation of soil particles were not taken intoaccount. Tillage can transport soil at rates highly dependent ontopography, and has a high geomorphological and pedologicalsignificance (Quine et al., 1999; Fister and Ries, 2009). The frequenttillage of the cultivated pediments may contribute to increasinglyhomogeneous topsoil conditions in the pediments.
We did not distinguish the effect of different vegetation types onthe distribution of SOC in the study area since data on theirdistribution were unavailable. The primary carbon source originatesfrom plants and, thus, vegetation type strongly affects the distribution
Fig. 11. Variability of vegetation cover (derived from spectral unmixing analysis) in theterrain classes (1: convex mid and lower hillslopes, 2: steep upper hillslope sections, 3:ridges, 4: valley bottom, 5. concave mid and lower hillslopes).
260 W. Schwanghart, T. Jarmer / Geomorphology 126 (2011) 252–263

Author's personal copy
of SOC in the topsoil since the wide variety of tissues showcharacteristic patterns of decomposition (Sanderman and Amundson,2003). For example, Almagro et al. (2010) recently observed lowerlitterfall inputs and higher litter decomposition rates in olive grovesthan in abandoned agricultural fields.
Past land use patterns must be taken into account to betterunderstand today's distribution of SOC. The study area experiencedvarious changes in land use practices owing to demographic growth,changes in market demand, expanding international markets and theEuropean Common Agricultural Policy and thus underwent differentforms of disturbances of the hydrological and geomorphologicalprocess regime (Garcá-Ruiz, 2010). Different land managementpractices strongly affect soil erodibility and water holding capacityin the study area, but their effect on SOC in the topsoil was shown tobe generally low during the investigation periods (14–16 months)(García-Orenes et al., 2009). On longer time scales, however, it wasshown by Martínez-Mena et al. (2002) and Martínez-Mena et al.(2008) that large SOC losses due to mineralization occur in the firstyears after vegetation removal. Our data provides only a snapshot ofpresent SOC distribution but some of the observed patterns are mostlikely related to different degrees of disturbance in the past years. Thistemporal aspect could not be covered in our analysis but should beincluded in future research in this area.
It is currently infeasible to quantitatively estimate the effects of thementioned processes and factors on our results since their assessmentrequire information that are usually not available at our investigatedspatial scale. If spatially distributed land use data for field blocks andfor various time slices were available, however, it could be used toassess the effect of temporal land use changes on the distribution oftopsoil SOC concentrations within the field blocks in the future. Inaddition, the lack of significant correlations in our study may often bea result from the relatively low resolution of our DEM which may betoo coarse to model drainage patterns and surface roughness at thesmall hillslope scale. Thus, similar studies should aim at includinghigh resolution elevation data as acquired by LiDAR to betterconstrain the topographic influence on the spatial distribution of SOC.
6. Conclusion
This study applied a remote sensing based approach for the spatialestimation of SOC in a semi-arid area in southeastern Spain. Theapproach provides reliable estimates of TOC in the topsoil and can betransferred to areas where the soil surface is devoid of vegetation atleast during parts of the year such as semi-arid and arid regions withpronounced dry phases and agricultural areas where the soil surface istemporarily exposed. The approach thus fulfills the increasingdemand on spatially distributed, quantitative information on terres-trial ecosystems and contributes to recent endeavors of digital soilmapping and monitoring.
The generated spatial dataset on topsoil TOC values was analyzedwith respect to the influence of topography on the spatial distributionof SOC at different spatial scales. The results show that there are majordifferences between topsoil SOC at the landscape scale with valleybottoms having the highest SOC most likely associated with increasedwater availability and the prevalence of fine texture soils. At thehillslope scale different topographic controls are observed. A positivetrend towards SOC accumulation with increasing TWI is observed onsteep slopes that promote a downward accumulation of water andfines. The correlations, however, are characterized by strong scatter atthe fine scale, indicating the importance of other factors and processessuch as vegetation patches and tillage erosion.
Moorman et al. (2004) and Yoo et al. (2006) show that there is astrong topography dependent SOC storage in humid areas. Our datasuggest that there is also a topographic control on SOC in the topsoil insemi-arid regions. This control depends largely on the investigatedspatial scale and is strongest at the landscape scale. So far our findings
refer only to TOC in the upper few centimeters of the soil profile andfurther studies are required to obtain spatially distributed informationof SOC storage and its relation to topography.
Acknowledgments
The authors like to thank Joachim Hill and Sebastian Mader, TrierUniversity, who pre-processed the HyMap data. T.J.'s work wassupported by an Aly Kaufman Fellowship at the Technion, Haifa. Thisstudy is part of the PilotHydroSurf project granted by the University ofBasel, which is highly acknowledged. Very constructive comments ofMatthias Boer and an anonymous reviewer helped to improve themanuscript.
References
Adams, J., Smith, M., Gillespie, A., 1989. Simple methods for complex natural surfaces: astrategy for the hyperspectral era of remote sensing. Proc. of the IGARSSSymposium, 10–14 July. IEEE, Vancouver, Canada, pp. 16–21.
Alewell, C., Schaub, M., Conen, F., 2009. A method to detect soil carbon degradationduring soil erosion. Biogeosciences 6, 2541–2547.
Almagro, M., López, J., Boix-Fayos, C., Albaladejo, J., Martínez-Mena, M., 2010.Belowground carbon allocation patterns in a dry Mediterranean ecosystem: acomparison of two models. Soil Biology and Biochemistry 42, 1549–1557.
Amundson, R., 2001. The carbon budget in soils. Annual Review of Earth and PlanetarySciences 29, 535–562.
Austin, A.T., Yahdjian, L., Stark, J.M., Belnap, J., Porporato, A., Norton, U., Ravetta, D.A.,Schaeffler, S.M., 2004. Water pulses and biogeochemical cycles in arid and semiaridecosystems. Oecologia 141, 221–235.
Bailly, J.S., Monestiez, P., Lagacherie, P., 2006. Modelling spatial variability alongdrainage networks with geostatistics. Mathematical Geology 38, 515–539.
Baumgardner, M., Silva, L., Biehl, L., Stoner, E., 1985. Reflectance properties of soils.Advances in Agronomy 38, 1–44.
Bellin, N., van Wesemael, B., Meerkerk, A., Vanacker, V., Barbera, G., 2009.Abandonment of soil and water conservation structures in Mediterraneanecosystems: a case study from south east Spain. Catena 76, 114–121.
Belnap, J., Welter, J.R., Grimm, N.B., Barger, N., Ludwig, J.A., 2005. Linkages betweenmicrobial and hydrologic processes in arid and semiarid watersheds. Ecology 86,298–307.
Ben-Dor, E., Banin, A., 1994. Visible and near-infrared (0.4–1.1 μm) analysis of arid andsemiarid soils. Remote Sensing of Environment 48, 261–274.
Ben-Dor, E., Banin, A., 1995. Near-infrared analysis as a rapid method to simultaneouslyevaluate several soil properties. Soil Science Society of America Journal 59,364–372.
Berhe, A.A., Harden, J.W., Torn, M.S., Harte, J., 2008. Linking soil organic matterdynamics and erosion-induced terrestrial carbon sequestration at differentlandform positions. Journal of Geophysical Research 113, G04039.
Berk, A., Anderson, G.P., Acharya, P.K., Chetwynd, P.K., Bernstein, L.S., Shettle, E.P.,Matthew, M.W., Adler-Golden, S.M., 1999. MODTRAN4 user's manual. AirforceResearch Laboratory, Space Vehicles Directorate, Airforce Material Command,Hanscom AFB, MA 01731-3010, Massachusetts.
Beven, K., 2002. Dryland river characteristics and concepts. In: Bull, L.J., Kirkby, M.J.(Eds.), Dryland Rivers. Hydrology and Geomorphology of Semi-arid Channels. JohnWiley & Sons, Chichester, pp. 57–106.
Beven, K.J., Kirkby, M., 1979. A physical based variable contributing area model of basinhydrology. Hydrological Sciences Bulletin 24, 43–69.
Bird, S.B., Herrick, J.E., Wander, M.M., Wright, S.F., 2002. Spatial heterogeneity ofaggregate stability and soil carbon in semi-arid rangeland. Environmental Pollution116, 445–455.
Boer, M., Barrio, G.D., Puigdefábres, J., 1996. Mapping soil depth classes in dryMediterranean areas using terrain attributes derived from a digital elevationmodel. Geoderma 72, 99–118.
Bracken, L.J., Croke, J., 2007. The concept of hydrological connectivity and itscontribution to understanding runoff-dominated geomorphic systems. Hydrolog-ical Processes 21, 1749–1763.
Bracken, L., Kirkby, M., 2005. Differences in hillslope runoff and sediment transportrates within two semi-arid catchments in southeast Spain. Geomorphology 68,183–200.
Brown, D., Shepherd, K., Walsh, M., Mays, M., Reinsch, T., 2006. Global soilcharacterization with VNIR diffuse reflectance spectroscopy. Geoderma 132,273–290.
Buis, E., Veldkamp, A., 2008. Modelling dynamic water redistribution patterns in aridcatchments in the Negev Desert of Israel. Earth Surface Processes and Landforms33, 107–122.
Burke, I.C., Lauenroth, W.K., Riggle, R., Brannen, P., Madigan, B., Beard, S., 1999. Spatialvariability of soil properties in the shortgrass steppe: the relative importance oftopography, grazing, microsite, and plant species in controlling spatial patterns.Ecosystems 2, 422–438.
Burrough, P.A., Van Gaans, P.F.M., MacMillan, R.A., 2000. High-resolution landformclassification using fuzzy-k-means. Fuzzy Sets and Systems 113, 37–52.
261W. Schwanghart, T. Jarmer / Geomorphology 126 (2011) 252–263

Author's personal copy
Calvo-Cases, A., Boix-Fayos, C., Imeson, A.C., 2003. Runoff generation, sedimentmovement and soil water behaviour on calcareous (limestone) slopes of someMediterranean environments in southeast Spain. Geomorphology 50, 269–291.
Cammeraat, L.H., 2002. A review of two strongly contrasting geomorphological systemswithin the context of scale. Earth Surface Processes and Landforms 27, 1201–1222.
Cammeraat, L.H., Imeson, A., 1998. Deriving indicators of soil degradation from soilaggregation studies in SE Spain and S France. Geomorphology 23, 307–321.
Cammeraat, L.H., Imeson, A.C., 1999. The evolution and significance of soil-vegetationpatterns following land abandonment and fire in Spain. Catena 37, 107–127.
Cantón, Y., Solé-Benet, A., Domingo, F., 2004. Temporal and spatial patterns of soilmoisture in semiarid badlands of SE Spain. Journal of Hydrology 285, 199–214.
Cerdà, A., 1997. Soil erosion after land abandonment in a semiarid environment ofsoutheastern Spain. Arid Land Research and Management 11, 163–176.
Chin, W.W., Newsted, P.R., 1999. Structural equation modelling analysis with smallsamples using partial least squares. In: Hoyle, R.H. (Ed.), Statistical Strategies forSmall Sample Research. Sage, Thousand Oaks, CA, pp. 307–341.
Davis, J.C., 1986. Statistics and Data Analysis in Geology, 2nd Edition. JohnWiley & Sons,New York, Chichester, Brisbane.
Fister, W., Ries, J., 2009. Wind erosion in the central Ebro Basin under changing land usemanagement. Field experiments with a portable wind tunnel. Journal of AridEnvironments 73, 996–1004.
Fox, D.M., Bryan, R.B., 1999. The relationship of soil loss by interrill erosion to slopegradient. Catena 38, 211–222.
Garcá-Ruiz, J.M., 2010. The effects of land uses on soil erosion in Spain: a review. Catena81, 1–11.
García-Orenes, F., Cerdà, A., Mataix-Solera, J., Guerrero, C., Bodí, M., Arcenegui, V., Zornoza,R., Sempere, J., 2009. Effects of agriculturalmanagement on surface soil properties andsoil-water losses in eastern Spain. Soil and Tillage Research 106, 117–123.
Glatzel, S., Sommer, M., 2005. Colluvial soils and landscape position: field studies ongreenhouse gas exchange and related ecological characteristics. Zeitschrift fürGeomorphologie N.F. Supplement 139, 87–99.
Goidts, E., van Wesemael, B., van Oost, K., 2009. Driving forces of soil organic carbonevolution at the landscape and regional scale using data from a stratified soilmonitoring. Global Change Biology 15, 2981–3000.
Gomez, C., Viscarra Rossel, R., McBratney, A., 2008. Soil organic carbon prediction byhyperspectral remote sensing and field VIS-NIR spectroscopy: an Australian casestudy. Geoderma 146, 403–411.
Haenlein, M., Kaplan, A.M., 2004. A beginner's guide to partial least squares analysis.Understanding Statistics 3, 283–297.
Harper, R.J., Gilkes, R.J., 2001. Some factors affecting the distribution of carbon in soils ofa dryland agricultural system in southwestern Australia. In: Lal, R., Kimble, J.M.,Follett, R.F., Stewart, B.A. (Eds.), Assessment Methods for Soil Carbon. LewisPublishers, Boca Raton, London, New York, Washington, pp. 577–591.
Hassink, J., 1997. The capacity of soils to preserve organic C and N by their associationwith clay and silt particles. Plant and Soil 191, 77–87.
Hill, J., Schütt, B., 2000. The use of remote sensing satellites for mapping complexpatterns of erosion and stability in arid Mediterranean ecosystems. Remote Sensingof Environment 74, 557–569.
Hill, J., Sturm, B., 1991. Radiometric correction of multi-temporal thematic mapper datafor use in agricultural land-cover classification and vegetation monitoring.International Journal of Remote Sensing 12, 1471–1491.
Hill, J., Mehl, W., Radeloff, V., 1995. Improved forest mapping by combiningatmospheric and topographic effects. In: Askne, J. (Ed.), Sensors and EnvironmentalApplications of Remote Sensing. A.A. Balkema, Rotterdam, Brookfield, pp. 143–151.
Hitz, C., 2002. Inventur und Dynamik der organischen Substanz in Böden der AlpinenStufe. Vol. 42 of Physische Geographie. Universität Zürich, Zürich.
Hoffmann, T., Glatzel, S., Dikau, R., 2009. A carbon storage perspective on alluvialsediment storage in the rhine catchment. Geomorphology 108, 127–137.
Hutchinson, M.F., 1989. A new procedure for gridding elevation and stream line datawith automatic removal of spurious pits. Journal of Hydrology 106, 211–232.
Janzen, H.H., 2004. Carbon cycling in earth systems – a soil science perspective.Agriculture, Ecosystems & Environment 104, 399–417.
Jarmer, T., 2005. Der Einsatz von Reflexionsspektrometrie und Satellitenbilddaten zurErfassung pedochemischer Eigenschaften in semi-ariden und ariden Gebieten Israels.No. 29 in Trier Geographische Schriften. Geographische Gesellschaft Trier, Trier.
Jarmer, T., Vohland, M., Lilienthal, H., Schnug, E., 2008. Estimation of some chemicalproperties of an agricultural soil by spectroradiometric measurements. Pedosphere18, 163–170.
Jarmer, T., Hill, J., Lavee, H., Sarah, P., 2010. Mapping soil organic carbon in semi-arid andarid ecosystems of Israel. Photogrammetric Engineering and Remote Sensing 75,85–94.
Jenny, H., 1980. The Soil Resource. Springer, New York.Jobbágy, E.G., Jackson, R.B., 2000. The vertical distribution of soil organic carbon and its
relation to climate and vegetation. Ecological Applications 10, 423–436.Kimble, J.M., Lal, R., Mausbach, M., 2001. Erosion effects on soil organic carbon pool in
soils in Iowa. In: Stott, D.E., Mohtar, R.H., Steinhardt, G.C. (Eds.), Sustaining theGlobal Farm. Selected Papers from the 10th International Soil ConservationOrganization Meeting Held May 24-29, 1999 at Purdue University and the USDA-ARS National Soil Erosion Research Laboratory. International Soil ConservationOrganization in cooperation with the USDA and Purdue University, West Lafayette,pp. 472–475.
Kirkby, M.J., Bull, L.J., 2000. Some factors controlling gully growth in fine-grainedsediments: a model applied in southeast Spain. Catena 40, 127–146.
Kirkby, M.J., Bracken, L.J., Shannon, J., 2005. The influence of rainfall distribution andmorphological factors on runoff delivery from dryland catchments in SE Spain.Catena 62, 136–156 August.
Konen, M., Burras, C., Sandor, J., 2003. Organic carbon, texture, and quantitative colormeasurement relationships for cultivated soils in north central Iowa. Soil ScienceSociety of America Journal 67, 1823–1830.
Krishnan, P., Alexander, J., Butler, B., Hummel, J., 1980. Reflectance technique for predictingsoil organic matter. Soil Science Society of America Journal 44, 1282–1285.
Kuhn, N.J., Hoffmann, T., Schwanghart, W., Dotterweich, M., 2009. Agricultural soilerosion and global carbon cycle: controversy over? Earth Surface Processes andLandforms 34, 1033–1038.
Lesschen, J., Schoorl, J., Cammeraat, L., 2009. Modelling runoff and erosion for a semi-arid catchment using a multi-scale approach based on hydrological connectivity.Geomorphology 109, 174–183.
MacMillan, R.A., Shary, P.A., 2009. Landforms and landform elements in geomorphometry.In: Hengl, T., Reuter, H.I. (Eds.), Geomorphometry. Concepts, Software, Applications.Vol. 33 of Developments in Soil Science. Elsevier, Amsterdam, pp. 227–254.
Martínez-Mena, M., Albaladejo, J., Castillo, V.M., 1998. Factors influencing surface runoffgeneration in a Mediterranean semi-arid environment: Chicamo watershed, SESpain. Hydrological Processes 12, 741–754.
Martínez-Mena, M., Alvarez Rogel, J., Castillo, V., Albaladejo, J., 2002. Organic carbonand nitrogen losses influenced by vegetation removal in a semiarid Mediterraneansoil. Biogeochemistry 61, 309–321.
Martínez-Mena, M., Lopez, J., Almagro, M., Boix-Fayos, C., Albaladejo, J., 2008. Effect ofwater erosion and cultivation on the soil carbon stock in a semiarid area of south-east Spain. Soil and Tillage Research 99, 119–129.
Matheron, G., 1963. Principles of geostatistics. Economic Geology 58, 1246–1266.Moore, I.D., Grayson, R.B., Ladson, A.R., 1993. Digital terrain modelling: a review of
hydrological, geomorphological, and biological applications. In: Beven, K.J., Moore,I.D. (Eds.), Terrain analysis and distributed modelling in hydrology. advances inhydrological processes. Wiley & Sons, Chichester, New York, Brisbane, pp. 7–34.
Moorman, T.B., Cambardella, C.A., James, D.E., Karlen, D.L., Kramer, L.A., 2004.Quantification of tillage and landscape effects on soil carbon in small Iowawatersheds. Soil and Tillage Research 78, 225–236.
Morvan, X., Saby, N., Arrouays, D., Bas, C.L., Jones, R., Verheijen, F., Bellamy, P., Stephens,M., Kibblewhite, M., 2008. Soil monitoring in Europe: a review of existing systemsand requirements for harmonisation. Science of The Total Environment 391, 1–12.
Navarro-Hervás, F., 1991. El sistema hidrográfico del Guadalentín. Consejeria de PoliticaTerritorial. Obras Publicas y Medio Ambiente, Murcia.
Oades, J.M., 1989. An introduction to organic matter in mineral soils, In: Dixon, J.B.,Weed, S.B. (Eds.), Minerals in Soil Environments, 2nd Edition. Soil. Sci. Soc. Am,Madison, WI, pp. 89–159.
Poesen, J., van Wesemael, B., Govers, G., Martinez-Fernandez, J., Desmet, P., Vandaele,K., Quine, T., Degraer, G., 1997. Patterns of rock fragment cover generated by tillageerosion. Geomorphology 18, 183–197.
Puigdefabregas, J., Boer, M.M., Gutierrez, L., Sole, A., 1998. Differential responses ofhillslope and channel elements to rainfall events in a semi-arid area. Geomorphol-ogy 23, 337–351.
Puigdefabregas, J., Sole, A., Gutierrez, L., del Barrio, G., Boer, M., 1999. Scales andprocesses of water and sediment redistribution in drylands: results from theRambla Honda field site in southeast Spain. Earth Science Reviews 48, 39–70.
Quine, T.A., Govers, G., Poesen, J., Walling, D., van Wesemael, B., Martinez-Fernandez, J.,1999. Fine-earth translocation by tillage in stony soils in the Guadalentin, south-east Spain: an investigation using caesium-134. Soil and Tillage Research 51,279–301.
Quinton, J.N., Catt, J.A., Steer, J., 2006. Soil carbon losses by water erosion:experimentation and modeling at field and national scales in the UK. Agriculture,Ecosystems & Environment 112, 87–102.
Quinton, J.N., Govers, G., Van Oost, K., Bardgett, R.D., 2010. The impact of agriculturalsoil erosion on biogeochemical cycling. Nature Geoscience 3, 311–314.
Ravindranath, N.H., Ostwald, M., 2008. Carbon Inventory Methods. Handbook forGreenhouse Gas Inventory, Carbon Mitigation and Roundwood ProductionProjects. Vol. 29 of Advances in Global Change Research. Springer, New York.
Reeves III, J., McCarty, G., Mimmo, T., 2002. The potential of diffuse reflectancespectroscopy for the determination of carbon invertories in soils. EnvironmentalPollution 116, 277–284.
Reuter, H.I., Hengl, T., Gessler, P., Soille, P., 2009. Preparation of DEMs forgeomorphometric analysis. In: Hengl, T., Reuter, H.I. (Eds.), Geomorphometry.Concepts, Software, Applications. Vol. 33 of Developments in Soil Science. Elsevier,Amsterdam, pp. 87–120.
Roberts, D., Smith, M., Adams, J., 1993. Green vegetation, nonphotosynthetic vegetation,and soils in Aviris data. Remote Sensing of Environment 44, 255–269.
Rossell, R.A., Gasparoni, J.C., Galantini, J.A., 2001. Soil organic matter evaluation. In: Lal, R.,Kimble, J.M., Follett, R.F., Stewart, B.A. (Eds.), Assessment Methods for Soil Carbon.Lewis Publishers, Boca Raton, London, New York, Washington, pp. 311–322.
Ruiz-Sinoga, J.D., Diaz, A.R., Bueno, E.F., Murillo, J.M., 2010. The role of soil surfaceconditions in regulating runoff and erosion processes on a metamorphic hillslope(southern Spain): soil surface conditions, runoff and erosion in southern Spain.Catena 80, 131–139.
Sanderman, J., Amundson, R., 2003. Biogeochemistry of decomposition and detritalprocessing. In: Holland, H.D., Turekian, K.K. (Eds.), Treatise on Geochemistry.Pergamon, Oxford, pp. 249–316.
Schläpfer, D., Richter, R., 2002. Geoatmospheric processing of airborne imagingspectrometer data. part 1: parametric orthorectification. International Journal ofRemote Sensing 23, 2609–2630.
Schlesinger, W.H., Pilmanis, A.M., 1998. Plant-soil interactions in deserts. Biogeochem-istry 42, 169–187.
Schlesinger, W.H., Raikes, J.A., Hartley, A.E., Cross, A.F., 1996. On the spatial patterns ofsoil nutrients in desert ecosystems. Ecology 77, 364–374.
262 W. Schwanghart, T. Jarmer / Geomorphology 126 (2011) 252–263

Author's personal copy
Schwanghart, W., Kuhn, N.J., 2010. Topotoolbox: a set of matlab functions fortopographic analysis. Environmental Modelling and Software 25, 770–781.
Skoien, J.O., Merz, R., Blöschl, G., 2006. Top-kriging – geostatistics on stream networks.Hydrology and Earth System Sciences 10, 277–287.
Smith, S.V., Renwick, W.H., Buddemeier, R.W., Crossland, C.J., 2001. Budgets of soilerosion and deposition for sediments and sedimentary organic carbon across theconterminous united states. Global Biogeochemical Cycles 15, 697–707.
Stallard, R.F., 1998. Terrestrial sedimentation and the carbon cycle: couplingweathering and erosion to carbon burial. Global Biogeochemical Cycles 12,231–257.
Stevenson, F.J., 1994. Humus Chemistry. John Wiley & Sons, New York.Tanré, D., Deroo, C., Duhaut, P., Herman, M., Morcrette, J.J., Perbos, J., Deschamps, P.Y.,
1990. Description of a computer code to simulate the signal in the solar spectrum:the 5 s code. International Journal of Remote Sensing 11, 659–668.
Tiessen, H., Cuevas, E., Chacon, P., 1994. The role of soil organic matter in sustaining soilfertility. Nature 371, 783–785.
Udelhoven, T., Emmerling, C., Jarmer, T., 2003. Quantitative analysis of soil chemicalproperties with diffuse reflectance spectrometry and partial-least-square regres-sion: a feasibility study. Plant and Soil 251, 319–329.
Van Oost, K., Quine, T.A., Govers, G., De Gryze, S., Six, J., Harden, J.W., Ritchie, J.C.,McCarty, G.W., Heckrath, G., Kosmas, C., Giraldez, J.V., Marques da Silva, J.R.,Merchx, R., 2007. The impact of agricultural soil erosion on the global carbon cycle.Science 318, 626–629.
van Waes, C., Mestdagh, I., Lootens, P., Carlier, L., 2005. Possibilities of near reflectancespectroscopy for the prediction of organic carbon concentrations in grassland soils.Journal of Agricultural Science 143, 487–492.
van Wesemael, B., Mulligan, M., Poesen, J., 2000. Spatial patterns of soil water balanceon intensively cultivated hillslopes in a semi-arid environment: the impact of rockfragments and soil thickness. Hydrological Processes 14, 1811–1828.
van Wesemael, B., Cammeraat, E., Mulligan, M., Burke, S., 2003. The impact of soilproperties and topography on drought vulnerability of rainfed cropping systems insouthern Spain. Agriculture, Ecosystems & Environment 94, 1–15.
van Wesemael, B., Rambaud, X., Poesen, J., Muligan, M., Cammeraat, E., Stevens, A.,2006. Spatial patterns of land degradation and their impacts on the water balanceof rainfed treecrops: a case study in south east Spain. Geoderma 133, 43–56.
Ver Hoef, J.M., Peterson, E., Theobald, D., 2006. Spatial statistical models that use flowand stream distance. Environmental and Ecological Statistics 13, 449–464.
Viscarra Rossel, R.A., 2008. ParLeS: Software for chemometric analysis of spectroscopicdata. Chemometrics and Intelligent Laboratory Systems 90, 72–83.
Viscarra Rossel, R., Walvoort, D., McBratney, A., Janik, L., Skjemstad, J., 2006. Visible,near infrared or combined diffuse reflectance spectroscopy for simultaneousassessment of various soil properties. Geoderma 131, 59–75.
WBGU, 1998. World in transition: strategies for managing global environmental risks.German Advisory Council on Global Change Annual Report 1998. Springer, Berlin.
Webster, R., Oliver, M., 2001. Geostatistics for Environmental Scientists. John Wiley &Sons, Chichester, New York.
Wilcox, B.P., Breshears, D.D., Allen, C.D., 2003. Ecohydrology of a resource-conservingsemiarid woodland: effects of scale and disturbance. Ecological Monographs 73,223–239.
Wills, S., Burras, C., Sandor, J., 2007. Prediction of SOC content using field and laboratorymeasurements of soil color. Soil Science Society of America Journal 71, 380–388.
Yair, A., Raz-Yassif, N., 2004. Hydrological processes in a small arid catchment: scaleeffects of rainfall and slope length. Geomorphology 61, 155–169.
Yoo, K., Amundson, R., Heimsath, A.M., Dietrich, W.E., 2006. Spatial patterns of soilorganic carbon on hillslopes: integrating geomorphic processes and the biological Ccycle. Geoderma 130, 47–65.
263W. Schwanghart, T. Jarmer / Geomorphology 126 (2011) 252–263
Related Documents