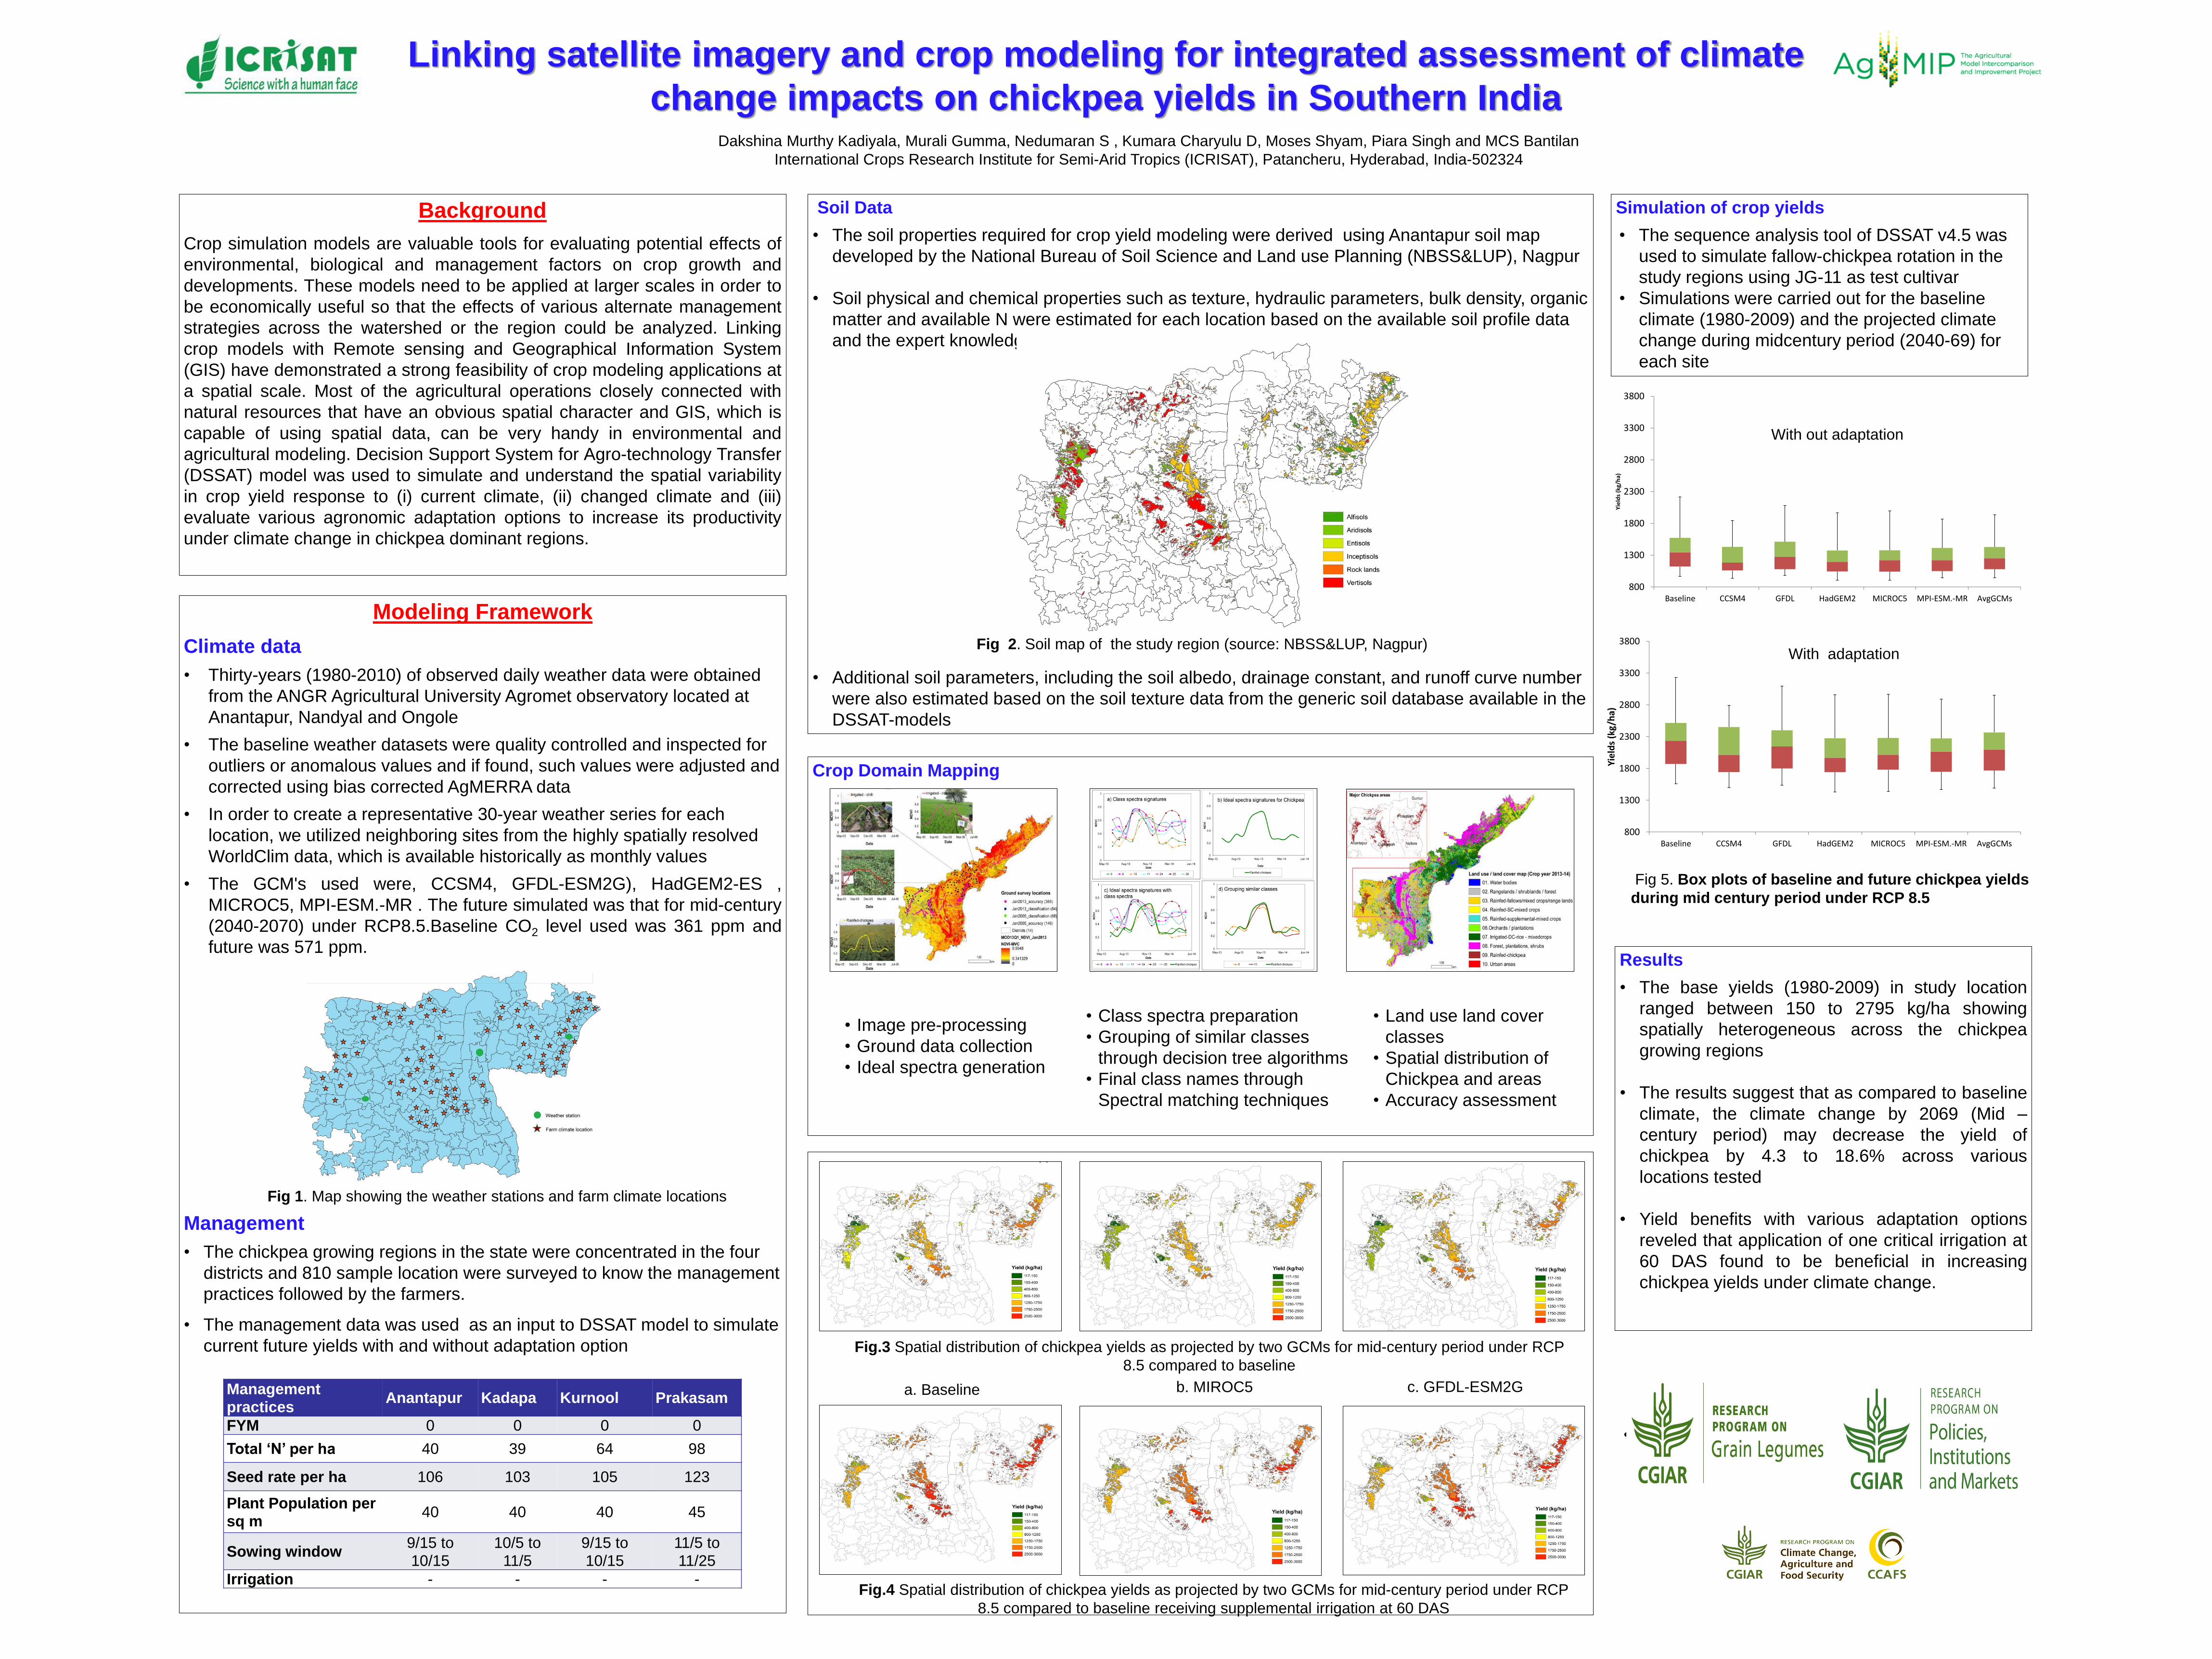
Linking satellite imagery and crop modeling for integrated assessment of climate change impacts on chickpea yields in Southern India Dakshina Murthy Kadiyala, Murali Gumma, Nedumaran S , Kumara Charyulu D, Moses Shyam, Piara Singh and MCS Bantilan International Crops Research Institute for Semi-Arid Tropics (ICRISAT), Patancheru, Hyderabad, India-502324 Soil Data • The soil properties required for crop yield modeling were derived using Anantapur soil map developed by the National Bureau of Soil Science and Land use Planning (NBSS&LUP), Nagpur • Soil physical and chemical properties such as texture, hydraulic parameters, bulk density, organic matter and available N were estimated for each location based on the available soil profile data and the expert knowledge • Additional soil parameters, including the soil albedo, drainage constant, and runoff curve number were also estimated based on the soil texture data from the generic soil database available in the DSSAT-models Simulation of crop yields • The sequence analysis tool of DSSAT v4.5 was used to simulate fallow-chickpea rotation in the study regions using JG-11 as test cultivar • Simulations were carried out for the baseline climate (1980-2009) and the projected climate change during midcentury period (2040-69) for each site Crop Domain Mapping Background Crop simulation models are valuable tools for evaluating potential effects of environmental, biological and management factors on crop growth and developments. These models need to be applied at larger scales in order to be economically useful so that the effects of various alternate management strategies across the watershed or the region could be analyzed. Linking crop models with Remote sensing and Geographical Information System (GIS) have demonstrated a strong feasibility of crop modeling applications at a spatial scale. Most of the agricultural operations closely connected with natural resources that have an obvious spatial character and GIS, which is capable of using spatial data, can be very handy in environmental and agricultural modeling. Decision Support System for Agro-technology Transfer (DSSAT) model was used to simulate and understand the spatial variability in crop yield response to (i) current climate, (ii) changed climate and (iii) evaluate various agronomic adaptation options to increase its productivity under climate change in chickpea dominant regions. Modeling Framework Climate data • Thirty-years (1980-2010) of observed daily weather data were obtained from the ANGR Agricultural University Agromet observatory located at Anantapur, Nandyal and Ongole • The baseline weather datasets were quality controlled and inspected for outliers or anomalous values and if found, such values were adjusted and corrected using bias corrected AgMERRA data • In order to create a representative 30-year weather series for each location, we utilized neighboring sites from the highly spatially resolved WorldClim data, which is available historically as monthly values • The GCM's used were, CCSM4, GFDL-ESM2G), HadGEM2-ES , MICROC5, MPI-ESM.-MR . The future simulated was that for mid-century (2040-2070) under RCP8.5.Baseline CO 2 level used was 361 ppm and future was 571 ppm. Management • The chickpea growing regions in the state were concentrated in the four districts and 810 sample location were surveyed to know the management practices followed by the farmers. • The management data was used as an input to DSSAT model to simulate current future yields with and without adaptation option Management practices Anantapur Kadapa Kurnool Prakasam FYM 0 0 0 0 Total ‘N’ per ha 40 39 64 98 Seed rate per ha 106 103 105 123 Plant Population per sq m 40 40 40 45 Sowing window 9/15 to 10/15 10/5 to 11/5 9/15 to 10/15 11/5 to 11/25 Irrigation - - - - • Image pre-processing • Ground data collection • Ideal spectra generation • Class spectra preparation • Grouping of similar classes through decision tree algorithms • Final class names through Spectral matching techniques • Land use land cover classes • Spatial distribution of Chickpea and areas • Accuracy assessment . • . 800 1300 1800 2300 2800 3300 3800 Baseline CCSM4 GFDL HadGEM2 MICROC5 MPI-ESM.-MR AvgGCMs Yields (kg/ha) 800 1300 1800 2300 2800 3300 3800 Baseline CCSM4 GFDL HadGEM2 MICROC5 MPI-ESM.-MR AvgGCMs Yields (kg/ha) Results • The base yields (1980-2009) in study location ranged between 150 to 2795 kg/ha showing spatially heterogeneous across the chickpea growing regions • The results suggest that as compared to baseline climate, the climate change by 2069 (Mid – century period) may decrease the yield of chickpea by 4.3 to 18.6% across various locations tested • Yield benefits with various adaptation options reveled that application of one critical irrigation at 60 DAS found to be beneficial in increasing chickpea yields under climate change. Fig 1. Map showing the weather stations and farm climate locations Fig 2. Soil map of the study region (source: NBSS&LUP, Nagpur) Fig.3 Spatial distribution of chickpea yields as projected by two GCMs for mid-century period under RCP 8.5 compared to baseline a. Baseline b. MIROC5 c. GFDL-ESM2G Fig.4 Spatial distribution of chickpea yields as projected by two GCMs for mid-century period under RCP 8.5 compared to baseline receiving supplemental irrigation at 60 DAS Fig 5. Box plots of baseline and future chickpea yields during mid century period under RCP 8.5 With adaptation With out adaptation

Linking satellite imagery and crop modeling for integrated assessment of climate change impacts on chickpea yields in Southern India
Jul 21, 2015
Welcome message from author
This document is posted to help you gain knowledge. Please leave a comment to let me know what you think about it! Share it to your friends and learn new things together.
Transcript
Linking satellite imagery and crop modeling for integrated assessment of climate
change impacts on chickpea yields in Southern India Dakshina Murthy Kadiyala, Murali Gumma, Nedumaran S , Kumara Charyulu D, Moses Shyam, Piara Singh and MCS Bantilan
International Crops Research Institute for Semi-Arid Tropics (ICRISAT), Patancheru, Hyderabad, India-502324
Soil Data
• The soil properties required for crop yield modeling were derived using Anantapur soil map
developed by the National Bureau of Soil Science and Land use Planning (NBSS&LUP), Nagpur
• Soil physical and chemical properties such as texture, hydraulic parameters, bulk density, organic
matter and available N were estimated for each location based on the available soil profile data
and the expert knowledge
• Additional soil parameters, including the soil albedo, drainage constant, and runoff curve number
were also estimated based on the soil texture data from the generic soil database available in the
DSSAT-models
Simulation of crop yields
• The sequence analysis tool of DSSAT v4.5 was
used to simulate fallow-chickpea rotation in the
study regions using JG-11 as test cultivar
• Simulations were carried out for the baseline
climate (1980-2009) and the projected climate
change during midcentury period (2040-69) for
each site
Crop Domain Mapping
Background
Crop simulation models are valuable tools for evaluating potential effects of
environmental, biological and management factors on crop growth and
developments. These models need to be applied at larger scales in order to
be economically useful so that the effects of various alternate management
strategies across the watershed or the region could be analyzed. Linking
crop models with Remote sensing and Geographical Information System
(GIS) have demonstrated a strong feasibility of crop modeling applications at
a spatial scale. Most of the agricultural operations closely connected with
natural resources that have an obvious spatial character and GIS, which is
capable of using spatial data, can be very handy in environmental and
agricultural modeling. Decision Support System for Agro-technology Transfer
(DSSAT) model was used to simulate and understand the spatial variability
in crop yield response to (i) current climate, (ii) changed climate and (iii)
evaluate various agronomic adaptation options to increase its productivity
under climate change in chickpea dominant regions.
Modeling Framework
Climate data
• Thirty-years (1980-2010) of observed daily weather data were obtained
from the ANGR Agricultural University Agromet observatory located at
Anantapur, Nandyal and Ongole
• The baseline weather datasets were quality controlled and inspected for
outliers or anomalous values and if found, such values were adjusted and
corrected using bias corrected AgMERRA data
• In order to create a representative 30-year weather series for each
location, we utilized neighboring sites from the highly spatially resolved
WorldClim data, which is available historically as monthly values
• The GCM's used were, CCSM4, GFDL-ESM2G), HadGEM2-ES ,
MICROC5, MPI-ESM.-MR . The future simulated was that for mid-century
(2040-2070) under RCP8.5.Baseline CO2 level used was 361 ppm and
future was 571 ppm.
Management
• The chickpea growing regions in the state were concentrated in the four
districts and 810 sample location were surveyed to know the management
practices followed by the farmers.
• The management data was used as an input to DSSAT model to simulate
current future yields with and without adaptation option
Management practices
Anantapur Kadapa Kurnool Prakasam
FYM 0 0 0 0
Total ‘N’ per ha 40 39 64 98
Seed rate per ha 106 103 105 123
Plant Population per sq m
40 40 40 45
Sowing window 9/15 to 10/15
10/5 to 11/5
9/15 to 10/15
11/5 to 11/25
Irrigation - - - -
• Image pre-processing
• Ground data collection
• Ideal spectra generation
• Class spectra preparation
• Grouping of similar classes
through decision tree algorithms
• Final class names through
Spectral matching techniques
• Land use land cover
classes
• Spatial distribution of
Chickpea and areas
• Accuracy assessment
.
• .
800
1300
1800
2300
2800
3300
3800
Baseline CCSM4 GFDL HadGEM2 MICROC5 MPI-ESM.-MR AvgGCMs
Yie
lds
(kg/
ha)
800
1300
1800
2300
2800
3300
3800
Baseline CCSM4 GFDL HadGEM2 MICROC5 MPI-ESM.-MR AvgGCMs
Yie
lds
(kg
/ha)
Results
• The base yields (1980-2009) in study location
ranged between 150 to 2795 kg/ha showing
spatially heterogeneous across the chickpea
growing regions
• The results suggest that as compared to baseline
climate, the climate change by 2069 (Mid –
century period) may decrease the yield of
chickpea by 4.3 to 18.6% across various
locations tested
• Yield benefits with various adaptation options
reveled that application of one critical irrigation at
60 DAS found to be beneficial in increasing
chickpea yields under climate change.
Fig 1. Map showing the weather stations and farm climate locations
Fig 2. Soil map of the study region (source: NBSS&LUP, Nagpur)
Fig.3 Spatial distribution of chickpea yields as projected by two GCMs for mid-century period under RCP
8.5 compared to baseline
a. Baseline b. MIROC5 c. GFDL-ESM2G
Fig.4 Spatial distribution of chickpea yields as projected by two GCMs for mid-century period under RCP
8.5 compared to baseline receiving supplemental irrigation at 60 DAS
Fig 5. Box plots of baseline and future chickpea yields
during mid century period under RCP 8.5
With adaptation
With out adaptation
Related Documents