Linking Learning Goals and Educational Resources through Interactive Concept Map Visualizations TAMARA SUMNER 1 , FAISAL AHMAD 1 , SONAL BHUSHAN 1 , QIANYI GU 1 , FRANCIS MOLINA 2 , STEDMAN WILLARD 2 , MICHAEL WRIGHT 3 , LYNNE DAVIS 3 AND GREG JANÉE 4 1 Dept of Computer Science, University of Colorado, Campus Box 430 Boulder, CO, USA 80309-0430 {sumner, fahmad, bhushan, gu}@cs.colorado.edu 2 Project 2061, American Association for the Advancement of Science, 1200 New York Avenue, NW, Washington DC, USA 20005 {fmolina, twillard}@aaas.org 3 DLESE Program Center, University Corporation for Atmospheric Research, 3300 Mitchell Lane, Boulder, CO, USA {mwright, lynne} @ucar.edu 4 Alexandria Project, University of California, Santa Barbara, 1205 Girvetz Hall, Santa Barbara, CA, USA [email protected] Abstract. Concept browsing interfaces can help educators and learners to locate and use learning resources that are aligned with recognized learning goals. The Strand Map Service enables users to navigate interactive visualizations of related learning goals and to request digital library resources aligned with learning goals. These interfaces are created using a programmatic web service interface that dynamically generates interactive visual components. Preliminary findings suggest that these library interfaces appear to help users stay focused on the scientific content of their information discovery task, as opposed to focusing on the mechanics of searching.

Welcome message from author
This document is posted to help you gain knowledge. Please leave a comment to let me know what you think about it! Share it to your friends and learn new things together.
Transcript
Linking Learning Goals and Educational Resources through Interactive Concept Map Visualizations
TAMARA SUMNER1, FAISAL AHMAD1, SONAL BHUSHAN1, QIANYI GU1,
FRANCIS MOLINA2, STEDMAN WILLARD2, MICHAEL WRIGHT3, LYNNE
DAVIS3 AND GREG JANÉE4
1 Dept of Computer Science, University of Colorado, Campus Box 430 Boulder, CO, USA 80309-0430 {sumner, fahmad, bhushan, gu}@cs.colorado.edu 2 Project 2061, American Association for the Advancement of Science, 1200 New York Avenue, NW, Washington DC, USA 20005 {fmolina, twillard}@aaas.org 3 DLESE Program Center, University Corporation for Atmospheric Research, 3300 Mitchell Lane, Boulder, CO, USA {mwright, lynne} @ucar.edu 4 Alexandria Project, University of California, Santa Barbara, 1205 Girvetz Hall, Santa Barbara, CA, USA [email protected]
Abstract. Concept browsing interfaces can help educators and learners to locate and
use learning resources that are aligned with recognized learning goals. The Strand
Map Service enables users to navigate interactive visualizations of related learning
goals and to request digital library resources aligned with learning goals. These
interfaces are created using a programmatic web service interface that dynamically
generates interactive visual components. Preliminary findings suggest that these
library interfaces appear to help users stay focused on the scientific content of their
information discovery task, as opposed to focusing on the mechanics of searching.
1 Introduction
For the past decade there have been a series of reform
recommendations in science education calling for more emphasis on
inquiry-based pedagogies, and for the development of science
curriculum that emphasizes student understanding and making
connections between the ideas and skills students develop over time [1,
2]. Educational standards have emerged as a driving force behind these
reform efforts. Central to the standards movement is the need for a
description of the essential understandings that all students should
attain. Within the United States, the Benchmarks for Science Literacy,
developed by the American Association for the Advancement of
Science (AAAS), and the National Science Education Standards
(NSES), published by the National Research Council, present a clear
description, at the national level, of what all students should know and
be able to do across a spectrum of science, mathematics, technology,
and engineering disciplines [1, 3].
A primary purpose of the National Science Digital Library (NSDL) is
to help educators implement science education reforms [4, 5]. As
collections in NSDL grow, a critical challenge will be to provide
library interfaces and services that enable educators, designers of
curricular materials, and learners to locate resources that support
recognized standards and to integrate these resources into coherent
learning activities. Concept browsing interfaces, based on nationally
recognized standards, can address this challenge by helping educators
and learners to locate, comprehend and use educational resources in
NSDL. These interfaces provide navigational and orientational cues
that are typically lacking from traditional keyword or fielded search
interfaces. Prior research indicates that concept map representations are
useful cognitive scaffolds, helping users lacking domain expertise –
such as learners, new teachers, or educators teaching out of area – to
understand the macro-level structure of an information space [6, 7].
We are creating a web service interface to support the construction of
concept browsing interfaces based on the learning goals articulated in
Benchmarks for Science Literacy [1]. These learning goals, or
benchmarks, describe what learners should know, or be able to do, at
key stages in their education across the natural sciences, mathematics,
technology, and social sciences. Strand maps provide a visual
representation that emphasizes the coherence intended in the
benchmarks and invite both teachers and learners to make connections
between ideas. The Atlas of Science Literacy [8], published by AAAS
and the National Science Teachers Association, features strand maps on
topics important to science literacy (e.g., weather and climate, flow of
energy in ecosystems, or conservation of matter). Each map consists of
node-link representations illustrating a set of relationships between
benchmarks organized around a topic (Figure 1).
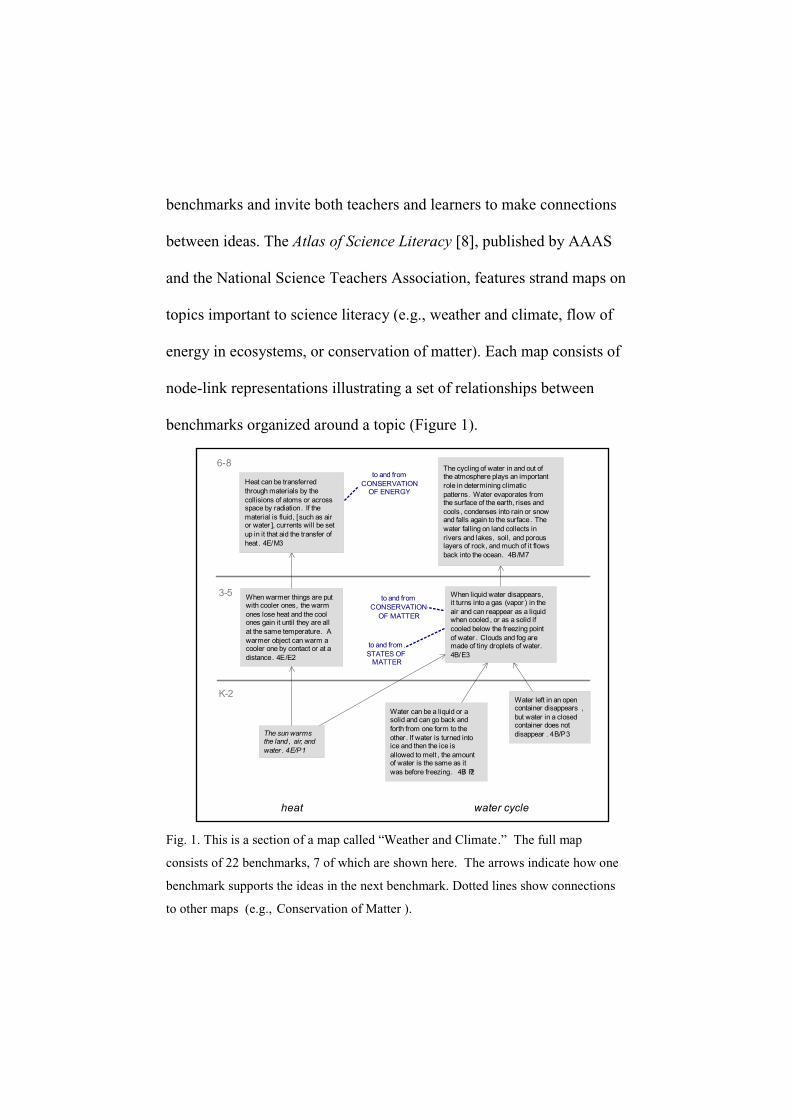
Fig. 1. This is a section of a map called “Weather and Climate.” The full map
consists of 22 benchmarks, 7 of which are shown here. The arrows indicate how one
benchmark supports the ideas in the next benchmark. Dotted lines show connections
to other maps (e.g., Conservation of Matter ).
to and from CONSERVATION
OF ENERGY
to and from CONSERVATION
OF MATTER
to and from STATES OF
MATTER
6-8
3-5
K-2
water cycleheat
Water left in an open container disappears , but water in a closed container does not disappear . 4B/P3The sun warms
the land , air, and water . 4E/P1
Water can be a liquid or a solid and can go back and forth from one form to the other . If water is turned into ice and then the ice is allowed to melt , the amount of water is the same as it was before freezing. 4B/ P2
When liquid water disappears, it turns into a gas (vapor ) in the air and can reappear as a liquid when cooled , or as a solid if cooled below the freezing point of water . Clouds and fog are made of tiny droplets of water. 4B/E3
The cycling of water in and out of the atmosphere plays an important role in determining climatic patterns. Water evaporates from the surface of the earth, rises and cools , condenses into rain or snowand falls again to the surface. The water falling on land collects in rivers and lakes, soil, and porous layers of rock, and much of it flows back into the ocean. 4B/M7
Heat can be transferred through materials by the collisions of atoms or across space by radiation. If the material is fluid, [such as air or water ], currents will be set up in it that aid the transfer of heat. 4E/M3
When warmer things are put with cooler ones, the warm ones lose heat and the cool ones gain it until they are all at the same temperature. A warmer object can warm a cooler one by contact or at a distance. 4E/E2
High-level descriptions of the benchmarks are provided in the nodes,
while the links depict the interrelationships between benchmarks. Each
map contains vertical strands reflecting key ideas in that topic (e.g.,
heat, water cycle, atmosphere, and climate change are strands within
the weather and climate map). Each strand is cross-referenced by grade
levels (K-2, 3-5, 6-8, 9-12) to illustrate how student understanding
develops over time.
2 The Strand Map Service
The Strand Map Service (the ‘Service’) builds on and extends the
significant knowledge base embodied in Benchmarks and the Atlas.
The Service supports the needs of two audiences through the provision
of two public interfaces: (1) graphical concept browsing interfaces for
use by K-12 educators and learners and (2) a programmatic web service
interface for use by digital library developers.
K-12 Educators and Learners
Strand maps are intended to help teachers and other educators design
coherent and comprehensive curricula, plan instruction, develop and
evaluate curricular materials, and construct assessment activities [8].
Maps also support teacher preparation and professional development:
teachers report that their own content knowledge is improved by
studying a map’s connections and that maps provide a helpful
perspective for reflecting on their own teaching practices (ibid). The
Service is being designed to support these traditional uses of the paper-
based maps, and to additionally enable educators and learners to locate
educational resources that support particular learning goals through
integration with digital library collections. Concept browsing interfaces
supported by the Service enable K-12 educators and learners to:
Discover educational resources that support nationally-
recognized learning goals (benchmarks)
Browse learning goals and their interconnections by exploring
interactive, concept map visualizations
Enhance their own content knowledge by examining
background information on learning goals, such as prior
research on student conceptions, related educational standards,
and assessment strategies to check student understanding.
Digital Library Developers
A programmatic web service interface enables digital library
developers to easily construct concept browsing interfaces appropriate
to the needs of their specific library audiences using dynamically
generated visual components provided by the Service. Thus, rather than
creating static presentations of strand maps, the Service generates
visualizations of maps and map components from information modeled
in the Service. Some of these components provide different ways of
viewing information specific to the AAAS information space, such as
views of individual maps, strands, sub-strands (the intersection between
a strand and a specific grade range), and benchmarks. Other
components support different ways of navigating through this
information space. These components were articulated and refined
using a user-centered design process described in [9].
3 An Example – DLESE
Figure 2 shows a demonstrator created using the Service for the Digital
Library for Earth System Education (DLESE – www.dlese.org). Users
can browse this interface using the pull down menus or by direct
manipulation of map elements. For instance, let’s assume that a middle
school teacher named Holly is planning a new unit on climate for her
8th grade integrated science class. Holly chooses to view the Weather
and Climate map by selecting it from the pull down menu. Browsing
the map, Holly learns that understanding that the Earth’s climate can
change is a key concept for learners in this grade range to grasp. She
zooms in on the climate change strand by selecting the strand name.
Benchmarks in this strand indicate that it is important for students to
understand that both human activities, such as logging, and natural
disasters, such as volcanic eruptions, can cause the climate to change.
She sees that it is important for her unit to emphasize that these changes
are sometimes abrupt and sometimes gradual in order to lay the
groundwork for studies of climate patterns in later grades.
Holly clicks on the benchmark about volcanic eruptions and climate
change and elects to retrieve educational resources in DLESE that
support this learning goal. As she looks through the search results, she
starts to wonder how much her students need to know about volcanoes
prior to starting this unit. She presses the related benchmarks button to
view all the pre-requisite and subsequent benchmarks, drawn from
across all the maps, related to the volcanic eruption and climate change
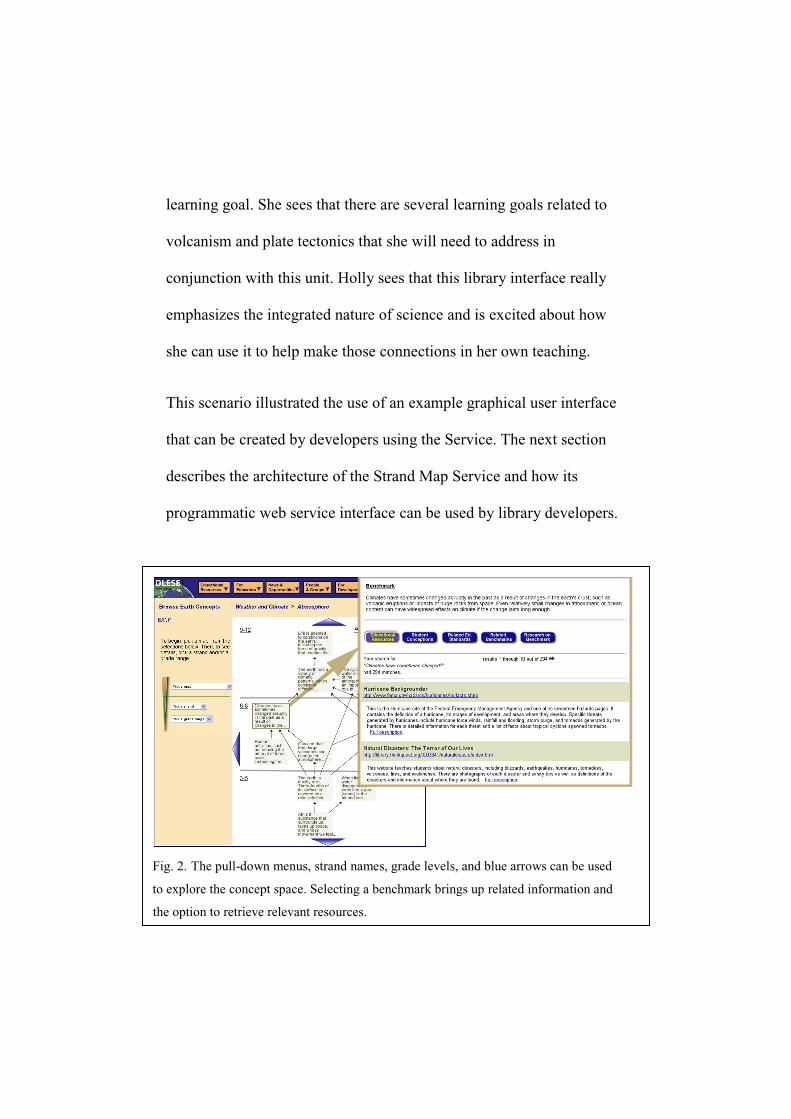
learning goal. She sees that there are several learning goals related to
volcanism and plate tectonics that she will need to address in
conjunction with this unit. Holly sees that this library interface really
emphasizes the integrated nature of science and is excited about how
she can use it to help make those connections in her own teaching.
This scenario illustrated the use of an example graphical user interface
that can be created by developers using the Service. The next section
describes the architecture of the Strand Map Service and how its
programmatic web service interface can be used by library developers.
Fig. 2. The pull-down menus, strand names, grade levels, and blue arrows can be used
to explore the concept space. Selecting a benchmark brings up related information and
the option to retrieve relevant resources.
4 Service Architecture and Protocol
Our approach builds on recent advances in visualization components
[10] and programmatic interfaces to knowledge organization systems
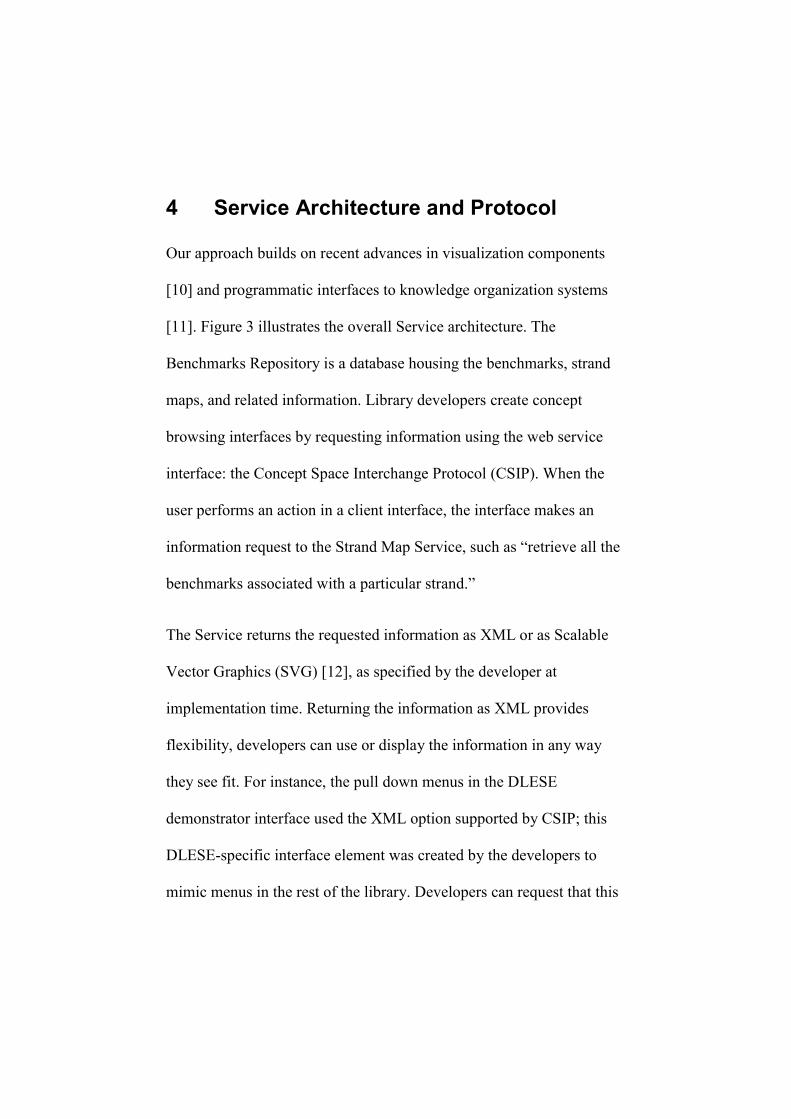
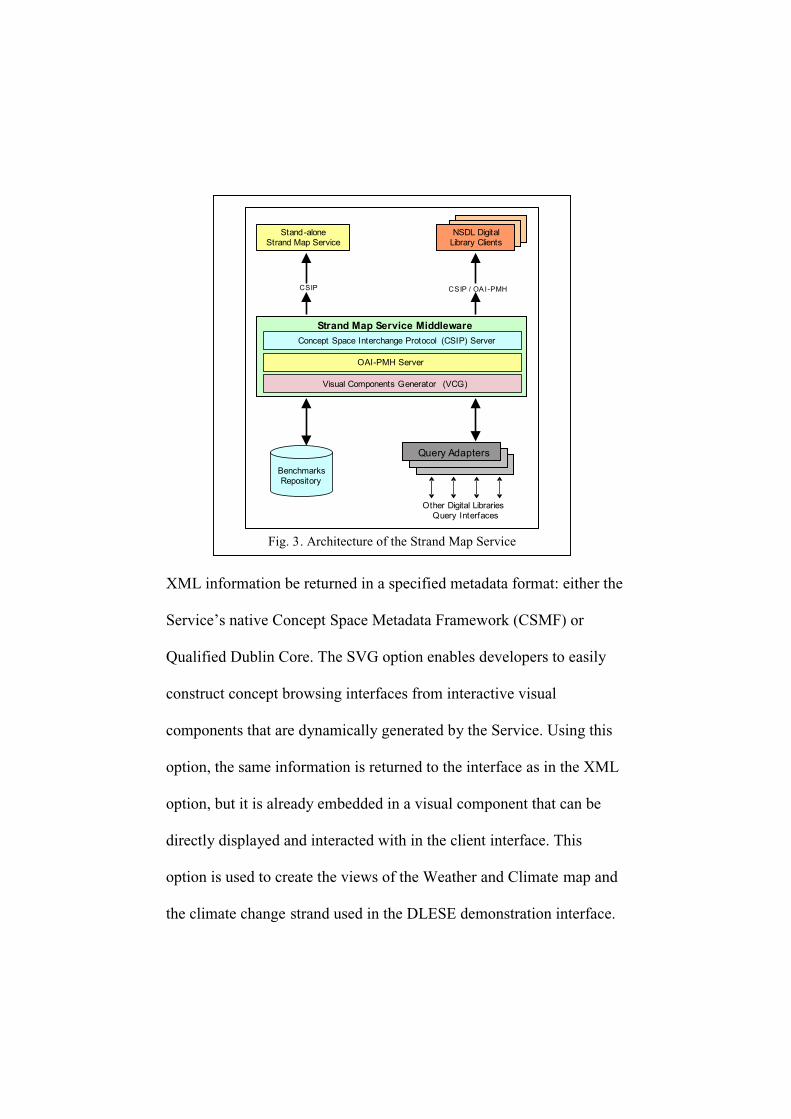
[11]. Figure 3 illustrates the overall Service architecture. The
Benchmarks Repository is a database housing the benchmarks, strand
maps, and related information. Library developers create concept
browsing interfaces by requesting information using the web service
interface: the Concept Space Interchange Protocol (CSIP). When the
user performs an action in a client interface, the interface makes an
information request to the Strand Map Service, such as “retrieve all the
benchmarks associated with a particular strand.”
The Service returns the requested information as XML or as Scalable
Vector Graphics (SVG) [12], as specified by the developer at
implementation time. Returning the information as XML provides
flexibility, developers can use or display the information in any way
they see fit. For instance, the pull down menus in the DLESE
demonstrator interface used the XML option supported by CSIP; this
DLESE-specific interface element was created by the developers to
mimic menus in the rest of the library. Developers can request that this
XML information be returned in a specified metadata format: either the
Service’s native Concept Space Metadata Framework (CSMF) or
Qualified Dublin Core. The SVG option enables developers to easily
construct concept browsing interfaces from interactive visual
components that are dynamically generated by the Service. Using this
option, the same information is returned to the interface as in the XML
option, but it is already embedded in a visual component that can be
directly displayed and interacted with in the client interface. This
option is used to create the views of the Weather and Climate map and
the climate change strand used in the DLESE demonstration interface.
Fig. 3. Architecture of the Strand Map Service
Stand-aloneStrand Map Service
Strand Map Service Middleware
y t
Concept Space Interchange Protocol (CSIP) Server
Query Adapters
BenchmarksRepository
CSIP / OA I-PMH
OAI-PMH Server
Visual Components Generator (VCG)
CSIP
Other Digital LibrariesQuery Interfaces
NSDL DigitalLibrary Clients
The Service middleware uses query adapters, designed to search over
different collections within NSDL, in order to locate resources that
support specific learning goals. The Service can retrieve resources in
several ways. First, resources can be retrieved that are indexed as being
aligned with a particular benchmark or benchmarks. Second, resources
can be retrieved that are indexed as being aligned with one or more
National Science Education Standards (NSES), using the mapping
between the benchmarks and the NSES captured in the Benchmarks
Repository. Third, resources can be retrieved using keywords and
audience information corresponding to a particular benchmark or
standard; this information is also modeled in the Benchmarks
Repository. These methods can be used individually or in combination.
For instance, the DLESE demonstrator uses a combination of the
second and third methods to increase the precision of the returned
results when searching over their collections.
The Concept Space Interchange Protocol
The CSIP design is based on the REpresentational State Transfer
(REST) style of web architecture [13]. This architectural style reflects
the stateless, document-centric view of the web. Each service request is
represented by a unique URL, and each request response is seen as a
transfer of representation in the form of a document. CSIP supports
three types of requests: (1) service description (which returns
information about the capabilities and version of this instance of the
Service), (2) submit resource (which is used to submit additional
benchmark information to the Service), and (3) query (which is used to
request AAAS information and visual components useful for creating
concept browsing interfaces). Libraries developers initiate requests
using either HTTP Get (for service description and submit resource
requests) or HTTP Post (for query requests) with a unique URL
associated with each of the three request types.
The protocol is divided into two parts: core and extension. CSIP-core
supports a limited set of queries called content queries. A content query
is similar to conventional queries where search is performed over
textual data without assuming any semantics. CSIP-extension supports
complex combinations of content queries using logical operators, and a
specialized navigational query type. A navigational query makes use of
the relations that are part of the AAAS concept maps; e.g., is-part-of or
contributes-to-achieving. The navigational query starts from one
benchmark and finds all objects that are related to the benchmark
through a specific relation. An example of a navigational query is to
find the ‘nearest neighbors’, i.e., the prerequisite and subsequent
learning goals for a particular benchmark, using the contributes-to-
achieving relation. This type of query is used to retrieve Related
Benchmarks in the DLESE demonstration interface. This query
illustrates how the Service can be used to generate new visualizations,
inherent in the Benchmarks Repository data model, that were never
published in the AAAS books.
To illustrate how developers create concept browsing interfaces using
CSIP, let’s consider three of the queries used to create the DLESE
demonstration interface. In this interface (Figure 2), the left hand pull
down menu displays all of the strand maps in modeled in the
Benchmarks Repository. The right hand frame displays requested map
components dynamically generated by the visualization system in SVG.
The generation of these left and right hand components is performed
when the client interface initiates a CSIP query. In the DLESE
example, the CSIP query used to generate the list of all strand maps
shown in the pull down menu is:
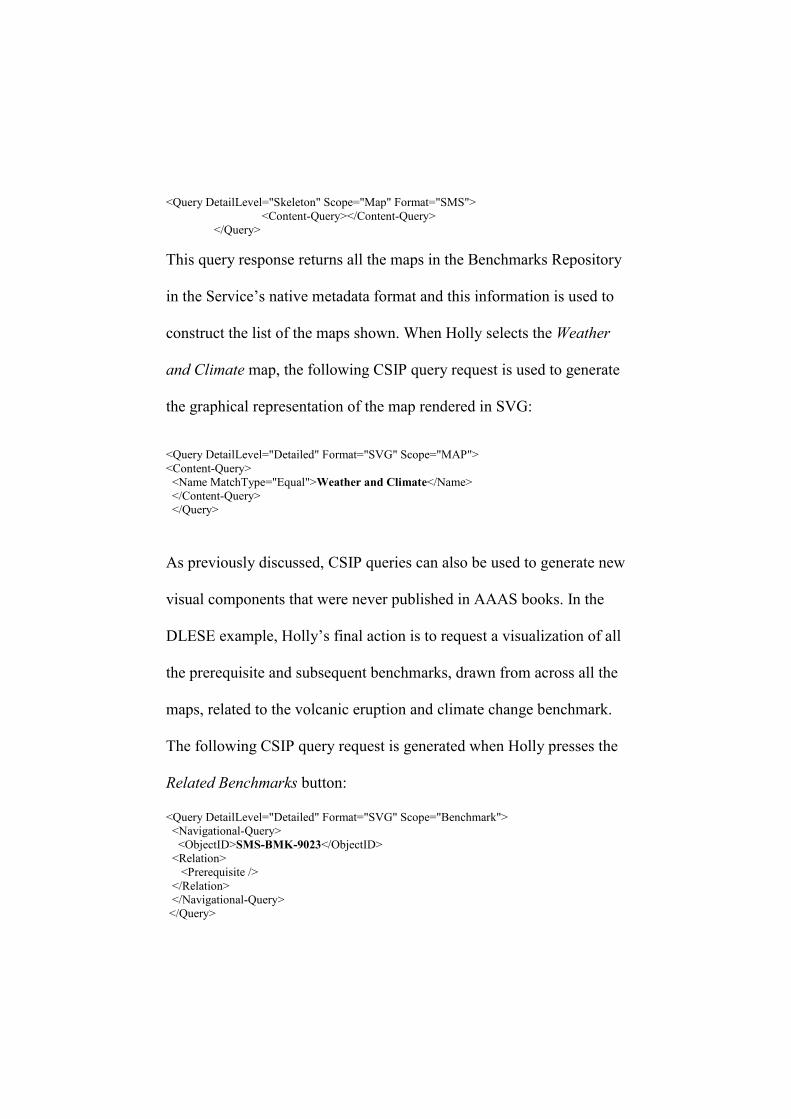
<Query DetailLevel="Skeleton" Scope="Map" Format="SMS"> <Content-Query></Content-Query> </Query> This query response returns all the maps in the Benchmarks Repository
in the Service’s native metadata format and this information is used to
construct the list of the maps shown. When Holly selects the Weather
and Climate map, the following CSIP query request is used to generate
the graphical representation of the map rendered in SVG:
<Query DetailLevel="Detailed" Format="SVG" Scope="MAP"> <Content-Query> <Name MatchType="Equal">Weather and Climate</Name> </Content-Query> </Query>
As previously discussed, CSIP queries can also be used to generate new
visual components that were never published in AAAS books. In the
DLESE example, Holly’s final action is to request a visualization of all
the prerequisite and subsequent benchmarks, drawn from across all the
maps, related to the volcanic eruption and climate change benchmark.
The following CSIP query request is generated when Holly presses the
Related Benchmarks button:
<Query DetailLevel="Detailed" Format="SVG" Scope="Benchmark"> <Navigational-Query> <ObjectID>SMS-BMK-9023</ObjectID> <Relation> <Prerequisite /> </Relation> </Navigational-Query> </Query>
In this navigational query, the “prerequisite” element in the “relation”
field is used to retrieve all the benchmarks that have this kind of
relation to the benchmark with the object ID of “SMS-BMK-9023”. All
the benchmarks that meet this requirement are retrieved from the
Benchmarks Repository and rendered in SVG.
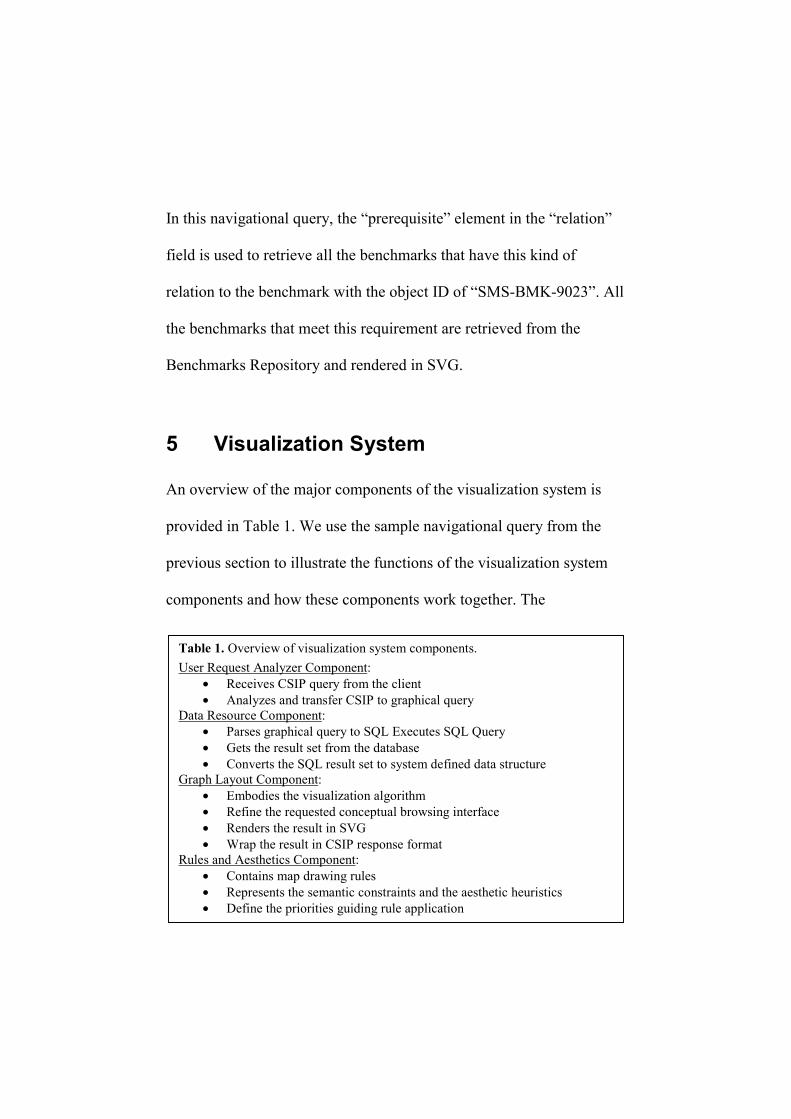
5 Visualization System
An overview of the major components of the visualization system is
provided in Table 1. We use the sample navigational query from the
previous section to illustrate the functions of the visualization system
components and how these components work together. The
Table 1. Overview of visualization system components. User Request Analyzer Component:
• Receives CSIP query from the client • Analyzes and transfer CSIP to graphical query
Data Resource Component: • Parses graphical query to SQL Executes SQL Query • Gets the result set from the database • Converts the SQL result set to system defined data structure
Graph Layout Component: • Embodies the visualization algorithm • Refine the requested conceptual browsing interface • Renders the result in SVG • Wrap the result in CSIP response format
Rules and Aesthetics Component: • Contains map drawing rules • Represents the semantic constraints and the aesthetic heuristics • Define the priorities guiding rule application
navigational query is first processed by the User Request
Analyzer Component. The Analyzer parses this query, and initiates a
request to the Data Resource Component to generate a visual
representation using the target benchmark and other benchmarks
related to it. The Data Resource Component uses an SQL query to
retrieve the related benchmarks and the inter-relationships between
these benchmarks from the Benchmarks Repository. The Data
Resource Component then converts the SQL result set to a tree based
data structure that sets the target benchmark to be the tree’s root and
other related benchmarks as its descendents. The Graph Layout
Component uses the visualization algorithm described below to
generate a ‘draft’ visualization. The Rules and Aesthetics Component
refines this draft representation and the final result is rendered in SVG
and wrapped as a CSIP response.
The core of the visualization system is the visualization algorithm used
by the Graph Layout Component. The design goals for this algorithm
were three-fold. First, the algorithm needed to generate all the visual
components identified in earlier user-centered requirements studies as
being desirable to support in CSIP v1.0 [9]. Second, the algorithm
needed to preserve both the semantics underpinning the strand maps
and the aesthetic standards of the AAAS human experts who made the
original maps. Third, the algorithm needed to extend the maps modeled
in the Atlas, by representing interdisciplinary relationships between
benchmarks and strands that cross map boundaries imposed in the two-
dimensional paper-based publications. Prior research in graph drawing
techniques informed the development of this algorithm since strand
maps are a form of directed acyclic graphs (DAGS) [14]. Strand maps
have unique features and aesthetics compared to other type of DAGS:
they have a relatively small number of nodes, the node size is
significantly larger in order to contain descriptions of the benchmarks,
and the vertical and horizontal alignment of groups of nodes is an
important semantic distinction that needs to be represented.
Our methodology for designing the visualization algorithm intertwined
expert knowledge acquisition activities, to inform algorithm design and
evaluation, with rapid prototyping. Our knowledge acquisition
activities involved analyzing the published maps and interviewing
professional strand map developers in order to articulate the semantic
constraints that needed to be preserved and the desirable aesthetic
heuristics used by human experts who created the published maps. The
resulting visualization algorithm uses tree-based processing, where a
strand map is viewed as consisting of a tree with multiple roots.
Breadth First Search is used to compute the vertical depth level of each
node relative to its nearest root. Depth First Search is used to compute
the horizontal relationships, across strands and within a strand, between
nodes at the same vertical depth. The results of these two searches are
combined to quantitatively identify internal relations between nodes.
These quantitative relations are then used to allocate nodes to
placements within a predefined grid that represents the available
drawing space. Where pairs of nodes conflict; e.g., the link between
two nodes may cross a third node and violate an aesthetic heuristic,
local placement adjustments are then made by moving the conflicting
node to the next available placement in the grid.
6 Evaluation
A small pilot study was conducted in order to begin to study the effect
of the Service’s concept browsing interfaces on the cognitive strategies
of users browsing a digital library like DLESE. Twelve undergraduate
psychology students participated in the study. Six were male, and six
were female. Half the participants performed the study using the
existing DLESE search engine (the nonStrandMaps group) available at
http://www.dlese.org, while the other half (the StrandMaps group)
performed the study using a Strand Maps interface to DLESE.
Participants in both groups were given the same set of 4 pre-determined
tasks to perform with the system. Each task required them to imagine
themselves as a teacher in a secondary school. They were asked to find
specific kinds of resources that they could use to teach certain specified
concepts. In order to study their cognitive strategies, participants were
asked to do a self-explanation while performing the tasks. A self-
explanation protocol aims to capture the representation of knowledge
that the user has [15]. Participants doing self-explanations have been
shown to make comments about the conditions under which specific
actions are advisable, the relationships between actions and goals, and
the consequences of actions [16]. During the self-explanation,
participants were asked to talk aloud about their choices while using the
system, and to verbalize the reasoning behind their actions. The audio
of this self-explanation was recorded for each participant. On average,
participants took 45-60 minutes to complete the study.
Findings
The self-explanation for all participants performing all the tasks
produced 110 pages of verbal transcripts. As a preliminary analysis,
two researchers performed multiple readings of these transcripts, from
which emerged patterns of comments that differ across the two groups.
It can be postulated that participants in the StrandMaps group used the
concept browsing interface as a tool rather than as a learning device,
but it was an effective tool. They read the benchmark text displayed in
nodes of the maps and compared it to the text of the tasks, thus using
the Strand Map interface to figure out which benchmark was
appropriate for their task. They also used the displayed benchmarks to
facilitate their decision process by analyzing and comparing the text in
different benchmark boxes. For example, one participant tasked with
finding a classroom activity related to the cause of earthquakes, said:
“…since he wants to talk about earthquakes, we’ll just go to [the] earthquakes and
volcanoes section..and he wants to find out the cause of earthquakes, so.. I’m reading
the different little boxes to find out which one sounds more related to why
earthquakes occur…Let’s see, this one talks about .. how the core of the earth is hot
and that’s what makes earthquakes and volcanic eruptions but .. this one says that
they also occur along boundaries with colliding plates, so I’m going to try this one…“
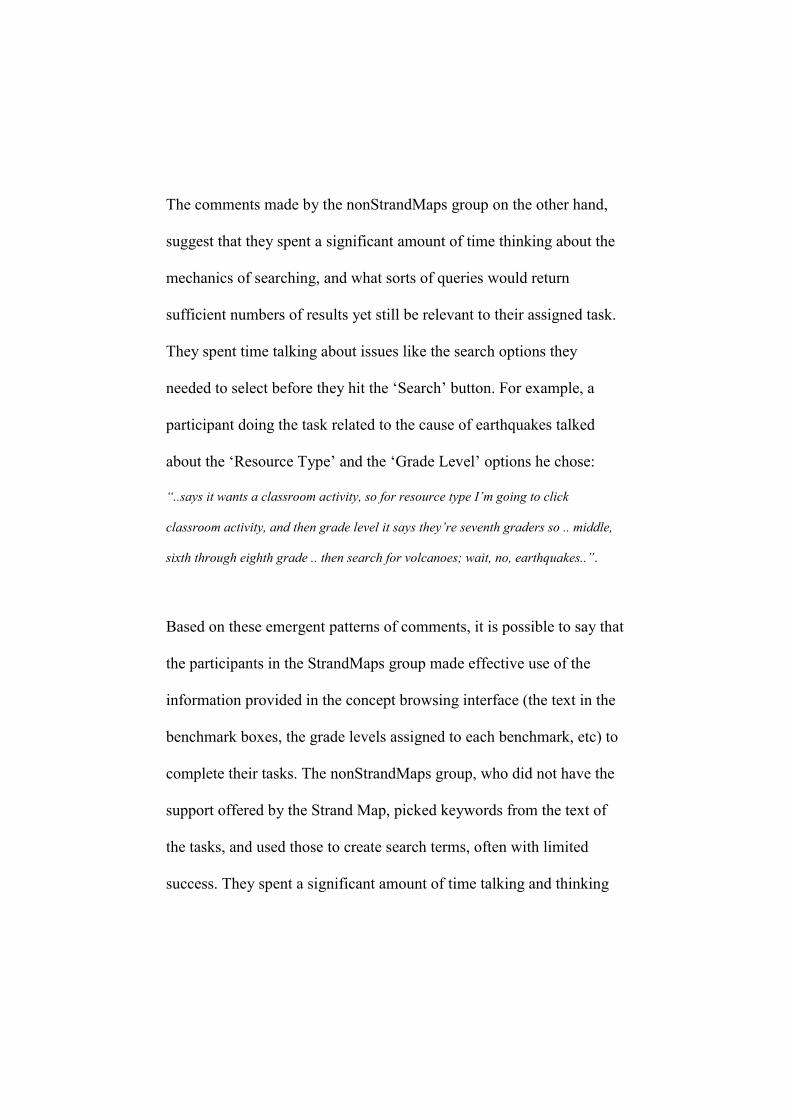
The comments made by the nonStrandMaps group on the other hand,
suggest that they spent a significant amount of time thinking about the
mechanics of searching, and what sorts of queries would return
sufficient numbers of results yet still be relevant to their assigned task.
They spent time talking about issues like the search options they
needed to select before they hit the ‘Search’ button. For example, a
participant doing the task related to the cause of earthquakes talked
about the ‘Resource Type’ and the ‘Grade Level’ options he chose:
“..says it wants a classroom activity, so for resource type I’m going to click
classroom activity, and then grade level it says they’re seventh graders so .. middle,
sixth through eighth grade .. then search for volcanoes; wait, no, earthquakes..”.
Based on these emergent patterns of comments, it is possible to say that
the participants in the StrandMaps group made effective use of the
information provided in the concept browsing interface (the text in the
benchmark boxes, the grade levels assigned to each benchmark, etc) to
complete their tasks. The nonStrandMaps group, who did not have the
support offered by the Strand Map, picked keywords from the text of
the tasks, and used those to create search terms, often with limited
success. They spent a significant amount of time talking and thinking
about how to translate their information seeking needs into suitable
search engine queries.
As future work, a propositional analysis of the verbal data will be
conducted, which entails separating the verbal data into complex
propositions, analyzing the types of processes present in the data, and
developing a formal method for identifying and scoring these processes
across participants [17]. This type of analysis would enable a finer-
grained identification and analysis of participants’ cognitive strategies.
7 Conclusions
Given the small number of study participants, the results presented here
should be viewed as descriptive in nature. However, these preliminary
findings underscore the potential value of this visualization approach to
digital libraries with an educational mission: these interfaces appear to
help users stay focused on the scientific content of their information
discovery task, as opposed to focusing on the mechanics of searching.
We attribute these results to the navigational and orientational cues
afforded by the strand maps. The merit of our approach lies in its
innovative use of web services technology to provide an educationally-
relevant visualization service across distributed library sites, as opposed
to creating a visualization interface for a single library. We hope that
concept browsing interfaces created with the Service will help teachers
and students to understand that science is not a list of facts to
memorize, but instead a rich network of ideas to explore.
Acknowledgements
This research is funded in part by the National Science Foundation
under NSF Award #0226286. Any opinions, findings, and conclusions
or recommendations expressed in this material are those of the
author(s) and do not necessarily reflect the views of the NSF.
References
[1] AAAS, Benchmarks for Science Literacy. New York: Project 2061, American
Association for the Advancement of Science, Oxford University Press, 1993.
[2] NRC, "Transforming Undergraduate Education in Science, Mathematics,
Engineering, and Technology Education," National Research Council, National
Academy Press, Washington, DC 1999.
[3] NRC, National Science Education Standards. Washington, DC: National Research
Council (NRC), National Academy Press, 1996.
[4] F. Wattenberg, "A National Digital Library for Science, Mathematics, Engineering,
and Technology Education," in D-Lib Magazine, vol. 5. Arlington, VA, 1998,
http://www.dlib.org/dlib/october98/wattenberg/10wattenberg.html#contents.
[5] L. L. Zia, "The NSF National Science, Technology, Engineering, and Mathematics
Education Digital Library (NSDL) program: New projects and a progress report," D-
Lib Magazine, vol. 7, 2001.
[6] R. H. Hall, M. A. Hall, and C. B. Saling, "The effects of graphical postorganization
strategies on learning from knowledge maps.," Journal of Experimental Education,,
vol. 67, pp. 101-112, 1999.
[7] A. M. O'Donnell, D. F. Dansereau, and R. H. Hall, "Knowledge Maps as Scaffolds
for Cognitive Processing," Educational Psychology Review, vol. 14, pp. 71-86, 2002.
[8] AAAS, Atlas of Science Literacy. Washington, DC: Project 2061, American
Association for the Advancement of Science, and the National Science Teachers
Association, 2001.
[9] T. R. Sumner, S. Bhushan, F. Ahmad, and Q. Gu, Designing a Language for Creating
Conceptual Browsing Interfaces for Digital Libraries. in ACM/IEEE Joint Conference
on Digital Libraries (JCDL '03), (Houston, Texas (May 27-31), 2003), 258-260.
[10] C. North and B. Schneiderman, "Snap-together visualization: can users construct and
operate coordinated visualizations?," International Journal of Human Computer
Studies, vol. 53, pp. 715-739, 2000.
[11] C. Binding and D. Tudhope, "KOS at your Service: Programmatic Access to
Knowledge Organisation Systems," Journal of Digital Information, vol. 4,
http://jodi.ecs.soton.ac.uk/Articles/v04/i04/Binding/, 2004.
[12] W3C, "Scalable Vector Graphics (SVG) 1.1 Specification," Ferraiolo, Jon, Fujisawa,
Jun, and Jackson, Dean, [http://www.w3.org/TR/SVG/], Last accessed: 10 April,
2004
[13] R. T. Fielding and R. N. Taylor, "Principled Design of the Modern Web
Architecture," ACM Transactions on Internet Technology, vol. 2, pp. 115 - 150,
2002.
[14] I. G. Tollis, G. Di Battista, P. Eades, and R. Tamassia, Graph Drawing: Algorithms
for Visualization of Graphs, 1st ed., New Jersey: Prentice Hall, 1998.
[15] M. Chi, N. d. Leeuw, M.-H. Chiu, and C. LaVancher, "Eliciting Self-Explanations
improves understanding," Cognitive Science, vol. 18, pp. 439-477, 1994.
[16] K. VanLehn, R. M. Jones, and M. T. H. Chi, "A model of the self-explanation effect,"
Journal of the Learning Sciences, vol. 2, pp. 1-59, 1992.
[17] M. Chi, "Quantifying qualitative analyses of verbal data: A practical guide," Journal
of the Learning Sciences, vol. 6, pp. 271-315, 1997.
Related Documents


