Chapter Ten Linking Economic and Political Opportunities in Nondemocracies Maryjane Osa and Cristina Corduneanu-Huci Do changing economic conditions create political instability? This is an old question, posed over a century ago by Alexis de Tocqueville (2001) in his clas- sic study of France’s Old Regime. In the post–World War II world, economists and political scientists were particularly concerned that decolonialization and economic modernization in the developing countries might threaten world stability. By the early 1980s, sociologists and others had spent more than a decade debunking theories of modernization, and the political development literature was considered passé. Social science seemingly had wearied of the question and had moved on to sexier topics: iterative strategic games, the structure/agent problem, political opportunity, and contention. But the cri- tiques never destroyed the conventional wisdoms: economists still believed that growth rates and inequality affect political stability (Alesina et al.1996; Venieris and Gupta 1983) and political scientists asserted that economic con- ditions affect voting and support for political institutions (Hibbs 1987a; Hibbs 1987b; Keech 1995); many sociologists have simply abandoned the field and moved on—to political opportunity and culture (McAdam, McCarthy, and Zald 1996; Goodwin and Jasper 2004). chap10.p65 11/20/2004, 3:48 PM 177

Welcome message from author
This document is posted to help you gain knowledge. Please leave a comment to let me know what you think about it! Share it to your friends and learn new things together.
Transcript
Chapte r Ten
Linking Economic and PoliticalOpportunities in Nondemocracies
Maryjane Osa and Cristina Corduneanu-Huci
Do changing economic conditions create political instability? This is an oldquestion, posed over a century ago by Alexis de Tocqueville (2001) in his clas-sic study of France’s Old Regime. In the post–World War II world, economistsand political scientists were particularly concerned that decolonialization andeconomic modernization in the developing countries might threaten worldstability. By the early 1980s, sociologists and others had spent more than adecade debunking theories of modernization, and the political developmentliterature was considered passé. Social science seemingly had wearied of thequestion and had moved on to sexier topics: iterative strategic games, thestructure/agent problem, political opportunity, and contention. But the cri-tiques never destroyed the conventional wisdoms: economists still believedthat growth rates and inequality affect political stability (Alesina et al.1996;Venieris and Gupta 1983) and political scientists asserted that economic con-ditions affect voting and support for political institutions (Hibbs 1987a; Hibbs1987b; Keech 1995); many sociologists have simply abandoned the field andmoved on—to political opportunity and culture (McAdam, McCarthy, andZald 1996; Goodwin and Jasper 2004).
chap10.p65 11/20/2004, 3:48 PM177
MARYJANE OSA AND CRISTINA CORDUNEANU-HUCI
178
In his writings on state building, Charles Tilly shows how links betweeneconomic development and politics are causally interactive rather thanunidirectional. Tilly’s work on European state formation demonstrates howconcentrations of capital and of coercion created a sociological nexus ofpolitical interaction which set the developmental trajectory of the nationstate (Tilly 1975a; Tilly 1990; Tilly 1995a). More recently, Tilly and his col-laborators Sidney Tarrow and Doug McAdam have called for a refocusingof research to delineate recurrent mechanisms and processes—of signifi-cance in state building but found also in forms of collective action such asethnic conflict, democratization, and revolution (McAdam, Tarrow, and Tilly2001). Stimulated by the Tillian debates, our inquiry takes up, once again,the linkage between economic change and political contention.
In this chapter, we first review the literature on economic developmentand political instability. Second, we discuss the trend toward a more inten-sive concern with political opportunity structures and how this recent lit-erature can be reconnected with the earlier research on modernization. Wefocus explicitly on nondemocratic cases, to avoid the overemphasis onWestern Europe usually found in research on social mobilization. Third,we discuss our data set and explain the qualitative comparative analysis(QCA) method that we use for our empirical analysis. Fourth, we presentthe results of the comparative analysis of our twenty-four nondemocraticcases, identifying linked political economic conditions associated withmobilization. Finally, we discuss how economic conditions may be con-nected to political opportunities and constraints.
From Modernization to Globalization
In The Old Regime and the French Revolution, Alexis de Tocqueville (2001)argues that the French did not revolt because economic hardships had be-come intolerable under Louis XVI. On the contrary, the Revolution camewhen economic conditions had improved. The king himself destroyed theancient institutions of feudalism and then he revoked newly granted liber-ties. It was the rollback of the royal reforms that demonstrated to his sub-jects the arbitrariness and the vulnerability of the system. Thus, Tocquevillesees the general economic condition refracted through political institutionsand public perceptions of opportunity/threat.
The political development literature in the 1970s picked up onTocqueville’s themes in research on modernizing polities. Gurr (1970), forexample, argues that in a period of economic expansion, individuals’ ex-pectations of future improvements rise faster than the economy’s ability tosatisfy their increased demands. This leads to social frustration, which isexpressed as political violence (see also Davies 1962). Hibbs (1973) argues,on the basis of cross-national empirical research, that low economic growth
chap10.p65 11/20/2004, 3:48 PM178
LINKING ECONOMIC AND POLITICAL OPPORTUNITIES IN NONDEMOCRACIES
179
increases popular dissatisfaction and creates incentives for antigovernmentalactivities. Huntington (1968) focuses on the modernization process as a majorsource of social frustration and political instability. According to him, the ef-forts to achieve modernity through rapid economic accumulation led to ashift in loyalties, social disruption, and mass participation. Usually, in thisliterature it is assumed that economic changes influence political develop-ment through a social-psychological mechanism of frustration/aggression.The outcome of this process is political instability.
The vast literature on modernization and economic development alsoposits a link between growth and political stability. There are two mainarguments. Some researchers contend that low growth increases inequal-ity and the likelihood of political instability (Alesina et al. 1996; Hibbs 1973;Londregan and Poole 1990; Venieris and Gupta 1983). Others argue thatvery rapid growth puts stress on society, which is thrown into disequilib-rium that political institutions are unable to contain (Kornhauser 1959; Hun-tington 1968).
Dependency theory’s appeal peaked in the late 1970s. Dos Santos,Cardoso, and others held that low growth in the less developed (especiallyLatin American) countries was due to the structural inequalities of worldcapitalism that created enduring relations of dependence (Cardoso andFaletto 1979; Dos Santos 2000; Galtung 1980). Influenced by Marxist eco-nomics (Gunder Frank 1980; Prebisch 1986) and with a strong affinity toworld system theory (Hopkins 1982; Wallerstein 1974), the dependencyframework stimulated a wealth of empirical research, much of it inconclu-sive (Bardhan 2003; Cardoso and Helmege 1997; Ghosh 2001). In the 1980s,the ascent of the “Asian Tigers” economic boom (in Taiwan, South Korea,Hong Kong, Singapore) challenged the validity of this perspective (Kim1998). From the dependencia perspective, the Asian Tigers were peripheralcountries that should have been constrained by their colonial histories. Ifdependence endures because of the structure of world capitalism, how doesone explain the surge of the Asian economies?
With the collapse of the Second World socialist economies (1989–1991)and the global boom of the nineties, sociologists shifted their attention fromeconomic to political sources of contention. Social movements researchers,in particular, treated economic conditions as background factors that maycontribute to the opening of political opportunity. Social movement litera-ture in the nineties was concerned increasingly with the formations of po-litical networks, institutions, and culture that might influence social per-ceptions of threats and opportunities (Meyer 2004; Tarrow 1998b). Someresearchers are now combining these concerns with attention to mecha-nisms and processes within defined episodes of contention. (See chap. 7,this volume.) In the social movement literature, economic conditions havebeen subsumed, for the most part, either under opportunity conditions orunder grievances that are brought to the forefront of social movements.
chap10.p65 11/20/2004, 3:48 PM179
MARYJANE OSA AND CRISTINA CORDUNEANU-HUCI
180
Economic grievances are expressed by catalyzing events (e.g., protestsagainst price increases or for better working conditions) or as part of fram-ing processes during movement mobilization.
In sum, the scholarly literature linking economic development and po-litical stability has evolved considerably, with different schools proposingvarious types of connections. Modernization theorists were concerned withthe effects of social strain on rapidly growing economies; economists ar-gued that economic dislocations would undermine political stability; po-litical development scholars focused on social-psychological mechanismsthat could convert economic dissatisfaction into political unrest; depen-dency and world systems analysts investigated how core states’ structuraladvantages stabilized an international system of economic inequality. So-cial movement scholars downplayed the causal influence of economic con-ditions and gave priority to political opportunities. No single theory hasmanaged to capture the significant ways in which economic conditions cre-ate contexts for mobilization. All the foregoing, however, have stimulatedempirical research, producing further insights and questions. In this chap-ter, we take a fresh look at the problem. We attempt to isolate specific con-figurations of economic conditions that are associated with “political insta-bility” in nondemocratic regimes at the height of their coercive power. Thus,we hope to assess the political impact of specific economic conjunctures forauthoritarian rule..
Our Project: Opportunity Structures in Nondemocracies
Stable democracies historically have been rare achievements. Yet most ofthe research on mobilization by social movement analysts has focused onpostwar Western Europe and North America. Western liberal states havegreat institutional advantages for groups hoping to challenge governmentpolicies: uncensored mass media, independent courts, freedom of associa-tion and combination, and access to elected officials.
Studies of nondemocratic regimes usually focus on their transition todemocracy, the point at which authoritarian controls have broken down.Consequently, we know least about the ways in which populations livingunder rigid nondemocratic governments (e.g., authoritarian dictatorships,one-party states, Leninist regimes) are able to mobilize in protest. And it isprecisely here, in nondemocracies, that political violence is most expectedbecause there are few institutional alternatives to express dissent. Sincethere are few mediating institutions for conflict resolution and no mecha-nism for regular, legitimate transfers of power (i.e., free elections), it is inthese cases that we should see the most direct influence of economics onmobilization. Thus, we have chosen a set of stable nondemocracies for ourstudy.
chap10.p65 11/20/2004, 3:48 PM180
LINKING ECONOMIC AND POLITICAL OPPORTUNITIES IN NONDEMOCRACIES
181
There are good reasons why research on nondemocracies is scarce. Sincenondemocratic regimes lack public oversight, they are not compelled tocollect or issue statistical information that could reveal the shortcomings oftheir rule. The official data released by these regimes are often unreliable,or simply missing. Nor do authoritarian dictatorships welcome indepen-dent researchers who may be able to collect their own data to fill in theblanks. Consequently, there is an inherent difficulty in studying these cases—and the quality of the available data is vastly inferior to those data setsused for research in American politics.
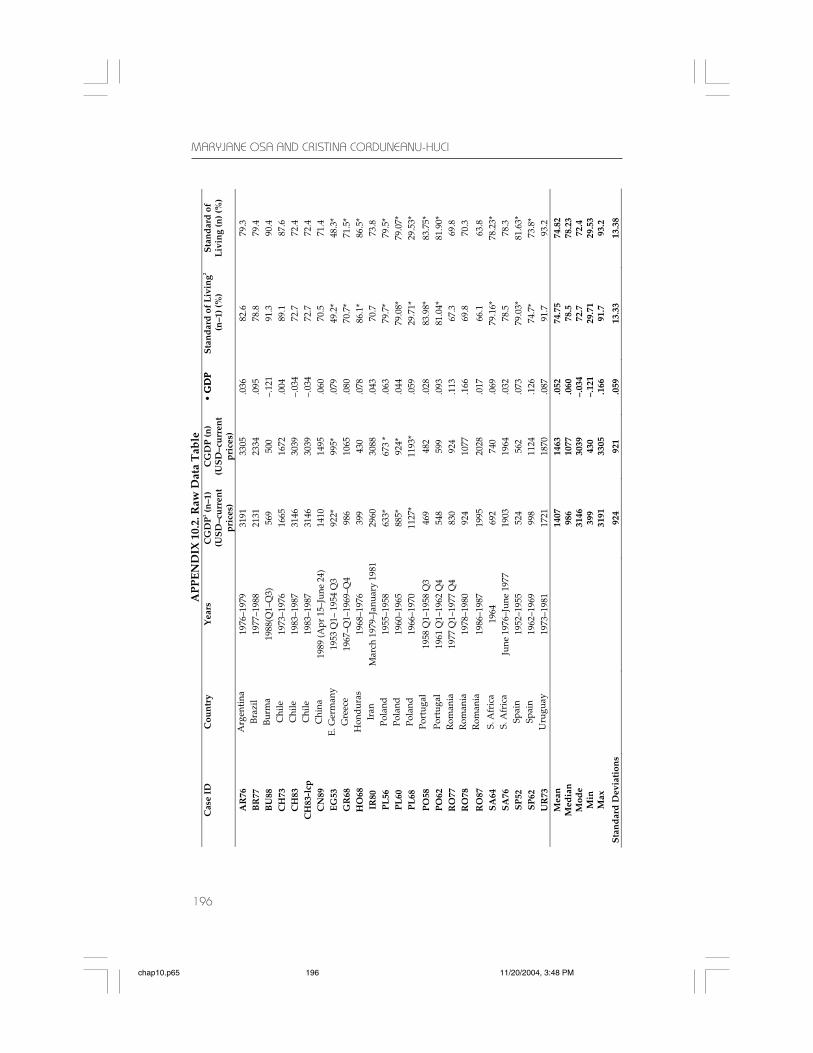
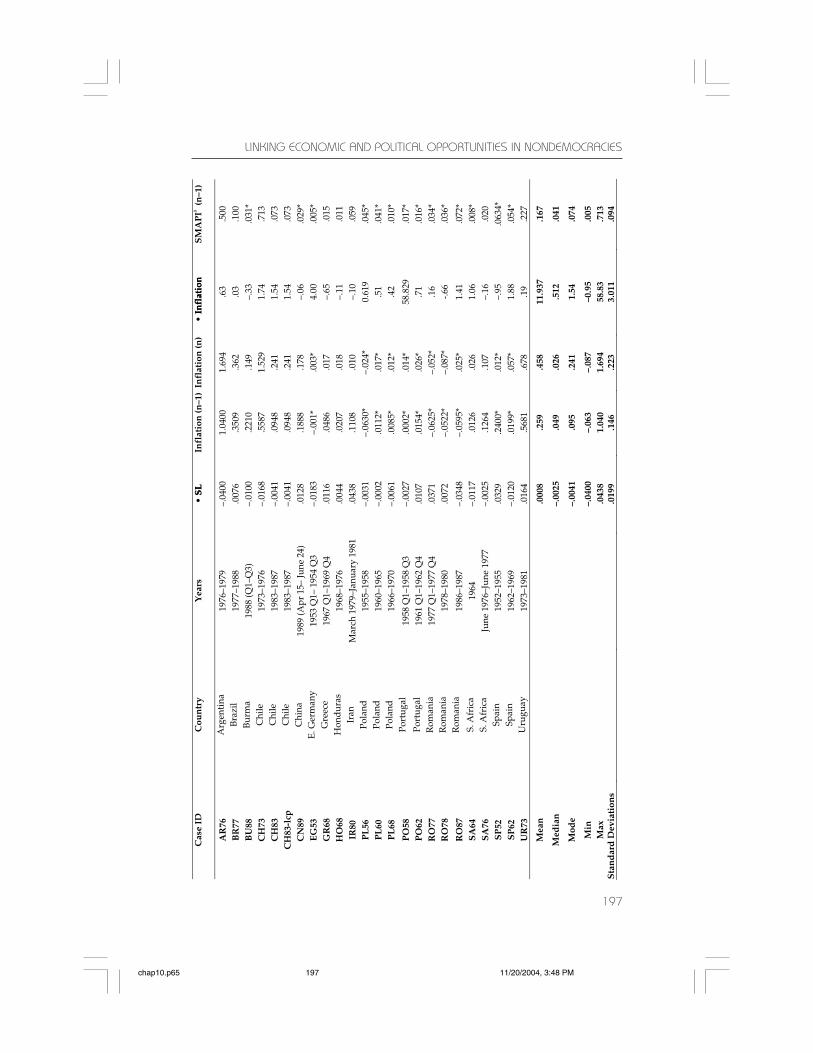
In democracies, both the electoral and the economic data are publicly avail-able, systematically comparable, and reliable, but in authoritarian states, re-searchers face the dilemma of a trade-off between data availability and/orcomparability. The cross-national official and scientific sources (see appendix10.2 and bibliography) offer few available data points for nondemocracies,while the national statistical yearbooks, as well as election or protest datafrom these countries, are not reliable. Moreover, the reported macroeconomicindicators are not always comparable because of their computational formu-las: for example, while democracies generally report the gross domestic prod-uct (GDP) as a standardized measure of their material wealth, the communistcountries replace it with gross material product or national income in theirnational accounts. In consequence, cross-national statistical analyses of thesecases are impossible. In our study, we circumvent these problems by using aqualitative comparative method that allows us to convert numerical (or sta-tistical) indicators into qualitative measures that are comparable across ourcases. We improve reliability by consulting multiple data sources for each ofour cases.
This chapter builds on our earlier study of political opportunity struc-tures in nondemocracies (Osa and Corduneanu-Huci 2003). We gathereddata on twenty-four episodes of mobilization/no mobilization in fifteennondemocractic states. All cases from our data set occur during the ColdWar (1948–1989) but vary according to type of nondemocratic regime (e.g.,military regimes, state socialist regimes, bureaucratic authoritarian regimes)and region (including Eastern and Southern Europe, Latin America, theMiddle East, sub-Saharan Africa, and East Asia).1
We ask whether the conjunction of economic factors other researchersbelieve to be causal may be associated with political instability—or in amore positive phrase, social mobilization—in the nondemocratic regime.
Qualitative Comparative Method
The method of qualitative comparative analysis developed by Charles Ragin(1987, 1995, 2000) is well suited for an exploratory analysis of economicopportunity conditions in nondemocratic settings. It allows for detailed,contextual comparisons of more countries than is usual in comparative case
chap10.p65 11/20/2004, 3:48 PM181
MARYJANE OSA AND CRISTINA CORDUNEANU-HUCI
182
studies. QCA assumes that social (and political) causality is nonlinear, in-terdependent, and heterogeneous—a much more realistic set of assump-tions for our cases than those underlying regression analysis.
Our database consists of twenty-four cases, drawn from fifteen nondemo-cratic countries. Eighteen cases resulted in social mobilization (SOCMOB = 1)and six cases resulted in the nonoccurrence of mobilization (SOCMOB = 0).QCA takes the raw data matrix of nominal-scale variables coded in a bi-nary form and reconstructs it as a truth table. (For the truth table matrix,see appendix 10.1. The raw data appear in appendix 10.2.) The truth tablecomprises a number of rows (2n where n = the number of independentvariables) representing all logical combinations of values on the indepen-dent variables. The number of empirical cases corresponding to each rowcan vary between 0 and n. The program first takes the raw data matrix andtransforms it into a truth table in which the nonexistent logical combina-tions are added to the empirical instances. The minimization algorithm startswith the raw data matrix and, by eliminating redundant factors via astepwise comparison of case pairs, it produces the “prime implicants,” theminimum sets of conditions considered necessary for producing a certainoutcome (0 or 1 on the dependent variable). The underlying logic of com-parison for this algorithm is derived from John Stuart Mill’s methods ofagreement and difference combined (Mill 1974).
A potential problem with this method is the existence of contradictions,that is, a pair of cases where the same set of causal conditions leads toopposite outcomes. Ragin (1987: 113–18) suggests a number of options fordealing with this problem. The first option ignores the contradiction, giventhat the same set of conditions causes both a positive and a negative out-come. In practice, the two contradictory cases are removed from the truthtable. The second option, more generous analytically, is based on the as-sumption that the probability of occurrence of any given outcome in thecontradiction is 0.5. Only one case from the contradictory pair is includedin the truth table. When the positive outcome is considered, the positivecase is included; when the negative outcome is analyzed, the negative caseis included. The third alternative incorporates the contradictions in theminimization algorithm. The analyst reviews the contradictions on a case-by-case basis for missed idiosyncrasies. Since the economic conditions maynot be independent of political factors for our cases, we are adopting thethird alternative.
In short, by using the Boolean methods of qualitative comparative analy-sis, we can manage the complexity of our cases while considering the rel-evant factors in all their logical combinations. We can thus identify the eco-nomic configurations in authoritarian countries that appear with theoccurrence of the dependent variable, social mobilization. By analyzingthese conjunctions, or prime implicants, we are able to identify patterns inour data that may support others’ research findings or imply specific causal
chap10.p65 11/20/2004, 3:48 PM182
LINKING ECONOMIC AND POLITICAL OPPORTUNITIES IN NONDEMOCRACIES
183
relations. This allows us to generate empirically grounded hypotheses thatcan be tested when good-quality data become available.
Variables
To explain economic opportunities for social mobilization in nondemocraticcontexts, we tested a number of models using the variables suggested bythe foregoing literature review: economic growth, standard of living, in-equality (using three different measures), trade openness, inflation, andinflation uncertainty. Clearly, for a data set with only twenty-four cases, weneeded to reduce the number of independent variables. The following is adiscussion of the variables that we used for the final model, including adiscussion of our strategies for data reduction.
Dependent Variable: SOCMOB. We defined “social mobilization” as an episodeof collective action by participants (drawn from nonelite or repressed seg-ments of society) opposed to state policy. This is a broader definition thanSchock (1999: 357) uses; he requires a high numerical threshold for partici-pation (more than ten thousand participants). Since we wanted to includesemiclandestine attempts at oppositional mobilization (e.g., human rightsorganizing in Latin America) and neighborhood-level mobilizations (e.g.,poor people’s movements in Honduras and Iran), we opted for a moreinclusive definition. Although human rights organizing and the occupa-tion of buildings may seem qualitatively different from the traditional in-dicators of mobilization (e.g., strikes, demonstrations), in authoritariancontexts they are all manifestations of high-risk/high-cost political action(McAdam 1988).
To create our data set, we set boundaries around the sequences of mobi-lization (or their absence) that define our cases. We identified the first ma-jor episode of contention after the consolidation of the fifteen nondemo-cratic regimes by graphing political contention (a composite variable thatincludes strikes, demonstrations, riots, and armed attacks) event countsfrom the World Handbook III (1985) to find mobilization peaks and troughs.Because of well-known problems with data coding in the World Handbookof Political and Social Indicators III (Diani 1992), we did not use event countsas a cross-national measure; rather, we relied on the World Handbook to pointto source data and significant (newsworthy) events. Once we had locatedthe periods of contention and quiescence, we turned to the descriptive areastudies literature to learn more about catalytic events (or events of majorsignificance) that would shed light on the mobilization contents. This sec-ondary literature usually contained area experts’ periodizations that fur-ther explained the different phases of repression and contention. Finally,where area specialists contradicted the World Handbook data, we coded ourcases on the basis of the area analysts’ writings.
chap10.p65 11/20/2004, 3:48 PM183
MARYJANE OSA AND CRISTINA CORDUNEANU-HUCI
184
Independent Variables. Since the QCA method proceeds by comparing andreducing conditions to their most parsimonious configurations, the correctselection of conditions is paramount for achieving reliable results (Amentaand Poulsen 1994). The economic growth literature and political develop-ment studies provide a host of macroeconomic variables suggested by vari-ous theories linking economic conditions and political instability. Here wepresent the various measures and our rationale for selecting those used inthe model.
Growth is the most general indicator of a country’s economic well-be-ing. In capitalist countries, this is usually measured as real GDP per capita(Heston, et al. 1995; Heston, Summers, and Aten 2002). However, for thestate socialist economies during the 1950s and 1960s (Poland, Romania,and East Germany), equivalent data do not exist. To fill in the data pointson real GDP per capita for these cases, we substituted the national incomeor gross material product (GMP) as reported in the statistical yearbooks ofeach country. (See appendix 10.2 for the raw economic data used in com-puting the QCA truth table.) Although these data are unreliable for cross-national statistical analyses, they are adequate for our purposes. Since weare mainly interested in the dynamics (annual expansion or contraction ofthe economy) and not absolute values, we converted the economic data(continuous variables) into discrete (dichotomous) variables: 1 for increas-ing GDP (GMP, or national income) per capita and 0 for decreasing.
Standard of living is an alternative measure of a country’s well-beingthat gives a more realistic view of the gap between richer and poorer coun-tries. Following Heston and Summers (1995), we compute a population’sstandard of living (SLpop), as public consumption + private consumption –military expenditures/GDP. SLpop is smaller than the overall economic ca-pacity as measured by the GDP of the population. For thirteen cases, wedrew from Penn World Tables 5.6 (Heston et al. 1995); for the eleven casesnot included in the Penn World tables, we gathered data from other sourcesand calculated the SLpop measure based on information on consumptionshare of GDP and military expenditures. (See appendix 10.2.)
Although GDP growth and standard of living are often used in econo-mists’ models to predict political stability, when we included both thesevariables in our QCA analysis, the results were nonparsimonious anduninterpretable. However, when we combined these measures to create anew variable, GDPGAP, the results were much improved. There are theoreti-cal reasons why this new variable would have greater explanatory power.First, GDP per capita growth by itself is not a relevant indicator of accumu-lation if the actual consumption is going down (SL decrease). By combin-ing it with the SLpop dynamic, we measure meaningful growth. Second,whenever there is a gap between rates of GDP growth and SLpop decrease, itmeans that the military expenditures are increasing; these are also associ-ated with repressive dynamics of the states we are analyzing.
chap10.p65 11/20/2004, 3:48 PM184
LINKING ECONOMIC AND POLITICAL OPPORTUNITIES IN NONDEMOCRACIES
185
Inflation volatility (called inflation uncertainty in the literature)2 tapsinto domestic conditions that directly affect households and figure promi-nently in a regime’s economic program. In our QCA analysis, using infla-tion itself, or using it jointly with inflation volatility, gave nonparsimoniousresults. Inflation volatility better captures the potential impact of inflationon the economy over time, so it was included in the final model. Inflationvolatility (INFLVOL) indicates a historical trajectory of inflation; a high INFLVOL
value means that a significant leap in inflation is imminent but that thevolatility of the situation is such that no prediction of future inflation wouldbe reliable. Inflation volatility is a time series estimation computed as thestandard deviation (SD) of inflation in overlapping seven-year periods. ForINFLVOL, twelve data points were unavailable in Fischer 1993, so we com-puted them by hand based on the inflation values that we had from othersources.3 (See appendix 10.2.)
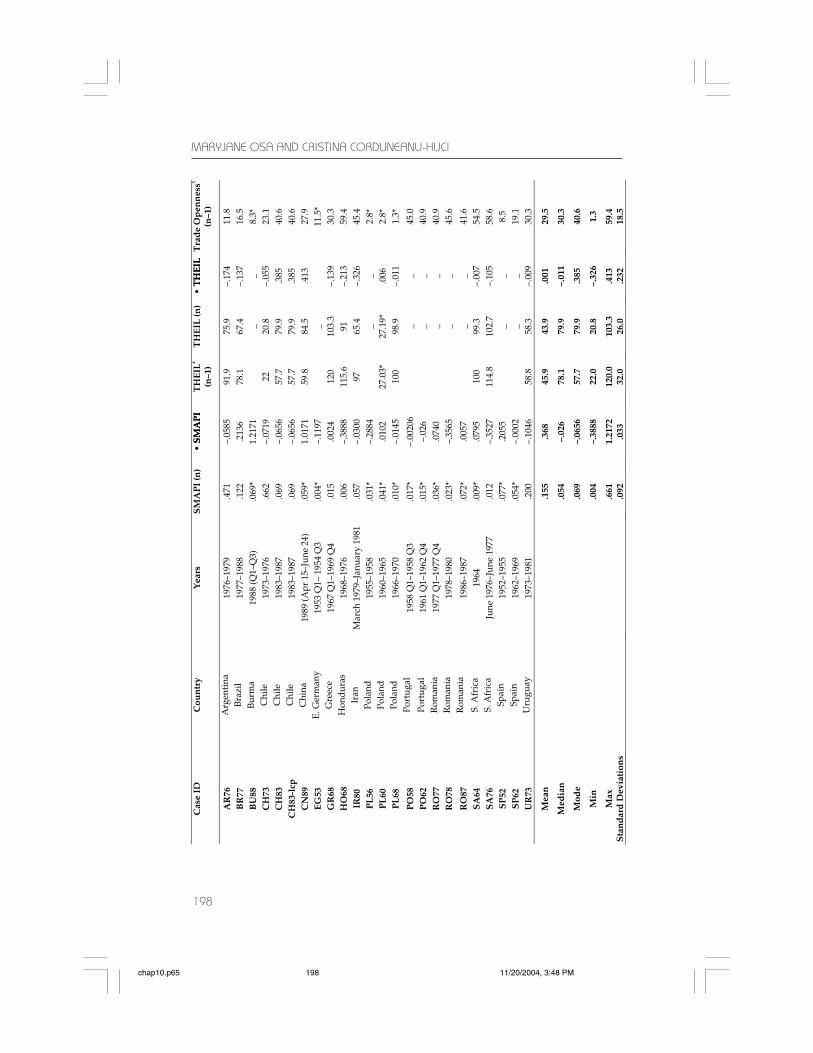
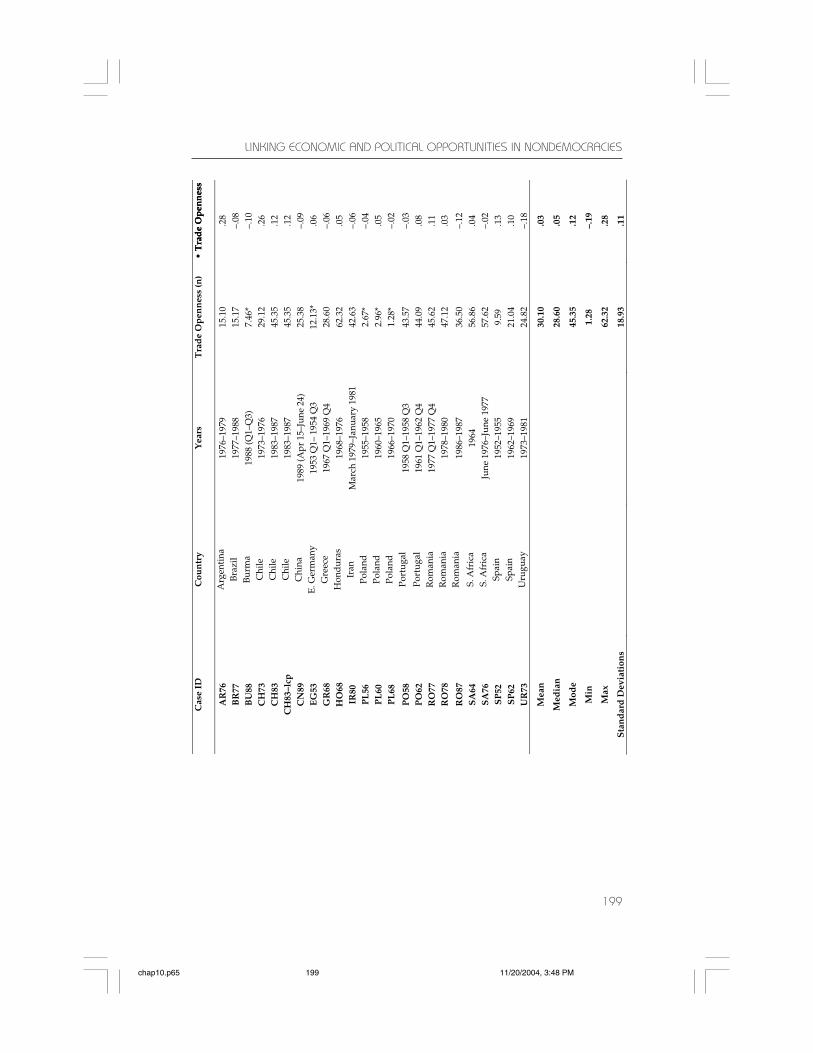
Trade openness, an indicator of international connectedness and the sta-tus of a country in the world system, has been shown to play a significantrole in internal political alignments (Katznelson, Shefter, and Keohane 2002;Milner 1997; Rogowski 1989) and state failures (Goldstone et al. 2000). 4 Weincluded this variable in all of the models that we analyzed. Theory sug-gests that trade openness (in absolute value) is indeed associated with bothfaster domestic economic growth and the existence of democratic institu-tions and processes. Thus, indirectly, the magnitude of a state’s commer-cial exchanges with the rest of the world seems to be connected with politi-cal stability.5 There are two alternative indicators for trade openness: (1)annual change in the extent of trade openness measured as the share offoreign trade in GDP [(exports + imports) 100/GDP]; and (2) a qualitativedetermination of the country’s trade policy, coded 1 if liberal and 0 if pro-tectionist. We are using the first indicator for two reasons. First, since weare interested in how the situation is changing, the dynamic measure inmore appropriate. Second, we have four missing data points on the qualita-tive index of trade openness (Sachs and Warner 1995), which reduces the ef-fectiveness of this index in our analysis.
Inequality is theoretically important (and usually more extreme in non-democratic countries), but the statistical data for this measure are very dif-ficult to locate. Despite our best efforts to locate figures, we have ten miss-ing data points. We are interested in whether, at the point of mobilization,social inequality is increasing or decreasing. There are three alternative in-dicators: (1) Gini, based on Lorenz’s curve (UNDP/World Income Inequal-ity Database, http://www.wider.unu.edu/wiid/wiid.htm; Deininger andSquire 1996); (2) Theil Index, University of Texas Inequality Project (http://utip.gov.utexas.edu); and (3) estimated household income inequality(EHII4), an alternative measure generated by the University of Texas In-equality Project. For our project we are using the Theil Index, considered tobe a superior measure to the traditional Gini and highly correlated with
chap10.p65 11/20/2004, 3:48 PM185
MARYJANE OSA AND CRISTINA CORDUNEANU-HUCI
186
EHII4 (Conceição and Galbraith 1999; Galbraith and Kum 2003). For onemissing data point (Theil statistic unavailable) we have substituted the Ginicoefficient. We coded 1 if inequality was increasing and 0 if it was decreas-ing. (See appendixes 10.1 and 10.2.)
We tried various combinations of economic factors; the four-variablemodel (with recombined GDP and SL) produced the most parsimonious,interpretable results. The final model is specified in Boolean/QCA nota-tion thusly,
SOCMOB = GDPGAP . INFLVOL . THEIL . TO1
This represents a model in which social mobilization occurs with some com-bination of the GDP gap, inflation volatility, inequality, and trade opennessvariables (dynamic measures, as specified above).
Results
Results of the QCA analysis identified three prime implicants, or conjunc-tures of economic conditions, that occur with the positive outcome of so-cial mobilization. The nonoccurrence of mobilization is expressed in a singleprime implicant. Each of these is discussed below.
Outcome 1: Economic Conditions and Social Mobilization
We first consider whether social mobilization (SOCMOB) resulted from anycombination of the four independent variables: Inflation volatility (INFLVOL),trade openness (TO1), the gap between GDP growth and a falling standardof living (GDPGAP), and inequality (THEIL). Recall that we are coding theseindicators as 1 if they are increasing and as 0 if they are decreasing. In ourdata set, we have eighteen cases with positive outcomes: East Germany1953, Poland 1956, Portugal 1958, Portugal 1962, Spain 1962, Greece 1968,Honduras 1968, Poland 1968, Chile 1973, Argentina 1977, South Africa 1976,Brazil 1977, Romania 1977, Iran 1980, Chile 1983, Romania 1987, Burma1988, and China 1989. The results of QCA truth table minimization in themost parsimonious model (including contradictions) identify three primeimplicants, or combinations of conditions associated with the outcome,social mobilization.6
This first prime implicant [INFLVOL to1] shows that social mobilizationoccurred when there was an increase in inflation volatility coinciding witha decrease in trade openness, or a move towards protectionism on the partof the regime. Five cases in our database are covered by this prime implicant:Brazil 77, Greece 68, Burma 88, China 89, and Romania 87. Increasing infla-tion volatility (INFLVOL) ranged from 0.002 (lowest increase) in Greece 68
chap10.p65 11/20/2004, 3:48 PM186
LINKING ECONOMIC AND POLITICAL OPPORTUNITIES IN NONDEMOCRACIES
187
to 1.217 (highest increase) in Burma 88 with a standard deviation for thesecases of 0.582. Similarly, there was a range of decreasing trade opennessfrom –0.057 (lowest decrease) in Greece 68 to –0.123 (highest decrease) inRomania 87 with a standard deviation for these cases of 0.025. Social mobi-lization ranged from nonviolent, nondisruptive activities such as intellec-tuals’ and professionals’ public statements opposing regime policies (Bra-zil, China), to disruptive, nonviolent actions such as student demonstrations(Brazil, China, Burma, Romania), labor strikes (Brazil, Romania, Burma),marches and street demonstrations (Burma, China, Greece), and finally in-cluding disruptive antiregime violence such as arson and armed attacks(Greece, Romania) (see Osa and Corduneanu-Huci 2003)7.
Generally, this prime implicant describes nondemocratic states undereconomic stress that are attempting to manage uncertainty either by with-drawing from broader international exchanges or, more likely, by imple-menting domestic austerity policies to reduce international dependence.
The second prime implicant [GDPGAP inflvol] shows that social mobi-lization occurred when there was a growing gap between GDP and a sink-ing standard of living that coincided with decreasing inflation volatility.Eight cases have this configuration: Argentina 77, Chile 73, East Germany53, Spain 62, Poland 56, Poland 68, Portugal 58, and South Africa 76. TheGDP growth ranged from .004 (lowest increase) in Chile 73 to .13 (highestincrease) in Spain 62 with a standard deviation of .04. The decrease in thestandard of living ranged from –.002 (lowest decrease) in South Africa 76to –.04 in (highest decrease) in Argentina 77 (SD = .01).
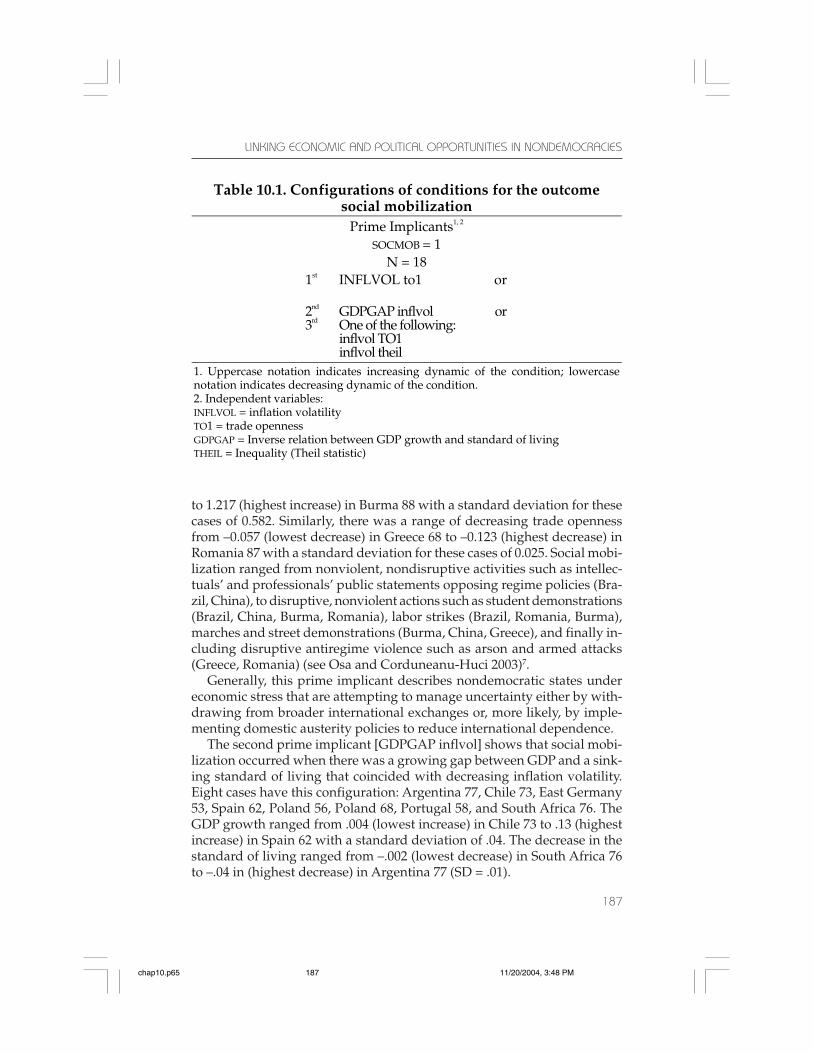
Table 10.1. Configurations of conditions for the outcome social mobilization
Prime Implicants1, 2 SOCMOB = 1
N = 18 1st INFLVOL to1
or
2nd GDPGAP inflvol or 3rd One of the following:
inflvol TO1
inflvol theil
1. Uppercase notation indicates increasing dynamic of the condition; lowercase notation indicates decreasing dynamic of the condition. 2. Independent variables: INFLVOL = inflation volatility TO1 = trade openness GDPGAP = Inverse relation between GDP growth and standard of living THEIL = Inequality (Theil statistic)
chap10.p65 11/20/2004, 3:48 PM187
MARYJANE OSA AND CRISTINA CORDUNEANU-HUCI
188
Similarly, decreasing inflation volatility (inflvol) ranged from –.0002 (low-est decrease) in Spain 62 to –.35 (highest decrease) in South Africa 76 (SD =.13). Social mobilization in these cases ranged from nonviolent,nondisruptive activities such as organizing clandestine antiregime networks(Chile), to disruptive, nonviolent actions such as boycotts (South Africa),strikes (East Germany, Spain), student protests (Portugal, Poland 56 and68, Spain, South Africa), and street manifestations (East Germany, Poland56 and 68, Portugal); also included were acts of disruptive antiregime vio-lence such as arson and assaults (Poland 56, South Africa) (see Osa andCorduneanu-Huci 2003).
No definitive scenario common to all the cases with this configurationcan be established with the QCA methods and our data. Possibly, the less-ening of inflation volatility gives the nondemocratic regime greater leeway(or confidence?) to invest more heavily in military expenditures. This wouldaccount for the increasing gap between GDP growth and a falling standardof living. In addition, we found that GDPGAP was weakly correlated (r2 =0.33) with increasing repression.8 It could be that segments of the popula-tion were unconstrained by economic conditions (due to decreasing infla-tion uncertainty) and were reacting to the militarization or increasing re-pression of the regime. Although authoritarian regimes applied repressionto suppress social unrest, empirically, this often led to the opposite out-come, increased mobilization by outraged populations. These counter-intuitive results are sometime called “the protest/repression paradox”(Brocket 1994; Mason and Krane 1989).
Our third prime implicant has two variants. Variant A occurs when de-creasing inflation volatility is paired with increasing trade openness. Vari-ant B occurs when decreasing inflation volatility is paired with decreasinginequality. These are situations where the economic conditions are rela-tively good: inflation is predictable and international economic exchangesare increasing or social inequality is decreasing. The occurrence of mobili-zation in this configuration accords with Tocqueville’s argument that a cer-tain amount of prosperity, given other political conditions, creates a favor-able context for oppositional collective action.
There are nine cases of variant A [inflvol TO1], with two contradictions,and thirteen cases of variant B [inflvol theil], with two contradictions.9 Thestory here is in the contradictions. That 22 percent of the cases coveredunder variant A have the outcome “no mobilization” suggests that eco-nomic factors are not the sole determinant of social mobilization for ourcases. A closer examination of the contradictory pairs shows why this is so.The first contradiction in variant A is between the two Chilean cases. In onecase, Chile 83, mobilization occurred; in the second case, Chile 83–lcp re-fers to “low combative poblaciones” that did not join in the general mobili-zation. Macroeconomic conditions were identical for both cases includedin our database. However, certain poblaciones mobilized successfully
chap10.p65 11/20/2004, 3:48 PM188
LINKING ECONOMIC AND POLITICAL OPPORTUNITIES IN NONDEMOCRACIES
189
whereas others did not. This is again an indication of interveningsociopolitical variables missing from the model. As both Oxhorn (1991)and Schneider (1991) document, differential grassroot organizational ca-pacities and network structures explain the difference of outcomes.
The second paired contradiction is Portugal 62 and Romania 78, whichappears in both variant A and variant B. Portugal 62 and Romania 78 ex-hibit the same configuration: decreasing GDP gap, decreasing inflationvolatility, and increasing trade openness. However, the Portuguese mobi-lized and the Romanians did not. A careful look at the Romanian case showswhy. When the Valea Jiului miners’ strike of 1977 was suppressed, theCeausescu regime cracked down on the strikers and their families, impris-oned hundreds of workers, and used secret police to intimidate everybodyelse. By 1978, the close- knit miners’ network broke apart as a result of thegovernment’s campaign of repression. The mining valley was sealed off bythe army and secret police, strike leaders mysteriously disappeared, fourthousand miners were relocated, and some were sent to forced labor camps(Deletant 1998: 233).
The second contradictory pair in variant B is Iran 80 (mobilization) andUruguay 73 (no mobilization). The explanation for the negative outcomein Uruguay seems to be the highly repressive conditions that were enforcedby a united military (see Osa and Corduneanu-Huci 2003).
Outcome 2: Economic Conditions and No Mobilization
A single prime implicant [INFLVOL TO1] was derived from truth tableminimization for the 0 (no mobilization) outcome. In the analysis, mobili-zation did not occur when inflation volatility coincided with increasingtrade openness. There are four cases covered under this implicant, includ-ing one contradiction.
Here a mixed economic situation, a move toward economic liberalismcoupled with increasing inflation uncertainty, is associated with quiescencein South Africa 64, Spain (1952–1955) and Poland (1960–1965). All threecountries had established a dictatorial status quo that was maintained withmoderate growth, relatively high levels of repression, and tacit acceptanceof these authoritarian regimes on the part of the West.
Romania 77 is the contradictory case, a situation of mobilization thatshould not have happened (given the model). In the positive outcome, thequiescence after the strike, Romania 78, presents a contradiction in our data;in this, the no-mobilization outcome, the strike itself appears in contradic-tion with Spain 52. Romania 77 is an unusual case of widespread mobiliza-tion of more than ten thousand workers despite impressively unfavorableeconomic and political circumstances. The mobilization is explained by theunusual formation of a dense, multiplex social network in a region thathad been isolated from the rest of the country primarily owing to the
chap10.p65 11/20/2004, 3:48 PM189
MARYJANE OSA AND CRISTINA CORDUNEANU-HUCI
190
government’s relocation policy. These networks allowed the miners to com-municate effectively within their community and generate resources inter-nally to allow a vast mobilization to take place (Deletant 1998; Vasi 2004).
Discussion
Social scientists have proposed various hypotheses linking economic con-ditions and political instability. In this chapter, we explored how popula-tions under authoritarian or other nondemocratic control structures man-aged to mobilize against dictatorial regimes. It is precisely in these casesthat economic conditions are thought to have the most direct effects. Sometheorists argue that improving economic conditions may trigger the collec-tive action of challengers (e.g., Tocqueville, Gurr, Davies). Others considerworsening economic conditions, such as increasing inequality and pov-erty, as important causal factors (e.g., Dos Santos, Cardoso and Faletto).Although liberal democracy is the preferred end point envisioned by theo-ries of democratization, development, revolution, and state breakdown,these theories are not advanced by additional research on Western indus-trial democracies. We will learn more about how states find a path towarda democratic outcome by studying how societies mobilize, successfully ornot, during the dictatorships. Our chapter’s contribution to this agenda istwofold: (1) we identified the relevant economic variables associated withmobilization/nonmobilization in a range of nondemocratic cases; (2) the re-sults of our data analysis suggest possible overlaps between economic andpolitical opportunities for mobilization.
The literature on economic growth and political development identifieda number of variables used in cross-national research on these topics: growthof GDP, standard of living, inflation, inflation uncertainty, various mea-sures of inequality, and trade openness. We worked with all of these vari-
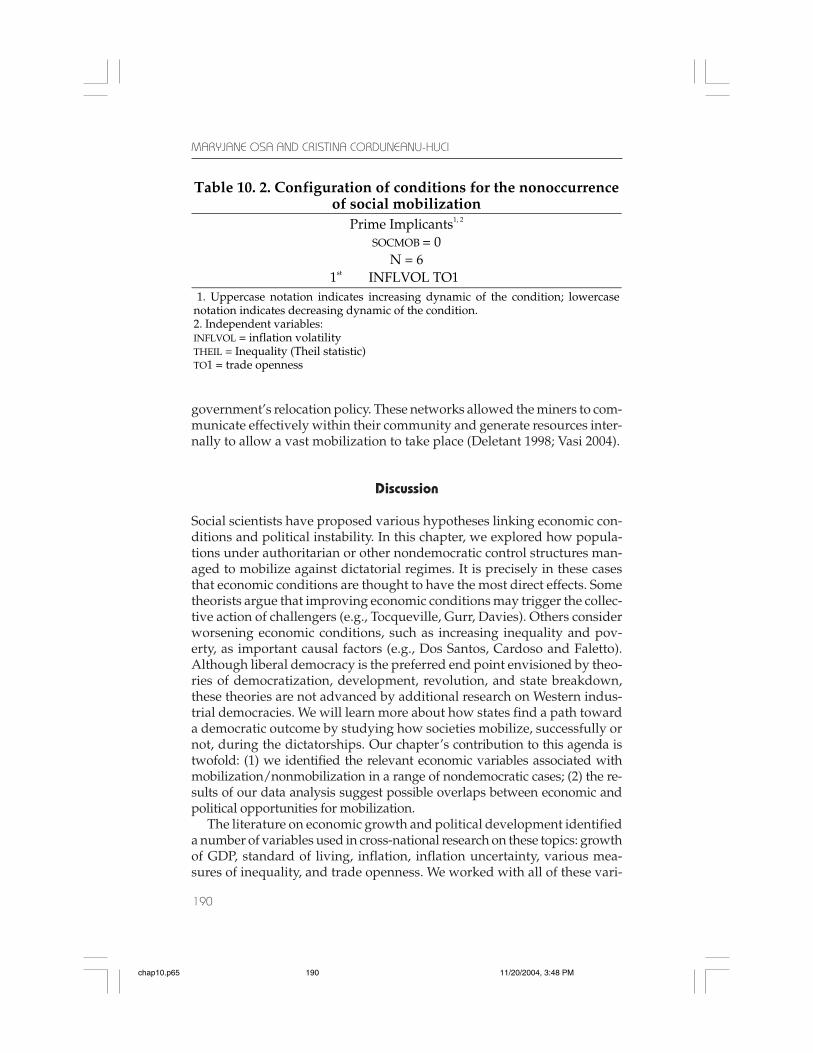
Table 10. 2. Configuration of conditions for the nonoccurrence of social mobilization
Prime Implicants1, 2 SOCMOB = 0
N = 6 1st INFLVOL TO1
1. Uppercase notation indicates increasing dynamic of the condition; lowercase notation indicates decreasing dynamic of the condition. 2. Independent variables: INFLVOL = inflation volatility THEIL = Inequality (Theil statistic) TO1 = trade openness
chap10.p65 11/20/2004, 3:48 PM190
LINKING ECONOMIC AND POLITICAL OPPORTUNITIES IN NONDEMOCRACIES
191
ables, using QCA to identify prime implicants for many differently speci-fied models. The combination of the GDP growth and standard of livingmeasures into a single variable, GDPGAP, gave the most parsimonious (andinterpretable) results.
Our economic opportunity model of social mobilization undernondemocracies is specified with four variables: GDP gap (difference be-tween economic growth and a falling standard of living), inflation volatil-ity (uncertainty), trade openness, and inequality (Theil statistic). Besidesbeing parsimonious, the model was quite robust. We ran the analysis ofthis four variable model in three different ways: (1) with pure outcomes,using only the actual cases of 1, 0 with contradictions eliminated from thedata set; (2) with inclusion of the logical cases, using logically possible com-binations for which we had no empirical data; and (3) with the algorithmselecting the contradictions to include in the analysis. (See “Results” sec-tion of the chapter.) For each of these specifications, we obtained the sameprime implicants, with contradictions that were easily interpretable.
The QCA analysis identified three prime implicants for the positive (so-cial mobilization) outcome and a single prime implicant for the negative(no mobilization) outcome. The contradictions were few, and they wereinstructive. We draw three conclusions from our analysis of the contradic-tory pairs in our data. First, the economic causality models are question-able. If economists’ theories of a direct connection between economic con-ditions and political instability were correct, then the same factors shouldalways produce the same outcome. For the two contradictions (i.e., Chile73lcp, Romania 78), the economic variables that occur with mobilization(in all the other cases) are present, yet there is no mobilization. This obser-vation calls into question assertions about the direct causality of economicfactors. However, it could be argued that our model does not include thecausal variables and that is why we observed contradictory outcomes. Con-sidering this possibility, we tested all the other likely variables and combi-nations. The results were even worse. The other models had more contra-dictions and less parsimonious results—up to nine prime implicants forcertain models.
Second, close examination of the contradictory cases reveals a patterncommon to all. In the cases where mobilization should have occurred but didn’t,and the cases where no mobilization occurred and should have, a commonfactor was social networks. The contradictions in the positive outcome (e.g.,Romania 78) were situations in which favorable mobilization conditionsexisted, but owing to the prior destruction of mobilizing networks duringa regime crackdown, no coordination among opposition groups was pos-sible. Conversely, the two contradictions for the negative outcome againhighlight severe repression (Uruguay 73) and networks. For example, inRomania 77, mobilization should not have taken place, according to ourmodel. This was a highly unusual case that appeared as an anomaly also
chap10.p65 11/20/2004, 3:48 PM191
MARYJANE OSA AND CRISTINA CORDUNEANU-HUCI
192
from the perspective of political opportunity. Besides the lack of favorableeconomic conditions, the political situation in Romania did not offer muchhope for widespread mobilization: there was no divided elite, no externalallies, no media access, and increasing repression. Upon close examinationof the case, we found that unusually strong social networks in the miningregion generated their own resources; strike leaders also used the specificlabor conditions to their advantage (miners were underground, commu-nist bosses were above ground in the mining offices) (Osa and Corduneanu-Huci 2003).
Finally, the existence of contradictions, according to the QCA methodol-ogy literature, often implies an incorrect selection of variables for the model(de Meur and Rihoux 2002). For this chapter, we isolated only the economicfactors. From the perspective of social movement theory, this is anunderspecified model of collective action. The contradictions suggest thata full model of social mobilization for these cases, at minimum, shouldinclude networks in addition to economic conditions, and it should prob-ably also include some of the political opportunity factors. This brings usto the second contribution of the analysis.
The likelihood of an overlap between economic conditions and politicalopportunity in nondemocratic regimes is suggested not only from the dataanalysis but also from recent critiques of the political opportunity/politi-cal process model in social movement theory. Specifically, critics argue thatmobilization can and does occur without the “opening” of political oppor-tunity, however that may be specified (Goodwin and Jasper 2004; Kurzman1996). In addition, it is possible for movements to internally generate re-sources that permit mobilization despite restrictive external conditions(Morris 1981). Our study suggests two specific patterns of overlap betweeneconomic and political opportunities, connecting the political factor of di-vided elites with the economic variable trade openness, and linking politi-cal repression and GDPGAP.
Our data suggest an intriguing connection between divided elites andtrade openness that are echoed in the findings of the State Failure TaskForce (Goldstone et al. 2000; see also Hagre 2000; Solingen 1998). From ourPolitical Opportunity Structures in Nondemocracies (POSND) database(Osa and Corduneanu-Huck 2002), we took data on divided elites for allour cases (0, 1) and ran a correlation with trade openness. For this proce-dure, we did not use the change in trade openness. Rather, we used a dummyvariable that coded the country/case liberal (1) or protectionist (0) at thetime of mobilization (Sachs and Warner 1995). We found a high correlation(r2 = 0.52) between low trade openness (i.e., protectionism) and dividedelites. What could account for this strong relationship?
The State Failure Task Force offers a number of possibilities regardingthe nature of intraelite conflict and its relation to protectionism. Interfer-ence in the economy by corrupt officials and rent seekers, insecure prop-
chap10.p65 11/20/2004, 3:48 PM192
LINKING ECONOMIC AND POLITICAL OPPORTUNITIES IN NONDEMOCRACIES
193
erty rights, and the lack of due process—all may contribute to a withdrawalfrom open trade practices. The state failure study concludes, “whateverthe precise mechanism, we believe that relatively low trade openness servesas a highly sensitive indicator of the costs imposed on a country by theinability of the state and elites to cooperate in upholding the rule of lawand fair practices. In addition to inhibiting trade, this inability to cooperatemay encourage political instability” (Goldstone et al. 2000: 11). Our researchconfirms this finding: elite divisions are strongly correlated with low tradeopenness in the nondemocratic cases in our data set. This pattern may notindicate a single mechanism operating across the cases, but the strong link-age between political and economic factors indicates a need for further re-search.
Finally, the link between political repression and the economic condi-tions of GDPGAP is clear. The GDPGAP variable identifies a discrepancy be-tween increasing economic growth and a decreasing standard of living; thegap is created because of excessive military expenditures. This reflects thestate’s increased costs of coercion. In the nondemocratic cases, these ex-penditures often reflect the expansion of the security apparatus and an in-tensification of repressive controls over society. However, as the literatureon the repression/protest paradox concludes, the outcome of state repres-sion is not predictable. Our intention in this chapter is to highlight the link-ages; this is only the first step toward discovering mechanisms that ac-count for differential outcomes.
In Coercion, Capital, and European States, Charles Tilly (1990) examinedprocesses (urbanization and state building) and structures (cities and states)resulting from a millennium of European conflict. In the new millennium,we see the logics of capital and coercion underlying the processes of glo-balization and democratization. Economic and political conditions clearlyaffect the potential for domestic mobilization to counter repression andmove the authoritarian state toward democracy. Democratic governancegives these states their best chance of coping with new global structures.Through understanding how to facilitate democratic challengers, perhapsit will be possible to reduce the severity of international conflict in the nextthousand years.
Notes
1. A description of how the database was constructed and a discussion of thecase selection strategy and other methodological issues can be found in Osa andCorduneanu-Huci 2003.
2. We refer to this indicator as inflation volatility to avoid the social-psycho-logical overtones of “inflation uncertainty.” The technical name for the indicator isthe Simple Moving Average of Predicted Inflation (SMAPI) in Fischer 1993. We use“inflation volatility” to indicate the SMAPI statistic.
chap10.p65 11/20/2004, 3:48 PM193
MARYJANE OSA AND CRISTINA CORDUNEANU-HUCI
194
3. Inflation statistics for sixteen cases were available in Fischer 1993 as con-sumer price index (CPI) measures. For the remaining cases where the CPI data didnot exist, we substituted one of the following indicators: index number of real wages,cost of living index, and purchasing power parity index (PPP). (See appendix 10.2.)We coded the inflation variable for the truth table as 1 if inflation was increasingand 0 if inflation was decreasing. We dropped this variable from the final (mostparsimonious) model but used these inflation figures to calculate inflation volatil-ity (or SMAPI) for the missing data points.
4. The global model in this task force report shows that after controlling forpopulation and level of development, the odds ratio of state failure were 1.7 higherin the countries with relatively low trade openness than for countries with tradeopenness above the median. (p = 0.062).
5. This issue is discussed in greater detail in the concluding “Discussion” sec-tion of this chapter.
6. We used the same algorithm for the 0 output minimization as for the posi-tive outcomes. By selecting “don’t care” on the contradictions, we allowed the QCAprogram to ignore some contradictions to fit the best model. The algorithm ig-nored a single contradiction to achieve the most parsimonious result.
7. Due to space limitations here, we are not citing all the references to the spe-cific case studies. For full citations to the area literature for our cases see Osa andCorduneanu-Huci 2003.
8. See the POSND database for data on repression dynamics (Osa andCorduneanu-Huci 2002). Also see published results in Osa and Corduneanu-Huci2003.
9. Cases of variant A are Argentina 76, Chile 73, Chile 83, East Germany 53,Spain 62, Honduras 68, Portugal 62, and the contradictions (0 outcome) Chile83–lcp and Romania 78. Variant B cases are Argentina 76, Chile 73, Iran 80, East Ger-many 53, Spain 62, Honduras 68, Poland 56, Poland 68, Portugal 58, Portugal 62,South Africa 76, and the contradictions (0 outcome) Uruguay 73 and Romania 78.
chap10.p65 11/20/2004, 3:48 PM194

LINKING ECONOMIC AND POLITICAL OPPORTUNITIES IN NONDEMOCRACIES
195
A
PP
EN
DIX
10.
1. T
ruth
Tab
le
Cas
e ID
Cou
ntr
y
Yea
rs
C
GD
P
grow
th
•
Sta
nd
ard
S
tan
dar
d
of L
ivin
g
C
GD
Pga
p
•
Infl
atio
n
•
SM
AP
I S
MA
PI
(In
flat
ion
V
olat
ilit
y)
•
TH
EIL
•
Tra
de
Tra
de
Op
enn
ess
S
ocia
l M
obil
izat
ion
AR
76
Arg
enti
na
1976
–197
9 1
0 1
1 0
0 1
1 B
R77
B
razi
l 19
77–1
988
1 1
0 1
1 0
0 1
BU
88
Bur
ma
1988
(Q1–
Q3)
0
0 0
0 1
_ 0
1 C
H73
C
hile
19
73–1
976
1 0
1 1
0 0
1 1
CH
83
Chi
le
1983
–198
7 0
0 0
1 0
1 1
1 C
H83
-lcp
C
hile
19
83–1
987
0 0
0 1
0 1
1 0
CN
89
Chi
na
1989
(Apr
il 15
–Jun
. 24)
1
1 0
0 1
1 0
1 E
G53
E
. G
erm
any
1953
Q1–
1954
Q3
1 0
1 1
0 _
1 1
GR
68
Gre
ece
1967
Q1–
1969
Q4
1 1
0 0
1 0
0 1
HO
68
Hon
dur
as
1968
–197
6 1
1 0
0 0
0 1
1 IR
80
Iran
M
arch
197
9–Ja
n. 1
981
1 1
0 0
0 0
0 1
PL
56
Pola
nd
1955
–195
8 1
0 1
1 0
_ 0
1 P
L60
Po
land
19
60–1
965
1 0
1 1
1 1
1 0
PL
68
Pola
nd
1966
–197
0 1
0 1
1 0
0 0
1 P
O58
Po
rtug
al
1958
Q1–
1958
Q3
1 0
1 1
0 _
0 1
PO
62
Port
ugal
19
61 Q
1–19
62 Q
4 1
1 0
1 0
_ 1
1 R
O77
R
oman
ia
1977
Q1–
1977
Q4
1 1
0 0
1 _
1 1
RO
78
Rom
ania
19
78–1
980
1 1
0 1
0 _
1 0
RO
87
Rom
ania
19
86–1
987
1 0
1 1
1 _
0 1
SA
64
S. A
fric
a 19
64
1 0
1 1
1 0
1 0
SA
76
S. A
fric
a Ju
ne 1
976–
June
197
7 1
0 1
0 0
0 0
1 S
P52
Sp
ain
1952
–195
5 1
1 0
0 1
_ 1
0 S
P62
Sp
ain
1962
–196
9 1
0 1
1 0
_ 1
1 U
R73
U
rugu
ay
1973
–198
1 1
1 0
1 0
0 0
0
chap10.p65 11/20/2004, 3:48 PM195
MARYJANE OSA AND CRISTINA CORDUNEANU-HUCI
196
AP
PE
ND
IX 1
0.2.
Raw
Dat
a T
able
C
ase
ID
Cou
ntr
y Y
ears
C
GD
P1 (n
–1)
(US
D–c
urr
ent
pri
ces)
CG
DP
(n)
(US
D–c
urr
ent
pri
ces)
• G
DP
GD
P
S
tan
dar
d o
f L
ivin
g2
(n–1
) (%
) S
tan
dar
d o
f L
ivin
g (n
) (%
)
AR
76
Arg
enti
na
1976
–197
9 31
91
3305
.0
36
82.6
79
.3
BR
77
Bra
zil
1977
–198
8 21
31
2334
.0
95
78.8
79
.4
BU
88
Bur
ma
1988
(Q1–
Q3)
56
9 50
0 –.
121
91.3
90
.4
CH
73
Chi
le
1973
–197
6 16
65
1672
.0
04
89.1
87
.6
CH
83
Chi
le
1983
–198
7 31
46
3039
–.
034
72.7
72
.4
CH
83-l
cp
Chi
le
1983
–198
7 31
46
3039
–.
034
72.7
72
.4
CN
89
Chi
na
1989
(Apr
15–
June
24)
14
10
1495
.0
60
70.5
71
.4
EG
53
E. G
erm
any
1953
Q1–
195
4 Q
3 92
2*
995*
.0
79
49.2
* 48
.3*
GR
68
Gre
ece
1967
–Q1–
1969
–Q4
986
1065
.0
80
70.7
* 71
.5*
HO
68
Hon
dur
as
1968
–197
6 39
9 43
0 .0
78
86.1
* 86
.5*
IR80
Ir
an
Mar
ch 1
979–
Janu
ary
1981
29
60
3088
.0
43
70.7
73
.8
PL
56
Pola
nd
1955
–195
8 63
3*
673
* .0
63
79.7
* 79
.5*
PL
60
Pola
nd
1960
–196
5 88
5*
924*
.0
44
79.0
8*
79.0
7*
PL
68
Pola
nd
1966
–197
0 11
27*
1193
* .0
59
29.7
1*
29.5
3*
PO
58
Port
ugal
19
58 Q
1–19
58 Q
3 46
9 48
2 .0
28
83.9
8*
83.7
5*
PO
62
Port
ugal
19
61 Q
1–19
62 Q
4 54
8 59
9 .0
93
81.0
4*
81.9
0*
RO
77
Rom
ania
19
77 Q
1–19
77 Q
4 83
0 92
4 .1
13
67.3
69
.8
RO
78
Rom
ania
19
78–1
980
924
1077
.1
66
69.8
70
.3
RO
87
Rom
ania
19
86–1
987
1995
20
28
.017
66
.1
63.8
S
A64
S.
Afr
ica
1964
69
2 74
0 .0
69
79.1
6*
78.2
3*
SA
76
S. A
fric
a Ju
ne 1
976–
June
197
7 19
03
1964
.0
32
78.5
78
.3
SP
52
Spai
n 19
52–1
955
524
562
.073
79
.03*
81
.63*
S
P62
Sp
ain
1962
–196
9 99
8 11
24
.126
74
.7*
73.8
* U
R73
U
rugu
ay
1973
–198
1 17
21
1870
.0
87
91.7
93
.2
Mea
n
1407
14
63
.052
74
.75
74.8
2 M
edia
n
986
1077
.0
60
78.5
78
.23
Mod
e
31
46
3039
–.
034
72.7
72
.4
Min
39
9 43
0 –.
121
29.7
1 29
.53
Max
31
91
3305
.1
66
91.7
93
.2
Sta
nd
ard
Dev
iati
ons
924
921
.059
13
.33
13.3
8
chap10.p65 11/20/2004, 3:48 PM196
LINKING ECONOMIC AND POLITICAL OPPORTUNITIES IN NONDEMOCRACIES
197
Cas
e ID
C
oun
try
Yea
rs
• S
L
SL
In
flat
ion
(n–1
)In
flat
ion
(n)
•
In
flat
ion
In
flat
ion
S
MA
PI3 (
n–1
)
AR
76
Arg
enti
na
1976
–197
9 –.
0400
1.
0400
1.
694
.63
.500
B
R77
B
razi
l 19
77–1
988
.007
6 .3
509
.362
.0
3 .1
00
BU
88
Bur
ma
1988
(Q1–
Q3)
–.
0100
.2
210
.149
–.
33
.031
* C
H73
C
hile
19
73–1
976
–.01
68
.558
7 1.
529
1.74
.7
13
CH
83
Chi
le
1983
–198
7 –.
0041
.0
948
.241
1.
54
.073
C
H83
-lcp
C
hile
19
83–1
987
–.00
41
.094
8 .2
41
1.54
.0
73
CN
89
Chi
na
1989
(Apr
15–
June
24)
.0
128
.188
8 .1
78
–.06
.0
29*
EG
53
E. G
erm
any
1953
Q1–
195
4 Q
3 –.
0183
–.
001*
.0
03*
4.00
.0
05*
GR
68
Gre
ece
1967
Q1–
1969
Q4
.011
6 .0
486
.017
–.
65
.015
H
O68
H
ond
uras
19
68–1
976
.004
4 .0
207
.018
–.
11
.011
IR
80
Iran
M
arch
197
9–Ja
nuar
y 19
81
.043
8 .1
108
.010
–.
10
.059
P
L56
P
olan
d
1955
–195
8 –.
0031
–.
0630
* –.
024*
0.
619
.045
* P
L60
P
olan
d
1960
–196
5 –.
0002
.0
112*
.0
17*
.51
.041
* P
L68
P
olan
d
1966
–197
0 –.
0061
.0
085*
.0
12*
.42
.010
*
PO
58
Port
ugal
19
58 Q
1–19
58 Q
3 –.
0027
.0
002*
.0
14*
58.8
29
.017
* P
O62
Po
rtug
al
1961
Q1–
1962
Q4
.010
7 .0
154*
.0
26*
.71
.016
* R
O77
R
oman
ia
1977
Q1–
1977
Q4
.037
1 –.
0625
* –.
052*
.1
6 .0
34*
RO
78
Rom
ania
19
78–1
980
.007
2 –.
0522
* –.
087*
-.6
6 .0
36*
RO
87
Rom
ania
19
86–1
987
–.03
48
–.05
95*
.025
* 1.
41
.072
* S
A64
S.
Afr
ica
1964
–.
0117
.0
126
.026
1.
06
.008
* S
A76
S.
Afr
ica
June
197
6–Ju
ne 1
977
–.00
25
.126
4 .1
07
–.16
.0
20
SP
52
Spai
n 19
52–1
955
.032
9 .2
400*
.0
12*
–.95
.0
634*
S
P62
Sp
ain
1962
–196
9 –.
0120
.0
199*
.0
57*
1.88
.0
54*
UR
73
Uru
guay
19
73–1
981
.016
4 .5
681
.678
.1
9 .2
27
Mea
n
.000
8 .2
59
.458
11
.937
.1
67
Med
ian
–.
0025
.0
49
.026
.5
12
.041
Mod
e
–.00
41
.095
.2
41
1.54
.0
74
Min
–.
0400
–.
063
–.08
7 –0
.95
.005
M
ax
.043
8 1.
040
1.69
4 58
.83
.713
S
tan
dar
d D
evia
tion
s
.019
9 .1
46
.223
3.
011
.094
chap10.p65 11/20/2004, 3:48 PM197
MARYJANE OSA AND CRISTINA CORDUNEANU-HUCI
198
Cas
e ID
C
oun
try
Yea
rs
SM
AP
I (n
) •
SM
AP
I S
MA
PI
T
HE
IL4
(n–1
) T
HE
IL (n
) •
TH
EIL
TH
EIL
T
rad
e O
pen
nes
s5
(n–1
)
AR
76
Arg
enti
na
1976
–197
9 .4
71
–.05
85
91.9
75
.9
–.17
4 11
.8
BR
77
Bra
zil
1977
–198
8 .1
22
.213
6 78
.1
67.4
–.
137
16.5
B
U88
B
urm
a 19
88 (Q
1–Q
3)
.069
* 1.
2171
_ _
8.3*
C
H73
C
hile
19
73–1
976
.662
–.
0719
22
20
.8
–.05
5 23
.1
CH
83
Chi
le
1983
–198
7 .0
69
–.06
56
57.7
79
.9
.385
40
.6
CH
83-l
cp
Chi
le
1983
–198
7 .0
69
–.06
56
57.7
79
.9
.385
40
.6
CN
89
Chi
na
1989
(Apr
15–
June
24)
.0
59*
1.01
71
59.8
84
.5
.413
27
.9
EG
53
E. G
erm
any
1953
Q1–
195
4 Q
3 .0
04*
–.11
97
_
11
.5*
GR
68
Gre
ece
1967
Q1–
1969
Q4
.015
.0
024
120
103.
3 –.
139
30.3
H
O68
H
ond
uras
19
68–1
976
.006
–.
3888
11
5.6
91
–.21
3 59
.4
IR80
Ir
an
Mar
ch 1
979–
Janu
ary
1981
.0
57
–.03
00
97
65.4
–.
326
45.4
P
L56
Po
land
19
55–1
958
.031
* –.
2884
_ _
2.8*
P
L60
Po
land
19
60–1
965
.041
* .0
102
27.0
3*
27.1
9*
.006
2.
8*
PL
68
Pola
nd
1966
–197
0 .0
10*
–.01
45
100
98.9
–.
011
1.3*
PO
58
Port
ugal
19
58 Q
1–19
58 Q
3 .0
17*
–.00
206
_
_ 45
.0
PO
62
Port
ugal
19
61 Q
1–19
62 Q
4 .0
15*
–.02
6
_ _
40.9
R
O77
R
oman
ia
1977
Q1–
1977
Q4
.036
* .0
740
_
_ 40
.9
RO
78
Rom
ania
19
78–1
980
.023
* –.
3565
_ _
45.6
RO
87
Rom
ania
19
86–1
987
.072
* .0
057
_
_ 41
.6
SA
64
S. A
fric
a 19
64
.009
* .0
795
100
99.3
–.
007
54.5
S
A76
S.
Afr
ica
June
197
6–Ju
ne 1
977
.012
–.
3527
11
4.8
102.
7 –.
105
58.6
S
P52
Sp
ain
1952
–195
5 .0
77*
.205
5
_ _
8.5
SP
62
Spai
n 19
62–1
969
.054
* –.
0002
_ _
19.1
U
R73
U
rugu
ay
1973
–198
1 .2
00
–.10
46
58.8
58
.3
–.00
9 30
.3
Mea
n
.155
.3
68
45.9
43
.9
.001
29
.5
Med
ian
.0
54
–.02
6 78
.1
79.9
–.
011
30.3
Mod
e
.0
69
–.06
56
57.7
79
.9
.385
40
.6
Min
.0
04
–.38
88
22.0
20
.8
–.32
6 1.
3
Max
.6
61
1.21
72
120.
0 10
3.3
.413
59
.4
Sta
nd
ard
Dev
iati
ons
.092
.0
33
32.0
26
.0
.232
18
.5
chap10.p65 11/20/2004, 3:48 PM198
LINKING ECONOMIC AND POLITICAL OPPORTUNITIES IN NONDEMOCRACIES
199
Cas
e ID
C
oun
try
Yea
rs
Tra
de
Op
enn
ess
(n)
• T
rad
e O
pen
nes
s T
rad
e O
pen
nes
s
AR
76
Arg
enti
na
1976
–197
9 15
.10
.28
BR
77
Bra
zil
1977
–198
8 15
.17
–.08
B
U88
B
urm
a 19
88 (Q
1–Q
3)
7.46
* –.
10
CH
73
Chi
le
1973
–197
6 29
.12
.26
CH
83
Chi
le
1983
–198
7 45
.35
.12
CH
83–l
cp
Chi
le
1983
–198
7 45
.35
.12
CN
89
Chi
na
1989
(Apr
15–
June
24)
25
.38
–.09
E
G53
E
. Ger
man
y 19
53 Q
1– 1
954
Q3
12.1
3*
.06
GR
68
Gre
ece
1967
Q1–
1969
Q4
28.6
0 –.
06
HO
68
Hon
dur
as
1968
–197
6 62
.32
.05
IR80
Ir
an
Mar
ch 1
979–
Janu
ary
1981
42
.63
–.06
P
L56
P
olan
d
1955
–195
8 2.
67*
–.04
P
L60
P
olan
d
1960
–196
5 2.
96*
.05
PL
68
Pol
and
19
66–1
970
1.28
* –.
02
PO
58
Port
ugal
19
58 Q
1–19
58 Q
3 43
.57
–.03
P
O62
Po
rtug
al
1961
Q1–
1962
Q4
44.0
9 .0
8 R
O77
R
oman
ia
1977
Q1–
1977
Q4
45.6
2 .1
1 R
O78
R
oman
ia
1978
–198
0 47
.12
.03
RO
87
Rom
ania
19
86–1
987
36.5
0 –.
12
SA
64
S. A
fric
a 19
64
56.8
6 .0
4 S
A76
S.
Afr
ica
June
197
6–Ju
ne 1
977
57.6
2 –.
02
SP
52
Spai
n 19
52–1
955
9.59
.1
3 S
P62
Sp
ain
1962
–196
9 21
.04
.10
UR
73
Uru
guay
19
73–1
981
24.8
2 –.
18
Mea
n
30.1
0 .0
3
Med
ian
28
.60
.05
Mod
e
45
.35
.12
Min
1.
28
–.19
Max
62
.32
.28
Sta
nd
ard
Dev
iati
ons
18.9
3 .1
1
chap10.p65 11/20/2004, 3:48 PM199
MARYJANE OSA AND CRISTINA CORDUNEANU-HUCI
200
Sources and Notes for Appendixes 10.1 and 10.2
1. The consumer gross domestic product (CGDP) data source is the Penn WorldTables 5.6 except for cases marked with an asterisk, which are from the followingsources:
East Germany 1953: CGDP computed based on data from StatistischesJahrbuch DDR 1955, Penn World Tables 6.1, and IMF International Financial Statis-tics; Poland 1956, 1960, 1968: CGDP and national income dynamics data collectedfrom the UN Economic Bulletin for Europe and Concise Statistical Yearbook of Poland1970.
2. The standard of living (SL) data source is the Penn World Tables 5.6 exceptfor cases marked with an asterisk, which are from the following sources:
East Germany 1953: SL computed from consumption data in StatistischesJahrbuch DDR 1955 and military expenditures data from Alton et al. 1980; Greece1968: SL computed from Penn World Tables 6.1 (consumption), Singer and Small1999 (military expenditures) and Statistical Yearbook of Greece 1968 (military expen-ditures); Honduras 1968: SL computed from Penn World Tables 6.1 (consumption),The Statistical Abstract of Latin America 1972 (consumption and military expendi-tures), and Singer and Small 1999 (military expenditures); Poland 1956, 1960, 1968:SL computed from Concise Statistical Yearbook of Poland 1970 (consumption), Singerand Small 1999 (military expenditures) and World Military Expenditures and ArmsTransfers 1966—1975 (military expenditures); Portugal 1958, 1962: SL computedfrom Penn World Tables 6.1 and Annuario Estatistico Portugal 1958 (consumption),and Singer and Small 1999 (military expenditures); South Africa 1964: SL com-puted from Penn World Tables 6.1 and South Africa Statistical Yearbook 1964, 1965,and 1966 (consumption), and Singer and Small 1999 (military expenditures) Spain1952, 1962: SL computed from Penn World Tables 6.1 (consumption), and Singerand Small 1999 (military expenditures).
3. The SMAPI (inflation volatility) data source is Fischer 1993 except for casesmarked with asterisk which are from the following sources:
Burma 1988: SMAPI computed based on inflation data from Fischer 1993;China 1989: SMAPI computed based on overall retail price index data from ChinaStatistical Yearbook 1990; East Germany 1953: SMAPI computed based on three avail-able data points for inflation in Statistisches Jahrbuch DDR 1955; Poland 1956, 1960,1968: SMAPI computed from data on changes in the retail commodity prices col-lected from Concise Statistical Yearbook of Poland 1970 and Poland in Figures 1949–1964 (three data points available for Poland 1956); Portugal 1958, 1962: SMAPIcomputed based on Consumer Price Index (CPI) data from Annuario EstatisticoPortugal 1958, 1961; Romania 1977, 1978: SMAPI computed based on the real wageindex collected from Anuarul Statistic al Republicii Socialiste Romania; Romania 87:SMAPI computed based on purchasing power parity (PPP) index collected fromPenn World Tables 6.1; South Africa 1964: SMAPI computed based on CPI datafrom South Africa Statistical Yearbook 1964, 1965, 1966; Spain 1952, 1962: SMAPI com-puted from CPI data from Anuario Estadistico d’Espana 1962, and PPP indexes fromPenn World Tables 6.1.
4. The Theil data source is the World Theils /UTIP except for cases markedwith asterisk which are from the following sources:
chap10.p65 11/20/2004, 3:48 PM200
LINKING ECONOMIC AND POLITICAL OPPORTUNITIES IN NONDEMOCRACIES
201
Poland 1960: Theil replaced with Gini values collected from the UNDP WorldIncome Inequality Database.
5. The trade openness data source is the Penn World Tables 5.6 except for casesmarked with asterisk, which are from the following sources:
East Germany 1953: Trade openness computed from foreign trade data inUN International Trade Statistics and UN Yearbook of National Accounts 1957, 1958,1959, and 1967; Poland 1956, 1960, 1968: Trade openness computed from foreigntrade data in Penn World Tables 5.6 and 6.1, Concise Statistical Yearbook of Poland1970, and Poland in Figures 1949–1964; Burma 1988: Trade openness computed fromforeign trade data in the UN Statistical Yearbook for Asia and the Pacific 1989.
chap10.p65 11/20/2004, 3:48 PM201
Related Documents