Linking cyber and physical spaces through community detection and clustering in social media feeds Arie Croitoru a,⇑ , N. Wayant b , A. Crooks c , J. Radzikowski a , A. Stefanidis a a The Center for Geospatial Intelligence, Dept. of Geography and Geoinformation Science, George Mason University, 4400 University Drive, MS 6C3, Fairfax, VA 22030, United States b US Army Geospatial Research Laboratory, 7701 Telegraph Road, Alexandria, VA 22315-3802, United States c Dept. of Computational Social Science, George Mason University, 4400 University Drive, MS 6C3, Fairfax, VA 22030, United States article info Article history: Available online xxxx Keywords: Social media Spatiotemporal clustering Social network analysis Community detection Geospatial analysis abstract Over the last decade we have witnessed a significant growth in the use of social media. Interactions within their context lead to the establishment of groups that function at the intersection of the physical and cyber spaces, and as such represent hybrid communities. Gaining a better understanding of how information flows in these hybrid communities is a substantial scientific challenge with significant impli- cations on our ability to better harness crowd-contributed content. This paper addresses this challenge by studying how information propagates and evolves over time at the intersection of the physical and cyber spaces. By analyzing the spatial footprint, social network structure, and content in both physical and cyber spaces we advance our understanding of the information propagation mechanisms in social media. The utility of this approach is demonstrated in two real-world case studies, the first reflecting a planned event (the Occupy Wall Street – OWS – movement’s Day of Action in November 2011), and the second reflecting an unexpected disaster (the Boston Marathon bombing in April 2013). Our findings highlight the intricate nature of the propagation and evolution of information both within and across cyber and physical spaces, as well as the role of hybrid networks in the exchange of information between these spaces. Ó 2014 Elsevier Ltd. All rights reserved. 1. Introduction The past few years have witnessed the dramatic increase in the adoption and use of social media (Kaplan & Haenlein, 2010). In the U.S. alone, approximately two-thirds of online users participate in social media (Smith, 2011), spending on average between 3.6 and 6.5 h a month in social networking sites such as Facebook or Twit- ter (Nielsen, 2012). This has led to an unprecedented increase in the volume of data generated by social media users: every minute we have over 270,000 tweets (or retweets) contributed worldwide (Forbes, 2012), 3000 images posted in Flickr (Sapiro, 2011), and 100 h of video uploaded in YouTube (YouTube, 2014). These are but a few examples of the shift that has occurred in recent years toward user-generated digital content. With millions of users around the world, this trend is likely to further intensify (Hollis, 2011) as technological advances empower users to contribute richer data at higher rates. Social media services and platforms offer a wide array of digital channels for expression and interaction, ranging from forums/mes- sage boards (e.g. MacRumors), weblogs (e.g. Blogger, Wordpress), and microblogging (e.g. Twitter, Tumblr, Weibo), to wikis (e.g. Wikipedia, Wikimapia), social networking services (e.g. Facebook, Google+, LinkedIn), and podcasts (Video and Audio e.g. iTunes, Ustream). Such media have enabled the general public to contrib- ute, disseminate, and exchange information (Kaplan & Haenlein, 2010), by introducing a bottom-up alternative to complement the traditional top-down nature of Web 1.0 (Schneckenberg, 2009). This has not only resulted in a change in traditional journal- ism and news reporting (Deuze, 2008; Kwak, Lee, Park, & Moon, 2010), but it is also leading to new opportunities within the geo- graphical sciences (Caverlee, Cheng, Sui, & Kamath, 2013; Sui & Goodchild, 2011) due to the rich geographic context and context social media data often provides. A noteworthy example of this trend is the livehoods project (Cranshaw, Schwartz, Hong, & Sadeh, 2012) that is used to characterize and understand urban dynamics using social media. Indeed, social media, and micro-bog- ging in particular, have already been shown useful in predicting pandemics (Chunara, Andrews, & Brownstein, 2012; Culotta, 2010; Ritterman, Osborne, & Klein, 2009) or natural disasters http://dx.doi.org/10.1016/j.compenvurbsys.2014.11.002 0198-9715/Ó 2014 Elsevier Ltd. All rights reserved. ⇑ Corresponding author. E-mail addresses: [email protected] (A. Croitoru), Nicole.M.Wayant@usace. army.mil (N. Wayant), [email protected] (A. Crooks), [email protected] (J. Radzikowski), [email protected] (A. Stefanidis). Computers, Environment and Urban Systems xxx (2014) xxx–xxx Contents lists available at ScienceDirect Computers, Environment and Urban Systems journal homepage: www.elsevier.com/locate/compenvurbsys Please cite this article in press as: Croitoru, A., et al. Linking cyber and physical spaces through community detection and clustering in social media feeds. Computers, Environment and Urban Systems (2014), http://dx.doi.org/10.1016/j.compenvurbsys.2014.11.002

Welcome message from author
This document is posted to help you gain knowledge. Please leave a comment to let me know what you think about it! Share it to your friends and learn new things together.
Transcript
Computers, Environment and Urban Systems xxx (2014) xxx–xxx
Contents lists available at ScienceDirect
Computers, Environment and Urban Systems
journal homepage: www.elsevier .com/locate /compenvurbsys
Linking cyber and physical spaces through community detectionand clustering in social media feeds
http://dx.doi.org/10.1016/j.compenvurbsys.2014.11.0020198-9715/� 2014 Elsevier Ltd. All rights reserved.
⇑ Corresponding author.E-mail addresses: [email protected] (A. Croitoru), Nicole.M.Wayant@usace.
army.mil (N. Wayant), [email protected] (A. Crooks), [email protected] (J.Radzikowski), [email protected] (A. Stefanidis).
Please cite this article in press as: Croitoru, A., et al. Linking cyber and physical spaces through community detection and clustering in social mediComputers, Environment and Urban Systems (2014), http://dx.doi.org/10.1016/j.compenvurbsys.2014.11.002
Arie Croitoru a,⇑, N. Wayant b, A. Crooks c, J. Radzikowski a, A. Stefanidis a
a The Center for Geospatial Intelligence, Dept. of Geography and Geoinformation Science, George Mason University, 4400 University Drive, MS 6C3, Fairfax, VA 22030, United Statesb US Army Geospatial Research Laboratory, 7701 Telegraph Road, Alexandria, VA 22315-3802, United Statesc Dept. of Computational Social Science, George Mason University, 4400 University Drive, MS 6C3, Fairfax, VA 22030, United States
a r t i c l e i n f o
Article history:Available online xxxx
Keywords:Social mediaSpatiotemporal clusteringSocial network analysisCommunity detectionGeospatial analysis
a b s t r a c t
Over the last decade we have witnessed a significant growth in the use of social media. Interactionswithin their context lead to the establishment of groups that function at the intersection of the physicaland cyber spaces, and as such represent hybrid communities. Gaining a better understanding of howinformation flows in these hybrid communities is a substantial scientific challenge with significant impli-cations on our ability to better harness crowd-contributed content. This paper addresses this challenge bystudying how information propagates and evolves over time at the intersection of the physical and cyberspaces. By analyzing the spatial footprint, social network structure, and content in both physical andcyber spaces we advance our understanding of the information propagation mechanisms in social media.The utility of this approach is demonstrated in two real-world case studies, the first reflecting a plannedevent (the Occupy Wall Street – OWS – movement’s Day of Action in November 2011), and the secondreflecting an unexpected disaster (the Boston Marathon bombing in April 2013). Our findings highlightthe intricate nature of the propagation and evolution of information both within and across cyber andphysical spaces, as well as the role of hybrid networks in the exchange of information between thesespaces.
� 2014 Elsevier Ltd. All rights reserved.
1. Introduction
The past few years have witnessed the dramatic increase in theadoption and use of social media (Kaplan & Haenlein, 2010). In theU.S. alone, approximately two-thirds of online users participate insocial media (Smith, 2011), spending on average between 3.6 and6.5 h a month in social networking sites such as Facebook or Twit-ter (Nielsen, 2012). This has led to an unprecedented increase inthe volume of data generated by social media users: every minutewe have over 270,000 tweets (or retweets) contributed worldwide(Forbes, 2012), 3000 images posted in Flickr (Sapiro, 2011), and100 h of video uploaded in YouTube (YouTube, 2014). These arebut a few examples of the shift that has occurred in recent yearstoward user-generated digital content. With millions of usersaround the world, this trend is likely to further intensify (Hollis,2011) as technological advances empower users to contributericher data at higher rates.
Social media services and platforms offer a wide array of digitalchannels for expression and interaction, ranging from forums/mes-sage boards (e.g. MacRumors), weblogs (e.g. Blogger, Wordpress),and microblogging (e.g. Twitter, Tumblr, Weibo), to wikis (e.g.Wikipedia, Wikimapia), social networking services (e.g. Facebook,Google+, LinkedIn), and podcasts (Video and Audio e.g. iTunes,Ustream). Such media have enabled the general public to contrib-ute, disseminate, and exchange information (Kaplan & Haenlein,2010), by introducing a bottom-up alternative to complementthe traditional top-down nature of Web 1.0 (Schneckenberg,2009). This has not only resulted in a change in traditional journal-ism and news reporting (Deuze, 2008; Kwak, Lee, Park, & Moon,2010), but it is also leading to new opportunities within the geo-graphical sciences (Caverlee, Cheng, Sui, & Kamath, 2013; Sui &Goodchild, 2011) due to the rich geographic context and contextsocial media data often provides. A noteworthy example of thistrend is the livehoods project (Cranshaw, Schwartz, Hong, &Sadeh, 2012) that is used to characterize and understand urbandynamics using social media. Indeed, social media, and micro-bog-ging in particular, have already been shown useful in predictingpandemics (Chunara, Andrews, & Brownstein, 2012; Culotta,2010; Ritterman, Osborne, & Klein, 2009) or natural disasters
a feeds.
2 A. Croitoru et al. / Computers, Environment and Urban Systems xxx (2014) xxx–xxx
(e.g. Corbane, Lemoine, & Kauffmann, 2012; Crooks, Croitoru,Stefanidis, & Radzikowski, 2013; Zook, Graham, Shelton, &Gorman, 2010) to name a few.
As we increasingly embrace the use of crowd-contributed con-tent, gaining a better understanding of how physical space eventsare reported and discussed within these hybrid communities is asubstantial theoretical challenge that also has significant applica-tion potential. This paper addresses this challenge by studyinghow information propagates and evolves over time at the intersec-tion of the physical and cyber spaces, considering representativetest cases and studying them under the lens of geosocial analysis.By analyzing the spatial footprint, social network structure, andcontent in both physical and cyber spaces we can advance ourunderstanding of the complex mechanism through which informa-tion regarding localized events is propagated through social media.
A particularity of social media that renders such study neces-sary is the fact that, unlike other forms of volunteered geographicinformation, contributions there are part of a networking process,whereby individuals share and exchange information with othermembers of these online communities (Stefanidis et al., 2013). Thisnetworking activity may center around a variety of topics, rangingfrom personal observations on minutia to commentaries on issuesof broader interest (Aiello et al., 2013; Mischaud, 2007). Under-standing how people participate in this process remains a substan-tial, cross-disciplinary theoretical challenge. As a way to addressthis issue, Farnham and Churchill (2011), for example, discussedthe issue of cyber (online) presences, governed by principles of cyberinteraction and information flow. However, as these studiesemerged from the social psychology domain, they often fail to ade-quately address the role of the physical space in these cyber inter-actions. People still live and function primarily in a physical space(rather than the cyber one), and their interactions in this space stillplay a central role in shaping their behavior. As social mediabecomes an integral part of our societies, understanding the inter-play between cyber presence and the corresponding physical space(so called ‘‘polysocial reality’’ (Applin & Fischer, 2012)) becomesincreasingly important, as it will elevate our capability to leveragesuch content for a variety of purposes.
Mapping and understanding the relations between the cyberand the physical spaces, and in particular the information flowbetween them is a substantial scientific research challenge, asthese two spaces are often not explicitly related, nor are they stud-ied in tandem. The emergence of geolocated social media presentsa unique opportunity to address this challenge by allowing us tolink cyber and physical activities through user interactions, andunderstand how peoples’ actions and reactions to events manifestthemselves across these spaces. Such knowledge is critical in awide range of applications of broader societal value (e.g. disasterresponse), providing additional motivation for this research.
Our focus is on studying the connections between the cyber andthe physical spaces (especially as it relates to reports of events inthe physical space), as they are expressed through social associa-tions and physical proximity. By doing so we will show how wecan identify connections across these two spaces, and demonstratethe value of studying both simultaneously rather than separately.We argue that by studying social networks in both physical andcyber spaces, combining social network analysis (SNA) and spatio-temporal data clustering we can better understand their complexstructure. While SNA is a rapidly growing field (e.g., Newman(2010) and Barabási (2012)), it is only recently emerging as a toolin geospatial analysis, and is often underutilized (Ter Wal &Boschma, 2009). Moreover, SNA too is weakened because of thelack of geographic consideration when exploring social relations(e.g. Bosco, 2006). Only recently have we started seeing some earlystudies that attempt to infuse geography into this issue, addressingfor example the geographic scope of topics discussed in on-line
Please cite this article in press as: Croitoru, A., et al. Linking cyber and physicalComputers, Environment and Urban Systems (2014), http://dx.doi.org/10.1016/j.
communities (HerdaGdelen, Zuo, Gard-Murray, and Bar-Yam(2013)). Our work contributes to this issue by linking the cyberand physical spaces through SNA and spatiotemporal analysis,aiming to bridge the gap between these two fields.
The remainder of this paper is organized as follows. In Section 2we discuss the rise of geosocial media as a new social communica-tion avenue and a novel source of geosocial information. In partic-ular, we discuss the notion of physical presence within socialmedia and its importance for exploring the relation between thecyber and the physical domains. In Section 3 we discuss how com-munities and groups can be detected in both the cyber and physi-cal space, and how they can be processed to form a ‘hybrid’geosocial view of communities. To showcase these concepts andtheir benefits, in Section 4 we present the analysis of two casestudies that make use of Twitter data associated with two differenttypes of events: a planned activity during the Occupy Wall Street(OWS) Day of Action (November 17th, 2011), and the response tothe Boston Marathon Bombing (April 15, 2013). This paper is con-cluded with a summary and outlook in Section 5.
2. The rise of geosocial media and spatial presence
The power of social media to disseminate information of socie-tal importance has been showcased over the last few years withrespect to a range events, from citizen journalism (e.g. the 2008Mumbai terrorist attacks; Arthur, 2008), to civil unrest (e.g. the2011 London riots (Glasgow, Ebaugh, & Fink, 2012) and the ‘ArabSpring’ (Christensen, 2011; Howard, Agarwal, & Mazammil,2011)), military operations (e.g. the 2011 U.S. raid on Bin Laden’shideaway (McCullagh, 2011)) and health (e.g. Culotta, 2010).Within this wide range of themes social media content oftenrelates to the real-world space and the events occurring in it, itmay contain some geolocation information, thus making it geoso-cial media. The emergence of such information represents a com-plementary approach to what was initially considered to beVolunteered Geographic Information (VGI; Goodchild, 2007; Sui,2008), as it focuses on geographic information that may be con-veyed through social media but not intentionally volunteered.
Generally, geolocation information in social media may beavailable at two different levels of granularity: in the form of pre-cise coordinates (e.g. GPS), or through a toponym detected in themedia content (e.g. mentioning a city name) that can be resolvedusing a gazetteer (e.g. Croitoru, Crooks, Radzikowski, & Stefanidis,2013; Fink et al., 2009). This information is typically harvestedtogether with the rest of the content from the corresponding socialmedia platform Application Programming Interfaces (APIs). Alter-natively, geolocation information can be harvested from the con-tent of the users’ profiles (e.g. establishing a user’s homelocation), however this information tends to be less reliable as itdoes not necessarily reflect user location at the moment that a par-ticular contribution was made (and is therefore not used in ourstudy). It is worth noting that reports on the percentage of geolo-cated social media – and twitter in particular – vary. For example,Java, Song, Finin, and Tseng (2009) report half of the tweets thatthey harvested had some geolocation information, in the form ofcoordinates or description, while Cheng, Caverlee, and Lee (2010)report that 21% of the tweets in their data corpus had toponymcontent, while another 5% of them had precise coordinates. Whilethe exact percentage of geolocated tweets may vary depending onthe theme and the studied area, we have observed in prior workthat on average the percentage of precisely geolocated tweetstends to be much lower, often in the range of 0.5–3.0%.
The ability to convey (and share) thematic as well as locationinformation through social media enables its users to establish pres-ence within their domain of interest. While the notion of presence
spaces through community detection and clustering in social media feeds.compenvurbsys.2014.11.002
A. Croitoru et al. / Computers, Environment and Urban Systems xxx (2014) xxx–xxx 3
has been previously explored in communication theory and mediapsychology (Wirth et al., 2007), the emergence of new media (suchas social media) and computer-mediated user interaction hasbrought to it renewed and significant interest (Biocca, Harms, &Burgoon, 2003). As a result, various ontologies of the notion of pres-ence have been proposed in recent years, in which different types ofpresence are identified (Mantovani & Riva, 1999). For example, Lee(2004) distinguished between spatial (also called physical), social,and self-presence, in which different types of user experiences andenablement are provided. Within this typology, of particular interestto our work is the notion of spatial presence as it relates to the enable-ment of humans to feel present in a space through the use of media.For example, during a high impact event, social media users maydevelop a sense of ‘living’ the event and even being at its impact area,and as a result communicate their experiences by creating socialmedia content. In this context, recent work has highlighted the roleof feeling and the user’s capacity to develop mental imagery ofscenes in developing such spatial presence (Rodríguez-Ardura &Martínez-López, 2014; Schubert, 2009).
For the purpose of our research we adopt the spatial presencetheory presented by Wirth et al. (2007). Accordingly, we definespatial presence as a ‘‘sense of ‘being there’ which occurs when apart or all of a person’s perception fails to accurately acknowledgethe role of technology that makes it appear that s/he is in a physicallocation and environment other from her/his actual location andenvironment in the physical world’’ (Wirth et al., 2007; p. 495).The spatial presence theory models the establishment of spatialpresence as a two-step process: in the first step a mental modelof the situation is constructed, and in the second step spatial pres-ence emerges through the formation of a perceptual hypothesis. Itis important to note that in this model spatial presence is consid-ered a binary mode (i.e. it may exist or not exist for a given user)rather than a continuum. Furthermore, both Lee (2004) andWirth et al. (2007) highlight that in this model spatial presencecan emerge even in non-immersive media with no sensory inputs,such as simple text.
The significance of the spatial presence theory for our work liesin its affordance to distinguish between users who establish spatialpresence in the physical space of interest and others who do not. Inthis research we therefore regard presence not only in the strictsense of actual presence in the physical space of interest (as con-veyed by precise GPS coordinates), but also in the psychologicalsense of experiencing spatial presence. Put differently, we regardthe intentional action of including geolocation information, e.g. atoponym, in a social media message as an active expression ofestablishing spatial presence. Accordingly, a user’s spatial presencecan be perceived as the aggregate of the spatial locations associ-ated with the user’s activities and interests as they are capturedthrough social media content. As a result, we consider geolocatedmessages as belonging to the physical space of interest. Conversely,social media content that does not include geolocation information(and is not precisely geolocated), for which evidence of spatialpresence was not conveyed, is considered as belonging to a cyberspace as it originated from users who did not intentionallyexpressed spatial presence in the physical domain. As we discussin Section 3, this distinction lays the ground for our geosocialanalysis.
3. Cyber space communities and physical space groups
Social media have proven to be a fertile ground for fosteringuser interaction, thus supporting the large-scale synthesis of thevirtual and the real (Gordon & Manosevitch, 2011; Mitra, 2003;Parks, 2011). As a result, communities with various degrees ofphysical and virtual presence are formed (Mitra & Schwartz,
Please cite this article in press as: Croitoru, A., et al. Linking cyber and physicalComputers, Environment and Urban Systems (2014), http://dx.doi.org/10.1016/j.
2001), linking physical spaces, cyber spaces, and human activity.In earlier work, Porter (2004) outlined a typology for virtual com-munities, and discussed their attributes, namely purpose, place,platform, and pattern of interaction, noting that further researchis required in order to gain better understanding of the interplaybetween physical space, place, and the virtual. Social media pro-vides an opportunity to tackle this challenge by enabling us toobserve how people, either individual or groups, act and interactin the physical and the virtual space. While in the past consider-able attention was given to the mapping and understanding ofthe physical space in which human activity takes place, the riseof social media, and the ability of individuals embedded in thephysical space to report and share information provides a uniqueopportunity to jointly study the cyber and physical domains, andtheir respective communities. In order to understand the relation-ship between these two spaces, we propose a geosocial approach,where communities in cyber space are compared and contrastedagainst physical space clusters.
Our interest in community detection stems from the centralrole communities have in building our understanding of humanactivity and social processes. In particular, it has been recognizedthat uncovering community structures in social networks facili-tates the development of a deeper understanding of the functionand properties of large social networks, as well as shedding lighton the processes of information propagation and diffusion in net-works (Murata, 2010). However, community formation in cyber-space is a complex process, emerging through various levels ofinteractivity and diverse forms of communication (Kollock &Smith, 1998; Murata, 2010; Obst & White, 2004) and psychologicaltraits (Friggeri, Lambiotte, Kosinski, & Fleury, 2012; Obst, Smith, &Zinkiewicz, 2002). Relevant to our work, Harrison and Dourish(1996) recognized the emergence of a new form of space and placethat is enabled through the computer-mediated interactions ofhumans, where space and place can exist on a continuum rangingfrom the physical to the virtual. This cyber-physical continuum isalso described in Virnoche and Marx (1997), in which a typologyof communities based on shared geographic and virtual spaces ispresented and described through a ‘degree of virtualness’. In thesame vein, Gruzd, Wellman, and Takhteyev (2011) recently studiedthe notion of community in Twitter, noting that although Twitterwas not designed to support the development of communities, itdoes foster the development of so-called ‘imagined communities’.
In view of this prior work, we seek to develop an approach forstudying communities with both in cyber and physical space fromsocial media data, with a particular emphasis on understanding thelinks between these spaces. From this perspective communities areviewed as groups of users that are more densely connected to eachother than to the rest of the network (Papadopoulos, Kompatsiaris,Vakali, & Spyridonos, 2012). Within this approach, our distinctionbetween cyber space and physical space is based on the spatialpresence theory, as discussed in Section 2. It is important to notethat the underlying assumption in our approach is the emergenceof a social network through social media interaction, whichdenotes the establishment of some form of association betweenusers, however short or long its duration may be (Java et al.,2009; Purohit, Ruan, Joshi, Parthasarathy, & Sheth, 2011; Zhang,Wu, & Yang, 2012). For example, in the case of Twitter, a networkcan be formed based on different conversational elements, such asretweets (‘‘RT’’) or mentions ‘‘@’’ (Boyd, Golder, & Lotan, 2010;Dann, 2010; Kim, Seo, Ha, Lim, & Yoon, 2013), or based on user-declared relations such as ‘‘following’’ (Gruzd et al., 2011).
3.1. Detecting communities in social networks
Much of the value and power of social media lies in the abilityto capture associations between users through their activities (e.g.
spaces through community detection and clustering in social media feeds.compenvurbsys.2014.11.002
4 A. Croitoru et al. / Computers, Environment and Urban Systems xxx (2014) xxx–xxx
a retweet in the case of Twitter), from which social networks couldbe constructed. More specifically, we consider here a social net-work G=(V,E) in which V a set of vertices (social media users) andE # V � V is a set of edges that are established through user inter-actions (e.g. retweeting). Our interest in constructing such net-works and detecting communities in them stems from the needto understand the role and function of communities in the propa-gation of information about real-world events, both between com-munities in the same domain (i.e. cyber or physical) andcommunities in different domains. For this purpose, we regardthe task of detecting communities as a data-mining problem, inwhich a community is defined as ‘groups (of network nodes)within which the network connections are dense, but betweenwhich they are sparser’ (Newman, 2006; Newman & Girvan,2004; Papadopoulos et al., 2012; Yang, Liu, & Liu, 2010). While var-ious other definitions have been proposed (see Yang, Liu, et al.(2010) and Murata (2010) for a more in-depth discussion), the def-inition used here is arguably the most commonly used (Plantié &Crampes, 2013).
The problem of community detection has been studied exten-sively in recent years (e.g., Newman, 2004a; Papadopoulos et al.,2012; Yang, Liu, et al., 2010). In a recent survey on communitydetection, Plantié and Crampes (2013) presented a classificationmethod of the different approaches to the problem based on theinputs and outputs of each approach. Their survey indicated thatmost community detection algorithms use a graph (network) asinput and provide a partition of the graph as output, where the par-tition is formed through a top-down process, a bottom-up process,or a clustering process. In these algorithms the objective functionto be optimized is typically an edge centrality measure (as a min-imization problem) or a modularity measure (as a maximizationproblem). For the purpose of our research we utilize the Louvainmethod for detecting communities (Blondel, Guillaume,Lambiotte, & Lefebvre, 2008), an iterative bottom-up approach thatoptimizes a modularity metric Q that serves as an indication for theoverall quality of a given graph partition (Clauset, Newman, &Moore, 2004; Newman, 2004b; Newman & Girvan, 2004). In thisapproach, Q provides a measure of the difference between theobserved and expected edge density within a network subset.The modularity measure can be either positive or negative, wherepositive values indicate the possible presence of community struc-ture (Newman, 2006), and the higher the modularity the moredensely connected the nodes within the partition sets (Wakita &Tsurumi, 2007).
3.2. Clustering groups in physical space
While cyberspace communities emerge through user interac-tions, groups in physical space can be formed through proximityof individuals in space and time. Like the identification of commu-nities in cyberspace, identifying groups in the physical space can beregarded as a set partitioning or clustering problem. A widely usedapproach to detect such clusters is to apply density-based cluster-ing, such as the Density Based Spatial Clustering of Applicationwith Noise (DBSCAN; Ester, Kriegel, Sander, & Xu, 1996). DBSCANis a well-established clustering algorithm that builds on densityas a measure for defining and detecting clusters. The algorithmaims to find the maximal set of points that meet a certain densityproperty based on two user-defined parameters: a neighborhoodradius e and a minimum number of points d. These parameterscan be determined through domain knowledge, or through a heu-ristic estimation algorithm (e.g., the ‘Automatic Epsilon Calcula-tion’ method by Gorawski and Malczok (2006)). DBSCAN offersseveral distinct advantages, including the ability to distinguishnoise in the data, accommodate arbitrary cluster shapes, and per-form clustering without prior knowledge or assumptions on the
Please cite this article in press as: Croitoru, A., et al. Linking cyber and physicalComputers, Environment and Urban Systems (2014), http://dx.doi.org/10.1016/j.
number of clusters. Despite these advantages, algorithms such asDBSCAN have a key shortcoming when applied to geolocated socialdata feeds, namely the lack of temporal awareness: it does not con-sider that data is received as a stream (i.e. tweets that are reportedas an event develops over time). This temporal nature of the data isparticularly important since it allows monitoring an event as itunfolds and provide insight into how its footprint evolves.
To address these issues we employ a stream-based clusteringalgorithm. There exist several approaches to incorporate the tem-poral aspect of the data into the clustering problem, such as den-sity-based approaches (for a recent extensive review of densitybased stream clustering algorithms see Amini, Wah, & Saboohi,2014), probabilistic approaches (Aggarwal, 2013), or geostatisticalapproaches (Christakos, 2000). In this work we utilize DenStream(Cao, Ester, Qian, & Zhou, 2006), a density-based clustering algo-rithm over an evolving data Stream in the presence of noise thatbuilds on the stream clustering framework of Aggarwal, Han,Wang, and Yu (2003). In the context of our work, we apply Den-Stream to a stream of geolocated tweets, in order to identify groupsof Twitter users in space and time, and explore their interactions inthe physical space.
Extending DBSCAN, DenStream is based on three user-definedparameters: a minimum weight threshold m, a cluster radiusthreshold e, and a scaling parameter b (0 < b < 1) of m. Two of theseparameters (m and b) are user-derived, and can be set through apriori domain knowledge or a training data set (e.g. Miller,Dickinson, Deitrick, Hu, & Wang, 2014), while the third parameter(e) is initialized by DBSCAN as explained below. The fundamentalidea behind DenStream is the formation of micro-clusters thatemerge and evolve as data is received from the stream. The algo-rithm begins by applying DBSCAN on an initial stream dataset,from which e is initialized and seed (candidate) clusters arederived. Then, at each consecutive step of the algorithm (as pointdata is received from the stream) points either form a newmicro-cluster or are added to the closest micro-clusters based onspatial proximity using the Euclidean distance measure. In orderto account for the temporal aspect of the data, DenStream assignsa weight to each data point using a time decay function of the formf ðtÞ ¼ 2�kDt , where Dt is the difference between the calculationtime and the time stamp of the data point, and k is a constant thatallows determining the importance of historical data in the cluster-ing process. k can be determined from the data stream rates orthrough a priori domain knowledge about the observed phenome-non. Cao et al. (2006), who performed sensitivity analysis of thequality of the clustering as a function of k, reported that DenStremexhibited relatively stable quality for a wide range of k, thusallowing the algorithm to perform well when k is not known pre-cisely. Similar results were also reported for the scaling parameterb.
Based on the time decay function, and after the initializationprocess, DenStream then clusters points into micro-clusters, whereeach cluster is characterized by three time-variable parameters: aweight w(t) that is calculated as the sum of the weights f(t) of allpoints in the cluster, a center c(t) that is calculated as the weightedaverage of the coordinates of all points in the cluster, and a radiusr(t) that is calculated as the weighted average of the distance of allthe points in the cluster from its center c(t). As points are receivedfrom the data stream and clustered into micro-clusters, DenStreamdynamically maintains three classes of clusters (and updates theirparameters): core clusters for which w(t) > m and r(t) < e, potentialclusters for which w(t) P bm and r(t) < e, and outlier (noise) clus-ters for which w(t) < bm. In addition, each cluster is tagged witha time stamp indicating its creation. Through DenStream, we aretherefore able identify and collect for a given data stream a set ofcore clusters that will be used for analyzing the physical spacegroups.
spaces through community detection and clustering in social media feeds.compenvurbsys.2014.11.002
A. Croitoru et al. / Computers, Environment and Urban Systems xxx (2014) xxx–xxx 5
3.3. A geosocial view of communities
Both communities and groups can be studied in their respectivedomains, cyber space and physical space, to gain insights into therole and function of each type of higher-order structure of users.However, performing such analysis in only one domain indepen-dently while ignoring the other may lead to loss of information,and in turn may impact our ability to derive valuable knowledge.To demonstrate this, consider for example a Twitter user for whichno location information is available who is being retweeted exten-sively by two Twitter users who are in close physical space proxim-ity. Analyzing a retweet network only in cyber space or in physicalspace will not convey such information, even though it may beessential for the understanding of information propagation in bothspaces. Consequently, we argue that in order to better understandhow information is shared between spaces a hybrid approach isneeded, in which the links within each space as well as the linksbetween the cyber and the physical spaces are explored. We referto this as a geosocial view of communities.
Our analysis approach builds on the representation of theassociations between cyber space users and physical space usersas a bipartite graph (sometimes referred to as two-mode network(Prell, 2012)). More formally, let T and B be the sets of ‘top’ and‘bottom’ non-empty node sets (i.e. social media users) suchthat T \ B ¼£. Given T and B, a bipartite graph is the tripletGB = (T,B,E) in which E # T � B is a set of links (Latapy,Magnien, & Del Vecchio, 2008). Accordingly, a bipartite graphrepresents only the links between T and B rather than the linkswithin B or T. In order to construct our hybrid cyber-physical geo-social view that captures the relations between cyber space andphysical space we construct a bipartite graph GB = (C,P,E) suchthat C is the set of cyber space nodes, P is the set of (geolocated)physical space nodes, C and P are disjoint (i.e. in our analysiseach user can be either geolocated or non-geolocated), andE # C � P is the set of links that transcend the cyber and thephysical spaces. As we are particularly interested in the propaga-tion of information between these two spaces it is important thatE will capture the direction of the flow of information making GB
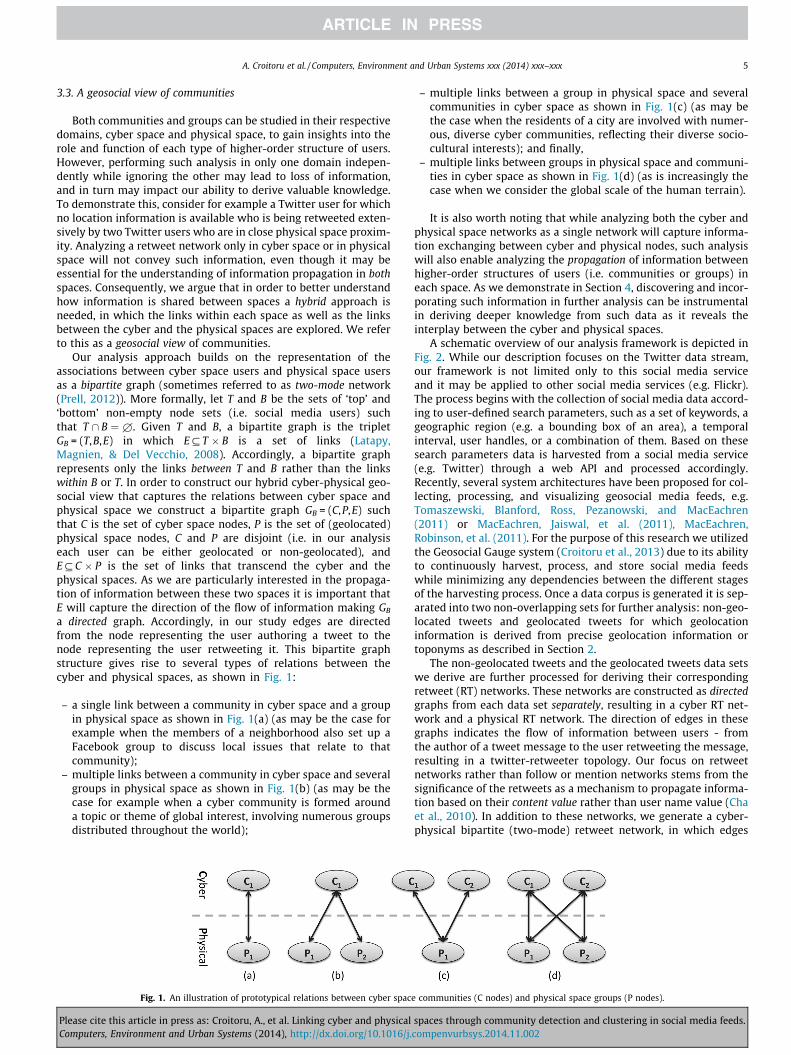
a directed graph. Accordingly, in our study edges are directedfrom the node representing the user authoring a tweet to thenode representing the user retweeting it. This bipartite graphstructure gives rise to several types of relations between thecyber and physical spaces, as shown in Fig. 1:
– a single link between a community in cyber space and a groupin physical space as shown in Fig. 1(a) (as may be the case forexample when the members of a neighborhood also set up aFacebook group to discuss local issues that relate to thatcommunity);
– multiple links between a community in cyber space and severalgroups in physical space as shown in Fig. 1(b) (as may be thecase for example when a cyber community is formed arounda topic or theme of global interest, involving numerous groupsdistributed throughout the world);
Fig. 1. An illustration of prototypical relations between cyber spac
Please cite this article in press as: Croitoru, A., et al. Linking cyber and physicalComputers, Environment and Urban Systems (2014), http://dx.doi.org/10.1016/j.
– multiple links between a group in physical space and severalcommunities in cyber space as shown in Fig. 1(c) (as may bethe case when the residents of a city are involved with numer-ous, diverse cyber communities, reflecting their diverse socio-cultural interests); and finally,
– multiple links between groups in physical space and communi-ties in cyber space as shown in Fig. 1(d) (as is increasingly thecase when we consider the global scale of the human terrain).
It is also worth noting that while analyzing both the cyber andphysical space networks as a single network will capture informa-tion exchanging between cyber and physical nodes, such analysiswill also enable analyzing the propagation of information betweenhigher-order structures of users (i.e. communities or groups) ineach space. As we demonstrate in Section 4, discovering and incor-porating such information in further analysis can be instrumentalin deriving deeper knowledge from such data as it reveals theinterplay between the cyber and physical spaces.
A schematic overview of our analysis framework is depicted inFig. 2. While our description focuses on the Twitter data stream,our framework is not limited only to this social media serviceand it may be applied to other social media services (e.g. Flickr).The process begins with the collection of social media data accord-ing to user-defined search parameters, such as a set of keywords, ageographic region (e.g. a bounding box of an area), a temporalinterval, user handles, or a combination of them. Based on thesesearch parameters data is harvested from a social media service(e.g. Twitter) through a web API and processed accordingly.Recently, several system architectures have been proposed for col-lecting, processing, and visualizing geosocial media feeds, e.g.Tomaszewski, Blanford, Ross, Pezanowski, and MacEachren(2011) or MacEachren, Jaiswal, et al. (2011), MacEachren,Robinson, et al. (2011). For the purpose of this research we utilizedthe Geosocial Gauge system (Croitoru et al., 2013) due to its abilityto continuously harvest, process, and store social media feedswhile minimizing any dependencies between the different stagesof the harvesting process. Once a data corpus is generated it is sep-arated into two non-overlapping sets for further analysis: non-geo-located tweets and geolocated tweets for which geolocationinformation is derived from precise geolocation information ortoponyms as described in Section 2.
The non-geolocated tweets and the geolocated tweets data setswe derive are further processed for deriving their correspondingretweet (RT) networks. These networks are constructed as directedgraphs from each data set separately, resulting in a cyber RT net-work and a physical RT network. The direction of edges in thesegraphs indicates the flow of information between users - fromthe author of a tweet message to the user retweeting the message,resulting in a twitter-retweeter topology. Our focus on retweetnetworks rather than follow or mention networks stems from thesignificance of the retweets as a mechanism to propagate informa-tion based on their content value rather than user name value (Chaet al., 2010). In addition to these networks, we generate a cyber-physical bipartite (two-mode) retweet network, in which edges
e communities (C nodes) and physical space groups (P nodes).
spaces through community detection and clustering in social media feeds.compenvurbsys.2014.11.002
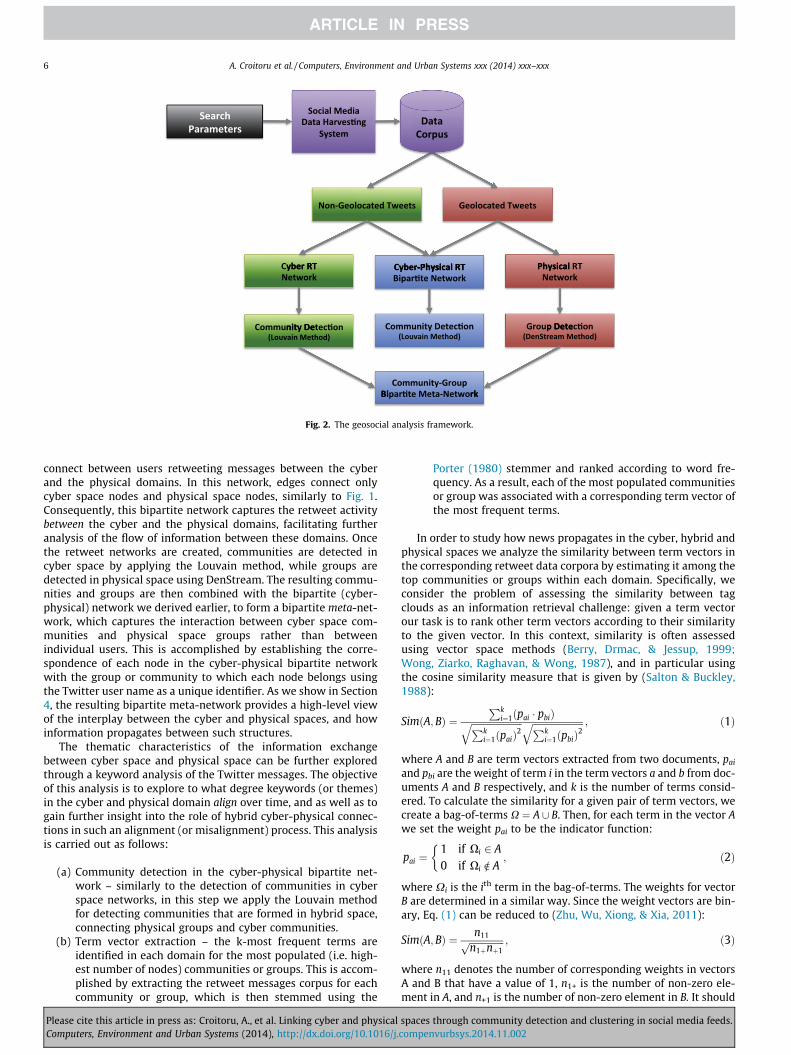
Fig. 2. The geosocial analysis framework.
6 A. Croitoru et al. / Computers, Environment and Urban Systems xxx (2014) xxx–xxx
connect between users retweeting messages between the cyberand the physical domains. In this network, edges connect onlycyber space nodes and physical space nodes, similarly to Fig. 1.Consequently, this bipartite network captures the retweet activitybetween the cyber and the physical domains, facilitating furtheranalysis of the flow of information between these domains. Oncethe retweet networks are created, communities are detected incyber space by applying the Louvain method, while groups aredetected in physical space using DenStream. The resulting commu-nities and groups are then combined with the bipartite (cyber-physical) network we derived earlier, to form a bipartite meta-net-work, which captures the interaction between cyber space com-munities and physical space groups rather than betweenindividual users. This is accomplished by establishing the corre-spondence of each node in the cyber-physical bipartite networkwith the group or community to which each node belongs usingthe Twitter user name as a unique identifier. As we show in Section4, the resulting bipartite meta-network provides a high-level viewof the interplay between the cyber and physical spaces, and howinformation propagates between such structures.
The thematic characteristics of the information exchangebetween cyber space and physical space can be further exploredthrough a keyword analysis of the Twitter messages. The objectiveof this analysis is to explore to what degree keywords (or themes)in the cyber and physical domain align over time, and as well as togain further insight into the role of hybrid cyber-physical connec-tions in such an alignment (or misalignment) process. This analysisis carried out as follows:
(a) Community detection in the cyber-physical bipartite net-work – similarly to the detection of communities in cyberspace networks, in this step we apply the Louvain methodfor detecting communities that are formed in hybrid space,connecting physical groups and cyber communities.
(b) Term vector extraction – the k-most frequent terms areidentified in each domain for the most populated (i.e. high-est number of nodes) communities or groups. This is accom-plished by extracting the retweet messages corpus for eachcommunity or group, which is then stemmed using the
Please cite this article in press as: Croitoru, A., et al. Linking cyber and physicalComputers, Environment and Urban Systems (2014), http://dx.doi.org/10.1016/j.
Porter (1980) stemmer and ranked according to word fre-quency. As a result, each of the most populated communitiesor group was associated with a corresponding term vector ofthe most frequent terms.
In order to study how news propagates in the cyber, hybrid andphysical spaces we analyze the similarity between term vectors inthe corresponding retweet data corpora by estimating it among thetop communities or groups within each domain. Specifically, weconsider the problem of assessing the similarity between tagclouds as an information retrieval challenge: given a term vectorour task is to rank other term vectors according to their similarityto the given vector. In this context, similarity is often assessedusing vector space methods (Berry, Drmac, & Jessup, 1999;Wong, Ziarko, Raghavan, & Wong, 1987), and in particular usingthe cosine similarity measure that is given by (Salton & Buckley,1988):
SimðA;BÞ ¼Pk
i¼1ðpai � pbiÞffiffiffiffiffiffiffiffiffiffiffiffiffiffiffiffiffiffiffiffiffiffiPki¼1ðpaiÞ
2q ffiffiffiffiffiffiffiffiffiffiffiffiffiffiffiffiffiffiffiffiffiffiPk
i¼1ðpbiÞ2
q ; ð1Þ
where A and B are term vectors extracted from two documents, pai
and pbi are the weight of term i in the term vectors a and b from doc-uments A and B respectively, and k is the number of terms consid-ered. To calculate the similarity for a given pair of term vectors, wecreate a bag-of-terms X ¼ A [ B. Then, for each term in the vector Awe set the weight pai to be the indicator function:
pai ¼1 if Xi 2 A
0 if Xi R A
�; ð2Þ
where Xi is the ith term in the bag-of-terms. The weights for vectorB are determined in a similar way. Since the weight vectors are bin-ary, Eq. (1) can be reduced to (Zhu, Wu, Xiong, & Xia, 2011):
SimðA;BÞ ¼ n11ffiffiffiffiffiffiffiffiffiffiffiffiffiffiffin1þnþ1p ; ð3Þ
where n11 denotes the number of corresponding weights in vectorsA and B that have a value of 1, n1+ is the number of non-zero ele-ment in A, and n+1 is the number of non-zero element in B. It should
spaces through community detection and clustering in social media feeds.compenvurbsys.2014.11.002
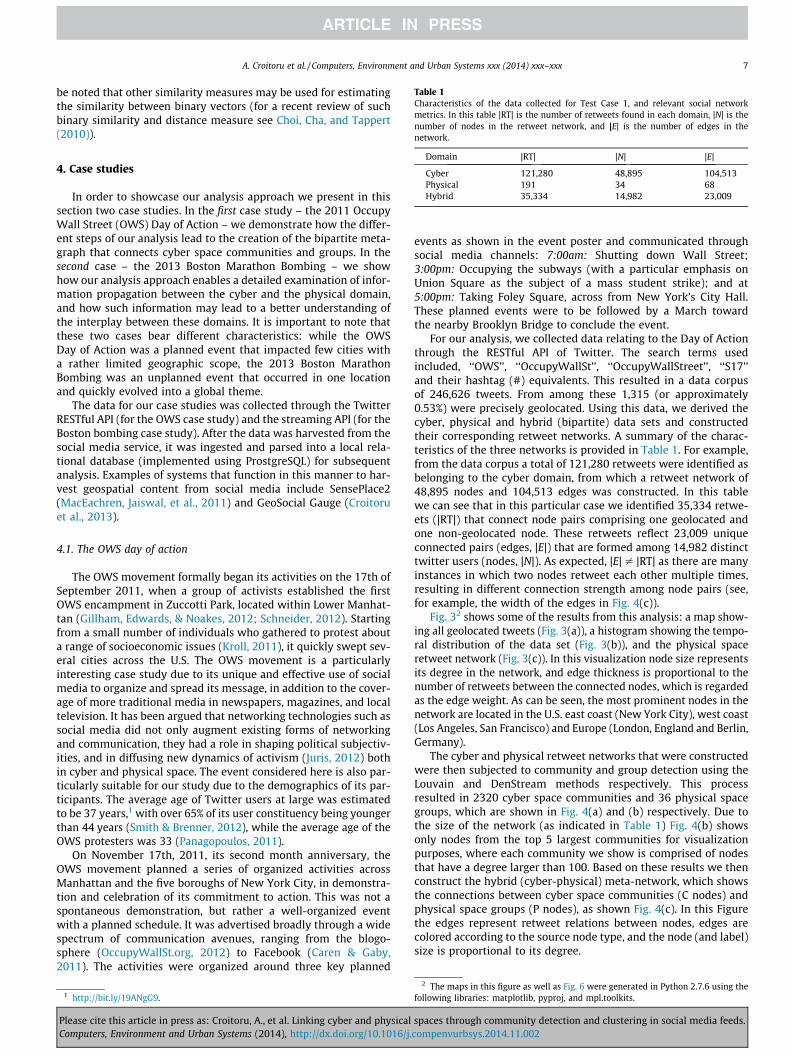
Table 1Characteristics of the data collected for Test Case 1, and relevant social networkmetrics. In this table |RT| is the number of retweets found in each domain, |N| is thenumber of nodes in the retweet network, and |E| is the number of edges in thenetwork.
A. Croitoru et al. / Computers, Environment and Urban Systems xxx (2014) xxx–xxx 7
be noted that other similarity measures may be used for estimatingthe similarity between binary vectors (for a recent review of suchbinary similarity and distance measure see Choi, Cha, and Tappert(2010)).
Domain |RT| |N| |E|
Cyber 121,280 48,895 104,513Physical 191 34 68Hybrid 35,334 14,982 23,009
4. Case studies
In order to showcase our analysis approach we present in thissection two case studies. In the first case study – the 2011 OccupyWall Street (OWS) Day of Action – we demonstrate how the differ-ent steps of our analysis lead to the creation of the bipartite meta-graph that connects cyber space communities and groups. In thesecond case – the 2013 Boston Marathon Bombing – we showhow our analysis approach enables a detailed examination of infor-mation propagation between the cyber and the physical domain,and how such information may lead to a better understanding ofthe interplay between these domains. It is important to note thatthese two cases bear different characteristics: while the OWSDay of Action was a planned event that impacted few cities witha rather limited geographic scope, the 2013 Boston MarathonBombing was an unplanned event that occurred in one locationand quickly evolved into a global theme.
The data for our case studies was collected through the TwitterRESTful API (for the OWS case study) and the streaming API (for theBoston bombing case study). After the data was harvested from thesocial media service, it was ingested and parsed into a local rela-tional database (implemented using ProstgreSQL) for subsequentanalysis. Examples of systems that function in this manner to har-vest geospatial content from social media include SensePlace2(MacEachren, Jaiswal, et al., 2011) and GeoSocial Gauge (Croitoruet al., 2013).
4.1. The OWS day of action
The OWS movement formally began its activities on the 17th ofSeptember 2011, when a group of activists established the firstOWS encampment in Zuccotti Park, located within Lower Manhat-tan (Gillham, Edwards, & Noakes, 2012; Schneider, 2012). Startingfrom a small number of individuals who gathered to protest abouta range of socioeconomic issues (Kroll, 2011), it quickly swept sev-eral cities across the U.S. The OWS movement is a particularlyinteresting case study due to its unique and effective use of socialmedia to organize and spread its message, in addition to the cover-age of more traditional media in newspapers, magazines, and localtelevision. It has been argued that networking technologies such associal media did not only augment existing forms of networkingand communication, they had a role in shaping political subjectiv-ities, and in diffusing new dynamics of activism (Juris, 2012) bothin cyber and physical space. The event considered here is also par-ticularly suitable for our study due to the demographics of its par-ticipants. The average age of Twitter users at large was estimatedto be 37 years,1 with over 65% of its user constituency being youngerthan 44 years (Smith & Brenner, 2012), while the average age of theOWS protesters was 33 (Panagopoulos, 2011).
On November 17th, 2011, its second month anniversary, theOWS movement planned a series of organized activities acrossManhattan and the five boroughs of New York City, in demonstra-tion and celebration of its commitment to action. This was not aspontaneous demonstration, but rather a well-organized eventwith a planned schedule. It was advertised broadly through a widespectrum of communication avenues, ranging from the blogo-sphere (OccupyWallSt.org, 2012) to Facebook (Caren & Gaby,2011). The activities were organized around three key planned
1 http://bit.ly/19ANgG9.
Please cite this article in press as: Croitoru, A., et al. Linking cyber and physicalComputers, Environment and Urban Systems (2014), http://dx.doi.org/10.1016/j.
events as shown in the event poster and communicated throughsocial media channels: 7:00am: Shutting down Wall Street;3:00pm: Occupying the subways (with a particular emphasis onUnion Square as the subject of a mass student strike); and at5:00pm: Taking Foley Square, across from New York’s City Hall.These planned events were to be followed by a March towardthe nearby Brooklyn Bridge to conclude the event.
For our analysis, we collected data relating to the Day of Actionthrough the RESTful API of Twitter. The search terms usedincluded, ‘‘OWS’’, ‘‘OccupyWallSt’’, ‘‘OccupyWallStreet’’, ‘‘S17’’and their hashtag (#) equivalents. This resulted in a data corpusof 246,626 tweets. From among these 1,315 (or approximately0.53%) were precisely geolocated. Using this data, we derived thecyber, physical and hybrid (bipartite) data sets and constructedtheir corresponding retweet networks. A summary of the charac-teristics of the three networks is provided in Table 1. For example,from the data corpus a total of 121,280 retweets were identified asbelonging to the cyber domain, from which a retweet network of48,895 nodes and 104,513 edges was constructed. In this tablewe can see that in this particular case we identified 35,334 retwe-ets (|RT|) that connect node pairs comprising one geolocated andone non-geolocated node. These retweets reflect 23,009 uniqueconnected pairs (edges, |E|) that are formed among 14,982 distincttwitter users (nodes, |N|). As expected, |E| – |RT| as there are manyinstances in which two nodes retweet each other multiple times,resulting in different connection strength among node pairs (see,for example, the width of the edges in Fig. 4(c)).
Fig. 32 shows some of the results from this analysis: a map show-ing all geolocated tweets (Fig. 3(a)), a histogram showing the tempo-ral distribution of the data set (Fig. 3(b)), and the physical spaceretweet network (Fig. 3(c)). In this visualization node size representsits degree in the network, and edge thickness is proportional to thenumber of retweets between the connected nodes, which is regardedas the edge weight. As can be seen, the most prominent nodes in thenetwork are located in the U.S. east coast (New York City), west coast(Los Angeles, San Francisco) and Europe (London, England and Berlin,Germany).
The cyber and physical retweet networks that were constructedwere then subjected to community and group detection using theLouvain and DenStream methods respectively. This processresulted in 2320 cyber space communities and 36 physical spacegroups, which are shown in Fig. 4(a) and (b) respectively. Due tothe size of the network (as indicated in Table 1) Fig. 4(b) showsonly nodes from the top 5 largest communities for visualizationpurposes, where each community we show is comprised of nodesthat have a degree larger than 100. Based on these results we thenconstruct the hybrid (cyber-physical) meta-network, which showsthe connections between cyber space communities (C nodes) andphysical space groups (P nodes), as shown Fig. 4(c). In this Figurethe edges represent retweet relations between nodes, edges arecolored according to the source node type, and the node (and label)size is proportional to its degree.
2 The maps in this figure as well as Fig. 6 were generated in Python 2.7.6 using thefollowing libraries: matplotlib, pyproj, and mpl.toolkits.
spaces through community detection and clustering in social media feeds.compenvurbsys.2014.11.002
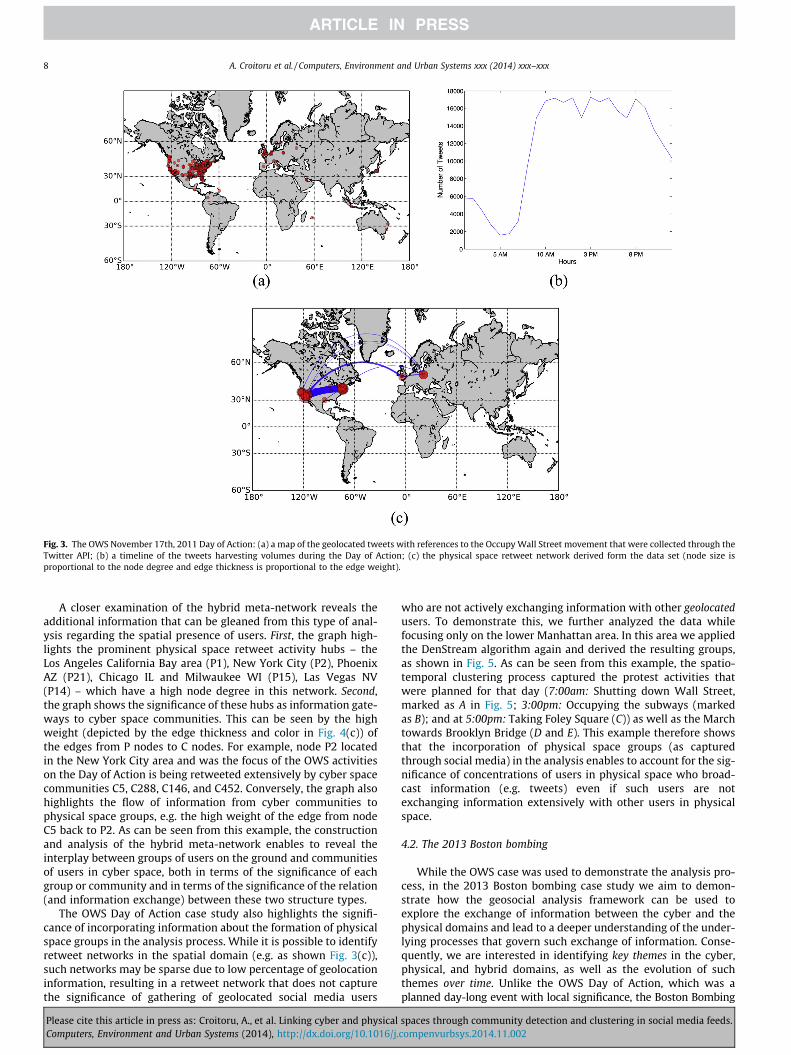
Fig. 3. The OWS November 17th, 2011 Day of Action: (a) a map of the geolocated tweets with references to the Occupy Wall Street movement that were collected through theTwitter API; (b) a timeline of the tweets harvesting volumes during the Day of Action; (c) the physical space retweet network derived form the data set (node size isproportional to the node degree and edge thickness is proportional to the edge weight).
8 A. Croitoru et al. / Computers, Environment and Urban Systems xxx (2014) xxx–xxx
A closer examination of the hybrid meta-network reveals theadditional information that can be gleaned from this type of anal-ysis regarding the spatial presence of users. First, the graph high-lights the prominent physical space retweet activity hubs – theLos Angeles California Bay area (P1), New York City (P2), PhoenixAZ (P21), Chicago IL and Milwaukee WI (P15), Las Vegas NV(P14) – which have a high node degree in this network. Second,the graph shows the significance of these hubs as information gate-ways to cyber space communities. This can be seen by the highweight (depicted by the edge thickness and color in Fig. 4(c)) ofthe edges from P nodes to C nodes. For example, node P2 locatedin the New York City area and was the focus of the OWS activitieson the Day of Action is being retweeted extensively by cyber spacecommunities C5, C288, C146, and C452. Conversely, the graph alsohighlights the flow of information from cyber communities tophysical space groups, e.g. the high weight of the edge from nodeC5 back to P2. As can be seen from this example, the constructionand analysis of the hybrid meta-network enables to reveal theinterplay between groups of users on the ground and communitiesof users in cyber space, both in terms of the significance of eachgroup or community and in terms of the significance of the relation(and information exchange) between these two structure types.
The OWS Day of Action case study also highlights the signifi-cance of incorporating information about the formation of physicalspace groups in the analysis process. While it is possible to identifyretweet networks in the spatial domain (e.g. as shown Fig. 3(c)),such networks may be sparse due to low percentage of geolocationinformation, resulting in a retweet network that does not capturethe significance of gathering of geolocated social media users
Please cite this article in press as: Croitoru, A., et al. Linking cyber and physicalComputers, Environment and Urban Systems (2014), http://dx.doi.org/10.1016/j.
who are not actively exchanging information with other geolocatedusers. To demonstrate this, we further analyzed the data whilefocusing only on the lower Manhattan area. In this area we appliedthe DenStream algorithm again and derived the resulting groups,as shown in Fig. 5. As can be seen from this example, the spatio-temporal clustering process captured the protest activities thatwere planned for that day (7:00am: Shutting down Wall Street,marked as A in Fig. 5; 3:00pm: Occupying the subways (markedas B); and at 5:00pm: Taking Foley Square (C)) as well as the Marchtowards Brooklyn Bridge (D and E). This example therefore showsthat the incorporation of physical space groups (as capturedthrough social media) in the analysis enables to account for the sig-nificance of concentrations of users in physical space who broad-cast information (e.g. tweets) even if such users are notexchanging information extensively with other users in physicalspace.
4.2. The 2013 Boston bombing
While the OWS case was used to demonstrate the analysis pro-cess, in the 2013 Boston bombing case study we aim to demon-strate how the geosocial analysis framework can be used toexplore the exchange of information between the cyber and thephysical domains and lead to a deeper understanding of the under-lying processes that govern such exchange of information. Conse-quently, we are interested in identifying key themes in the cyber,physical, and hybrid domains, as well as the evolution of suchthemes over time. Unlike the OWS Day of Action, which was aplanned day-long event with local significance, the Boston Bombing
spaces through community detection and clustering in social media feeds.compenvurbsys.2014.11.002
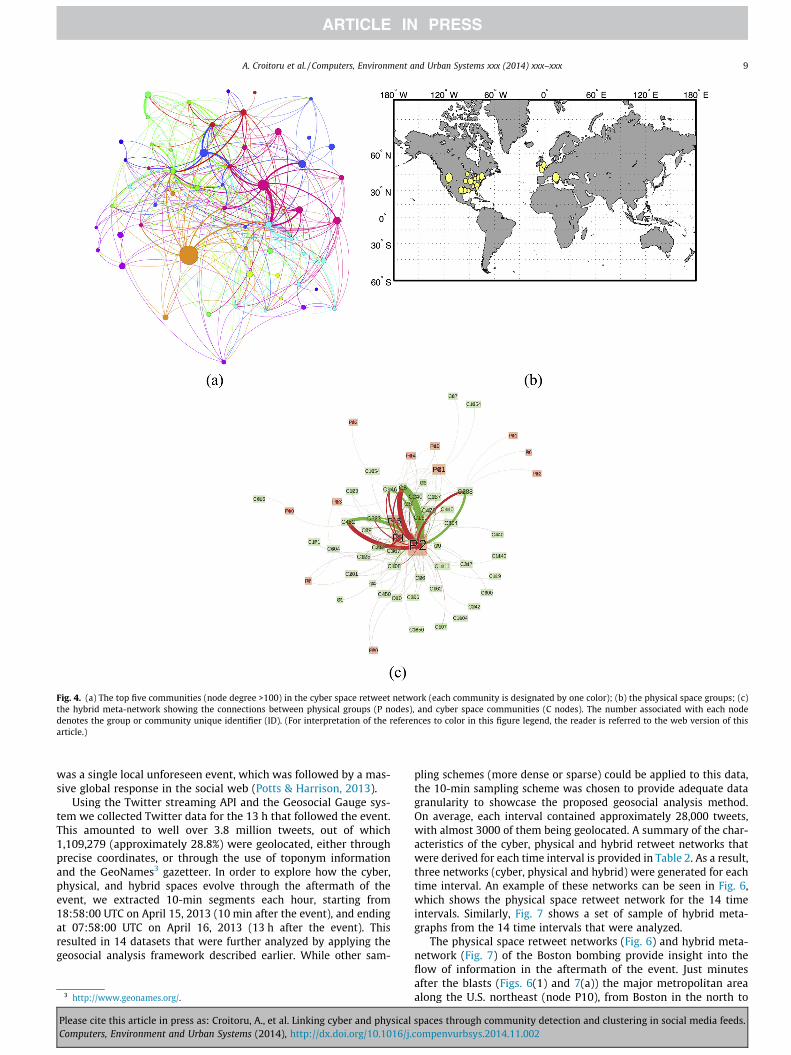
Fig. 4. (a) The top five communities (node degree >100) in the cyber space retweet network (each community is designated by one color); (b) the physical space groups; (c)the hybrid meta-network showing the connections between physical groups (P nodes), and cyber space communities (C nodes). The number associated with each nodedenotes the group or community unique identifier (ID). (For interpretation of the references to color in this figure legend, the reader is referred to the web version of thisarticle.)
A. Croitoru et al. / Computers, Environment and Urban Systems xxx (2014) xxx–xxx 9
was a single local unforeseen event, which was followed by a mas-sive global response in the social web (Potts & Harrison, 2013).
Using the Twitter streaming API and the Geosocial Gauge sys-tem we collected Twitter data for the 13 h that followed the event.This amounted to well over 3.8 million tweets, out of which1,109,279 (approximately 28.8%) were geolocated, either throughprecise coordinates, or through the use of toponym informationand the GeoNames3 gazetteer. In order to explore how the cyber,physical, and hybrid spaces evolve through the aftermath of theevent, we extracted 10-min segments each hour, starting from18:58:00 UTC on April 15, 2013 (10 min after the event), and endingat 07:58:00 UTC on April 16, 2013 (13 h after the event). Thisresulted in 14 datasets that were further analyzed by applying thegeosocial analysis framework described earlier. While other sam-
3 http://www.geonames.org/.
Please cite this article in press as: Croitoru, A., et al. Linking cyber and physicalComputers, Environment and Urban Systems (2014), http://dx.doi.org/10.1016/j.
pling schemes (more dense or sparse) could be applied to this data,the 10-min sampling scheme was chosen to provide adequate datagranularity to showcase the proposed geosocial analysis method.On average, each interval contained approximately 28,000 tweets,with almost 3000 of them being geolocated. A summary of the char-acteristics of the cyber, physical and hybrid retweet networks thatwere derived for each time interval is provided in Table 2. As a result,three networks (cyber, physical and hybrid) were generated for eachtime interval. An example of these networks can be seen in Fig. 6,which shows the physical space retweet network for the 14 timeintervals. Similarly, Fig. 7 shows a set of sample of hybrid meta-graphs from the 14 time intervals that were analyzed.
The physical space retweet networks (Fig. 6) and hybrid meta-network (Fig. 7) of the Boston bombing provide insight into theflow of information in the aftermath of the event. Just minutesafter the blasts (Figs. 6(1) and 7(a)) the major metropolitan areaalong the U.S. northeast (node P10), from Boston in the north to
spaces through community detection and clustering in social media feeds.compenvurbsys.2014.11.002
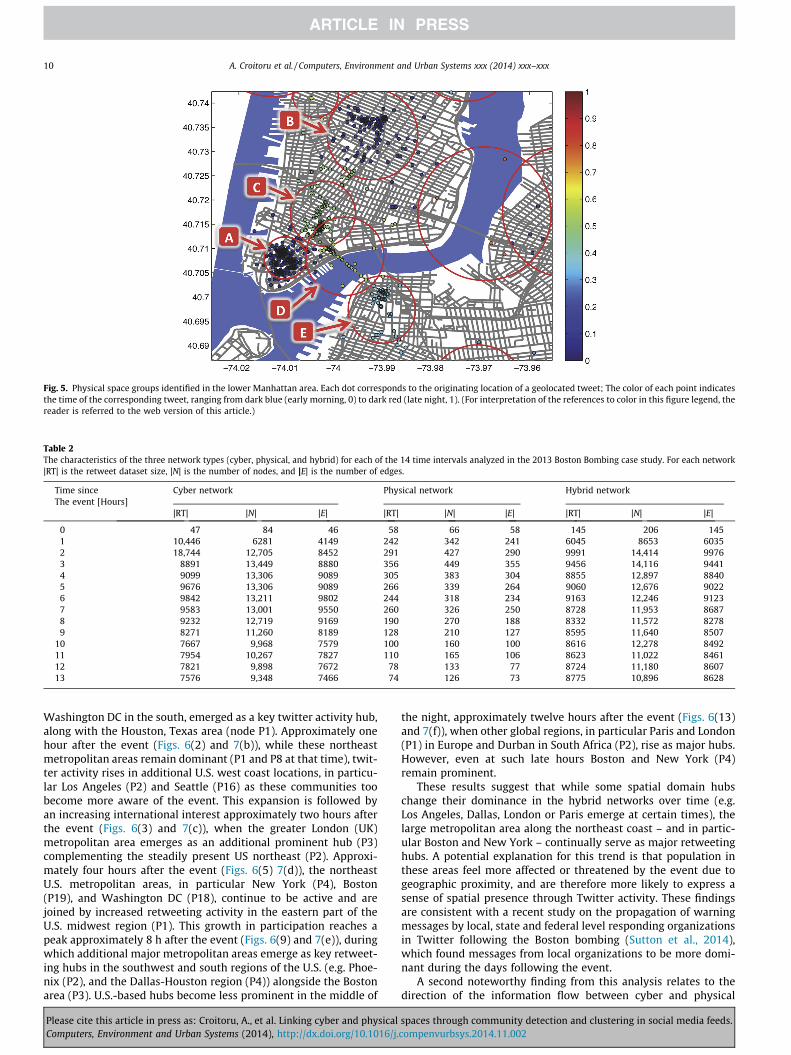
Fig. 5. Physical space groups identified in the lower Manhattan area. Each dot corresponds to the originating location of a geolocated tweet; The color of each point indicatesthe time of the corresponding tweet, ranging from dark blue (early morning, 0) to dark red (late night, 1). (For interpretation of the references to color in this figure legend, thereader is referred to the web version of this article.)
Table 2The characteristics of the three network types (cyber, physical, and hybrid) for each of the 14 time intervals analyzed in the 2013 Boston Bombing case study. For each network|RT| is the retweet dataset size, |N| is the number of nodes, and |E| is the number of edges.
Time sinceThe event [Hours]
Cyber network Physical network Hybrid network
|RT| |N| |E| |RT| |N| |E| |RT| |N| |E|
0 47 84 46 58 66 58 145 206 1451 10,446 6281 4149 242 342 241 6045 8653 60352 18,744 12,705 8452 291 427 290 9991 14,414 99763 8891 13,449 8880 356 449 355 9456 14,116 94414 9099 13,306 9089 305 383 304 8855 12,897 88405 9676 13,306 9089 266 339 264 9060 12,676 90226 9842 13,211 9802 244 318 234 9163 12,246 91237 9583 13,001 9550 260 326 250 8728 11,953 86878 9232 12,719 9169 190 270 188 8332 11,572 82789 8271 11,260 8189 128 210 127 8595 11,640 8507
10 7667 9,968 7579 100 160 100 8616 12,278 849211 7954 10,267 7827 110 165 106 8623 11,022 846112 7821 9,898 7672 78 133 77 8724 11,180 860713 7576 9,348 7466 74 126 73 8775 10,896 8628
10 A. Croitoru et al. / Computers, Environment and Urban Systems xxx (2014) xxx–xxx
Washington DC in the south, emerged as a key twitter activity hub,along with the Houston, Texas area (node P1). Approximately onehour after the event (Figs. 6(2) and 7(b)), while these northeastmetropolitan areas remain dominant (P1 and P8 at that time), twit-ter activity rises in additional U.S. west coast locations, in particu-lar Los Angeles (P2) and Seattle (P16) as these communities toobecome more aware of the event. This expansion is followed byan increasing international interest approximately two hours afterthe event (Figs. 6(3) and 7(c)), when the greater London (UK)metropolitan area emerges as an additional prominent hub (P3)complementing the steadily present US northeast (P2). Approxi-mately four hours after the event (Figs. 6(5) 7(d)), the northeastU.S. metropolitan areas, in particular New York (P4), Boston(P19), and Washington DC (P18), continue to be active and arejoined by increased retweeting activity in the eastern part of theU.S. midwest region (P1). This growth in participation reaches apeak approximately 8 h after the event (Figs. 6(9) and 7(e)), duringwhich additional major metropolitan areas emerge as key retweet-ing hubs in the southwest and south regions of the U.S. (e.g. Phoe-nix (P2), and the Dallas-Houston region (P4)) alongside the Bostonarea (P3). U.S.-based hubs become less prominent in the middle of
Please cite this article in press as: Croitoru, A., et al. Linking cyber and physicalComputers, Environment and Urban Systems (2014), http://dx.doi.org/10.1016/j.
the night, approximately twelve hours after the event (Figs. 6(13)and 7(f)), when other global regions, in particular Paris and London(P1) in Europe and Durban in South Africa (P2), rise as major hubs.However, even at such late hours Boston and New York (P4)remain prominent.
These results suggest that while some spatial domain hubschange their dominance in the hybrid networks over time (e.g.Los Angeles, Dallas, London or Paris emerge at certain times), thelarge metropolitan area along the northeast coast – and in partic-ular Boston and New York – continually serve as major retweetinghubs. A potential explanation for this trend is that population inthese areas feel more affected or threatened by the event due togeographic proximity, and are therefore more likely to express asense of spatial presence through Twitter activity. These findingsare consistent with a recent study on the propagation of warningmessages by local, state and federal level responding organizationsin Twitter following the Boston bombing (Sutton et al., 2014),which found messages from local organizations to be more domi-nant during the days following the event.
A second noteworthy finding from this analysis relates to thedirection of the information flow between cyber and physical
spaces through community detection and clustering in social media feeds.compenvurbsys.2014.11.002
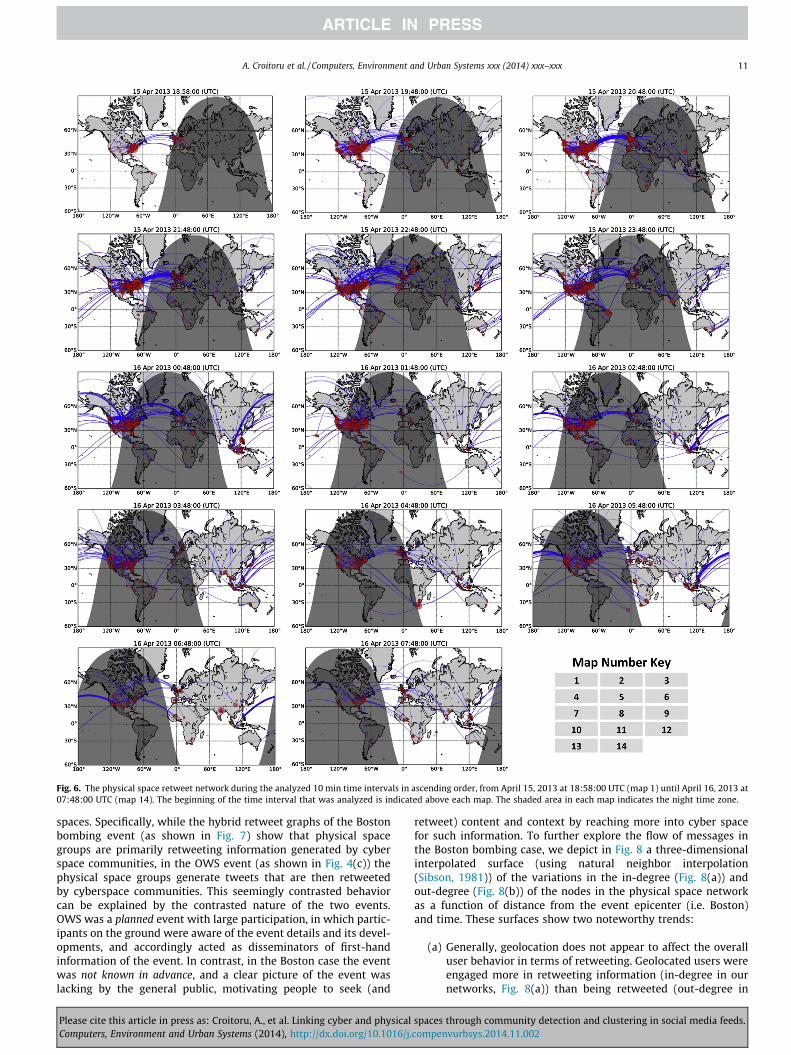
Fig. 6. The physical space retweet network during the analyzed 10 min time intervals in ascending order, from April 15, 2013 at 18:58:00 UTC (map 1) until April 16, 2013 at07:48:00 UTC (map 14). The beginning of the time interval that was analyzed is indicated above each map. The shaded area in each map indicates the night time zone.
A. Croitoru et al. / Computers, Environment and Urban Systems xxx (2014) xxx–xxx 11
spaces. Specifically, while the hybrid retweet graphs of the Bostonbombing event (as shown in Fig. 7) show that physical spacegroups are primarily retweeting information generated by cyberspace communities, in the OWS event (as shown in Fig. 4(c)) thephysical space groups generate tweets that are then retweetedby cyberspace communities. This seemingly contrasted behaviorcan be explained by the contrasted nature of the two events.OWS was a planned event with large participation, in which partic-ipants on the ground were aware of the event details and its devel-opments, and accordingly acted as disseminators of first-handinformation of the event. In contrast, in the Boston case the eventwas not known in advance, and a clear picture of the event waslacking by the general public, motivating people to seek (and
Please cite this article in press as: Croitoru, A., et al. Linking cyber and physicalComputers, Environment and Urban Systems (2014), http://dx.doi.org/10.1016/j.
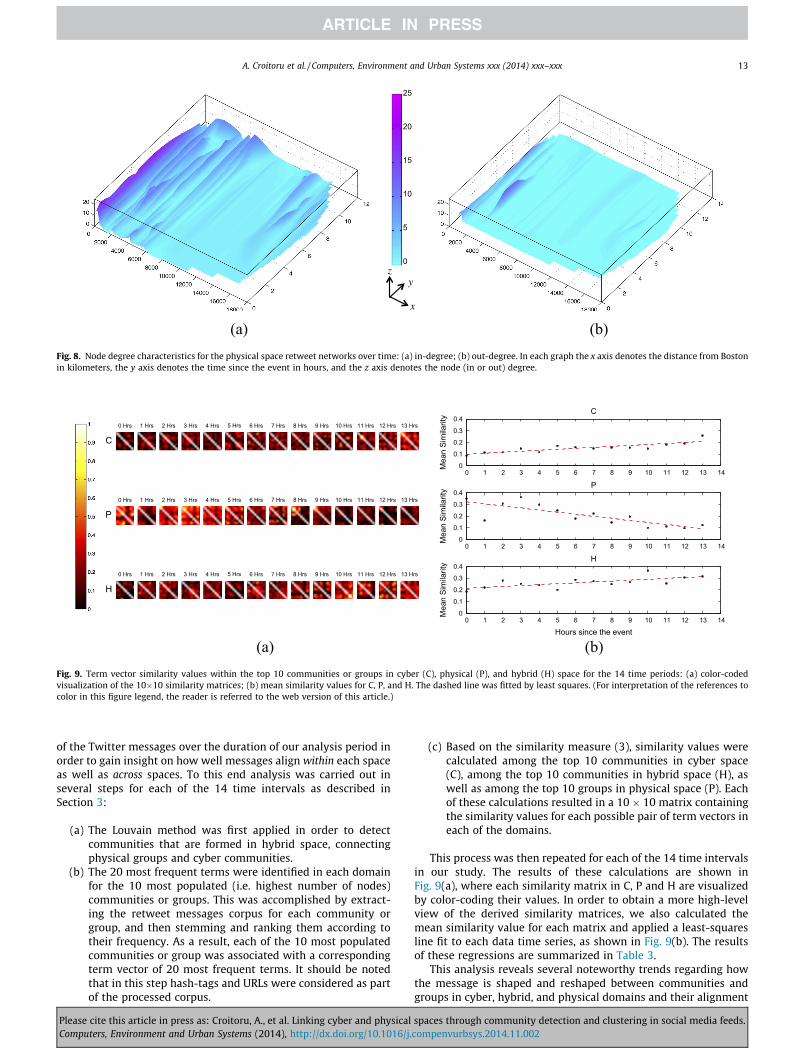
retweet) content and context by reaching more into cyber spacefor such information. To further explore the flow of messages inthe Boston bombing case, we depict in Fig. 8 a three-dimensionalinterpolated surface (using natural neighbor interpolation(Sibson, 1981)) of the variations in the in-degree (Fig. 8(a)) andout-degree (Fig. 8(b)) of the nodes in the physical space networkas a function of distance from the event epicenter (i.e. Boston)and time. These surfaces show two noteworthy trends:
(a) Generally, geolocation does not appear to affect the overalluser behavior in terms of retweeting. Geolocated users wereengaged more in retweeting information (in-degree in ournetworks, Fig. 8(a)) than being retweeted (out-degree in
spaces through community detection and clustering in social media feeds.compenvurbsys.2014.11.002
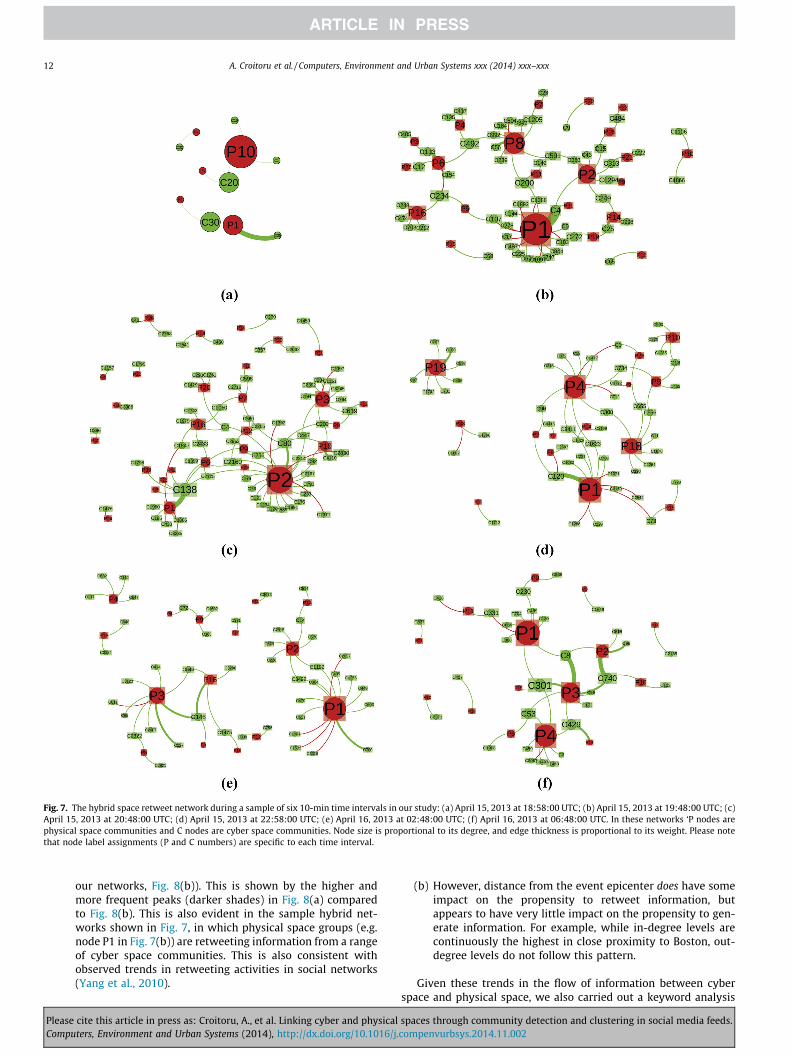
Fig. 7. The hybrid space retweet network during a sample of six 10-min time intervals in our study: (a) April 15, 2013 at 18:58:00 UTC; (b) April 15, 2013 at 19:48:00 UTC; (c)April 15, 2013 at 20:48:00 UTC; (d) April 15, 2013 at 22:58:00 UTC; (e) April 16, 2013 at 02:48:00 UTC; (f) April 16, 2013 at 06:48:00 UTC. In these networks ‘P nodes arephysical space communities and C nodes are cyber space communities. Node size is proportional to its degree, and edge thickness is proportional to its weight. Please notethat node label assignments (P and C numbers) are specific to each time interval.
12 A. Croitoru et al. / Computers, Environment and Urban Systems xxx (2014) xxx–xxx
our networks, Fig. 8(b)). This is shown by the higher andmore frequent peaks (darker shades) in Fig. 8(a) comparedto Fig. 8(b). This is also evident in the sample hybrid net-works shown in Fig. 7, in which physical space groups (e.g.node P1 in Fig. 7(b)) are retweeting information from a rangeof cyber space communities. This is also consistent withobserved trends in retweeting activities in social networks(Yang et al., 2010).
Please cite this article in press as: Croitoru, A., et al. Linking cyber and physicalComputers, Environment and Urban Systems (2014), http://dx.doi.org/10.1016/j.
(b) However, distance from the event epicenter does have someimpact on the propensity to retweet information, butappears to have very little impact on the propensity to gen-erate information. For example, while in-degree levels arecontinuously the highest in close proximity to Boston, out-degree levels do not follow this pattern.
Given these trends in the flow of information between cyberspace and physical space, we also carried out a keyword analysis
spaces through community detection and clustering in social media feeds.compenvurbsys.2014.11.002
(a) (b)
0
5
10
15
20
25
x
y z
Fig. 8. Node degree characteristics for the physical space retweet networks over time: (a) in-degree; (b) out-degree. In each graph the x axis denotes the distance from Bostonin kilometers, the y axis denotes the time since the event in hours, and the z axis denotes the node (in or out) degree.
(b)
0 Hrs
C
1 Hrs 2 Hrs 3 Hrs 4 Hrs 5 Hrs 6 Hrs 7 Hrs 8 Hrs 9 Hrs 10 Hrs 11 Hrs 12 Hrs 13 Hrs
0 Hrs
P
1 Hrs 2 Hrs 3 Hrs 4 Hrs 5 Hrs 6 Hrs 7 Hrs 8 Hrs 9 Hrs 10 Hrs 11 Hrs 12 Hrs 13 Hrs
0 Hrs
H
1 Hrs 2 Hrs 3 Hrs 4 Hrs 5 Hrs 6 Hrs 7 Hrs 8 Hrs 9 Hrs 10 Hrs 11 Hrs 12 Hrs 13 Hrs
0 1 2 3 4 5 6 7 8 9 10 11 12 13 140
0.1
0.2
0.3
0.4H
Hours since the event
Mea
n Si
mila
rity
0 1 2 3 4 5 6 7 8 9 10 11 12 13 140
0.1
0.2
0.3
0.4P
Mea
n Si
mila
rity
0 1 2 3 4 5 6 7 8 9 10 11 12 13 140
0.1
0.2
0.3
0.4C
Mea
n Si
mila
rity
(a)Fig. 9. Term vector similarity values within the top 10 communities or groups in cyber (C), physical (P), and hybrid (H) space for the 14 time periods: (a) color-codedvisualization of the 10�10 similarity matrices; (b) mean similarity values for C, P, and H. The dashed line was fitted by least squares. (For interpretation of the references tocolor in this figure legend, the reader is referred to the web version of this article.)
A. Croitoru et al. / Computers, Environment and Urban Systems xxx (2014) xxx–xxx 13
of the Twitter messages over the duration of our analysis period inorder to gain insight on how well messages align within each spaceas well as across spaces. To this end analysis was carried out inseveral steps for each of the 14 time intervals as described inSection 3:
(a) The Louvain method was first applied in order to detectcommunities that are formed in hybrid space, connectingphysical groups and cyber communities.
(b) The 20 most frequent terms were identified in each domainfor the 10 most populated (i.e. highest number of nodes)communities or groups. This was accomplished by extract-ing the retweet messages corpus for each community orgroup, and then stemming and ranking them according totheir frequency. As a result, each of the 10 most populatedcommunities or group was associated with a correspondingterm vector of 20 most frequent terms. It should be notedthat in this step hash-tags and URLs were considered as partof the processed corpus.
Please cite this article in press as: Croitoru, A., et al. Linking cyber and physicalComputers, Environment and Urban Systems (2014), http://dx.doi.org/10.1016/j.
(c) Based on the similarity measure (3), similarity values werecalculated among the top 10 communities in cyber space(C), among the top 10 communities in hybrid space (H), aswell as among the top 10 groups in physical space (P). Eachof these calculations resulted in a 10 � 10 matrix containingthe similarity values for each possible pair of term vectors ineach of the domains.
This process was then repeated for each of the 14 time intervalsin our study. The results of these calculations are shown inFig. 9(a), where each similarity matrix in C, P and H are visualizedby color-coding their values. In order to obtain a more high-levelview of the derived similarity matrices, we also calculated themean similarity value for each matrix and applied a least-squaresline fit to each data time series, as shown in Fig. 9(b). The resultsof these regressions are summarized in Table 3.
This analysis reveals several noteworthy trends regarding howthe message is shaped and reshaped between communities andgroups in cyber, hybrid, and physical domains and their alignment
spaces through community detection and clustering in social media feeds.compenvurbsys.2014.11.002
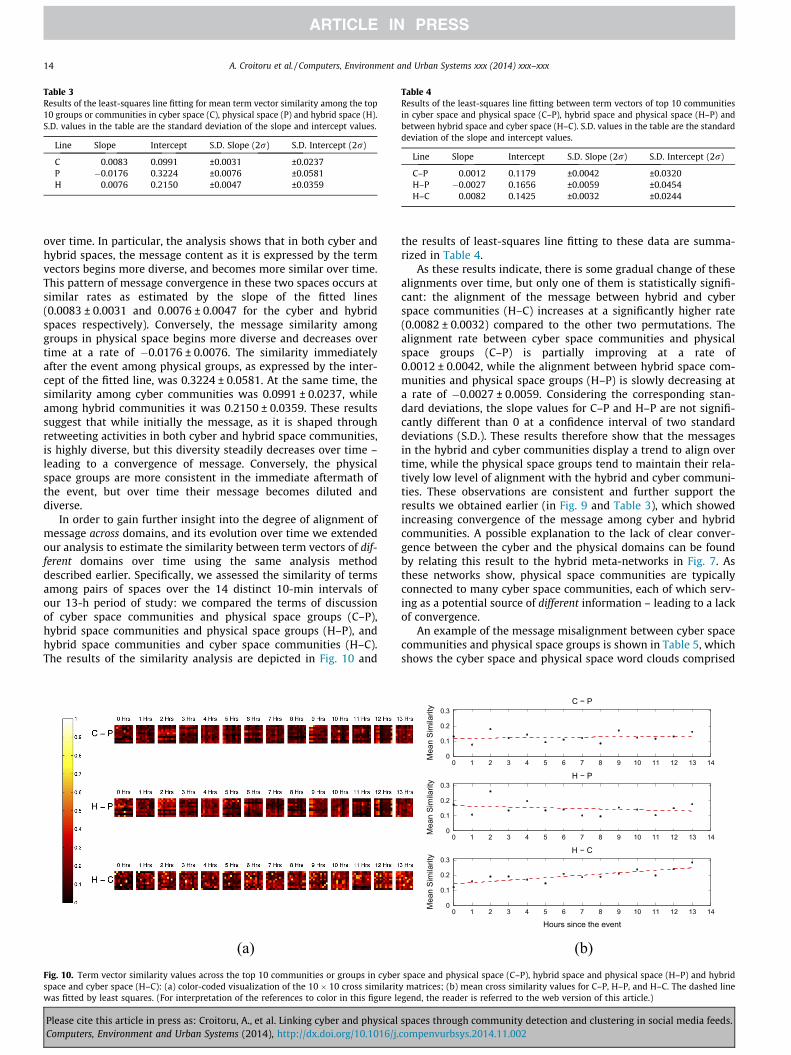
Table 3Results of the least-squares line fitting for mean term vector similarity among the top10 groups or communities in cyber space (C), physical space (P) and hybrid space (H).S.D. values in the table are the standard deviation of the slope and intercept values.
Line Slope Intercept S.D. Slope (2r) S.D. Intercept (2r)
C 0.0083 0.0991 ±0.0031 ±0.0237P �0.0176 0.3224 ±0.0076 ±0.0581H 0.0076 0.2150 ±0.0047 ±0.0359
Table 4Results of the least-squares line fitting between term vectors of top 10 communitiesin cyber space and physical space (C–P), hybrid space and physical space (H–P) andbetween hybrid space and cyber space (H–C). S.D. values in the table are the standarddeviation of the slope and intercept values.
Line Slope Intercept S.D. Slope (2r) S.D. Intercept (2r)
C–P 0.0012 0.1179 ±0.0042 ±0.0320H–P �0.0027 0.1656 ±0.0059 ±0.0454H–C 0.0082 0.1425 ±0.0032 ±0.0244
14 A. Croitoru et al. / Computers, Environment and Urban Systems xxx (2014) xxx–xxx
over time. In particular, the analysis shows that in both cyber andhybrid spaces, the message content as it is expressed by the termvectors begins more diverse, and becomes more similar over time.This pattern of message convergence in these two spaces occurs atsimilar rates as estimated by the slope of the fitted lines(0.0083 ± 0.0031 and 0.0076 ± 0.0047 for the cyber and hybridspaces respectively). Conversely, the message similarity amonggroups in physical space begins more diverse and decreases overtime at a rate of �0.0176 ± 0.0076. The similarity immediatelyafter the event among physical groups, as expressed by the inter-cept of the fitted line, was 0.3224 ± 0.0581. At the same time, thesimilarity among cyber communities was 0.0991 ± 0.0237, whileamong hybrid communities it was 0.2150 ± 0.0359. These resultssuggest that while initially the message, as it is shaped throughretweeting activities in both cyber and hybrid space communities,is highly diverse, but this diversity steadily decreases over time –leading to a convergence of message. Conversely, the physicalspace groups are more consistent in the immediate aftermath ofthe event, but over time their message becomes diluted anddiverse.
In order to gain further insight into the degree of alignment ofmessage across domains, and its evolution over time we extendedour analysis to estimate the similarity between term vectors of dif-ferent domains over time using the same analysis methoddescribed earlier. Specifically, we assessed the similarity of termsamong pairs of spaces over the 14 distinct 10-min intervals ofour 13-h period of study: we compared the terms of discussionof cyber space communities and physical space groups (C–P),hybrid space communities and physical space groups (H–P), andhybrid space communities and cyber space communities (H–C).The results of the similarity analysis are depicted in Fig. 10 and
(a) Fig. 10. Term vector similarity values across the top 10 communities or groups in cyberspace and cyber space (H–C): (a) color-coded visualization of the 10 � 10 cross similaritwas fitted by least squares. (For interpretation of the references to color in this figure le
Please cite this article in press as: Croitoru, A., et al. Linking cyber and physicalComputers, Environment and Urban Systems (2014), http://dx.doi.org/10.1016/j.
the results of least-squares line fitting to these data are summa-rized in Table 4.
As these results indicate, there is some gradual change of thesealignments over time, but only one of them is statistically signifi-cant: the alignment of the message between hybrid and cyberspace communities (H–C) increases at a significantly higher rate(0.0082 ± 0.0032) compared to the other two permutations. Thealignment rate between cyber space communities and physicalspace groups (C–P) is partially improving at a rate of0.0012 ± 0.0042, while the alignment between hybrid space com-munities and physical space groups (H–P) is slowly decreasing ata rate of �0.0027 ± 0.0059. Considering the corresponding stan-dard deviations, the slope values for C–P and H–P are not signifi-cantly different than 0 at a confidence interval of two standarddeviations (S.D.). These results therefore show that the messagesin the hybrid and cyber communities display a trend to align overtime, while the physical space groups tend to maintain their rela-tively low level of alignment with the hybrid and cyber communi-ties. These observations are consistent and further support theresults we obtained earlier (in Fig. 9 and Table 3), which showedincreasing convergence of the message among cyber and hybridcommunities. A possible explanation to the lack of clear conver-gence between the cyber and the physical domains can be foundby relating this result to the hybrid meta-networks in Fig. 7. Asthese networks show, physical space communities are typicallyconnected to many cyber space communities, each of which serv-ing as a potential source of different information – leading to a lackof convergence.
An example of the message misalignment between cyber spacecommunities and physical space groups is shown in Table 5, whichshows the cyber space and physical space word clouds comprised
(b)
0 1 2 3 4 5 6 7 8 9 10 11 12 13 140
0.1
0.2
0.3H − C
Hours since the event
Mea
n Si
mila
rity
0 1 2 3 4 5 6 7 8 9 10 11 12 13 140
0.1
0.2
0.3H − P
Mea
n Si
mila
rity
0 1 2 3 4 5 6 7 8 9 10 11 12 13 140
0.1
0.2
0.3C − P
Mea
n Si
mila
rity
space and physical space (C–P), hybrid space and physical space (H–P) and hybridy matrices; (b) mean cross similarity values for C–P, H–P, and H–C. The dashed linegend, the reader is referred to the web version of this article.)
spaces through community detection and clustering in social media feeds.compenvurbsys.2014.11.002
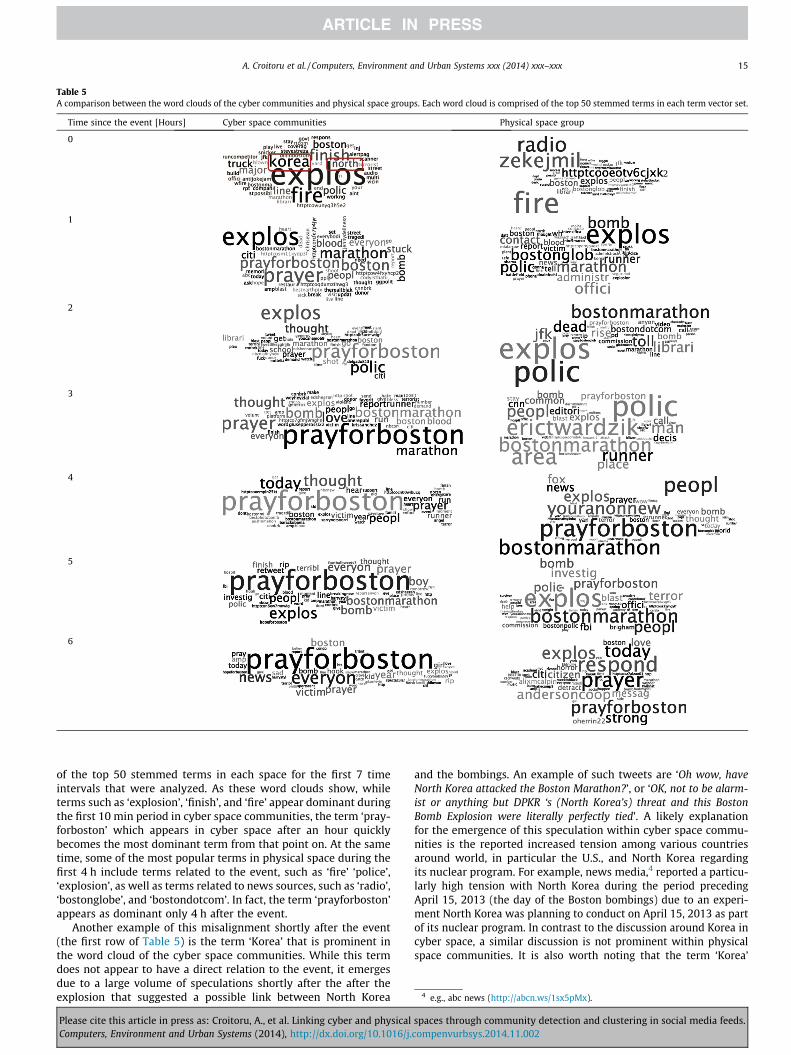
Table 5A comparison between the word clouds of the cyber communities and physical space groups. Each word cloud is comprised of the top 50 stemmed terms in each term vector set.
Time since the event [Hours] Cyber space communities Physical space group
0
2
1
2
3
4
5
6
4 e.g., abc news (http://abcn.ws/1sx5pMx).
A. Croitoru et al. / Computers, Environment and Urban Systems xxx (2014) xxx–xxx 15
of the top 50 stemmed terms in each space for the first 7 timeintervals that were analyzed. As these word clouds show, whileterms such as ‘explosion’, ‘finish’, and ‘fire’ appear dominant duringthe first 10 min period in cyber space communities, the term ‘pray-forboston’ which appears in cyber space after an hour quicklybecomes the most dominant term from that point on. At the sametime, some of the most popular terms in physical space during thefirst 4 h include terms related to the event, such as ‘fire’ ‘police’,‘explosion’, as well as terms related to news sources, such as ‘radio’,‘bostonglobe’, and ‘bostondotcom’. In fact, the term ‘prayforboston’appears as dominant only 4 h after the event.
Another example of this misalignment shortly after the event(the first row of Table 5) is the term ‘Korea’ that is prominent inthe word cloud of the cyber space communities. While this termdoes not appear to have a direct relation to the event, it emergesdue to a large volume of speculations shortly after the after theexplosion that suggested a possible link between North Korea
Please cite this article in press as: Croitoru, A., et al. Linking cyber and physicalComputers, Environment and Urban Systems (2014), http://dx.doi.org/10.1016/j.
and the bombings. An example of such tweets are ‘Oh wow, haveNorth Korea attacked the Boston Marathon?’, or ‘OK, not to be alarm-ist or anything but DPKR ‘s (North Korea’s) threat and this BostonBomb Explosion were literally perfectly tied’. A likely explanationfor the emergence of this speculation within cyber space commu-nities is the reported increased tension among various countriesaround world, in particular the U.S., and North Korea regardingits nuclear program. For example, news media,4 reported a particu-larly high tension with North Korea during the period precedingApril 15, 2013 (the day of the Boston bombings) due to an experi-ment North Korea was planning to conduct on April 15, 2013 as partof its nuclear program. In contrast to the discussion around Korea incyber space, a similar discussion is not prominent within physicalspace communities. It is also worth noting that the term ‘Korea’
spaces through community detection and clustering in social media feeds.compenvurbsys.2014.11.002
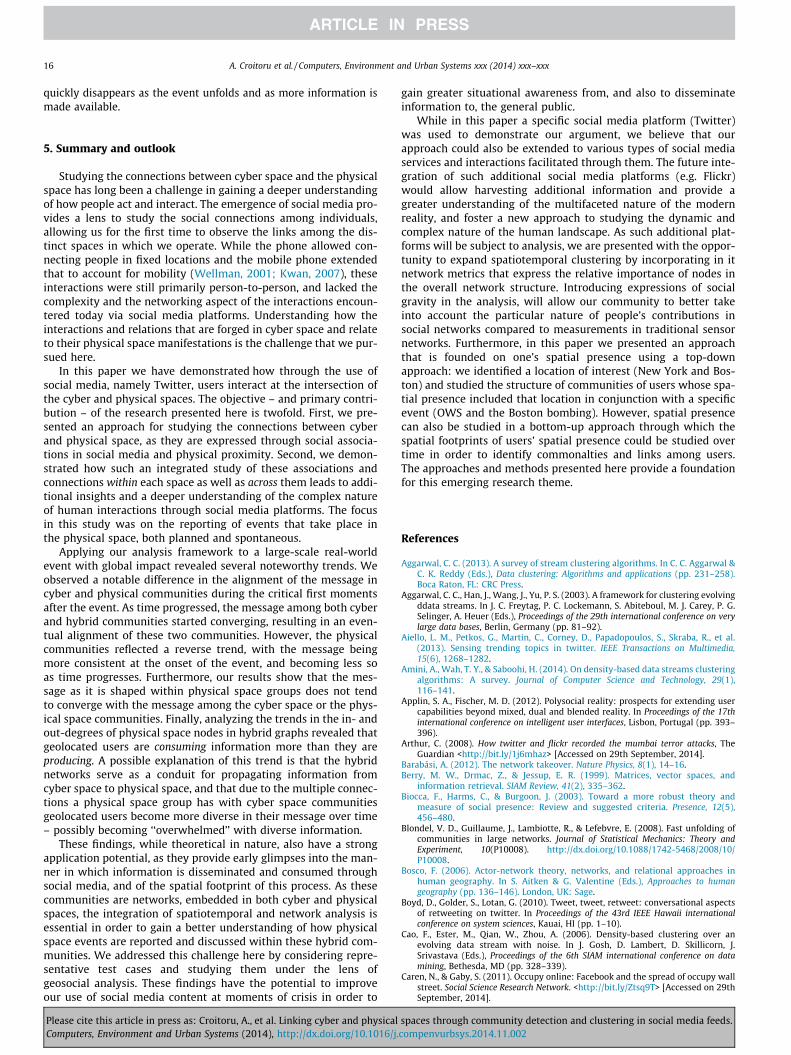
16 A. Croitoru et al. / Computers, Environment and Urban Systems xxx (2014) xxx–xxx
quickly disappears as the event unfolds and as more information ismade available.
5. Summary and outlook
Studying the connections between cyber space and the physicalspace has long been a challenge in gaining a deeper understandingof how people act and interact. The emergence of social media pro-vides a lens to study the social connections among individuals,allowing us for the first time to observe the links among the dis-tinct spaces in which we operate. While the phone allowed con-necting people in fixed locations and the mobile phone extendedthat to account for mobility (Wellman, 2001; Kwan, 2007), theseinteractions were still primarily person-to-person, and lacked thecomplexity and the networking aspect of the interactions encoun-tered today via social media platforms. Understanding how theinteractions and relations that are forged in cyber space and relateto their physical space manifestations is the challenge that we pur-sued here.
In this paper we have demonstrated how through the use ofsocial media, namely Twitter, users interact at the intersection ofthe cyber and physical spaces. The objective – and primary contri-bution – of the research presented here is twofold. First, we pre-sented an approach for studying the connections between cyberand physical space, as they are expressed through social associa-tions in social media and physical proximity. Second, we demon-strated how such an integrated study of these associations andconnections within each space as well as across them leads to addi-tional insights and a deeper understanding of the complex natureof human interactions through social media platforms. The focusin this study was on the reporting of events that take place inthe physical space, both planned and spontaneous.
Applying our analysis framework to a large-scale real-worldevent with global impact revealed several noteworthy trends. Weobserved a notable difference in the alignment of the message incyber and physical communities during the critical first momentsafter the event. As time progressed, the message among both cyberand hybrid communities started converging, resulting in an even-tual alignment of these two communities. However, the physicalcommunities reflected a reverse trend, with the message beingmore consistent at the onset of the event, and becoming less soas time progresses. Furthermore, our results show that the mes-sage as it is shaped within physical space groups does not tendto converge with the message among the cyber space or the phys-ical space communities. Finally, analyzing the trends in the in- andout-degrees of physical space nodes in hybrid graphs revealed thatgeolocated users are consuming information more than they areproducing. A possible explanation of this trend is that the hybridnetworks serve as a conduit for propagating information fromcyber space to physical space, and that due to the multiple connec-tions a physical space group has with cyber space communitiesgeolocated users become more diverse in their message over time– possibly becoming ‘‘overwhelmed’’ with diverse information.
These findings, while theoretical in nature, also have a strongapplication potential, as they provide early glimpses into the man-ner in which information is disseminated and consumed throughsocial media, and of the spatial footprint of this process. As thesecommunities are networks, embedded in both cyber and physicalspaces, the integration of spatiotemporal and network analysis isessential in order to gain a better understanding of how physicalspace events are reported and discussed within these hybrid com-munities. We addressed this challenge here by considering repre-sentative test cases and studying them under the lens ofgeosocial analysis. These findings have the potential to improveour use of social media content at moments of crisis in order to
Please cite this article in press as: Croitoru, A., et al. Linking cyber and physicalComputers, Environment and Urban Systems (2014), http://dx.doi.org/10.1016/j.
gain greater situational awareness from, and also to disseminateinformation to, the general public.
While in this paper a specific social media platform (Twitter)was used to demonstrate our argument, we believe that ourapproach could also be extended to various types of social mediaservices and interactions facilitated through them. The future inte-gration of such additional social media platforms (e.g. Flickr)would allow harvesting additional information and provide agreater understanding of the multifaceted nature of the modernreality, and foster a new approach to studying the dynamic andcomplex nature of the human landscape. As such additional plat-forms will be subject to analysis, we are presented with the oppor-tunity to expand spatiotemporal clustering by incorporating in itnetwork metrics that express the relative importance of nodes inthe overall network structure. Introducing expressions of socialgravity in the analysis, will allow our community to better takeinto account the particular nature of people’s contributions insocial networks compared to measurements in traditional sensornetworks. Furthermore, in this paper we presented an approachthat is founded on one’s spatial presence using a top-downapproach: we identified a location of interest (New York and Bos-ton) and studied the structure of communities of users whose spa-tial presence included that location in conjunction with a specificevent (OWS and the Boston bombing). However, spatial presencecan also be studied in a bottom-up approach through which thespatial footprints of users’ spatial presence could be studied overtime in order to identify commonalties and links among users.The approaches and methods presented here provide a foundationfor this emerging research theme.
References
Aggarwal, C. C. (2013). A survey of stream clustering algorithms. In C. C. Aggarwal &C. K. Reddy (Eds.), Data clustering: Algorithms and applications (pp. 231–258).Boca Raton, FL: CRC Press.
Aggarwal, C. C., Han, J., Wang, J., Yu, P. S. (2003). A framework for clustering evolvingddata streams. In J. C. Freytag, P. C. Lockemann, S. Abiteboul, M. J. Carey, P. G.Selinger, A. Heuer (Eds.), Proceedings of the 29th international conference on verylarge data bases, Berlin, Germany (pp. 81–92).
Aiello, L. M., Petkos, G., Martin, C., Corney, D., Papadopoulos, S., Skraba, R., et al.(2013). Sensing trending topics in twitter. IEEE Transactions on Multimedia,15(6), 1268–1282.
Amini, A., Wah, T. Y., & Saboohi, H. (2014). On density-based data streams clusteringalgorithms: A survey. Journal of Computer Science and Technology, 29(1),116–141.
Applin, S. A., Fischer, M. D. (2012). Polysocial reality: prospects for extending usercapabilities beyond mixed, dual and blended reality. In Proceedings of the 17thinternational conference on intelligent user interfaces, Lisbon, Portugal (pp. 393–396).
Arthur, C. (2008). How twitter and flickr recorded the mumbai terror attacks, TheGuardian <http://bit.ly/1j6mhaz> [Accessed on 29th September, 2014].
Barabási, A. (2012). The network takeover. Nature Physics, 8(1), 14–16.Berry, M. W., Drmac, Z., & Jessup, E. R. (1999). Matrices, vector spaces, and
information retrieval. SIAM Review, 41(2), 335–362.Biocca, F., Harms, C., & Burgoon, J. (2003). Toward a more robust theory and
measure of social presence: Review and suggested criteria. Presence, 12(5),456–480.
Blondel, V. D., Guillaume, J., Lambiotte, R., & Lefebvre, E. (2008). Fast unfolding ofcommunities in large networks. Journal of Statistical Mechanics: Theory andExperiment, 10(P10008). http://dx.doi.org/10.1088/1742-5468/2008/10/P10008.
Bosco, F. (2006). Actor-network theory, networks, and relational approaches inhuman geography. In S. Aitken & G. Valentine (Eds.), Approaches to humangeography (pp. 136–146). London, UK: Sage.
Boyd, D., Golder, S., Lotan, G. (2010). Tweet, tweet, retweet: conversational aspectsof retweeting on twitter. In Proceedings of the 43rd IEEE Hawaii internationalconference on system sciences, Kauai, HI (pp. 1–10).
Cao, F., Ester, M., Qian, W., Zhou, A. (2006). Density-based clustering over anevolving data stream with noise. In J. Gosh, D. Lambert, D. Skillicorn, J.Srivastava (Eds.), Proceedings of the 6th SIAM international conference on datamining, Bethesda, MD (pp. 328–339).
Caren, N., & Gaby, S. (2011). Occupy online: Facebook and the spread of occupy wallstreet. Social Science Research Network. <http://bit.ly/Ztsq9T> [Accessed on 29thSeptember, 2014].
spaces through community detection and clustering in social media feeds.compenvurbsys.2014.11.002
A. Croitoru et al. / Computers, Environment and Urban Systems xxx (2014) xxx–xxx 17
Caverlee, J., Cheng, Z., Sui, D. Z., & Kamath, K. Y. (2013). Towards geo-socialintelligence: Mining, analyzing, and leveraging geospatial footprints in socialmedia. IEEE Computer Society Data Engineering Bulletin, 26(3), 33–41.
Cha, M., Haddadi, H., Benevenuto, F., & Gummadi, P. K. (2010). Measuring userinfluence in twitter: The million follower fallacy. In Proceedings of the fourthinternational AAAI conference on weblogs and social media, (Vol. 10, pp. 10–17).
Cheng, Z., Caverlee, J., Lee, K. (2010). You are where you tweet: A content-basedapproach to geolocating twitter users. In Proceedings of the ACM conference oninformation and knowledge management, Toronto, Canada (pp. 759–768).
Choi, S. S., Cha, S. H., & Tappert, C. (2010). A survey of binary similarity and distancemeasures. Journal of Systemics, Cybernetics and Informatics, 8(1), 43–48.
Christakos, G. (2000). Modern spatiotemporal geostatistics. Oxford, UK: OxfordUniversity Press.
Christensen, C. (2011). Twitter revolutions? Addressing social media and dissent.The Communication Review, 14(3), 155–157.
Chunara, R., Andrews, J. R., & Brownstein, J. S. (2012). Social and news media enableestimation of epidemiological patterns early in the 2010 Haitian choleraoutbreak. The American Journal of Tropical Medicine and Hygiene, 86(1), 39–45.
Clauset, C., Newman, M. E. J., & Moore, C. (2004). Finding community structure invery large networks. Physical Review E, 70(6), 066111.
Corbane, C., Lemoine, G., & Kauffmann, M. (2012). Relationship between the spatialdistribution of SMS messages reporting needs and building damage in 2010Haiti disaster. Natural Hazards and Earth System Sciences, 12(2), 255–265.
Cranshaw, J., Schwartz, R., Hong, J. I., Sadeh, N. M. (2012). The livehoods project:Utilizing social media to understand the dynamics of a city. In Proceedings of thesixth international AAAI conference on weblogs an social media, Dublin, Ireland.
Croitoru, A., Crooks, A. T., Radzikowski, J., & Stefanidis, A. (2013). GeoSocial gauge: Asystem prototype for knowledge discovery from geosocial media. InternationalJournal of Geographical Information Science, 27(12), 2483–2508.
Crooks, A. T., Croitoru, A., Stefanidis, A., & Radzikowski, J. (2013). #Earthquake:Twitter as a distributed sensor system. Transactions in GIS, 17(1), 124–147.
Culotta, A. (2010). Towards detecting influenza epidemics by analyzing twittermessages. In Proceedings of the first workshop on social media analytics,Washington, DC (pp. 115–122).
Dann, S. (2010). Twitter content classification. First Monday, 15(12). <http://bit.ly/1hotPlO> [Accessed on 29th September, 2014].
Deuze, M. (2008). Understanding journalism as newswork: How It changes, andhow it remains the same. Westminster Papers in Communication and Culture,5(2), 4–23.
Ester, M., Kriegel, H.-P., Sander, J., Xu, X. (1996). A density-based algorithm fordiscovering clusters in large spatial databases with noise. In E. Simoudis, J. Han,U. Fayyad (Eds.). Proceedings of the 2nd international conference on knowledgediscovery and data mining, Portland, OR (pp. 226–231).
Farnham, S. D., Churchill, E. F. (2011). Faceted identity, faceted lives: social andtechnical issues with being yourself online. In Proceedings of the ACM 2011conference on computer supported cooperative work, Hangzhou, China (pp. 359–368).
Fink, C., Piatko, C., Mayfield, J., Chou, D., Finin, T., Martineau, J. (2009). Thegeolocation of web logs from textual clues. In The Proceedings of the 12th IEEEInternational Conference on Computational Science and Engineering, 29–31 August,2009, Vancouver, Canada, vol. 4, (pp. 1088–1092).
Forbes (2012). Twitter’s dick costolo: Twitter mobile ad revenue beats desktop onsome days, <http://onforb.es/KgTWYP> [Accessed on 29th September, 2014].
Friggeri, A., Lambiotte, R., Kosinski, M., Fleury, E. (2012). Psychological aspects ofsocial communities. In 2012 ASE international conference on social computing,Amsterdam, The Netherlands (pp. 195–202).
Gillham, P. F., Edwards, B., & Noakes, J. A. (2012). Strategic incapacitation and thepolicing of occupy wall street protests in New York City, 2011. Policing andSociety: An International Journal of Research and Policy. http://dx.doi.org/10.1080/10439463.2012.727607.
Glasgow, K., Ebaugh, A., Fink, C. (2012). #Londonsburning: Integrating geographictopical, and social information during crisis. In International AAAI conference onweblogs and social media, Dublin, Ireland.
Goodchild, M. F. (2007). Citizens as sensors: The world of volunteered geography.GeoJournal, 69(4), 211–221.
Gorawski, M., & Malczok, R. (2006). AEC algorithm: A heuristic approach tocalculating density-based clustering eps parameter. In T. Yakhno & E. J. Neuhold(Eds.), Advances in information systems (pp. 90–99). Berlin, Germany: Springer.
Gordon, E., & Manosevitch, E. (2011). Augmented deliberation: Merging physicaland virtual interaction to engage communities in urban planning. New Media &Society, 13, 1.
Gruzd, A., Wellman, B., & Takhteyev, Y. (2011). Imagining twitter as an imaginedcommunity. American Behavioral Scientist, 55(10), 1294–1318.
Harrison, S., Dourish, P. (1996). Re-place-ing space: The roles of place and space incollaborative systems. In Proceedings of the 1996 ACM conference on computersupported cooperative work, Boston, MA (pp. 67–76).
HerdaGdelen, A., Zuo, W., Gard-Murray, A., & Bar-Yam, Y. (2013). An exploration ofsocial identity: The geography and politics of news-sharing communities intwitter. Complexity, 19(2), 10–20.
Hollis, C. (2011). 2011 IDC digital universe study: Big data is here, now what?,<http://bit.ly/kouTgc> [Accessed on 30th September, 2014].
Howard, P. N., Agarwal, S. D., & Mazammil, M. (2011). When do states disconnecttheir digital networks? Responses to the political uses of social media. TheCommunication Review, 14(3), 216–232.
Please cite this article in press as: Croitoru, A., et al. Linking cyber and physicalComputers, Environment and Urban Systems (2014), http://dx.doi.org/10.1016/j.
Java, A., Song, X., Finin, T., & Tseng, B. (2009). Why we twitter: An analysis of amicroblogging community. In R. Goebel, J. Siekmann, & W. Wahlster (Eds.).Advances in web mining and web usage analysis, lecture notes in computer science(Vol. 5439, pp. 118–138). Berlin, Germany: Springer.
Juris, J. S. (2012). Reflections on #occupy everywhere: Social media public space,and emerging logics of aggregation. American Ethnologist, 39(2), 259–279.
Kaplan, A. M., & Haenlein, M. (2010). Users of the world unite! The challenges andopportunities of social media. Business Horizons, 53(1), 59–68.
Kim, Y. H., Seo, S., Ha, Y. H., Lim, S., & Yoon, Y. (2013). Two applications of clusteringtechniques to twitter: Community detection and issue extraction. DiscreteDynamics in Nature and Society. <http://bit.ly/1mSOEwr> [Accessed on 29thSeptember, 2014].
Kollock, P., & Smith, M. (Eds.). (1998). Communities in cyberspace. New York, NY:Routledge.
Kroll, A. (2011). How occupy wall street really got started, <http://bit.ly/1j6oCC9>[Accessed on 1st August, 2014].
Kwak, H., Lee, C., Park, H., Moon, S. (2010), What is twitter, a social network or anews media? In Proceedings of the 19th international conference on World WideWeb, Raleigh, NC (pp. 591–600).
Kwan, M. P. (2007). Mobile communications, social networks, and urban travel:Hypertext as a new metaphor for conceptualizing spatial interaction. TheProfessional Geographer, 59(4), 434–446.
Latapy, M., Magnien, C., & Del Vecchio, N. (2008). Basic notions for the analysis oflarge two-mode networks. Social Networks, 30(1), 31–48.
Lee, K. M. (2004). Presence, explicated. Communication Theory, 14(1), 27–50.MacEachren, A. M., Jaiswal, A., Robinson, A. C., Pezanowski, S., Savelyev, A., Mitra, P.,
et al. (2011). Senseplace2: Geotwitter analytics support for situationalawareness. In S. Miksch & M. Ward (Eds.), IEEE conference in visual analyticsscience and technology (VAST) (pp. 181–190). RI: Providence.
MacEachren, A. M., Robinson, A. C., Jaiswal, A., Pezanowski, S., Savelyev, A., Blanford,J., et al. (2011), Geo-twitter analytics: Applications in crisis management. InProceedings of the 25th international cartographic conference, Paris, France.
Mantovani, G., & Riva, G. (1999). Real presence: How different ontologies generatedifferent criteria for presence, telepresence, and virtual presence. Presence:Teleoperators and Virtual Environments, 8(5), 540–550.
McCullagh, D. (2011). Abbottabad resident tweets raid on bin laden compound, CBSNews (2nd May, 2011), <http://cbsn.ws/1sB1grR> [Accessed on 26th July,2014].
Miller, Z., Dickinson, B., Deitrick, W., Hu, W., & Wang, A. H. (2014). Twitter spammerdetection using data stream clustering. Information Sciences, 260, 64–73.
Mischaud, E. (2007). Twitter: Expressions of the whole self: an investigation into userappropriation of a web-based communications platform, MSc Thesis, LondonSchool of Economics, London, UK.
Mitra, A. (2003). Cybernetic space: Bringing the virtual and real together. Journal ofInteractive Advertising, 3(2). <http://jiad.org/article31> [Accessed on 29thSeptember, 2014].
Mitra, A., & Schwartz, R. L. (2001). From cyber space to cybernetic space: Rethinkingthe relationship between real and virtual spaces. Journal of Computer-MediatedCommunication, 7(1). <http://bit.ly/1eRmOrs> [Accessed on 26th July, 2014].
Murata, T. (2010). Detecting communities in social networks. In B. Furht (Ed.),Handbook of social network technologies and applications (pp. 269–280), NewYork, NY.
Newman, D. (2006). The lines that continue to separate us: Borders in our‘borderless’ world. Progress in Human Geography, 30(2), 142–161.
Newman, M. (2010). Networks: An introduction. Oxford, UK: Oxford University Press.Newman, M. E., & Girvan, M. (2004). Finding and evaluating community structure in
networks. Physical Review E, 69(2), 026113.Newman, M. E. J. (2004a). Detecting community structure in networks. The
European Physical Journal B: Condensed Matter and Complex Systems, 38(2),321–330.
Newman, M. E. J. (2004b). Fast algorithm for detecting community structure innetworks. Physical Review E, 66(6), 066133.
Nielsen (2012), State of The Media: The Social Media Report, <http://www.slidesha.re/1qYtDSu> [Accessed on 26th July, 2014].
Obst, P., & White, K. M. (2004). Revisiting the sense of community index: Aconfirmatory factor analysis. Journal of Community Psychology, 32(6), 691–705.
Obst, P., Smith, S. G., & Zinkiewicz, L. (2002). An exploration of sense of community,part 3: dimensions and predictors of psychological sense of community ingeographical communities. Journal of Community Psychology, 30(1), 119–133.
OccupyWallSt.org (2012). November 17th Day of Action, <http://www.occupywallst.org/action/november-17th/> [Accessed on 26th July, 2014].
Panagopoulos, C. (2011). Occupy wall street survey results october 2011, <http://bit.ly/1hoBpgo> [Accessed on 26th July, 2014].
Papadopoulos, S., Kompatsiaris, Y., Vakali, A., & Spyridonos, P. (2012). Communitydetection in social media. Data Mining and Knowledge Discovery, 24(3), 515–554.
Parks, M. R. (2011). Social network sites as virtual communities. In Z. Papacharissi(Ed.), A networked self: Identity, community, and culture on social network sites(pp. 105–123). New York, NY: Routledge.
Plantié, M., & Crampes, M. (2013). Survey on social community detection. In N.Ramzan, R. van Zwol, J. S. Lee, K. Clüver, & X. S. Hua (Eds.), Social media retrieval,computer communications and networks (pp. 65–85). New York, NY: Springer.
Porter, C. E. (2004). A typology of virtual communities: A multi-disciplinaryfoundation for future research. Journal of Computer-Mediated Communication,10(1).
spaces through community detection and clustering in social media feeds.compenvurbsys.2014.11.002
18 A. Croitoru et al. / Computers, Environment and Urban Systems xxx (2014) xxx–xxx
Porter, M. F. (1980). An algorithm for suffix stripping. Program, 14(3), 130–137.Potts, L., Harrison, A. (2013). Interfaces as rhetorical constructions: reddit and 4chan
during the Boston marathon bombings. In Proceedings of the 31st ACMinternational conference on design of communication, Greenville, NC (pp. 143–150).
Prell, C. (2012). Social network analysis: History, theory and methodology. London, UK:SAGE Publications Ltd..
Purohit, H., Ruan, Y., Joshi, A., Parthasarathy, S., Sheth, A. (2011). Understandinguser-community engagement by multifaceted features: A case study on twitter.In Proceedings of the 2011 social media analytics workshop at World Wide WebConference, Hyderabad, India.
Ritterman, J., Osborne, M., & Klein, E. (2009). Using prediction markets and twitterto predict a swine flu pandemic. In F. M. Carrero, J. M. Gómez, B. Monsalve, E.Puertas, & J. C. Cortizo (Eds.), 1st International workshop on mining social media(pp. 9–18). Spain: Sevilla.
Rodríguez-Ardura, I., & Martínez-López, F. J. (2014). Another look at ‘being there’experiences in digital media: Exploring connections of telepresence withmental imagery. Computers in Human Behavior, 30, 508–518.
Salton, G., & Buckley, C. (1988). Term-weighting approaches in automatic textretrieval. Information Processing & Management, 24(5), 513–523.
Sapiro, G. (2011). Images everywhere: Looking for models: Technical perspective.Communications of the ACM, 54(5). 108-108.
Schneckenberg, D. (2009). Web 2.0 and the empowerment of the knowledgeworker. Journal of Knowledge Management, 13(6), 509–520.
Schneider, N. (2012). Some assembly required: Witnessing the birth of occupy wallstreet, Harper’s Magazine, February 2012 Issue: 45–54, <http://bit.ly/1du91Ku>[Accessed on 27th July, 2014].
Schubert, T. W. (2009). A new conception of spatial presence: Once again, withfeeling. Communication Theory, 19(2), 161–187.
Sibson, R. (1981). A brief description of natural neighbor interpolation. In V. Barnett(Ed.), Interpolating multivariate data (pp. 21–36). New York, NY: John Wiley &Sons.
Smith, A. (2011). Why Americans use social media: Social networking sites areappealing as a way to maintain contact with close ties and reconnect with oldfriends. Pew Research Center, Washington DC. <http://bit.ly/rLCsA6> [Accessedon 1st August, 2014].
Smith, A., & Brenner, J. (2012). Twitter use 2012. Washington DC: Pew ResearchCenter.
Stefanidis, T., Crooks, A. T., & Radzikowski, J. (2013). Harvesting ambient geospatialinformation from social media feeds. GeoJournal, 78(2), 319–338.
Sui, D. (2008). The wikification of gis and its consequences: Or Angelina Jolie’s NewTattoo and the future of GIS. Computers, Environment and Urban Systems, 32(1),1–5.
Sui, D., & Goodchild, M. F. (2011). The convergence of GIS and social media:Challenges for GIScience. International Journal of Geographical InformationScience, 25(11), 1737–1748.
Please cite this article in press as: Croitoru, A., et al. Linking cyber and physicalComputers, Environment and Urban Systems (2014), http://dx.doi.org/10.1016/j.
Sutton, E. S., Spiro, B., Johnson, S., Fitzhugh, B., Gibson, Butts, C. T. (2014). Tersemessage amplification in the Boston bombing response. In S. R. Hiltz, M. S. Pfaff,L. Plotnick, A. C. Robinson (Eds.), Proceedings of the 11th international conferenceon Information Systems for Crisis Response and Management (ISCRAM), UniversityPark, Pennsylvania, USA, May 18–24, 2014. <http://bit.ly/Zszkwd> [Accessed on22nd September, 2014].
Ter Wal, A., & Boschma, R. (2009). Applying social network analysis in economicgeography: Framing some key analytic issues. The Annals of Regional Science,43(3), 739–756.
Tomaszewski, B., Blanford, J., Ross, K., Pezanowski, S., & MacEachren, A. M. (2011).Supporting geographically-aware web document foraging and sensemaking.Computers, Environment and Urban Systems, 35(3), 192–207.
Virnoche, M. E., & Marx, G. T. (1997). ‘‘Only Connect’’—E. M. Forster in an age ofelectronic communication: Computer-mediated association and communitynetworks. Sociological Inquiry, 67(1), 85–100.
Wakita, K., Tsurumi, T. (2007). Finding Community Structure in Mega-scale SocialNetworks’. In Proceedings of the 16th international conference on World WideWeb, Banff, Canada, pp. 1275–1276.
Wellman, B. (2001). Physical place and cyberplace: The rise of personalizednetworking. International Journal of Urban and Regional Research, 25(2),227–252.
Wirth, W., Hartmann, T., Böcking, S., Vorderer, P., Klimmt, C., Schramm, H., et al.(2007). A process model of the formation of spatial presence experiences. MediaPsychology, 9(3), 493–525.
Wong, S. K. M., Ziarko, W., Raghavan, V. V., & Wong, P. C. N. (1987). On modeling ofinformation retrieval concepts in vector spaces. ACM Transactions on DatabaseSystems, 12(2), 299–321.
Yang, B., Liu, D., & Liu, J. (2010). Discovering communities from social networks:Methodologies and applications. In B. Furht (Ed.), Handbook of social networktechnologies and applications (pp. 331–346). New York, NY: Springer.
Yang, Z., Guo, J., Cai, K., Tang, J., Li, J., Zhang, L., et al. (2010). Understandingretweeting behaviors in social networks. In Proceedings of the 19th ACMinternational conference on information and knowledge management, Toronto,Canada (pp. 1633–1636).
YouTube (2014). YouTube pressroom statistics. <http://bit.ly/gzYBVx> [Accessed on6th August, 2014].
Zhang, Y., Wu, Y., & Yang, Q. (2012). Community discovery in twitter based on userinterests. Journal of Computational Information Systems, 8(3), 991–1000.
Zhu, S., Wu, J., Xiong, H., & Xia, G. (2011). Scaling up top-K Cosine similarity search.Data & Knowledge Engineering, 70(1), 60–83.
Zook, M., Graham, M., Shelton, T., & Gorman, S. (2010). Volunteered geographicinformation and crowdsourcing disaster relief: A case study of the haitianearthquake. World Medical & Health Policy, 2(2).
spaces through community detection and clustering in social media feeds.compenvurbsys.2014.11.002
Related Documents


