1 LINKING BUSINESS ANALYTICS TO DECISION MAKING EFFECTIVENESS: A PATH MODEL ANALYSIS Key words: Business analytics; Information processing capability; Decision-making effectiveness; Information processing view; Contingency theory; Data-driven environment Abstract While business analytics is being increasingly used to gain data-driven insights to support decision-making, little research exists regarding the mechanism through which business analytics can be used to improve decision-making effectiveness at the organisational level. Drawing on the information processing view and contingency theory, this paper develops a research model linking business analytics to organisational decision-making effectiveness. The research model is tested using structural equation modelling based on 740 responses collected from UK businesses. The key findings demonstrate that business analytics, through the mediation of a data-driven environment, positively influences information processing capabilities, which in turn have a positive effect on decision-making effectiveness. The findings also demonstrate that the paths from business analytics to decision-making effectiveness have no statistical differences between large and medium companies but some differences between manufacturing and professional service industries. Our findings contribute to the business analytics literature by providing useful insights into business analytics applications and the facilitation of data-driven decision-making. They also contribute to managers’ knowledge and understanding by demonstrating how business analytics should be implemented to improve decision-making effectiveness.

Welcome message from author
This document is posted to help you gain knowledge. Please leave a comment to let me know what you think about it! Share it to your friends and learn new things together.
Transcript

1
LINKING BUSINESS ANALYTICS TO DECISION MAKING
EFFECTIVENESS: A PATH MODEL ANALYSIS
Key words: Business analytics; Information processing capability; Decision-making
effectiveness; Information processing view; Contingency theory; Data-driven environment
Abstract
While business analytics is being increasingly used to gain data-driven insights to support
decision-making, little research exists regarding the mechanism through which business
analytics can be used to improve decision-making effectiveness at the organisational level.
Drawing on the information processing view and contingency theory, this paper develops a
research model linking business analytics to organisational decision-making effectiveness.
The research model is tested using structural equation modelling based on 740 responses
collected from UK businesses. The key findings demonstrate that business analytics, through
the mediation of a data-driven environment, positively influences information processing
capabilities, which in turn have a positive effect on decision-making effectiveness. The
findings also demonstrate that the paths from business analytics to decision-making
effectiveness have no statistical differences between large and medium companies but some
differences between manufacturing and professional service industries. Our findings
contribute to the business analytics literature by providing useful insights into business
analytics applications and the facilitation of data-driven decision-making. They also
contribute to managers’ knowledge and understanding by demonstrating how business
analytics should be implemented to improve decision-making effectiveness.

2
1 INTRODUCTION
Business analytics (BA) refers to “the extensive use of data, statistical and quantitative
analysis, explanatory and predictive models, and fact-based management to drive decisions
and actions” [1, pp. 7]. The concept of BA was initially developed in the mid-1950s and has
been widely examined over the years [2, 3]. However, BA has recently re-emerged as an
important area of study [3-5]. Several key reasons can be identified for the growing
importance of BA. First, the advances in information technology (IT) have enabled
businesses to develop innovative ways to collect data from both internal and external sources
[2]. This leads to the unprecedented challenges of big data, characterised by “high volume,
high velocity, and/or high variety” [4, pp. 1249], as processing big data is difficult and
requires new and advanced technologies [3]. At the same time, big data offers remarkable
business opportunities for organisations to gain useful insights into customers and operations
[4]. Consequently, BA, based on sophisticated IT [6, 7], has been increasingly used by
organisations [4, 7-9]. Second, organisations require BA to “gain an edge by making better or
faster decisions” [10, pp. 30] to face increasing competition and turbulence in their
marketplaces due to the speed of technological advancement and globalisation. Third and
most importantly, the confluence of big data, advances in IT, and BA, has brought decision-
making to a completely new level that is ever so data-driven, allowing managers to see what
was previously invisible [11]. This represents “a qualitative change in opportunities to
generate value and competitive advantage”, and to enable decision-making move towards
“territory which has historically been seen as reliant on human judgment” [12, pp. 288-289].
Despite the importance of BA and data-driven decision-making [7-9], surprisingly little
academic research has been conducted to understand BA as an emerging field of study [5, 13].
Consequently, little is known about the mechanisms through which BA improves decision-
making. As many companies are still struggling to figure out how to use analytics [8, 11, 14],

3
the absence of such an understanding limits the ability of businesses to effectively leverage
BA for value creation. Until the mechanisms through which BA influences organisational
decision-making is better understood, realising business value from BA remains a challenge.
This paper therefore aims to reduce this research gap by developing an understanding
of the mechanisms through which BA improves decision-making effectiveness that is the
extent to which a decision results in desired outcomes [15]. Drawing on the information
processing view and contingency theory, this paper develops and empirically tests a path
model to explain how BA and other organisational factors work together to enhance decision-
making effectiveness.
Although contingency theory and the information processing view have been used
previously to understand the impact of IT on organisations, no research based on these two
theories has been conducted to date to examine the emerging BA and its impact on decision-
making effectiveness. Thus, this research seeks to contribute to the literature by developing a
research model in which relevant constructs regarding BA’s impact on decision-making
effectiveness are conceptualised and tested. To evaluate this research model empirically,
partial least squares structural equation modelling (PLS-SEM) is used, based on 740
responses that are collected from an online questionnaire survey of UK businesses. A multi-
group analysis is also conducted to understand whether industry and firm size moderate the
relationships hypothesised in the research model. This study shows that BA supported with a
data-driven environment will lead to the development of information processing capabilities,
which in turn have a major impact on organisational decision-making and decision-making
effectiveness. This research will also contribute to managers’ knowledge and understanding
of BA and its impact thereby to improve organisational decision-making.
The next section of the paper presents the literature review, the research model, and
hypotheses. The subsequent sections describe the instrument development and the data

4
collection processes, and report on the findings. The final section discusses the results and
implications.
2 THEORETICAL BACKGROUND
This section begins with defining the key terms to be used in this paper and then develops
hypotheses regarding the effect of BA on decision-making effectiveness.
2.1 Key concepts defined
From the information processing view [16, 17], the key task for organisations is to manage
uncertainty such as task complexity and the rate of environmental change through deploying
mechanisms of information processing. The information processing view emphasises the
importance of matching information processing requirements with information processing
capabilities: the greater the task uncertainty, the greater amount of information that has to be
processed [16]. Therefore, organisations should design its structure [17] or business processes
[18] to facilitate information processing to enable decision makers to process a great amount
of data, thereby to inform decision-making, reduce costs, and improve organisational
performance. For instance, [18] demonstrates that the interactive effect of information
processing needs and information processing capabilities has a significant effect on
performance in an inter-organisational supply chain context. Likewise, [19] shows that there
is a positive relationship between inter-firm information processing capabilities and supply
chain company performances. Thus, an organisation is expected to be more effective when its
information processing requirements are matched by its information processing capabilities
[17].
The concept of information processing capabilities is initially used by [16] without a
definition to outline the information processing view of organisational design. These terms
are adopted by [17, pp. 614] to further develop the information processing view, while
information processing is defined as “the gathering, interpreting, and synthesis of
5
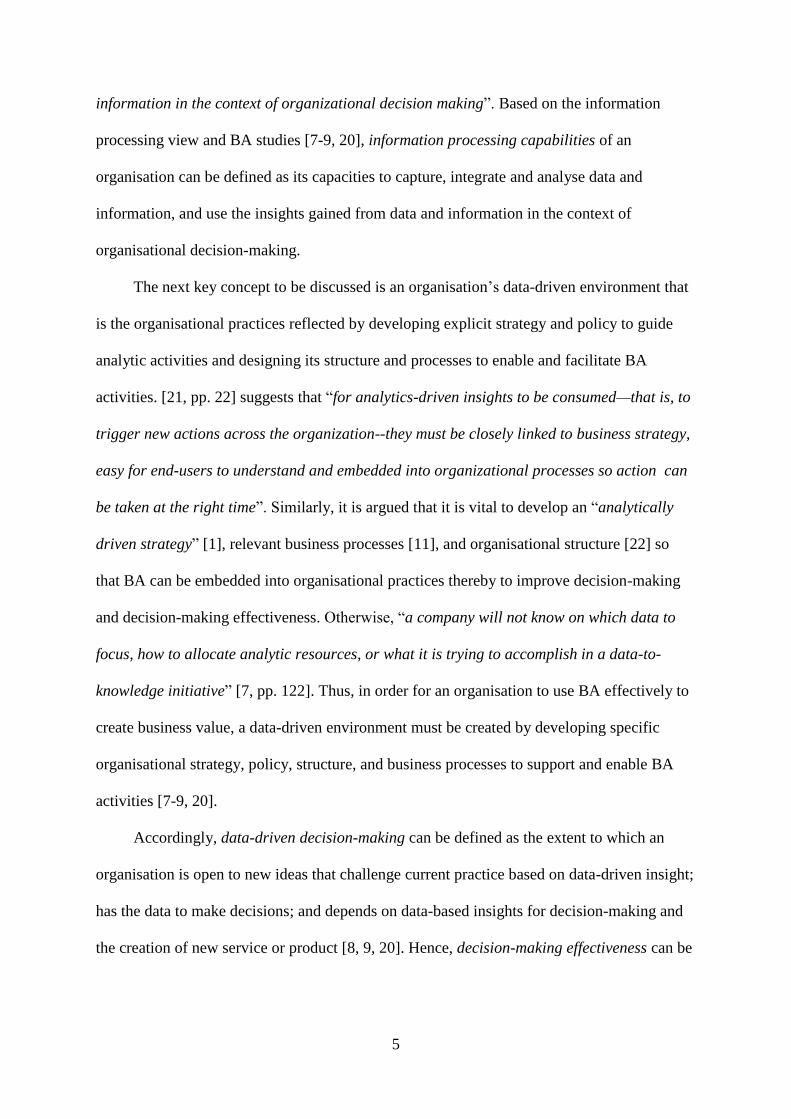
information in the context of organizational decision making”. Based on the information
processing view and BA studies [7-9, 20], information processing capabilities of an
organisation can be defined as its capacities to capture, integrate and analyse data and
information, and use the insights gained from data and information in the context of
organisational decision-making.
The next key concept to be discussed is an organisation’s data-driven environment that
is the organisational practices reflected by developing explicit strategy and policy to guide
analytic activities and designing its structure and processes to enable and facilitate BA
activities. [21, pp. 22] suggests that “for analytics-driven insights to be consumed—that is, to
trigger new actions across the organization--they must be closely linked to business strategy,
easy for end-users to understand and embedded into organizational processes so action can
be taken at the right time”. Similarly, it is argued that it is vital to develop an “analytically
driven strategy” [1], relevant business processes [11], and organisational structure [22] so
that BA can be embedded into organisational practices thereby to improve decision-making
and decision-making effectiveness. Otherwise, “a company will not know on which data to
focus, how to allocate analytic resources, or what it is trying to accomplish in a data-to-
knowledge initiative” [7, pp. 122]. Thus, in order for an organisation to use BA effectively to
create business value, a data-driven environment must be created by developing specific
organisational strategy, policy, structure, and business processes to support and enable BA
activities [7-9, 20].
Accordingly, data-driven decision-making can be defined as the extent to which an
organisation is open to new ideas that challenge current practice based on data-driven insight;
has the data to make decisions; and depends on data-based insights for decision-making and
the creation of new service or product [8, 9, 20]. Hence, decision-making effectiveness can be
6
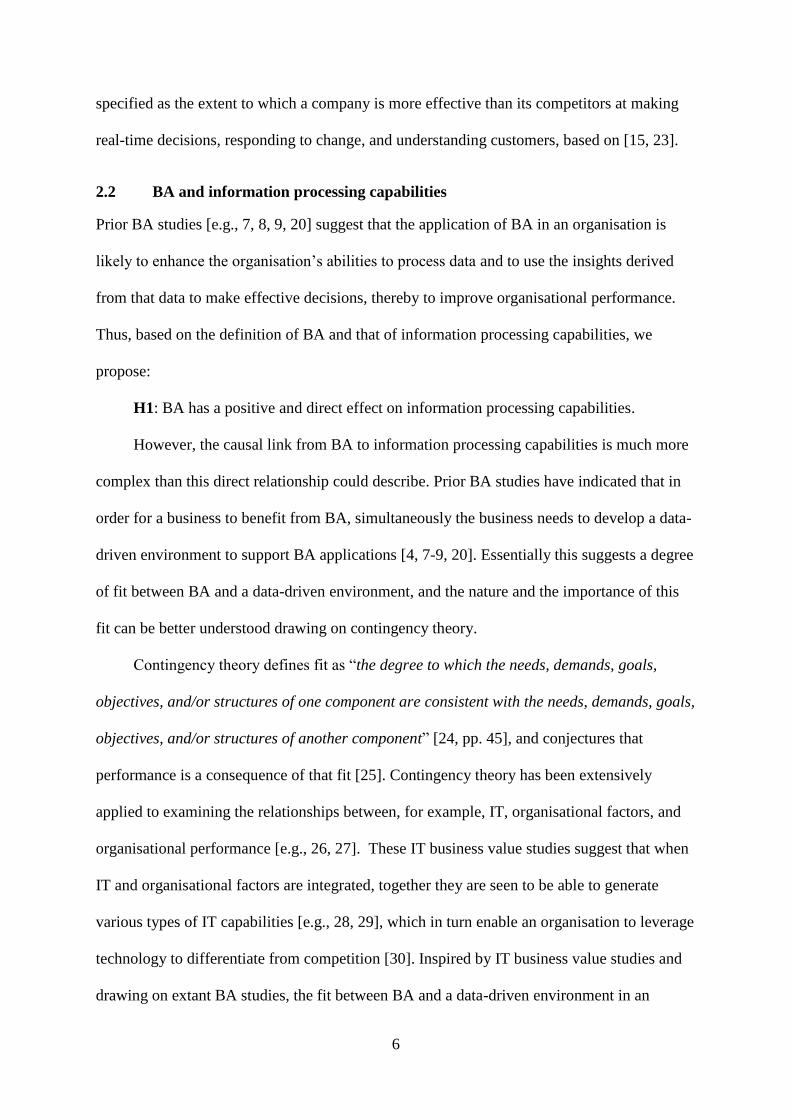
specified as the extent to which a company is more effective than its competitors at making
real-time decisions, responding to change, and understanding customers, based on [15, 23].
2.2 BA and information processing capabilities
Prior BA studies [e.g., 7, 8, 9, 20] suggest that the application of BA in an organisation is
likely to enhance the organisation’s abilities to process data and to use the insights derived
from that data to make effective decisions, thereby to improve organisational performance.
Thus, based on the definition of BA and that of information processing capabilities, we
propose:
H1: BA has a positive and direct effect on information processing capabilities.
However, the causal link from BA to information processing capabilities is much more
complex than this direct relationship could describe. Prior BA studies have indicated that in
order for a business to benefit from BA, simultaneously the business needs to develop a data-
driven environment to support BA applications [4, 7-9, 20]. Essentially this suggests a degree
of fit between BA and a data-driven environment, and the nature and the importance of this
fit can be better understood drawing on contingency theory.
Contingency theory defines fit as “the degree to which the needs, demands, goals,
objectives, and/or structures of one component are consistent with the needs, demands, goals,
objectives, and/or structures of another component” [24, pp. 45], and conjectures that
performance is a consequence of that fit [25]. Contingency theory has been extensively
applied to examining the relationships between, for example, IT, organisational factors, and
organisational performance [e.g., 26, 27]. These IT business value studies suggest that when
IT and organisational factors are integrated, together they are seen to be able to generate
various types of IT capabilities [e.g., 28, 29], which in turn enable an organisation to leverage
technology to differentiate from competition [30]. Inspired by IT business value studies and
drawing on extant BA studies, the fit between BA and a data-driven environment in an

7
organisation can be argued to have a positive impact on the organisation’s information
processing capabilities. It can be expected that an organisation with a higher degree of fit
between its BA and data-driven environment will outperform those with lower degree of fit;
and the better the fit, the stronger the information processing capabilities.
Regarding how this fit influences information processing capabilities, a mediation
model of fit can be supported by the proposition that technology can be an important
determinant of organisational processes and structure in research underpinned by contingency
theory [31]. For example, [32] argues that increasing technological complexity would require
greater structural complexity for effective performance, while [33] suggests that technology
can be a determinant of organisational processes and structure. Alternatively, [34] examines
the relative routineness of work and advocated that organisational structure depends on
technology. In line with this, it can be argued that BA applications are likely to bring about a
data-driven environment embedded in and reflected by explicitly developing organisational
strategy, policy, structure, and business processes to guide and enable BA activities, which
will help develop information processing capabilities. Thus, it is proposed that
H2: BA has a positive and indirect effect on information processing capabilities
through the mediation of a data-driven environment.
2.3 Data-driven environment, information processing capabilities and decision-
making
Drawing on the information processing view, an organisation is more likely to make effective
decisions when it designs its structure [17] and business processes [18] to facilitate its
information processing capabilities thereby to meet its data processing requirements. For
instance, the processing requirement of big data is complex as it involves dealing with data
that are high in volume, variety, and velocity. This big data processing requirement is
overwhelming to organisations since “it is very difficult for individuals to process large

8
volumes of incoming information comprehensively” [35, pp. 156]. It is also impossible for
traditional systems to capture, store, and analyse big data [2, 7]; rather, it requires new and
innovative forms of information processing capabilities that are likely to be provided by BA
with “advanced and unique data storage, management, analysis, and visualization
technologies” [3, pp. 1166]. Therefore, in order for an organisation to meet its big data
processing needs, it must develop its information processing capabilities through effective
BA applications, which are enabled by developing an “analytically driven strategy” [1] and
designing relevant business processes [11] and organisational structure [22].
When an organisation has developed strong information processing capabilities to
match its data processing requirements, the organisation can be expected to have sufficient
information and data-driven insights to allow it to evaluate its business practices, to make
informed decisions not only to improve internal business efficiencies but also to create new
products or services for customers [2], to achieve faster cycle times and greater flexibility [6],
and/or to significantly improve its performance [16]. This is consistent with the strategic
decision-making research. For example, it is expected that when a business has complete and
accurate information about the relationship between choices and outcomes, it will be most
likely to make successful decisions [36], to generate viable organisational strategies [37], and
to improve organisational performance [38]. Therefore, it is proposed that
H3: Information processing capabilities have a positive effect on a data-driven
decision-making.
H4: Information processing capabilities have a positive and direct effect on decision-
making effectiveness.
Furthermore, it has been widely recognised in the BA literature that the potentials of
BA can only be realised when a data-driven environment is developed so that decision-
making, strategy, and operations rely on data-driven insights [1, 8, 9]. A data-driven

9
environment is seen to help a company to have the data to make decisions, to be open to new
ideas, to make decisions depending on fact-based insights, and to use fact-based insight for
the creation of new service or product. Thus, it is proposed that
H5: A data-driven environment is positively and directly associated with data-driven
decision-making.
H6: Data-driven decision-making is positively associated with decision-making
effectiveness.
2.4 The moderating effect of firm size and industry type
The relationship between IT and firm size is an important area of study [27, 39]. Firm size
matters because it may affect the relationship between IT and other organisational aspects
such as the use and spending patterns of IT investment [40, 41]. This paper is particularly
interested in whether firm size might affect the way organisations implement BA.
Prior research has reported in the IT context that firm size has a moderating effect
on for example the total effects of quality system on final outcome [42] or weakly on the
performance relationship of advanced manufacturing technology [43]. In other areas of
management research, the findings on the moderating impact of firm size are at variance [e.g.,
44, 45]. Nevertheless, the impact of firm size should not be ignored. This research examines
whether firm size moderates the paths from BA to decision-making effectiveness. As prior
studies indicate that companies with different sizes behave differently regarding IT use and
investment [40, 41], it is thus proposed that
H7: Firm size moderates the paths from BA to decision-making effectiveness.
Another important variable is industry type since firms in different industries often
differ systematically regarding IT spending, needs for IT, and other organisational and
technological conditions that are relevant to the way IT is used [46]. While the impact of
industry type on IT has received limited attention in IT research [46], prior studies in other

10
research areas, however, have found support for the moderating effect of industry type on
organisational performance [e.g., 47, 48]. Similarly, it is expected that industry type is likely
to play a moderating role in affecting BA applications. Thus, it is proposed that
H8: Industry type moderates the paths from BA to decision-making effectiveness.
As a result, our research model can be summarised in Figure 1.
Figure 1. Research model
3 RESEARCH METHOD
The hypotheses are tested based on survey data using PLS-SEM. PLS-SEM is recommended
to be well suited for research situations where theory is less developed [49-51] and the
objective is prediction or to explain relationships among a set of constructs in research
situations where the phenomenon under study is new [52-54]. The importance of BA may
have been widely discussed, but BA is still re-emerging as a new research area while extant
BA studies are “predominantly practice driven…there is very little published management
scholarship” [13, pp. 321]. Consequently, there are hardly any developed measures for new
constructs in this area and few empirical studies to shed light on the relationships between
BA and other organisational variables. Thus, PLS-SEM is considered appropriate for the
present study to conceptualise and empirically test the paths from BA to decision-making
effectiveness. PLS-SEM is also appropriate for the present study as it can handle both
Business
Analytics
(BA)
Data-driven
Decision
Making
(DDM)
Data-driven
Environment
(DDE)
Decision
Making
Effectiveness
(DME)
Information
Processing
Capability
(IPC)

11
reflective and formative constructs, both of which are used in the research model. In the
following section, we outline the instrument development, validation, and dissemination
processes.
3.1 Research model constructs
To develop and test the research model, a number of constructs are identified and are
summarised in Table 1. As BA is still re-emerging as a new research area, there are few
previously validated measurement items. Thus, five new formative constructs have been
developed for this research based on literature on BA and IT business value.
To properly develop formative constructs is challenging [54] as the scale development
procedures suggested in the literature are limited [55]. Failing to define constructs properly
may cause serious problems such as damaging the validity of the constructs and statistical
conclusions [55] and/or affecting theory development and theory testing [56]. In order to
avoid common misspecifications, we develop the five constructs based on the four decision
rules [56]: the direction of causality between construct and indicators, the interchangeability
of indicators, the covariation among indicators, and the nomological net for the indicators.
To make the development process more transparent and robust, the definition of BA is used
as an example. Based on prior research [e.g., 3, 7, 9], BA is defined formatively by 13
different indicators in two stages: before and after data collection [56]. Prior to data
collection, the first decision rule considered is the direction of causality between BA and its
indicators. Rather than BA defines the indicators, it is more appropriate to understand BA as
a composite concept formed jointly by its indicators, each of which clearly captures different
aspects of the construct. For example, while web analytics focuses on digital data analysis,
simulation and model management are different and mainly about modelling. Thus, changes
in each indicator would have caused change in how BA is defined and interpreted. Second,
are the indicators interchangeable? Web analytics and social media analytics for instance

12
Table 1. Constructs and indicators of the study
Constructs Indicators Reference
BA
How often does your organisation use the following?
Statistical analysis (SA1)
Forecasting (FC1)
Query and analysis (QA1)
Predictive modelling (PM1)
Optimisation (OPT1)
Model management (MM1)
Simulation & scenario development (SM1)
Business reporting /KPIs/Dashboards (KPI1)
Web analytics (WA1)
Social media analytics (SMA1)
Interactive data visualisation (IDV1)
Text, audio, video analytics (TAVA1)
Data and text mining (DTM1)
[3, 7, 9]
Data-Driven
Environment
(DDE)
To what extent do you agree or disagree
We have explicit organisational strategy that guides business
analytics activities (STRA1)
We have explicit policies and rules that guide business
analytics activities (POL1)
We have well-defined organisational structure that enables
business analytics activities (STRU1)
Business analytics is integrated into our business processes
(PRO1)
We prioritise major business analytics investments by the
expected impact on business performance (PERF1)
[2, 7, 8,
20]
Information
processing
capabilities
(IPC)
We are more effective than our competitors at
Capturing data/information (CD1)
Integrating data/information (ID1)
Analysing data/information (AD1)
Using insights gained from data/information (UD1)
[7-9, 20]
Data-driven
Decision
Making
(DDM)
To what extent do you agree or disagree
We use data-based insight for the creation of new
service/product (S/P1)
We depend on data-based insights for decision making
(DM1)
We are open to new ideas that challenge current practice
based on data-driven insight (OPEN1)
We have the data to make decisions (DATA1)
[2, 8, 20]
Decision
Making
Effectiveness
(DME)
We are more effective than our competitors at
Responding quickly to change (CHA1)
Making real-time decisions (RTD1)
Understanding customers (CUS1)
[8, 9,
20]
share a common theme focusing on digital data analysis, but they are distinctly different from
optimisation and model management that focus on modelling. Thus, the indicators are not

13
interchangeable and the elimination of indicators may affect the characteristics of BA. Third,
are the indicators expected to covary with each other? The answer to this is not simply
positive or negative. It could be expected that indicators focusing on the same theme such as
analysing digital data are more likely to covary than those having different themes are. Thus
BA seems to be multidimensional than unidimensional, which could be verified by
conducting a factor analysis after data collection. Finally, regarding whether the indicators
have the same antecedents and consequences, the answer is not necessary. For example using
web analytics to analyse digital data may be driven by e-commerce initiatives while
modelling can be enacted by any business practices; accordingly, their consequences may
differ. This consideration again suggests that BA should be defined as a multidimensional
construct. For example, indicators focusing on digital data analysis should be grouped
together and defined as a reflective construct because they share a common theme and tend to
be interchangeable; the same should also be applicable to indicators relating to modelling.
Thus, prior to data collection, it is seen to be more appropriate to define BA formatively as a
higher-order component by a few lower-order reflective components. The reflective lower-
order components are then determined based on an exploratory factor analysis after data are
collected, which is covered in Section 4.4. Similarly, other formative constructs are defined
based on the four decision rules.
3.2 Data collection
To test the hypotheses empirically, we have selected both medium (with employees between
50 and 250) and large (more than 250 employees) UK enterprises as they are expected to
have the expertise and resources to employ various types of BA. A questionnaire survey is
generated using a five-point Likert scale measurements for all constructs. The survey
instruments are developed based on literature review initially and then are scrutinised by five
internal subject experts. After a few revisions, the survey is piloted to ensure that the

14
respondents understand the questions and there are no problems with the wording or
measurements. The survey is then delivered electronically through Qualtrics to managers,
whose email addresses are identified from the FAME database. Three rounds, four weeks
apart, of emails including the survey are sent. Each intended respondent is entered into a
draw to win an iPad mini and is offered a summary of the results. While 103,000 emails are
sent with the e-mail subject highlighted as questionnaire survey, the majority of them are
never opened; though a few companies have replied to state that they have a policy not to
participate in any surveys. Of all sent emails, 2,276 are opened, representing a click-through
rate of 2.2%; of these opened, we have received 740 usable responses, which represent a 32.5%
response rate.
4 RESULTS
4.1 Respondent’s profile
Table 2 summarises the respondents’ characteristics in terms of their organisational positions
and years of experience in their current firms and industry.
Table 2. Respondent profiles (n=740)
Industry % Positions %
Manufacturing 31 CEO/MD/Partner 28
Prof Services 15 Finance/Accounting director 13
Retail/Wholesale 8 Operations director 11
Technology 7 Marketing/Sales director 11
Financial Services 6 CIO/IT Manager 8
Other 33 Other directors 29
Respondent Experience
Years In the firm % In the industry %
≤ 5 22 4
5 < but ≤ 10 29 10
10 < but ≤ 15 13 12
15 < but ≤ 20 12 15
20 < but ≤ 25 10 14
>25 14 45

15
A key informant approach is used to collect data [57]. The reported positions of the
respondents suggest that 28% of the respondents are in a senior managerial position and the
rest of them are middle managers. Based on their managerial positions, the respondents are
highly likely to participate in decision-making processes related to the topic of the survey
[58]. Of all respondents, 49% have been with their firms for more than 10 years, whilst 86%
have been in the industry for more than 10 years. The respondents are from a number of
different industries, for example 31% from manufacturing sector, 15% from professional
services, and 8% from retail/wholesale. Overall, the sample of respondents seems to be
diverse, representing various industry, managerial position and experience.
4.2 Common method and non-respondent bias
Common method bias that may affect the correlations between variables and cause biased
parameter estimates [59] is assessed by conducting an exploratory factor analysis (EFA).
Harman’s single-factor test is conducted by entering all independent and dependent variables
[60]. If a single factor explains most of the variance of all the indicators, then the common
method variance (CMV) associated with the data is high. Conversely, if more than one factor
emerges to explain most of the communality, then the CMV associated with the data is low.
In this research, the test result shows that the first factor accounts for 33.22% of the total
variance; there is no evidence of a substantial amount of CMV in the data.
To evaluate the presence of non-response bias, we conduct two tests. The first test
compares the distributions of the position and company size of the respondents with those of
the complete sampling frame (respondents plus non-respondents with e-mail addresses),
based on the known value for the population approach [61]. In Table 3, the position and
company size of the respondents are the observed values, while the position and company
size of the members of the full sampling frame are the expected values. If the observed and
the expected values are significantly different, there is a bias between respondents and non-

16
respondents. A nonparametric chi-square test comparing the distributions of the observed and
expected values finds no significant differences.
Table 3. Expected and observed value
Position Observed value (%) Expected value (%)
CEO/MD/Partner 28 10
Finance/Accounting director 13 7
Operations director 11 2
Marketing/Sales director 11 8
CIO/IT Manager 8 6
Chi-square test p-value=0.9387
Company size Observed value (%) Expected value (%)
Medium 71 67
Large 29 33
Chi-square test p-value=0.9322
As a second test for non-response bias, we compares early (n=350) and late (n=390)
respondents, based on the premise that early respondents represent the average respondent
while late respondents represent the average non-respondent [61]. All 29 indicators are
evaluated by comparing the two groups through an independent t-test. The t-test results yield
two statistically significant differences: MM1 (one of 13 BA indicators) scores are significant
at the p=0.008<0.05 (two-tailed) for early respondents (M=2.429, SD=1.2253) and late
respondents (M=2.160, SD=1.0952); and OPEN1 (one of four data-driven decision-making
indicators) scores are significant at the p= 0.033<0.05 (two-tailed) for early respondents
(M=4.013, SD=0.7515) and late respondents (M=4.155, SD=0.7732). However, for the rest
of 27 indicators, the t-test result does not find significant difference between the two
respondent groups. Consequently, nonresponse bias does not appear to be a major problem
for the whole research while caution should be exercised in applying the findings.
4.3 Sample size and data screening
In our structural model, the maximum number of arrows pointing at a construct is five. In
order to detect minimum R2 value of 0.10 in any of the constructs for a significant level of

17
1%, the minimum sample size required is 205 based on [54]. Since we have 740 usable
responses, the minimum sample size requirement is thus met.
Data screening is performed using SPSS21. Missing data for an observation exceeding
10% are removed, and other missing values are replaced by using the mean value
replacement. Although PLS-SEM does not require data to be normally distributed [54],
normality is checked to ensure that the data are not too far away from normal distribution to
affect the assessment of the parameters’ significances. Of all 29 indicators, 26 of them are
normally distributed, while three (FC1, KPI1, OPEN1) are not. This deviation from normality
is not considered a major issue in this study.
4.4 Exploratory factor analysis on BA applications
BA includes different techniques. In order to explore the dimensions of BA and classify
various types of BA into meaningful categories, we conduct an exploratory factor analysis
(EFA) using a principal component analysis with Varimax rotation (SPSS21). Consequently,
three factors are identified from 13 BA techniques with 62.72% of total variance explained.
The first factor includes four BA techniques: statistical analysis, forecasting, query and
analysis, and business reporting/KPIs. Since these statistical approaches are commonly used
by organisations, thus we broadly name them as commonly used BA (CBA). The second
factor includes six BA techniques: model management, optimisation, predictive modelling,
simulation, interactive data visualisation, and data and text mining. We name them as model-
based BA (MBA) since modelling is the uniform essence of all these techniques. The third
factor includes web analytics, social media analytics, and text-audio-video analytics. We
name them as web-oriented BA (WBA) as they are used for analysing clickstream data and
information collected mainly on the web. We are aware that while this classification provides
a useful broad categorisation to facilitate communication, it needs to be further improved. For

18
example, MBA includes data-and text mining that could be part of WBA and some organisations use
web analytics more commonly. Detailed BA applications for each group are shown in Table 4.
Table 4. EFA analysis of BA applications
BA Tools/Techniques
Components and Factor Loadings
Communalities CBA MBA WBA
Statistical analysis
Forecasting
Query and analysis
Business reporting / KPIs
Model management
Optimisation
Predictive modelling
Simulation
Interactive data visualisation
Data and text mining
Web analytics
Social media analytics
Text-audio-video analytics
0.68
0.75
0.52
0.78
0.35
0.45
0.36
0.33
0.78
0.65
0.65
0.75
0.66
0.39
0.48
0.43
0.36
0.80
0.85
0.61
0.564
0.609
0.404
0.637
0.717
0.561
0.641
0.654
0.619
0.408
0.709
0.769
0.642
The EFA results are assessed based on the threshold values suggested by [62]. The
associated KMO with the EFA is 0.89, which is acceptable; Bartlett’s Test is significant at
p<0.000, and all communalities are above 0.4, suggesting the appropriateness of the data.
Cronbach's alpha is 0.88, suggesting reliability. All factor loadings are above 0.30 with a
sample of 740, suggesting convergent validity. In addition, the three factors identified namely
CBA, MBA, and WBA make sense because variables similar in nature loaded together on the
same factor, suggesting face validity. However, discriminant validity is not entirely
satisfactory since three variables including query and analysis, text-audio-video analytics, and
data and text mining have cross-loadings that are not different by more than 0.2. Yet, these
three variables are retained since they provide useful information about BA and this is an
exploratory research in nature.
Apart from developing a BA classification, this EFA analysis has also confirmed our
previous discussion in Section 3.1 that BA should be defined as a multidimensional construct.

19
Therefore, BA as a higher-order formative construct is finalised and defined by three lower-
order reflective constructs, namely, CBA, MBA, and WBA.
4.5 Evaluation of the reflective measurement indicators
Our PLS-SEM model includes both formative and reflective constructs (only lower-order
components). Following the recommendations made by [54], the reflective measurement
model is evaluated by considering the internal consistency (composite reliability), indicator
reliability, convergent validity and discriminant validity.
Composite reliability (CR) scores summarised in Table 5 indicate that results based on
these constructs are consistent since all constructs meet the recommended threshold value for
acceptable reliability, that is, both CR and Cronbach's α should be large than 0.70.
Table 5. Convergent validity and internal consistency reliability
Construct Indicator Loading
Indicator
reliability
Composite
reliability
Cronbach’s
alpha AVE
MBA
DTM1 0.64 0.41
0.89 0.84 0.56
IDV1 0.70 0.49
MM1 0.83 0.69
OPT1 0.75 0.56
PM1 0.79 0.62
SM1 0.78 0.61
CBA
FC1 0.74 0.55
0.83 0.73 0.55 KPI1 0.75 0.56
QA1 0.71 0.50
SA1 0.78 0.61
WBA
SMA1 0.85 0.72
0.86 0.76 0.68 TAVA1 0.80 0.64
WA1 0.82 0.67
Indicator reliability is first assessed by observing the factor loadings and each
indicator’s variance, the former should be large than 0.70 and the latter should be no less than
0.50. All factor loadings are above 0.7 except that DTM1’s loading is close to 0.7 and IDV1’s
loading is 0.7; and all variances are above 0.5 except that the variances of IDV1 and DTM1
are below 0.5. Therefore, indicator reliability is not entirely satisfactory but acceptable.

20
Convergent validity is also satisfactory since the average variance extracted (AVE)
value for each construct in Table 5 is no less than the recommended threshold value of 0.50.
Discriminant validity is satisfactory based on two tests. The first test is to analyse
Fornell-Larcker criterion [50] to evaluate if the square root of AVE value for each construct
is greater than the correlation of the construct with any other construct, which is true based on
the comparison summarised in Table 6.
The second test is to observe if each reflective indicator loads highest on the construct it
is associated with, which is also true (Table 7), thus demonstrating discriminant validity is
satisfactory.
Table 7. Cross-loading analysis
WBA MBA CBA
SMA1 0.85 0.40 0.32
TAVA1 0.80 0.52 0.32
WA1 0.82 0.43 0.33
DTM1 0.44 0.64 0.43
IDV1 0.52 0.70 0.36
MM1 0.48 0.83 0.46
OPT1 0.33 0.75 0.48
PM1 0.37 0.79 0.57
SM1 0.32 0.78 0.45
FC1 0.24 0.44 0.74
SA1 0.35 0.53 0.78
KPI1 0.27 0.38 0.75
QA1 0.30 0.49 0.71
4.6 Assessment of formative measurement indicators
The formative measurement model is evaluated in terms of collinearity, the indicator
Table 6. Inter-construct correlations
WBA MBA CBA
WBA 0.81
MBA 0.58 0.74
CBA 0.40 0.63 0.74 Square root of AVE on the diagonal

21
weights, significance of weights, and the indicator loadings [54]. To assess the level of
collinearity, the variance inflation of factor (VIF) values of all formative constructs are
evaluated (Table 8). The threshold value suggested for VIF is 3.3 by [56] and 5 by [54]; thus,
there are no collinearity issues.
Table 8. Collinearity assessment
BA IPC DDE
Indicators VIF Indicators VIF Indicators VIF
WBA 1.462 CD1 3.123 STRA1 2.920
MBA 2.022 ID1 3.611 POL1 2.347
CBA 1.653 AD1 2.306 STRU1 2.492
DDM UD1 2.240 PRO1 3.203
Indicators VIF DME PERF1 2.168
S/P1 1.711 Indicators VIF
DM1 1.738 CHA1 2.924
DATA1 1.055 RTD1 3.226
OPEN1 1.160 CUS1 2.487
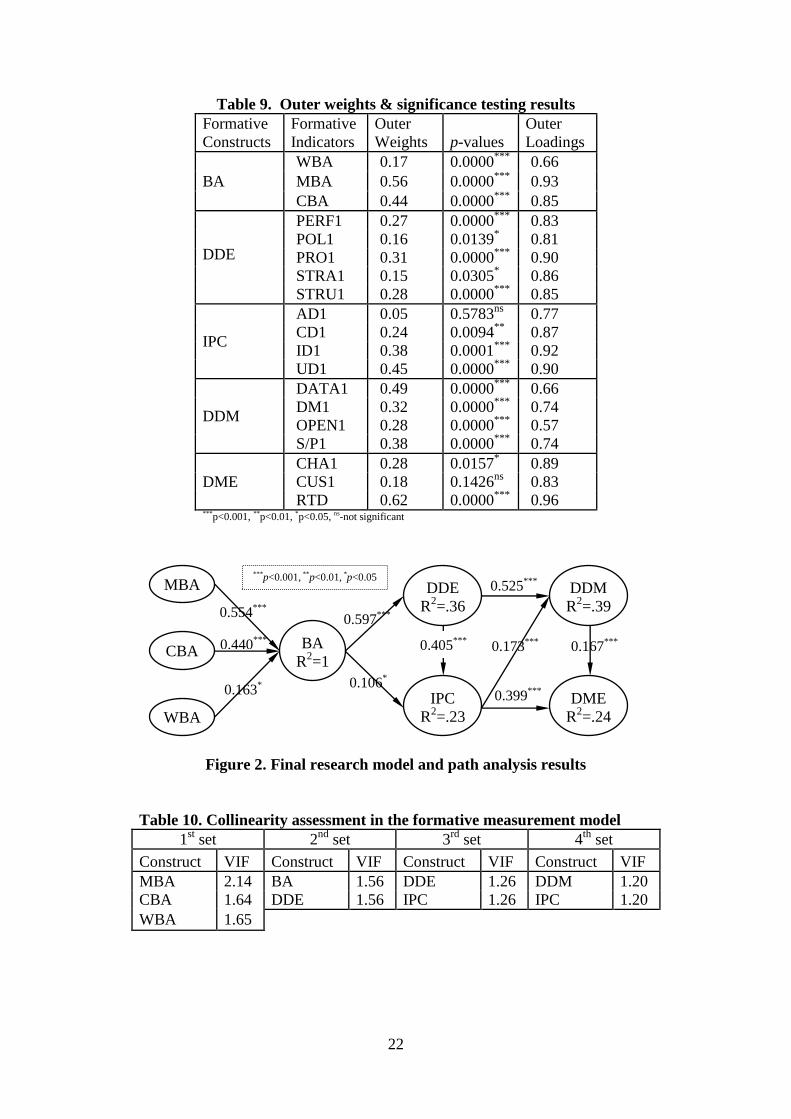
Based on the bootstrapping process (5,000 samples), all formative indictors’ outer
loadings, outer weights and the associated significance testing p-values are assessed and
summarised in Table 9. Except for AD1 and CUS1, all other indicators’ outer weights are
significant. When a formative indicator’s outer weight is not significant, [54] suggests that it
should be kept if its outer loading is above 0.5. As AD1 and CUS1’s outer loadings are above
0.5, they are retained, demonstrating each indicator’s absolute contribution to the associated
formative construct.
4.7 Hypothesis testing
SmartPLS 3 is used for testing the hypotheses and the results are presented in Figure 2.
Following [54], the structural model is assessed in terms of collinearity and the significance
and relevance of the structural model relationships. To assess collinearity issues, four sets of
predictor constructs are evaluated in SPSS 21 based on the latent variable scores from
SmartPLS 3. The VIF values are summarised in Table 10 and there are no collinearity issues.
22
Figure 2. Final research model and path analysis results
Table 10. Collinearity assessment in the formative measurement model
1st set 2
nd set 3
rd set 4
th set
Construct VIF Construct VIF Construct VIF Construct VIF
MBA 2.14 BA 1.56 DDE 1.26 DDM 1.20
CBA 1.64 DDE 1.56 IPC 1.26 IPC 1.20
WBA 1.65
Table 9. Outer weights & significance testing results
Formative
Constructs
Formative
Indicators
Outer
Weights p-values
Outer
Loadings
BA
WBA 0.17 0.0000***
0.66
MBA 0.56 0.0000***
0.93
CBA 0.44 0.0000***
0.85
DDE
PERF1 0.27 0.0000***
0.83
POL1 0.16 0.0139* 0.81
PRO1 0.31 0.0000***
0.90
STRA1 0.15 0.0305* 0.86
STRU1 0.28 0.0000***
0.85
IPC
AD1 0.05 0.5783ns
0.77
CD1 0.24 0.0094**
0.87
ID1 0.38 0.0001***
0.92
UD1 0.45 0.0000***
0.90
DDM
DATA1 0.49 0.0000***
0.66
DM1 0.32 0.0000***
0.74
OPEN1 0.28 0.0000***
0.57
S/P1 0.38 0.0000***
0.74
DME
CHA1 0.28 0.0157* 0.89
CUS1 0.18 0.1426ns
0.83
RTD 0.62 0.0000***
0.96 ***p<0.001, **p<0.01, *p<0.05, ns-not significant
0.405***
0.399***
0.525***
0.440***
0.554***
0.163*
0.597***
0.106*
0.173***
0.167***
***p<0.001, **p<0.01, *p<0.05 DDE
R2=.36
IPC
R2=.23
DME
R2=.24
DDM
R2=.39
MBA
WBA
CBA BA
R2=1

23
The significance and relevance of the path coefficients are shown in Figure 2. BA is
significantly related to both data-driven environment (DDE) and information processing
capabilities (IPC). Data-driven environment is strongly related to information processing
capabilities, which in turn are significantly related to data-driven decision-making (DDM)
and decision-making effectiveness (DME). Data-driven decision-making is significantly
contributing to decision-making effectiveness.
From Table 11, information processing capabilities have the strongest total effect on
decision-making effectiveness, followed by data-driven environment, BA, and data-driven
decision-making. A data-driven environment has the strongest total effect on information
processing capabilities, followed by BA.
Table 11. Total effect
Total effect on DME Total effect on IPC
IPC DDE BA DDM DDE BA
0.43 0.26 0.20 0.17 0.41 0.35
The predictive power of the model can be assessed by observing the amount of variance
attributed to the latent variables (i.e., R2) and the value of the predictive relevance Q
2,
summarised in Table 12.
All Q2 in Table 12 are above zero, providing support for the model’s predictive
relevance regarding the latent variables [54]. The model’s predictive power is reflected by the
variables’ R2 values. When PLS-SEM is used in IT studies, the effect size suggested for R
2 is
small=0.1, medium=0.25, and large=0.36 [51]. In line with this, the effect sizes of DDE and
DDM can be classified as large; the effect sizes of DME and IPC are close to medium. The
Table 12. Results of R2 and Q
2 values
IPC DDE BA DDM DME
R2 Value 0.23 0.36 1.0 0.39 0.24
Q2 Value 0.17 0.26 0.42 0.18 0.19

24
overall model’s explanatory power being 24% suggests that there are other influencing
factors beyond the scope of our research model to affect the organisation’s decision-making
effectiveness. Such factors may include for example characteristics of top management team,
organisational structure, and business environment [63].
Table 13 summarise the results of hypothesis testing with the standardised path
coefficients and p-values where appropriate.
Table 13. Summary results of hypotheses testing
Hypothesised path Stand. path coefficient p-values Hypothesis test
H1 BA -> IPC 0.106 0.0111*
Supported H2 BA -> DDE->IPC Supported
H3 IPC -> DDM 0.173 0.0000***
Supported H4 IPC -> DME 0.399 0.0000
*** Supported
H5 DDE -> DDM 0.525 0.0000***
Supported H6 DDM -> DME 0.167 0.0002***
Supported H7 Firm size moderates the proposed path
Rejected
H8 Industry type moderates the proposed path Weakly supported ***p<0.001, **p<0.01, *p<0.05
H1 suggests that BA has a positive and direct effect on information processing
capabilities (IPC), which is supported as BA’s effect on IPC is 0.106 (p<0.05). H2 assumes
that BA has an indirect effect on IPC through the mediation of a data-driven environment
(DDE). To validate H2, the mediating role of data-driven environment on the relationship
between BA and information processing capabilities was analysed, following the steps
suggested by [64] but based on bootstrapping [54]. The relative size of the mediating effect is
decided by calculating the variance accounted for (VAF) [65]. The result of the analysis
summarised in Table 14 suggests that data-driven environment partially but strongly mediates
the effect of BA on information processing capabilities; thus, H2 is supported.
H3 suggests that information processing capabilities have a positive effect on data-
driven decision-making (DDM). As shown in Table 13, the effect of information processing
capabilities on data-driven decision-making is 0.173 (p<0.001); thus H3 is supported. H4

25
Table 14. The mediating role of a data-driven environment
Hypothesis Direct effect
without mediation
Direct effect
with mediation
Indirect
effect VAF
Mediation
type observed
H2 0.347***
0.106* 0.242
*** 0.695 Partial
***p<0.001, **p<0.01, *p<0.05 VAF>0.80 full mediation, 0.20 ≤ VAF ≤ 0.80 partial mediation, VAF < 0.20 no mediation
posits that information processing capabilities have a direct and positive effect on decision-
making effectiveness (DME), which is supported as the effect of information processing
capabilities on decision-making effectiveness is 0.399 at (p<0.001). H5 suggests that data-
driven environment has a direct and positive effect on data-driven decision-making, which in
turn has a positive effect on decision-making effectiveness (H6). We find that the direct
effect of data-driven environment on data-driven decision-making is 0.525 (p<0.001) and the
effect of data-driven decision-making on decision-making effectiveness is 0.167 (p<0.001);
thus, both H5 and H6 are supported.
H7 and H8 propose that firm size and industry type moderate the paths from BA to
DME respectively. To understand whether firm size or industry type moderates the paths
from BA to decision-making effectiveness, a PLS-SEM multi-group analysis (PLS-MGA) is
conducted. When engaging in PLS-MGA, the number of observations in each group also
needs to meet the minimum sample size requirement. In order to detect a minimum R2 value
of 0.25 in any of the constructs for a significant level of 1%, the minimum sample size
required is 98 since the maximum number of arrows pointing at a construct is five in this
research [54]. Thus, to test the moderating effect of firm size, we compare medium (n=524)
and large (n=216) companies; to test the moderating effect of industry type, we compare
manufacturing (n=232) and professional services (n=108) industries. We are unable to
compare others because the sample size for each of the other industries is below 98. The
comparison between the hypothesised paths of medium (n=524) and large (n=216) companies
indicates that company size has no moderating effect on the paths from BA to decision-

26
making effectiveness because none of the p-values associated with the comparison is
significant; thus, H7 is rejected
Similarly, in order to assess the moderating effect of industry type on the paths from
BA to decision-making effectiveness, the hypothesised paths are compared between
manufacturing (n=232) and professional services (n=108). The comparison identifies that two
of the seven paths are significantly different: the comparison p-value associated with the
DDM to DME path is 0.012<0.05 while the comparison p-value associated with the IPC to
DDM path is 0.044<0.05. Thus, there is some statistical difference between the paths of
professional and manufacturing; H9 is weakly supported.
4.8 Testing the exogeneity of explanatory variables
Before we proceed to interpret the findings, a potential problem with our research is the
endogeneity of explanatory variables in the research model, which may introduce a serious
bias [66] that makes inferences problematic [67]. To validate our research, a Hausman test is
conducted to show the exogeneity of the explanatory variables and the absence of the
correlation between the explanatory variables and the error terms. This test uses instrumental
variable (IV), which must be (a) strongly correlated with the independent variable and (b)
independent of the error terms [68]. Three IVs are identified. The first IV is identifying
problems and opportunities, which could result in the use of BA but is unlikely to lead to a
data-driven environment (DDE) directly as the latter refers to the organisational strategy,
structure, and business processes that are specifically developed to support and enable BA
applications. A correlation analysis confirms that this IV is related to BA (p< 0.05, 2-tailed)
but not to DDE; therefore, identifying problems and opportunities is used as an IV for BA.
The second IV is routing gathering of opinions from clients that is part of BA application,
which helps develop a data-driven environment based on contingency theory as we have
discussed previously in section 2.2. Thus, the second IV is expected to relate to DDE but not

27
to data-driven decision-making (DDM) directly since the latter is defined by a number of
other factors, though it may use the insights gained from routing gathering of opinions from
clients as part of decision input. A correlation analysis confirms that routing gathering of
opinions from clients is related to DDE (p< 0.05, 2-tailed) but not to DDM. Thus, routing
gathering of opinions from clients is used as an IV for DDE. The third IV identified is the use
of predictive analytics that is seen to provide useful input to support DDM but not likely to
directly affect decision-making effectiveness (DME) since the latter is the combined result of
data-driven decision-making and other organisational factors. A correlation analysis
indicates that the use of predictive analytics is related to DDM (p< 0.05, 2-tailed) but not to
DME. Therefore, we use predictive analytics as IV for DDM. However, we are unable to find
suitable IV for information processing capabilities (IPC). Using the three IVs, we attempt to
conduct the Hausman test for each of the following four paths: BA→DDE, BA+DDE→IPC,
DDE+IPC→DDM, and DDM+IPC→DME. The test result listed in Table 15 indicates that
the explanatory variables in our model are not significantly endogenous, except that we are
unable to test the exogeneity of IPC. Thus, the PLS estimation is seen to be acceptable.
Table 15. Hausman test for endogeneity
Path Instrumental variable Hausman statistics Df p-value
BA→DDE identifying problems and
opportunities (for BA) 2.8939 2 0.2353
BA+DDE→IPC
identifying problems and
opportunities (for BA) &
routing gathering of opinions
from clients (for DDE)
0.3243 3 0.9554
DDE+IPC→DDM routing gathering of opinions
from clients (for DDE) 0.3732 3 0.9457
DDM+IPC→DME the use of predictive analytics
(for DDM) 2.2683 3 0.5186
5 DISCUSSION AND CONCLUSION

28
The motivation of this study is to develop an understanding of the mechanisms through which
BA improves decision-making effectiveness. While BA has recently re-emerged as an
important area of study [3, 4]; little is known about BA’s impact on organisational decision-
making as little academic research has been conducted to date [5, 13].
This study has based on prior BA literature, the information processing view and
contingency theory to develop a path model to conceptualise and examine relevant concepts
pertaining to BA and its impact on decision-making effectiveness. In the process of
enhancing understanding of these concepts and their relationships, we believe our research
offers original insights into how BA improves decision-making effectiveness.
First, we contribute to the literature on BA by developing an understanding of the
mechanisms through which BA improves decision-making effectiveness. Although the
importance of developing a data-driven environment and the potential of using BA to create
business value have been indicated by prior studies [8, 9, 20], there is little conceptual
understanding and empirical evidences to validate these assertions. This research advances
our knowledge by developing a conceptual understanding underpinned by relevant theories
and providing empirical evidence. By conceptualising the links between BA and decision-
making effectiveness, our research directs attention to the complex interdependences between
different organisational factors and the processes underlying BA applications. We have also
provided empirical evidence to support the conceptualisation. The research findings show
that BA has a positive effect on information processing capabilities directly and indirectly
through the mediation of a data-driven environment. Then information processing capabilities
will have a positive effect on data-driven decision-making, which positively improve
decision-making effectiveness. On the one hand, this finding confirms the suggestions made
in prior studies [8, 9, 20] that BA positively enhances information processing capabilities. On
the other hand and more importantly, the findings show that, in addition to a direct effect, BA

29
positively influences data-driven environment. By explicating such mechanisms, our research
suggests that applying BA requires an organisation to have a data-driven environment
simultaneously to support and enable BA activities; otherwise, BA applications are likely to
be unproductive. We hope that our conceptualisation of the relationships between BA and
other organisational factors will inspire others to conduct more research so that a deeper
understanding of the domain can be developed.
Second, we add to the on-going debate surrounding the proposition that IT can be an
important determinant of organisational factors underpinned by contingency theory [e.g., 32,
34]. Our empirical evidence suggests that facing the challenges of big data, increasing
competition, and technological advancement, BA applications and their benefits will help
organisations to realise that it is advantageous to develop appropriate strategy, structure and
processes to guide and enable BA activities. Thus, an important implication of our study is
the need to conduct more research on how BA helps develop a data-driven environment in an
organisation thereby to better support its decision-making.
Third, we contribute to the information processing view by providing empirical
evidence to support the key idea that an organisation needs to design its structure [17] and
business processes [18] to improving its information processing capabilities thereby to
improve its decision-making [16]. Our research through the concept of a data-driven
environment and empirical evidence suggests that when an organisation has developed
specific strategy, policy, structure, and processes to enable BA activities, its information
processing capabilities can be enhanced to improve its decision-making. Therefore, in
addition to the idea that BA is an important factor for the development of a data-driven
environment underpinned by contingency theory, our research drawing on the information
processing view further supports that creating a data-driven environment in an organisation
will help improve the organisation’s information processing capabilities and ultimately its

30
decision-making effectiveness. Consequently, this research underpinned by both contingency
theory and the information processing view enhances our understanding of the mechanisms
of BA’s impact on decision-making.
Fourth, we provide useful insights into whether company size and industry type
moderate the paths from BA to decision-making effectiveness. Our findings indicate that
large and medium companies use BA similarly to support decision-making. This is not
actually in conflict with [40, 41] since we have not included small business that are expected
to behave differently regarding IT use, compared with large companies. However, our
findings indicate that there are some differences across industries regarding BA applications.
While our methodology does not allow us to provide an in-depth explanation of this finding,
it provides empirical evidence in the context of BA to weakly support the moderating effect
of industry type [47, 48]. This tentative result calls for more research to develop a deeper
understanding of how different industries use BA.
Our research findings also provide important implications for BA practitioners. The
findings suggest that in an organisation BA is an important determinant of a data-driven
environment, which is the necessary condition for effective BA applications and decision-
making. Thus, BA must be implemented in tandem with developing a data-driven
environment to realise its potential. A data-driven environment would enhance BA’s impact
on the organisation’s information processing capabilities, which in turn, influence data-driven
decision-making and decision-making effectiveness. Therefore, companies should focus on
developing information processing capabilities with BA applications in a data-driven
organisational environment.
The study has several limitations. First, although we have followed the four decision
rules [56] to develop formative constructs to avoid misspecifications, we are unable to assess
the convergent validity of the formative constructs to evaluate whether the entire domain of

31
each formative construct has been covered by the selected indictors because the research
design does not include additional reflective items or “shadow” reflective constructs that
capture the essences of all five formative constructs. Second, our sample does not include
small enterprises with less than 50 employees. Thus, our findings are not applicable to small
enterprises. Third, we have used perceived measures to understand the key variables in this
research while quantitative measures based on specific decisions may complement the
perceived measures. Finally, we have not tested the exogeneity of information processing
capabilities since we are unable to find suitable instrumental variable for this constructs.
Despite these limitations, however, we believe our study offers opportunities for future
research. First, the understanding of BA and its impact could be further advanced by
conducting more context-specific (such as a particular industry) investigations, thereby help
companies to make better decisions about their investment. A second area for future research
is to understand the status of BA applications and its impact on decision-making in small
businesses. Third, factors such as top management team, organisational structure, and
business environment may have a significant effect on shaping the outcomes of strategic
decisions and thus should be examined in future BA research. Finally, in order for researchers
to have more confidence in drawing conclusions from research, future empirical IT research
should begin to address the issue of endogeneity as it could lead to biased and inconsistent
estimators thereby to limit the validity of research models.
REFERENCES
[1] T. H. Davenport and J. G. Harris, Competing on Analytics: The New Science of Winning. Boston,
MA: Harvard Business School Review Press, 2007.
[2] T. H. Davenport, "Analytics 3.0," Harvard Business Review, vol. 91, pp. 64-72, 2013.
[3] H. Chen, R. H. L. Chiang, and V. C. Storey, "Business intelligence and analytics: from big data to
big impact," MIS Quarterly, vol. 36, pp. 1165-1188, 2012.
[4] H. J. Watson, "Tutorial: Big Data Analytics: Concepts, Technologies, and Applications,"
Communications of the Association for Information Systems, vol. 34, pp. 1247-1268, 2014.
[5] C. Holsapple, A. Lee-Post, and R. Pakath, "A unified foundation for business analytics," Decision
Support Systems, 2014.
[6] T. H. Davenport, "Competing on analytics," Harvard Business Review, vol. 84, pp. 98-107, 2006.

32
[7] T. H. Davenport, J. G. Harris, D. W. De Long, and A. L. Jacobson, "Data to Knowledge to Results:
Building an analytic capability," California Management Review, vol. 43, pp. 117-138, 2001.
[8] D. Kiron, P. K. Prentice, and R. B. Ferguson, "Innovating With Analytics. (cover story)," MIT
Sloan Management Review, vol. 54, pp. 47-52, 2012.
[9] S. Lavalle, E. Lesser, R. Shockley, M. S. Hopkins, and N. Kruschwitz, "Special Report: Analytics
and the New Path to Value," MIT Sloan Management Review, vol. 52, pp. 22-32, 2011.
[10] D. Kiron, P. K. Prentice, and R. B. Ferguson, "Raising the Bar With Analytics," MIT Sloan
Management Review, vol. 55, pp. 29-33, 2014.
[11] D. Barton and D. Court, "Making Advanced Analytics Work For You," Harvard Business
Review, vol. 90, pp. 78-83, 2012.
[12] K. Gillon, S. Aral, L. Ching-Yung, S. Mithas, and M. Zozulia, "Business Analytics: Radical Shift
or Incremental Change?," Communications of the Association for Information Systems, vol. 34, pp.
287-296, 2014.
[13] G. George, M. R. Haas, and A. Pentland, "Big data and management," Academy of Management
Journal, vol. 57, pp. 321-326, 2014.
[14] D. A. Marchand and J. Peppard, "Why IT Fumbles Analytics," Harvard Business Review, vol. 91,
pp. 104-112, 2013.
[15] K. M. Eisenhardt and M. J. Zbaracki, "Strategic Decision Making," Strategic Management
Journal, vol. 13, pp. 17-37, 1992.
[16] J. R. Galbraith, "Organization design: an information processing view," Interfaces, vol. 4, pp. 28-
36, 1974.
[17] M. L. Tushman and D. A. Nadler, "Information Processing as an Integrating Concept in
Organizational Design," Academy of Management Review, vol. 3, pp. 613-624, 1978.
[18] G. Premkumar, K. Ramamurthy, and C. S. Saunders, "Information Processing View of
Organizations: An Exploratory Examination of Fit in the Context of Interorganizational
Relationships," Journal of Management Information Systems, vol. 22, pp. 257-294, 2005.
[19] E. T. Wang, J. C. F. Tai, and V. Grover, "Examining the relational benefits of improved interfirm
information processing capability in buyer-supplier dyads," MIS Quarterly, vol. 37, pp. 149-173,
2013.
[20] D. Kiron and R. Shockley, "Creating Business Value Analytics," MIT Sloan Management Review,
vol. 53, pp. 57-63, 2011.
[21] S. Lavalle, E. Lesser, R. Shockley, M. S. Hopkins, and N. Kruschwitz, "Big Data, Analytics and
the Path from Insights to Value," MIT Sloan Management Review, vol. 52, pp. 21-31, 2011.
[22] F. Acito and V. Khatri, "Business analytics: Why now and what next?," Business Horizons
(2014), , vol. 57, pp. 565-570, 2014.
[23] N. Rajagopalan, A. M. A. Rasheed, and D. K. Datta, "Strategic Decision Processes: Critical
Review and Future Directions," Journal of Management, vol. 19, p. 349, 1993.
[24] D. A. Nadler and M. L. Tushman, "A Model for Diagnosing Organizational Behavior,"
Organizational Dynamics, vol. 9, pp. 35-51, 1980.
[25] H. L. Tosi and J. W. Slocum, "Contingency Theory: Some Suggested Directions," Journal of
Management, vol. 10, pp. 9-26, 1984.
[26] Y. Chan, E. and B. H. Reich, "IT alignment: what have we learned?," Journal of Information
Technology, vol. 22, pp. 297-315, 2007.
[27] P. Weill and M. H. Olson, "An Assessment of the Contingency Theory of Management
Information Systems," Journal of Management Information Systems, vol. 6, pp. 59-85, 1989.
[28] J. Peppard and J. Ward, "Beyond strategic information systems: towards an IS capability," The
Journal of Strategic Information Systems, vol. 13, pp. 167-194, 2004.
[29] J.-H. Lim, T. C. Stratopoulos, and T. S. Wirjanto, "Path Dependence of Dynamic Information
Technology Capability: An Empirical Investigation," Journal of Management Information Systems,
vol. 28, pp. 45-84, 2011.
[30] A. S. Bharadwaj, "A resource-based perspective on information technology capability and firm
performance: an empirical investigation," MIS Quarterly, vol. 24, pp. 169-196, 2000.
[31] M. Jelinek, "Technology, Organizations, and Contingency," Academy of Management Review,
vol. 2, pp. 17-26, 1977.
[32] J. Woodward, Management and Technology. London, UK.: H. M. S. O, 1958

33
[33] J. D. Thompson and F. L. Bates, "Technology, Organization, and Administration,"
Administrative Science Quarterly, vol. 2, pp. 325-343, 1957.
[34] C. Perrow, "A Framework for the Comparative Analysis of Organizations," American
Sociological Review, vol. 32, pp. 194-208, 1967.
[35] E. Sadler-Smith, "Cognitive Style and the Management of Small and Medium-Sized
Enterprises," Organization Studies, vol. 25, pp. 155-181, 2004.
[36] S. B. Rodrigues and D. J. Hickson, "Success in decision making: different organizations,
differing reasons for success," Journal of Management Studies, vol. 32, pp. 655-678, 1995.
[37] J. W. Dean Jr and M. P. Sharfman, "Does decision process matter? A study of strategic decision-
making effectiveness," Academy of Management Journal, vol. 39, pp. 368-396, 1996.
[38] G. C. Mueller, M. A. Mone, and V. L. Barker Ill, "Formal Strategic Analyses and Organizational
Performance: Decomposing the Rational Model," Organization Studies, vol. 28, pp. 853-883, 2007.
[39] I. Kun Shin, V. Grover, and J. T. C. Teng, "Do Large Firms Become Smaller by Using
Information Technology?," Information Systems Research, vol. 24, pp. 470-491, 2013.
[40] W. H. Delone, "Firm Size and the Characteristics of Computer Use," Mis Quarterly, vol. 5, pp.
65-77, 1981.
[41] S. E. Harris and J. L. Katz, "Firm Size and the Information Technology Investment Intensity of
Life Insurers," Mis Quarterly, vol. 15, pp. 333-352, 1991.
[42] J. Jayaram, S. L. Ahire, and P. Dreyfus, "Contingency relationships of firm size, TQM duration,
unionization, and industry context on TQM implementation—A focus on total effects," Journal of
Operations Management, vol. 28, pp. 345-356, 2010.
[43] P. M. Swamidass and S. Kotha, "Explaining manufacturing technology use, firm size and
performance using a multidimensional view of technology," Journal of Operations Management,
vol. 17, pp. 23-37, 1998.
[44] J. Lee, "Does Size Matter in Firm Performance? Evidence from US Public Firms," International
Journal of the Economics of Business, vol. 16, pp. 189-203, 2009.
[45] L.-S. Lin, I.-C. Huang, P.-L. Du, and T.-F. Lin, "Human capital disclosure and organizational
performanceThe moderating effects of knowledge intensity and organizational size," Management
Decision, vol. 50, pp. 1790-1799, 2012.
[46] P. Neirotti and E. Paolucci, "Assessing the importance of industry in the adoption and
assimilation of IT: Evidence from Italian enterprises," Information & Management, vol. 48, pp.
249-259, 2011.
[47] S. B. Banerjee, E. S. Iyer, and R. K. Kashyap, "Corporate Environmentalism: Antecedents and
Influence of Industry Type," Journal of Marketing, vol. 67, pp. 106-122, 2003.
[48] L. Y. M. Sin, A. C. B. Tse, O. H. M. Yau, R. P. M. Chow, and J. S. Y. Lee, "Market Orientation,
Relationship Marketing Orientation, and Business Performance: The Moderating Effects of
Economic Ideology and Industry Type," Journal of International Marketing, vol. 13, pp. 36-57,
2005.
[49] D. Gefen, E. E. Rigdon, and D. Straub, "An Update and Extension to SEM Guidelines for
Administrative and Social Science Research," MIS Quarterly, vol. 35, pp. iii-A7, 2011.
[50] J. F. Hair, C. M. Ringle, and M. Sarstedt, "Partial Least Squares Structural Equation Modeling:
Rigorous Applications, Better Results and Higher Acceptance," in Long Range Planning vol. 46,
ed, 2013, pp. 1-12.
[51] M. Wetzels, G. Odekerken-Schröder, and C. van Oppen, "Using PLS path modeling for assessing
hierarchical construct models: guidelines and empirical illustration," MIS Quarterly, vol. 33, pp.
177-195, 2009.
[52] W. W. Chin and P. R. Newsted, "Structural Equation Modeling analysis with Small Samples
Using Partial Least Squares," in Statistical Strategies for Small Sample Research, R. Hoyle, Ed.,
ed Thousand Oaks, CA: Sage Publications, 1999, pp. 307-341.
[53] C. Fornell, "A Second Generation of Multivariate Analysis: Classification of Methods and
Implications for Marketing Research," in Review of Marketing, M. Huston, Ed., ed Chicago:
American Marketing Association, 1987.
[54] J. F. Hair, G. Hult, C. Ringle, and M. Sarstedt, A Primer on Partial Least Squares Structural
Equation Modeling (PLS-SEM): Sage, 2014.

34
[55] S. B. MacKenzie, P. M. Podsakoff, and N. P. Podsakoff, "Construct measurement and validation
procedures in MIS and behavioral research: Integrating new and existing techniques," Mis
Quarterly, vol. 35, pp. 293-A5, 2011.
[56] S. Petter, D. Straub, and A. Rai, "Specifying formative constructs in information systems
research," Mis Quarterly, vol. 31, pp. 623-656, 2007.
[57] R. P. Bagozzi, Y. Youjae, and L. W. Phillips, "Assessing Construct Validity in Organizational
Research," Administrative Science Quarterly, vol. 36, pp. 421-458, 1991.
[58] L. W. Phillips and R. P. Bagozzi, "On measuring organizational properties of distribution
channels: methodological issues in the use of key informants," Research in Marketing, vol. 8, p.
313, 1986.
[59] N. K. Malhotra, A. Patil, and S. S. Kim, "BIAS Breakdown," Marketing Research, vol. 19, pp.
24-29, 2007.
[60] P. M. Podsakoff, S. B. MacKenzie, J.-Y. Lee, and N. P. Podsakoff, "Common method biases in
behavioral research: A critical review of the literature and recommended remedies," Journal of
Applied Psychology, vol. 88, pp. 879-903, 2003.
[61] J. S. Armstrong and T. S. Overton, "Estimating Nonresponse Bias in Mail Surveys," Journal of
Marketing Research (JMR), vol. 14, pp. 396-402, 1977.
[62] J. F. Hair, W. C. Black, B. J. Babin, and R. E. Anderson, Multivariate Data Analysis, 7th ed.:
Prentice Hall Higher Education, 2010.
[63] V. M. Papadakis, S. Lioukas, and D. Chambers, "Strategic decision-making processes: The role
of management and context," Strategic Management Journal, vol. 19, p. 115, 1998.
[64] R. M. Baron and D. A. Kenny, "The Moderator-Mediator Variable Distinction in Social
Psychological Research – Conceptual, Strategic, and Statistical Considerations," Journal of
Personality and Social Psychology, vol. 5, pp. 1173–1182, 1986.
[65] P. E. Shrout and N. Bolger, "Mediation in experimental and nonexperimental studies: New
procedures and recommendations," Psychological Methods, vol. 7, pp. 422-445, 2002.
[66] C. N. Mclntosh, J. R. Edwards, and J. Antonakis, "Reflections on Partial Least Squares Path
Modeling," Organizational Research Methods, vol. 12, pp. 210-251, 2014.
[67] R. H. Chenhall and F. Moers, "The Issue of Endogeneity within Theory-Based, Quantitative
Management Accounting Research," European Accounting Review, vol. 16, pp. 173-195, 2007.
[68] C. N. McIntosh, J. R. Edwards, and J. Antonakis, "Reflections on Partial Least Squares Path
Modeling," Organizational Research Methods, vol. 17, pp. 210-251, 2014.

35
Managerial relevance statement
Business analytics is being increasingly used to gain data-driven insights to support decision-
making; however, extant literature indicates that many companies are still struggling to
figure out how to use business analytics. Some of them are unsure how to proceed, while
others are struggling to achieve a worthwhile return. The findings of this paper could provide
valuable insights into how an organisation should use business analytics to improve its
decision-making effectively. The findings of this paper show that a data-driven environment
in an organisation is the core-facilitating factor for the application of business analytics and
effective decision-making. In order to realise the potential of business analytics, an
organisation must develop explicit organisational strategy and policy to guide analytic
activities, and design its organisational structure and business processes to enable and
facilitate data-driven decision-making. Our research findings suggest that a data-driven
environment would enhance the impact of business analytics on the organisation’s
information processing capabilities, which in turn influence data-driven decision-making and
decision-making effectiveness. Therefore, in order to realise the potentials of business
analytics, companies should implement business analytics by developing an internal data-
driven environment.

36
Biosketchs and photos
Guangming Cao received both the BSc. degree in airplane design from the
Airplane Department and the MSc. in management and system engineering
from the Manufacturing Engineering Department, Northwestern
Polytechnical University, Xi’an, China; and the Ph.D. degree in systems
thinking and managing organisational change from the University of Luton,
UK. He previously held lecturing positions at the Northwestern
Polytechnical University in China and at the University of Ulster in UK. He
is currently a Principal Lecturer at the University of Bedfordshire in UK.
His research interests include business analytics, strategic IT alignment, IT
business value, and systems thinking. His research has appeared in International Journal of
Management Review, Supply Chain Management, Systemic Practice and Action Research,
Strategic Change, and Systems Research and Behavioral Science.
Yanqing Duan, PhD, is a Professor of Information Systems, Director of
Business and Information Systems Research Centre (BISC) at the
University of Bedfordshire, and a Visiting Professor of China Agricultural
University. She received her BSc in Mechanical Engineering and MSs in
Systems Engineering from China Agricultural University, and PhD from
Aston Business School, Aston University in the UK. Her principal
research interest is the use of the emerging Information and
Communication Technologies (ICT) in organisations and their impact on
decision making, innovation, and knowledge management. This research focus is reflected in
the context of ICT-based knowledge management and transfer, use of intelligent systems and
Big Data Analytics in supporting decision making and innovation, and Small to Medium
Sized Enterprises’ (SMEs) adoption of digital business. She has co-ordinated many research
projects funded by various funding bodies, mainly the European Commission. She published
over 160 referred articles, including papers in European Journal of Information Systems,
Information & Management, European Journal of Marketing, Expert Systems with
Applications, Information Technology & People, etc.
Gendao Li received the B.S. degree in information management and
systems, in 2004, and the Ph.D. degree in management science and
engineering from Chongqing University, China.
He is currently a Senior Research Fellow at the University of
Bedfordshire Business School. His current research interests include how
to use big data analytics to improve company performance, including
understanding the impact path from big data analytics to business
performance, understanding consumer purchase behavior and optimizing
pricing decisions. His work has been published in journals like European
Journal of Operational Research, International Journal of Production Economics, Journal of
the Operational Research Society, International Journal of Production Research.
Related Documents