© Information Systems Lab - 2013 http://islab.uom.gr Linked Open Government Data Analytics Evangelos Kalampokis, Efthimios Tambouris, Konstantinos Tarabanis

Welcome message from author
This document is posted to help you gain knowledge. Please leave a comment to let me know what you think about it! Share it to your friends and learn new things together.
Transcript

© Information Systems Lab - 2013
http://islab.uom.gr
Linked Open Government Data Analytics
Evangelos Kalampokis, Efthimios Tambouris,
Konstantinos Tarabanis

© Information Systems Lab, University of Macedonia
Aim of the paper
Introduce the concept of Data Analytics on top of
distributed statistical linked OGD
Describe the technical prerequisites
Demonstrate the end-user value

© Information Systems Lab, University of Macedonia
Open Government Data
More than 180 Open Government Data portals around the globe
provide data that “can be freely used, reused and redistributed by
anyone”
© Information Systems Lab, University of Macedonia
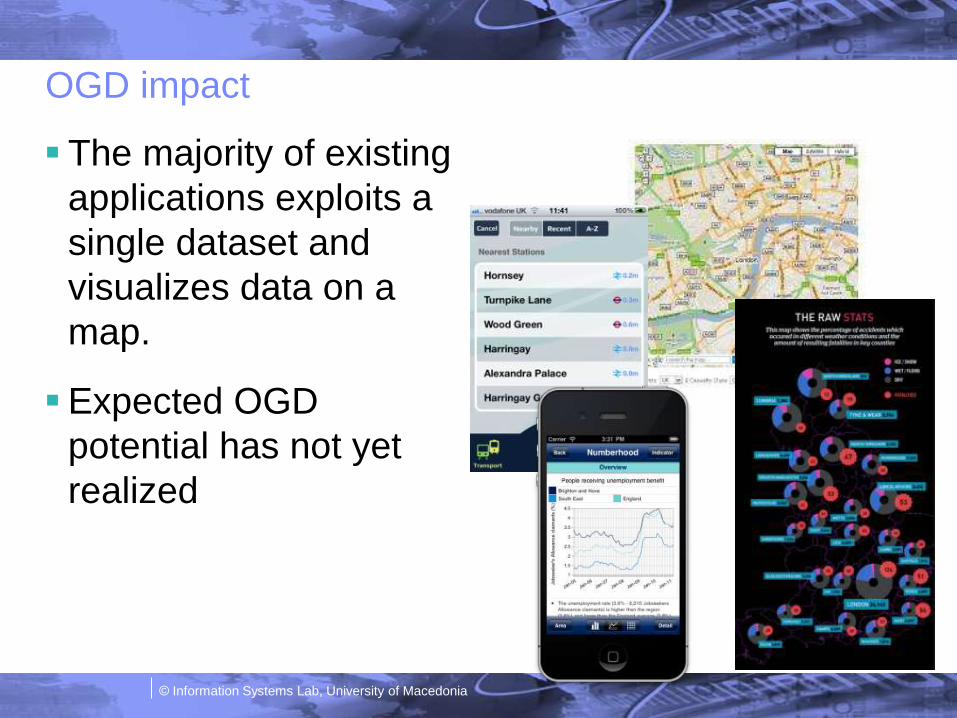
OGD impact
The majority of existing
applications exploits a
single dataset and
visualizes data on a
map.
Expected OGD
potential has not yet
realized

© Information Systems Lab, University of Macedonia
Importance of Data in modern societies
Business Intelligence
Evidence based policy-making
Academia

© Information Systems Lab, University of Macedonia
Open Statistical Data
A big portion of Open Government Data concerns statistics such as
population figures, economic and social indicators
For example, the majority (5867 out of 6098 datasets) of the data
published on the EU Open Data Portal are of statistical nature

© Information Systems Lab, University of Macedonia
But…although OGD enables free access to everyone, data is often
isolated (e.g. due to the available formats)
Data Silos
http://www.flickr.com/photos/rachelrusinski/526260022

© Information Systems Lab, University of Macedonia
Vision: Linked Open Government Data Analytics
Combining statistical OGD that were previously closed in disparate
sources
Performing data analytics on top of combined data
Gaining unexpected and unexplored insights into different domains
and problem areas.

© Information Systems Lab, University of Macedonia
Combining Statistical Data
Requires effort to:
– Discover data (e.g. datasets sharing common joint points and thus allow
for further analysis)
– Collect data
– Clean data (timely, accurate, relevant data)
– Transform data (common formats)
– Integrate data (interoperability, levels of granularity etc.)
– Visualize and statistically analyze (semi-automatic according to the type
of variables and measures)
We need to shift this effort from end-users to data-providers
http://www.flickr.com/photos/tetsumo/3586864217

© Information Systems Lab, University of Macedonia
Connecting Data Silos
We need an infrastructure that will enable connecting data silos over
the Web and thus reducing the effort required for statistical data reuse
This is where Linked Data comes in…
http://www.flickr.com/photos/sethwoodworth/2303531107

© Information Systems Lab, University of Macedonia
Linked Data
Items in a dataset are identified using URIs
URIs are dereferenceable using HTTP
RDF links to other URIs in other datasets are included

© Information Systems Lab, University of Macedonia
Technical Prerequisites
Metadata for data discovery
Vocabularies
Code lists, concept schemes and classifications
Typed links (e.g. olws:sameAs) between
– Dimensions definitions
– Values of dimensions
– Categories of measures
© Information Systems Lab, University of Macedonia
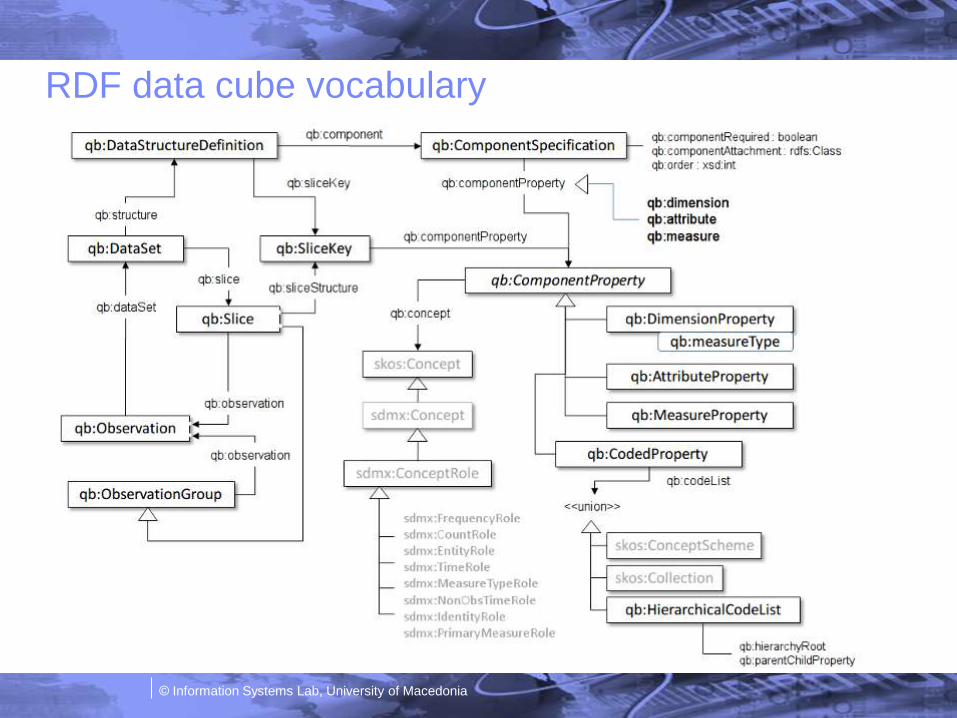
RDF data cube vocabulary

© Information Systems Lab, University of Macedonia
The UK Elections Case
Objective:
– To gain insights regarding UK elections through OGD
Starting point:
– Data regarding the results of two UK general elections from 2005 and
2010 – in both national and constituency level (Open Data in Guardian)
OGD:
– We need to discover data that could be analyzed together with the
election results data (i.e. that share common joint points)

© Information Systems Lab, University of Macedonia
OGD
Source:
– Data from data.gov.uk
Datasets:
– Unemployment and poverty between 2005-2010 in the UK parliament
constituencies
– In this paper we concentrate on unemployment due to space limitations
© Information Systems Lab, University of Macedonia
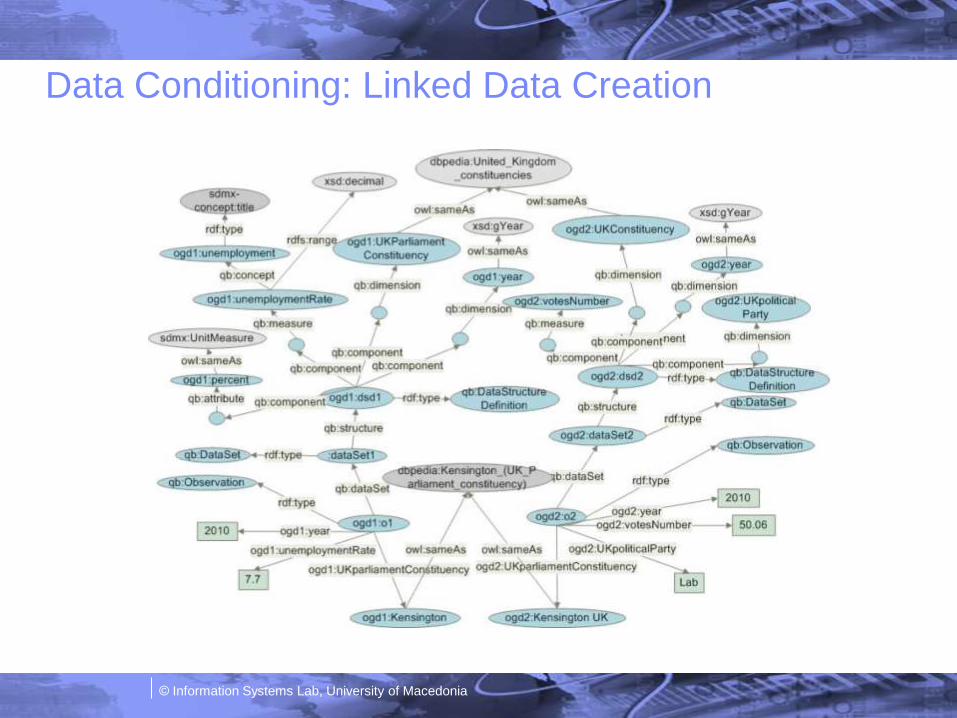
Data Conditioning: Linked Data Creation

© Information Systems Lab, University of Macedonia
Linked Data Analytics
Enables the semi-automatic visualization and performance of
statistical analyses based on :
– Joint points (i.e. variables that are described at a parliament constituency
level)
– Type of variables (e.g. Regression in the case of continuous and
classification in the case of categorical)

© Information Systems Lab, University of Macedonia
Logistic regression Classification Analysis
Measures the relationship between a categorical dependent variable
and one or more continuous independent variables by converting the
dependent variable to probability scores through the logistic function
Identify the relationship of unemployment rate of a parliament
constituency and the probability P(A) a particular political party to win
the elections in the constituency
P(A) 1
1 ey
y c0 c1x1 ...cnxn

© Information Systems Lab, University of Macedonia
Visualization Unemployment & Labours Results (2005)
The probability for the
Labour Party to win in a
constituency increases as
the unemployment rate of
the constituency increases
In constituencies with
unemployment rate > 5%
the Labour Party has
strong probability to win
In 2005 the average
unemployment rate was
3.35%

© Information Systems Lab, University of Macedonia
Visualization Unemployment & Labours Results (2010)
The pattern is the same
but was moved to the right.
The average
unemployment rate was
3.35% in 2005 and 7.5% in
2010
© Information Systems Lab, University of Macedonia
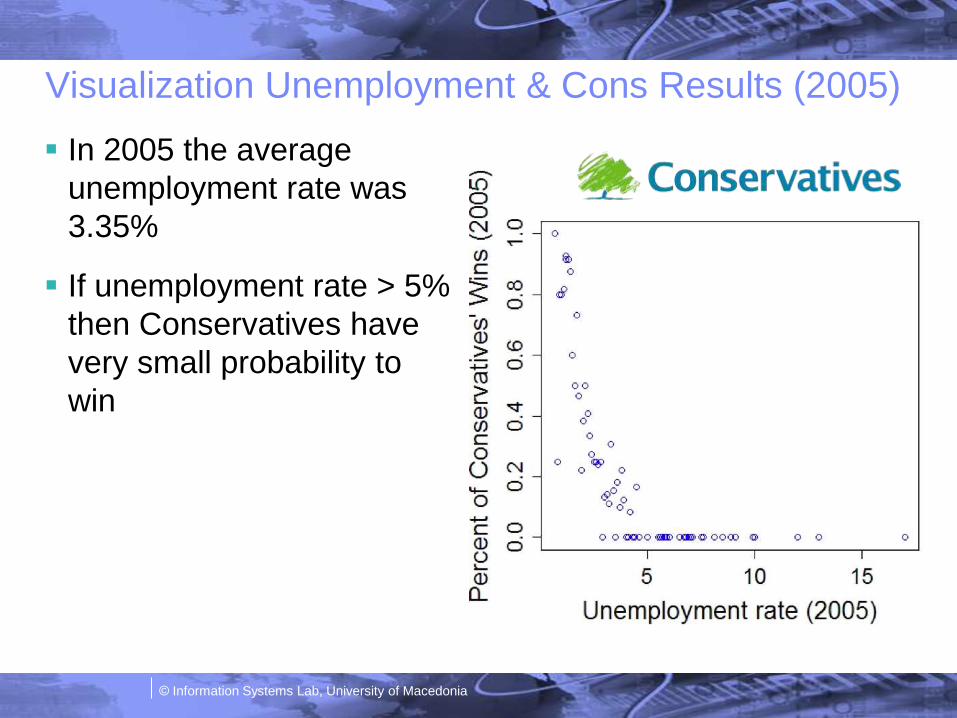
Visualization Unemployment & Cons Results (2005)
In 2005 the average
unemployment rate was
3.35%
If unemployment rate > 5%
then Conservatives have
very small probability to
win

© Information Systems Lab, University of Macedonia
Visualization Unemployment & Cons Results (2010)
In 2010 Conservatives do
not win in constituencies
with unemployment rate
>13%
However the average
unemployment rate
increased from 3.5% to
7.5%
The logistic regression
pattern is the same

© Information Systems Lab, University of Macedonia
Statistical model creation
Logistic function that measures the probability P(A) for a party to win in
a specific parliament constituency
For example, consider the Labour Party in the 2010 elections
x is the unemployment rate of the constituency.
In a constituency with 12% unemployment rate the probability for the
Labour Party to win is P(A)=0.8
P(A) 1
1 ey
y 3.823 0.437 x
© Information Systems Lab, University of Macedonia
Conclusion and Future Work
Significant efforts for developing tools and applications facilitating
Open Government Data (OGD) publishing and reuse
OGD has not yet realized the full potential.
Today, data analytics employ data closed in isolated systems
We claim that the real value of OGD will emerge from performing Data
Analytics on top of combined statistical datasets
Linked Open Government Data Analytics show the road ahead
Future work includes development of a platform enabling semi-
automatic identification of important relations between variables
described in distributed datasets

© Information Systems Lab, University of Macedonia
Acknowledgments
The work presented in the paper is partly funded by
Related Documents