UNCORRECTED PROOF ARTICLE Linkage and association analysis of CACNG3 in childhood absence epilepsy Kate V Everett* ,1,21 , Barry Chioza 1, , Jean Aicardi 2 , Harald Aschauer 3 , Oebele Brouwer 4 , Petra Callenbach 4 , Athanasios Covanis 5 , Olivier Dulac 6 , Orvar Eeg-Olofsson 7 , Martha Feucht 8 , Mogens Friis 9 , Franc ¸oise Goutieres 10 , Renzo Guerrini 11 , Armin Heils 12 , Marianne Kjeldsen 13 , Anna-Elina Lehesjoki 14 , Andrew Makoff 15 , Rima Nabbout 6 , Ingrid Olsson 16 , Thomas Sander 17,18 , Auli Sire ´n 19 , Paul McKeigue 20 , Robert Robinson 1,22 , Nichole Taske 1,23 , Michele Rees 1 and Mark Gardiner 1 1 Department of Paediatrics and Child Health, Royal Free and University College Medical School, University College London, London, UK; 2 Hoˆpital Robert Debre´, ParisCedex,France; 3 Department of General Psychiatry, Medical University Vienna, Vienna, Austria; 4 University Medical Centre Groningen, University of Groningen, Groningen, The Netherlands; 5 Neurology Department, The Children’s Hospital ‘Agia Sophia’, Athens, Greece; 6 Neuropaediatrics Department, Hoˆpital Necker Enfant Malades, Paris, France; 7 Department of Women’s and Children’s Health/ Neuropaediatrics, Uppsala University, Uppsala, Sweden; 8 Department of Paediatrics, Medical University Vienna, Vienna, Austria; 9 Department of Neurology, Sygehus Vestsjaelland, Holbaek, Denmark; 10 No institutional affiliation; 11 Division of Child Neurology and Psychiatry, University of Pisa, Pisa, Italy; 12 Clinic of Epileptology and Institute of Human Genetics, Rheinische Friedrich-Wilhelms-University of Bonn, Bonn, Germany; 13 Department of Neurology (Epilepsy Clinic), Odense University Hospital, Denmark; 14 Neuroscience Center and Folkha¨lsan Institute of Genetics, University of Helsinki, Helsinki, Finland; 15 Kings College London, Department of Psychological Medicine, Institute of Psychiatry, London, UK; 16 Neuropaediatric Unit, Queen Silvia Children’s Hospital, Go¨teborg, Sweden; 17 Gene Mapping Center (GMC), Max-Delbru¨ck-Centrum, Berlin, Germany; 18 Epilepsy Genetics Group, Department of Neurology, Charite´University Medicine, Humboldt University of Berlin, Berlin, Germany; 19 Department of Paediatrics, Tampere University Hospital, Tampere, Finland; 20 London School of Hygiene & Tropical Medicine, London, UK Childhood absence epilepsy (CAE) is an idiopathic generalised epilepsy characterised by absence seizures manifested by transitory loss of awareness with 2.5–4 Hz spike–wave complexes on ictal EEG. A genetic component to aetiology is established but the mechanism of inheritance and the genes involved are not fully defined. Available evidence suggests that genes encoding brain expressed voltage-gated calcium channels, including CACNG3 on chromosome 16p12–p13.1, may represent susceptibility loci for CAE. The aim of this work was to further evaluate CACNG3 as a susceptibility locus by linkage and association analysis. Assuming locus heterogeneity, a significant HLOD score (HLOD ¼ 3.54, a ¼ 0.62) was obtained for markers encompassing CACNG3 in 65 nuclear families with a proband with CAE. The maximum non- parametric linkage score was 2.87 (Po0.002). Re-sequencing of the coding exons in 59 patients did not identify any putative causal variants. A linkage disequilibrium (LD) map of CACNG3 was constructed using 23 single nucleotide polymorphisms (SNPs). Transmission disequilibrium was sought using individual SNPs and SNP-based haplotypes with the pedigree disequilibrium test in 217 CAE trios and the 65 nuclear Journal: EJHG Disk used Despatch Date: 18/1/2007 Article : npg_ejhg_5201783 Pages: 10 Op: thilakam Ed: suja figs 1-3 in color Gml : Template: Ver 1.1.1 Received 31 August 2006; revised 19 December 2006; accepted 20 December 2006 *Correspondence: Dr KV Everett, Department of Paediatrics and Child Health, Royal Free and University College Medical School, University College London, The Rayne Building, 5 University Street, London, WC1E 6JJ, UK. Tel: þ 44 207 6796124; Fax: þ 44 207 6796103; E-mail: [email protected] 21 These authors contributed equally to the work. 22 Current address: Paediatric Neurology, Great Ormond Street Hospital, London, UK. 23 Current address: National Institute for Health and Clinical Excellence (NICE), London, UK. European Journal of Human Genetics (2007) 0, 000–000 & 2007 Nature Publishing Group All rights reserved 1018-4813/07 $30.00 www.nature.com/ejhg

Welcome message from author
This document is posted to help you gain knowledge. Please leave a comment to let me know what you think about it! Share it to your friends and learn new things together.
Transcript

UNCORRECTED PROOF
ARTICLE
Linkage and association analysis of CACNG3 inchildhood absence epilepsy
Kate V Everett*,1,21, Barry Chioza1,, Jean Aicardi2, Harald Aschauer3, Oebele Brouwer4, PetraCallenbach4, Athanasios Covanis5, Olivier Dulac6, Orvar Eeg-Olofsson7, Martha Feucht8,Mogens Friis9, Francoise Goutieres10, Renzo Guerrini11, Armin Heils12, MarianneKjeldsen13, Anna-Elina Lehesjoki14, Andrew Makoff15, Rima Nabbout6, Ingrid Olsson16,Thomas Sander17,18, Auli Siren19, Paul McKeigue20, Robert Robinson1,22, Nichole Taske1,23,Michele Rees1 and Mark Gardiner1
1Department of Paediatrics and Child Health, Royal Free and University College Medical School, University CollegeLondon, London, UK; 2Hopital Robert Debre, Paris Cedex, France; 3Department of General Psychiatry, MedicalUniversity Vienna, Vienna, Austria; 4University Medical Centre Groningen, University of Groningen, Groningen, TheNetherlands; 5Neurology Department, The Children’s Hospital ‘Agia Sophia’, Athens, Greece; 6NeuropaediatricsDepartment, Hopital Necker Enfant Malades, Paris, France; 7Department of Women’s and Children’s Health/Neuropaediatrics, Uppsala University, Uppsala, Sweden; 8Department of Paediatrics, Medical University Vienna,Vienna, Austria; 9Department of Neurology, Sygehus Vestsjaelland, Holbaek, Denmark; 10No institutional affiliation;11Division of Child Neurology and Psychiatry, University of Pisa, Pisa, Italy; 12Clinic of Epileptology and Institute ofHuman Genetics, Rheinische Friedrich-Wilhelms-University of Bonn, Bonn, Germany; 13Department of Neurology(Epilepsy Clinic), Odense University Hospital, Denmark; 14Neuroscience Center and Folkhalsan Institute of Genetics,University of Helsinki, Helsinki, Finland; 15Kings College London, Department of Psychological Medicine, Institute ofPsychiatry, London, UK; 16Neuropaediatric Unit, Queen Silvia Children’s Hospital, Goteborg, Sweden; 17Gene MappingCenter (GMC), Max-Delbruck-Centrum, Berlin, Germany; 18Epilepsy Genetics Group, Department of Neurology,Charite University Medicine, Humboldt University of Berlin, Berlin, Germany; 19Department of Paediatrics, TampereUniversity Hospital, Tampere, Finland; 20London School of Hygiene & Tropical Medicine, London, UK
Childhood absence epilepsy (CAE) is an idiopathic generalised epilepsy characterised by absence seizuresmanifested by transitory loss of awareness with 2.5–4 Hz spike–wave complexes on ictal EEG. A geneticcomponent to aetiology is established but the mechanism of inheritance and the genes involved are notfully defined. Available evidence suggests that genes encoding brain expressed voltage-gated calciumchannels, including CACNG3 on chromosome 16p12–p13.1, may represent susceptibility loci for CAE. Theaim of this work was to further evaluate CACNG3 as a susceptibility locus by linkage and associationanalysis. Assuming locus heterogeneity, a significant HLOD score (HLOD¼3.54, a¼0.62) was obtained formarkers encompassing CACNG3 in 65 nuclear families with a proband with CAE. The maximum non-parametric linkage score was 2.87 (Po0.002). Re-sequencing of the coding exons in 59 patients did notidentify any putative causal variants. A linkage disequilibrium (LD) map of CACNG3 was constructed using23 single nucleotide polymorphisms (SNPs). Transmission disequilibrium was sought using individual SNPsand SNP-based haplotypes with the pedigree disequilibrium test in 217 CAE trios and the 65 nuclear
Journal: EJHG � Disk used Despatch Date: 18/1/2007Article : npg_ejhg_5201783 Pages: 10 Op: thilakam Ed: suja figs 1-3 in colorGml :
Template: Ver 1.1.1
Received 31 August 2006; revised 19 December 2006; accepted 20 December 2006
*Correspondence: Dr KV Everett, Department of Paediatrics and Child Health, Royal Free and University College Medical School, University College London,
The Rayne Building, 5 University Street, London, WC1E 6JJ, UK. Tel: þ44 207 6796124; Fax: þ44 207 6796103;
E-mail: [email protected] authors contributed equally to the work.22Current address: Paediatric Neurology, Great Ormond Street Hospital, London, UK.23Current address: National Institute for Health and Clinical Excellence (NICE), London, UK.
European Journal of Human Genetics (2007) 0, 000–000& 2007 Nature Publishing Group All rights reserved 1018-4813/07 $30.00
www.nature.com/ejhg

UNCORRECTED PROOF
pedigrees. Evidence for transmission disequilibrium (Pr0.01) was found for SNPs within a B35 kb regionof high LD encompassing the 5’UTR, exon 1 and part of intron 1 of CACNG3. Re-sequencing of this intervalwas undertaken in 24 affected individuals. Seventy-two variants were identified: 45 upstream; two 5’UTR;and 25 intronic SNPs. No coding sequence variants were identified, although four variants are predicted toaffect exonic splicing. This evidence supports CACNG3 as a susceptibility locus in a subset of CAE patients.European Journal of Human Genetics (2007) 0, 000–000. doi:10.1038/sj.ejhg.5201783
Keywords: absence epilepsy; linkage; association; CACNG3; splice variants
IntroductionThe absence epilepsies are a group of idiopathic generalised
epilepsies (IGEs), which vary in their age of onset, seizure
frequency and pattern of evolution. The typical absence
seizure is manifested as a transitory loss of awareness with
2.5–4 Hz spike–wave complexes on ictal EEG. The Inter-
national League Against Epilepsy (ILAE) classification
recognises a number of distinct absence epilepsy syn-
dromes, including childhood absence epilepsy (CAE),
juvenile absence epilepsy (JAE), epilepsy with myoclonic
absences, eyelid myoclonus with absences and juvenile
myoclonic epilepsy.1 However, it is uncertain whether they
represent a ‘biological continuum’ or distinct entities.
There is some evidence that CAE and JAE share a close
genetic relationship, allowing them to be considered as
one phenotype in genetic studies.2,3
Twin studies demonstrate that the IGEs have a signifi-
cant heritability,4 with regards to both occurrence and type
of seizure and syndrome.5 The molecular genetic basis of
CAE in humans is presently unknown, but studies on the
mechanism by which spike–wave seizures are generated,
isolation of genes causing spike–wave seizures in rodents
and initial linkage and association studies in humans have
allowed candidate genes and chromosomal regions to be
identified.
Four mouse models of spike–wave epilepsy are caused by
mutations in genes for different subunits of voltage-gated
calcium channels (VGCCs): tottering tg, Cacna1a;6 lethar-
gic lh, Cacnb4;7 ducky du, Cacna2d28 and stargazer stg,
CACNG2.9 There is some evidence that the g-subunits may
function as transmembrane receptor regulatory proteins
(TARPs),10 involved in trafficking.11
Genome-wide linkage analysis of IGE-multiplex families
has demonstrated evidence for susceptibility loci on
chromosomes 3q26, 14q23 and 2q36.12 Furthermore, loci
for three similar forms of absence epilepsy have been
identified on chromosomes 8q24 (ECA1), 5q31.1 (ECA2)
and 3q26 (ECA3).13 – 16 An association in humans has been
documented between polymorphisms in CACNA1A (chro-
mosome 19p13.2–p13.1) and IGE including CAE.17 Finally,
12 missense mutations in CACNA1H (chromosome
16p13.3) have been found in 14 sporadic Chinese Han
patients with CAE but not in any of 230 unrelated
controls.18 However, Heron et al.19 screened exons 9–11
of CACNA1H (in which 75% of the missense mutations
were found) in 192 patients with IGE or generalised
epilepsy with febrile seizures plus but did not find any of
those identified by Chen et al. Furthermore, we did not
find any of the 12 missense mutations in our resource of
CAE families and trios; nor did we find any evidence for
linkage to the CACNA1H locus.20
Previous analysis of 33 nuclear families with CAE under
the assumption of heterogeneity produced evidence sup-
portive of linkage to the CACNG3 locus on 16p12–p13.1,21
with an HLOD score of 0.55 (a¼0.35) and a non-
parametric linkage (NPL) score of 1.21. Although the
HLOD score did not reach statistical significance, this
may reflect the lack of power in the family resource and
locus heterogeneity. This gene was prioritised for further
analysis, because it had the second most positive HLOD
score, albeit not statistically significant, and because it is a
compelling candidate on biological grounds. The GABA
cluster on chromosome 15q, which had the most positive
HLOD score, has also been investigated further but the
results are not presented here. Those genes with HLOD
scores of zero and without any supportive evidence from
NPL analysis were not pursued in the larger resource.
Available evidence therefore suggests that genes encod-
ing brain expressed VGCCs including CACNG3 may
contribute to the aetiology of CAE. The aim of this work
was to test this hypothesis by linkage analysis using
microsatellite loci spanning CACNG3 in a resource of 65
nuclear families each with a proband with CAE, expanded
from the original resource of 33 families and by association
analysis using 23 single nucleotide polymorphisms (SNPs)
distributed across CACNG3 in the nuclear families and 217
parent-affected child trios.
Materials and methodsSubjects and samples
The 217 trios (affected child and both parents) and 65
nuclear pedigrees (with a total of 145 AE cases, including
25 of the pedigrees originally used by Robinson et al) were
NPG_EJHG_5201783
CACNG3 in absence epilepsyKV Everett et al
2
European Journal of Human Genetics

UNCORRECTED PROOF
all of Caucasian origin and ascertained from European
populations, including the UK, France, Germany, Austria,
the Netherlands, Denmark, Sweden, Finland and Italy.
Clinical data on subjects categorised as affected are
provided in the Supplementary Data. Appropriate in-
formed consent was obtained from all participants.
Diagnostic criteria based on the ILAE classification of
absence epilepsies were applied as described in the
Supplementary Data.1
Genomic DNA was extracted from whole blood or cheek
swab samples according to standard protocols.
Linkage analysis
Linkage analysis was performed using three fluorescently-
labelled microsatellite markers: D16S420, situated 5’ of the
gene; URB036 in the gene; a novel marker, UCL1032122
situated 3’ of the gene (chromosome 16: 24416648–
24416860). They span a genetic distance of 0.83 cM and a
physical distance of 273 Kb (Figure 1). This is a smaller
distance than originally tested for linkage by Robinson
et al. because we are specifically targeting CACNG3,
whereas markers to include CACNA1H as well were
previously used.
Genotyping was performed on the ABI 373 Sequence
Analyser using the Genescans and Genotypers software.
All pedigrees were checked for Mendelian inheritance
using the PedCheck program.23 Any pedigrees that failed
this test were re-genotyped. Multipoint linkage analysis
was performed using GeneHunter 2.1.24 Parametric analy-
sis was performed under the assumption of autosomal
dominant inheritance with a penetrance of 50%. A disease
allele frequency of 0.01 and a phenocopy rate of 0.0001
were assumed. These values are compatible with the
observed population prevalence and sibling recurrence risk
ratio attributable to the locus, based on the original
calculations of Risch.25 HLOD scores as well as an estimate
of a, which represents the proportion of pedigrees
consistent with linkage at a specific locus, were calculated.
The NPL statistic, along with the corresponding degree of
significance, was also calculated by GeneHunter. The NPL
statistic assesses the degree of allele-sharing in affected
individuals only and is valuable as it is a ‘model-free’ form
of analysis thus bypassing the inherent problems of a
parametric analysis such as misspecification of parameters.
Re-sequencing of coding exons
Bi-directional re-sequencing of the coding exons (chromo-
some 16: 24174862–24175823; 24265106–24266056;
24273263–24274226 and 24279814–24281595) was un-
dertaken in 59 cases taken from the 65 nuclear pedigrees.
This re-sequencing was performed in conjunction with
ABC at Imperial College, London, using standard Sanger
dideoxy protocols.
SNP analysis
Genomic DNA was typed for 23 SNPs by KBiosciences using
both the Amplifluort and Taqmant chemistries. SNPs
were chosen at B10 kb intervals encompassing the puta-
tive promoter region through to the 3’UTR (Figure 2). The
SNPs have been numbered from 1 to 23 for ease of
NPG_EJHG_5201783
24100k 24200k 24300k 24400k 24500k
Chr16Chr16
MicrosatellitesD16S420 URB036 UCL10321
Entrez genesNM_002738
PRKCB1: protein kinase C
NM_006539
CACNG3: voltage-dependent calcium channel gamma-3
NM_006910
RBBP6: retinoblastoma-binding protein 6 isoform 1
NM_018703
RBBP6: retinoblastoma-binding protein 6 isoform 2
NM_032626
RBBP6: retinoblastoma-binding protein 6 isoform 3
NM_212535
PRKCB1: protein kinase C
0.0
0.5
1.0
1.5
2.0
2.5
3.0
3.5
4.0
0.0 0.1 0.2 0.3 0.4 0.5 0.6 0.7 0.8Position (cM)
HLO
D/N
PL
0.0
0.1
0.2
0.3
0.4
0.5
0.6
0.7
Alp
ha
HLOD
NPL score
ResequencedRegion
Figure 1 CAE pedigrees. ’¼CAE; ¼ JAE; ¼ EGTCS; w¼ FS; *¼GTCS. Arrow indicates proband.
CACNG3 in absence epilepsyKV Everett et al
3
European Journal of Human Genetics
UNCORRECTED PROOF
reference. One of these is a novel SNP identified via
previous sequencing of a subset of the nuclear pedigrees;
the remaining 22 can be found on the NCBI SNP database
(Table 1).
These SNPs were typed in the entire resource and the
genotypes were used to construct linkage disequilibrium
(LD) blocks with Haploview 3.2.26 Blocks were defined as a
solid-spine of LD, that is, the first and last marker in a block
are in strong LD with all intermediate markers (one slight
mismatch is allowed by the programme), but these
intermediate markers are not necessarily in LD with one
another. A minimum D’ of 0.7 was used as the cutoff point
for strong LD. The program’s standard colour scheme was
employed, with pairwise D’ values less than 1 shown and
the degree of pink/red shading representing a pairwise LOD
Z2. GeneHunter was used to construct haplotypes based
on the largest blocks identified. Intrafamilial association
analysis was performed on individual SNPs using the
PDT.27 The PDT produces two measures of association,
the PDT-AVE and the PDT-SUM. The former gives all
families equal weight in the analysis, whereas the latter
gives more weight to more informative families.28 Associa-
tion analysis was also performed on the SNP haplotypes.
Each haplotype was assigned a single number, so that the
analysis could be performed essentially as though each
haplotype was a single locus with multiple alleles. This is
necessary because the PDT cannot simultaneously analyse
multiple loci.
The block structure of the CACNG3 locus was also
determined using the HapMap genotyped SNPs (see
Supplementary Data).
Re-sequencing and variant analysis
Bi-directional direct re-sequencing of B35 kb of genomic
DNA (chromosome 16, 24155960–24190949; Accession
number GI 51511732, NCBI Nucleotide Database) encom-
passing SNPs 1–9 from 24 affecteds was performed. Cases
were chosen from families compatible with linkage to the
CACNG3 locus and included individuals whose haplotypes
demonstrated the most significant disease association. This
re-sequencing work was performed by Polymorphic DNA
Technologies Inc., using standard Sanger dideoxy sequen-
cing protocols. The potential functional affect of all
identified variants was assessed by searching for predicted
NPG_EJHG_5201783
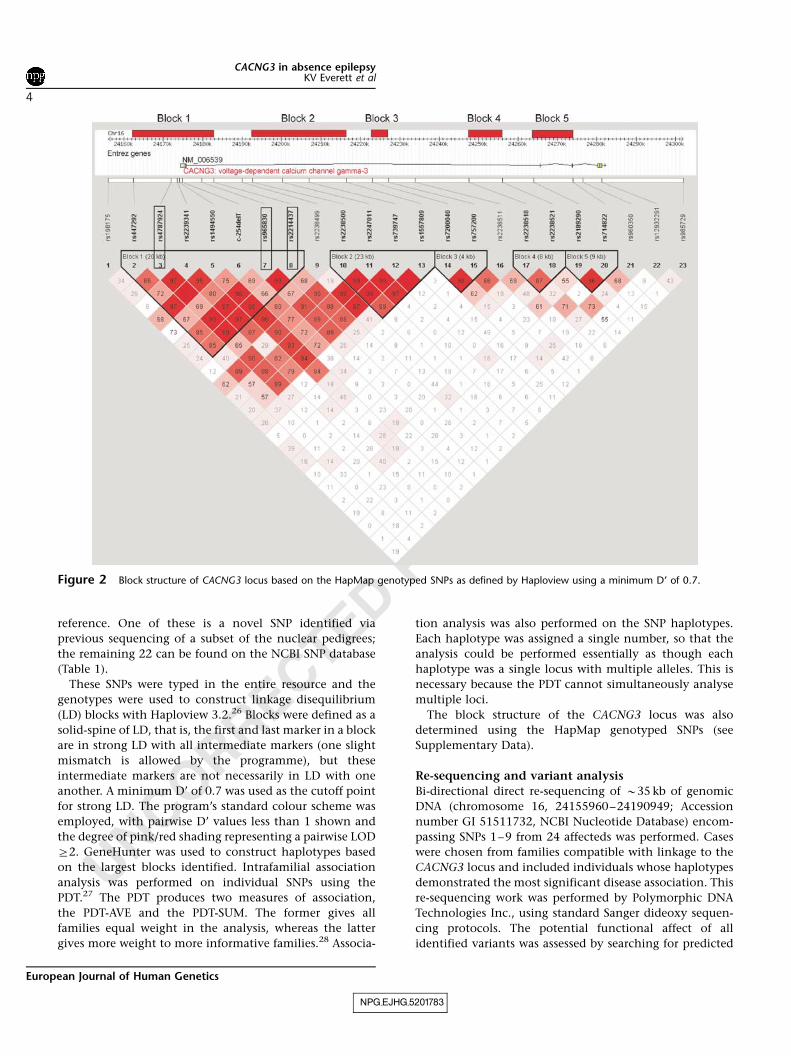
Figure 2 Block structure of CACNG3 locus based on the HapMap genotyped SNPs as defined by Haploview using a minimum D’ of 0.7.
CACNG3 in absence epilepsyKV Everett et al
4
European Journal of Human Genetics
UNCORRECTED PROOF
regulatory motifs contained within the TransFac and
Biobase databases via the Softberry NSITE portal. This
website also contains the FPROM program, which predicts
the position of potential promoters and enhancers.
GeneSplicer29 was used to predict whether any variant
might affect the splicing of the gene by identifying exon–
intron boundaries and scoring them. ESEfinder30 was used
to predict the presence of any exonic splicing enhancers in
exon 1. This program identifies putative binding sites for
four SR-rich proteins thought to be involved in the control
of splicing. Prediction is based on a scoring system
developed from weighted matrices for each motif con-
sensus sequence; when a certain threshold score is
achieved, the motif is recognised. The default values
suggested by the program authors were used throughout.
Standard BLAST analyses were performed to check for
sequence conservation between species.
ResultsLinkage analysis
The maximum HLOD score was 3.54 (a¼0.62) located
0.15 cM upstream of the distal marker, UCL10321. The
non-parametric analysis is also statistically significant:
maximum NPL statistic of 2.87 (Po0.002) occurring at
UCL10321 (Figure 1).
Re-sequencing of coding exons
Bi-directional re-sequencing of the coding exons and
surrounding intron–exon boundaries in 59 cases identified
34 variants: four were upstream of CACNG3; six in the
50UTR; five in intron 1; five in intron 2; nine in intron 3;
one synonymous SNP in exon 4 (A2121G, Pro307Pro); two
in the 30UTR and two downstream of CACNG3.
LD block structure
Analysis of LD based on the whole resource identified five
LD ‘blocks’ (Figure 2). The LD block structure predicted by
the HapMap project genotyped SNPs (based on CEPH
Caucasian data only), identified 11 blocks of LD across the
same region (see Supplementary Data).
SNP-based association analysis
Three SNPs showed significant transmission disequilibrium
(Pr0.01) with at least one of the test statistics: SNP3; SNP7
and SNP8 (Table 2). SNP3 is located approximately 2 kb
upstream of CACNG3, whereas SNPs 7 and 8 are all located
in intron 1. All three SNPs are in the first block of LD
(Figure 2).
Haplotype-based association analysis
Block-based haplotype association analysis was performed
on the entire data set using the PDT. No single complete
haplotype within a block was sufficiently common to allow
demonstration of disease association on the global level;
however, if a ‘sliding window’ approach was used on each
block, associated haplotypes were identified. Using this
approach, there are 13 haplotypes in Block 1, composed of
combinations of SNPs 2–8, which demonstrate overtrans-
mission and disease association (Pr0.05; Table 3). The
NPG_EJHG_5201783
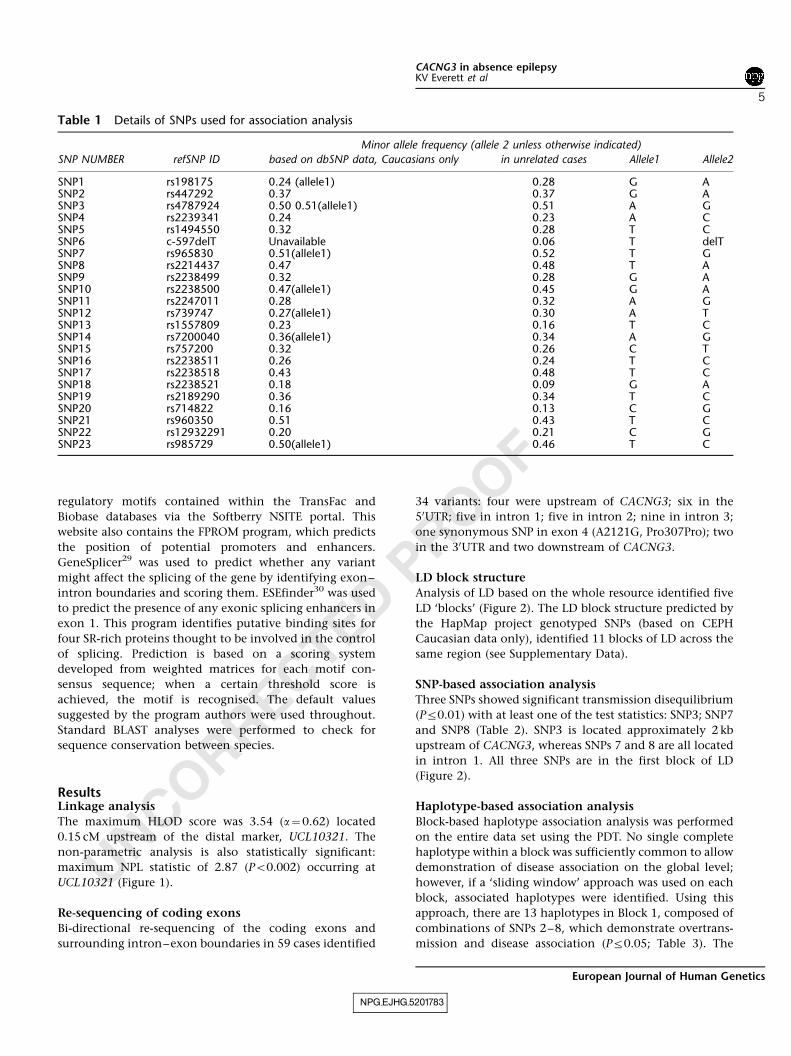
Table 1 Details of SNPs used for association analysis
Minor allele frequency (allele 2 unless otherwise indicated)
SNP NUMBER refSNP ID based on dbSNP data, Caucasians only in unrelated cases Allele1 Allele2
SNP1 rs198175 0.24 (allele1) 0.28 G ASNP2 rs447292 0.37 0.37 G ASNP3 rs4787924 0.50 0.51(allele1) 0.51 A GSNP4 rs2239341 0.24 0.23 A CSNP5 rs1494550 0.32 0.28 T CSNP6 c-597delT Unavailable 0.06 T delTSNP7 rs965830 0.51(allele1) 0.52 T GSNP8 rs2214437 0.47 0.48 T ASNP9 rs2238499 0.32 0.28 G ASNP10 rs2238500 0.47(allele1) 0.45 G ASNP11 rs2247011 0.28 0.32 A GSNP12 rs739747 0.27(allele1) 0.30 A TSNP13 rs1557809 0.23 0.16 T CSNP14 rs7200040 0.36(allele1) 0.34 A GSNP15 rs757200 0.32 0.26 C TSNP16 rs2238511 0.26 0.24 T CSNP17 rs2238518 0.43 0.48 T CSNP18 rs2238521 0.18 0.09 G ASNP19 rs2189290 0.36 0.34 T CSNP20 rs714822 0.16 0.13 C GSNP21 rs960350 0.51 0.43 T CSNP22 rs12932291 0.20 0.21 C GSNP23 rs985729 0.50(allele1) 0.46 T C
CACNG3 in absence epilepsyKV Everett et al
5
European Journal of Human Genetics

UNCORRECTED PROOF
individual haplotypes that are overtransmitted within each
window together form a larger haplotype composed of the
alleles 2211122. This haplotype has a frequency of 26.4%
in our parental population.
The sliding window approach also produces some
significant results in Block 2, which runs from SNPs 10 to
13, although these data are not as significant as for Block 1
(see Supplementary Data for details).
Variant detection
Intra-familial association analysis suggested that any
functional variant underlying the observed transmission
disequilibrium was most likely to be found between SNPs 1
and 9. Consequently, re-sequencing of the B35 kb of
genomic sequence in this region was undertaken. Of the
48 chromosomes from 24 affecteds that were sequenced, 19
were of the most common haplotype, 2211122, which also
shows the greatest evidence for disease association. The
remaining 25 chromosomes that were sequenced were
composed of a variety of different haplotypes. A total of 72
sequence variants were identified, including the nine
previously typed (Figure 3; full details can be found in
the Supplementary Information). Forty-five of these are
within 20 kb upstream of the gene, two in the 5’UTR and
the remaining 25 are in intron 1.
An initial assessment of which of the identified variants
were most likely to be causal was based on whether the
minor allele frequency was different in the 24 sequenced
cases from that quoted on the NCBI database (if that
information was available). Any variants in which this did
seem to be the case were typed in our entire resource, so
that intrafamilial association analysis could be performed.
Three variants (rs392728, rs11860647 and rs8048987) were
genotyped across the resource for this reason. However,
intrafamilial association analysis with the PDT did not
provide any evidence for preferential transmission of either
allele (data not shown).
Bioinformatics tools were also used to ascertain which of
these 72 variants might be functional. Those considered to
be most likely to have a functional effect are summarised in
Table 4 (see Supplementary Information for full details). Of
these, rs2021512 and rs1494550 are conserved at the
nucleotide level in the chimpanzee (see Supplementary
Data). rs11646957 has been typed in our resource of
pedigrees and trios and intrafamilial association analysis
performed. The results were not significant (data not
shown). Intrafamilial association analysis had already been
performed on rs1494550 and n20 as they are SNPs numbers
5 and 6 of the original 23 that were used. Neither
demonstrated any disease association in these analyses
NPG_EJHG_5201783
Table 2 SNPs showing statistically significant disease association (Pr0.01) in at least one PDT test statistic in the entireresource
SUM PDT AVE PDT
SNP Allele Transmitted Not transmitted Z (1 df) P-value Z (1 df) P-value
3 2(G) 300 254 2.65 0.008 2.26 0.0247 2(G) 265 221 2.64 0.008 2.32 0.0208 2(A) 286 235 2.95 0.003 2.63 0.009
Full details can be found in the Supplementary Information.
Table 3 SNP-based sliding-window analysis of Block 1 showing windows, which demonstrated significant (Po0.05) globaltransmission disequilibrium in the entire resource when analysed using the PDT
SNP Frequency in parents (%) Transmitted Not transmitted SUM PDT GLOBAL AVE PDT GLOBAL
2 3 4 5 6 7 8 Z (1 df) P-value w2(df) P-value Z (1df) P-value w2
(df) P-value
2 2 31.5 207 163 2.29 0.022 10.79(3) 0.013 2.60 0.009 9.33(3) 0.0252 2 1 30.2 183 143 2.16 0.031 17.41(7) 0.015 2.50 0.013 14.76(7) 0.039
2 1 44.1 262 217 2.67 0.008 10.41(3) 0.015 2.43 0.016 7.93(3) 0.0482 1 1 40.0 243 195 2.84 0.005 13.88(6) 0.031 2.62 0.009 10.74(6) 0.0972 1 1 1 34.1 191 141 3.20 0.001 21.57(11) 0.028 3.16 0.002 21.15(11) 0.0322 1 1 1 2 33.6 193 131 2.98 0.003 26.61(16) 0.046 3.29 0.001 28.34(16) 0.029
1 1 48.4 277 231 2.69 0.007 10.98(3) 0.012 2.37 0.018 8.06(3) 0.0451 1 1 42.2 222 173 3.04 0.002 16.31(6) 0.012 2.93 0.003 15.15(6) 0.019
1 1 2 36.8 210 158 3.25 0.001 22.83(7) 0.002 3.18 0.002 22.78(7) 0.0021 1 2 2 36.3 206 151 3.47 0.001 29.75(12) 0.003 3.48 0.001 29.81(12) 0.003
1 2 40.2 225 174 3.20 0.001 16.74(3) 0.001 3.10 0.002 16.53(3) 0.0011 2 2 39.4 222 162 3.92 0.000 29.95(6) 0.000 3.64 0.000 27.32(6) 0.000
2 2 45.8 277 221 3.21 0.001 17.60(3) 0.001 3.09 0.002 16.17(3) 0.001
Only haplotypes showing significant (Po0.05) overtransmission are shown. Full details can be found in the supplementary information.
CACNG3 in absence epilepsyKV Everett et al
6
European Journal of Human Genetics

UNCORRECTED PROOF
(see Supplementary Information). However, rs2021512 did
demonstrate significant transmission disequilibrium (SUM
PDT w2(1)¼7.91, P¼ 0.005; AVE PDT w2
(1)¼4.90, P¼0.027),
with the reference allele being overtransmitted to cases
(457 transmitted:422 not transmitted).
DiscussionOptimal strategies for the genetic analysis of ‘complex’
traits such as CAE have been much discussed in the recent
literature and the potential problems are well recognised.
These include uncertainties surrounding the delineation of
a categorical phenotype and the unpredictable relationship
between phenotype and genotype exemplified by current
ignorance of the genetic architecture of most ‘complex’
traits, and the recognition that even epilepsy phenotypes
demonstrating simple Mendelian inheritance display im-
mense heterogeneity and variable expressivity. All these
uncertainties preclude confident predictions about the
likely power and validity of any strategy selected, but
these data arise from approaches, which have some
reasonable degree of support and expectation of success
given certain assumptions.
CAE is a fairly well-defined and homogeneous pheno-
type with an electrophysiological hallmark and clear
evidence of a genetic aetiology. Although there is some
debate as to whether a narrower phenotype definition
NPG_EJHG_5201783
Resequenced Region
24150k 24160k 24170k 24180k 24190k
Chr16
Entrez GenesNM_006539
CACNG3: voltage-dependent calcium channel gamma-3Known SNPs
rs198175
rs675990
rs364414
rs392728
rs427032
rs12444655
rs9925433
rs390050
rs368108
rs11643132
rs367083
rs2021512
rs1494548
rs447292
rs1389825
rs2022174
rs916675
rs11645383
rs1494549
rs12149348
rs4787924
rs3760104
rs11640517
rs2239341
rs1494550
rs1494551
rs11646957
rs3060116
rs11640852
rs8051637
rs2238496
rs2238497
rs2299671
rs2238498
rs11860647
rs965830
rs11640412
rs2214437 rs11648782
rs2189291
rs8048987
rs2283550
rs12930391
rs11861918
rs2238499
Novel SNPsn1 n2
n3
n4
n5
n6
n7
n8
n9
n10 n11
n12
n13
n14
n15
n16
n17
n18
n19
n20 n21 n22
n23
n24
n25 n26 n27
LD Block 1
Figure 3
Table 4 Details of those variants most likely to have a functional effect based on the bioinformatics analyses performed
Site disrupted/created
Novel acceptor site Created
Variant ESE abolished Start position Sequencea End position
rs1164957 2 SF2/ASF motifsrs1494550 (SNP 5) 24160423 AG 24160424n20 (SNP 6) 24174105 CT 24174106rs2021512 24174976 AGTTT 24174980
aThe position of the indicated variant is shown in bold. This is not shown for SNP6 because the nucleotide is deleted. The splice-site dinucleotide isunderlined.
CACNG3 in absence epilepsyKV Everett et al
7
European Journal of Human Genetics

UNCORRECTED PROOF
should be adopted – in part to allow clearer prognostic
predictions – the clinical criteria adopted here provide the
reasonable expectation that the patients ascertained repre-
sent a homogenous clinical phenotype. It is known that a
variety of IGE phenotypes may cluster in families with a
proband with absence epilepsy, but analysis reveals an
increased clustering of CAE and JAE,2,3 suggesting that they
may share susceptibility loci. For this reason, the minority
of pedigrees in which first degree relatives of a proband
with CAE had a diagnosis of JAE were included and such
individuals were categorised as affected.
A further advantage of this phenotype for genetic
analysis lies in the existing level of understanding of the
molecular neurophysiological basis of the ‘spike–wave’
seizures, which are their hallmark.1 A substantial body of
evidence implicates VGCC genes in the aetiology of spike–
wave seizures in rodents and absence seizures in humans.
In particular, the stargazer phenotype arises from muta-
tions in Cacng2, one of a family of so-called g-subunit
genes, which have been further defined as a family of
transmembrane AMPA receptor regulatory proteins
(TARPS)10 that mediate surface expression of AMPA
receptors. Preliminary analysis in a limited family resource
provided support for CACNG3 as a CAE susceptibility locus.
It is noteworthy that the expression pattern of g3 is specific
to the cortex and hippocampus with low levels in the
cerebellum, consistent with a role in epileptogenesis. A
candidate gene approach therefore seems justified.
The relevant merits of linkage or association in the
analysis of a complex trait depend on the genetic
architecture of the trait, which cannot of course be known
in advance. Linkage can detect a locus of moderate effect in
a set of small nuclear pedigrees or sib-pairs provided the
proportion of linked families is adequate. It is robust to any
allelic heterogeneity. Association has more power to detect
loci of small effect, but does of course depend on allelic
homogeneity and allele frequencies conferring adequate
power. Both parametric and NPL analysis provided sig-
nificant evidence for linkage, indicating CACNG3 is a
susceptibility loci for CAE in a subset of the 65 nuclear
pedigrees analysed. Sequencing of coding regions did not
however identify any plausible causal sequence variants.
The role of CACNG3 was therefore further analysed by
intra-familial association analysis using the indirect ap-
proach based on genotyping of a set of common SNPs
spanning the CACNG3 gene. The pattern of LD across
CACNG3 was established and confirmed by HapMap data.
A number of assumptions underlie this strategy and restrict
its power to identify causal sequence variants. It is assumed
that the actual SNPs typed are not causal but are in
sufficiently tight LD with causal SNPs of adequately
matching allele frequency to permit their detection. Power
diminishes rapidly if these conditions are not fulfilled.31 It
is also assumed that any causal SNPs will be within the
associated interval, although in practice the interval is
difficult to define.32
Three SNPs in the first ‘block’ of LD showed significant
transmission disequilibrium (SNPs 3, 7 and 8) using the
pedigree disequilibrium test in the entire patient resource.
Using a ‘sliding window’ approach 13 haplotypes compris-
ing SNPs 2–8 within this ‘block’ demonstrated transmis-
sion disequilibrium. Together, these form an extended
haplotype composed of the alleles 2211122. Only two of
these SNPs (SNPs 5 and 6) could be implicated on
functional grounds. In each case, the minor allele is
predicted to lead to creation of a splice acceptor site.
However, neither SNP showed significant transmission
disequilibrium either alone or in combination. A correc-
tion for multiple testing was not applied to these analyses,
because although methods for calculating the effective
number of independent tests have been developed,33 their
validity in the presence of haplotype block structure has
been questioned34 and these methods are not yet estab-
lished tools. Thus, the association evidence described must
be considered as tentative but requiring independent
replication.
These observations suggested that causal variants under-
lying the observed transmission disequilibrium might lie
within the genomic region between SNPs 1 and 9 and were
most likely to be found on chromosomes of the haplotype
2211122. Re-sequencing of 35 kb of genomic sequence in
48 chromosomes identified a total of 72 sequence variants.
Evaluation of these variants encompassed the use of
bioinformatics tools to determine any potential function-
ality and genotyping in the entire resource to investigate
disease association. Four SNPs were predicted to have some
functional effect by disrupting exonic splicing enhancer
binding motifs or creating novel acceptor sites. One of
these, rs2021512, demonstrated significant transmission
disequilibrium with the reference sequence allele (G) being
overtransmitted in preference to the variant allele (A). This
suggests that the variant form is protective. Analysis
indicated that the variant allele could potentially create
an acceptor splice site, although it is unclear how this
might affect the function of the protein as rs2021512 is
non-genic and approximately 14 kb upstream of CACNG3.
However, it is possible that this SNP has a subtle regulatory
effect, which was not identified with the bioinformatics
used. Indeed, a paper earlier this year demonstrated that a
non-genic variant can have a gain-of-function effect on
another gene by creating a new transcriptional promoter.35
This is not necessarily what is occurring in this situation
but it is clear that variants some distance from a gene can
still exert a powerful effect on them. Furthermore, it is still
possible that rs2021512 is not a causal variant but is in LD
with an unidentified causal variant.
It is possible that the linkage observed is spurious and
CACNG3 is not a susceptibility locus for the CAE trait. A
false positive result is of course feasible even with the fairly
NPG_EJHG_5201783
CACNG3 in absence epilepsyKV Everett et al
8
European Journal of Human Genetics

UNCORRECTED PROOF
stringent threshold for significance utilised. The transmis-
sion disequilibrium observed could be a false positive
result, although not due to population substructure.
Alternatively, the observed association is real, but driven
by causal variants outside the sequenced region or too
infrequent and heterogeneous to be detected in the limited
number of chromosomes sequenced. It has been demon-
strated that long range LD can exist generating ‘genetically
indistinguishable SNPs’, which are many kilobases
apart.36,37 The power to detect a homogeneous causal
variant with a population frequency of 5% is approxi-
mately 92% when 48 chromosomes are sequenced but of
course a heterogeneous collection of low frequency
variants might go undetected. Finally, it is possible that
the observed SNPs demonstrating transmission disequili-
brium have functional consequences, which are not
apparent.
In conclusion, these observations provide genetic evi-
dence that CACNG3 is a susceptibility locus for CAE.
Common variants showing transmission disequilibrium
have been identified. Definitive evidence to confirm or
exclude this locus will require re-sequencing across an
extended genomic region encompassing CACNG3 in a
larger number of patients. Replication studies in similar
resources of CAE patients would demonstrate whether
rs2021512 is associated in other patient groups, and
functional work to establish what the exact biological
mechanism could be is needed.
AcknowledgementsThis work was supported by the MRC (UK), Wellcome Trust, ActionMedical Research and Epilepsy Research Foundation. We are verygrateful to the families for participating in this study and to all our142 collaborating clinicians, including Dr Lina Nashef. We thankGenethon for their assistance in collecting the French samples andRichard Sharp for his technical help. Austrian financial support camefrom the Austrian Research Foundation (awarded to Harald Aschauer,MD), Grant number P10460-MED. Thomas Sander, MD, wasawarded a grant by the Deutsche Forschungsgemeinschaft (Sa434/3-1), the German National Genome Research Network (01GS0479).Dutch financial support came from the Netherlands Organisation forHealth, Research and Development (ZonMW, 940-33-030) and theDutch National Epilepsy Fund – ‘The power of the small’ (NEF – ‘Demacht van het kleine’). Danish support (Mogens Friis, MD, andMarianne Kjeldsen, MD) came from the NINDS grant (NS-31564).
Web ResourcesThe URLs for data presented herein are as follows:Advanced Biotechnology Centre, Imperial College, http://bm-abc01.cx.med.ic.ac.uk/KBioscience, http://www.kbioscience.co.ukNCBI Nucleotide Database, http://www.ncbi.nlm.nih.gov/en-trez/query.fcgi?CMD¼ search&DB¼nuccorePolymorphic DNA Technologies, http://www.polymorphicdna.-comSoftberry NSITE Portal, http://www.softberry.com
GeneSplicer, http://www.tigr.org/tdb/GeneSplicer/gene_spl.htmlESEFinder, http://rulai.cshl.edu/tools/ESE/
References1 Engel Jr J: A proposed diagnostic scheme for people with epileptic
seizures and with epilepsy: report of the ILAE Task Force onClassification and Terminology. Epilepsia 2001; 42: 796–803.
2 Berkovic SF, Andermann F, Andermann E, Gloor P: Concepts ofabsence epilepsies: discrete syndromes or biological continuum?Neurology 1987; 37: 993–1000.
3 Marini C, Scheffer IE, Crossland KM et al: Genetic architecture ofidiopathic generalized epilepsy: clinical genetic analysis of 55multiplex families. Epilepsia 2004; 45: 467–478.
4 Berkovic SF, Howell RA, Hay DA, Hopper JL: Epilepsies in twins:genetics of the major epilepsy syndromes. Ann Neurol 1998; 43:435–445.
5 Kjeldsen MJ, Corey LA, Christensen K, Friis ML: Epileptic seizuresand syndromes in twins: the importance of genetic factors.Epilepsy Res 2003; 55: 137–146.
6 Fletcher CF, Lutz CM, O’Sullivan TN et al: Absence epilepsy intottering mutant mice is associated with calcium channel defects.Cell 1996; 87: 607–617.
7 Burgess DL, Jones JM, Meisler MH, Noebels JL: Mutation of theCa2+ channel beta subunit gene Cchb4 is associated with ataxiaand seizures in the lethargic (lh) mouse. Cell 1997; 88: 385–392.
8 Barclay J, Balaguero N, Mione M et al: Ducky mouse phenotype ofepilepsy and ataxia is associated with mutations in the Cacna2d2gene and decreased calcium channel current in cerebellarPurkinje cells. J Neurosci 2001; 21: 6095–6104.
9 Letts VA, Felix R, Biddlecome GH et al: The mouse stargazer geneencodes a neuronal Ca2+-channel gamma subunit. Nat Genet1998; 19: 340–347.
10 Tomita S, Chen L, Kawasaki Y et al: Functional studies anddistribution define a family of transmembrane AMPA receptorregulatory proteins. J Cell Biol 2003; 161: 805–816.
11 Chen L, Chetkovich DM, Petralia RS et al: Stargazin regulatessynaptic targeting of AMPA receptors by two distinct mechan-isms. Nature 2000; 408: 936–943.
12 Sander T, Schulz H, Saar K et al: Genome search for susceptibilityloci of common idiopathic generalised epilepsies. Hum Mol Genet2000; 9: 1465–1472.
13 Fong GC, Shah PU, Gee MN et al: Childhood absence epilepsywith tonic-clonic seizures and electroencephalogram 3-4-Hzspike and multispike-slow wave complexes: linkage to chromo-some 8q24. Am J Hum Genet 1998; 63: 1117–1129.
14 Haug K, Warnstedt M, Alekov AK et al: Mutations in CLCN2encoding a voltage-gated chloride channel are associated withidiopathic generalized epilepsies. Nat Genet 2003; 33: 527–532.
15 Sugimoto Y, Morita R, Amano K et al: Childhood absence epilepsyin 8q24: refinement of candidate region and construction ofphysical map. Genomics 2000; 68: 264–272.
16 Wallace RH, Marini C, Petrou S et al: Mutant GABA(A) receptorgamma2-subunit in childhood absence epilepsy and febrileseizures. Nat Genet 2001; 28: 49–52.
17 Chioza B, Wilkie H, Nashef L et al: Association between thealpha(1a) calcium channel gene CACNA1A and idiopathicgeneralized epilepsy. Neurology 2001; 56: 1245–1246.
18 Chen Y, Lu J, Pan H et al: Association between genetic variation ofCACNA1H and childhood absence epilepsy. Ann Neurol 2003; 54:239–243.
19 Heron SE, Phillips HA, Mulley JC et al: Genetic variation ofCACNA1H in idiopathic generalized epilepsy. Ann Neurol 2004;55: 595–596.
20 Chioza B, Everett K, Aschauer H et al: Evaluation of CACNA1H inEuropean patients with childhood absence epilepsy. Epilepsy Res2006; 69: 177–181.
21 Robinson R, Taske N, Sander T et al: Linkage analysis betweenchildhood absence epilepsy and genes encoding GABAA and
NPG_EJHG_5201783
Q1
CACNG3 in absence epilepsyKV Everett et al
9
European Journal of Human Genetics

UNCORRECTED PROOF
GABAB receptors, voltage-dependent calcium channels, and theECA1 region on chromosome 8q. Epilepsy Res 2002; 48: 169–179.
22 Jeganathan D, Chodhari R, Meeks M et al: Loci for primary ciliarydyskinesia map to chromosome 16p12.1–12.2 and 15q13.1–15.1in Faroe Islands and Israeli Druze genetic isolates. J Med Genet2004; 41: 233–240.
23 O’Connell JR, Weeks DE: PedCheck: a program for identificationof genotype incompatibilities in linkage analysis. Am J Hum Genet1998; 63: 259–266.
24 Kruglyak L, Daly MJ, Reeve-Daly MP, Lander ES: Parametric andnonparametric linkage analysis: a unified multipoint approach.Am J Hum Genet 1996; 58: 1347–1363.
25 Risch N: Linkage strategies for genetically complex traits. I.Multilocus models. Am J Hum Genet 1990; 46: 222–228.
26 Barrett JC, Fry B, Maller J, Daly MJ: Haploview: analysis andvisualization of LD and haplotype maps. Bioinformatics 2005; 21:263–265.
27 Martin ER, Monks SA, Warren LL, Kaplan NL: A test for linkageand association in general pedigrees: the pedigree disequilibriumtest. Am J Hum Genet 2000; 67: 146–154.
28 Martin ER, Bass MP, Kaplan NL: Correcting for a potential bias inthe pedigree disequilibrium test. Am J Hum Genet 2001; 68: 1065–1067.
29 Pertea M, Lin X, Salzberg SL: GeneSplicer: a new computationalmethod for splice site prediction. Nucleic Acids Res 2001; 29:1185–1190.
30 Cartegni L, Wang J, Zhu Z, Zhang MQ, Krainer AR: ESEfinder: Aweb resource to identify exonic splicing enhancers. Nucleic AcidsRes 2003; 31: 3568–3571.
31 de Bakker PI, Yelensky R, Pe’er I, Gabriel SB, Daly MJ, Altshuler D:Efficiency and power in genetic association studies. Nat Genet2005; 37: 1217–1223.
32 Soranzo N, Cavalleri GL, Weale ME et al: Identifying candidatecausal variants responsible for altered activity of the ABCB1multidrug resistance gene. Genome Res 2004; 14: 1333–1344.
33 Nyholt DR: A simple correction for multiple testing for single-nucleotide polymorphisms in linkage disequilibrium with eachother. Am J Hum Genet 2004; 74: 765–769.
34 Salyakina D, Seaman SR, Browning BL, Dudbridge F, Muller-Myhsok B: Evaluation of Nyholt’s procedure for multiple testingcorrection. Hum Hered 2005; 60: 19–25.
35 De Gobbi M, Viprakasit V, Hughes JR et al: A regulatory SNPcauses a human genetic disease by creating a new transcriptionalpromoter. Science 2006; 312: 1215–1217.
36 Lawrence R, Evans DM, Morris AP et al: Genetically indistinguish-able SNPs and their influence on inferring the location of disease-associated variants. Genome Res 2005; 15: 1503–1510.
37 Chapman JM, Cooper JD, Todd JA, Clayton DG: Detecting diseaseassociations due to linkage disequilibrium using haplotype tags: aclass of tests and the determinants of statistical power. Hum Hered2003; 56: 18–31.
Supplementary Information accompanies the paper on European Journal of Human Genetics website (http://www.nature.com/ejhg)
NPG_EJHG_5201783
CACNG3 in absence epilepsyKV Everett et al
10
European Journal of Human Genetics
Related Documents