United States Department of the Interior Bureau of Land Management Environmental Assessment DOI-BLM-AZ-A030-2022-00XX-EA Link Spring & Last Chance Allotments Grazing Permit Renewals June 2022 Grand Canyon-Parashant National Monument 345 E. Riverside Drive St. George, Utah 84790 Phone: (435) 688-3200 FAX: (435) 688-3258

Welcome message from author
This document is posted to help you gain knowledge. Please leave a comment to let me know what you think about it! Share it to your friends and learn new things together.
Transcript
United States Department of the Interior Bureau of Land Management
Environmental Assessment DOI-BLM-AZ-A030-2022-00XX-EA
Link Spring & Last Chance Allotments Grazing Permit Renewals
June 2022
Grand Canyon-Parashant National Monument 345 E. Riverside Drive St. George, Utah 84790 Phone: (435) 688-3200 FAX: (435) 688-3258
ii
Link Spring & Last Chance Allotments Grazing Permit Renewals
DOI-BLM-AZ-A030-2022-00XX-EA
Table of Contents
1.0 PURPOSE AND NEED ..........................................................................................................1
Introduction and Background .................................................................................... 1
Purpose and Need ...................................................................................................... 1
Conformance with BLM Land Use Plan(s) ............................................................... 4
Relationship to Statutes, Regulations, or Other Plans ............................................... 5
Identification of Issues ............................................................................................... 7
2.0 DESCRIPTION OF ALTERNATIVES .................................................................................8
Introduction ................................................................................................................ 8
Management Common to All Alternatives ................................................................ 8
2.2.1 Arizona Standards for Rangeland Health ......................................................... 8
Alternative A – Proposed Action ............................................................................... 9
2.3.1 Grazing System ............................................................................................... 10
2.3.2 Terms and Conditions of Grazing Permit ....................................................... 11
2.3.3 Monitoring and Adaptive Management .......................................................... 12
Alternative B – No Grazing ..................................................................................... 12
Alternative(s) Considered but Eliminated From Further Analysis .......................... 12
2.5.1 No Action Alternative ..................................................................................... 12
3.0 AFFECTED ENVIRONMENT ............................................................................................13
Introduction .............................................................................................................. 13
General Setting......................................................................................................... 13
3.2.1 Topography ..................................................................................................... 14
3.2.2 Climate ............................................................................................................ 14
3.2.3 Land Health Evaluation .................................................................................. 15
Elements of Resources of the Human Environment ................................................ 16
Resources Brought Forward for Analysis ................................................................ 21
3.4.1 Livestock Grazing ........................................................................................... 21
3.4.2 Vegetation Including Invasive, Non-Native Plant Species ............................. 25
3.4.3 Wildlife, Including Big Game, Migratory Birds, and Sensitive Species ........ 33
4.0 ENVIRONMENTAL CONSEQUENCES ...........................................................................41
Introduction .............................................................................................................. 41
iii
Direct and Indirect Impacts ...................................................................................... 41
4.2.1 Livestock Grazing ........................................................................................... 41
4.2.2 Vegetation Including Invasive, Non-Native Plant Species ............................. 43
4.2.3 Wildlife, Including Big Game, Migratory Birds, and Sensitive Species. ....... 44
Cumulative Impacts ................................................................................................. 47
4.3.1 Cumulative Impacts to Livestock Grazing ..................................................... 48
4.3.2 Cumulative Impacts to Vegetation Including Invasive, Non-Native Plant Species ............................................................................................................ 49
4.3.3 Cumulative Impacts to Wildlife ...................................................................... 49
Monitoring ............................................................................................................... 50
5.0 CONSULTATION AND COORDINATION ......................................................................52
List of Preparers and Reviewers .............................................................................. 52
6.0 REFERENCES .....................................................................................................................53
APPENDIX A – Maps ...................................................................................................................57
APPENDIX B – Arizona Standards for Rangeland Health and Guidelines for Grazing Administration (BLM 1997). .......................................................................................44
APPENDIX C - Land Health Evaluation Update for the Link Spring Allotment .........................52
APPENDIX D – Land Health Evaluation Update for the Last Chance Allotment .......................67
APPENDIX E- Historic Precipitation Reports ..............................................................................80
APPENDIX F – Existing Range Improvements ............................................................................84
List of Tables
Table 2.1. Proposed Action Authorization # 0201581 Link Spring Allotment ...............................9
Table 2.2. Proposed Action Authorization # 0201966 Last Chance Allotment ............................10
Table 2.3. Link Spring Allotment Four Pasture Deferred Rotation Schedule. .............................10
Table 2.4. Last Chance Allotment Two Pasture Deferred Rotation Schedule. ..............................11
Table 3.1. Annual Precipitation Rates for Link Spring and Last Chance Allotments ..................15
Table 3.2. Elements/Resources of the Human Environment .........................................................17
Table 3.3. Land Ownership * .........................................................................................................22
Table 3.4. Link Spring Allotment Updated Rangeland Health Data Summary .............................24
Table 3.5. Last Chance Allotment Updated Rangeland Health Data Summary ............................24
Table 3.6. Link Spring Allotment Wildfire History with GIS Acres (1980 – 2020) (BLM GIS). .............................................................................................................................26
Table 3.7. Last Chance Allotment Wildfire History with GIS Acres (1980 – 2020) (BLM GIS). .............................................................................................................................27
Table 5.1. List of BLM Preparers/Reviewers ................................................................................52
iv
Table 5.2. Non-BLM Agency Reviewers ......................................................................................52
Table C.1. Link Spring Allotment Actual Use ..............................................................................52
Table C.2. Utilization, Link Spring Key Area #1 (Canyon/Wilderness Pasture) ..........................53
Table C.3. Utilization, Link Spring Key Area #2 – (Tweedie Pasture) .........................................53
Table C.4. Trend Data, Link Spring Key Area #1 (Canyon/Wilderness Pasture) .........................54
Table C.5. Overall Trend, Link Spring Key Area #1 (Canyon/Wilderness Pasture) .....................55
Table C.6. Trend Data, Link Spring Key Area #2 (Tweedie Pasture) ...........................................56
Table C.7. Overall Trend, Link Spring Key Area #2 (Tweedie Pasture) ......................................57
Table C.8. Link Spring Key Area #1 (Canyon/Wilderness Pasture). Ecological Site Inventory Data – Ecological Condition. ......................................................................58
Table C.9. Link Spring Key Area #2 – (Tweedie Pasture). Ecological Site Inventory Data – Ecological Condition. ...............................................................................................60
Table C.10. Link Spring Allotment Updated Rangeland Health Data Summary. .........................64
Table C.11. Link Spring Key Area #1 (Canyon/Wilderness Pasture), Desired Plant Community Objectives Determination Table ..............................................................65
Table C.12. Link Spring Key Area #2 – (Tweedie Pasture), Desired Plant Community Objectives Determination Table ..................................................................................66
Table D.1. Last Chance Allotment Actual Use ..............................................................................67
Table D.2. Utilization, Last Chance Key Area #1 (Upper Pasture) ...............................................68
Table D.3. Utilization, Last Chance Key Area #2 (Lower Pasture) ..............................................68
Table D.4. Trend Data, Last Chance Key Area #1 (Upper Pasture) ..............................................69
Table D.5. Overall Trend, Last Chance Key Area #1 (Upper Pasture) .........................................70
Table D.6. Trend Data, Last Chance Key Area #2 (Lower Pasture) .............................................70
Table D.7. Overall Trend, Last Chance Key Area #2 (Lower Pasture) .........................................71
Table D.8. Last Chance Key Area #1 (Upper Pasture) Ecological Site Inventory Data – Ecological Condition. ..................................................................................................73
Table D.9. Last Chance Key Area #2 (Lower Pasture) Ecological Site Inventory Data – Ecological Condition ...................................................................................................74
Table D.10. Last Chance Allotment Updated Rangeland Health Data Summary .........................76
Table D.11. Last Chance Key Area #1, (Upper Pasture), Desired Plant Community Objectives Determination Table ..................................................................................77
Table D.12. Last Chance Key Area #2 (Lower Pasture) Desired Plant Community Objectives Determination Table ..................................................................................78
Table E.1. Olaf Knolls RAWS Historical Precipitation Report .....................................................80
Table E.2. Tweeds Point RAWS Historical Precipitation Report .................................................81
Table E.3. Sullivan Tank Historical Precipitation Report .............................................................82
v
Table F.1. Link Spring Allotment Existing Range Improvements ................................................84
Table F.2. Link Spring Allotment Existing Fences .......................................................................84
Table F.3. Link Spring Allotment Existing Pipelines ....................................................................85
Table F.4. Last Chance Allotment Existing Range Improvements ...............................................85
Table F.5. Last Chance Allotment Existing Fences .......................................................................86
Table F.6. Last Chance Allotment Existing Pipelines ...................................................................86
List of Acronyms
AGFD Arizona Game and Fish Department AMP Allotment Management Plan AUM Animal Unit Month BLM Bureau of Land Management CFR Code of Federal Regulations CBW Composition by Weight DFC Desired Future Condition DPC Desired Plant Community DR Decision Record DWR Dry Weight Rank EA Environmental Assessment EIS Environmental Impact Statement ESD(s) Ecological Site Description(s) FLPMA Federal Land Policy and Management Act FONSI Finding of No Significant Impact GCPNM Grand Canyon-Parashant National Monument IAT Interdisciplinary Assessment Team NEPA National Environmental Policy Act NRCS Natural Resources Conservation Service OHV Off-Highway Vehicle PNC Potential Natural Community PRIA Public Rangelands Improvement Act p.z. Precipitation Zone RAWS Remote Automatic Weather Station RRT Range Resource Team RMP Resource Management Plan S&G Standards and Guidelines USC United States Code USFWS United States Fish & Wildlife Service VRM Visual Resource Management
1
Chapter 1 1.0 PURPOSE AND NEED
Introduction and Background On January 4, 2007, the Bureau of Land Management (BLM), Grand Canyon-Parashant National Monument (GCPNM) completed an evaluation of rangeland conditions on the Link Spring Allotment (AZ04819). On January 4, 2010, an evaluation of rangeland conditions was completed on the Last Chance Allotment (AZ04815) (see Appendix A - Figure 1 - Location Map). A detailed discussion on rangeland health for these allotments can be found in Chapter 3, Section 3.2.3. The Interdisciplinary Assessment Team (IAT), during the land health evaluation process, determined that the Link Spring Allotment and the Last Chance Allotment were making significant progress toward meeting all applicable standards for rangeland health (BLM 2007 and BLM 2010). In 2021, an interdisciplinary team re-evaluated both allotments utilizing Interpreting Indicators of Rangeland Health, Version 4 (BLM 2005), utilization, and trend monitoring data. It was determined that the allotments are continuing to make progress toward meeting the Arizona BLM Standards for Rangeland Health (Standards for Rangeland Health) (Appendix B). This Environmental Assessment (EA) has been prepared to disclose and analyze the environmental consequences of the proposed grazing permit renewals, as well as alternative livestock management, for the Link Spring and Last Chance Allotments. Livestock grazing on public lands is managed according to grazing regulations found in the Code of Federal Regulations (CFR) at 43 CFR Part 4100. The BLM is responsible for determining the appropriate levels and management strategies for livestock grazing in these allotments. This analysis provides information as required by the BLM implementing regulations for the National Environmental Policy Act (NEPA), the Taylor Grazing Act (TGA), and the Federal Land Policy Management Act (FLPMA) to determine whether to authorize grazing within these allotments, and whether changes to current management are necessary. This EA also serves as a tool to help the authorized officer make an informed decision that is in conformance with the GCPNM Resource Management Plan (RMP) (BLM 2008a). The action culminates evaluations conducted on these allotments under the Arizona BLM Standards for Rangeland Health and Guidelines for Grazing Management. In addition, this EA determines if current grazing management practices would maintain desirable conditions and continue to allow improvement of public land resources, or whether changes in grazing management for the allotments are necessary. This EA is intended to evaluate the findings of the land health evaluation as it relates to vegetation conditions and resource values in the allotments. This is done to balance demands placed on the resources by various authorized uses within the allotments.
Purpose and Need The BLM has received grazing permit renewal applications from ZD Cattle Company, the current permittee, to renew the ten-year term grazing permit authorization # 0201581 on the Link Spring Allotment (AZ04819) and authorization # 0201966 on the Last Chance Allotment (AZ04815). The purpose of this action is to fully process the term grazing permit authorization #0201581 on the Link Spring Allotment (AZ04819) and authorization #0201966 on the Last Chance Allotment (AZ04815) in accordance with all applicable laws, regulations, and policies.
2
Compliance with all applicable laws and regulations includes consultation, coordination, and cooperation with affected individuals, interested publics, States, and Indian Tribes; completion of the applicable level of NEPA review; consultation with the United States Fish and Wildlife Service (USFWS) under Section 7 of the Endangered Species Act, if applicable; and ensuring that the allotments are achieving or making significant progress toward achievement of rangeland health standards and RMP objectives. Because the grazing permit for the Link Spring Allotment expired on 4/30/2018, the BLM renewed the permit for a ten-year period in the interim with the same terms and conditions pursuant to Section 402(c)(2) of the FLPMA as amended by Public Law No. 113-291, pending compliance with applicable laws and regulations. The grazing permit for the Last Chance Allotment expired on 3/31/2015, the BLM renewed the permit for a ten-year period in the interim with the same terms and conditions pursuant to Section 402(c)(2) of the FLPMA as amended by Public Law No. 113-291, pending compliance with applicable laws and regulations. These actions resulted in new permits being issued while this EA is prepared to process the permits. The purpose of this action is to provide for livestock grazing opportunities on public lands under the TGA and other applicable laws. BLM Arizona adopted the Arizona Standards for Rangeland Health and Guidelines for Livestock Grazing Management in 1997; these Standards for Rangeland Health were incorporated into the RMP. Rangelands should be achieving or making significant progress towards achieving the standards and to provide for proper nutrient cycling, hydrologic cycling, and energy flow. Guidelines direct the selection of grazing management practices and, where appropriate, livestock facilities to promote significant progress toward, or the attainment and maintenance of, the standards. The RMP identifies resource management objectives and management actions that establish guidance for managing a broad spectrum of land uses and allocations for public lands in the GCPNM. The RMP identified public lands within the Link Spring Allotment and the Last Chance Allotment as available for domestic livestock grazing. Where consistent with the goals and objectives of the RMP and Standards for Rangeland Health, allocation of forage for livestock use and the issuance of grazing permits to qualified applicants are provided for by the TGA and FLPMA. The need for the proposed action is to respond to the permittee’s request to renew the term grazing permits. The BLM now intends to consider whether to renew, renew with modifications, or not renew the grazing permit in accordance with those applicable laws and regulations. When issued, grazing permits must include appropriate terms and conditions designed to “achieve management and resource condition objectives for the public lands… and to ensure conformance with part 4180. Livestock grazing is an accepted and valid use of the BLM range management program, as provided for by the TGA, FLPMA, and the Public Rangelands Improvement Act (PRIA), as amended. Regulations controlling livestock grazing on public lands found in 43 CFR 4100.0-2. The objective of these regulations are to “promote healthy sustainable rangeland ecosystems; to accelerate restoration and improvement of public rangelands to properly functioning conditions; to promote the orderly use, improvement and development of the public lands; to establish efficient and effective administration of grazing of public rangelands; and to provide for the sustainability of the western livestock industry and communities that are dependent upon productive, healthy public rangelands”.
3
The BLM and National Park Service (NPS) interdisciplinary team has developed this EA for the purpose of analyzing the potential effects of livestock grazing on resources that may be affected across the allotments described in the Proposed Action. This approach is needed to ensure that management actions on public land conform to the appropriate land use plans, are site specific, and balance uses between different resource values. The Fundamentals of Rangeland Health (43 CFR 4180) including, watersheds, ecological condition, water quality, and Threatened & Endangered Species habitat have been analyzed. This assessment was conducted by the IAT which consisted of resource specialists from: BLM, Natural Resource Conservation Service (NRCS), Arizona Game and Fish Department (AGFD), and Mohave County Extension. The IAT was assisted by the Rangeland Resource Team (RRT), a diverse group of local residents formed and appointed under the Resource Advisory Council.
The RRT, IAT, permittees and other interested parties were invited to attend an issue scoping meeting for the Link Spring Allotment on January 29, 2002, and a field visit on November 20, 2002. The issue scoping meeting for the Last Chance Allotment was held on March 31, 2004, and a field visit on April 28, 2004. At the conclusion of the field visits for each allotment, the group determined that the Link Spring Allotment and Last Chance Allotment were making significant progress toward meeting the applicable standards for rangeland health. An allotment assessment report for the Link Spring Allotment was completed on January 4, 2007 (BLM 2007). An allotment assessment report for the Last Chance Allotment was completed on January 4, 2010 (BLM 2010). Both assessments were conducted in accordance with directions set forth in the Washington Office Instruction Memorandum No. 98-91 and Arizona State Instruction Memorandum No. 99-012 for implementation of Standards for Rangeland Health and Guidelines for Grazing Administration (Standards and Guides) (Appendix B, BLM 1997). The GCPNM Manager is the authorized officer responsible for the decisions regarding management of public lands within these allotments. Based on the results of the NEPA analysis, the authorized officer will issue a determination of the significance of the environmental effects and whether an EIS would be required. If the authorized officer determines that it is not necessary to prepare an EIS, the EA will be deemed sufficient and will provide information for the authorized officer to make an informed decision whether to renew, renew with modifications, or not renew the permit and if renewed, which management actions, mitigation measures, and monitoring requirements will be prescribed for the Link Spring Allotment and Last Chance Allotment to ensure management objectives and Standards for Rangeland Health are achieved. Grand Canyon-Parashant National Monument Proclamation Proposed actions within the GCPNM are designed to also ensure the long-term protection of a wide variety of biological objects and a long rich human history, as guided by Presidential Proclamation 7265. This presidential proclamation explains that GCPNM was created because of its “outstanding objects of scientific and historic interest.” The proclamation also states, “shall continue to issue and administer grazing leases”. The analysis of impacts to affected resources constitutes the analysis of impacts to Monument objects in this EA.
4
Conformance with BLM Land Use Plan(s) The alternatives described in Chapter 2 of this EA are in conformance and consistent with the GCPNM RMP, approved January 29, 2008 (BLM 2008a). It has also been determined that the alternatives would not conflict with other decisions throughout the plan. The following decisions are from Table 2.12 in the RMP regarding management of livestock grazing: DFC-GM-02: Livestock use and associated management practices will be conducted in a manner consistent with other resource needs and objectives to ensure that the health of rangeland resources is preserved or improved so that they are productive for all rangeland values. Where needed, public rangeland ecosystems will be improved to meet objectives. LA-GM-01: On BLM-administered lands, all allotments will continue to be classified as available for grazing by livestock under the principal of multiple use and sustained yield, except where specifically noted.1 MA-GM-03: Implementing the Arizona Standards for Rangeland Health will continue on all grazing allotments in accordance with established schedules and congressional requirements. The Arizona Standards for Rangeland Health and guidelines for grazing management will apply to all livestock grazing activities on BLM and NPS-administered lands consistent with the appropriate enabling legislation. These guidelines address management practices at the grazing allotment management (AMP) level and are intended to maintain desirable conditions or improve undesirable rangeland conditions within reasonable time frames.2 MA-GM-04: The interdisciplinary allotment evaluation process will continue to be used to provide specific guidance and actions for managing livestock grazing. Existing AMPs and other activity plans will be consistent with achieving the DFC’s and standards for rangeland health. They will contain the site-specific management objectives, as well as actions, methods, tools, and appropriate monitoring protocols. MA-GM-05: Existing management practices and levels of use on grazing allotments will be reviewed and evaluated on a priority basis to determine if they meet or are making progress toward meeting the Arizona Standards for Rangeland Health on BLM and NPS-administered lands and Vital Signs standards on NPS-administered lands. Appropriate and timely action will be implemented to deal with those areas not meeting the standards. MA-GM-06: The allotment management categorization process will continue to be used to define the level of management needed to properly administer livestock grazing according to management needs, resource conflicts, potential for improvement, and BLM funding/staffing constraints. The allotment categories are Custodial (C), managed custodially to protect resource conditions and values; Maintain (M), managed to maintain current satisfactory resource conditions and are actively managed to ensure that the condition of resource values do not decline; and Improve (I), actively managed to improve unsatisfactory resource conditions.3
1 No restrictions are associated with the Link Spring or Last Chance Allotments. 2 There are no NPS-administered lands within the Link Spring or Last Chance Allotments.
5
MA-GM-08: Allowable use on key forage species is 50% on allotments with rotational grazing systems except in tortoise habitat. On allotments in desert tortoise habitat or being less intensively managed, utilization is set at 45%. MA-GM-09: Any hay or other feed used in administering the livestock operation will be certified weed free.
Relationship to Statutes, Regulations, or Other Plans Numerous federal laws, regulations, and policies guide BLM management activities on public lands, with the most prominent laws being listed in this section. FLPMA (43 United States Code [U.S.C.] 1701), directs the BLM to manage public lands “in a manner that will protect the quality of scientific, scenic, historic, ecological, environmental, air and atmospheric, water resources, and archeological values.” The BLM has prepared this EA for the Link Spring Allotment and Last Chance Allotment Grazing Permit Renewals in compliance with NEPA and FLPMA. The statutes that govern public land rangeland management are the TGA of June 28, 1934, as amended (43 U.S.C. 315, 315a–315r); section 102 of the FLPMA of 1976 (43 U.S.C. 1740) as amended by the PRIA of 1978 (43 U.S.C. 1901 et seq.). The authority for renewing grazing permits is provided for in 43 CFR 4100 where the objectives of the regulations are “....to promote healthy, sustainable rangeland ecosystems; to accelerate restoration and improvement of public rangelands to properly functioning conditions; to promote the orderly use, improvement and development of the public lands; to establish efficient and effective administration of grazing of public rangelands; and to provide for the sustainability of the western livestock industry and communities that are dependent upon productive, healthy public rangelands” (43 CFR 4100.0-2). The Link Spring Allotment and Last Chance Allotment are wholly within the GCPNM (Appendix A - Figure 1). The GCPNM is responsible for grazing management of both allotments (BLM 2008a). Designation of the Monument did not, in and of itself, require modification of the current grazing practices. The presidential proclamation states that “Laws, regulations, and policies followed by the BLM in issuing and administering grazing leases on all lands under its jurisdiction shall continue to apply…” (BLM 2008a) Under the Antiquities Act, the BLM must protect objects identified in the presidential proclamation that established the National Monument. Therefore, if the BLM determines that any Monument objects are harmed by current management then management (including permit terms and conditions) would be modified accordingly. The analysis of impacts to specific resources constitutes the analysis of impacts to Monument objects in this EA. The Proposed Action complies with 43 CFR 4100.0-8 which states, in part, “The authorized officer shall manage livestock grazing on public lands under the principle of multiple use and sustained yield, and in accordance with applicable land use plans.” The Proposed Action is consistent with the Fundamentals of Rangeland Health (43 CFR 4180.1) and Standards for Rangeland Health (Appendix B, BLM 1997), which were developed through a collaborative process involving the Arizona Resource Advisory Council and the BLM State Standards and Guidelines team. The Secretary of the Interior approved the Standards and Guidelines in April 1997. These Standards for Rangeland Health were incorporated into the GCPNM RMP (BLM 2008a). Standards for Rangeland Health should be achieving or making
6
significant progress towards achieving the standards and to provide for proper nutrient cycling, hydrologic cycling, and energy flow. Guidelines direct the selection of grazing management practices and, where appropriate, livestock facilities to promote significant progress toward, or the attainment and maintenance of, the standards. The RMP identifies resource management objectives and management actions that establish guidance for managing a broad spectrum of land uses and allocations for public lands in the GCPNM. The RMP identified public lands within the Link Spring Allotment and Last Chance Allotment as available for domestic livestock grazing (BLM 2008a). Where consistent with the goals and objectives of the RMP and Standards for Rangeland Health, allocation of forage for livestock use and the issuance of grazing permits to qualified applicants are provided for by the TGA and FLPMA. The regulations at 43 CFR Part 10 specifically require land use authorizations, including leases and permits, to include a requirement for the holder of the authorization to notify the appropriate Federal official immediately upon the discovery of human remains and other items covered by the Native American Graves Protection and Repatriation Act (see 43 CFR 10.4(g); the actual requirement for persons to notify the Federal agency official and protect the discovery is in 43 CFR 10.4(b) and (c)). Executive Order 13186 requires the BLM and other Federal agencies to work with the U.S. Fish and Wildlife Service (USFWS) to provide protection for migratory birds. Implementation of the Proposed Action is not likely to adversely affect any species of migratory bird known or suspected to occur on the allotments. No take of any such species is anticipated. The subject allotments are in Mohave County, Arizona. The Proposed Action is consistent with the Mohave County General Plan (revised most recently on September 15, 2015). While livestock grazing is not specifically addressed in the Mohave County General Plan, this action does not conflict with decisions contained within the Plan. In addition, the Proposed Action and the alternatives would comply with the following laws and/or agency regulations, other plans and is consistent with applicable Federal and state laws, regulations, and plans to the maximum extent possible. • The Antiquities Act of 1906 • Migratory Bird Treaty Act of 1918 (16 U.S.C. 703-712; Ch. 128; July 13, 1918; 40 Stat.
755), as amended • Taylor Grazing Act of 1934 (43 U.S.C. 315) • The National Historic Preservation Act of 1966, as amended • National Environmental Policy Act of 1969 (42 United States Code (USC) 4321 et seq) • Clean Air Act of 1970 (42 U.S.C. 7401 et seq.) • Endangered Species Act of 1973, as amended • Federal Land Policy and Management Act of 1976 (43 [USC] 1707 et seq.) • Public Rangelands Improvement Act of 1978 (43 U.S.C. 1901) • Native American Graves Protection and Repatriation Act of 1990 (25 U.S.C. 3001–3013;
104 Stat. 3048-3058) • Arizona Water Quality Standards, Revised Statute Title 49, Chapter II
7
Identification of Issues Identification of issues for this assessment was accomplished by considering the resources that could be affected by implementation of one of the alternatives. The RRT, IAT, permittees and other interested parties were invited to attend a scoping meeting for the Link Spring Allotment on January 29, 2002, and a field visit on November 20, 2002. The scoping meeting for the Last Chance Allotment was held on March 31, 2004, and a field visit on April 28, 2004. At the conclusion of the field visits, the group determined that the Link Spring Allotment and Last Chance Allotment is making significant progress toward meeting the applicable standards for rangeland health. Issues identified during the scoping process can be seen in the Standards for Rangeland Health and Guidelines for Grazing Administration Implementation Project: Allotment Assessment for Link Spring (BLM 2007). See the Standards for Rangeland Health and Guidelines for Grazing Administration Implementation Project: Allotment Assessment for Last Chance (BLM 2010). The allotments were revisited by an interdisciplinary team of resource specialists in 2021 to update both assessments. Input from the BLM and NPS interdisciplinary team (IDT) can be found in Table 3.2 Elements/Resources of the Human Environment. The issues identified through the scoping and IDT process are listed below:
• BLM or State Sensitive Plant Species: Two species of salvage-restricted cacti may be affected by the proposed action.
• Livestock Grazing • Vegetation, including Invasive, Non-Native Plant Species: The current vegetative
community composition may be affected by each of the alternatives. • Wildlife
8
Chapter 2 2.0 DESCRIPTION OF ALTERNATIVES
4
Introduction NEPA and its implementing regulations require that an agency rigorously explore and objectively evaluate a reasonable range of alternatives. Reasonable alternatives are those that meet the purpose of and need for action and that are feasible to implement, taking into consideration regulatory, technical, economic, environmental, and other factors. This EA focuses on two alternatives, the proposed action, to issue new ten-year term grazing permits with updated terms and conditions and a no grazing alternative. The grazing permittee submitted applications to renew the ten-year term grazing permit for each authorization with no proposed changes. The BLM interdisciplinary team (IDT) explored and evaluated several different alternatives to determine whether the underlying need for the Proposed Action – providing for livestock grazing opportunities on public lands while ensuring that the allotment is achieving (or progressing toward meeting) rangeland health standards – would be met.
Management Common to All Alternatives The regulations at 43 CFR Part 10 specifically require land use authorizations, including leases and permits, to include a requirement for the holder of the authorization to notify the appropriate Federal official immediately upon the discovery of human remains and other items covered by the Native American Graves Protection and Repatriation Act (see 43 CFR 10.4(g); the actual requirement for persons to notify the Federal agency official and protect the discovery is in 43 CFR 10.4(b) and (c)). This requirement is incorporated as a term and condition of any grazing permit that would be issued. 2.2.1 Arizona Standards for Rangeland Health The allotments would be managed to achieve the following objectives, as described in the Arizona Standards for Rangeland Health (BLM 1997, Appendix B):
1) Upland soils exhibit infiltration, permeability, and erosion rates that are appropriate to soil type, climate, and landform (ecological site).
2) Riparian and wetland areas are in properly functioning condition. 3) Productive and diverse upland and riparian-wetland plant communities of native species
exist and are maintained. See Section 3.2.3 Land Health Evaluation for discussion of land health evaluations that have been completed for each allotment.
4 This standard does not apply in the Link Spring or Last Chance Allotments. As stated in Table 3.2 of this EA, there are no wetland/riparian areas in either allotment.
9
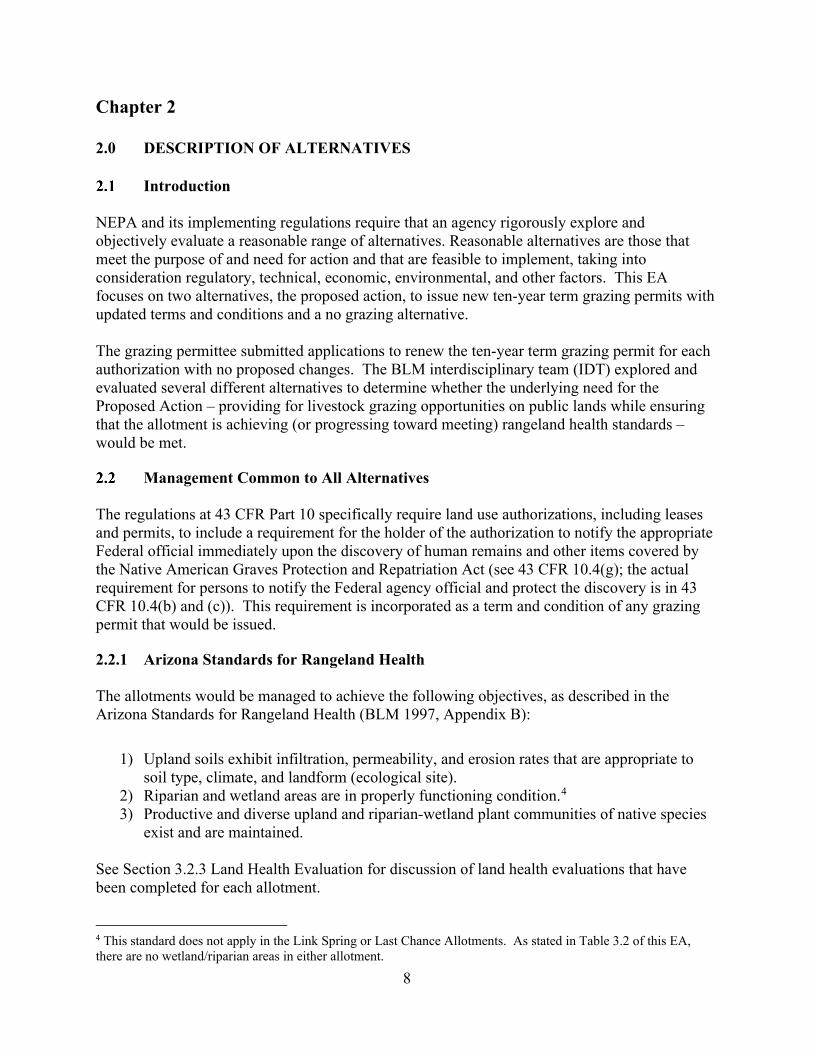
Alternative A – Proposed Action The Proposed Action was developed in cooperation with the grazing permittee. The livestock grazing management practices proposed under this alternative (i.e., season of use, utilization levels, ecological condition, and Desired Plant Communities (DPC) objectives) were designed to manage the overall rangeland resources present, provide for a diversity of wildlife and plant species, maintain functioning ecosystems, and maintain and/or improve ecological condition. Specifically, under this alternative the BLM would:
• Cancel the existing grazing permit and issue a new term grazing permit for the Link Spring Allotment for a period of ten years with updated terms and conditions. There are no proposed changes in number or kind of livestock, or season of use for this allotment. Livestock grazing would occur during the established season of use, and with the number of Animal Unit Months (AUMs)5 limited to the current active preference shown in Table 2.1.
• Cancel the existing grazing permit and issue a new term grazing permit for the Last Chance Allotment for a period of ten years with updated terms and conditions. There are no proposed changes in number or kind of livestock, or season of use for this allotment. Livestock grazing would occur during the established season of use, and with the number of Animal Unit Months (AUMs)6 limited to the current active preference shown in Table 2.2.
No new structural range improvements are proposed for either allotment under any of the alternatives. Any range improvements proposed in the future would be considered through a separate NEPA process. Only maintenance of current range improvements would be allowed through an existing cooperative agreement. Table 2.1. Proposed Action Authorization # 0201581 Link Spring Allotment
Allotment Number
Allotment Name
Livestock Kind
Livestock Number
Season of Use
Percent Public Land¹
Active AUMs
Suspended AUMs
AZ04819 Link Spring Cattle 93 3/1 -2/28
96 1,071 685
AZ04819 Link Spring Horse 2 3/1 – 2/28
96 23 0
Total 1,094 685 ¹Percent public land is based on AUMs.
5 An AUM, or Animal Unit Month, is a unit of measurement indicating how much forage is eaten by a cow/calf pair in one month. 6 An AUM, or Animal Unit Month, is a unit of measurement indicating how much forage is eaten by a cow/calf pair in one month.
10
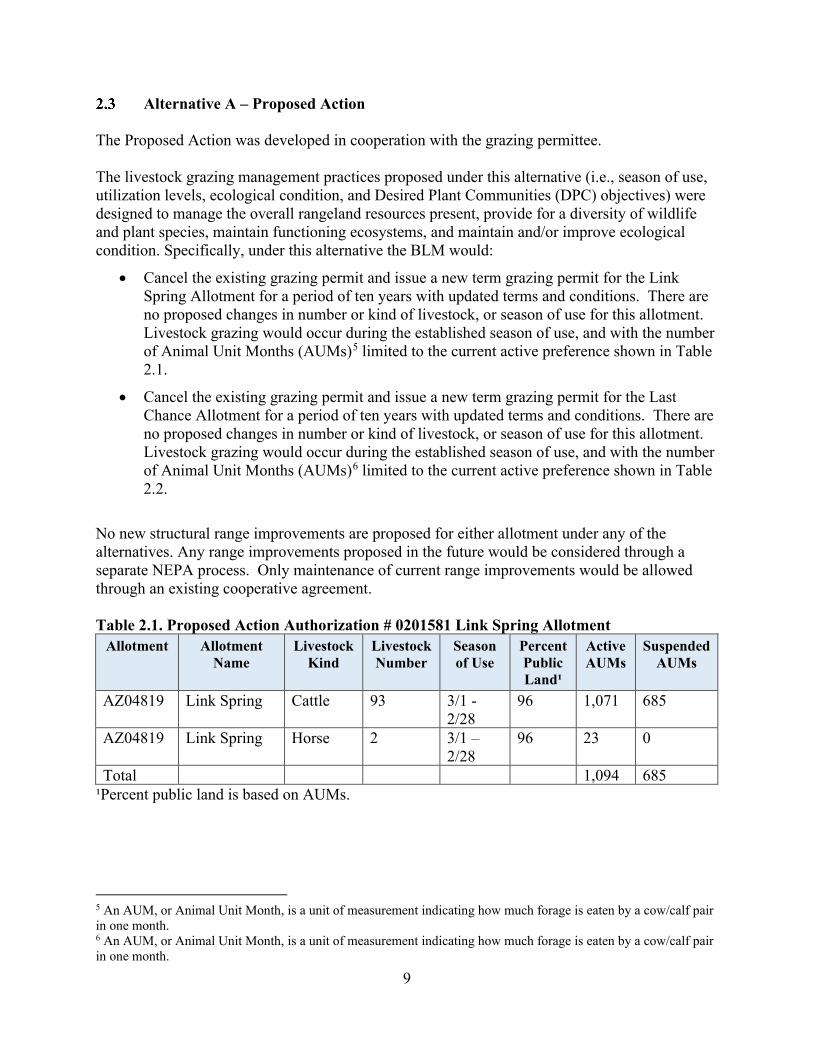
Table 2.2. Proposed Action Authorization # 0201966 Last Chance Allotment Allotment Number
Allotment Name
Livestock Kind
Livestock Number
Season of Use
Percent Public Land¹
Active AUMs
Suspended AUMs
AZ04815 Last Chance Cattle 57 12/1 – 11/30
89 609 346
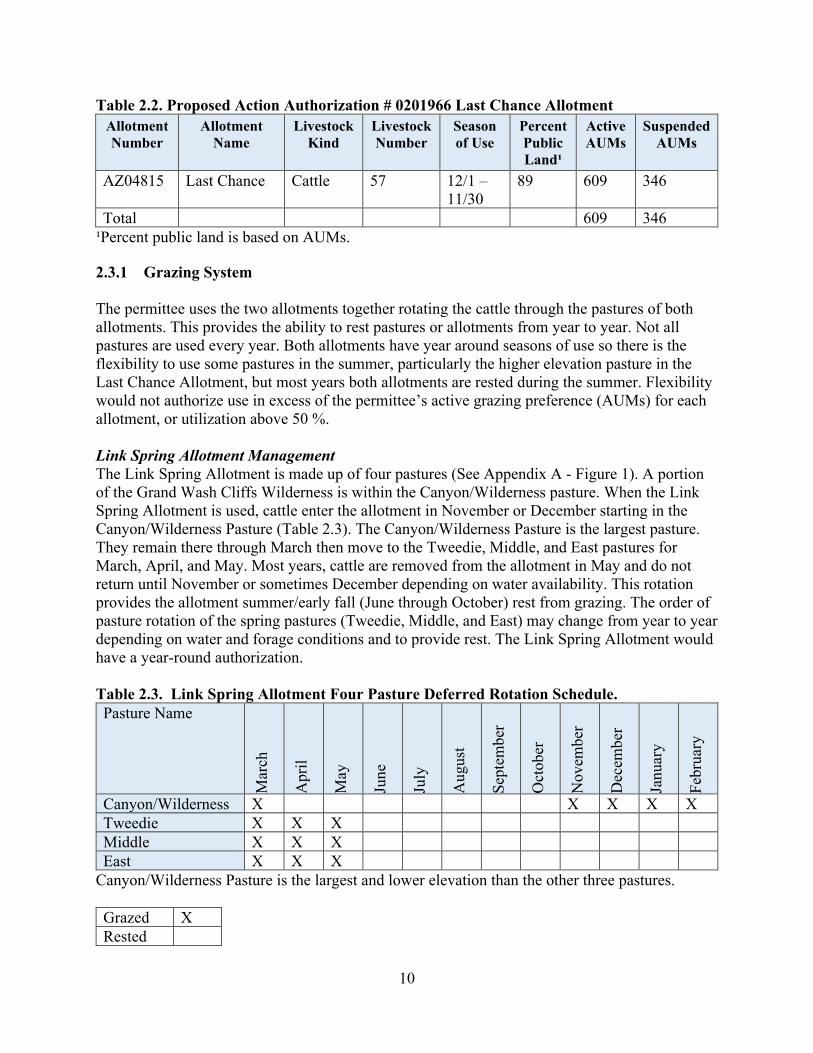
Total 609 346 ¹Percent public land is based on AUMs. 2.3.1 Grazing System The permittee uses the two allotments together rotating the cattle through the pastures of both allotments. This provides the ability to rest pastures or allotments from year to year. Not all pastures are used every year. Both allotments have year around seasons of use so there is the flexibility to use some pastures in the summer, particularly the higher elevation pasture in the Last Chance Allotment, but most years both allotments are rested during the summer. Flexibility would not authorize use in excess of the permittee’s active grazing preference (AUMs) for each allotment, or utilization above 50 %. Link Spring Allotment Management The Link Spring Allotment is made up of four pastures (See Appendix A - Figure 1). A portion of the Grand Wash Cliffs Wilderness is within the Canyon/Wilderness pasture. When the Link Spring Allotment is used, cattle enter the allotment in November or December starting in the Canyon/Wilderness Pasture (Table 2.3). The Canyon/Wilderness Pasture is the largest pasture. They remain there through March then move to the Tweedie, Middle, and East pastures for March, April, and May. Most years, cattle are removed from the allotment in May and do not return until November or sometimes December depending on water availability. This rotation provides the allotment summer/early fall (June through October) rest from grazing. The order of pasture rotation of the spring pastures (Tweedie, Middle, and East) may change from year to year depending on water and forage conditions and to provide rest. The Link Spring Allotment would have a year-round authorization. Table 2.3. Link Spring Allotment Four Pasture Deferred Rotation Schedule. Pasture Name
Mar
ch
Apr
il
May
June
July
Aug
ust
Sept
embe
r
Oct
ober
Nov
embe
r
Dec
embe
r
Janu
ary
Febr
uary
Canyon/Wilderness X X X X X Tweedie X X X Middle X X X East X X X
Canyon/Wilderness Pasture is the largest and lower elevation than the other three pastures. Grazed X Rested
11
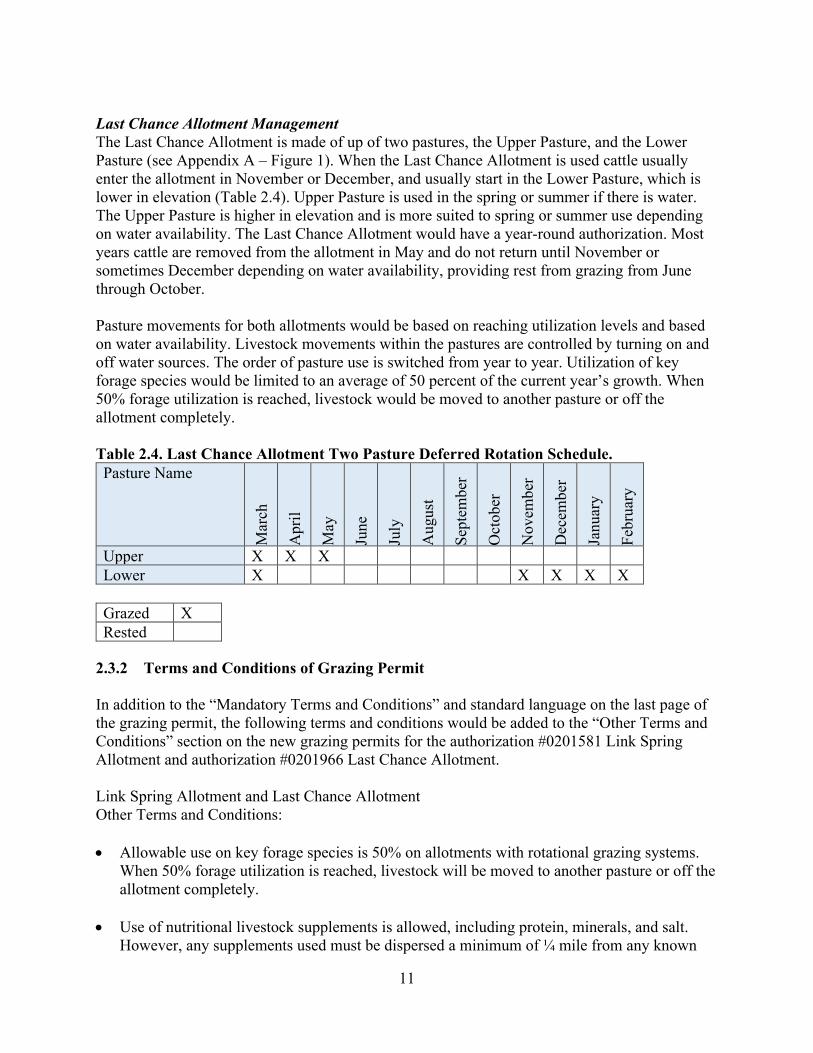
Last Chance Allotment Management The Last Chance Allotment is made of up of two pastures, the Upper Pasture, and the Lower Pasture (see Appendix A – Figure 1). When the Last Chance Allotment is used cattle usually enter the allotment in November or December, and usually start in the Lower Pasture, which is lower in elevation (Table 2.4). Upper Pasture is used in the spring or summer if there is water. The Upper Pasture is higher in elevation and is more suited to spring or summer use depending on water availability. The Last Chance Allotment would have a year-round authorization. Most years cattle are removed from the allotment in May and do not return until November or sometimes December depending on water availability, providing rest from grazing from June through October. Pasture movements for both allotments would be based on reaching utilization levels and based on water availability. Livestock movements within the pastures are controlled by turning on and off water sources. The order of pasture use is switched from year to year. Utilization of key forage species would be limited to an average of 50 percent of the current year’s growth. When 50% forage utilization is reached, livestock would be moved to another pasture or off the allotment completely. Table 2.4. Last Chance Allotment Two Pasture Deferred Rotation Schedule. Pasture Name
Mar
ch
Apr
il
May
June
July
Aug
ust
Sept
embe
r
Oct
ober
Nov
embe
r
Dec
embe
r
Janu
ary
Febr
uary
Upper X X X Lower X X X X X
Grazed X Rested
2.3.2 Terms and Conditions of Grazing Permit In addition to the “Mandatory Terms and Conditions” and standard language on the last page of the grazing permit, the following terms and conditions would be added to the “Other Terms and Conditions” section on the new grazing permits for the authorization #0201581 Link Spring Allotment and authorization #0201966 Last Chance Allotment. Link Spring Allotment and Last Chance Allotment Other Terms and Conditions: • Allowable use on key forage species is 50% on allotments with rotational grazing systems.
When 50% forage utilization is reached, livestock will be moved to another pasture or off the allotment completely.
• Use of nutritional livestock supplements is allowed, including protein, minerals, and salt. However, any supplements used must be dispersed a minimum of ¼ mile from any known
12
water sources, riparian areas, populations of special status plant species, winterfat dominated sites, and cultural or any other sensitive sites.
• The permittee would be allowed to use an actual use billing system. This privilege may be
revoked, and the permittee placed on advanced billing if payment of bills and/or actual use reports are late. An actual use grazing report (Form 4130-5) must be submitted within 15 days after completing annual grazing use.
2.3.3 Monitoring and Adaptive Management The proposed action includes adaptive management, which provides options that may be needed to adjust decisions and actions to meet desired conditions as determined through monitoring. BLM resource specialists would periodically monitor the allotments over the ten-year term of the grazing permits to ensure that the fundamentals or conditions of rangeland health are being met, in accordance with 43 CFR 4180. If monitoring indicates that desired conditions are not being achieved and current livestock grazing practices are causing non-attainment of resource objectives, management of the allotments would be modified in cooperation with the permittee(s). Adaptive management allows the BLM to adjust the timing, intensity, frequency, and duration of grazing; the grazing management system; and livestock numbers temporarily or on a more long-term basis, as deemed necessary. For example, drought conditions, fire, or flood events could require adaptive management adjustments to be made. If a permittee disagrees with the BLM’s assessment of the resource conditions or the necessary modifications, the BLM may nevertheless issue a Full Force and Effect Grazing Decision to protect resources.
Alternative B – No Grazing Alternative B would cancel the existing grazing permit(s) and issue new ten-year term grazing permit(s) on the authorization #0201581 Link Spring Allotment and/or authorization #0201966 Last Chance Allotment with zero authorized AUMs for active preference – all AUMs would be suspended (i.e., livestock grazing would be deferred for the ten-year permit period). In ten years, the allotment(s) would be re-evaluated. No new range improvement projects would be constructed, and no modifications would be made to existing projects.
Alternative(s) Considered but Eliminated From Further Analysis 2.5.1 No Action Alternative Under this alternative, new ten-year term grazing permits would be issued for the Link Spring Allotment and Last Chance Allotment with the same terms and conditions as the current permits. There would be no changes to the kind of livestock, season of use, or number of active permitted AUMs. No new range improvements projects would be constructed and no modifications would be made to existing projects. Livestock grazing on the allotments would continue to be the same as outlined in Alternative A (Proposed Action) except there would be no changes to the current terms and conditions. See Table 2.1 (Link Spring Allotment) and Table 2.2 (Last Chance Allotment) for grazing that would be authorized under this alternative. Potential impacts to elements of the environment would therefore be the same as those described for Alternative A, so a separate analysis of the No Action Alternative is not required (BLM 2008b).
13
CHAPTER 3 3.0 AFFECTED ENVIRONMENT
Introduction The purpose of this chapter is to describe the existing environment potentially affected by one of the alternatives to assist the reader in understanding the existing situation. An interdisciplinary team of resource specialists considered and analyzed the affected environment of this EA. Table 3.2 addresses the elements and resources of concern considered in the development of this EA; this table indicates whether the element or resource is not present in the project area, present but not impacted to a degree that requires detailed analysis, or present and potentially impacted. The resources identified and discussed in Section 3.4 include the relevant physical, social, and biological conditions that may be impacted with implementation of one of the alternatives and provides the baseline for comparing impacts described in Chapter 4.
General Setting The Link Spring Allotment and Last Chance Allotment are located in northwestern Arizona approximately 40 - 45 air miles south of St. George, Utah (Appendix A, Figure 1). The Last Chance Allotment is adjacent to and east of the Link Spring Allotment. They share an allotment boundary. Both allotments are wholly within and administered by the Grand Canyon-Parashant National Monument (GCPNM) (BLM 2008a). The allotments are in the Mojave-Great Basin Transition Zone and the Colorado Plateau. Specifically, the Grand Wash Cliffs and Shivwits Plateau Ecological Zones. A portion of the Grand Wash Cliffs Wilderness is within the Link Spring Allotment (Appendix A, Figure 1). A good variety and diversity of vegetation exist in the allotments ranging from pinyon-juniper in the higher elevations to desert shrub and annual and perennial grasses in the lower elevations (BLM 2007). Link Spring Allotment Gila & Salt River Meridian, Mohave County, Arizona. T. 35 N., R. 13 W.,
Sections: 6, 7, 18, 19; T. 35 N., R. 14 W.,
Sections: 1 thru 3, 10 thru 15, 22 – 24; T. 36 N., R. 13 W.,
Sections: 1 thru 20, 22, 23, 29 thru 31; T. 36 N., R. 14 W.,
Sections: 1, 2, 11 thru 15, 22 thru 27, 34 thru 36; T. 37 N., R. 13 W., Sections: 32 thru 35. Last Chance Allotment Gila & Salt River Meridian, Mohave County, Arizona. T. 35 N., R. 13 W.,
Sections: 4 thru 9, 16 thru 21;
14
T. 36 N., T. 13 W., Sections: 16, 20 thru 22, 27 thru 34.
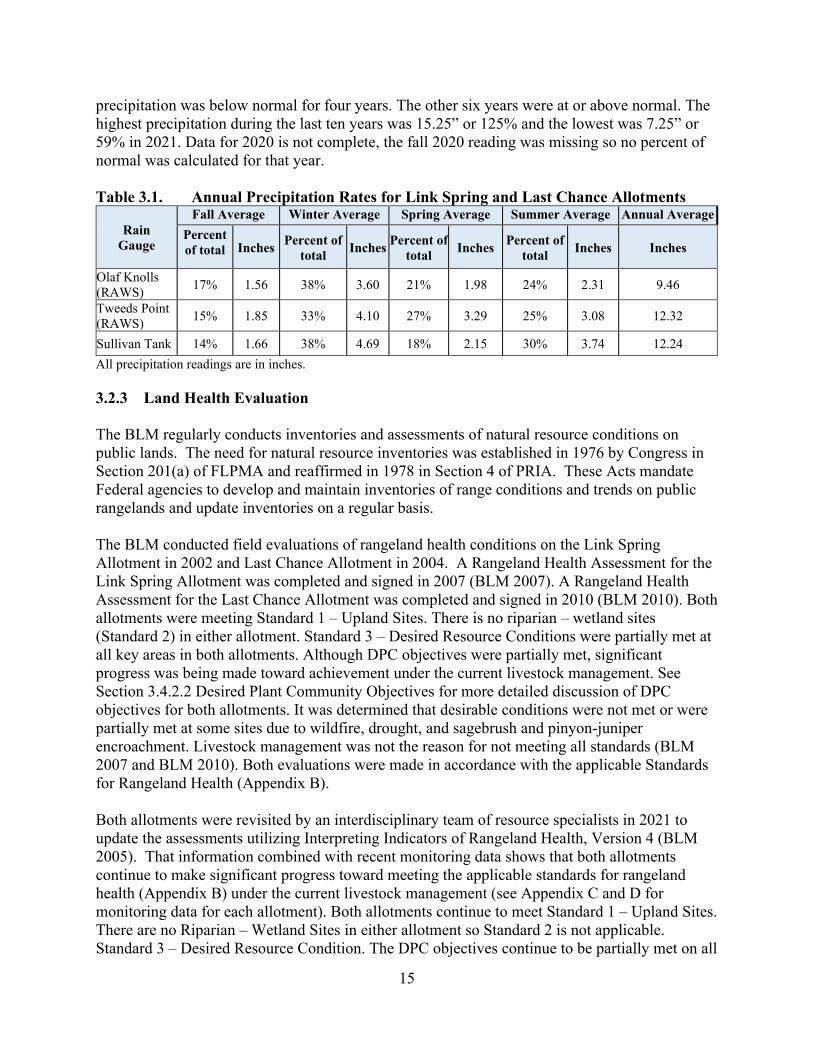
3.2.1 Topography The area is made up of rugged canyons, ridges, scenic escarpments, miles of cliffs, and sandstone buttes (BLM 2007). A few of the topographical features in the Link Spring Allotment include Tweeds Points, Hidden Rim, Hidden Canyon, St. George Canyon, Upper Grand Wash Cliffs, and Middle Bench. Elevations range from 3,400 feet in the northwestern portion, lower part of Hidden Canyon, to 6,620 feet in the southeast corner of the allotment. The main topographic features of the Last Chance Allotment are Last Chance Canyon and Last Chance Points (BLM 2010). Also, the Hidden Rim and Hidden Canyon are found within the allotment. Elevations range from 4,140 feet in the northern part of the allotment to 6,700 feet in the southwest corner of the allotment. 3.2.2 Climate Precipitation amounts vary within the project area due to extremes in elevations found in the allotments. The project area ranges from the 9 – 17 inch precipitation zones depending on elevation and aspect. Most precipitation occurring in the winter (33 – 38%) see Table 3.1 below. Summer rains fall from June through September in most years (24 – 30%), see Appendix E for the complete historic precipitation reports from the Olaf Knolls RAWS, Tweeds Point RAWS, and Sullivan Tank precipitation gauges. RAWS (remote automatic weather station). Average temperatures in the lower elevations range from 95 – 100 °F in the summer and lows can be below 10 °F in the winter. In the upper elevations summer temperatures can reach 95 °F and in the winter less than 10 °F. Olaf Knolls RAWS is located at T.36N. R.14W. Sec. 20 SWNW in the Pakoon Allotment at about 3,020 feet elevation. It has been read from 1985 - 2022. It is approximately 3 miles west of the Link Spring Allotment. See Appendix E Table E.1. Over the last ten years (2011 – 2021), precipitation was below normal for four years. The other six years were at or above normal. The highest precipitation during the last ten years was 15.04” or 159% in 2011 and the lowest was 4.72” or 50% in 2021. It should be noted that departures from normal are not unusual (Doswell 1997), and precipitation may be well above or well below the seasonal average (National Drought Mitigation Center 2015). Tweeds Point RAWS at T. 37 N. R. 13 W. Sec. 30 NENE is in Jump Canyon Allotment at approximately 5,380 ft. It has been read from 1985 – 2022. It is about 2 miles north of the northern part of the Link Spring Allotment. See Appendix E Table E.2. Over the last ten years (2011 – 2021), precipitation was below normal for four years. The other six years were at or above normal. The highest precipitation during the last ten years was 18.90” or 153% in 2011 and the lowest was 4.10” or 33% in 2021. The Sullivan Tank rain gauge (Appendix E Table E.3) has been read from 1978 to 2022 and is located at T.37N. R.12W. Sec. 14 SESW in the Sullivan Tank Allotment at about 5,280 feet. It is about 6 miles NE of the Link Spring Allotment. Over the last ten years (2010 – 2021),
15
precipitation was below normal for four years. The other six years were at or above normal. The highest precipitation during the last ten years was 15.25” or 125% and the lowest was 7.25” or 59% in 2021. Data for 2020 is not complete, the fall 2020 reading was missing so no percent of normal was calculated for that year. Table 3.1. Annual Precipitation Rates for Link Spring and Last Chance Allotments
Rain Gauge
Fall Average Winter Average Spring Average Summer Average Annual Average Percent of total Inches Percent of
total Inches Percent of total Inches Percent of
total Inches Inches
Olaf Knolls (RAWS) 17% 1.56 38% 3.60 21% 1.98 24% 2.31 9.46
Tweeds Point (RAWS) 15% 1.85 33% 4.10 27% 3.29 25% 3.08 12.32
Sullivan Tank 14% 1.66 38% 4.69 18% 2.15 30% 3.74 12.24 All precipitation readings are in inches. 3.2.3 Land Health Evaluation The BLM regularly conducts inventories and assessments of natural resource conditions on public lands. The need for natural resource inventories was established in 1976 by Congress in Section 201(a) of FLPMA and reaffirmed in 1978 in Section 4 of PRIA. These Acts mandate Federal agencies to develop and maintain inventories of range conditions and trends on public rangelands and update inventories on a regular basis. The BLM conducted field evaluations of rangeland health conditions on the Link Spring Allotment in 2002 and Last Chance Allotment in 2004. A Rangeland Health Assessment for the Link Spring Allotment was completed and signed in 2007 (BLM 2007). A Rangeland Health Assessment for the Last Chance Allotment was completed and signed in 2010 (BLM 2010). Both allotments were meeting Standard 1 – Upland Sites. There is no riparian – wetland sites (Standard 2) in either allotment. Standard 3 – Desired Resource Conditions were partially met at all key areas in both allotments. Although DPC objectives were partially met, significant progress was being made toward achievement under the current livestock management. See Section 3.4.2.2 Desired Plant Community Objectives for more detailed discussion of DPC objectives for both allotments. It was determined that desirable conditions were not met or were partially met at some sites due to wildfire, drought, and sagebrush and pinyon-juniper encroachment. Livestock management was not the reason for not meeting all standards (BLM 2007 and BLM 2010). Both evaluations were made in accordance with the applicable Standards for Rangeland Health (Appendix B). Both allotments were revisited by an interdisciplinary team of resource specialists in 2021 to update the assessments utilizing Interpreting Indicators of Rangeland Health, Version 4 (BLM 2005). That information combined with recent monitoring data shows that both allotments continue to make significant progress toward meeting the applicable standards for rangeland health (Appendix B) under the current livestock management (see Appendix C and D for monitoring data for each allotment). Both allotments continue to meet Standard 1 – Upland Sites. There are no Riparian – Wetland Sites in either allotment so Standard 2 is not applicable. Standard 3 – Desired Resource Condition. The DPC objectives continue to be partially met on all
16
key areas on both allotments for the same reasons as stated above (see 3.4.2.2 Desired Plant Community Objectives) for details for each key area. Livestock management was not the reason for not meeting all standards, the results of wildfire, years of drought, and woody vegetation encroachment have slowed recovery and achievement of objectives. Wildfires have burned through Link Spring Key Area # 1 on or about 1980 (BLM 2007). Link Spring Key Area # 2 has burned at least twice from 1980 – 2020, in 2005 and again in 2012 (Appendix A, Figure 2 and Section 3.4.2.1). Both key areas are currently in early seral ecological condition. The IAT concluded that livestock grazing was not impeding achievement of objectives (BLM 2007). Attempting to monitor 100% of any given rangeland is not practical. Instead, representative study sites are selected based on their ability to predict range conditions over much larger areas (University of Arizona 2010). Evaluation sites, or key areas as defined in Technical Reference 1734-4 (BLM 1999b), were selected (location and amount) using professional judgment based upon terrain, past uses of the area, and location of waters. Specific locations of key areas are available in the project file (Appendix A, Figure 3). Existing trend studies, ecological condition data, actual use, and utilization studies for each allotment was analyzed (see Section 3.4.1). The trend identified in the rangeland health assessment survey assessed; erosion status, vegetative cover, vigor, species diversity, and location of the most palatable plants in relation to access to a grazing animal. This is discussed in detail in Section 3.4.2, the Vegetation and Invasive, Non-Native Species section of Chapter 3 and the data used for the summary and analysis is found in Appendix C (Link Spring Allotment monitoring) and Appendix D (Last Chance Allotment monitoring). The rangeland health assessments confirmed that the allotments were making significant progress toward meeting the applicable standards for rangeland health in 2007 (Link Spring Allotment) and in 2010 (Last Chance Allotment) and continues to make significant progress toward meeting standards in 2021.
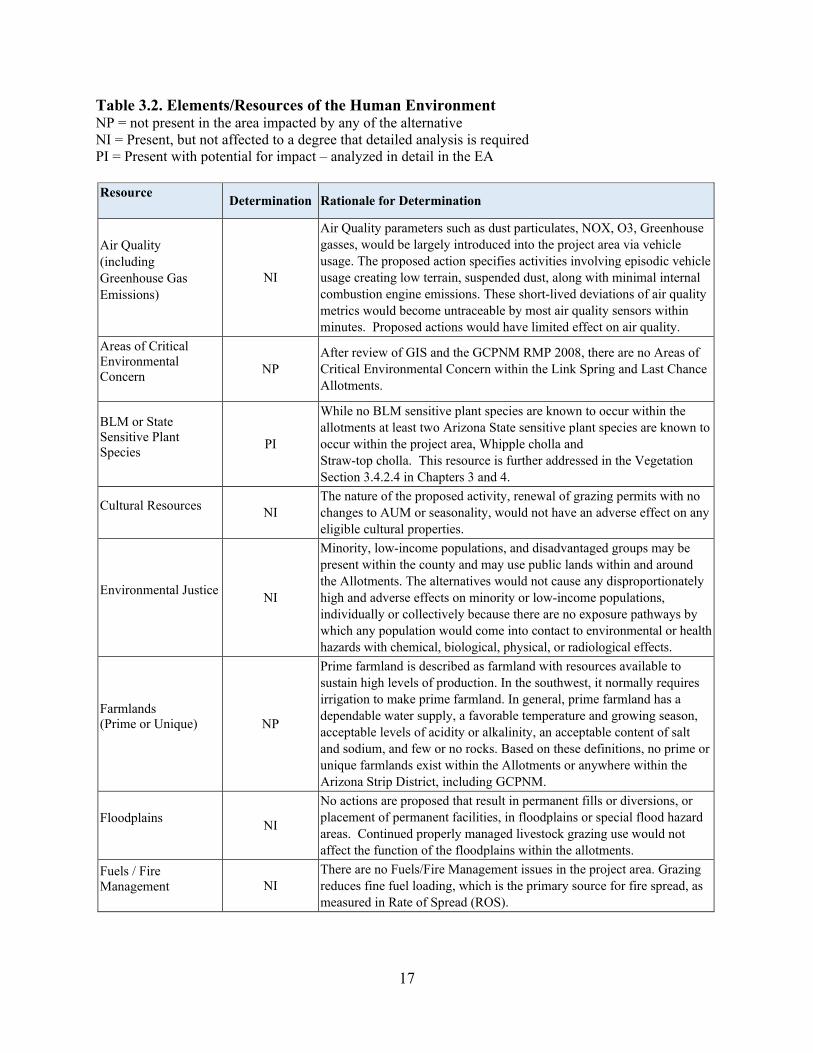
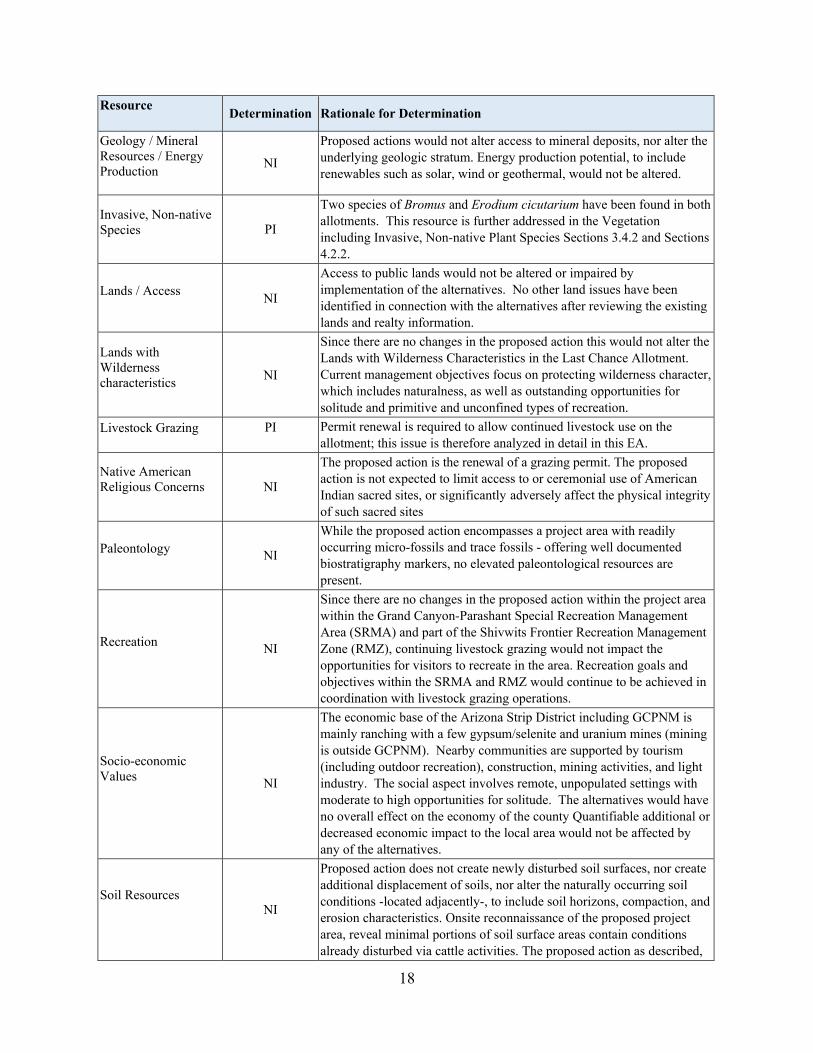
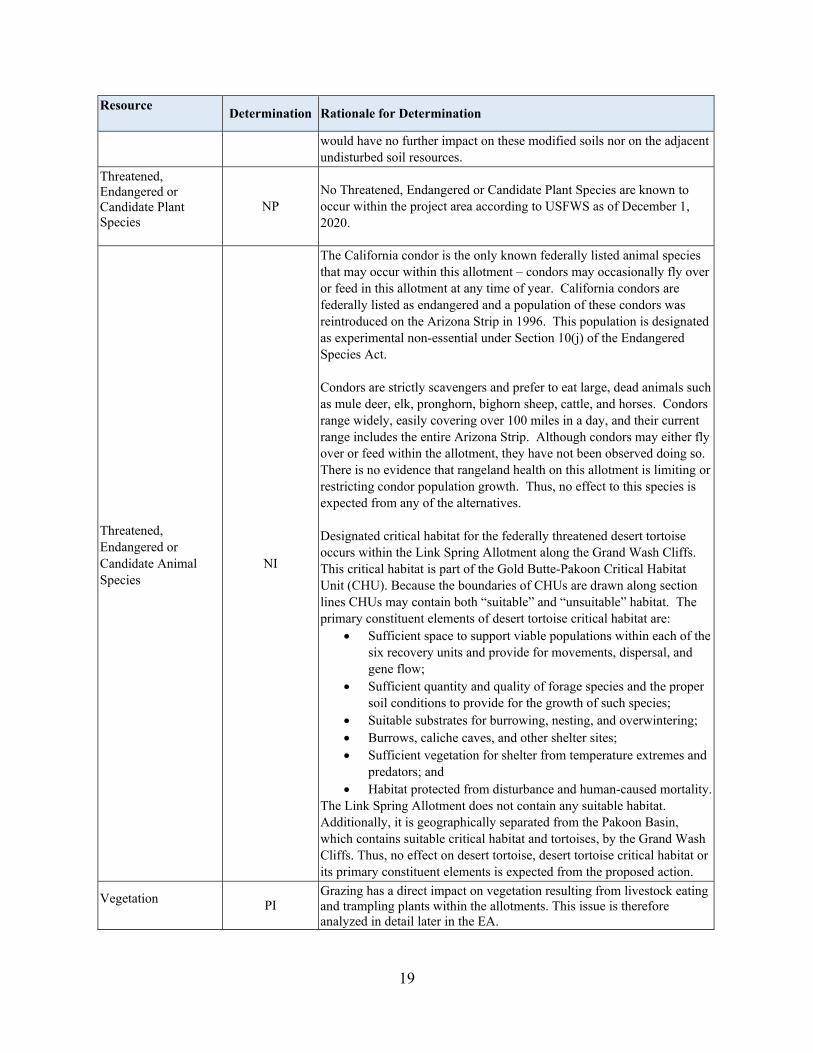
Elements of Resources of the Human Environment The BLM is required to consider many authorities when evaluating a federal action. Those elements of the human environment that are subject to the requirements specified in statute, regulation, or executive order, and must be considered in all EAs (BLM 2008b) have been considered by BLM resource specialists to determine whether they would be potentially affected by the Proposed Action or alternatives. These elements are identified in Table 3.2, along with the rationale for determination on potential effects. If any element was determined to potentially be impacted, it was carried forward for detailed analysis in this EA. If an element is not present or would not be affected, it was not carried forward for analysis. Table 3.2 also contains other resources that have been considered in this EA. As with the elements of the human environment, if these resources were determined to be potentially affected, they were carried forward for detailed analysis.
17
Table 3.2. Elements/Resources of the Human Environment NP = not present in the area impacted by any of the alternative NI = Present, but not affected to a degree that detailed analysis is required PI = Present with potential for impact – analyzed in detail in the EA Resource Determination Rationale for Determination
Air Quality (including Greenhouse Gas Emissions)
NI
Air Quality parameters such as dust particulates, NOX, O3, Greenhouse gasses, would be largely introduced into the project area via vehicle usage. The proposed action specifies activities involving episodic vehicle usage creating low terrain, suspended dust, along with minimal internal combustion engine emissions. These short-lived deviations of air quality metrics would become untraceable by most air quality sensors within minutes. Proposed actions would have limited effect on air quality.
Areas of Critical Environmental Concern
NP After review of GIS and the GCPNM RMP 2008, there are no Areas of Critical Environmental Concern within the Link Spring and Last Chance Allotments.
BLM or State Sensitive Plant Species
PI
While no BLM sensitive plant species are known to occur within the allotments at least two Arizona State sensitive plant species are known to occur within the project area, Whipple cholla and Straw-top cholla. This resource is further addressed in the Vegetation Section 3.4.2.4 in Chapters 3 and 4.
Cultural Resources NI
The nature of the proposed activity, renewal of grazing permits with no changes to AUM or seasonality, would not have an adverse effect on any eligible cultural properties.
Environmental Justice NI
Minority, low-income populations, and disadvantaged groups may be present within the county and may use public lands within and around the Allotments. The alternatives would not cause any disproportionately high and adverse effects on minority or low-income populations, individually or collectively because there are no exposure pathways by which any population would come into contact to environmental or health hazards with chemical, biological, physical, or radiological effects.
Farmlands (Prime or Unique)
NP
Prime farmland is described as farmland with resources available to sustain high levels of production. In the southwest, it normally requires irrigation to make prime farmland. In general, prime farmland has a dependable water supply, a favorable temperature and growing season, acceptable levels of acidity or alkalinity, an acceptable content of salt and sodium, and few or no rocks. Based on these definitions, no prime or unique farmlands exist within the Allotments or anywhere within the Arizona Strip District, including GCPNM.
Floodplains NI
No actions are proposed that result in permanent fills or diversions, or placement of permanent facilities, in floodplains or special flood hazard areas. Continued properly managed livestock grazing use would not affect the function of the floodplains within the allotments.
Fuels / Fire Management
NI There are no Fuels/Fire Management issues in the project area. Grazing reduces fine fuel loading, which is the primary source for fire spread, as measured in Rate of Spread (ROS).
18
Resource Determination Rationale for Determination
Geology / Mineral Resources / Energy Production
NI
Proposed actions would not alter access to mineral deposits, nor alter the underlying geologic stratum. Energy production potential, to include renewables such as solar, wind or geothermal, would not be altered.
Invasive, Non-native Species
PI
Two species of Bromus and Erodium cicutarium have been found in both allotments. This resource is further addressed in the Vegetation including Invasive, Non-native Plant Species Sections 3.4.2 and Sections 4.2.2.
Lands / Access NI
Access to public lands would not be altered or impaired by implementation of the alternatives. No other land issues have been identified in connection with the alternatives after reviewing the existing lands and realty information.
Lands with Wilderness characteristics
NI
Since there are no changes in the proposed action this would not alter the Lands with Wilderness Characteristics in the Last Chance Allotment. Current management objectives focus on protecting wilderness character, which includes naturalness, as well as outstanding opportunities for solitude and primitive and unconfined types of recreation.
Livestock Grazing
PI
Permit renewal is required to allow continued livestock use on the allotment; this issue is therefore analyzed in detail in this EA.
Native American Religious Concerns
NI
The proposed action is the renewal of a grazing permit. The proposed action is not expected to limit access to or ceremonial use of American Indian sacred sites, or significantly adversely affect the physical integrity of such sacred sites
Paleontology NI
While the proposed action encompasses a project area with readily occurring micro-fossils and trace fossils - offering well documented biostratigraphy markers, no elevated paleontological resources are present.
Recreation NI
Since there are no changes in the proposed action within the project area within the Grand Canyon-Parashant Special Recreation Management Area (SRMA) and part of the Shivwits Frontier Recreation Management Zone (RMZ), continuing livestock grazing would not impact the opportunities for visitors to recreate in the area. Recreation goals and objectives within the SRMA and RMZ would continue to be achieved in coordination with livestock grazing operations.
Socio-economic Values
NI
The economic base of the Arizona Strip District including GCPNM is mainly ranching with a few gypsum/selenite and uranium mines (mining is outside GCPNM). Nearby communities are supported by tourism (including outdoor recreation), construction, mining activities, and light industry. The social aspect involves remote, unpopulated settings with moderate to high opportunities for solitude. The alternatives would have no overall effect on the economy of the county Quantifiable additional or decreased economic impact to the local area would not be affected by any of the alternatives.
Soil Resources
NI
Proposed action does not create newly disturbed soil surfaces, nor create additional displacement of soils, nor alter the naturally occurring soil conditions -located adjacently-, to include soil horizons, compaction, and erosion characteristics. Onsite reconnaissance of the proposed project area, reveal minimal portions of soil surface areas contain conditions already disturbed via cattle activities. The proposed action as described,
19
Resource Determination Rationale for Determination
would have no further impact on these modified soils nor on the adjacent undisturbed soil resources.
Threatened, Endangered or Candidate Plant Species
NP No Threatened, Endangered or Candidate Plant Species are known to occur within the project area according to USFWS as of December 1, 2020.
Threatened, Endangered or Candidate Animal Species
NI
The California condor is the only known federally listed animal species that may occur within this allotment – condors may occasionally fly over or feed in this allotment at any time of year. California condors are federally listed as endangered and a population of these condors was reintroduced on the Arizona Strip in 1996. This population is designated as experimental non-essential under Section 10(j) of the Endangered Species Act. Condors are strictly scavengers and prefer to eat large, dead animals such as mule deer, elk, pronghorn, bighorn sheep, cattle, and horses. Condors range widely, easily covering over 100 miles in a day, and their current range includes the entire Arizona Strip. Although condors may either fly over or feed within the allotment, they have not been observed doing so. There is no evidence that rangeland health on this allotment is limiting or restricting condor population growth. Thus, no effect to this species is expected from any of the alternatives. Designated critical habitat for the federally threatened desert tortoise occurs within the Link Spring Allotment along the Grand Wash Cliffs. This critical habitat is part of the Gold Butte-Pakoon Critical Habitat Unit (CHU). Because the boundaries of CHUs are drawn along section lines CHUs may contain both “suitable” and “unsuitable” habitat. The primary constituent elements of desert tortoise critical habitat are:
• Sufficient space to support viable populations within each of the six recovery units and provide for movements, dispersal, and gene flow;
• Sufficient quantity and quality of forage species and the proper soil conditions to provide for the growth of such species;
• Suitable substrates for burrowing, nesting, and overwintering; • Burrows, caliche caves, and other shelter sites; • Sufficient vegetation for shelter from temperature extremes and
predators; and • Habitat protected from disturbance and human-caused mortality.
The Link Spring Allotment does not contain any suitable habitat. Additionally, it is geographically separated from the Pakoon Basin, which contains suitable critical habitat and tortoises, by the Grand Wash Cliffs. Thus, no effect on desert tortoise, desert tortoise critical habitat or its primary constituent elements is expected from the proposed action.
Vegetation PI
Grazing has a direct impact on vegetation resulting from livestock eating and trampling plants within the allotments. This issue is therefore analyzed in detail later in the EA.
20
Resource Determination Rationale for Determination
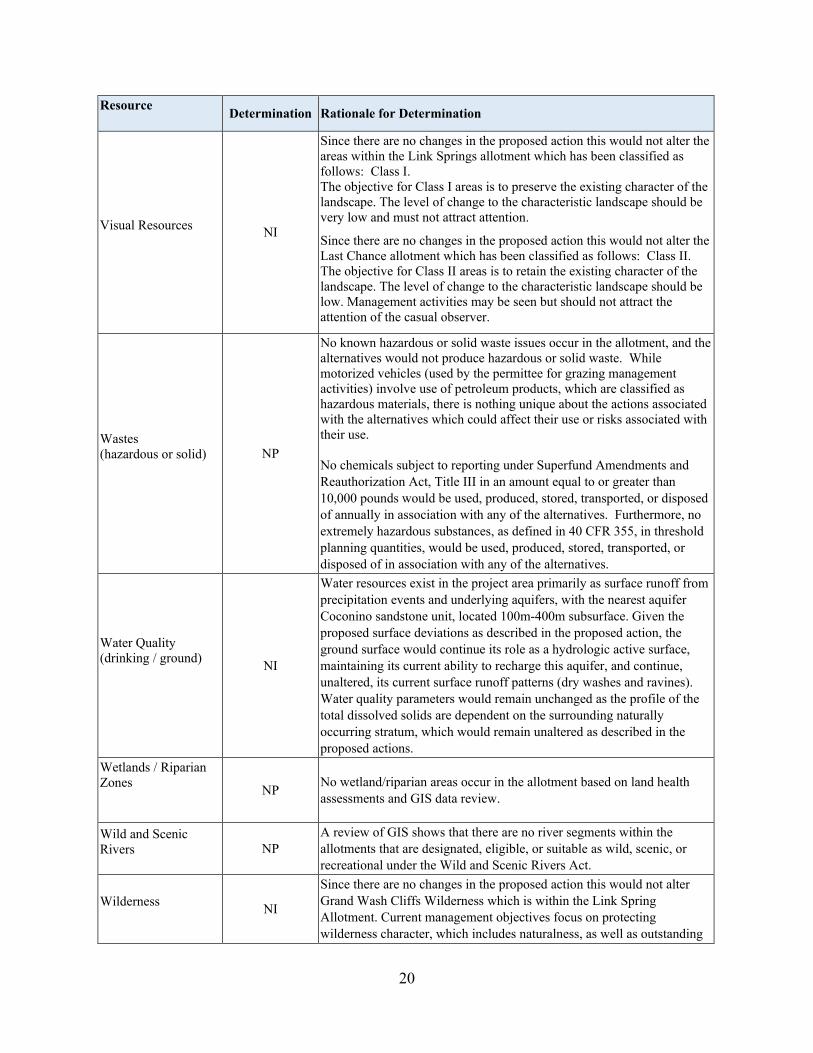
Visual Resources NI
Since there are no changes in the proposed action this would not alter the areas within the Link Springs allotment which has been classified as follows: Class I. The objective for Class I areas is to preserve the existing character of the landscape. The level of change to the characteristic landscape should be very low and must not attract attention.
Since there are no changes in the proposed action this would not alter the Last Chance allotment which has been classified as follows: Class II. The objective for Class II areas is to retain the existing character of the landscape. The level of change to the characteristic landscape should be low. Management activities may be seen but should not attract the attention of the casual observer.
Wastes (hazardous or solid)
NP
No known hazardous or solid waste issues occur in the allotment, and the alternatives would not produce hazardous or solid waste. While motorized vehicles (used by the permittee for grazing management activities) involve use of petroleum products, which are classified as hazardous materials, there is nothing unique about the actions associated with the alternatives which could affect their use or risks associated with their use. No chemicals subject to reporting under Superfund Amendments and Reauthorization Act, Title III in an amount equal to or greater than 10,000 pounds would be used, produced, stored, transported, or disposed of annually in association with any of the alternatives. Furthermore, no extremely hazardous substances, as defined in 40 CFR 355, in threshold planning quantities, would be used, produced, stored, transported, or disposed of in association with any of the alternatives.
Water Quality (drinking / ground)
NI
Water resources exist in the project area primarily as surface runoff from precipitation events and underlying aquifers, with the nearest aquifer Coconino sandstone unit, located 100m-400m subsurface. Given the proposed surface deviations as described in the proposed action, the ground surface would continue its role as a hydrologic active surface, maintaining its current ability to recharge this aquifer, and continue, unaltered, its current surface runoff patterns (dry washes and ravines). Water quality parameters would remain unchanged as the profile of the total dissolved solids are dependent on the surrounding naturally occurring stratum, which would remain unaltered as described in the proposed actions.
Wetlands / Riparian Zones
NP No wetland/riparian areas occur in the allotment based on land health assessments and GIS data review.
Wild and Scenic Rivers
NP A review of GIS shows that there are no river segments within the allotments that are designated, eligible, or suitable as wild, scenic, or recreational under the Wild and Scenic Rivers Act.
Wilderness NI
Since there are no changes in the proposed action this would not alter Grand Wash Cliffs Wilderness which is within the Link Spring Allotment. Current management objectives focus on protecting wilderness character, which includes naturalness, as well as outstanding
21
Resources Brought Forward for Analysis
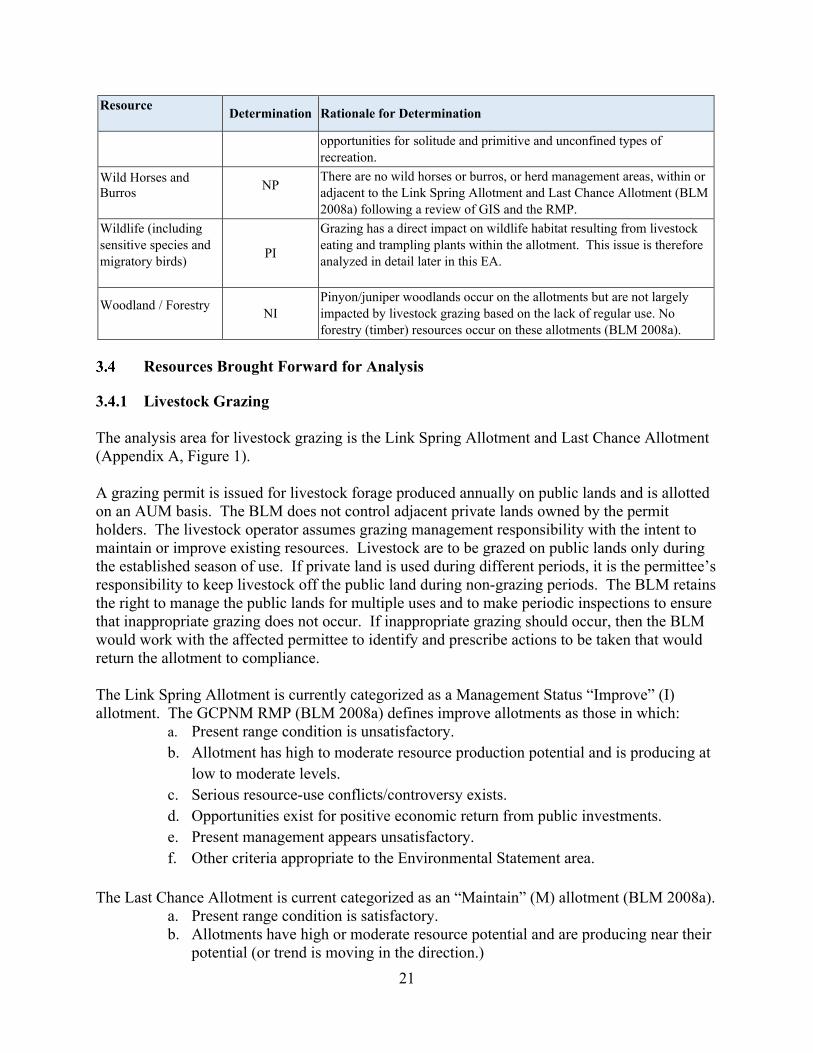
3.4.1 Livestock Grazing The analysis area for livestock grazing is the Link Spring Allotment and Last Chance Allotment (Appendix A, Figure 1). A grazing permit is issued for livestock forage produced annually on public lands and is allotted on an AUM basis. The BLM does not control adjacent private lands owned by the permit holders. The livestock operator assumes grazing management responsibility with the intent to maintain or improve existing resources. Livestock are to be grazed on public lands only during the established season of use. If private land is used during different periods, it is the permittee’s responsibility to keep livestock off the public land during non-grazing periods. The BLM retains the right to manage the public lands for multiple uses and to make periodic inspections to ensure that inappropriate grazing does not occur. If inappropriate grazing should occur, then the BLM would work with the affected permittee to identify and prescribe actions to be taken that would return the allotment to compliance. The Link Spring Allotment is currently categorized as a Management Status “Improve” (I) allotment. The GCPNM RMP (BLM 2008a) defines improve allotments as those in which:
a. Present range condition is unsatisfactory. b. Allotment has high to moderate resource production potential and is producing at
low to moderate levels. c. Serious resource-use conflicts/controversy exists. d. Opportunities exist for positive economic return from public investments. e. Present management appears unsatisfactory. f. Other criteria appropriate to the Environmental Statement area.
The Last Chance Allotment is current categorized as an “Maintain” (M) allotment (BLM 2008a).
a. Present range condition is satisfactory. b. Allotments have high or moderate resource potential and are producing near their
potential (or trend is moving in the direction.)
Resource Determination Rationale for Determination
opportunities for solitude and primitive and unconfined types of recreation.
Wild Horses and Burros
NP
There are no wild horses or burros, or herd management areas, within or adjacent to the Link Spring Allotment and Last Chance Allotment (BLM 2008a) following a review of GIS and the RMP.
Wildlife (including sensitive species and migratory birds)
PI
Grazing has a direct impact on wildlife habitat resulting from livestock eating and trampling plants within the allotment. This issue is therefore analyzed in detail later in this EA.
Woodland / Forestry NI
Pinyon/juniper woodlands occur on the allotments but are not largely impacted by livestock grazing based on the lack of regular use. No forestry (timber) resources occur on these allotments (BLM 2008a).
22
c. No serious resource-use conflicts/controversy exist. d. Opportunities may exist for positive economic return from public investments. e. Present management is satisfactory. f. Other criteria appropriate to the Environmental Statement area.
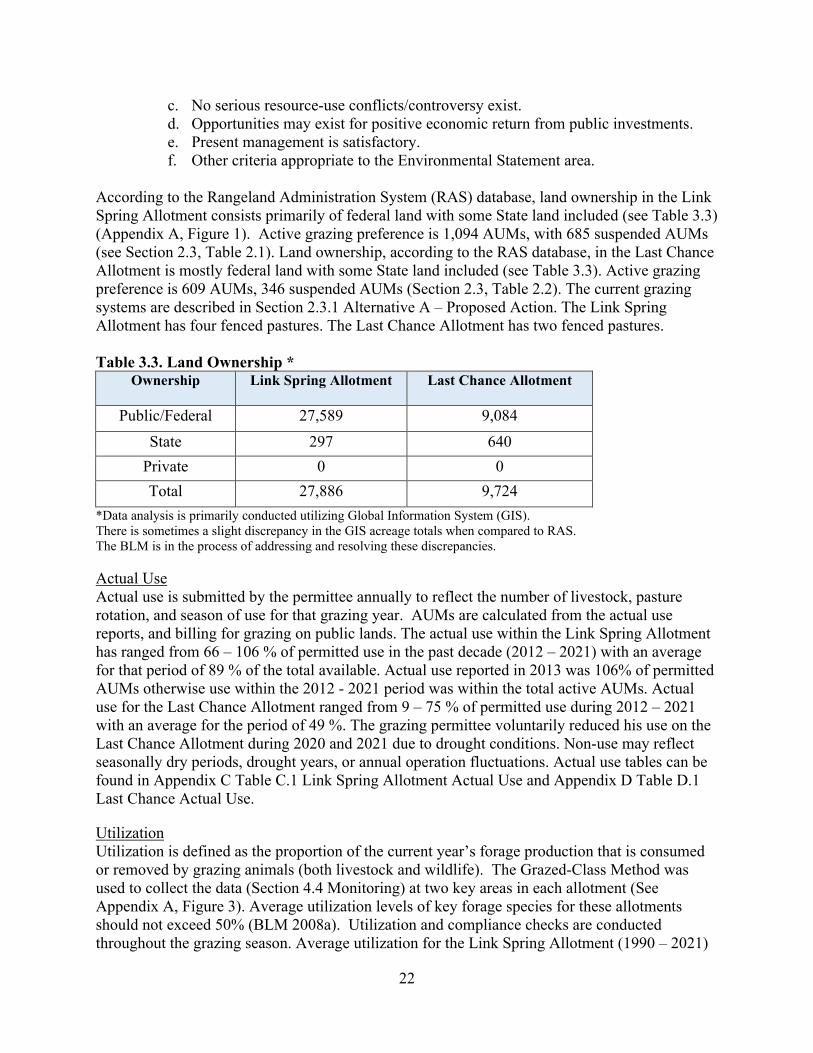
According to the Rangeland Administration System (RAS) database, land ownership in the Link Spring Allotment consists primarily of federal land with some State land included (see Table 3.3) (Appendix A, Figure 1). Active grazing preference is 1,094 AUMs, with 685 suspended AUMs (see Section 2.3, Table 2.1). Land ownership, according to the RAS database, in the Last Chance Allotment is mostly federal land with some State land included (see Table 3.3). Active grazing preference is 609 AUMs, 346 suspended AUMs (Section 2.3, Table 2.2). The current grazing systems are described in Section 2.3.1 Alternative A – Proposed Action. The Link Spring Allotment has four fenced pastures. The Last Chance Allotment has two fenced pastures. Table 3.3. Land Ownership *
Ownership Link Spring Allotment Last Chance Allotment
Public/Federal 27,589 9,084 State 297 640
Private 0 0 Total 27,886 9,724
*Data analysis is primarily conducted utilizing Global Information System (GIS). There is sometimes a slight discrepancy in the GIS acreage totals when compared to RAS. The BLM is in the process of addressing and resolving these discrepancies. Actual Use Actual use is submitted by the permittee annually to reflect the number of livestock, pasture rotation, and season of use for that grazing year. AUMs are calculated from the actual use reports, and billing for grazing on public lands. The actual use within the Link Spring Allotment has ranged from 66 – 106 % of permitted use in the past decade (2012 – 2021) with an average for that period of 89 % of the total available. Actual use reported in 2013 was 106% of permitted AUMs otherwise use within the 2012 - 2021 period was within the total active AUMs. Actual use for the Last Chance Allotment ranged from 9 – 75 % of permitted use during 2012 – 2021 with an average for the period of 49 %. The grazing permittee voluntarily reduced his use on the Last Chance Allotment during 2020 and 2021 due to drought conditions. Non-use may reflect seasonally dry periods, drought years, or annual operation fluctuations. Actual use tables can be found in Appendix C Table C.1 Link Spring Allotment Actual Use and Appendix D Table D.1 Last Chance Actual Use.
Utilization Utilization is defined as the proportion of the current year’s forage production that is consumed or removed by grazing animals (both livestock and wildlife). The Grazed-Class Method was used to collect the data (Section 4.4 Monitoring) at two key areas in each allotment (See Appendix A, Figure 3). Average utilization levels of key forage species for these allotments should not exceed 50% (BLM 2008a). Utilization and compliance checks are conducted throughout the grazing season. Average utilization for the Link Spring Allotment (1990 – 2021)
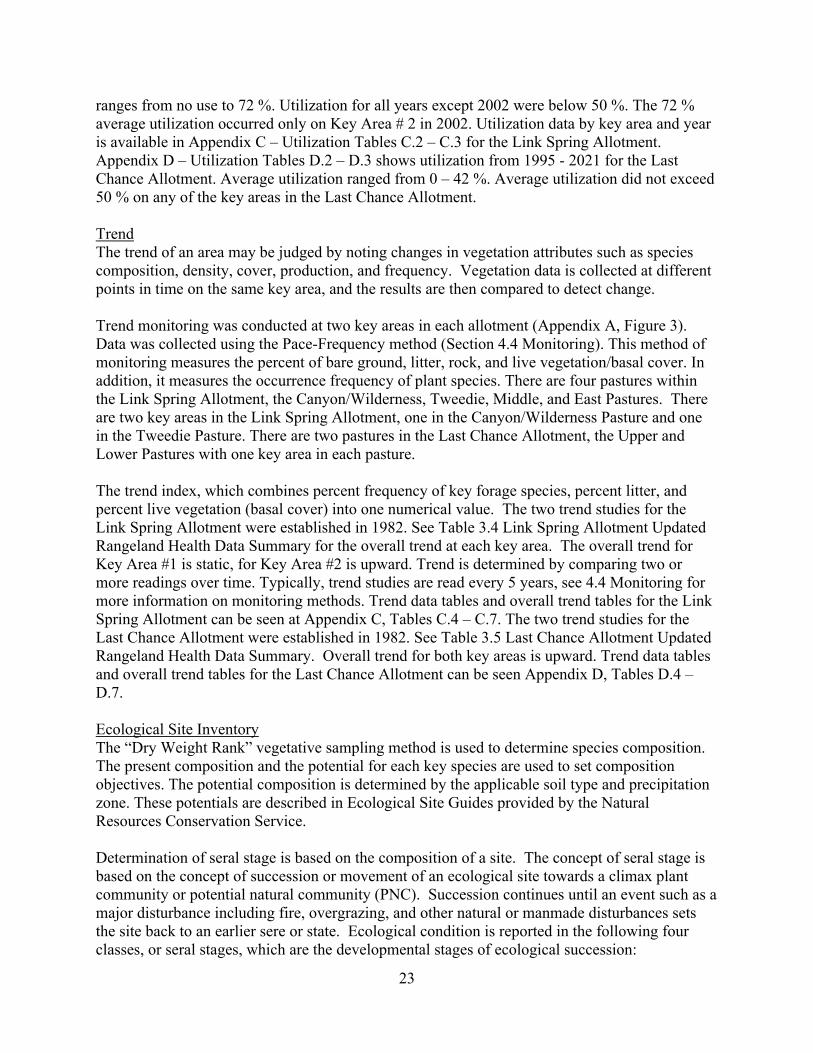
23
ranges from no use to 72 %. Utilization for all years except 2002 were below 50 %. The 72 % average utilization occurred only on Key Area # 2 in 2002. Utilization data by key area and year is available in Appendix C – Utilization Tables C.2 – C.3 for the Link Spring Allotment. Appendix D – Utilization Tables D.2 – D.3 shows utilization from 1995 - 2021 for the Last Chance Allotment. Average utilization ranged from 0 – 42 %. Average utilization did not exceed 50 % on any of the key areas in the Last Chance Allotment. Trend The trend of an area may be judged by noting changes in vegetation attributes such as species composition, density, cover, production, and frequency. Vegetation data is collected at different points in time on the same key area, and the results are then compared to detect change. Trend monitoring was conducted at two key areas in each allotment (Appendix A, Figure 3). Data was collected using the Pace-Frequency method (Section 4.4 Monitoring). This method of monitoring measures the percent of bare ground, litter, rock, and live vegetation/basal cover. In addition, it measures the occurrence frequency of plant species. There are four pastures within the Link Spring Allotment, the Canyon/Wilderness, Tweedie, Middle, and East Pastures. There are two key areas in the Link Spring Allotment, one in the Canyon/Wilderness Pasture and one in the Tweedie Pasture. There are two pastures in the Last Chance Allotment, the Upper and Lower Pastures with one key area in each pasture. The trend index, which combines percent frequency of key forage species, percent litter, and percent live vegetation (basal cover) into one numerical value. The two trend studies for the Link Spring Allotment were established in 1982. See Table 3.4 Link Spring Allotment Updated Rangeland Health Data Summary for the overall trend at each key area. The overall trend for Key Area #1 is static, for Key Area #2 is upward. Trend is determined by comparing two or more readings over time. Typically, trend studies are read every 5 years, see 4.4 Monitoring for more information on monitoring methods. Trend data tables and overall trend tables for the Link Spring Allotment can be seen at Appendix C, Tables C.4 – C.7. The two trend studies for the Last Chance Allotment were established in 1982. See Table 3.5 Last Chance Allotment Updated Rangeland Health Data Summary. Overall trend for both key areas is upward. Trend data tables and overall trend tables for the Last Chance Allotment can be seen Appendix D, Tables D.4 – D.7. Ecological Site Inventory The “Dry Weight Rank” vegetative sampling method is used to determine species composition. The present composition and the potential for each key species are used to set composition objectives. The potential composition is determined by the applicable soil type and precipitation zone. These potentials are described in Ecological Site Guides provided by the Natural Resources Conservation Service. Determination of seral stage is based on the composition of a site. The concept of seral stage is based on the concept of succession or movement of an ecological site towards a climax plant community or potential natural community (PNC). Succession continues until an event such as a major disturbance including fire, overgrazing, and other natural or manmade disturbances sets the site back to an earlier sere or state. Ecological condition is reported in the following four classes, or seral stages, which are the developmental stages of ecological succession:
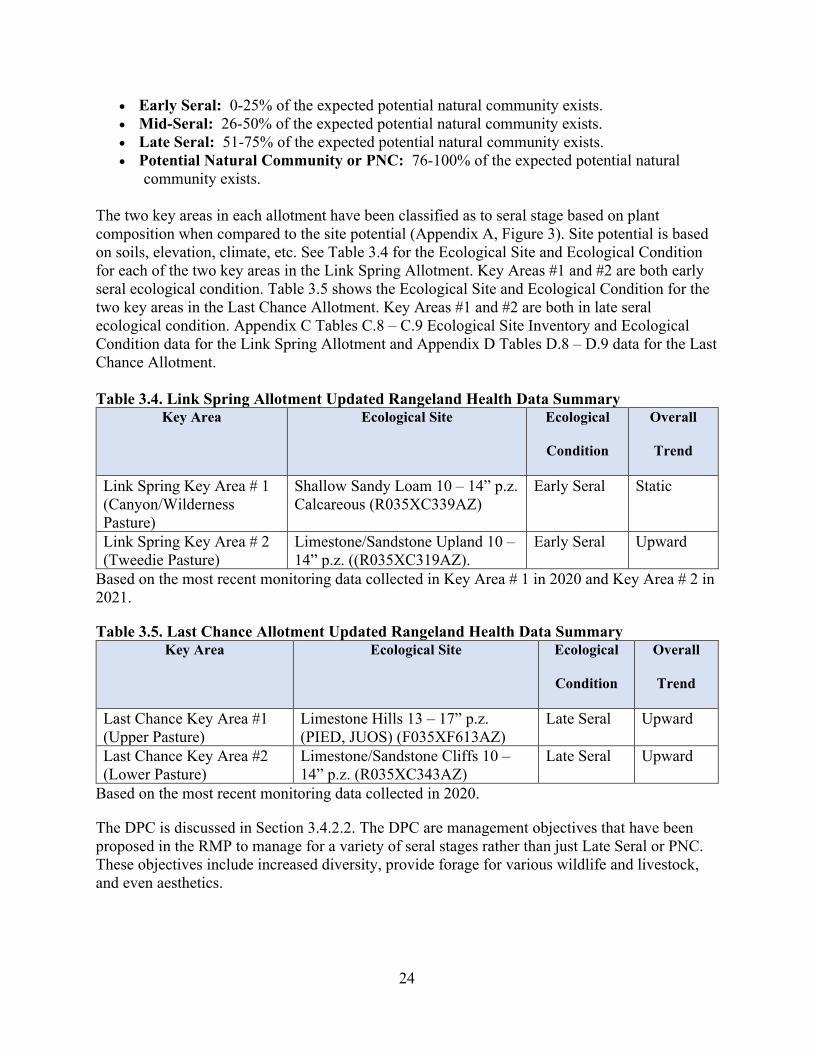
24
• Early Seral: 0-25% of the expected potential natural community exists. • Mid-Seral: 26-50% of the expected potential natural community exists. • Late Seral: 51-75% of the expected potential natural community exists. • Potential Natural Community or PNC: 76-100% of the expected potential natural
community exists. The two key areas in each allotment have been classified as to seral stage based on plant composition when compared to the site potential (Appendix A, Figure 3). Site potential is based on soils, elevation, climate, etc. See Table 3.4 for the Ecological Site and Ecological Condition for each of the two key areas in the Link Spring Allotment. Key Areas #1 and #2 are both early seral ecological condition. Table 3.5 shows the Ecological Site and Ecological Condition for the two key areas in the Last Chance Allotment. Key Areas #1 and #2 are both in late seral ecological condition. Appendix C Tables C.8 – C.9 Ecological Site Inventory and Ecological Condition data for the Link Spring Allotment and Appendix D Tables D.8 – D.9 data for the Last Chance Allotment. Table 3.4. Link Spring Allotment Updated Rangeland Health Data Summary
Key Area Ecological Site Ecological
Condition
Overall
Trend
Link Spring Key Area # 1 (Canyon/Wilderness Pasture)
Shallow Sandy Loam 10 – 14” p.z. Calcareous (R035XC339AZ)
Early Seral Static
Link Spring Key Area # 2 (Tweedie Pasture)
Limestone/Sandstone Upland 10 – 14” p.z. ((R035XC319AZ).
Early Seral Upward
Based on the most recent monitoring data collected in Key Area # 1 in 2020 and Key Area # 2 in 2021.
Table 3.5. Last Chance Allotment Updated Rangeland Health Data Summary Key Area Ecological Site Ecological
Condition
Overall
Trend
Last Chance Key Area #1 (Upper Pasture)
Limestone Hills 13 – 17” p.z. (PIED, JUOS) (F035XF613AZ)
Late Seral Upward
Last Chance Key Area #2 (Lower Pasture)
Limestone/Sandstone Cliffs 10 – 14” p.z. (R035XC343AZ)
Late Seral Upward
Based on the most recent monitoring data collected in 2020.
The DPC is discussed in Section 3.4.2.2. The DPC are management objectives that have been proposed in the RMP to manage for a variety of seral stages rather than just Late Seral or PNC. These objectives include increased diversity, provide forage for various wildlife and livestock, and even aesthetics.
25
3.4.1.1 Range Improvements Both allotments contain a number of existing structural range improvements as shown in Appendix F Tables F.1 – F.3 for the Link Spring Allotment and Tables F.4 – F.6 for the Last Chance Allotment (Appendix A, Figure 4). These range improvements consist of corrals, cattleguards, fences, reservoirs, catchments, troughs, and pipelines. No new structural range improvements are proposed for either allotment under any of the alternatives. Any range improvements proposed in the future would be considered through a separate NEPA process. Only maintenance of current range improvements would be allowed through an existing cooperative agreement. 3.4.2 Vegetation Including Invasive, Non-Native Plant Species Vegetation within the allotments falls broadly under the Mojave Transition and Colorado Plateau floristic provinces. Much of the project area is dominated by a mixture of juniper (Juniperus osteosperma), pinyon pine (Pinus edulis and Pinus monophylla) and shrubs such as cliffrose (Purshia mexicana) and blackbrush (Coleogyne ramosissima). The understory is characterized by a combination of cacti such as cholla (Cylindropuntia spp.), forbs such as globemallow (Sphaeralcea ambigua), and grasses such as squirreltail (Elymus elymoides). Various forms of yucca (primarily Yucca baccata) and blackbrush intergrade with the trees and shrubs typical of the Colorado Plateau floristic province. Blackbrush is also found as a near monoculture, primarily in the Last Chance Lower Pasture. The current zonation of dominant shrub or tree areas roughly corresponds to the expected Ecological Site Description (ESD) polygons available from USDA Soil Survey (Appendix A, Figure 3). Variations exist due in part to wildfires (Section 3.4.2.1) and invasive non-native plant species (Section 3.4.2.3). In general, the Rangeland Health Assessments for the two allotments in 2021 found, even in previously burned areas, multiple components of the expected plant diversity based on the best-case scenario described in the ESDs. Expected dominant or subdominant woody species occurred approximately as expected. Deviation from expected vegetative diversity, based on the ESDs, tended to occur due to greater species diversity of shrubs than expected, previous fire history and ongoing drought. One key area in the Limestone/Sandstone Cliffs 10-14" p.z. contained a greater variety of tree species than expected. All areas contained less than expected native grass and forb presence, however, signs indicate in previous years, this presence may have been greater. Limited monsoonal moisture is expected to have decreased the native grass and forb presence, though the native plant seedbank is expected to be largely intact. This project area, having encountered extreme to exceptional drought and spotty rainfall in 2020 and 2021 (NDMC 2022, Appendix E), would not be expected to produce many annual plants. In some locations, where some rainfall had occurred, plants surveyed in 2021 appeared somewhat green with some flowering. Long-lived trees, shrubs and cacti appeared largely dormant in 2021, though not severely damaged by the prolonged exceptional drought (no browned leaves or dominated by skeletal limbs). Burned areas, while dominated by cheatgrass (Bromus tectorum) retain, particularly on slopes in the Shallow Sandy Loam 10-14" p.z. Calcareous ESD, healthy, though drought-stressed, native shrubs and trees. This indicates that the Tweedy Complex (2005) and Hobble Complex (2012) fires did not severely alter soil characteristics in areas and
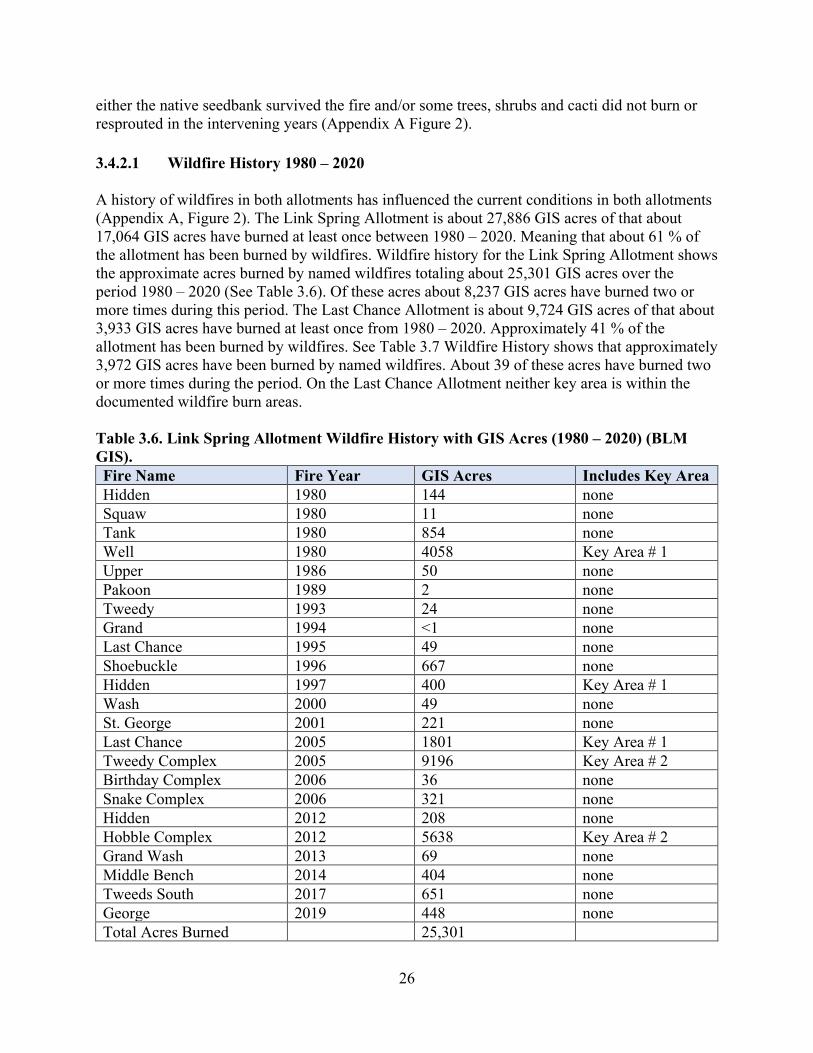
26
either the native seedbank survived the fire and/or some trees, shrubs and cacti did not burn or resprouted in the intervening years (Appendix A Figure 2). 3.4.2.1 Wildfire History 1980 – 2020 A history of wildfires in both allotments has influenced the current conditions in both allotments (Appendix A, Figure 2). The Link Spring Allotment is about 27,886 GIS acres of that about 17,064 GIS acres have burned at least once between 1980 – 2020. Meaning that about 61 % of the allotment has been burned by wildfires. Wildfire history for the Link Spring Allotment shows the approximate acres burned by named wildfires totaling about 25,301 GIS acres over the period 1980 – 2020 (See Table 3.6). Of these acres about 8,237 GIS acres have burned two or more times during this period. The Last Chance Allotment is about 9,724 GIS acres of that about 3,933 GIS acres have burned at least once from 1980 – 2020. Approximately 41 % of the allotment has been burned by wildfires. See Table 3.7 Wildfire History shows that approximately 3,972 GIS acres have been burned by named wildfires. About 39 of these acres have burned two or more times during the period. On the Last Chance Allotment neither key area is within the documented wildfire burn areas. Table 3.6. Link Spring Allotment Wildfire History with GIS Acres (1980 – 2020) (BLM GIS). Fire Name Fire Year GIS Acres Includes Key Area Hidden 1980 144 none Squaw 1980 11 none Tank 1980 854 none Well 1980 4058 Key Area # 1 Upper 1986 50 none Pakoon 1989 2 none Tweedy 1993 24 none Grand 1994 <1 none Last Chance 1995 49 none Shoebuckle 1996 667 none Hidden 1997 400 Key Area # 1 Wash 2000 49 none St. George 2001 221 none Last Chance 2005 1801 Key Area # 1 Tweedy Complex 2005 9196 Key Area # 2 Birthday Complex 2006 36 none Snake Complex 2006 321 none Hidden 2012 208 none Hobble Complex 2012 5638 Key Area # 2 Grand Wash 2013 69 none Middle Bench 2014 404 none Tweeds South 2017 651 none George 2019 448 none Total Acres Burned 25,301
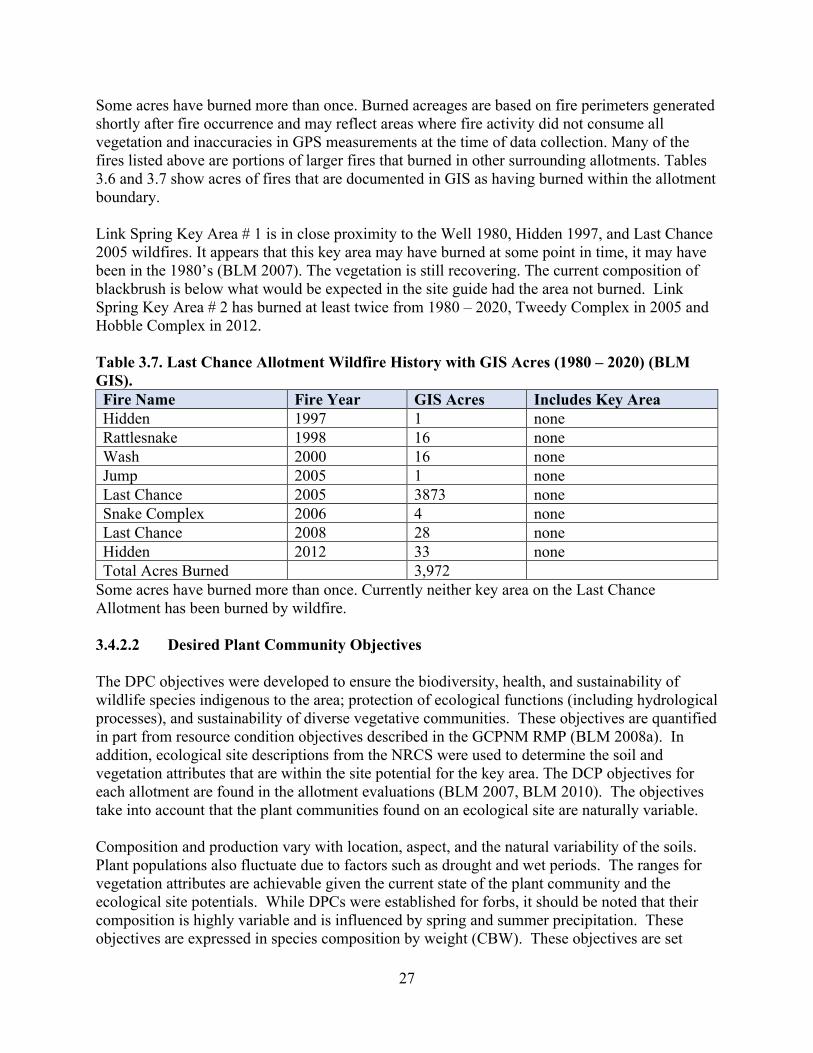
27
Some acres have burned more than once. Burned acreages are based on fire perimeters generated shortly after fire occurrence and may reflect areas where fire activity did not consume all vegetation and inaccuracies in GPS measurements at the time of data collection. Many of the fires listed above are portions of larger fires that burned in other surrounding allotments. Tables 3.6 and 3.7 show acres of fires that are documented in GIS as having burned within the allotment boundary. Link Spring Key Area # 1 is in close proximity to the Well 1980, Hidden 1997, and Last Chance 2005 wildfires. It appears that this key area may have burned at some point in time, it may have been in the 1980’s (BLM 2007). The vegetation is still recovering. The current composition of blackbrush is below what would be expected in the site guide had the area not burned. Link Spring Key Area # 2 has burned at least twice from 1980 – 2020, Tweedy Complex in 2005 and Hobble Complex in 2012. Table 3.7. Last Chance Allotment Wildfire History with GIS Acres (1980 – 2020) (BLM GIS). Fire Name Fire Year GIS Acres Includes Key Area Hidden 1997 1 none Rattlesnake 1998 16 none Wash 2000 16 none Jump 2005 1 none Last Chance 2005 3873 none Snake Complex 2006 4 none Last Chance 2008 28 none Hidden 2012 33 none Total Acres Burned 3,972
Some acres have burned more than once. Currently neither key area on the Last Chance Allotment has been burned by wildfire. 3.4.2.2 Desired Plant Community Objectives The DPC objectives were developed to ensure the biodiversity, health, and sustainability of wildlife species indigenous to the area; protection of ecological functions (including hydrological processes), and sustainability of diverse vegetative communities. These objectives are quantified in part from resource condition objectives described in the GCPNM RMP (BLM 2008a). In addition, ecological site descriptions from the NRCS were used to determine the soil and vegetation attributes that are within the site potential for the key area. The DCP objectives for each allotment are found in the allotment evaluations (BLM 2007, BLM 2010). The objectives take into account that the plant communities found on an ecological site are naturally variable. Composition and production vary with location, aspect, and the natural variability of the soils. Plant populations also fluctuate due to factors such as drought and wet periods. The ranges for vegetation attributes are achievable given the current state of the plant community and the ecological site potentials. While DPCs were established for forbs, it should be noted that their composition is highly variable and is influenced by spring and summer precipitation. These objectives are expressed in species composition by weight (CBW). These objectives are set
28
according to the ecological site guide and current composition at the site based on the most recent monitoring data. Link Spring Allotment See DPC Objectives Determination Tables, Appendix C, Tables C.11 – C.12. Below is a summary with the DPC Objectives for each key area and if the objectives are met based on the most recent monitoring data. See Appendix A, Figure 3 for map of key area locations. Link Spring Key Area #1 (Canyon/Wilderness Pasture) (Data table in Appendix C Table C.11 based on 2020 monitoring) Ecological Site: Shallow Sandy Loam 10 – 14” p.z. Calcareous (R035XC339AZ).
• Maintain Bouteloua curtipendula (sideoats grama) to between 1 and 2% CBW. • Increase Sporobolus cryptandrus (sand dropseed) to between 1 and 2% CBW. • Increase Elymus elymoides (Sitanion hystrix) (squirreltail) to between 1 and 3%
CBW. • Increase Purshia mexicana (Cowania mexicana) (Mexican cliffrose) to between 1
and 3% CBW. • Increase Ephedra (Ephedra viridis) (Mormon tea) to between 1 and 3% CBW. • Maintain forbs CBW to between 1 to 5%. • Maintain Live Vegetation (Basal Cover) to between 3 to 8%.
Based on 2020 monitoring, the DPC objectives were partially met at this key area. Live basal vegetation cover is met with 4 %. The shrub objective for Purshia mexicana was to increase it to 1 – 3 %, this objective was met and slightly exceeds at 4 % CBW. The objective for Ephedra viridis was not met. The objective for Bouteloua curtipendula was met and exceeds by 4 % CBW. The objective for Elymus elymoides, and Sporobolus cryptandrus was not met. The objective for forbs was not met. This area is currently in early seral ecological condition with a static overall trend (Table 3.4 Link Spring Allotment Updated Rangeland Health Data Summary). The IAT concluded that livestock grazing was not impeding achievement of objectives (BLM 2007). The results of wildfire and years of drought have slowed recovery. Rationale: The DPC objectives (BLM 2007) were to manage the site for mid-seral stage plant communities. The key species listed are the species recognized to be important for forage, watershed, and cover, and are components of the ecological site. Wildfires have burned through Key Area # 1 on or about 1980 (BLM 2007). There have been other documented wildfires close to this key area, see Table 3.6 Link Spring Allotment Wildfire History above. It was observed that some of the key area has burned and some is unburned. Some of the desired species are present in and around the key area see Table C.4 Trend Data Key Area # 1. Species like Ephedra viridis, Elymus elymoides, and Sporobolus cryptandrus, are present in the key area but are not in large enough quantities to be represented in the CBW. Currently Sporobolus cryptandrus is present with 3 % frequency. Over time, it is expected that these plants would increase in the key area. Prior to wildfires, according to the site guide Key Area #1 would have been a shrub plant community, dominated by blackbrush and other desert shrubs (cliffrose, Ephedra, and yucca). Trees would have been scattered increasing in population with elevation and cool aspect.
29
Perennial grasses would be very scattered and are primarily cool season. Forbs would also be infrequent (BLM 2007). Link Spring Key Area #2 – (Tweedie Pasture) (Data table in Appendix C Table C.12 based on 2021 monitoring) Ecological Site: Limestone/Sandstone Upland 10 – 14” p.z. (R035XC319AZ).
• Increase Bouteloua curtipendula (sideoats grama) to between 2 and 5% CBW. • Increase Sporobolus cryptandrus (sand dropseed) to between 1 and 5% CBW. • Maintain Pleuraphis jamesii (Hilaria jamesii) (James' galleta) to between 5 to 15%
CBW. • Increase Elymus elymoides (Sitanion hystrix) (squirreltail) to between 2 and 5% CBW. • Increase Purshia mexicana (Cowania mexicana) (Mexican cliffrose) to between 2 and
5% CBW. • Increase Ephedra (Mormon tea) to between 1 and 5% CBW. • Maintain the forbs CBW between 1 to 5%. • Maintain Live Vegetation (Basal Cover) to between 3 and 8%.
Based on the 2021 monitoring, DPC objectives are partially met at this key area. Live basal vegetation cover met the objective with 5 %. The objective for shrubs was not met. The objective for Sporobolus cryptandrus met and exceeded the objective. Pleuraphis jamesii did not meet the objective with 1 % CBW. The objective for other species of perennial grasses was not met. The objective for forbs was met with 1 % CBW for Sphaeralcea ambigua, an early seral forb. Link Spring Key Area # 2 has burned at least twice, in 2005 and again in 2012. See Table 3.6 Link Spring Allotment Wildfire History. It is currently in early seral condition with an upward overall trend recovering from those wildfires (Table 3.4 Link Spring Allotment Updated Rangeland Health Data Summary). Sporobolus cryptandrus (sand dropseed) is an early seral stage plant in disturbed areas and is extremely drought tolerant (Tilley, St. John, and Ogle 2009). The large CBW, 25 % of sand dropseed, is likely a response to wildfire. Recovery of shrub species is likely to be slow after repeated wildfires. There is currently 25 % of Achnatherum hymenoides, a cool season perennial grass, which is over the site guide composition level of 0 – 2 %. Rationale: Previous to the 2005 and 2012 wildfires Key Area # 2 was made up of mid and short grasses, palatable shrubs, and sagebrush. In the original plant community, there was a mixture of both cool and warm season grasses (BLM 2007). The site guide for this key area (Table C.9) shows that pre-wildfire the area would have been dominated by Artemisia tridentata ssp. wyomingensis (big sagebrush) with 70 – 85 %, currently it makes up 3 %. The effects of repeated wildfire accounts for the current early seral Ecological Condition at the key area. Trees would have made up 1- 20 %. Currently there are zero. Last Chance Allotment See the DPC Objectives Determination Tables, Appendix D, Tables D.11 – D.12. Below is a summary with the DPC Objectives for each key area and whether the objectives are met or not met based on the most recent monitoring data. See Appendix A, Figure 3 for map of key area locations.
30
Last Chance Key Area #1, (Upper Pasture) (Data table in Appendix D Table D.11 based on 2020 monitoring) Ecological Site: Limestone Hills 13 – 17” p.z. (PIED, JUOS) (F035XF613AZ).
• Increase Elymus elymoides (Sitanion hystrix) (squirreltail) to between 1 to 5% CBW. • Increase Poa fendleriana (muttongrass) to between 3 to 10% CBW. • Increase Stipa sp. (needlegrass) to between 0 to 3% CBW. • Maintain Purshia mexicana (Cowania mexicana) (Mexican cliffrose) between 5 to 10%
CBW. • Maintain Ephedra viridis (Mormon tea) between 0 to 5% CBW. • Maintain Fallugia paradoxa (Apache plume) between 2 to 10% CBW. • Maintain Eriogonum sp. (buckwheat) between 5 to 15% CBW. • Maintain Artemisia tridentata (big sagebrush) between 0 to 10% CBW. • Maintain Pinus edulis/Pinus monophylla (pinyon pine) and Juniperus osteosperma (Utah
juniper) between 0 to 5% CBW. Based on the 2020 monitoring, DPC objectives were partially met at this key area. Trees, which include Juniperus osteosperma, Pinus edulis, and Pinus monophylla, account for a total of 24% CBW which exceeds the objective of 0 – 5%. Artemisia tridentata, Eriogonum sp. each exceeds the objective for each species under shrubs. Fallugia paradoxa was not recorded at the key area when it was last read, not meeting the objective. Ephedra viridis and Purshia mexicana met the objective for each of these shrub species. For grass species, Elymus elymoides met the objective with 2 % CBW. Poa fendleriana did not meet the objective with 1%, the objective is 3 – 10%. Stipa sp. was not recorded at the key area in 2020, the objective for Stipa sp. ranges from 0 – 3% CBW. Elymus elymoides has increased from 0% CBW as documented in the 2010 Last Chance Allotment evaluation to 2% as of the most recent reading in 2020. Poa fendleriana also increased from 0% CBW to 1% in 2020. Rationale: When these DPC objectives were developed during the 2010 Last Chance Allotment evaluation, it was noted in that document that some of the objectives may only be attainable if some type of land treatment is completed in the future (BLM 2010). Future land/vegetation treatments could be designed to reduce composition of trees and sagebrush, Artemisia tridentata, which would open up this area and allow an increase in grass species and composition. Purshia mexicana, cliffrose, is currently at the upper limit of the objective for that species. If a vegetation treatment is proposed in the future in a separate NEPA document, treatment of the cliffrose could be considered to invigorate the cliffrose through targeted treatment. The IAT team concluded that livestock grazing is not a factor in DPC achievement at this key area; but progress toward attainment of objectives could be affected by future land treatments and/or drought which could reduce the CBW of trees and shrubs (BLM 2010). Key Area # 1 is currently in late seral ecological condition, see Table 3.5 Last Chance Allotment Updated Rangeland Health Data Summary. The DPC objectives would be managed for mid-seral ecological condition. To date, no land treatments have been implemented in this area or are planned for the reasonably foreseeable future. There is no record of this area having been burned by wildfire. Last Chance Key Area #2, (Lower Pasture) Ecological Site: Limestone/Sandstone Cliffs 10 – 14” p.z. (R035XC343AZ). (Data table in Appendix D Table D.12 based on 2020 monitoring)
31
Maintain Stipa sp. (needlegrass) between 0 to 5% CBW. Maintain Coleogyne ramosissima (blackbrush) between 80 to 95% CBW. Increase Ephedra viridis (Mormon tea) to between 1 to 3% CBW. Increase Purshia mexicana (Cowania mexicana) (Mexican cliffrose) to between 1 to 3% CBW. Maintain Fallugia paradoxa (Apache plume) between 0 to 3% CBW Based on 2020 monitoring DPC objectives are partially met at this key area. This site is and has been dominated by Coleogyne ramosissima, blackbrush. This key area was established in 1982. Since then, CBW of blackbrush has ranged from a low of 87% in 1995 to 95% in 2020. In this stable state, blackbrush will exclude other species. Currently Coleogyne ramosissima at 95% CBW is at the upper limit of the objective for the species. Objectives for Fallugia paradoxa and Stipa sp. were both at zero CBW but that fits within the range of 0 – 3 % for Fallugia paradoxa and Stipa sp. 0 – 5 %. Fallugia paradoxa, and Purshia mexicana are present in small numbers at the key area but are not in large enough quantities to be represented in the CBW. Needlegrass, Stipa sp., is also present in small amounts on the site but did not occur on the transect. Rationale: The historic native plant community (Ecological site Limestone/Sandstone Cliffs 10 – 14” p.z.) at Key Area # 2 developed in the absence of fire where blackbrush has had the opportunity to dominate the site. When this community burns it could become a mixed shrub community with perennial grasses and forbs (USDA 2020). According to wildfire history from 1980 – 2020 this area has not burned. The DPC objectives would manage Key Area # 2 as a late seral blackbrush community with blackbrush making up 80 – 95 % CBW. That objective has been met. Currently the key area is in late seral ecological condition with an upward overall trend see Table 3.5 Last Chance Allotment Updated Rangeland Health Data Summary. The IAT in the 2004 field tour wanted to see more green Mormon tea and cliffrose on the site and acknowledged that these objectives would never be met without some form of land treatment (BLM 2010). The IAT team also noted that there were areas just off the transect location, where cliffrose and green Mormon tea were more abundant. The IAT team agreed that livestock grazing was not the impeding factor in DPC achievement (BLM 2010). The long term dominance of blackbrush (from at least 1982 – 2020) at this site has not allowed the desired grass and other shrub species to attain the desired CBW, which is due to the lack of disturbances like wildfire. In conclusion at both key areas, the IAT suggested implementing a vegetative treatment (i.e., using fire) that would set both areas back to an early seral stage that would decrease pinyon-juniper and sagebrush meeting those DPC objectives at key area #1; but at key area #2 increasing green Mormon tea and cliffrose after fire would not be as easy because of lower precipitation. At both key areas after a vegetative treatment, attainment of the “other” DPC objectives because of the low precipitation would be questionable. Again, as mentioned above, those species identified as not meeting (requiring a vegetative treatment to push them towards meeting the DPC objectives) are already close to what they should be based on the site guide and considering the patchy nature of plants in the plant community as a whole (BLM 2010). Based on the 2020 and 2021 monitoring, DPC objectives were partially met at all the key areas in both allotments. DPC Objective Tables for the Link Spring Allotment Appendix C, Tables
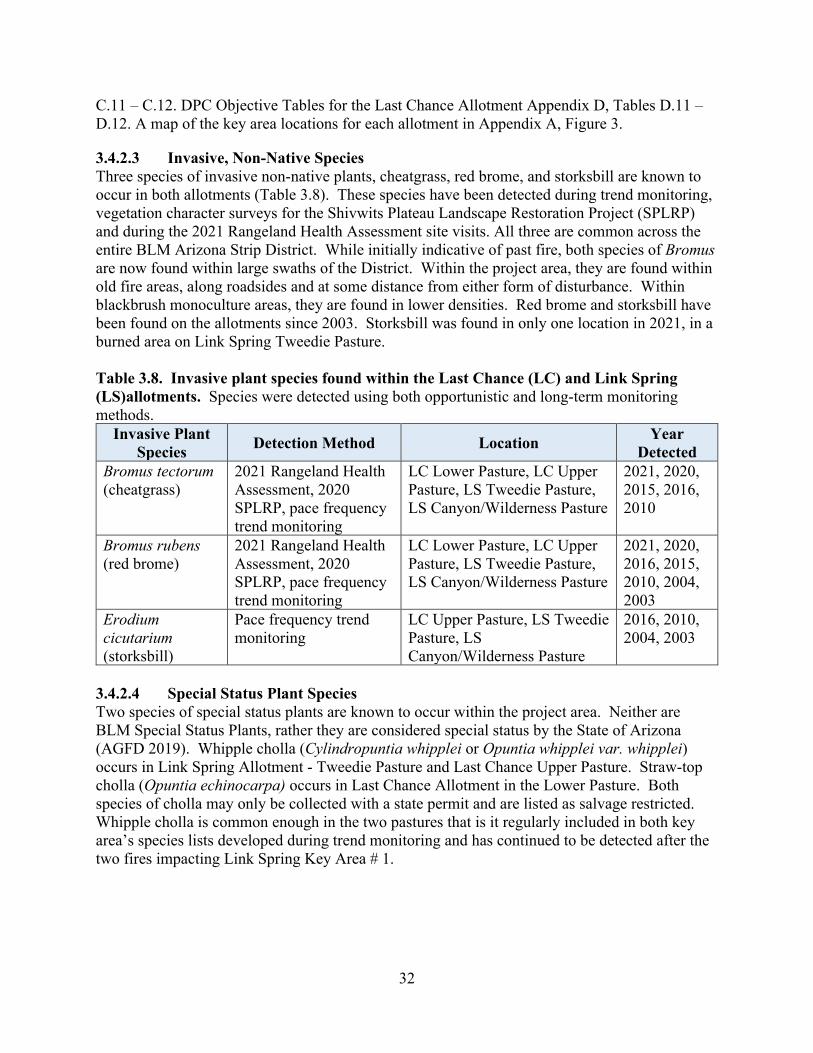
32
C.11 – C.12. DPC Objective Tables for the Last Chance Allotment Appendix D, Tables D.11 – D.12. A map of the key area locations for each allotment in Appendix A, Figure 3.
3.4.2.3 Invasive, Non-Native Species Three species of invasive non-native plants, cheatgrass, red brome, and storksbill are known to occur in both allotments (Table 3.8). These species have been detected during trend monitoring, vegetation character surveys for the Shivwits Plateau Landscape Restoration Project (SPLRP) and during the 2021 Rangeland Health Assessment site visits. All three are common across the entire BLM Arizona Strip District. While initially indicative of past fire, both species of Bromus are now found within large swaths of the District. Within the project area, they are found within old fire areas, along roadsides and at some distance from either form of disturbance. Within blackbrush monoculture areas, they are found in lower densities. Red brome and storksbill have been found on the allotments since 2003. Storksbill was found in only one location in 2021, in a burned area on Link Spring Tweedie Pasture. Table 3.8. Invasive plant species found within the Last Chance (LC) and Link Spring (LS)allotments. Species were detected using both opportunistic and long-term monitoring methods.
Invasive Plant Species Detection Method Location Year
Detected Bromus tectorum (cheatgrass)
2021 Rangeland Health Assessment, 2020 SPLRP, pace frequency trend monitoring
LC Lower Pasture, LC Upper Pasture, LS Tweedie Pasture, LS Canyon/Wilderness Pasture
2021, 2020, 2015, 2016, 2010
Bromus rubens (red brome)
2021 Rangeland Health Assessment, 2020 SPLRP, pace frequency trend monitoring
LC Lower Pasture, LC Upper Pasture, LS Tweedie Pasture, LS Canyon/Wilderness Pasture
2021, 2020, 2016, 2015, 2010, 2004, 2003
Erodium cicutarium (storksbill)
Pace frequency trend monitoring
LC Upper Pasture, LS Tweedie Pasture, LS Canyon/Wilderness Pasture
2016, 2010, 2004, 2003
3.4.2.4 Special Status Plant Species Two species of special status plants are known to occur within the project area. Neither are BLM Special Status Plants, rather they are considered special status by the State of Arizona (AGFD 2019). Whipple cholla (Cylindropuntia whipplei or Opuntia whipplei var. whipplei) occurs in Link Spring Allotment - Tweedie Pasture and Last Chance Upper Pasture. Straw-top cholla (Opuntia echinocarpa) occurs in Last Chance Allotment in the Lower Pasture. Both species of cholla may only be collected with a state permit and are listed as salvage restricted. Whipple cholla is common enough in the two pastures that is it regularly included in both key area’s species lists developed during trend monitoring and has continued to be detected after the two fires impacting Link Spring Key Area # 1.
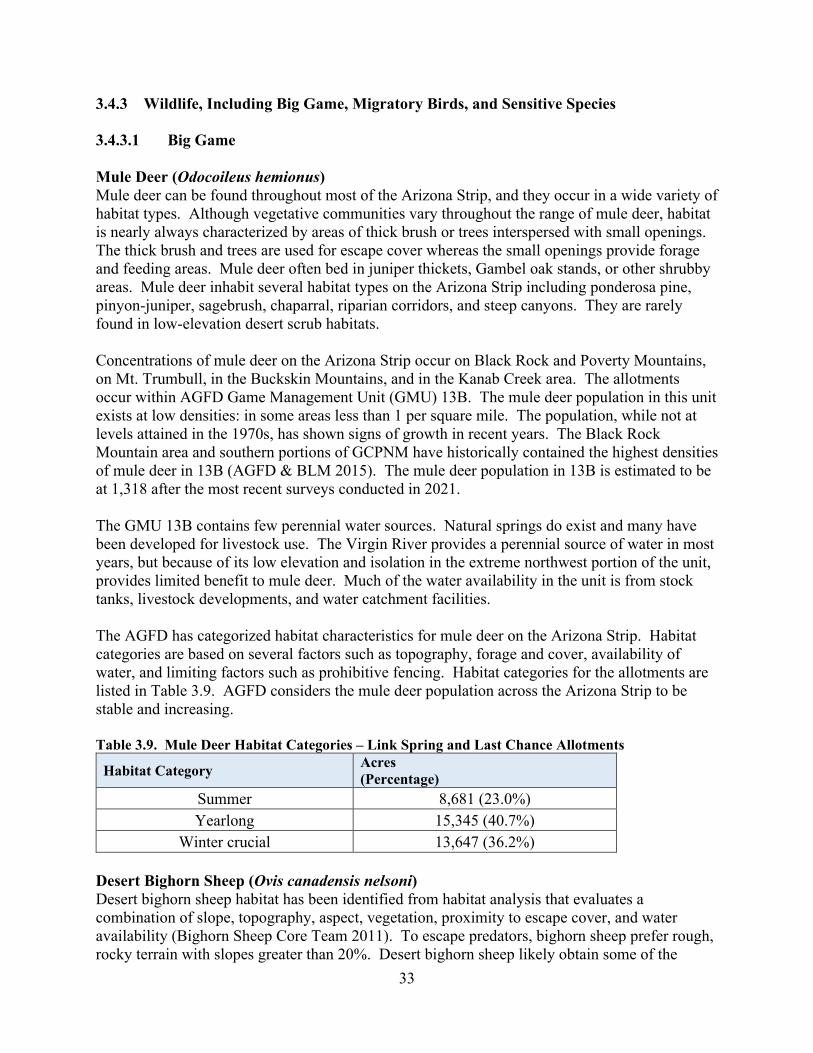
33
3.4.3 Wildlife, Including Big Game, Migratory Birds, and Sensitive Species 3.4.3.1 Big Game Mule Deer (Odocoileus hemionus) Mule deer can be found throughout most of the Arizona Strip, and they occur in a wide variety of habitat types. Although vegetative communities vary throughout the range of mule deer, habitat is nearly always characterized by areas of thick brush or trees interspersed with small openings. The thick brush and trees are used for escape cover whereas the small openings provide forage and feeding areas. Mule deer often bed in juniper thickets, Gambel oak stands, or other shrubby areas. Mule deer inhabit several habitat types on the Arizona Strip including ponderosa pine, pinyon-juniper, sagebrush, chaparral, riparian corridors, and steep canyons. They are rarely found in low-elevation desert scrub habitats. Concentrations of mule deer on the Arizona Strip occur on Black Rock and Poverty Mountains, on Mt. Trumbull, in the Buckskin Mountains, and in the Kanab Creek area. The allotments occur within AGFD Game Management Unit (GMU) 13B. The mule deer population in this unit exists at low densities: in some areas less than 1 per square mile. The population, while not at levels attained in the 1970s, has shown signs of growth in recent years. The Black Rock Mountain area and southern portions of GCPNM have historically contained the highest densities of mule deer in 13B (AGFD & BLM 2015). The mule deer population in 13B is estimated to be at 1,318 after the most recent surveys conducted in 2021. The GMU 13B contains few perennial water sources. Natural springs do exist and many have been developed for livestock use. The Virgin River provides a perennial source of water in most years, but because of its low elevation and isolation in the extreme northwest portion of the unit, provides limited benefit to mule deer. Much of the water availability in the unit is from stock tanks, livestock developments, and water catchment facilities. The AGFD has categorized habitat characteristics for mule deer on the Arizona Strip. Habitat categories are based on several factors such as topography, forage and cover, availability of water, and limiting factors such as prohibitive fencing. Habitat categories for the allotments are listed in Table 3.9. AGFD considers the mule deer population across the Arizona Strip to be stable and increasing. Table 3.9. Mule Deer Habitat Categories – Link Spring and Last Chance Allotments
Habitat Category Acres (Percentage)
Summer 8,681 (23.0%) Yearlong 15,345 (40.7%)
Winter crucial 13,647 (36.2%) Desert Bighorn Sheep (Ovis canadensis nelsoni) Desert bighorn sheep habitat has been identified from habitat analysis that evaluates a combination of slope, topography, aspect, vegetation, proximity to escape cover, and water availability (Bighorn Sheep Core Team 2011). To escape predators, bighorn sheep prefer rough, rocky terrain with slopes greater than 20%. Desert bighorn sheep likely obtain some of the
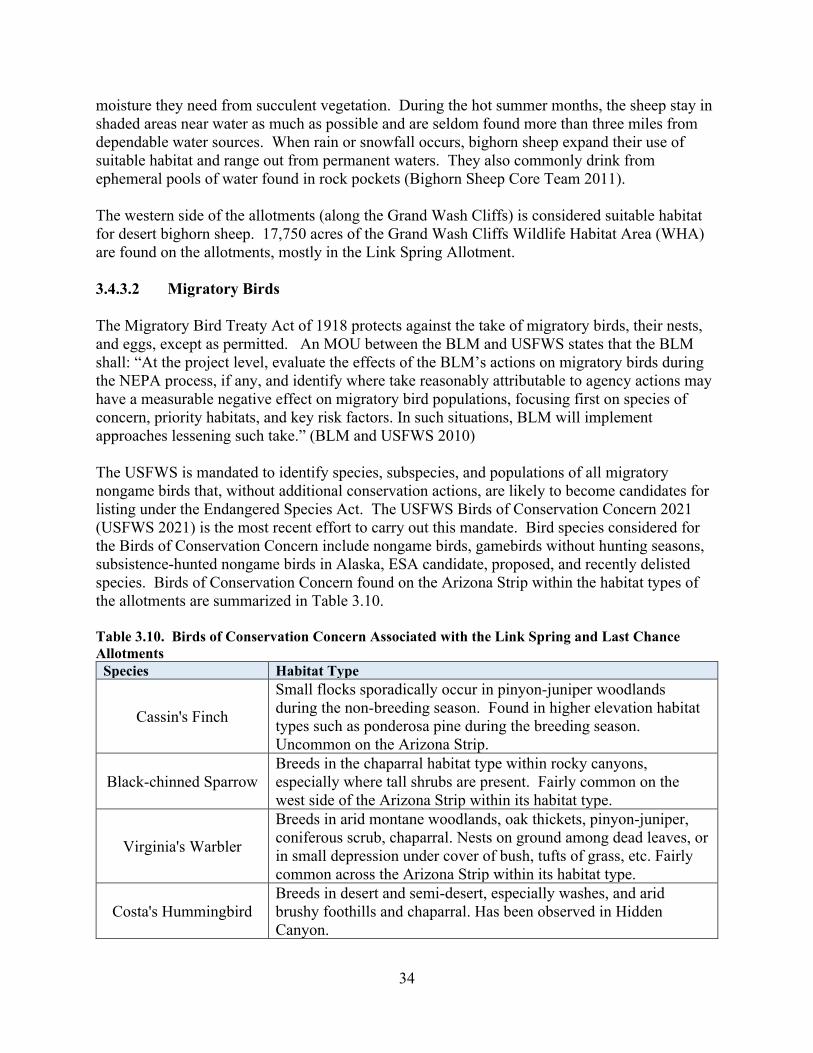
34
moisture they need from succulent vegetation. During the hot summer months, the sheep stay in shaded areas near water as much as possible and are seldom found more than three miles from dependable water sources. When rain or snowfall occurs, bighorn sheep expand their use of suitable habitat and range out from permanent waters. They also commonly drink from ephemeral pools of water found in rock pockets (Bighorn Sheep Core Team 2011). The western side of the allotments (along the Grand Wash Cliffs) is considered suitable habitat for desert bighorn sheep. 17,750 acres of the Grand Wash Cliffs Wildlife Habitat Area (WHA) are found on the allotments, mostly in the Link Spring Allotment. 3.4.3.2 Migratory Birds The Migratory Bird Treaty Act of 1918 protects against the take of migratory birds, their nests, and eggs, except as permitted. An MOU between the BLM and USFWS states that the BLM shall: “At the project level, evaluate the effects of the BLM’s actions on migratory birds during the NEPA process, if any, and identify where take reasonably attributable to agency actions may have a measurable negative effect on migratory bird populations, focusing first on species of concern, priority habitats, and key risk factors. In such situations, BLM will implement approaches lessening such take.” (BLM and USFWS 2010) The USFWS is mandated to identify species, subspecies, and populations of all migratory nongame birds that, without additional conservation actions, are likely to become candidates for listing under the Endangered Species Act. The USFWS Birds of Conservation Concern 2021 (USFWS 2021) is the most recent effort to carry out this mandate. Bird species considered for the Birds of Conservation Concern include nongame birds, gamebirds without hunting seasons, subsistence-hunted nongame birds in Alaska, ESA candidate, proposed, and recently delisted species. Birds of Conservation Concern found on the Arizona Strip within the habitat types of the allotments are summarized in Table 3.10. Table 3.10. Birds of Conservation Concern Associated with the Link Spring and Last Chance Allotments
Species Habitat Type
Cassin's Finch
Small flocks sporadically occur in pinyon-juniper woodlands during the non-breeding season. Found in higher elevation habitat types such as ponderosa pine during the breeding season. Uncommon on the Arizona Strip.
Black-chinned Sparrow Breeds in the chaparral habitat type within rocky canyons, especially where tall shrubs are present. Fairly common on the west side of the Arizona Strip within its habitat type.
Virginia's Warbler
Breeds in arid montane woodlands, oak thickets, pinyon-juniper, coniferous scrub, chaparral. Nests on ground among dead leaves, or in small depression under cover of bush, tufts of grass, etc. Fairly common across the Arizona Strip within its habitat type.
Costa's Hummingbird Breeds in desert and semi-desert, especially washes, and arid brushy foothills and chaparral. Has been observed in Hidden Canyon.
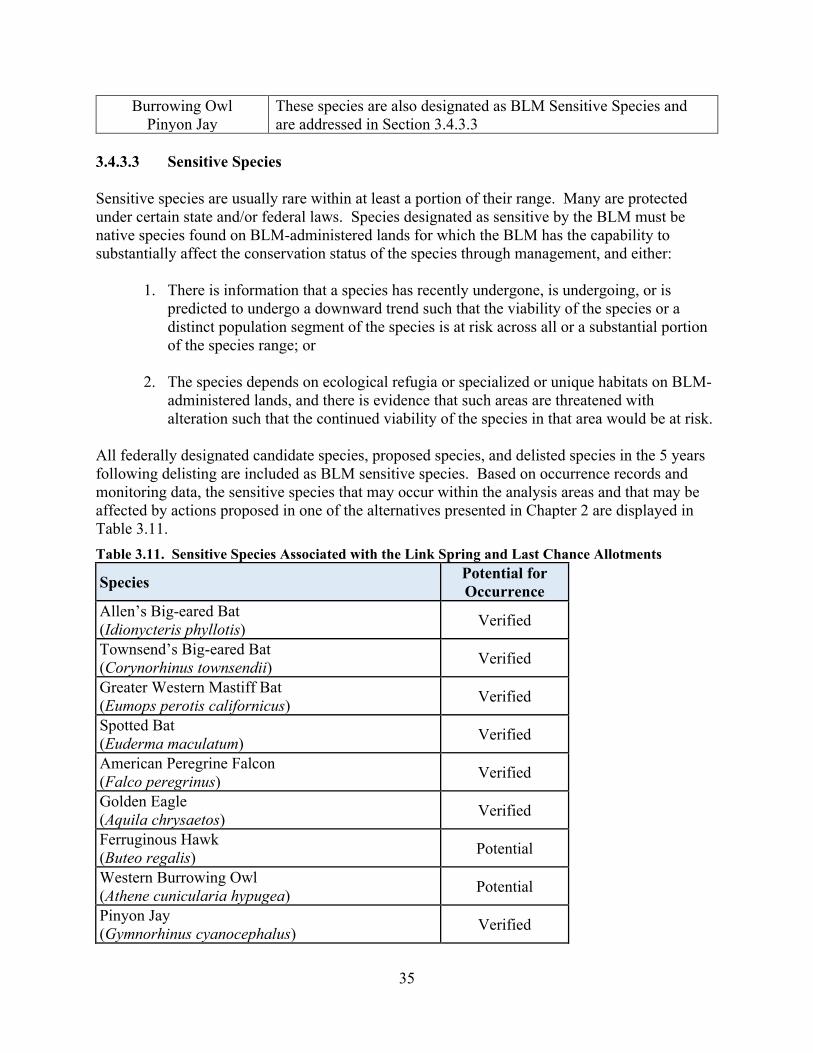
35
Burrowing Owl Pinyon Jay
These species are also designated as BLM Sensitive Species and are addressed in Section 3.4.3.3
3.4.3.3 Sensitive Species Sensitive species are usually rare within at least a portion of their range. Many are protected under certain state and/or federal laws. Species designated as sensitive by the BLM must be native species found on BLM-administered lands for which the BLM has the capability to substantially affect the conservation status of the species through management, and either:
1. There is information that a species has recently undergone, is undergoing, or is predicted to undergo a downward trend such that the viability of the species or a distinct population segment of the species is at risk across all or a substantial portion of the species range; or
2. The species depends on ecological refugia or specialized or unique habitats on BLM-
administered lands, and there is evidence that such areas are threatened with alteration such that the continued viability of the species in that area would be at risk.
All federally designated candidate species, proposed species, and delisted species in the 5 years following delisting are included as BLM sensitive species. Based on occurrence records and monitoring data, the sensitive species that may occur within the analysis areas and that may be affected by actions proposed in one of the alternatives presented in Chapter 2 are displayed in Table 3.11. Table 3.11. Sensitive Species Associated with the Link Spring and Last Chance Allotments
Species Potential for Occurrence
Allen’s Big-eared Bat (Idionycteris phyllotis) Verified
Townsend’s Big-eared Bat (Corynorhinus townsendii) Verified
Greater Western Mastiff Bat (Eumops perotis californicus) Verified
Spotted Bat (Euderma maculatum) Verified
American Peregrine Falcon (Falco peregrinus) Verified
Golden Eagle (Aquila chrysaetos) Verified
Ferruginous Hawk (Buteo regalis) Potential
Western Burrowing Owl (Athene cunicularia hypugea) Potential
Pinyon Jay (Gymnorhinus cyanocephalus) Verified
36
Monarch Butterfly (Danaus plexippus) Potential
Additional sensitive species may also occur within the analysis areas. However, it has been determined by BLM wildlife biologists that these species would not be affected by actions proposed in this EA. These species are therefore not addressed further in this document. Table 3.12 lists the sensitive species that will not be discussed in further detail, along with the rationale for their exclusion from further analysis. Additionally, impacts to sensitive species found outside the analysis areas were not analyzed. Table 3.12. Sensitive Species Excluded From Further Analysis
Species Rationale for Excluding from Further Analysis
House Rock Valley Chisel-toothed Kangaroo Rat (Dipodomys microps
leucotis)
This species is endemic to the House Rock Valley on the eastern side of the Arizona Strip and is not present within (or near) the allotments.
Northern Leopard Frog (Lithobates pipiens)
This species has a limited range on the Arizona Strip and currently only occupies Soap Creek Tank on the Paria Plateau and possibly Kanab Creek. Habitat for this species is not present in or near the allotments.
Arizona Toad (Anaxyrus microscaphus)
Found on the Arizona Strip only along the Virgin River and tributaries. Habitat for this species is not present in or near the allotments.
Bald Eagle (Haliaeetus leucocephalus)
Bald eagles may be found in the project area during the winter months. Carrion and easily scavenged prey items provide important sources of winter food in terrestrial habitats that are away from open water, such as in the allotments. The proposed action and alternatives would have no impact on carrion food sources. No nests are located on the Arizona Strip and nesting habitat (large trees near bodies of water) is non-existent.
Northern Goshawk (Accipiter gentilis)
Northern goshawks are found in coniferous forests in the northern, north-central, and eastern parts of the state at elevations ranging between 4,750 to 9,120 feet. Habitat for this species is not present in or near the allotments.
Native Fish (5 species) These species are restricted to the Virgin River, Paria River, and Kanab Creek. Habitat for these species does not occur within or near the allotments.
Spring Snails (4 species) These species are restricted to very small ranges at spring sites along the Virgin River and are not present within or near the allotments.
Allen’s Big-eared Bat (Idionycteris phyllotis) Allen’s big-eared bat usually inhabits forested areas of the mountainous southwest and is relatively common in pine-oak forested canyons and coniferous forests; however, it also may occur in non-forested, arid habitats. At most sites where this species occurs, cliffs, outcroppings, boulder piles, or lava flows are found nearby. Day roosts may include rock shelters, caves, trees,
37
and mines. Their elevational distribution ranges from 1,320 to 9,800 feet, and their main food source is small moths gleaned from surfaces or in flight (AGFD 2001). These bats are known to use stock ponds as water and food sources but are theorized as too large-bodied to drink from water catchments (Herder 1996). The allotments contain pinyon-juniper woodlands and semi-arid habitats that occur near cliffs and outcroppings. Allen’s big-eared bats are found throughout the Arizona Strip and likely occupy the allotments. The presence of livestock reservoirs in the allotments may attract Allen’s big-eared bats for drinking and foraging opportunities. Townsend’s Big-eared Bat (Corynorhinus townsendii) In Arizona, summer day roosts are found in caves and mines from desert scrub up to woodlands and coniferous forests. Night roosts may often be in abandoned buildings. In winter, they hibernate in cold caves, lava tubes and mines mostly in uplands and mountains from the vicinity of the Grand Canyon to the southeastern part of the state (AGFD 2003a). These bats prefer to hang from open ceilings in caves or mines and do not use crevices. Townsend’s big-eared bats are found throughout the Arizona Strip and likely occupy the allotments, especially those areas that are located in pinyon-juniper woodlands (Sherwin et al. 2000). The presence of livestock reservoirs may attract Townsend’s big-eared bats for drinking and foraging opportunities. Suitable roosting and hibernacula sites may be present in Hidden Canyon where there are abandoned mines. Greater Western Mastiff Bat (Eumops perotis californicus) Found in desert scrub near cliffs, preferring rugged rocky canyons with abundant crevices. They prefer crowding into tight crevices a foot or more deep and two inches or more wide. Colonies prefer crevices even deeper, to ten or more feet. These bats prefer to wedge themselves in the backs of cracks or crevices where they narrow down considerably. Entrances to roosting crevices are usually horizontal but facing downward which facilitates entry and exit (AGFD 2002b). They are known to forage at least 15 miles from the nearest likely roosting sites. Suitable roosting sites for greater western mastiff bats may be found on the west side of the allotments. The presence of livestock reservoirs may attract greater western mastiff bats for drinking and foraging opportunities, especially given the long distances they travel from roost sites. Spotted Bat (Euderma maculatum) Spotted bats are found from low desert in southwestern Arizona to high desert and riparian habitats in northwestern Arizona and Utah to conifer forests in northern Arizona and other western states. They are found in desert scrub, riparian, pinyon-juniper, and montane coniferous forests at elevations up to 8,670 feet. They roost in small cracks found in cliffs and stony outcrops. They forage on large flying insects, primarily moths (AGFD 2003b). The allotments contain extensive pinyon-juniper woodlands as well as numerous high cliffs and rocky outcrops which may provide suitable roosting habitat. The presence of livestock reservoirs may attract spotted bats for drinking and foraging opportunities.
38
American Peregrine Falcon (Falco peregrinus anatum) Peregrine falcons utilize areas that range in elevation from sea level to 9,000 feet and breed wherever sufficient prey is available near cliffs. Preferred habitat for peregrine falcons consists of steep, sheer cliffs that overlook woodlands, riparian areas, and other habitats that support a high density of prey species. Nest sites are usually associated with water. In Arizona, peregrine falcons now occur in areas that had previously been considered marginal habitat, suggesting that populations in optimal habitats are approaching saturation (AGFD 2002a). Nesting sites, also called eyries, usually consist of a shallow depression scraped into a ledge on the side of a cliff. Peregrine falcons are aerial predators that usually kill their prey in the air. Birds comprise the most common prey item, but bats are also taken (AGFD 2002a). Potential nesting habitat is found along the steep cliff faces and canyons in the western section of the allotments. Golden Eagle (Aquila chrysaetos) Golden eagles are typically found in open country, prairies, arctic and alpine tundra, open wooded country, and barren areas, especially in hilly or mountainous regions. Black-tailed jackrabbits and rock squirrels are the main prey species taken (Eakle and Grubb 1986). Carrion also provides an important food source, especially during the winter months. Nesting occurs on rock ledges, cliffs, or in large trees. Several alternate nests may be used by one pair and the same nests may be used in consecutive years or the pair may shift to an alternate nest site in different years. In Arizona they occur in mountainous areas and vacate desert areas after breeding. Nests were observed at elevations between 4,000 and 10,000 feet. Nests are commonly found on cliff ledges; however, ponderosa pine, junipers, and rock outcrops are also used as nest sites. Golden eagles forage over a large area and utilize the allotments for hunting and scavenging. Potential and historic nesting sites are found along the steep cliff faces along the western boundary of the allotments. Ferruginous Hawk (Buteo regalis) Ferruginous hawks are large hawks that inhabit the grasslands, deserts, and open areas of western North America – they are the largest North American hawk and are often mistaken for eagles due to their size. Ferruginous means “rusty color” and refers to the bird’s colored wings and legs. During the breeding season, they prefer grasslands, sagebrush, and other arid shrub country. Nesting occurs in trees or utility poles surrounded by open areas. Mammals generally comprise 80 to 90 percent of the prey items or biomass in the diet with birds being the next most common mass component. Ferruginous hawks may use open areas within the allotments, especially during the winter when they are fairly common in the area. Nesting habitat is available especially in areas where lone trees are located among wide areas of open country. Western Burrowing Owl (Athene cunicularia hypugea) Burrowing owls occupy a wide variety of open habitats including grasslands, deserts, or open shrublands. Burrowing owls do not dig their own burrows and must rely on existing burrows
39
dug by prairie dogs, ground squirrels, badgers, skunks, coyotes, and foxes but will also use manmade and other natural openings. Nest-site fidelity is high and burrows are often reused for several years if not destroyed (Haug et al. 1993). Moderate grazing can have a beneficial impact on burrowing owl habitat by keeping grasses and forbs low (MacCracken 1985) but the control of burrowing rodent colonies in grazed areas is believed to be an important factor in the burrowing owl’s decline (Desmond and Savidge 1996). Burrowing owls can be generally tolerant of some human presence, often nesting in close proximity to urban or suburban areas in agricultural fields, vacant lots, golf courses, or areas cleared for construction (AGFD 2009). Burrowing owls are infrequently encountered on the Arizona Strip likely due to the lack of prairie dog or other large rodent colonies. Burrowing owl habitat is present in the allotments, but nesting attempts have not been documented. Pinyon Jay (Gymnorhinus cyanocephalus) The pinyon jay is a medium-sized corvid that inhabits much of the intermountain west and is particularly associated with pinyon-juniper ecosystems. Pinyon jays are highly social birds that nest communally and form large flocks that may number into the hundreds. Pinyon jays harvest seeds of pinyon pine, and to a lesser extent ponderosa and limber pine, during the fall and cache these seeds for use in late winter and early spring when other food sources are scarce (Balda & Bateman 1971). Caches are often located in areas that receive little snow, such as under pine and juniper tree crowns or on south slopes where snow melts early, allowing the caches to be accessible during late winter and early spring (Wiggins 2005). Spatial memory is highly developed in pinyon jays and cache relocation is efficient and reliable (Stotz & Balda 1995). Seeds that are not relocated and consumed will often germinate and contribute to pinyon pine regeneration. Pinyon jay habitat preferences include mosaics of large tracts of pinyon-juniper woodlands especially those areas that contain large, mature, seed-producing pinyon pines, and relatively open structure with mixed shrubs (especially sagebrush) and grasses (Latta et al. 1999). One nesting colony of pinyon jays typically requires an area of about 230 acres for nesting and about 5,120 acres for total home range (Balda & Bateman 1971). Pinyon jays place nests in roughly equal proportions in pinyon and juniper trees and usually select trees that are substantially taller and larger in diameter when compared to random plots (Johnson et al. 2015). Pinyon-juniper woodlands are extensive in the allotments and likely support multiple nesting colonies of pinyon jays, although nests have not been documented. Monarch Butterfly (Danaus plexippus) Monarch butterflies breed throughout the United States, absent only from the forests of the Pacific Northwest. Breeding densities are highest from the east coast to the Great Plains, with typically low densities in the western states. Migration corridors are found east of the Rocky Mountains, in the Great Basin, and within California. Wintering areas are located along the California coast and in Mexico (Jepsen et al. 2015). Over the past 20 years a 90% decline in wintering monarchs has been detected in Mexico along with a 50% decline noted in California, leading to a petition for listing under the Endangered Species Act. The USFWS found that listing the monarch butterfly as an endangered or threatened species is warranted but precluded
40
by higher priority actions to amend the Lists of Endangered and Threatened Wildlife and Plants (USFWS 2020). Monarch larvae feed exclusively on 27 species of milkweed which can be found in a variety of habitats such as rangelands, agricultural areas, riparian zones, wetlands, deserts, and woodlands. In the western U.S., the two most important larval food sources are narrow-leaved milkweed (Asclepias fascicularis) and showy milkweed (A. speciosa). Adult monarchs forage on a wide variety of flowering plants for nectar during migration periods (Brower et al. 2006). Monarchs may breed in low numbers within the allotments, although documentation is lacking. Milkweed species are present, including showy milkweed. Migrating monarchs have been observed on the Arizona Strip in the fall in areas outside of the allotments.
41
CHAPTER 4 4.0 ENVIRONMENTAL CONSEQUENCES
Introduction The potential consequences or effects of each alternative are discussed in this chapter. Only impacts that may result from implementing the alternatives are described in this EA. If an ecological component is not discussed, it is because BLM resource specialists considered effects to the component and determined that the alternatives would have minimal or no effects (see Table 3.2). The intent of this analysis is to provide the scientific and analytical basis for the environmental consequences. Impacts are defined as modifications to the existing condition of the environment and/or probable future condition that would be brought about by implementation of one of the alternatives. Impacts can be direct or indirect; direct impacts are those effects that are caused by the action or alternative and occur at the same time and place, while indirect effects are those effects that are caused by or would result from an alternative and are later in time but that are still reasonably certain to occur. Cumulative effects are generally assessed using the environmental impacts of past, present, or reasonably foreseeable future actions within the project areas.
Direct and Indirect Impacts
4.2.1 Livestock Grazing The impact analysis area for livestock grazing is the Link Spring and Last Chance Allotments. 4.2.1.1 Direct and Indirect Impacts of Alternative A. The Proposed Action would directly affect the grazing permittee on the Link Spring Allotment and the Last Chance Allotment by renewing the ten-year term grazing permits with no changes to either authorization except to update the terms and conditions (2.3.2 Grazing System - Link Spring Allotment and Last Chance Allotment - Other Terms and Conditions). The action would issue a new term grazing permit for each allotment that would result in no changes to the season of use or to the kind of livestock. There would be no proposed change in the total number of AUMs 7 authorized for each allotment limited to the current active preference and suspended AUMs (Table 2.1 and 2.2). The current grazing permittee is the same for each authorization. The permittee wants to continue to have two separate grazing authorizations and does not want to combine the two authorizations or the two allotments. This action would maintain the current level of livestock grazing authorized for each authorization, which would result in a continued viable ranching operation for the livestock operator and provide some degree of stability for the permittee’s livestock operation (Table 2.1
7 An AUM, or Animal Unit Month, is a unit of measurement indicating how much forage is eaten by a cow/calf pair in one month.
42
and 2.2). Allowable use on key forage species would remain at 50 % for each allotment. When 50% forage utilization is reached, livestock would be moved to another pasture or off the allotment completely. Permit renewal would also meet the purpose and need for action identified in Chapter 1 of this EA – to provide for livestock grazing opportunities on public lands where consistent with meeting management objectives, including the Arizona Standards for Rangeland Health and Guidelines for Livestock Grazing Management (Appendix B) and the GCPNM RMP (BLM 2008a), and respond to applications to fully process and renew permits to graze livestock on public land. The permittee uses the two allotments together rotating the cattle through the pastures of both allotments. This gives him the ability to rest pastures or allotments from year to year. Both allotments have year around seasons of use so there is the flexibility to use some pastures in the summer, particularly the higher elevation pasture in the Last Chance Allotment, but most years both allotments are rested during the summer. Most years cattle are removed in May and do not return until November, allowing growing season rest from June through October. This would allow the vegetation to grow and set seed without grazing pressure. Grazing in the fall resumes after seed shatter. Based on recent monitoring the Link Spring (Appendix C) and Last Chance (Appendix D) Allotments continue to make progress toward meeting the standards for rangeland health (Section 3.2.3 Land Health Evaluation). Grazing authorized under Alternative A would be expected to continue making progress toward meeting the standards for rangeland health (Appendix B). 4.2.1.2 Direct and Indirect Impacts of Alternative B- No Grazing This alternative would negatively affect the livestock grazing permittee on the Link Spring and Last Chance Allotments by not authorizing any active preference under the term grazing permits. The action would cancel the current level of livestock grazing numbers and season of use authorized. This would not provide current or future use, stability, and compatibility for the permittee’s livestock operation because he would not be authorized to use the allotment. This would force him to seek alternate arrangements for his livestock, such as leasing private pasture or obtaining a different federal grazing permit on a different allotment which would be challenging, and potentially economically not feasible. It would most likely put this livestock operation out of business. This alternative would not meet the purpose and need for action identified in Chapter 1– to provide for livestock grazing opportunities on public lands where consistent with meeting management objectives, including the Arizona Standards for Rangeland Health and Guidelines for Livestock Grazing Management (Appendix B), as well as the GCPNM RMP (BLM 2008a), and the need to respond to applications to fully process and renew permits to graze livestock on public land.
43
4.2.2 Vegetation Including Invasive, Non-Native Plant Species 4.2.2.1 Direct and Indirect Impacts of Alternative A. Under this alternative, the impacts of grazing on vegetation seen during the previous grazing permit would continue for an additional ten years. The Last Chance allotment most likely would continue to show an upward trend, while the Link Spring allotment would continue in a static or upward trend depending on pasture, toward attaining the prescribed DPCs. Any large-scale changes in vegetation would be through wildfire or vegetation treatments. No vegetation treatments are proposed under this alternative. The diversity of plant species encountered during monitoring, even during drought, indicate that current grazing levels and conditions have not significantly impacted, or limited, the potential species diversity, as suggested by the ESD. The complex topography of the project area continues to provide plant and seedbank refugia from fire, cattle, and browsers such as mule deer. In combination, cattle have not been allowed to overgraze (remove all plants) within the allotments, enabling enough local seed production and regeneration to maintain expected plant diversity. Burned areas would likely continue to repopulate with native plants while being dominated by Bromus spp., as they have with current grazing patterns in conjunction with the wildfire behavior. The project area has three extremely common and pervasive invasive non-native plant species. Continued grazing is not expected to increase their spread. Given the local dominance of this plant in multiple areas, it is expected to continue spreading into areas where it has not yet been detected, regardless of the use of the allotment by cattle. If other invasive species are encountered, invasive plant management on GCPNM works with the permittees to allow for the treatment of spatially confined non-native plants such as Scotch thistle. Monitoring for new invasive plant populations is ongoing at GCPNM and treatment is part of existing BLM Arizona Strip District policy. The two-salvage restricted Arizona special status species would not be negatively impacted by the continuation of grazing. No new range improvements (ground disturbance) are including in the proposed action, so there is no need to consider salvaging plants. The cholla have been consistently present in the project area since at least 2004 and would not be expected to be removed through grazing. 4.2.2.2 Direct and Indirect Impacts of Alternative B- No Grazing Under this alternative, BLM would reissue ten-year term grazing permits on the authorization #0201581 Link Spring Allotment and/or authorization #0201966 Last Chance Allotment with zero authorized AUMs for active preference – all AUMs would be suspended. As with Alternative A – Proposed Action, vegetation would likely continue an upward trend toward DPC objectives on the Last Chance allotment and a static or upward trend on the Link Spring allotment, depending on pasture. Shifts in species dominance, would be determined primarily through impacts from wildfire, climatic conditions, and past landscape disturbance. It is unknown if Alternative B would have a beneficial impact on vegetation. Numerous studies have found positive effects, negative effects, and no effects when managed grazing was removed. Positive outcomes appear to be based on current vegetative community characteristics,
44
history of the area, and the presence and density of invasive non-native plant species (Davies 2014). Un-grazed plants may seed more than currently, increasing the seedbank and increasing the rate at which the allotments DPC trend increases. This reproductive increase, however, would be highly dependent on climatic condition influencing the adult plant’s development and health. It was noted in the 2010 Land Health Evaluation treatment of cliffrose in Last Chance Upper Pasture may be considered in the future. Removal of grazing would not substitute for treatment, as the reinvigoration of cliffrose typically involves reducing the above ground biomass. Alternative B would have a negligible impact on invasive species. As was noted in Section 4.2.2.1, invasive plant management is ongoing and would not be curtailed by this alternative. Removal of grazing would not change in any substantial way the occurrence or distribution of invasive non-native plants in the allotments. Alternative B would also have a negligible impact on the two Arizona special status plant species. Since these species are of concern with ground disturbance, and Alternative B does not propose any, the cholla would be unaffected by the decrease in AUMs to zero. 4.2.3 Wildlife, Including Big Game, Migratory Birds, and Sensitive Species. 4.2.3.1 Direct and Indirect Impacts of Alternative A. Herbaceous vegetation provides forage and concealment cover for wildlife species, particularly during the spring breeding period when fawning, nesting, and rearing of young occurs. Livestock grazing reduces the height and amount of herbaceous vegetation. The presence of livestock and the movement of livestock between areas of use could result in the direct disturbance or displacement of some wildlife from preferred habitats, nesting/birthing sites, or water sources. Both the disturbance and displacement of wildlife and the reduction of herbaceous forage and cover could limit the productivity and reproductive success of some species. However, the livestock grazing proposed in Alternative A allows the permittee to use the two allotments together rotating the cattle through the pastures of both allotments. This gives the ability to rest pastures or allotments from year to year. Using seasonal deferment and rest-rotation, vegetation would continue a static to upward trend, and therefore wildlife habitat components would be maintained or improved. Big Game Mule deer The presence of livestock and the trailing of livestock between use areas could displace small numbers of mule deer from preferred habitats and/or water sources. However, given that deer on the allotments are likely habituated to the presence of livestock, this displacement would only be temporary. Properly managed livestock grazing is designed to cause minimal impacts to rangeland resources. Rotating the season of use among pastures would provide periodic rest for vegetation to help maintain plant vigor. The current livestock management regime on the allotment has been in place for many years; it is therefore expected that livestock grazing proposed under this
45
alternative would minimally affect habitat for mule deer. Since utilization on vegetation is limited to 50% on the allotments, competition for forage between livestock and deer should be minimal. Bighorn Sheep The rugged and steep nature of bighorn sheep habitat limits contact between sheep and livestock to a few areas within the allotments. The majority of habitat used by desert bighorn sheep in the allotments is essentially ungrazed due to its steep nature and resulting inaccessibility to livestock. Since utilization on vegetation is limited to 50% on the allotments, competition for forage should be minimal. Migratory Birds The current livestock management regime on the allotment has been in place for many years; it is therefore expected that livestock grazing proposed under this alternative would minimally affect habitat for migratory birds. Since utilization on vegetation is limited to 50% on the allotments, competition for forage between livestock and seed-eating migratory birds should be minimal and composition of grasses and palatable shrubs is considered high, leaving adequate resources for insect prey populations. Sensitive Species Bats Properly managed livestock grazing is designed to cause minimal impacts to rangeland resources, including vegetation that may serve as habitat for the insects that bats prey upon. Utilization on vegetation is limited and composition of grasses and palatable shrubs is considered high, leaving adequate resources for insect populations. Livestock grazing also would not affect roost sites or hibernacula since these sites tend to be inaccessible to livestock. Implementation of this alternative is therefore unlikely to measurably impact any sensitive bat species known or suspected to occur within the allotment. Peregrine Falcon and Golden Eagle Nesting sites for peregrine falcons or golden eagles would not be impacted by livestock within the allotment because these sites are located on ledges in cliff faces that are inaccessible to livestock. Prey species for peregrine falcons, such as mourning doves, generally do well in human altered environments including grazed areas. Habitat for golden eagle prey species, such as black-tailed jackrabbits, could be adversely impacted if overutilization occurs. However, the effects of moderate grazing (such as that proposed under this alternative) can be negligible to slightly beneficial for many prey species (Olendorff 1993). Vegetation in the allotment is sufficient to provide food and shelter requirements for populations of prey species. Habitat for prey species would be minimally affected because grazing under this alternative provides periodic rest for the plant communities. Disturbance to nest sites from livestock management operations is unlikely given the remote and inaccessible locations these species choose for nesting. Implementation of this alternative is not likely to impact peregrine falcon or golden eagle habitat or nesting success.
46
Ferruginous hawk Nesting sites and habitat for ferruginous hawk prey species have the potential to be impacted by livestock grazing within the allotment. Isolated nest trees used by this species could be impacted through rubbing of the trunk or by damaging the root system from congregations of cattle seeking shade; however, the likelihood of damaging these nest trees is minimal. Habitat for prey species, such as black-tailed jackrabbits, could be adversely impacted if overutilization occurs. However, the effects of moderate grazing (such as proposed under this alternative) can be negligible to slightly beneficial for many prey species (Olendorff 1993). Vegetation in the allotments is sufficient to provide food and shelter requirements for populations of prey species for the ferruginous hawk. Ferruginous hawks are sensitive to human disturbance near the nest site; however, no documented nests occur within the allotment so disturbance at nest sites would be sporadic and would not lead to a trend toward listing. Burrowing owl Nesting burrows for burrowing owls could potentially be impacted by livestock within the allotment through trampling. However, burrowing owls prefer open country with sparse vegetation and often do well in moderately grazed areas. Prey species are numerous in the allotment and include small mammals, insects, and reptiles. Vegetation in the allotments is sufficient to provide food and shelter requirements for populations of prey species. Disturbance to nest sites from livestock management operations may occur but this species is known to tolerate moderate levels of human disturbance (Klute et al. 2003). Implementation of grazing under this alternative would result in relatively minor impacts to burrowing owl habitat or potential nesting success in the allotments. Pinyon Jay While the potential effects of livestock grazing on pinyon jays are unclear, the policy of removing pinyon-juniper woodlands to promote grazing has resulted in habitat loss in several southwestern states (Wiggins 2005). However, no pinyon-juniper removals are proposed under this alternative, therefore impacts to nesting areas, tree canopy, or food sources would be negligible and similar to those described above for migratory birds. Monarch Butterfly Livestock grazing can alter the structure, diversity, and growth pattern of vegetation, which can affect the associated insect community. Grazing during a time when flowers are already scarce may result in insufficient forage for the monarch butterfly. Recommended grazing BMPs (USDA 2015) for monarch butterflies and other pollinators include:
• Protect the current season’s growth in grazed areas by striving to retain at least 50% of the annual vegetative growth on all plants.
• Minimize livestock concentrations in one area by rotating livestock grazing timing and location to help maintain open, herbaceous plant communities that are capable of supporting a wide diversity of butterflies and other pollinators.
47
These actions are incorporated into the proposed grazing systems for the allotments under this alternative. Implementation of grazing under this alternative would therefore result in relatively minor impacts to monarch butterflies and their habitat in the allotments. 4.2.3.2 Direct and Indirect Impacts of Alternative B – No Grazing Under this alternative, no livestock grazing would occur so plants would only be minimally grazed (by wildlife) and vegetative structure would remain intact. Vegetation would therefore have the most rest and recovery as compared to the Proposed Action. Since this alternative would result in the least grazing on vegetation, plants would have the maximum amount of energy compounds in their stems for survival and reproduction, and plant communities would continue to provide sufficient forage for mule deer, prey species, and habitat components for migratory birds. In addition, since no livestock would be present on the allotments, no potential for displacement of wildlife from preferred habitats and/or water sources would occur. Existing livestock water improvements would not be maintained and would deteriorate over time, leaving fewer water sources available to wildlife within the allotments.
Cumulative Impacts “Cumulative impacts” are those impacts resulting from the incremental impact of an action when added to other past, present, or reasonably foreseeable actions regardless of what agency or person undertakes such other actions. This EA is intended to qualify and quantify the impacts to the environment that result from the incremental impact of the alternatives when added to other past, present, and reasonably foreseeable future actions. These impacts can result from individually minor but collectively important actions taking place over a period of time. Specific actions that have occurred, are occurring, or are likely to occur in the reasonably foreseeable future include:
• Livestock grazing – Livestock grazing in the region has evolved and changed considerably since it began in the 1860s and is one factor that has created the current environment – livestock grazing has occurred in the area for 150+ years. The Link Spring and Last Chance Allotments and the adjacent BLM-administered land are active grazing allotments. Each of these allotments is managed under a grazing system that is documented and described in an AMP. Cumulative impacts to livestock grazing are discussed in Section 4.3.1.
• Recreation – Recreation activities occurring throughout the project area involve a broad spectrum of pursuits ranging from dispersed and casual recreation to organized, BLM-permitted group uses. Typical recreation in the region includes off-highway vehicle (OHV) driving, scenic driving, hunting, hiking, wildlife viewing, horseback riding, camping, backpacking, mountain biking, geocaching, picnicking, night-sky viewing, and photography. The GCPNM is known for its large-scale undeveloped areas and remoteness, which provide an array of recreational opportunities for users who wish to experience primitive and undeveloped recreation, as well as those seeking more organized or packaged recreation experiences.
• Wildland fire – There is always a risk of wildfire from both human causes and natural causes such as lightening, which is a possibility especially with summer monsoon season or during extended drought. See Section 3.4.2.1 Wildfire History above for a discussion of the
48
wildfire history of both allotments. Wildfire will continue to have an impact to vegetation on these allotments, and surrounding areas on the GCPNM. It is likely that there will be new wildfire starts sometime in the future.
4.3.1 Cumulative Impacts to Livestock Grazing The cumulative impact analysis area for livestock grazing is the Link Spring and Last Chance Allotments. Livestock grazing in the region has evolved and changed considerably since it began in the 1860s and is one factor that has created the current environment. At the turn of the century, large herds of livestock grazed on unreserved public domain in uncontrolled open range. Eventually, the range was stocked beyond its capacity, causing changes in plant, soil, and water relationships. Some speculate that the changes were permanent and irreversible, turning plant communities from grass and herbaceous species to brush and trees. Protective vegetative cover was reduced, and more runoff brought erosion, rills, and gullies. In response to these problems, livestock grazing reform began in 1934 with the passage of the Taylor Grazing Act. Subsequent laws, regulations, and policy changes have resulted in adjustments in livestock numbers, season-of-use changes, and other management changes. Given the past experiences with livestock impacts on public land resources, as well as the cumulative impacts that could occur on the larger ecosystem from grazing on various public and private lands in the region, management of livestock grazing is an important factor in ensuring the protection of public land resources. Past, present, and reasonably foreseeable actions within the analysis area would continue to influence range resources, watershed conditions and trends. The impact of actions such as voluntary livestock reductions during dry periods and implementation of a grazing system have improved range conditions. The net result has been greater species diversity, improved plant vigor, and increased ground cover from grasses and forbs. In the long-term, as the population of the surrounding area increases (which would increase the use of public lands), conflicts between livestock grazing and these other uses could arise. Resolving conflicts may require adjustments and/or restrictions placed on livestock grazing management. Other factors also influence livestock grazing operations, such as climatic and market fluctuations. A six-year drought in the region occurred between 1998 and 2004, which dramatically affected livestock grazing operations on the Arizona Strip, resulting in virtually all cattle being pulled from the public lands in 2004. Similar fluctuations in livestock numbers would likely occur in the future. The effects on livestock grazing in the Link Spring and Last Chance Allotments have been analyzed under the “Direct and Indirect Effects” section 4.2.1 of this chapter. In addition to livestock grazing, there are a wide variety of uses and activities occurring on the lands within and adjacent to the allotment, as described above. Since livestock grazing occurs throughout the area and on adjacent private lands, it is reasonable to assume that impacts similar to those identified earlier in this chapter would occur elsewhere in the area. This additive impact may affect wildlife habitat or corridors and the greater ecosystems by altering vegetation associations or decreasing water quality. These systems and the health of the region as a whole are important
49
for the survival of many native species. Consultation with AGFD in regard to renewal of livestock grazing permits did not identify any issues directly related to livestock grazing beyond those already discussed above. It is therefore anticipated that none of the alternatives would result in cumulative impacts to livestock grazing when added to other past, present, and reasonably foreseeable activities in the area. 4.3.2 Cumulative Impacts to Vegetation Including Invasive, Non-Native Plant Species The cumulative impact analysis area is the Link Spring and Last Chance Allotments plus a one-mile buffer zone around the allotment boundaries. The two alternatives considered in this document represent a negligible impact on the vegetation community and composition both within the Link Spring and Last Chance allotments and the surrounding cumulative impact analysis area. The primary impacts, in decreasing importance, to vegetation are climatic variability and wildfire. Each of these has been discussed previously in this document. A 10-year grazing permit, with or without AUMs, would not be included on the primary impact list. Stipulations within the permit provide a mechanism to keep grazing from adversely interacting with climatic variability, such as drought, which could negatively impact the vegetative community. Similarly, the permit is written to prevent overgrazing. Link Spring allotment is within the boundary of the Shivwits Plateau Landscape Restoration Project. Under that project, no vegetation treatments were proposed for Link Spring due to the topography (prevalence of steep slopes and cliffs), presence of vegetative communities that generally do not react well to landscape level manipulation (Mojave Transition vegetation) and general vegetative health of the allotment. Burned areas appear to be on a positive native plant trajectory. Neither alternative would alter the decision to not treat Link Spring allotment at this time. Invasive plant management within the analysis area is ongoing. Ultimately, none of the alternatives would adversely affect invasive plant management or greatly aid the dispersal of invasive plants. Since there are no known novel invasive plants within the allotments, nothing proposed within this document would change the invasive plant species known to occur in the cumulative impact analysis area. 4.3.3 Cumulative Impacts to Wildlife The cumulative impact analysis area for wildlife species is the Link Spring and Last Chance Allotments plus a three-mile buffer zone around the allotment boundaries. Actions that contribute cumulatively to the overall disturbance to wildlife and wildlife habitat include livestock grazing, recreation activities, and wildfire. Past livestock grazing resulted in the degradation of wildlife habitat from overgrazing and the introduction of invasive plant species. Livestock grazing in the region has evolved and changed considerably since the 1860s. At the turn of the previous century, large herds of livestock grazed in uncontrolled open range, causing changes in plant, soil, and water relationships. In response, livestock grazing reform began in 1934 with passage of the Taylor Grazing Act. Subsequent laws, regulations, and policy changes have resulted in adjustments in livestock numbers, season-of-use changes, and other management changes. Grazing continues in the analysis area, and is
50
managed such that ecological condition of the area is good and all land health standards are being met or are progressing toward being met. Recreational pursuits, particularly OHV use, have caused disturbance to most all species and their habitats. With the increase in local populations has come a dramatic increase in the level of OHV use, resulting in increased disturbance, injury, and mortality to wildlife, particularly ground dwelling species with low mobility. Transportation corridors exist through the habitat of virtually all species found within the analysis area. Impacts vary by species and by the location, level of use, and speed of travel over the road. Wildfire could play a large role in the quality of habitat in the analysis area. Burned areas are slow to recover and the disturbance often results in an increase in non-native annual grasses. These non-native plants are often the fine fuels that carry the fire making burned areas more likely to burn again in the future. It is anticipated that the Proposed Action would continue to have incremental cumulative impacts to wildlife, particularly when added to other past, present, and reasonably foreseeable activities in the area. However, none of these impacts are anticipated to be significant.
Monitoring Long Term: Long term monitoring studies are scheduled to be read at the key areas by the BLM every five years (Appendix A, Figure 3). Frequency, cover, and composition data are collected using the pace frequency and dry-weight-rank (DWR) methods to measure achievement of standards for rangeland health and detect changes in resource conditions. This data is also used to determine whether the allotment is meeting the DPC Objectives established for each key area. DWR method of data collection would be used to monitor species composition. In addition, Pace Frequency and Step-Point studies would be used at each key area to detect changes of individual species and vegetative cover, which indicates a trend and status of basal and foliar cover. The DWR and pace frequency study methods are described in Sampling Vegetation Attributes, Interagency Technical Reference 1734-4 (BLM 1999b). Short Term: Livestock use on key forage plants is determined annually by conducting grazing utilization studies using the Grazed-Class Method as described in the Utilization Studies and Residual Measurements Interagency Technical Reference 1734-3 (BLM 1999a). All monitoring data would be used to evaluate current management of the allotments and assist the BLM in making management decisions that help achieve vegetation objectives. Other information to be collected and compiled is precipitation, actual use, etc. All monitoring data would be used to evaluate current management and assist BLM in making management decisions that helps achieve vegetation objectives on the allotment. Annual allotment compliance would be included in monitoring of this allotment. Compliance monitoring would assure terms and conditions of the permit are being met. Compliance checks would also monitor any special conditions or mitigation included in Cooperative Agreements, Section 4 Permits, or other grazing regulations.

51
The monitoring addressed above is sufficient to identify changes in vegetation because of livestock grazing activities. In addition to those methods described, there are efforts in place to inventory for noxious weed establishment, as well as monitor treated areas for treatment effectiveness. Known weed sites would be retreated as needed.
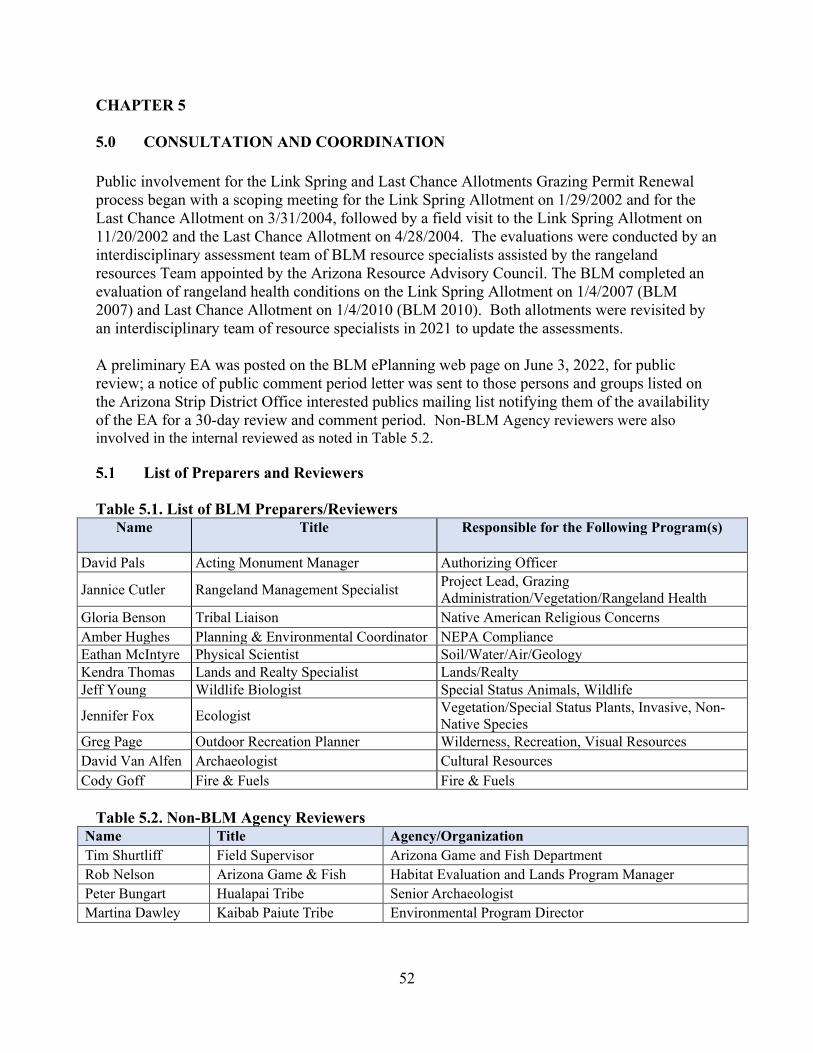
52
CHAPTER 5 5.0 CONSULTATION AND COORDINATION Public involvement for the Link Spring and Last Chance Allotments Grazing Permit Renewal process began with a scoping meeting for the Link Spring Allotment on 1/29/2002 and for the Last Chance Allotment on 3/31/2004, followed by a field visit to the Link Spring Allotment on 11/20/2002 and the Last Chance Allotment on 4/28/2004. The evaluations were conducted by an interdisciplinary assessment team of BLM resource specialists assisted by the rangeland resources Team appointed by the Arizona Resource Advisory Council. The BLM completed an evaluation of rangeland health conditions on the Link Spring Allotment on 1/4/2007 (BLM 2007) and Last Chance Allotment on 1/4/2010 (BLM 2010). Both allotments were revisited by an interdisciplinary team of resource specialists in 2021 to update the assessments. A preliminary EA was posted on the BLM ePlanning web page on June 3, 2022, for public review; a notice of public comment period letter was sent to those persons and groups listed on the Arizona Strip District Office interested publics mailing list notifying them of the availability of the EA for a 30-day review and comment period. Non-BLM Agency reviewers were also involved in the internal reviewed as noted in Table 5.2.
List of Preparers and Reviewers Table 5.1. List of BLM Preparers/Reviewers
Name Title Responsible for the Following Program(s)
David Pals Acting Monument Manager Authorizing Officer
Jannice Cutler Rangeland Management Specialist Project Lead, Grazing Administration/Vegetation/Rangeland Health
Gloria Benson Tribal Liaison Native American Religious Concerns Amber Hughes Planning & Environmental Coordinator NEPA Compliance Eathan McIntyre Physical Scientist Soil/Water/Air/Geology Kendra Thomas Lands and Realty Specialist Lands/Realty Jeff Young Wildlife Biologist Special Status Animals, Wildlife
Jennifer Fox Ecologist Vegetation/Special Status Plants, Invasive, Non-Native Species
Greg Page Outdoor Recreation Planner Wilderness, Recreation, Visual Resources David Van Alfen Archaeologist Cultural Resources Cody Goff Fire & Fuels Fire & Fuels
Table 5.2. Non-BLM Agency Reviewers
Name Title Agency/Organization Tim Shurtliff Field Supervisor Arizona Game and Fish Department Rob Nelson Arizona Game & Fish Habitat Evaluation and Lands Program Manager Peter Bungart Hualapai Tribe Senior Archaeologist Martina Dawley Kaibab Paiute Tribe Environmental Program Director
53
CHAPTER 6 6.0 REFERENCES Arizona Game and Fish Department (AGFD). 2001. Idionycteris phyllotis. Allen’s Big-eared
Bat. Unpublished abstract compiled and edited by the Heritage Data Management System, Arizona Game and Fish Department, Phoenix.
Arizona Game and Fish Department (AGFD). 2002a. Falco peregrinus anatum. American
Peregrine Falcon. Unpublished abstract compiled and edited by the Heritage Data Management System, Arizona Game and Fish Department, Phoenix, AZ. 6 pp.
Arizona Game and Fish Department (AGFD). 2002b. Eumops perotis californicus. Greater
Western Mastiff Bat. Unpublished abstract compiled and edited by the Heritage Data Management System, Arizona Game and Fish Department, Phoenix.
Arizona Game and Fish Department (AGFD). 2003a. Corynorhinus townsendii pallescens.
Townsend’s Big-eared Bat. Unpublished abstract compiled and edited by the Heritage Data Management System, Arizona Game and Fish Department, Phoenix.
Arizona Game and Fish Department (AGFD). 2003b. Euderma maculatum. Spotted Bat.
Unpublished abstract compiled and edited by the Heritage Data Management System, Arizona Game and Fish Department, Phoenix.
Arizona Game and Fish Department (AGFD). 2009. Athene cunicularis. Burrowing Owl.
Unpublished abstract compiled and edited by the Heritage Data Management System, Arizona Game and Fish Department, Phoenix, AZ. 7 pp.
Arizona Game and Fish Department (AGFD). 2019. Special Status Species by County,
Taxonomic Group, Scientific Name. Heritage Data Management System, Arizona Game and Fish Department, Phoenix, Arizona.
Arizona Game and Fish Department and U.S. Department of the Interior, Bureau of Land
Management (AGFD and BLM). 2015. Arizona Strip Interdisciplinary Mule Deer Management Plan 2015-2019. 49 pp.
Balda, R.P. and G.C. Bateman. 1971. Flocking and Annual Cycle of the Piñon Jay
(Gymnorhinus cyanocephalus). The Condor 73:287-302. Bighorn Sheep Core Team. 2011. Arizona Strip Desert Bighorn Sheep Management Plan, as
Amended. Prepared for the Bureau of Land Management, U.S. Forest Service and Arizona Game and Fish Department, 18 pp.
Brower, L. P., L.S. Fink, and P. Walford. 2006. Fueling the fall migration of the monarch
butterfly. Integrative and Comparative Biology, 46(6):1123–1142.
54
Davies, K. W., Vavra, M., Schultz, B., and N. Rimbey. 2014. Implications of Longer Term Rest from Grazing in the Sagebrush Steppe. Journal of Rangeland Applications 1:14-34.
Desmond, M.J. and J.A. Savidge. 1996. Factors Influencing Burrowing Owl (Speotyto
cunicularia) Nest Densities and Numbers in Western Nebraska. American Midland Naturalist 136(1):143-148.
Doswell, C. 1997. Misconceptions about what is "normal" for the atmosphere. Cooperative
Institute for Mesoscale Meteorological Studies, National Severe Storms Laboratory, Norman, Oklahoma.
Eakle, W.L. and T.G. Grubb. 1986. Prey Remains from Golden Eagle Nests in Central Arizona.
Western Birds 17:87-89. Haug, E.A., B.A. Milsap, and M.S. Martell. 1993. Burrowing owl (Speotyto cunicularia). In
The Birds of North America, edited by A. Poole and F. Gill. No. 61. Philadelphia: The Birds of North America.
Herder, Michael. 1996. Northern Arizona Bat Roost Inventory. Heritage Grant Report No.
196035. Prepared for Arizona Game and Fish Department. Jepsen, S., D.F. Schweitzer, B. Young, N. Sears, M. Ormes, and S.H. Black. 2015. Conservation
status and ecology of the Monarch butterfly in the United States. Arlington, VA: NatureServe and Portland, OR: The Xerces Society for Invertebrate Conservation. 28 p.
Johnson, K., L. Wickersham, J. Smith, N. Petersen, and J. Wickersham. 2015. Nest-scale
Habitat Use by Pinyon Jay and Gray Vireo in the BLM Farmington Resource Area 2013−2014: Final Report. Natural Heritage New Mexico Publication number 15-GTR-386.
Klute, D.S., L.W. Ayers, M.T. Green, W.H. Howe, S.L. Jones, J.A. Shaffer, S.R. Sheffield, and
T.S. Zimmerman. 2003. Status Assessment and Conservation Plan for the Western Burrowing Owl in the United States. U.S. Department of the Interior, Fish and Wildlife Service, Biological Technical Publication FWS/BTP-R6001-2003. Washington, D.C. 120 pp.
Latta, M.J., C.J. Beardmore, and T.E. Corman. 1999. Arizona Partners in Flight Bird
Conservation Plan. Version 1.0. Nongame and Endangered Wildlife Program Technical Report 142. Arizona Game and Fish Department, Phoenix, Arizona.
MacCracken, J.G., D.W. Uresk, and R.M. Hansen. 1985. Vegetation and Soils of Burrowing
Owl Nest Sites in Conata Basin, South Dakota. The Condor, 87:152-154.
National Drought Mitigation Center (NDMC). 2022. Available online at: Current Map | United States Drought Monitor (unl.edu). Accessed June 1, 2022.
55
National Drought Mitigation Center. 2015. From "Understanding Weather Normals" by Jack
Williams, USAToday.com; NDMC "Drought Indices". Accessed at: http://drought.unl.edu/ranchplan/DroughtBasics/WeatherDrought/WhatisNormalPrecipitation.aspx. Accessed April 20, 2015.
Olendorff, R.R. 1993. Status, biology, and management of ferruginous hawks: A review.
Raptor Res. and Tech. Asst. Cen., Spec. Rep. U.S. Dept. Interior, Bur. Land Management, Boise, ID. 84 pp.
Sherwin, R.E., D. Stricklan and D.S. Rogers. 2000. Roosting Affinities of Townsend’s Big-
eared Bat (Corynorhinus townsendii) in Northern Utah. Journal of Mammalogy, 81:939-947.
Stotz, N.G. and R.P. Balda. 1995. Cache and Recovery Behavior of Wild Pinyon Jays in
Northern Arizona. The Southwestern Naturalist 40:180-184. Tilley, D., L. St. John, and D. Ogle. 2009. Plant guide for sand dropseed (Sporobolus
cryptandrus). USDA-Natural Resources Conservation Service, Idaho Plant Materials Center. Aberdeen, ID
U.S. Department of Agriculture (USDA). 2015. Pollinator-Friendly Best Management Practices
for Federal Lands. 52 pp. U.S. Department of Agriculture (USDA). Natural Resources Conservation Service (NRCS).
2020. Ecological site R035XC343AZ Limestone/Sandstone Cliffs 10-14” p.z. Accessed: 10/14/2020.
U.S. Department of the Interior, Bureau of Land Management (BLM). 1997. Arizona Standards
for Rangeland Health and Guidelines for Grazing Administration. United States Department of the Interior, Bureau of Land Management, Arizona State Office.
U.S. Department of the Interior, Bureau of Land Management (BLM). 1999a. Utilization
Studies and Residual Measurements, Technical Reference 1734-3. Written by: Coulloudon, B., K. Eshelman, J. Gianola, N. Habich, L. Hughes, C. Johnson, M. Pellant, P. Podborny, A. Rasmussen, B. Robles, P. Shaver, J. Spehar, J. Willoughby. Denver, CO. BLM/RS/ST-96/004+1730. Pp 174.
U.S. Department of the Interior, Bureau of Land Management (BLM). 1999b. Sampling
Vegetation Attributes, Technical Reference 1734-4. Written by: Coulloudon, B., K. Eshelman, J. Gianola, N. Habich, L. Hughes, C. Johnson, M. Pellant, P. Podborny, A. Rasmussen, B. Robles, P. Shaver, J. Spehar, J. Willoughby. Denver, CO. BLM/RS/ST-96/004+1730. Pp 171.
U.S. Department of the Interior, Bureau of Land Management (BLM). 2001. Ecological Site
Inventory, Technical Reference 1734-7. Written by: Habich, E.F. Denver, CO. BLM/ST/ST-01/003+1734. pp. 112.
56
U.S. Department of the Interior, Bureau of Land Management (BLM). 2005. Interpreting
Indicators of Rangeland Health, Version 4, Technical Reference 1734-6. Written by: Pellant, M., P. Shaver, D.A. Pyke, and J.E. Herrick. Denver, CO. BLM/ST/ST-01/003+1734. Pp. 112.
U.S. Department of the Interior, Bureau of Land Management (BLM). 2007. Standards for
Rangeland Health and Guidelines for Grazing Administration Implementation Project: Allotment Assessment for Link Spring Allotment #4819. Unpublished report on file at the Grand Canyon-Parashant National Monument, St. George, Utah.
U.S. Department of the Interior, Bureau of Land Management (BLM). 2008a. Grand Canyon-
Parashant National Monument Resource Management Plan (RMP). Bureau of Land Management, St. George, Utah.
U.S. Department of the Interior, Bureau of Land Management (BLM). 2008b. National
Environmental Policy Act. BLM Handbook H-1790-1. Bureau of Land Management, Washington D.C.
U.S. Department of the Interior, Bureau of Land Management (BLM). 2010. Standards for
Rangeland Health and Guidelines for Grazing Administration Implementation Project: Allotment Assessment for Last Chance Allotment #4815. Unpublished report on file at the Grand Canyon-Parashant National Monument, St. George, Utah.
U.S. Department of the Interior. Bureau of Land Management (BLM) and U.S. Fish and
Wildlife Service (USFWS). 2010. Memorandum of Understanding (MOU) between the U.S. Department of the Interior Bureau of Land Management and the U. S. Fish and Wildlife Service to Promote the Conservation of Migratory Birds. Washington D.C. 13 pp.
U.S. Department of the Interior, U.S. Fish and Wildlife Service (USFWS). 2020. Endangered
and Threatened Wildlife and Plants; 12-Month Finding for the Monarch Butterfly. 85 FR 81813.
U.S. Fish and Wildlife Service. 2021. Birds of Conservation Concern 2021. United States
Department of the Interior, U.S. Fish and Wildlife Service, Migratory Birds, Falls Church, Virginia. http://www.fws.gov/birds/management/managed-species/birds-of-conservation-concern.php
University of Arizona, College of Agriculture and Life Sciences – Arizona Cooperative
Extension. 2010. Rangeland Monitoring: Selecting Key Areas. Written by: Jeff Schalau, Associate Agent, Agriculture & Natural Resources. Originally published in 2001, revised January 2010.
Wiggins, D.A. 2005. Pinyon Jay (Gymnorhinus cyanocephalus): a Technical Conservation
Assessment. [Online]. USDA Forest Service, Rocky Mountain Region.
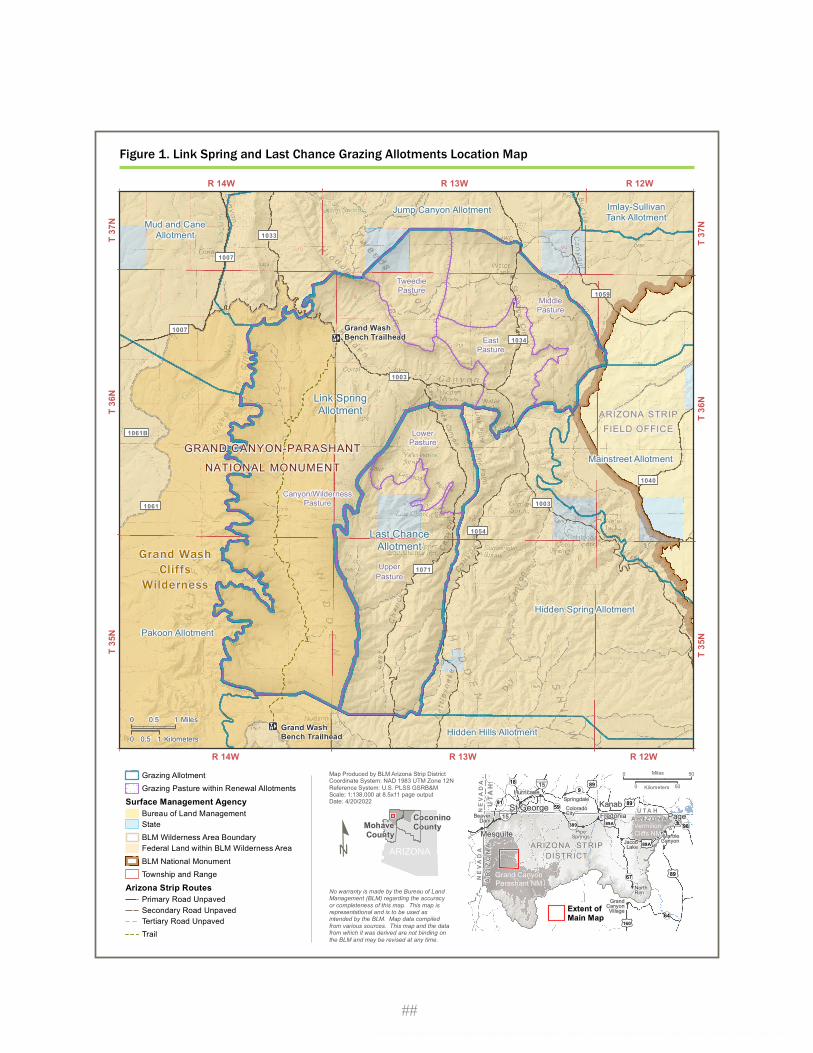
º
File Path: \\blm\dfs\loc\EGIS\AZ\Arizona_Strip_DO\Projects\Range\2022\DOI-BLM-AZ-A010-2022-00XX-EA_LinkSpring_LastChance_GPR\projects\carto\Map_Fig1_LinkSpring_LastChance_GPR_location_2022.mxd | User: bhansen
Grazing AllotmentGrazing Pasture within Renewal Allotments
Surface Management AgencyBureau of Land ManagementStateBLM Wilderness Area BoundaryFederal Land within BLM Wilderness AreaBLM National MonumentTownship and Range
Arizona Strip RoutesPrimary Road UnpavedSecondary Road UnpavedTertiary Road UnpavedTrail
ARIZONA
MohaveCounty
CoconinoCounty !
!
!
!
!
!
!
!
!
!
!
!
¬«91
£¤89¥¦15
PageSt.George
BeaverDam
Mesquite
ColoradoCity
PipeSprings
KanabFredonia
NorthRimGrandCanyonVillage
JacobLakeMarbleCanyon!
HurricaneSpringdale!
U TA HA R I Z O N A
UTA
HA
RI Z
ON
AN
E VA
DA
NE V
AD
A
Extent of Main Map
£¤89A
ARIZONA STRIPDISTRICT
£¤160
£¤89A
£¤89
£¤89¬«59
¬«389
¬«67
¬«18
¬«64
¬«9
¬«98¥¦15
VermilionCliffs NM
Grand CanyonParashant NM
0 50Kilometers
0 50Miles
No warranty is made by the Bureau of LandManagement (BLM) regarding the accuracyor completeness of this map. This map isrepresentational and is to be used asintended by the BLM. Map data compiledfrom various sources. This map and the datafrom which it was derived are not binding onthe BLM and may be revised at any time.
Map Produced by BLM Arizona Strip DistrictCoordinate System: NAD 1983 UTM Zone 12NReference System: U.S. PLSS GSRB&MScale: 1:138,000 at 8.5x11 page outputDate: 4/20/2022
Figure 1. Link Spring and Last Chance Grazing Allotments Location Map
!E
!E
ARIZONA STRIPFIELD OFFICE
1007
1059
GRAND CANYON-PARASHANTNATIONAL MONUMENT
Grand WashCliffs
Wilderness
TweediePasture
MiddlePasture
Canyon/WildernessPasture
LowerPasture
UpperPasture
EastPasture
Mud and CaneAllotment
Jump Canyon Allotment
Link SpringAllotment
Pakoon Allotment
Last ChanceAllotment
Hidden Spring Allotment
Hidden Hills Allotment
Mainstreet Allotment
Imlay-SullivanTank Allotment
1003
1061
1040
1054
1034
1071
1003
1061B
1007
1033
Grand WashBench Trailhead
Grand WashBench Trailhead
R 14W R 13W R 12W
R 14W R 13W R 12W
T 35N
T 36N
T 35N
T 36N
T 37N
T 37N
0 10.5 Miles
0 10.5 Kilometers
##
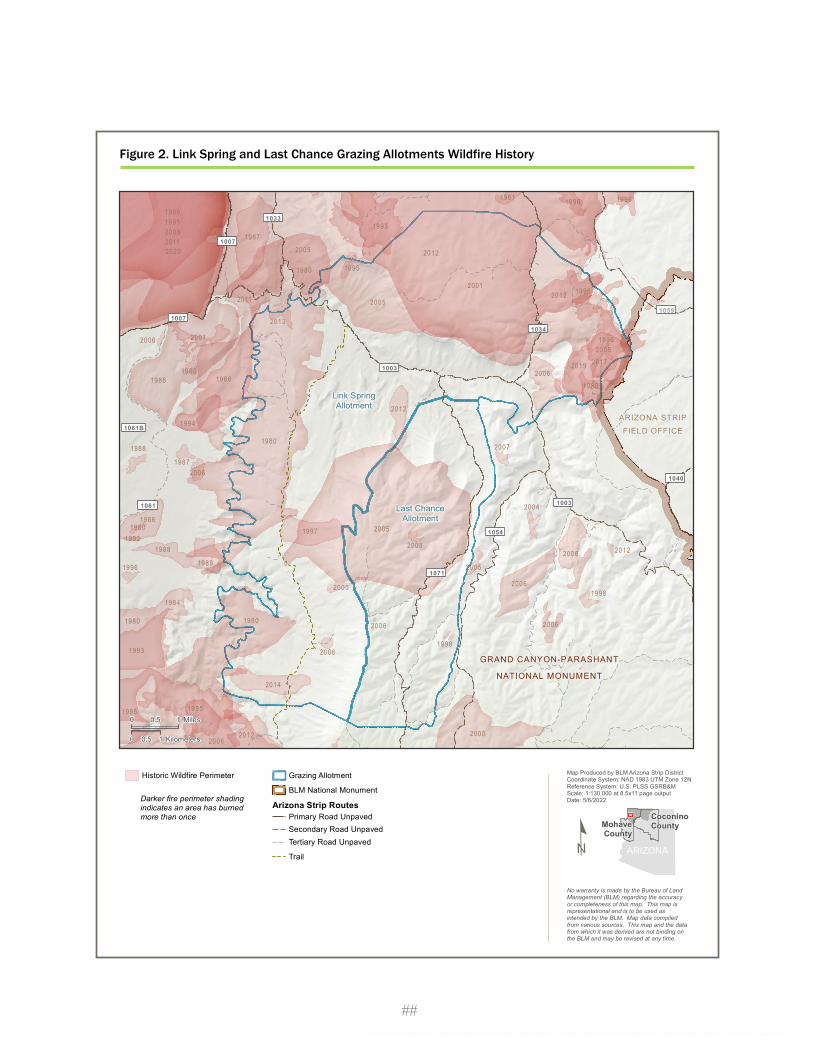
File Path: \\blm\dfs\loc\EGIS\AZ\Arizona_Strip_DO\Projects\Range\2022\DOI-BLM-AZ-A010-2022-00XX-EA_LinkSpring_LastChance_GPR\projects\carto\Map_FigX_LinkSpring_LastChance_GPR_fire_history_2022.mxd | User: bhansen
Historic Wildfire Perimeter Grazing AllotmentBLM National Monument
Arizona Strip RoutesPrimary Road UnpavedSecondary Road UnpavedTertiary Road UnpavedTrail ARIZONA
MohaveCounty
CoconinoCounty
No warranty is made by the Bureau of LandManagement (BLM) regarding the accuracyor completeness of this map. This map isrepresentational and is to be used asintended by the BLM. Map data compiledfrom various sources. This map and the datafrom which it was derived are not binding onthe BLM and may be revised at any time.
Map Produced by BLM Arizona Strip DistrictCoordinate System: NAD 1983 UTM Zone 12NReference System: U.S. PLSS GSRB&MScale: 1:130,000 at 8.5x11 page outputDate: 5/6/2022
Figure 2. Link Spring and Last Chance Grazing Allotments Wildfire History
ARIZONA STRIPFIELD OFFICE
10071059
GRAND CANYON-PARASHANTNATIONAL MONUMENT
Link SpringAllotment
Last ChanceAllotment
1003
1061
1040
1054
1034
1071
1003
1061B
1007
1033
1980
19801980
1984
1980
1980
19801980
1981
19891988
1986
1986
1987
1986
1986
19871988
1995 1995
1993
1992
1994
1995 1993
1995
1997
1996
2000
2000
1998
1996
1996
1998
19961996
2001
2005
2004
2001
2005
2005
2005
2005
2005
2006
2006
2006
2006
2007
2008
2006
2006
2006
2006
2006
2012
2014
2013
2011
2011
2012
2012
2012
20122020
20172019
0 10.5 Miles
0 10.5 Kilometers
##
Darker fire perimeter shadingindicates an area has burnedmore than once
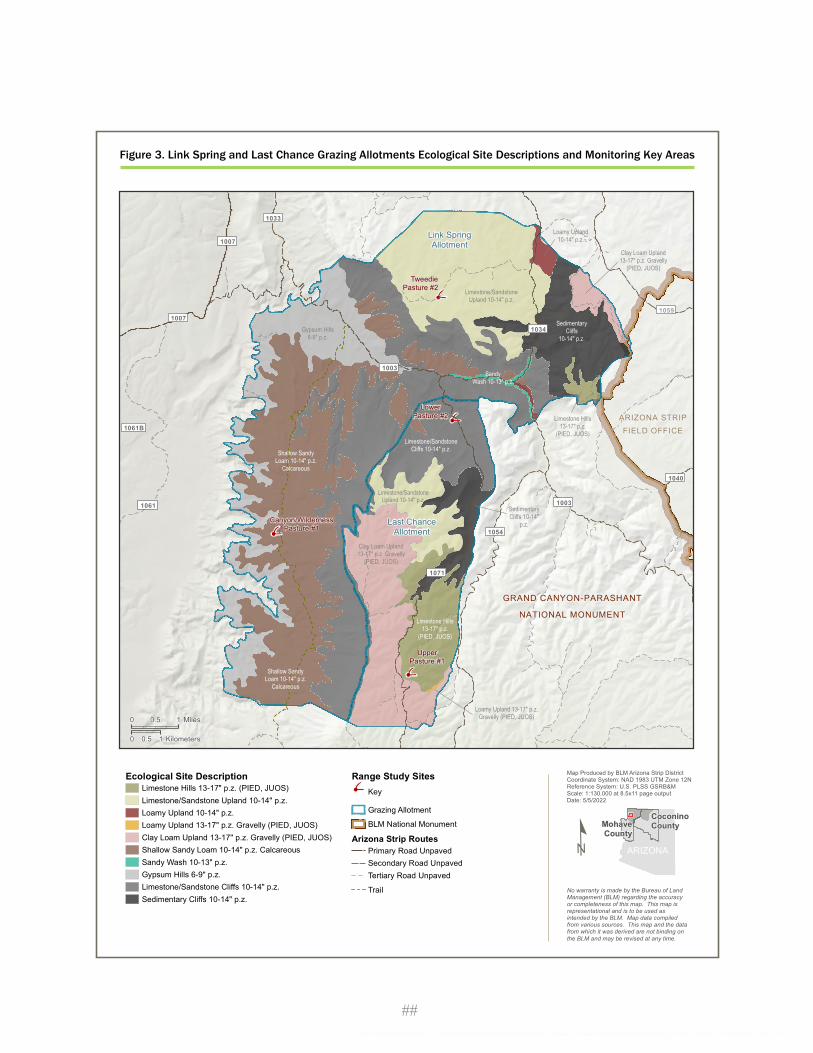
File Path: \\blm\dfs\loc\EGIS\AZ\Arizona_Strip_DO\Projects\Range\2022\DOI-BLM-AZ-A010-2022-00XX-EA_LinkSpring_LastChance_GPR\projects\carto\Map_FigX_LinkSpring_LastChance_GPR_ESD_monitoring_2022.mxd | User: bhansen
Ecological Site DescriptionLimestone Hills 13-17" p.z. (PIED, JUOS)Limestone/Sandstone Upland 10-14" p.z.Loamy Upland 10-14" p.z.Loamy Upland 13-17" p.z. Gravelly (PIED, JUOS)Clay Loam Upland 13-17" p.z. Gravelly (PIED, JUOS)Shallow Sandy Loam 10-14" p.z. CalcareousSandy Wash 10-13" p.z.Gypsum Hills 6-9" p.z.Limestone/Sandstone Cliffs 10-14" p.z.Sedimentary Cliffs 10-14" p.z.
Range Study SitesKeyGrazing AllotmentBLM National Monument
Arizona Strip RoutesPrimary Road UnpavedSecondary Road UnpavedTertiary Road UnpavedTrail
ARIZONA
MohaveCounty
CoconinoCounty
No warranty is made by the Bureau of LandManagement (BLM) regarding the accuracyor completeness of this map. This map isrepresentational and is to be used asintended by the BLM. Map data compiledfrom various sources. This map and the datafrom which it was derived are not binding onthe BLM and may be revised at any time.
Map Produced by BLM Arizona Strip DistrictCoordinate System: NAD 1983 UTM Zone 12NReference System: U.S. PLSS GSRB&MScale: 1:130,000 at 8.5x11 page outputDate: 5/5/2022
Figure 3. Link Spring and Last Chance Grazing Allotments Ecological Site Descriptions and Monitoring Key Areas
ARIZONA STRIPFIELD OFFICE
10071059
Shallow SandyLoam 10-14" p.z.
Calcareous
GRAND CANYON-PARASHANTNATIONAL MONUMENT
Link SpringAllotment
Last ChanceAllotment
1003
1061
1040
1054
1034
1071
1003
1061B
1007
1033
LowerPasture #2
UpperPasture #1
Canyon/WildernessPasture #1
TweediePasture #2
Loamy Upland10-14" p.z.
Gypsum Hills6-9" p.z.
Limestone/SandstoneUpland 10-14" p.z.
Loamy Upland 13-17" p.z.Gravelly (PIED, JUOS)
Limestone Hills13-17" p.z.
(PIED, JUOS)
Limestone Hills13-17" p.z.
(PIED, JUOS)
SandyWash 10-13" p.z.
Limestone/SandstoneUpland 10-14" p.z.
Limestone/SandstoneCliffs 10-14" p.z.Shallow Sandy
Loam 10-14" p.z.Calcareous
SedimentaryCliffs 10-14"
p.z.
Clay Loam Upland13-17" p.z. Gravelly
(PIED, JUOS)
SedimentaryCliffs
10-14" p.z.
Clay Loam Upland13-17" p.z. Gravelly
(PIED, JUOS)
0 10.5 Miles
0 10.5 Kilometers
##
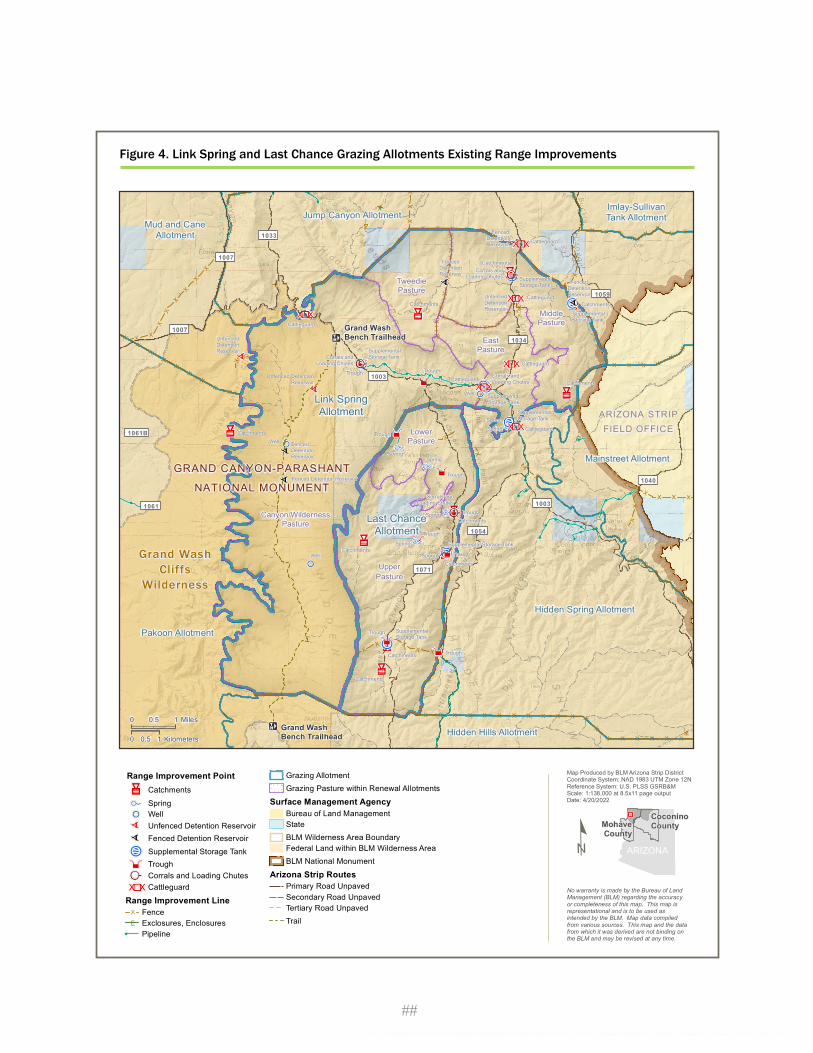
File Path: \\blm\dfs\loc\EGIS\AZ\Arizona_Strip_DO\Projects\Range\2022\DOI-BLM-AZ-A010-2022-00XX-EA_LinkSpring_LastChance_GPR\projects\carto\Map_FigX_LinkSpring_LastChance_GPR_improvements_2022.mxd | User: bhansen
Range Improvement PointCatchmentsSpringWellUnfenced Detention ReservoirFenced Detention ReservoirSupplemental Storage TankTroughCorrals and Loading ChutesCattleguard
Range Improvement LineFenceExclosures, EnclosuresPipeline
Grazing AllotmentGrazing Pasture within Renewal Allotments
Surface Management AgencyBureau of Land ManagementStateBLM Wilderness Area BoundaryFederal Land within BLM Wilderness AreaBLM National Monument
Arizona Strip RoutesPrimary Road UnpavedSecondary Road UnpavedTertiary Road UnpavedTrail
ARIZONA
MohaveCounty
CoconinoCounty
No warranty is made by the Bureau of LandManagement (BLM) regarding the accuracyor completeness of this map. This map isrepresentational and is to be used asintended by the BLM. Map data compiledfrom various sources. This map and the datafrom which it was derived are not binding onthe BLM and may be revised at any time.
Map Produced by BLM Arizona Strip DistrictCoordinate System: NAD 1983 UTM Zone 12NReference System: U.S. PLSS GSRB&MScale: 1:138,000 at 8.5x11 page outputDate: 4/20/2022
Figure 4. Link Spring and Last Chance Grazing Allotments Existing Range Improvements
ARIZONA STRIPFIELD OFFICE
1007
1059
SpringTrough
GRAND CANYON-PARASHANTNATIONAL MONUMENT
Grand WashCliffs
Wilderness
TweediePasture
MiddlePasture
Canyon/WildernessPasture
LowerPasture
UpperPasture
EastPasture
Mud and CaneAllotment
Jump Canyon Allotment
Link SpringAllotment
Pakoon Allotment
Last ChanceAllotment
Hidden Spring Allotment
Hidden Hills Allotment
Mainstreet Allotment
Imlay-SullivanTank Allotment
1003
1061
1040
1054
1034
1071
1003
1061B
1007
1033
Grand WashBench Trailhead
Grand WashBench Trailhead
Catchments
TroughCatchments
SupplementalStorage TankTrough
Well SpringCatchments
Supplemental Storage TankTroughCatchments
SpringCatchments
Fenced Detention Reservoir Trough
SpringSpring
WellTrough
Spring
Catchments Spring
SupplementalStorage Tank
CatchmentsWell
Unfenced DetentionReservoir
Trough
SupplementalStorage Tank
UnfencedDetentionReservoir
CatchmentsSupplementalStorage Tank
FencedDetentionReservoirUnfenced
DetentionReservoir
FencedDetentionReservoir Supplemental
Storage Tank
Catchments
FencedDetentionReservoir
SupplementalStorage Tank
Trough
Trough
Catchments
Corrals andLoading Chutes
Cattleguard
Corrals andLoading Chutes
Corrals andLoading Chutes
Corrals andLoading Chutes
Cattleguard
Cattleguard
Cattleguard
Cattleguard
Cattleguard
FencedDetentionReservoir
0 10.5 Miles
0 10.5 Kilometers
##
44
APPENDIX B – Arizona Standards for Rangeland Health and Guidelines for Grazing Administration (BLM 1997). INTRODUCTION The Department of the Interior's final rule for Grazing Administration, issued on February 22, 1995, and effective August 21, 1995, requires that Bureau of Land Management (BLM) State Directors develop State or regional standards and guidelines for grazing administration in consultation with BLM Resource Advisory Councils (RAC), other agencies and the public. The final rule provides those fallback standards and guidelines be implemented, if State standards and guidelines are not developed by February 12, 1997. Arizona Standards and Guidelines and the final rule apply to grazing administration on public lands as indicated by the following quotation from the Federal Register, Volume 60, Number 35, page 9955.
"The fundamentals of rangeland health, guiding principles for standards and the fallback standards address ecological components that are affected by all uses of public rangelands, not just livestock grazing. However, the scope of this final rule, and therefore the fundamentals of rangeland health of §4180.1, and the standards and guidelines to be made effective under §4180.2, are limited to grazing administration."
Although the process of developing standards and guidelines applies to grazing administration, present rangeland health is the result of the interaction of many factors in addition to grazing by livestock. Other contributing factors may include, but are not limited to, past land uses, land use restrictions, recreation, wildlife, rights-of-way, wild horses and burros, mining, fire, weather, and insects and disease.
With the commitment of BLM to ecosystem and interdisciplinary resource management, the standards for rangeland health as developed in this current process will be incorporated into management goals and objectives. The standards and guidelines for rangeland health for grazing administration, however, are not the only considerations in resolving resource issues. The following quotations from the Federal Register, Vol. 60, No. 35, page 9956, February 22, 1995, describe the purpose of standards and guidelines and their implementation:
"The guiding principles for standards and guidelines require that State or regional standards and guidelines address the basic components of healthy rangelands. The Department believes that by implementing grazing-related actions that are consistent with the fundamentals of §4180.1 and the guiding principles of §4180.2, the long-term health of public rangelands can be ensured.
"Standards and guidelines will be implemented through terms and conditions of grazing permits, leases, and other authorizations, grazing-related portions of activity plans (including Allotment Management Plans), and through range improvement-related activities.
45
"The Department anticipates that in most cases the standards and guidelines themselves will not be terms and conditions of various authorizations but that the terms and conditions will reflect the standards and guidelines.
"The Department intends that assessments and corrective actions will be undertaken in priority order as determined by BLM.
"The Department will use a variety of data including monitoring records, assessments, and knowledge of the locale to assist in making the "significant progress" determination. It is anticipated that in many cases it will take numerous grazing seasons to determine direction and magnitude of trend. However, actions will be taken to establish significant progress toward conformance as soon as sufficient data are available to make informed changes in grazing practices."
FUNDAMENTALS AND DEFINITION OF RANGELAND HEALTH
The Grazing Administration Regulations, at §4180.1 (43 Code of Federal Regulation [CFR] 4180.1), Federal Register Vol. 60, No. 35, pg. 9970, direct that the authorized officer ensures that the following conditions of rangeland health exist:
(a) Watersheds are in, or are making significant progress toward, properly functioning physical condition, including their upland, riparian-wetland, and aquatic components; soil and plant conditions support infiltration, soil moisture storage, and the release of water that are in balance with climate and landform and maintain or improve water quality, water quantity, and timing and duration of flow.
(b) Ecological processes, including the hydrologic cycle, nutrient cycle, and energy flow, are maintained, or there is significant progress toward their attainment, in order to support healthy biotic populations and communities.
(c) Water quality complies with State water quality standards and achieves, or is making significant progress toward achieving, established BLM management objectives such as meeting wildlife needs.
(d) Habitats are, or are making significant progress toward being, restored or maintained for Federal threatened and endangered species, Federal Proposed, Category 1 and 2 Federal candidate and other special status species.
These fundamentals focus on sustaining productivity of a rangeland rather than its uses. Emphasizing the physical and biological functioning of ecosystems to determine rangeland health is consistent with the definition of rangeland health as proposed by the Committee on Rangeland Classification, Board of Agriculture, National Research Council (Rangeland Health, 1994, pg. 4 and 5). This Committee defined Rangeland Health ". . .as the degree to which the integrity of the soil and the ecological processes of rangeland ecosystems are sustained." This committee emphasized ". . .the degree of integrity of the soil and ecological processes that are
46
most important in sustaining the capacity of rangelands to satisfy values and produce commodities." The Committee also recommended that "The determination of whether a rangeland is healthy, at risk, or unhealthy should be based on the evaluation of three criteria: degree of soil stability and watershed function, integrity of nutrient cycles and energy flow, and presence of functioning mechanisms" (Rangeland Health, 1994, pg. 97-98). Standards describe conditions necessary to encourage proper functioning of ecological processes on specific ecological sites. An ecological site is the logical and practical ecosystem unit upon which to base an interpretation of rangeland health. Ecological site is defined as: ". . . a kind of land with specific physical characteristics which differs from other kinds of land in its ability to produce distinctive kinds and amounts of vegetation and in its response to management" (Journal of Range Management, 48:279, 1995). Ecological sites result from the interaction of climate, soils, and landform (slope, topographic position). The importance of this concept is that the "health" of different kinds of rangeland must be judged by standards specific to the potential of the ecological site. Acceptable erosion rates, water quality, productivity of plants and animals, and other features are different on each ecological site. Since there is wide variation of ecological sites in Arizona, standards and guidelines covering these sites must be general. To make standards and guidelines too specific would reduce the ability of BLM and interested publics to select specific objectives, monitoring strategies, and grazing permit terms and conditions appropriate to specific landforms. Ecological sites have the potential to support several different plant communities. Existing communities are the result of the combination of historical and recent uses and natural events. Management actions may be used to modify plant communities on a site. The desired plant community for a site is defined as follows: "Of the several plant communities that may occupy a site, the one that has been identified through a management plan to best meet the plan's objectives for the site. It must protect the site as a minimum." (Journal of Range Management, 48:279, 1995.) Fundamentals (a) and (b) define physical and biological components of rangeland health and are consistent with the definition of rangeland health as defined by the Committee on Rangeland Classification, Board on Agriculture, National Research Council, as discussed in the paragraph above. These fundamentals provide the basis for sustainable rangelands. Fundamentals (c) and (d) emphasize compliance with existing laws and regulation and, therefore, define social and political components of rangeland health. Compliance with Fundamentals (c) and (d) is accomplished by managing to attain a specific plant community and associated wildlife species present on ecological sites. These desired plant communities are determined in the BLM planning process, or, where the desired plant community is not identified, a community may be selected that will meet the conditions of Fundamentals (a) and (b) and also adhere to laws and regulations. Arizona Standard 3 is written to comply with Fundamentals (c) and (d) and provide a logical combination of Standards and Guidelines for planning and management purposes.
47
STANDARD AND GUIDELINE DEFINITIONS Standards are goals for the desired condition of the biological and physical components and characteristics of rangelands. Standards: (1) are measurable and attainable; and
(2) comply with various Federal and State statutes, policies, and directives applicable to BLM Rangelands.
Guidelines are management approaches, methods, and practices that are intended to achieve a standard. Guidelines:
(1) typically identify and prescribe methods of influencing or controlling specific public land uses; (2) are developed and applied consistent with the desired condition and within site capability; and (3) may be adjusted over time.
IMPLEMENTING STANDARDS AND GUIDELINES
The authorized officer will review existing permitted livestock use, allotment management plans, or other activity plans which identify terms and conditions for management on public land. Existing management practices, and levels of use on grazing allotments will be reviewed and evaluated on a priority basis to determine if they meet, or are making significant progress toward meeting, the standards and are in conformance with the guidelines. The review will be interdisciplinary and conducted under existing rules which provide for cooperation, coordination, and consultation with affected individuals, federal, state, and local agencies, tribal governments, private landowners, and interested publics. This review will use a variety of data, including monitoring records, assessments, and knowledge of the locale to assist in making the significant progress determination. Significance will be determined on a case-by-case basis, considering site potential, site condition, weather and financial commitment. It is anticipated there will be cases where numerous years will be needed to determine direction and magnitude of trend. Upon completion of review, the authorized officer shall take appropriate action as soon as practicable but no later than the start of the next grazing year upon determining that the existing grazing management practices or level of use on public land are significant factors contributing to failure to achieve the standards and conform with the guidelines that are made effective under 43 CFR 4180.2. Appropriate action means implementing actions that will result in significant progress toward fulfillment of the standards and significant progress toward conformance with guidelines. Livestock grazing will continue where significant progress toward meeting standards is being made. Additional activities and practices would not be needed on such allotments. Where new activities or practices are required to assure significant progress toward meeting standards, livestock grazing use can continue contingent upon determinations from monitoring data that the implemented actions are effective in making significant progress toward meeting the standards. In some cases, additional action may be needed as determined by monitoring data over time.
48
New plans will incorporate an interdisciplinary team approach (Arizona BLM Interdisciplinary Resource Management Handbook, April 1995). The terms and conditions for permitted grazing in these areas will be developed to comply with the goals and objectives of these plans which will be consistent with the standards and guidelines.
ARIZONA STANDARDS AND GUIDELINES
Arizona Standards and Guidelines (S&G) for grazing administration have been developed through a collaborative process involving the Bureau of Land Management State S&G Team and the Arizona Resource Advisory Council. Together, through meetings, conference calls, correspondence, and Open Houses with the public, the BLM State Team and RAC prepared Standards and Guidelines to address the minimum requirements outlined in the grazing regulations. The Standards and Guidelines, criteria for meeting Standards, and indicators are an integrated document that conforms to the fundamentals of rangeland health and the requirements of the regulations when taken as a whole. Upland sites, riparian-wetland areas, and desired resource conditions are each addressed by a standard and associated guidelines. Standard 1: Upland Sites Upland soils exhibit infiltration, permeability, and erosion rates that are appropriate to soil type, climate and landform (ecological site). Criteria for meeting Standard 1:
Soil conditions support proper functioning of hydrologic, energy, and nutrient cycles. Many factors interact to maintain stable soils and healthy soil conditions, including appropriate amounts of vegetative cover, litter, and soil porosity and organic matter. Under proper functioning conditions, rates of soil loss and infiltration are consistent with the potential of the site.
Ground cover in the form of plants, litter or rock is present in pattern, kind, and amount sufficient to prevent accelerated erosion for the ecological site; or ground cover is increasing as determined by monitoring over an established period of time.
Signs of accelerated erosion are minimal or diminishing for the ecological site as determined by monitoring over an established period of time.
As indicated by such factors as: Ground Cover litter live vegetation, amount and type (e.g., grass, shrubs, trees, etc.) rock Signs of erosion flow pattern
gullies rills plant pedestaling
49
Exceptions and exemptions (where applicable): none Guidelines: 1-1. Management activities will maintain or promote ground cover that will provide for infiltration, permeability, soil moisture storage, and soil stability appropriate for the ecological sites within management units. The ground cover should maintain soil organisms and plants and animals to support the hydrologic and nutrient cycles, and energy flow. Ground cover and signs of erosion are surrogate measures for hydrologic and nutrient cycles and energy flow. 1-2. When grazing practices alone are not likely to restore areas of low infiltration or permeability, land management treatments may be designed and implemented to attain improvement. Standard 2: Riparian-Wetland Sites Riparian-wetland areas are in properly functioning condition. Criteria for meeting Standard 2:
Stream channel morphology and functions are appropriate for proper functioning condition for existing climate, landform, and channel reach characteristics. Riparian-wetland areas are functioning properly when adequate vegetation, land form, or large woody debris is present to dissipate stream energy associated with high water flows.
Riparian-wetland functioning condition assessments are based on examination of hydrologic, vegetative, soil and erosion-deposition factors. BLM has developed a standard checklist to address these factors and make functional assessments. Riparian-wetland areas are functioning properly as indicated by the results of the application of the appropriate checklist.
The checklist for riparian areas is in Technical Reference 1737-9 "Process for Assessing Proper Functioning Condition." The checklist for wetlands is in Technical Reference 1737-11 "Process for Assessing Proper Functioning Condition for Lentic Riparian-Wetland Areas."
As indicated by such factors as: Gradient Width/depth ratio Channel roughness and sinuosity of stream channel Bank stabilization Reduced erosion Captured sediment Ground-water recharge Dissipation of energy by vegetation
50
Exceptions and exemptions (where applicable): Dirt tanks, wells, and other water facilities constructed or placed at a location for the
purpose of providing water for livestock and/or wildlife and which have not been determined through local planning efforts to provide for riparian or wetland habitat are exempt.
Water impoundments permitted for construction, mining, or other similar activities
are exempt. Guidelines: 2-1. Management practices maintain or promote sufficient vegetation to maintain, improve or restore riparian-wetland functions of energy dissipation, sediment capture, groundwater recharge and stream bank stability, thus promoting stream channel morphology (e.g., gradient, width/depth ratio, channel roughness and sinuosity) and functions appropriate to climate and landform. 2-2. New facilities are located away from riparian-wetland areas if they conflict with achieving or maintaining riparian-wetland function. Existing facilities are used in a way that does not conflict with riparian-wetland functions or are relocated or modified when incompatible with riparian-wetland functions. 2-3. The development of springs and seeps or other projects affecting water and associated resources shall be designed to protect ecological functions and processes. Standard 3: Desired Resource Conditions Productive and diverse upland and riparian-wetland plant communities of native species exist and are maintained. Criteria for meeting Standard 3:
Upland and riparian-wetland plant communities meet desired plant community objectives. Plant community objectives are determined with consideration for all multiple uses. Objectives also address native species, and the requirements of the Taylor Grazing Act, Federal Land Policy and Management Act, Endangered Species Act, Clean Water Act, and appropriate laws, regulations, and policies. Desired plant community objectives will be developed to assure that soil conditions and ecosystem function described in Standards 1 and 2 are met. They detail a site-specific plant community, which when obtained, will assure rangeland health, State water quality standards, and habitat for endangered, threatened, and sensitive species. Thus, desired plant community objectives will be used as an indicator of ecosystem function and rangeland health.
As indicated by such factors as: Composition Structure Distribution
51
Exceptions and exemptions (where applicable): Ecological sites or stream reaches on which a change in existing vegetation is
physically, biologically, or economically impractical. Guidelines: 3-1. The use and perpetuation of native species will be emphasized. However, when restoring or rehabilitating disturbed or degraded rangelands, non-intrusive, non-native plant species are appropriate for use where native species (a) are not available, (b) are not economically feasible, (c) cannot achieve ecological objectives as well as non-native species, and/or (d) cannot compete with already established non-native species. 3-2. Conservation of Federal threatened or endangered, proposed, candidate, and other special status species is promoted by the maintenance or restoration of their habitats. 3-3. Management practices maintain, restore, or enhance water quality in conformance with State or Federal standards. 3-4. Intensity, season and frequency of use, and distribution of grazing use should provide for growth and reproduction of those plant species needed to reach desired plant community objectives. 3-5. Grazing on designated ephemeral (annual and perennial) rangeland may be authorized if the following conditions are met:
ephemeral vegetation is present in draws, washes, and under shrubs and has grown to
useable levels at the time grazing begins; sufficient surface and subsurface soil moisture exists for continued plant growth; serviceable waters are capable of providing for proper grazing distribution; sufficient annual vegetation will remain on site to satisfy other resource concerns,
(i.e., watershed, wildlife, wild horses and burros); and monitoring is conducted during grazing to determine if objectives are being met.
3-6. Management practices will target those populations of noxious weeds which can be controlled or eliminated by approved methods. 3-7. Management practices to achieve desired plant communities will consider protection and conservation of known cultural resources, including historical sites, and prehistoric sites and plants of significance to Native American peoples.
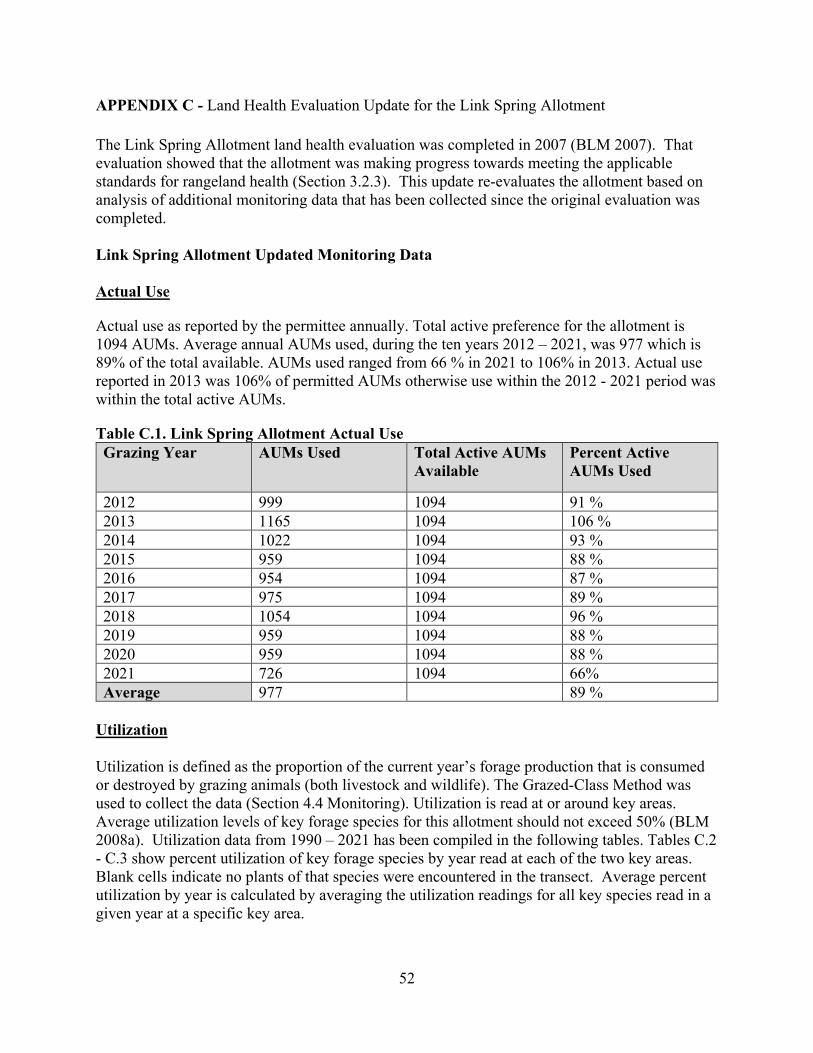
52
APPENDIX C - Land Health Evaluation Update for the Link Spring Allotment The Link Spring Allotment land health evaluation was completed in 2007 (BLM 2007). That evaluation showed that the allotment was making progress towards meeting the applicable standards for rangeland health (Section 3.2.3). This update re-evaluates the allotment based on analysis of additional monitoring data that has been collected since the original evaluation was completed. Link Spring Allotment Updated Monitoring Data Actual Use
Actual use as reported by the permittee annually. Total active preference for the allotment is 1094 AUMs. Average annual AUMs used, during the ten years 2012 – 2021, was 977 which is 89% of the total available. AUMs used ranged from 66 % in 2021 to 106% in 2013. Actual use reported in 2013 was 106% of permitted AUMs otherwise use within the 2012 - 2021 period was within the total active AUMs.
Table C.1. Link Spring Allotment Actual Use Grazing Year AUMs Used Total Active AUMs
Available Percent Active AUMs Used
2012 999 1094 91 % 2013 1165 1094 106 % 2014 1022 1094 93 % 2015 959 1094 88 % 2016 954 1094 87 % 2017 975 1094 89 % 2018 1054 1094 96 % 2019 959 1094 88 % 2020 959 1094 88 % 2021 726 1094 66% Average 977 89 %
Utilization Utilization is defined as the proportion of the current year’s forage production that is consumed or destroyed by grazing animals (both livestock and wildlife). The Grazed-Class Method was used to collect the data (Section 4.4 Monitoring). Utilization is read at or around key areas. Average utilization levels of key forage species for this allotment should not exceed 50% (BLM 2008a). Utilization data from 1990 – 2021 has been compiled in the following tables. Tables C.2 - C.3 show percent utilization of key forage species by year read at each of the two key areas. Blank cells indicate no plants of that species were encountered in the transect. Average percent utilization by year is calculated by averaging the utilization readings for all key species read in a given year at a specific key area.
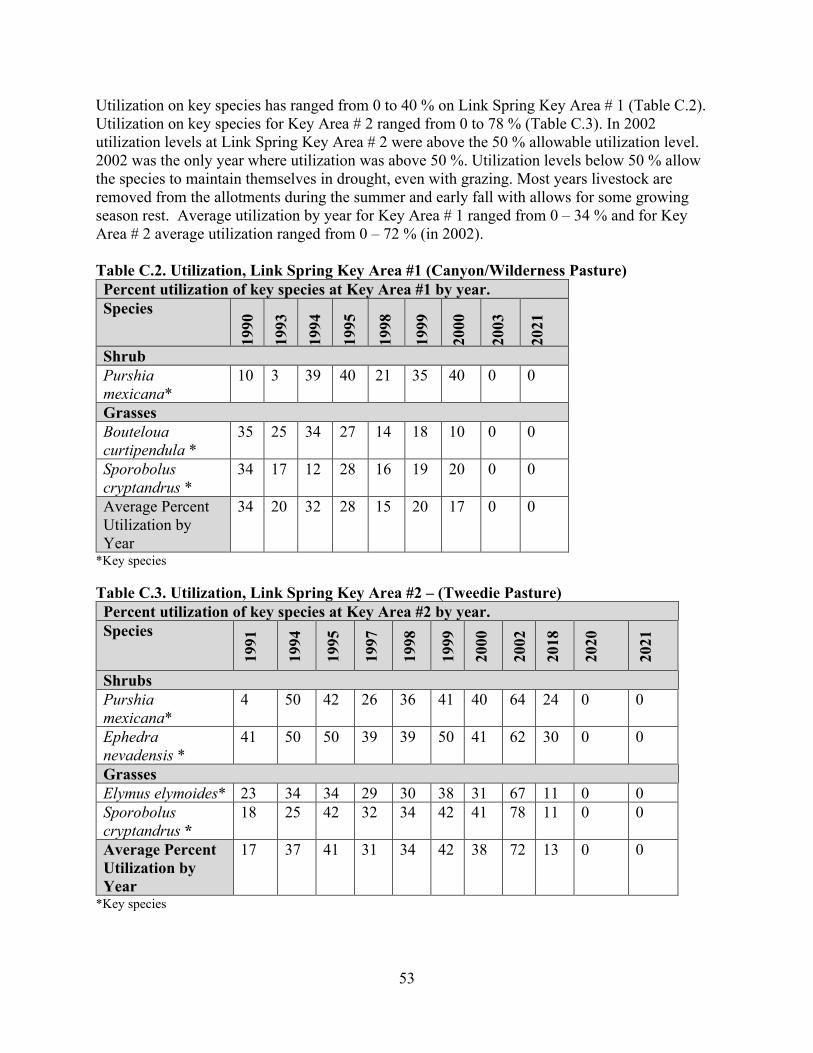
53
Utilization on key species has ranged from 0 to 40 % on Link Spring Key Area # 1 (Table C.2). Utilization on key species for Key Area # 2 ranged from 0 to 78 % (Table C.3). In 2002 utilization levels at Link Spring Key Area # 2 were above the 50 % allowable utilization level. 2002 was the only year where utilization was above 50 %. Utilization levels below 50 % allow the species to maintain themselves in drought, even with grazing. Most years livestock are removed from the allotments during the summer and early fall with allows for some growing season rest. Average utilization by year for Key Area # 1 ranged from 0 – 34 % and for Key Area # 2 average utilization ranged from 0 – 72 % (in 2002). Table C.2. Utilization, Link Spring Key Area #1 (Canyon/Wilderness Pasture) Percent utilization of key species at Key Area #1 by year. Species
1990
1993
1994
1995
1998
1999
2000
2003
2021
Shrub Purshia mexicana*
10 3 39 40 21 35 40 0 0
Grasses Bouteloua curtipendula *
35 25 34 27 14 18 10 0 0
Sporobolus cryptandrus *
34 17 12 28 16 19 20 0 0
Average Percent Utilization by Year
34 20 32 28 15 20 17 0 0
*Key species Table C.3. Utilization, Link Spring Key Area #2 – (Tweedie Pasture) Percent utilization of key species at Key Area #2 by year. Species
1991
1994
1995
1997
1998
1999
2000
2002
2018
2020
2021
Shrubs Purshia mexicana*
4 50 42 26 36 41 40 64 24 0 0
Ephedra nevadensis *
41 50 50 39 39 50 41 62 30 0 0
Grasses Elymus elymoides* 23 34 34 29 30 38 31 67 11 0 0 Sporobolus cryptandrus *
18 25 42 32 34 42 41 78 11 0 0
Average Percent Utilization by Year
17 37 41 31 34 42 38 72 13 0 0
*Key species
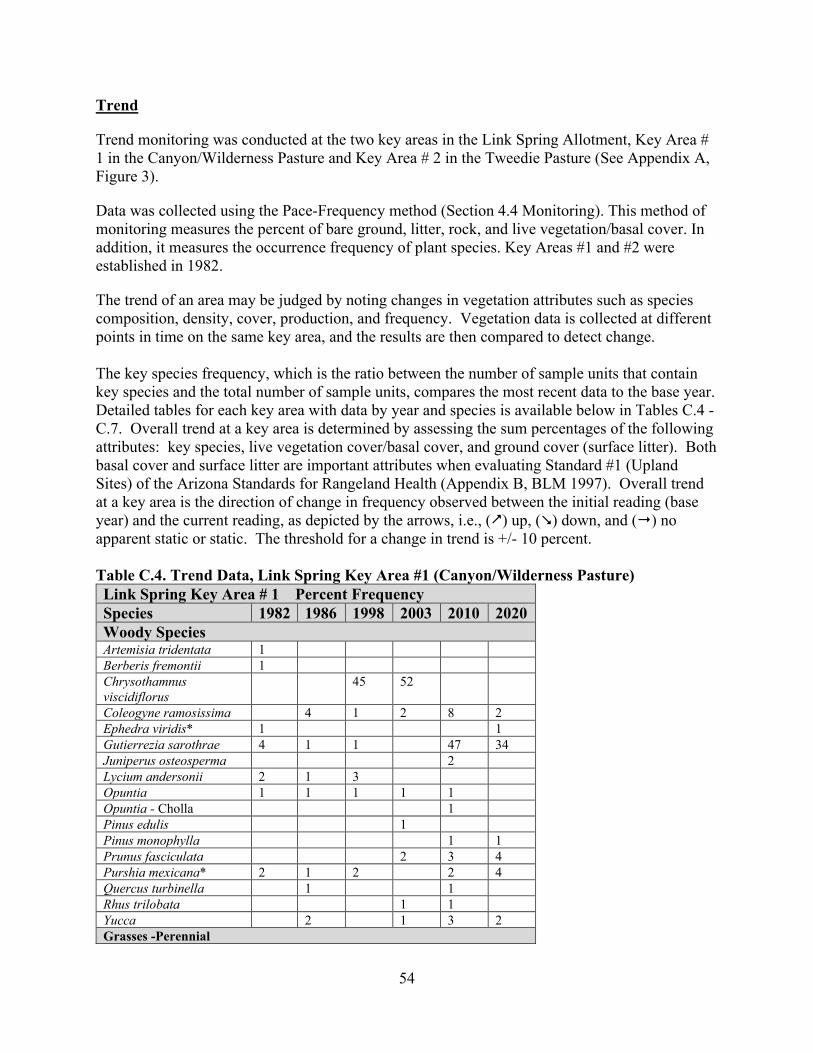
54
Trend
Trend monitoring was conducted at the two key areas in the Link Spring Allotment, Key Area # 1 in the Canyon/Wilderness Pasture and Key Area # 2 in the Tweedie Pasture (See Appendix A, Figure 3).
Data was collected using the Pace-Frequency method (Section 4.4 Monitoring). This method of monitoring measures the percent of bare ground, litter, rock, and live vegetation/basal cover. In addition, it measures the occurrence frequency of plant species. Key Areas #1 and #2 were established in 1982.
The trend of an area may be judged by noting changes in vegetation attributes such as species composition, density, cover, production, and frequency. Vegetation data is collected at different points in time on the same key area, and the results are then compared to detect change. The key species frequency, which is the ratio between the number of sample units that contain key species and the total number of sample units, compares the most recent data to the base year. Detailed tables for each key area with data by year and species is available below in Tables C.4 - C.7. Overall trend at a key area is determined by assessing the sum percentages of the following attributes: key species, live vegetation cover/basal cover, and ground cover (surface litter). Both basal cover and surface litter are important attributes when evaluating Standard #1 (Upland Sites) of the Arizona Standards for Rangeland Health (Appendix B, BLM 1997). Overall trend at a key area is the direction of change in frequency observed between the initial reading (base year) and the current reading, as depicted by the arrows, i.e., () up, () down, and () no apparent static or static. The threshold for a change in trend is +/- 10 percent. Table C.4. Trend Data, Link Spring Key Area #1 (Canyon/Wilderness Pasture) Link Spring Key Area # 1 Percent Frequency Species 1982 1986 1998 2003 2010 2020 Woody Species Artemisia tridentata 1 Berberis fremontii 1 Chrysothamnus viscidiflorus
45 52
Coleogyne ramosissima 4 1 2 8 2 Ephedra viridis* 1 1 Gutierrezia sarothrae 4 1 1 47 34 Juniperus osteosperma 2 Lycium andersonii 2 1 3 Opuntia 1 1 1 1 1 Opuntia - Cholla 1 Pinus edulis 1 Pinus monophylla 1 1 Prunus fasciculata 2 3 4 Purshia mexicana* 2 1 2 2 4 Quercus turbinella 1 1 Rhus trilobata 1 1 Yucca 2 1 3 2 Grasses -Perennial
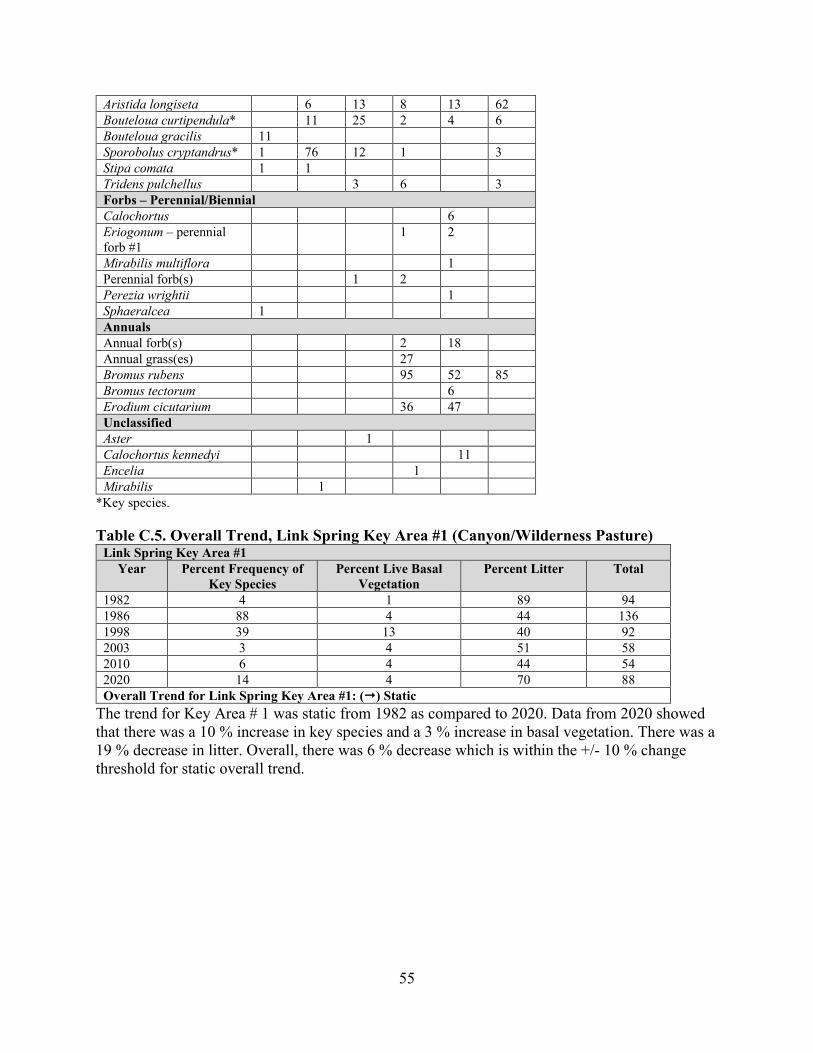
55
Aristida longiseta 6 13 8 13 62 Bouteloua curtipendula* 11 25 2 4 6 Bouteloua gracilis 11 Sporobolus cryptandrus* 1 76 12 1 3 Stipa comata 1 1 Tridens pulchellus 3 6 3 Forbs – Perennial/Biennial Calochortus 6 Eriogonum – perennial forb #1
1 2
Mirabilis multiflora 1 Perennial forb(s) 1 2 Perezia wrightii 1 Sphaeralcea 1 Annuals Annual forb(s) 2 18 Annual grass(es) 27 Bromus rubens 95 52 85 Bromus tectorum 6 Erodium cicutarium 36 47 Unclassified Aster 1 Calochortus kennedyi 11 Encelia 1 Mirabilis 1
*Key species.
Table C.5. Overall Trend, Link Spring Key Area #1 (Canyon/Wilderness Pasture) Link Spring Key Area #1
Year Percent Frequency of Key Species
Percent Live Basal Vegetation
Percent Litter Total
1982 4 1 89 94 1986 88 4 44 136 1998 39 13 40 92 2003 3 4 51 58 2010 6 4 44 54 2020 14 4 70 88 Overall Trend for Link Spring Key Area #1: () Static
The trend for Key Area # 1 was static from 1982 as compared to 2020. Data from 2020 showed that there was a 10 % increase in key species and a 3 % increase in basal vegetation. There was a 19 % decrease in litter. Overall, there was 6 % decrease which is within the +/- 10 % change threshold for static overall trend.
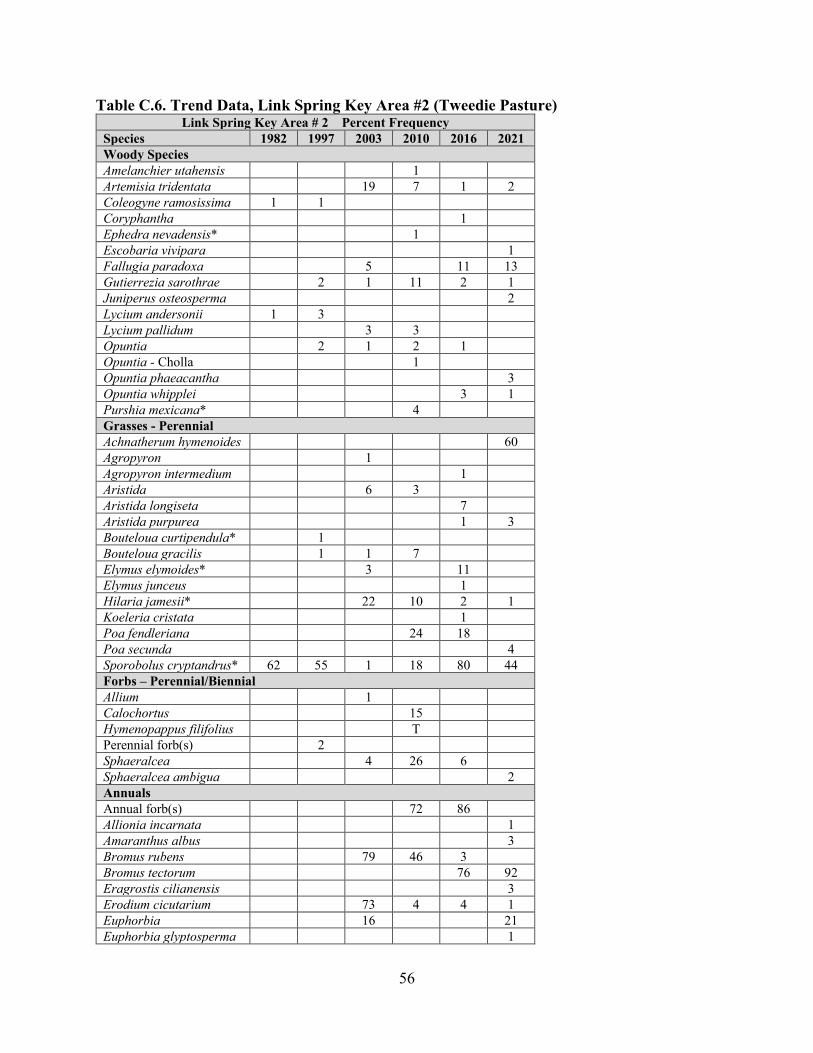
56
Table C.6. Trend Data, Link Spring Key Area #2 (Tweedie Pasture) Link Spring Key Area # 2 Percent Frequency
Species 1982 1997 2003 2010 2016 2021 Woody Species Amelanchier utahensis 1 Artemisia tridentata 19 7 1 2 Coleogyne ramosissima 1 1 Coryphantha 1 Ephedra nevadensis* 1 Escobaria vivipara 1 Fallugia paradoxa 5 11 13 Gutierrezia sarothrae 2 1 11 2 1 Juniperus osteosperma 2 Lycium andersonii 1 3 Lycium pallidum 3 3 Opuntia 2 1 2 1 Opuntia - Cholla 1 Opuntia phaeacantha 3 Opuntia whipplei 3 1 Purshia mexicana* 4 Grasses - Perennial Achnatherum hymenoides 60 Agropyron 1 Agropyron intermedium 1 Aristida 6 3 Aristida longiseta 7 Aristida purpurea 1 3 Bouteloua curtipendula* 1 Bouteloua gracilis 1 1 7 Elymus elymoides* 3 11 Elymus junceus 1 Hilaria jamesii* 22 10 2 1 Koeleria cristata 1 Poa fendleriana 24 18 Poa secunda 4 Sporobolus cryptandrus* 62 55 1 18 80 44 Forbs – Perennial/Biennial Allium 1 Calochortus 15 Hymenopappus filifolius T Perennial forb(s) 2 Sphaeralcea 4 26 6 Sphaeralcea ambigua 2 Annuals Annual forb(s) 72 86 Allionia incarnata 1 Amaranthus albus 3 Bromus rubens 79 46 3 Bromus tectorum 76 92 Eragrostis cilianensis 3 Erodium cicutarium 73 4 4 1 Euphorbia 16 21 Euphorbia glyptosperma 1
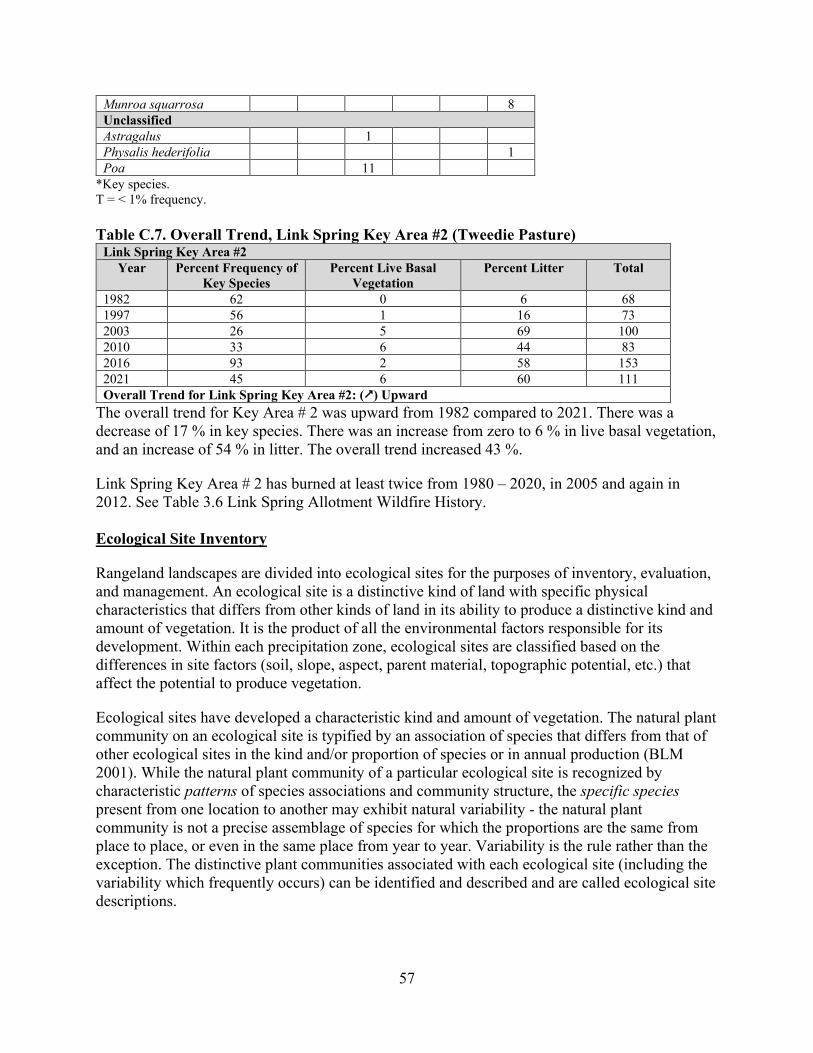
57
Munroa squarrosa 8 Unclassified Astragalus 1 Physalis hederifolia 1 Poa 11
*Key species. T = < 1% frequency. Table C.7. Overall Trend, Link Spring Key Area #2 (Tweedie Pasture)
Link Spring Key Area #2 Year Percent Frequency of
Key Species Percent Live Basal
Vegetation Percent Litter Total
1982 62 0 6 68 1997 56 1 16 73 2003 26 5 69 100 2010 33 6 44 83 2016 93 2 58 153 2021 45 6 60 111 Overall Trend for Link Spring Key Area #2: () Upward
The overall trend for Key Area # 2 was upward from 1982 compared to 2021. There was a decrease of 17 % in key species. There was an increase from zero to 6 % in live basal vegetation, and an increase of 54 % in litter. The overall trend increased 43 %.
Link Spring Key Area # 2 has burned at least twice from 1980 – 2020, in 2005 and again in 2012. See Table 3.6 Link Spring Allotment Wildfire History. Ecological Site Inventory
Rangeland landscapes are divided into ecological sites for the purposes of inventory, evaluation, and management. An ecological site is a distinctive kind of land with specific physical characteristics that differs from other kinds of land in its ability to produce a distinctive kind and amount of vegetation. It is the product of all the environmental factors responsible for its development. Within each precipitation zone, ecological sites are classified based on the differences in site factors (soil, slope, aspect, parent material, topographic potential, etc.) that affect the potential to produce vegetation.
Ecological sites have developed a characteristic kind and amount of vegetation. The natural plant community on an ecological site is typified by an association of species that differs from that of other ecological sites in the kind and/or proportion of species or in annual production (BLM 2001). While the natural plant community of a particular ecological site is recognized by characteristic patterns of species associations and community structure, the specific species present from one location to another may exhibit natural variability - the natural plant community is not a precise assemblage of species for which the proportions are the same from place to place, or even in the same place from year to year. Variability is the rule rather than the exception. The distinctive plant communities associated with each ecological site (including the variability which frequently occurs) can be identified and described and are called ecological site descriptions.
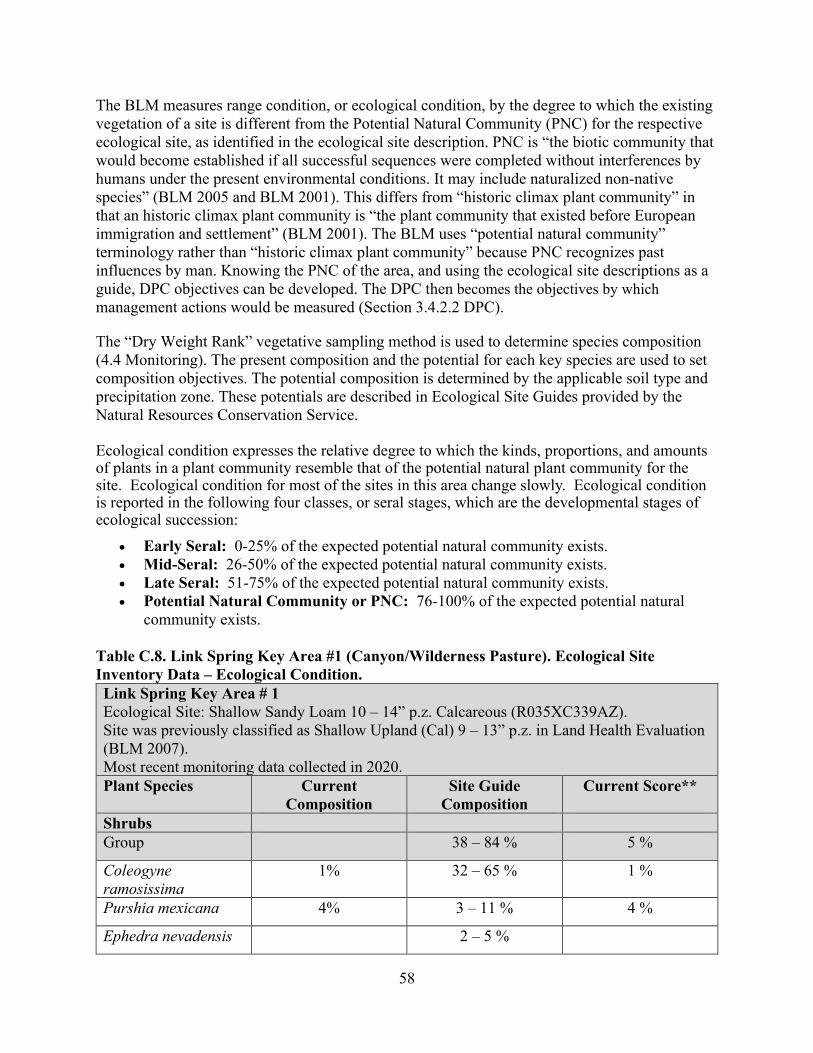
58
The BLM measures range condition, or ecological condition, by the degree to which the existing vegetation of a site is different from the Potential Natural Community (PNC) for the respective ecological site, as identified in the ecological site description. PNC is “the biotic community that would become established if all successful sequences were completed without interferences by humans under the present environmental conditions. It may include naturalized non-native species” (BLM 2005 and BLM 2001). This differs from “historic climax plant community” in that an historic climax plant community is “the plant community that existed before European immigration and settlement” (BLM 2001). The BLM uses “potential natural community” terminology rather than “historic climax plant community” because PNC recognizes past influences by man. Knowing the PNC of the area, and using the ecological site descriptions as a guide, DPC objectives can be developed. The DPC then becomes the objectives by which management actions would be measured (Section 3.4.2.2 DPC).
The “Dry Weight Rank” vegetative sampling method is used to determine species composition (4.4 Monitoring). The present composition and the potential for each key species are used to set composition objectives. The potential composition is determined by the applicable soil type and precipitation zone. These potentials are described in Ecological Site Guides provided by the Natural Resources Conservation Service.
Ecological condition expresses the relative degree to which the kinds, proportions, and amounts of plants in a plant community resemble that of the potential natural plant community for the site. Ecological condition for most of the sites in this area change slowly. Ecological condition is reported in the following four classes, or seral stages, which are the developmental stages of ecological succession:
• Early Seral: 0-25% of the expected potential natural community exists. • Mid-Seral: 26-50% of the expected potential natural community exists. • Late Seral: 51-75% of the expected potential natural community exists. • Potential Natural Community or PNC: 76-100% of the expected potential natural
community exists.
Table C.8. Link Spring Key Area #1 (Canyon/Wilderness Pasture). Ecological Site Inventory Data – Ecological Condition. Link Spring Key Area # 1 Ecological Site: Shallow Sandy Loam 10 – 14” p.z. Calcareous (R035XC339AZ). Site was previously classified as Shallow Upland (Cal) 9 – 13” p.z. in Land Health Evaluation (BLM 2007). Most recent monitoring data collected in 2020. Plant Species Current
Composition Site Guide
Composition Current Score**
Shrubs Group 38 – 84 % 5 %
Coleogyne ramosissima
1% 32 – 65 % 1 %
Purshia mexicana 4% 3 – 11 % 4 %
Ephedra nevadensis 2 – 5 %
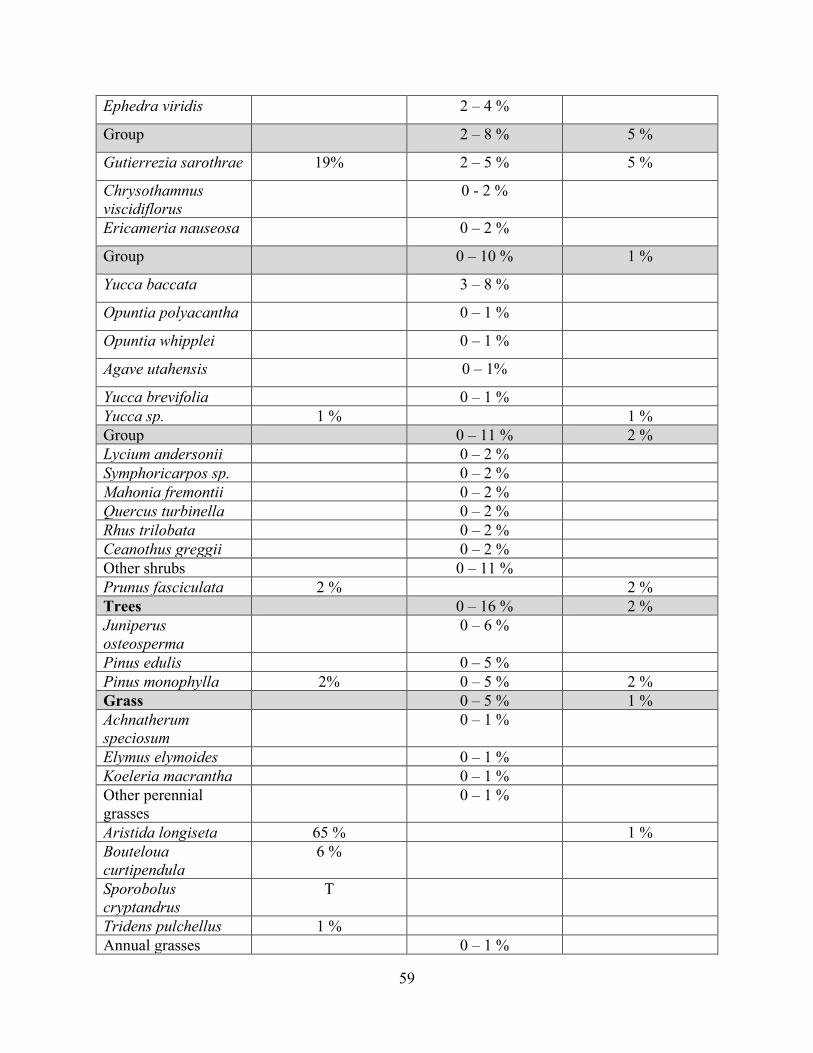
59
Ephedra viridis 2 – 4 %
Group 2 – 8 % 5 %
Gutierrezia sarothrae 19% 2 – 5 % 5 %
Chrysothamnus viscidiflorus
0 - 2 %
Ericameria nauseosa 0 – 2 %
Group 0 – 10 % 1 %
Yucca baccata 3 – 8 %
Opuntia polyacantha 0 – 1 %
Opuntia whipplei 0 – 1 %
Agave utahensis 0 – 1%
Yucca brevifolia 0 – 1 % Yucca sp. 1 % 1 % Group 0 – 11 % 2 % Lycium andersonii 0 – 2 % Symphoricarpos sp. 0 – 2 % Mahonia fremontii 0 – 2 % Quercus turbinella 0 – 2 % Rhus trilobata 0 – 2 % Ceanothus greggii 0 – 2 % Other shrubs 0 – 11 % Prunus fasciculata 2 % 2 % Trees 0 – 16 % 2 % Juniperus osteosperma
0 – 6 %
Pinus edulis 0 – 5 % Pinus monophylla 2% 0 – 5 % 2 % Grass 0 – 5 % 1 % Achnatherum speciosum
0 – 1 %
Elymus elymoides 0 – 1 % Koeleria macrantha 0 – 1 % Other perennial grasses
0 – 1 %
Aristida longiseta 65 % 1 % Bouteloua curtipendula
6 %
Sporobolus cryptandrus
T
Tridens pulchellus 1 % Annual grasses 0 – 1 %
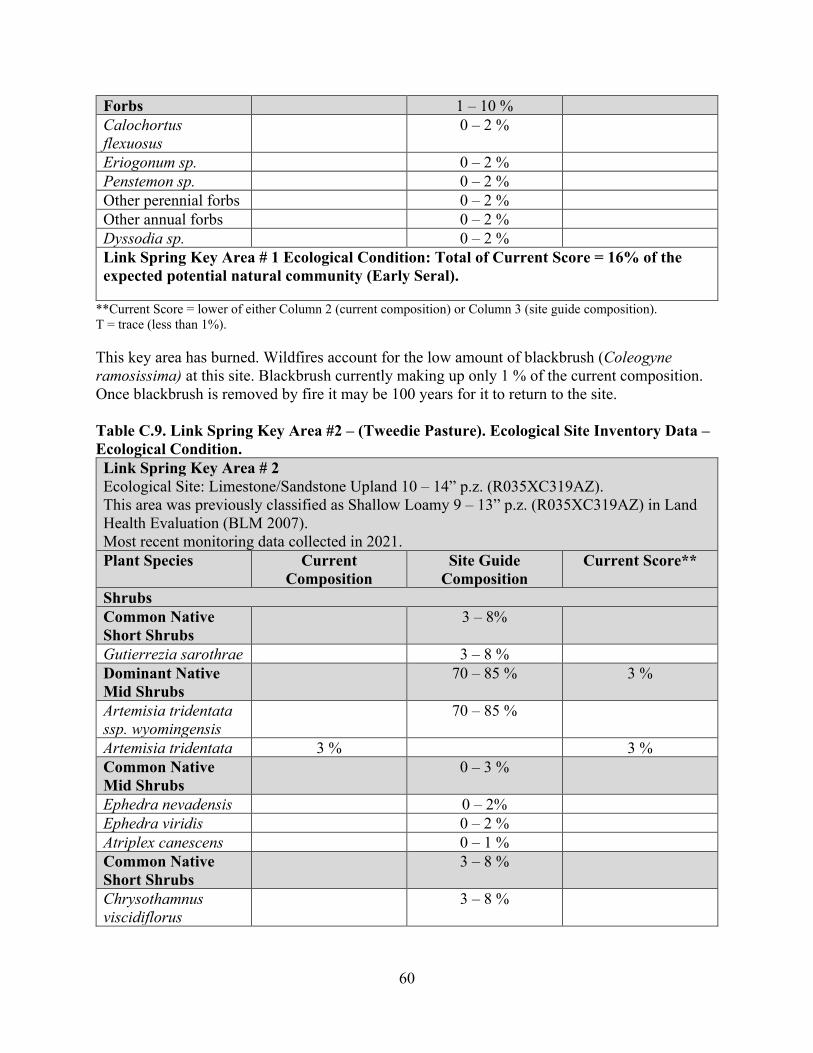
60
Forbs 1 – 10 % Calochortus flexuosus
0 – 2 %
Eriogonum sp. 0 – 2 % Penstemon sp. 0 – 2 % Other perennial forbs 0 – 2 % Other annual forbs 0 – 2 % Dyssodia sp. 0 – 2 % Link Spring Key Area # 1 Ecological Condition: Total of Current Score = 16% of the expected potential natural community (Early Seral).
**Current Score = lower of either Column 2 (current composition) or Column 3 (site guide composition). T = trace (less than 1%).
This key area has burned. Wildfires account for the low amount of blackbrush (Coleogyne ramosissima) at this site. Blackbrush currently making up only 1 % of the current composition. Once blackbrush is removed by fire it may be 100 years for it to return to the site. Table C.9. Link Spring Key Area #2 – (Tweedie Pasture). Ecological Site Inventory Data – Ecological Condition. Link Spring Key Area # 2 Ecological Site: Limestone/Sandstone Upland 10 – 14” p.z. (R035XC319AZ). This area was previously classified as Shallow Loamy 9 – 13” p.z. (R035XC319AZ) in Land Health Evaluation (BLM 2007). Most recent monitoring data collected in 2021. Plant Species Current
Composition Site Guide
Composition Current Score**
Shrubs Common Native Short Shrubs
3 – 8%
Gutierrezia sarothrae 3 – 8 % Dominant Native Mid Shrubs
70 – 85 % 3 %
Artemisia tridentata ssp. wyomingensis
70 – 85 %
Artemisia tridentata 3 % 3 % Common Native Mid Shrubs
0 – 3 %
Ephedra nevadensis 0 – 2% Ephedra viridis 0 – 2 % Atriplex canescens 0 – 1 % Common Native Short Shrubs
3 – 8 %
Chrysothamnus viscidiflorus
3 – 8 %
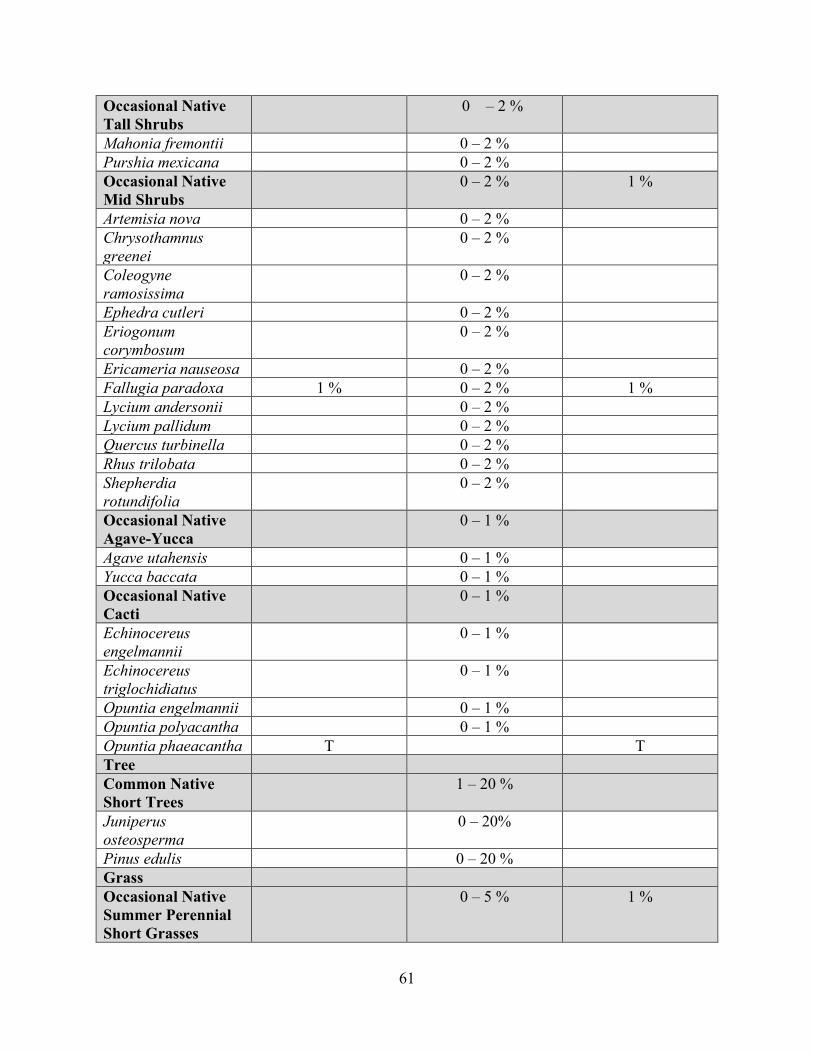
61
Occasional Native Tall Shrubs
0 – 2 %
Mahonia fremontii 0 – 2 % Purshia mexicana 0 – 2 % Occasional Native Mid Shrubs
0 – 2 % 1 %
Artemisia nova 0 – 2 % Chrysothamnus greenei
0 – 2 %
Coleogyne ramosissima
0 – 2 %
Ephedra cutleri 0 – 2 % Eriogonum corymbosum
0 – 2 %
Ericameria nauseosa 0 – 2 % Fallugia paradoxa 1 % 0 – 2 % 1 % Lycium andersonii 0 – 2 % Lycium pallidum 0 – 2 % Quercus turbinella 0 – 2 % Rhus trilobata 0 – 2 % Shepherdia rotundifolia
0 – 2 %
Occasional Native Agave-Yucca
0 – 1 %
Agave utahensis 0 – 1 % Yucca baccata 0 – 1 % Occasional Native Cacti
0 – 1 %
Echinocereus engelmannii
0 – 1 %
Echinocereus triglochidiatus
0 – 1 %
Opuntia engelmannii 0 – 1 % Opuntia polyacantha 0 – 1 % Opuntia phaeacantha T T Tree Common Native Short Trees
1 – 20 %
Juniperus osteosperma
0 – 20%
Pinus edulis 0 – 20 % Grass Occasional Native Summer Perennial Short Grasses
0 – 5 % 1 %
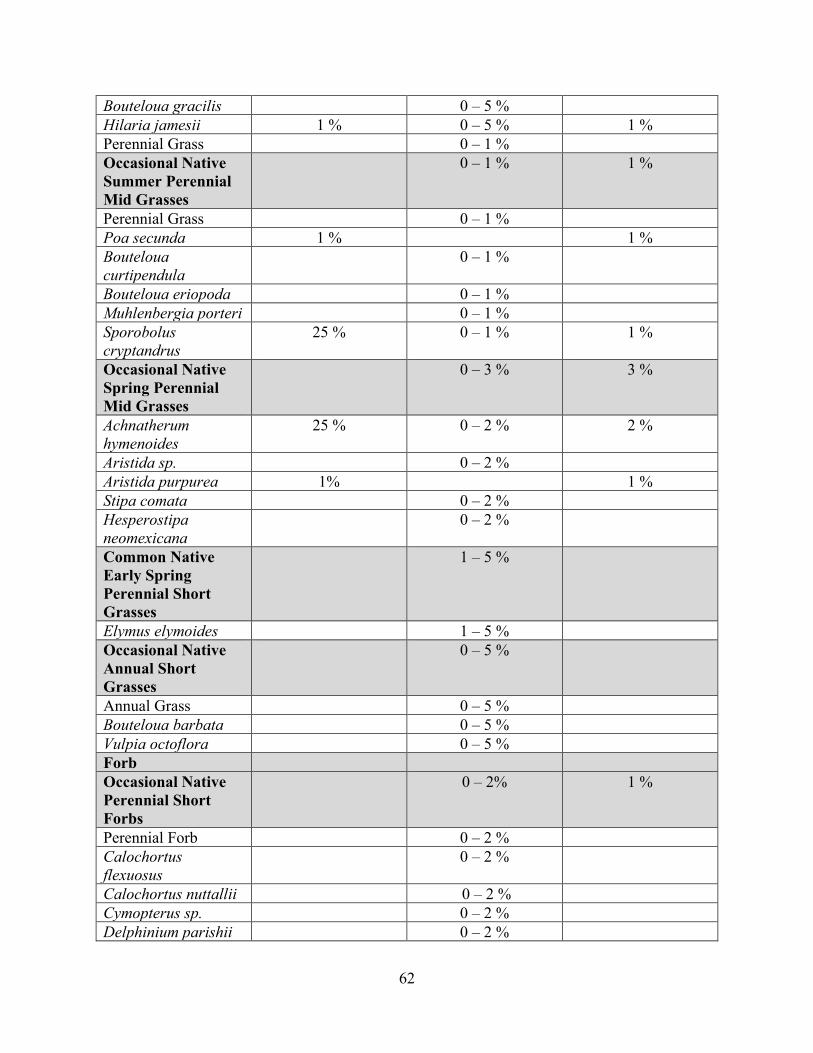
62
Bouteloua gracilis 0 – 5 % Hilaria jamesii 1 % 0 – 5 % 1 % Perennial Grass 0 – 1 % Occasional Native Summer Perennial Mid Grasses
0 – 1 % 1 %
Perennial Grass 0 – 1 % Poa secunda 1 % 1 % Bouteloua curtipendula
0 – 1 %
Bouteloua eriopoda 0 – 1 % Muhlenbergia porteri 0 – 1 % Sporobolus cryptandrus
25 % 0 – 1 % 1 %
Occasional Native Spring Perennial Mid Grasses
0 – 3 % 3 %
Achnatherum hymenoides
25 % 0 – 2 % 2 %
Aristida sp. 0 – 2 % Aristida purpurea 1% 1 % Stipa comata 0 – 2 % Hesperostipa neomexicana
0 – 2 %
Common Native Early Spring Perennial Short Grasses
1 – 5 %
Elymus elymoides 1 – 5 % Occasional Native Annual Short Grasses
0 – 5 %
Annual Grass 0 – 5 % Bouteloua barbata 0 – 5 % Vulpia octoflora 0 – 5 % Forb Occasional Native Perennial Short Forbs
0 – 2% 1 %
Perennial Forb 0 – 2 % Calochortus flexuosus
0 – 2 %
Calochortus nuttallii 0 – 2 % Cymopterus sp. 0 – 2 % Delphinium parishii 0 – 2 %
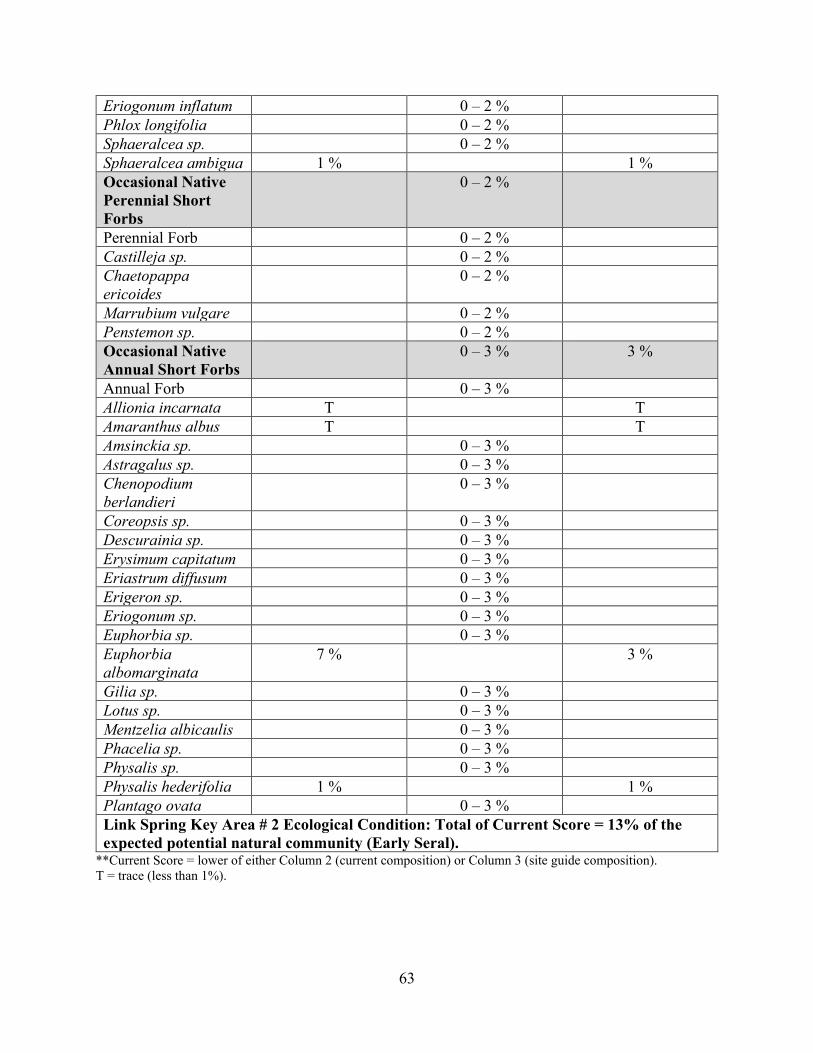
63
Eriogonum inflatum 0 – 2 % Phlox longifolia 0 – 2 % Sphaeralcea sp. 0 – 2 % Sphaeralcea ambigua 1 % 1 % Occasional Native Perennial Short Forbs
0 – 2 %
Perennial Forb 0 – 2 % Castilleja sp. 0 – 2 % Chaetopappa ericoides
0 – 2 %
Marrubium vulgare 0 – 2 % Penstemon sp. 0 – 2 % Occasional Native Annual Short Forbs
0 – 3 % 3 %
Annual Forb 0 – 3 % Allionia incarnata T T Amaranthus albus T T Amsinckia sp. 0 – 3 % Astragalus sp. 0 – 3 % Chenopodium berlandieri
0 – 3 %
Coreopsis sp. 0 – 3 % Descurainia sp. 0 – 3 % Erysimum capitatum 0 – 3 % Eriastrum diffusum 0 – 3 % Erigeron sp. 0 – 3 % Eriogonum sp. 0 – 3 % Euphorbia sp. 0 – 3 % Euphorbia albomarginata
7 % 3 %
Gilia sp. 0 – 3 % Lotus sp. 0 – 3 % Mentzelia albicaulis 0 – 3 % Phacelia sp. 0 – 3 % Physalis sp. 0 – 3 % Physalis hederifolia 1 % 1 % Plantago ovata 0 – 3 % Link Spring Key Area # 2 Ecological Condition: Total of Current Score = 13% of the expected potential natural community (Early Seral).
**Current Score = lower of either Column 2 (current composition) or Column 3 (site guide composition). T = trace (less than 1%).
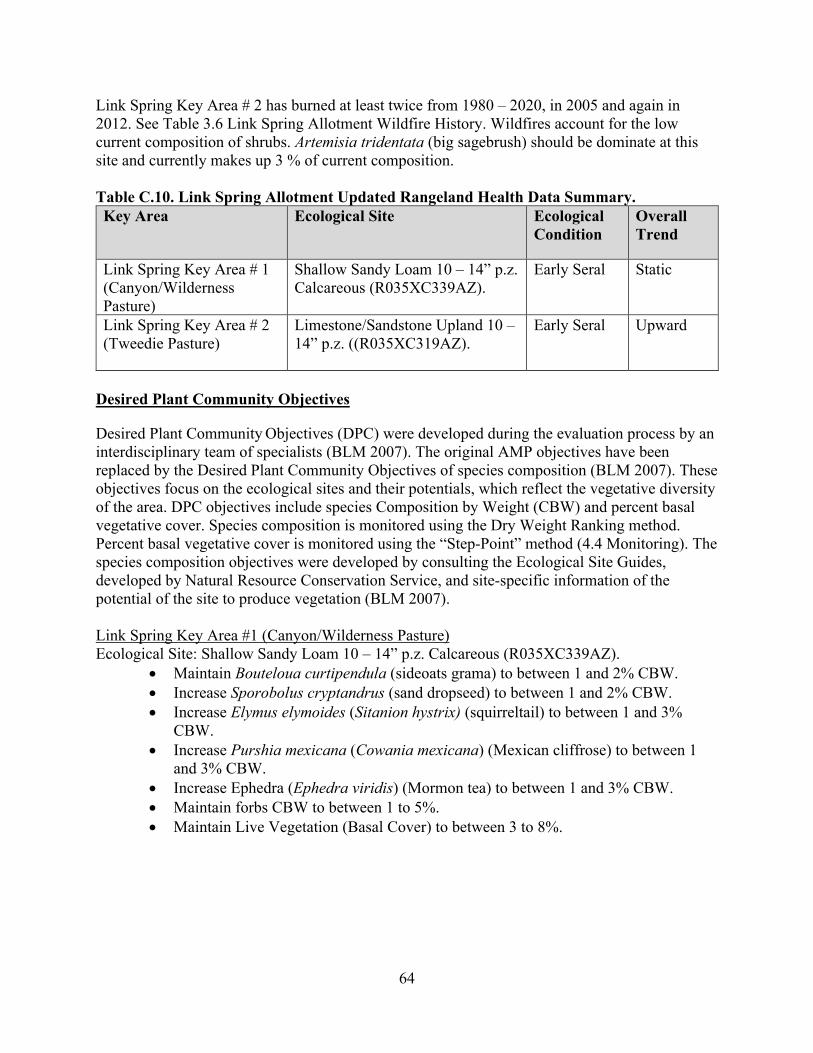
64
Link Spring Key Area # 2 has burned at least twice from 1980 – 2020, in 2005 and again in 2012. See Table 3.6 Link Spring Allotment Wildfire History. Wildfires account for the low current composition of shrubs. Artemisia tridentata (big sagebrush) should be dominate at this site and currently makes up 3 % of current composition. Table C.10. Link Spring Allotment Updated Rangeland Health Data Summary. Key Area Ecological Site Ecological
Condition Overall Trend
Link Spring Key Area # 1 (Canyon/Wilderness Pasture)
Shallow Sandy Loam 10 – 14” p.z. Calcareous (R035XC339AZ).
Early Seral Static
Link Spring Key Area # 2 (Tweedie Pasture)
Limestone/Sandstone Upland 10 – 14” p.z. ((R035XC319AZ).
Early Seral Upward
Desired Plant Community Objectives
Desired Plant Community Objectives (DPC) were developed during the evaluation process by an interdisciplinary team of specialists (BLM 2007). The original AMP objectives have been replaced by the Desired Plant Community Objectives of species composition (BLM 2007). These objectives focus on the ecological sites and their potentials, which reflect the vegetative diversity of the area. DPC objectives include species Composition by Weight (CBW) and percent basal vegetative cover. Species composition is monitored using the Dry Weight Ranking method. Percent basal vegetative cover is monitored using the “Step-Point” method (4.4 Monitoring). The species composition objectives were developed by consulting the Ecological Site Guides, developed by Natural Resource Conservation Service, and site-specific information of the potential of the site to produce vegetation (BLM 2007). Link Spring Key Area #1 (Canyon/Wilderness Pasture) Ecological Site: Shallow Sandy Loam 10 – 14” p.z. Calcareous (R035XC339AZ).
• Maintain Bouteloua curtipendula (sideoats grama) to between 1 and 2% CBW. • Increase Sporobolus cryptandrus (sand dropseed) to between 1 and 2% CBW. • Increase Elymus elymoides (Sitanion hystrix) (squirreltail) to between 1 and 3%
CBW. • Increase Purshia mexicana (Cowania mexicana) (Mexican cliffrose) to between 1
and 3% CBW. • Increase Ephedra (Ephedra viridis) (Mormon tea) to between 1 and 3% CBW. • Maintain forbs CBW to between 1 to 5%. • Maintain Live Vegetation (Basal Cover) to between 3 to 8%.
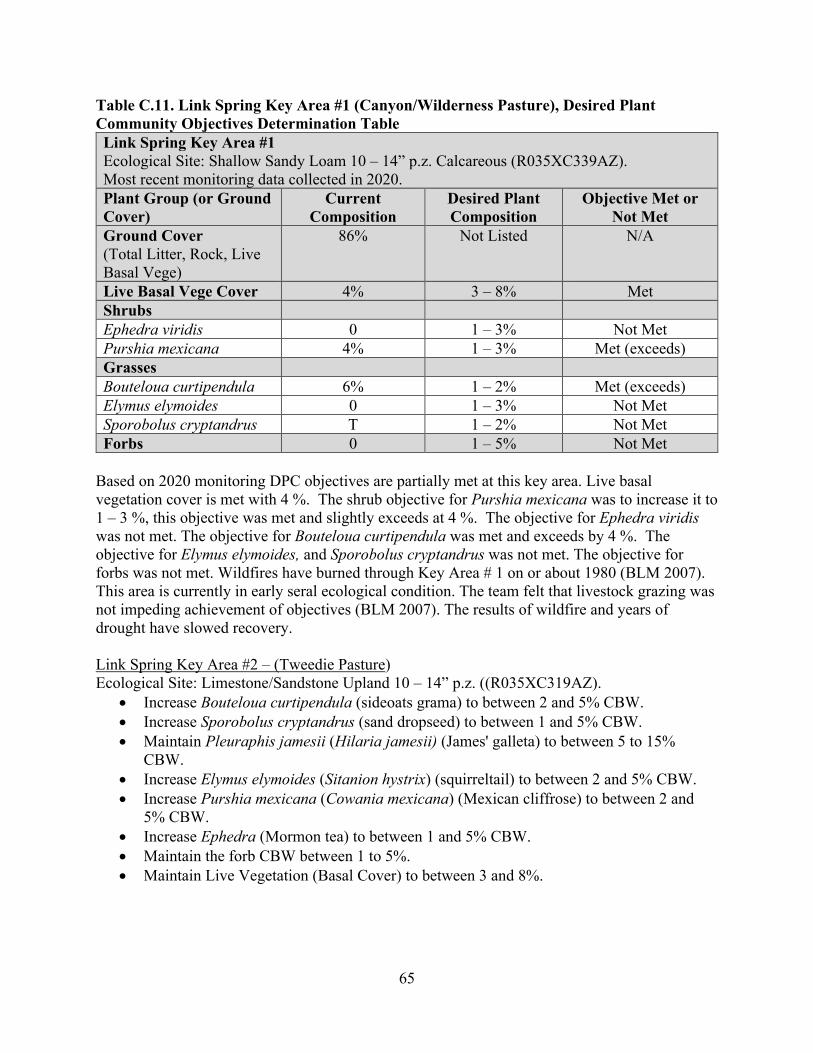
65
Table C.11. Link Spring Key Area #1 (Canyon/Wilderness Pasture), Desired Plant Community Objectives Determination Table Link Spring Key Area #1 Ecological Site: Shallow Sandy Loam 10 – 14” p.z. Calcareous (R035XC339AZ). Most recent monitoring data collected in 2020. Plant Group (or Ground Cover)
Current Composition
Desired Plant Composition
Objective Met or Not Met
Ground Cover (Total Litter, Rock, Live Basal Vege)
86% Not Listed N/A
Live Basal Vege Cover 4% 3 – 8% Met Shrubs Ephedra viridis 0 1 – 3% Not Met Purshia mexicana 4% 1 – 3% Met (exceeds) Grasses Bouteloua curtipendula 6% 1 – 2% Met (exceeds) Elymus elymoides 0 1 – 3% Not Met Sporobolus cryptandrus T 1 – 2% Not Met Forbs 0 1 – 5% Not Met
Based on 2020 monitoring DPC objectives are partially met at this key area. Live basal vegetation cover is met with 4 %. The shrub objective for Purshia mexicana was to increase it to 1 – 3 %, this objective was met and slightly exceeds at 4 %. The objective for Ephedra viridis was not met. The objective for Bouteloua curtipendula was met and exceeds by 4 %. The objective for Elymus elymoides, and Sporobolus cryptandrus was not met. The objective for forbs was not met. Wildfires have burned through Key Area # 1 on or about 1980 (BLM 2007). This area is currently in early seral ecological condition. The team felt that livestock grazing was not impeding achievement of objectives (BLM 2007). The results of wildfire and years of drought have slowed recovery. Link Spring Key Area #2 – (Tweedie Pasture) Ecological Site: Limestone/Sandstone Upland 10 – 14” p.z. ((R035XC319AZ).
• Increase Bouteloua curtipendula (sideoats grama) to between 2 and 5% CBW. • Increase Sporobolus cryptandrus (sand dropseed) to between 1 and 5% CBW. • Maintain Pleuraphis jamesii (Hilaria jamesii) (James' galleta) to between 5 to 15%
CBW. • Increase Elymus elymoides (Sitanion hystrix) (squirreltail) to between 2 and 5% CBW. • Increase Purshia mexicana (Cowania mexicana) (Mexican cliffrose) to between 2 and
5% CBW. • Increase Ephedra (Mormon tea) to between 1 and 5% CBW. • Maintain the forb CBW between 1 to 5%. • Maintain Live Vegetation (Basal Cover) to between 3 and 8%.
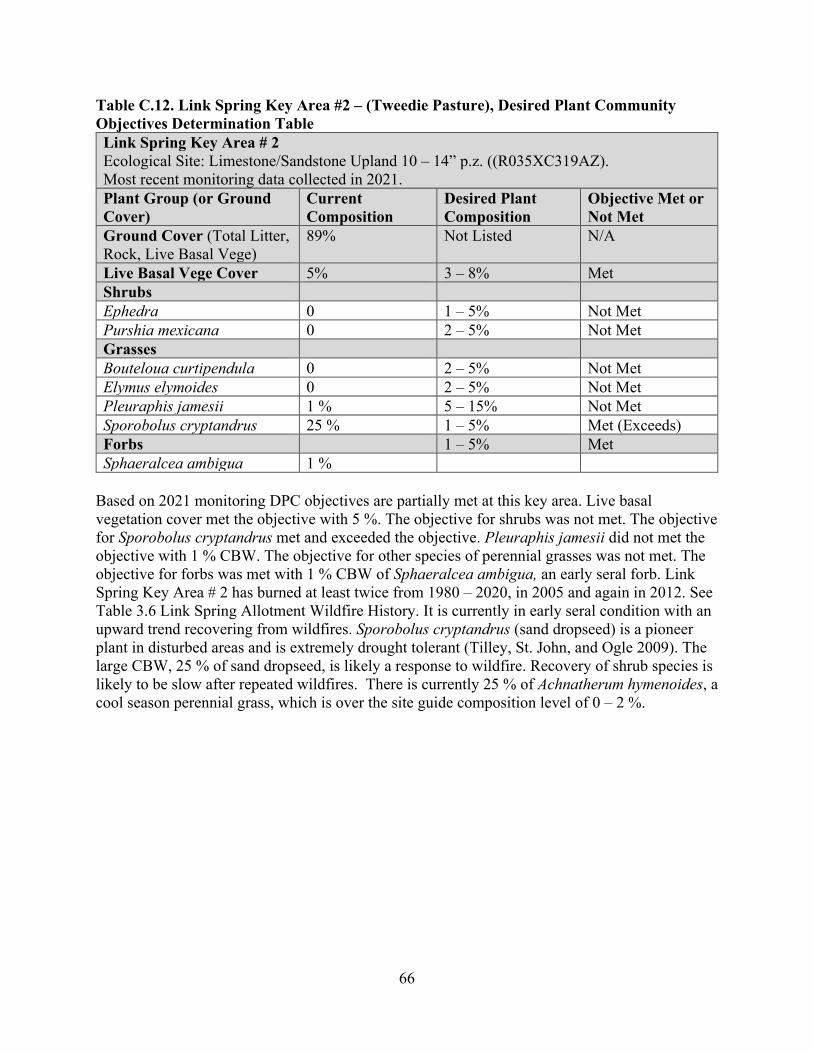
66
Table C.12. Link Spring Key Area #2 – (Tweedie Pasture), Desired Plant Community Objectives Determination Table Link Spring Key Area # 2 Ecological Site: Limestone/Sandstone Upland 10 – 14” p.z. ((R035XC319AZ). Most recent monitoring data collected in 2021. Plant Group (or Ground Cover)
Current Composition
Desired Plant Composition
Objective Met or Not Met
Ground Cover (Total Litter, Rock, Live Basal Vege)
89% Not Listed N/A
Live Basal Vege Cover 5% 3 – 8% Met Shrubs Ephedra 0 1 – 5% Not Met Purshia mexicana 0 2 – 5% Not Met Grasses Bouteloua curtipendula 0 2 – 5% Not Met Elymus elymoides 0 2 – 5% Not Met Pleuraphis jamesii 1 % 5 – 15% Not Met Sporobolus cryptandrus 25 % 1 – 5% Met (Exceeds) Forbs 1 – 5% Met Sphaeralcea ambigua 1 %
Based on 2021 monitoring DPC objectives are partially met at this key area. Live basal vegetation cover met the objective with 5 %. The objective for shrubs was not met. The objective for Sporobolus cryptandrus met and exceeded the objective. Pleuraphis jamesii did not met the objective with 1 % CBW. The objective for other species of perennial grasses was not met. The objective for forbs was met with 1 % CBW of Sphaeralcea ambigua, an early seral forb. Link Spring Key Area # 2 has burned at least twice from 1980 – 2020, in 2005 and again in 2012. See Table 3.6 Link Spring Allotment Wildfire History. It is currently in early seral condition with an upward trend recovering from wildfires. Sporobolus cryptandrus (sand dropseed) is a pioneer plant in disturbed areas and is extremely drought tolerant (Tilley, St. John, and Ogle 2009). The large CBW, 25 % of sand dropseed, is likely a response to wildfire. Recovery of shrub species is likely to be slow after repeated wildfires. There is currently 25 % of Achnatherum hymenoides, a cool season perennial grass, which is over the site guide composition level of 0 – 2 %.
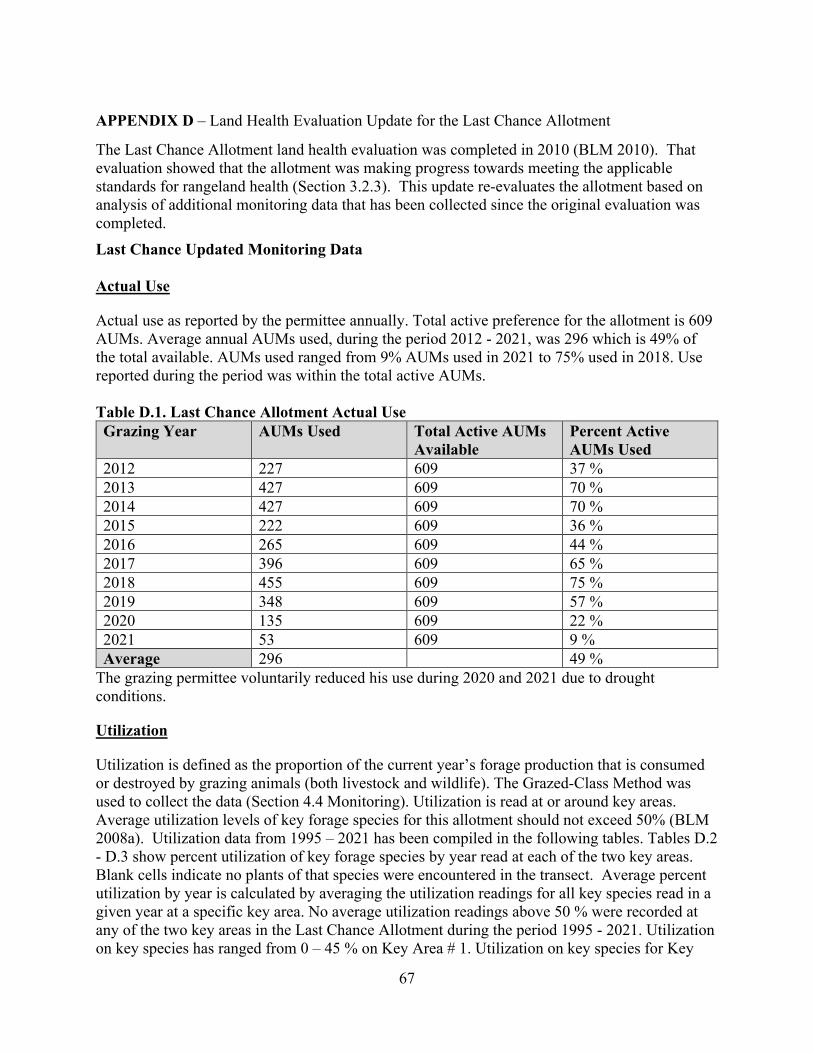
67
APPENDIX D – Land Health Evaluation Update for the Last Chance Allotment
The Last Chance Allotment land health evaluation was completed in 2010 (BLM 2010). That evaluation showed that the allotment was making progress towards meeting the applicable standards for rangeland health (Section 3.2.3). This update re-evaluates the allotment based on analysis of additional monitoring data that has been collected since the original evaluation was completed. Last Chance Updated Monitoring Data Actual Use
Actual use as reported by the permittee annually. Total active preference for the allotment is 609 AUMs. Average annual AUMs used, during the period 2012 - 2021, was 296 which is 49% of the total available. AUMs used ranged from 9% AUMs used in 2021 to 75% used in 2018. Use reported during the period was within the total active AUMs. Table D.1. Last Chance Allotment Actual Use Grazing Year AUMs Used Total Active AUMs
Available Percent Active AUMs Used
2012 227 609 37 % 2013 427 609 70 % 2014 427 609 70 % 2015 222 609 36 % 2016 265 609 44 % 2017 396 609 65 % 2018 455 609 75 % 2019 348 609 57 % 2020 135 609 22 % 2021 53 609 9 % Average 296 49 %
The grazing permittee voluntarily reduced his use during 2020 and 2021 due to drought conditions.
Utilization
Utilization is defined as the proportion of the current year’s forage production that is consumed or destroyed by grazing animals (both livestock and wildlife). The Grazed-Class Method was used to collect the data (Section 4.4 Monitoring). Utilization is read at or around key areas. Average utilization levels of key forage species for this allotment should not exceed 50% (BLM 2008a). Utilization data from 1995 – 2021 has been compiled in the following tables. Tables D.2 - D.3 show percent utilization of key forage species by year read at each of the two key areas. Blank cells indicate no plants of that species were encountered in the transect. Average percent utilization by year is calculated by averaging the utilization readings for all key species read in a given year at a specific key area. No average utilization readings above 50 % were recorded at any of the two key areas in the Last Chance Allotment during the period 1995 - 2021. Utilization on key species has ranged from 0 – 45 % on Key Area # 1. Utilization on key species for Key
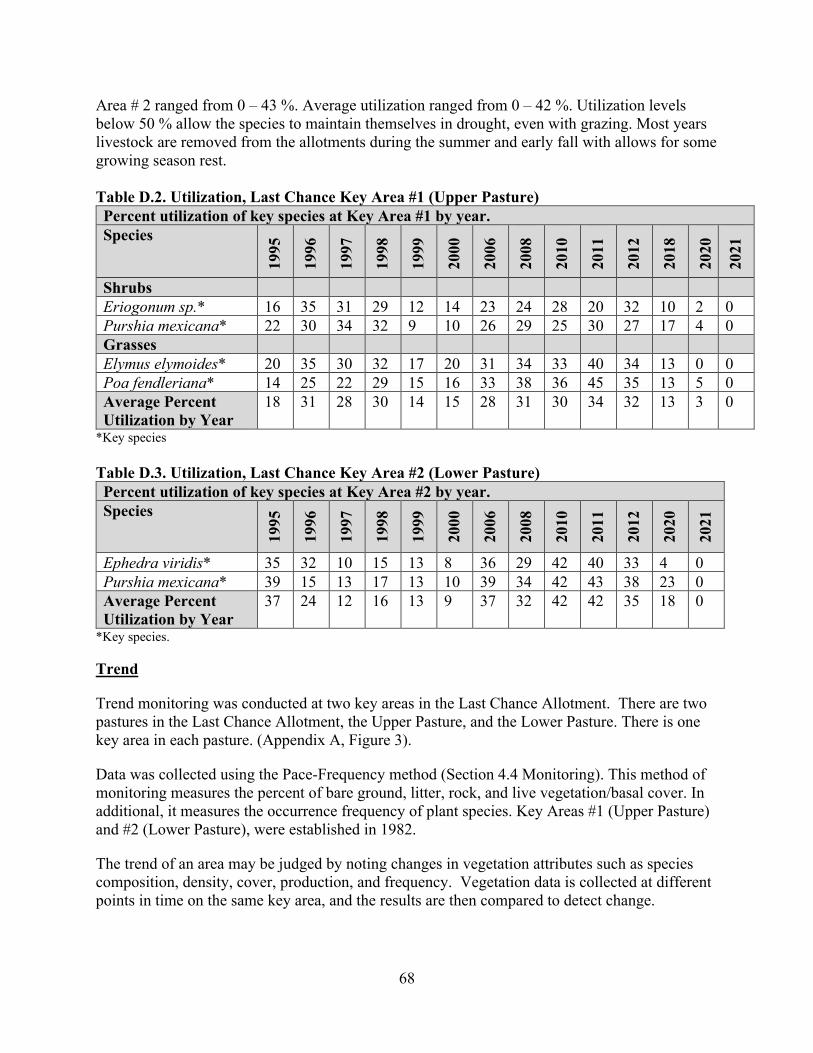
68
Area # 2 ranged from 0 – 43 %. Average utilization ranged from 0 – 42 %. Utilization levels below 50 % allow the species to maintain themselves in drought, even with grazing. Most years livestock are removed from the allotments during the summer and early fall with allows for some growing season rest. Table D.2. Utilization, Last Chance Key Area #1 (Upper Pasture) Percent utilization of key species at Key Area #1 by year. Species
1995
1996
1997
1998
1999
2000
2006
2008
2010
2011
2012
2018
2020
2021
Shrubs Eriogonum sp.* 16 35 31 29 12 14 23 24 28 20 32 10 2 0 Purshia mexicana* 22 30 34 32 9 10 26 29 25 30 27 17 4 0 Grasses Elymus elymoides* 20 35 30 32 17 20 31 34 33 40 34 13 0 0 Poa fendleriana* 14 25 22 29 15 16 33 38 36 45 35 13 5 0 Average Percent Utilization by Year
18 31 28 30 14 15 28 31 30 34 32 13 3 0
*Key species Table D.3. Utilization, Last Chance Key Area #2 (Lower Pasture) Percent utilization of key species at Key Area #2 by year. Species
1995
1996
1997
1998
1999
2000
2006
2008
2010
2011
2012
2020
2021
Ephedra viridis* 35 32 10 15 13 8 36 29 42 40 33 4 0 Purshia mexicana* 39 15 13 17 13 10 39 34 42 43 38 23 0 Average Percent Utilization by Year
37 24 12 16 13 9 37 32 42 42 35 18 0
*Key species. Trend
Trend monitoring was conducted at two key areas in the Last Chance Allotment. There are two pastures in the Last Chance Allotment, the Upper Pasture, and the Lower Pasture. There is one key area in each pasture. (Appendix A, Figure 3).
Data was collected using the Pace-Frequency method (Section 4.4 Monitoring). This method of monitoring measures the percent of bare ground, litter, rock, and live vegetation/basal cover. In additional, it measures the occurrence frequency of plant species. Key Areas #1 (Upper Pasture) and #2 (Lower Pasture), were established in 1982.
The trend of an area may be judged by noting changes in vegetation attributes such as species composition, density, cover, production, and frequency. Vegetation data is collected at different points in time on the same key area, and the results are then compared to detect change.
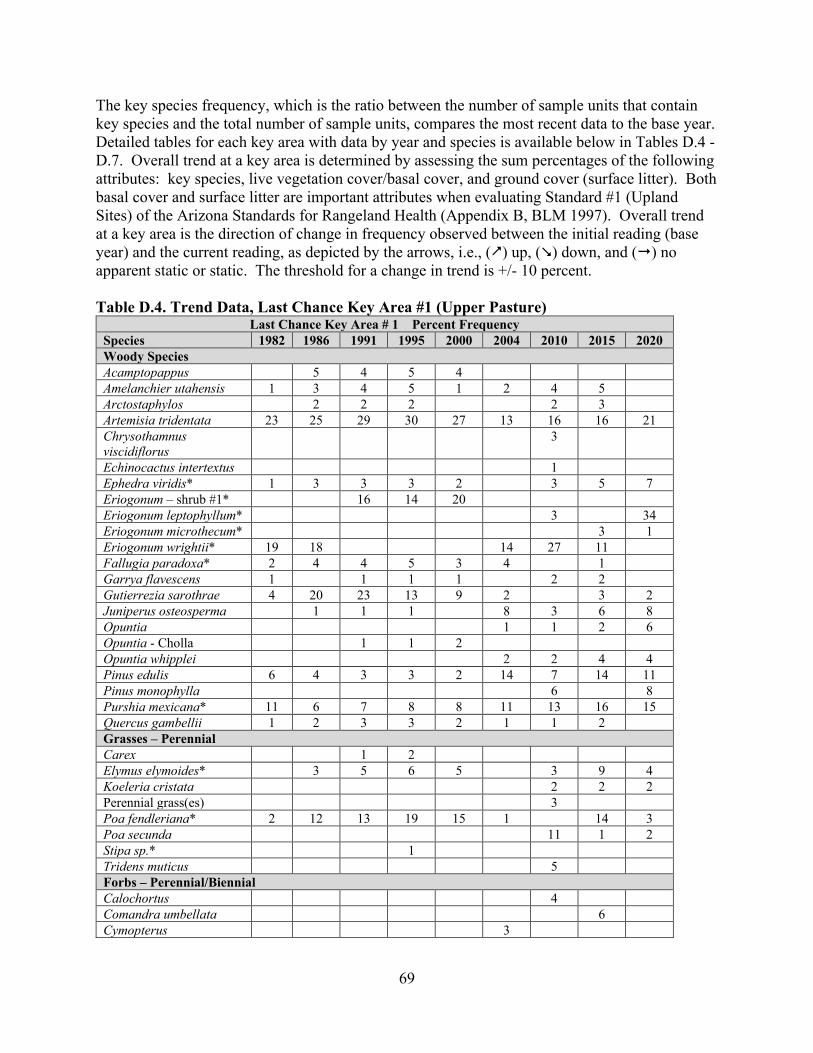
69
The key species frequency, which is the ratio between the number of sample units that contain key species and the total number of sample units, compares the most recent data to the base year. Detailed tables for each key area with data by year and species is available below in Tables D.4 - D.7. Overall trend at a key area is determined by assessing the sum percentages of the following attributes: key species, live vegetation cover/basal cover, and ground cover (surface litter). Both basal cover and surface litter are important attributes when evaluating Standard #1 (Upland Sites) of the Arizona Standards for Rangeland Health (Appendix B, BLM 1997). Overall trend at a key area is the direction of change in frequency observed between the initial reading (base year) and the current reading, as depicted by the arrows, i.e., () up, () down, and () no apparent static or static. The threshold for a change in trend is +/- 10 percent. Table D.4. Trend Data, Last Chance Key Area #1 (Upper Pasture)
Last Chance Key Area # 1 Percent Frequency Species 1982 1986 1991 1995 2000 2004 2010 2015 2020 Woody Species Acamptopappus 5 4 5 4 Amelanchier utahensis 1 3 4 5 1 2 4 5 Arctostaphylos 2 2 2 2 3 Artemisia tridentata 23 25 29 30 27 13 16 16 21 Chrysothamnus viscidiflorus
3
Echinocactus intertextus 1 Ephedra viridis* 1 3 3 3 2 3 5 7 Eriogonum – shrub #1* 16 14 20 Eriogonum leptophyllum* 3 34 Eriogonum microthecum* 3 1 Eriogonum wrightii* 19 18 14 27 11 Fallugia paradoxa* 2 4 4 5 3 4 1 Garrya flavescens 1 1 1 1 2 2 Gutierrezia sarothrae 4 20 23 13 9 2 3 2 Juniperus osteosperma 1 1 1 8 3 6 8 Opuntia 1 1 2 6 Opuntia - Cholla 1 1 2 Opuntia whipplei 2 2 4 4 Pinus edulis 6 4 3 3 2 14 7 14 11 Pinus monophylla 6 8 Purshia mexicana* 11 6 7 8 8 11 13 16 15 Quercus gambellii 1 2 3 3 2 1 1 2 Grasses – Perennial Carex 1 2 Elymus elymoides* 3 5 6 5 3 9 4 Koeleria cristata 2 2 2 Perennial grass(es) 3 Poa fendleriana* 2 12 13 19 15 1 14 3 Poa secunda 11 1 2 Stipa sp.* 1 Tridens muticus 5 Forbs – Perennial/Biennial Calochortus 4 Comandra umbellata 6 Cymopterus 3
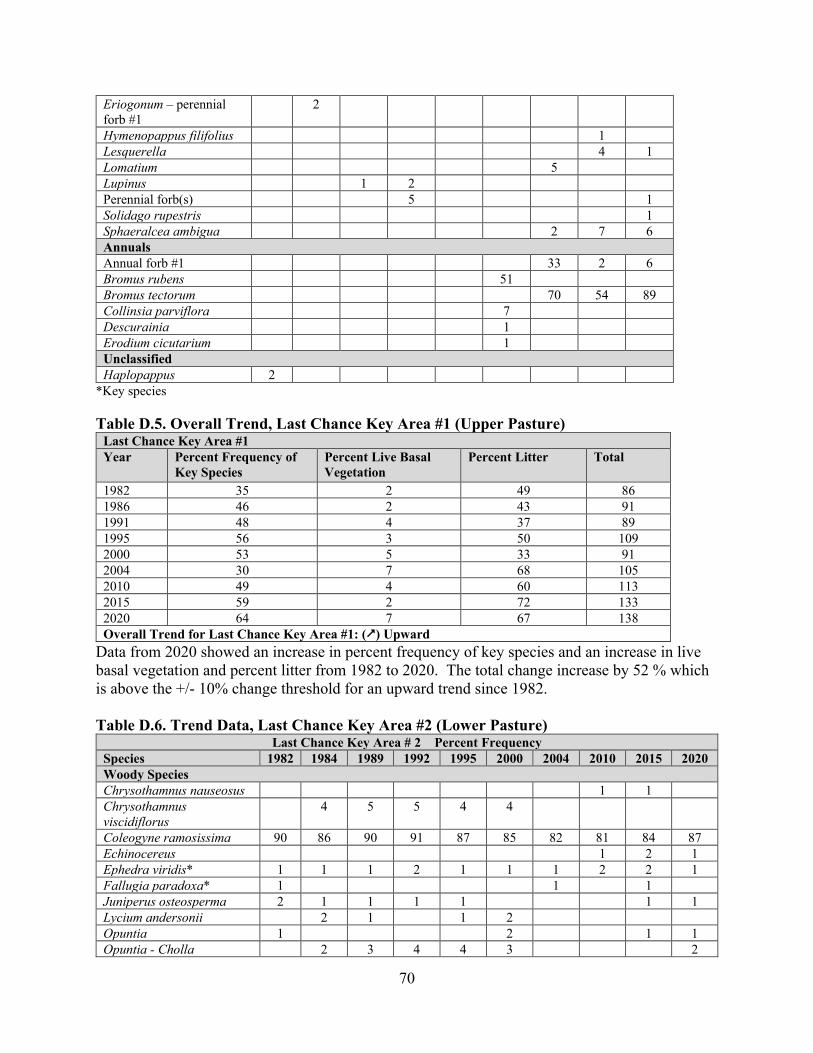
70
Eriogonum – perennial forb #1
2
Hymenopappus filifolius 1 Lesquerella 4 1 Lomatium 5 Lupinus 1 2 Perennial forb(s) 5 1 Solidago rupestris 1 Sphaeralcea ambigua 2 7 6 Annuals Annual forb #1 33 2 6 Bromus rubens 51 Bromus tectorum 70 54 89 Collinsia parviflora 7 Descurainia 1 Erodium cicutarium 1 Unclassified Haplopappus 2
*Key species
Table D.5. Overall Trend, Last Chance Key Area #1 (Upper Pasture) Last Chance Key Area #1 Year Percent Frequency of
Key Species Percent Live Basal Vegetation
Percent Litter Total
1982 35 2 49 86 1986 46 2 43 91 1991 48 4 37 89 1995 56 3 50 109 2000 53 5 33 91 2004 30 7 68 105 2010 49 4 60 113 2015 59 2 72 133 2020 64 7 67 138 Overall Trend for Last Chance Key Area #1: () Upward
Data from 2020 showed an increase in percent frequency of key species and an increase in live basal vegetation and percent litter from 1982 to 2020. The total change increase by 52 % which is above the +/- 10% change threshold for an upward trend since 1982. Table D.6. Trend Data, Last Chance Key Area #2 (Lower Pasture)
Last Chance Key Area # 2 Percent Frequency Species 1982 1984 1989 1992 1995 2000 2004 2010 2015 2020 Woody Species Chrysothamnus nauseosus 1 1 Chrysothamnus viscidiflorus
4 5 5 4 4
Coleogyne ramosissima 90 86 90 91 87 85 82 81 84 87 Echinocereus 1 2 1 Ephedra viridis* 1 1 1 2 1 1 1 2 2 1 Fallugia paradoxa* 1 1 1 Juniperus osteosperma 2 1 1 1 1 1 1 Lycium andersonii 2 1 1 2 Opuntia 1 2 1 1 Opuntia - Cholla 2 3 4 4 3 2
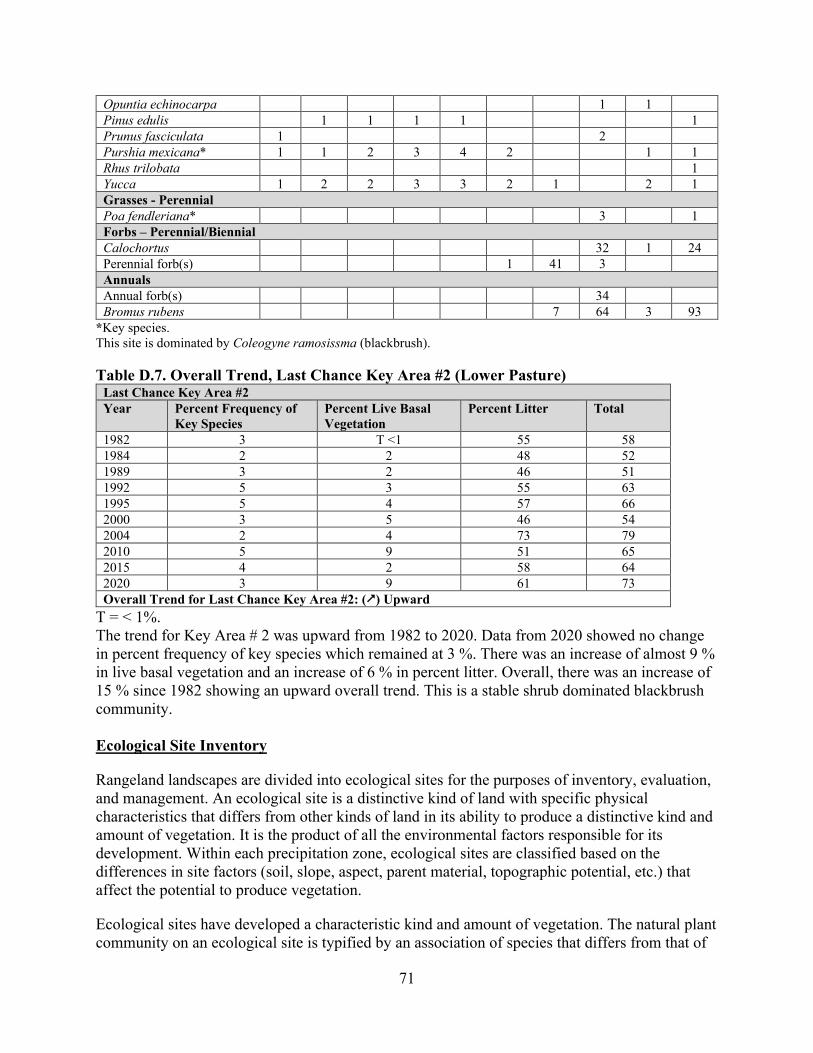
71
Opuntia echinocarpa 1 1 Pinus edulis 1 1 1 1 1 Prunus fasciculata 1 2 Purshia mexicana* 1 1 2 3 4 2 1 1 Rhus trilobata 1 Yucca 1 2 2 3 3 2 1 2 1 Grasses - Perennial Poa fendleriana* 3 1 Forbs – Perennial/Biennial Calochortus 32 1 24 Perennial forb(s) 1 41 3 Annuals Annual forb(s) 34 Bromus rubens 7 64 3 93
*Key species. This site is dominated by Coleogyne ramosissma (blackbrush). Table D.7. Overall Trend, Last Chance Key Area #2 (Lower Pasture)
Last Chance Key Area #2 Year Percent Frequency of
Key Species Percent Live Basal Vegetation
Percent Litter Total
1982 3 T <1 55 58 1984 2 2 48 52 1989 3 2 46 51 1992 5 3 55 63 1995 5 4 57 66 2000 3 5 46 54 2004 2 4 73 79 2010 5 9 51 65 2015 4 2 58 64 2020 3 9 61 73 Overall Trend for Last Chance Key Area #2: () Upward
T = < 1%. The trend for Key Area # 2 was upward from 1982 to 2020. Data from 2020 showed no change in percent frequency of key species which remained at 3 %. There was an increase of almost 9 % in live basal vegetation and an increase of 6 % in percent litter. Overall, there was an increase of 15 % since 1982 showing an upward overall trend. This is a stable shrub dominated blackbrush community. Ecological Site Inventory
Rangeland landscapes are divided into ecological sites for the purposes of inventory, evaluation, and management. An ecological site is a distinctive kind of land with specific physical characteristics that differs from other kinds of land in its ability to produce a distinctive kind and amount of vegetation. It is the product of all the environmental factors responsible for its development. Within each precipitation zone, ecological sites are classified based on the differences in site factors (soil, slope, aspect, parent material, topographic potential, etc.) that affect the potential to produce vegetation.
Ecological sites have developed a characteristic kind and amount of vegetation. The natural plant community on an ecological site is typified by an association of species that differs from that of
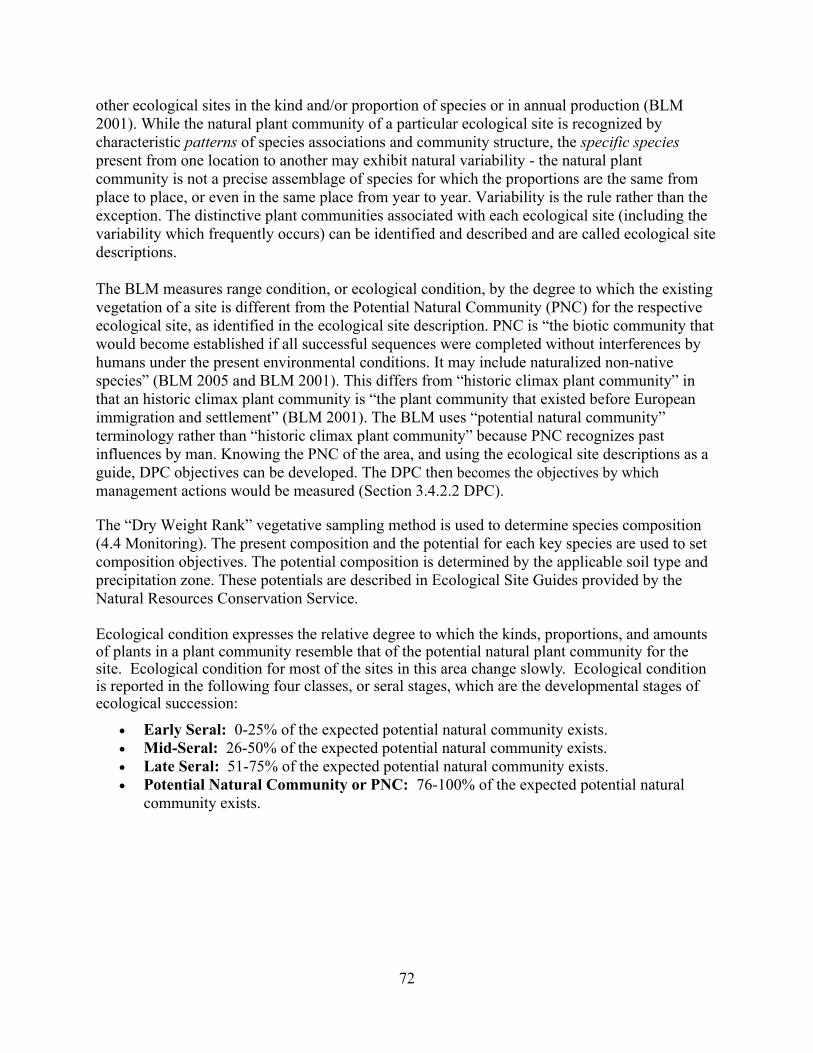
72
other ecological sites in the kind and/or proportion of species or in annual production (BLM 2001). While the natural plant community of a particular ecological site is recognized by characteristic patterns of species associations and community structure, the specific species present from one location to another may exhibit natural variability - the natural plant community is not a precise assemblage of species for which the proportions are the same from place to place, or even in the same place from year to year. Variability is the rule rather than the exception. The distinctive plant communities associated with each ecological site (including the variability which frequently occurs) can be identified and described and are called ecological site descriptions. The BLM measures range condition, or ecological condition, by the degree to which the existing vegetation of a site is different from the Potential Natural Community (PNC) for the respective ecological site, as identified in the ecological site description. PNC is “the biotic community that would become established if all successful sequences were completed without interferences by humans under the present environmental conditions. It may include naturalized non-native species” (BLM 2005 and BLM 2001). This differs from “historic climax plant community” in that an historic climax plant community is “the plant community that existed before European immigration and settlement” (BLM 2001). The BLM uses “potential natural community” terminology rather than “historic climax plant community” because PNC recognizes past influences by man. Knowing the PNC of the area, and using the ecological site descriptions as a guide, DPC objectives can be developed. The DPC then becomes the objectives by which management actions would be measured (Section 3.4.2.2 DPC).
The “Dry Weight Rank” vegetative sampling method is used to determine species composition (4.4 Monitoring). The present composition and the potential for each key species are used to set composition objectives. The potential composition is determined by the applicable soil type and precipitation zone. These potentials are described in Ecological Site Guides provided by the Natural Resources Conservation Service.
Ecological condition expresses the relative degree to which the kinds, proportions, and amounts of plants in a plant community resemble that of the potential natural plant community for the site. Ecological condition for most of the sites in this area change slowly. Ecological condition is reported in the following four classes, or seral stages, which are the developmental stages of ecological succession:
• Early Seral: 0-25% of the expected potential natural community exists. • Mid-Seral: 26-50% of the expected potential natural community exists. • Late Seral: 51-75% of the expected potential natural community exists. • Potential Natural Community or PNC: 76-100% of the expected potential natural
community exists.
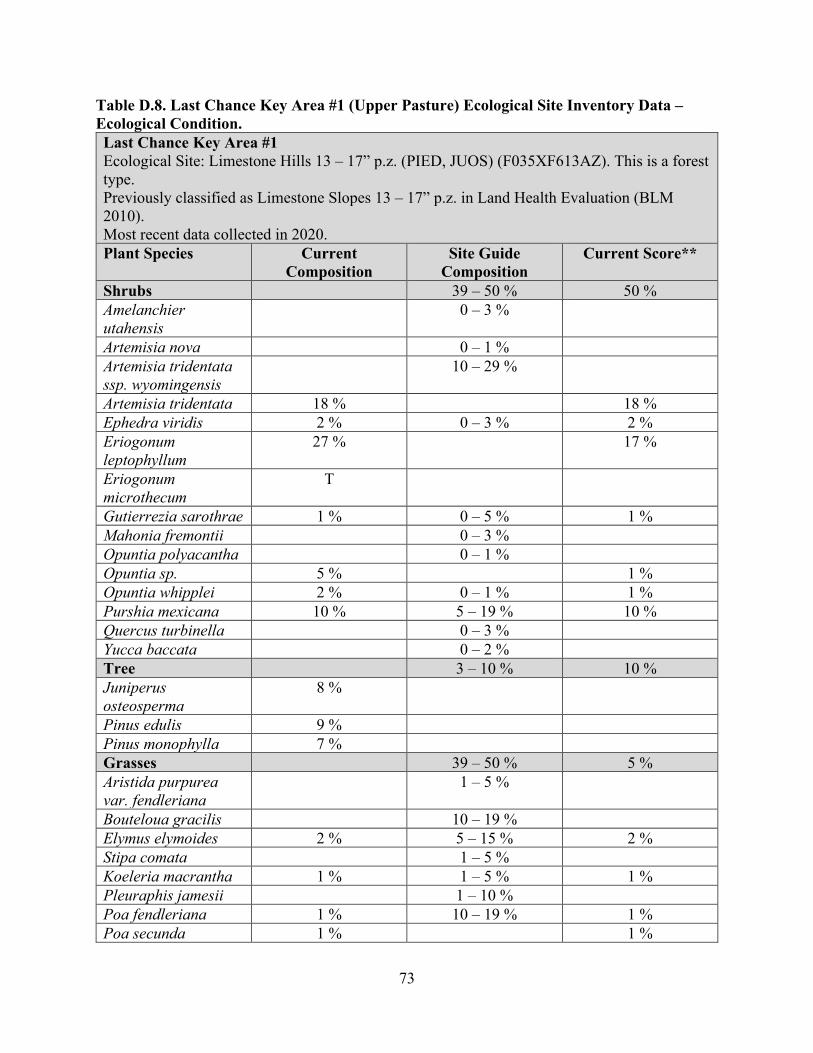
73
Table D.8. Last Chance Key Area #1 (Upper Pasture) Ecological Site Inventory Data – Ecological Condition. Last Chance Key Area #1 Ecological Site: Limestone Hills 13 – 17” p.z. (PIED, JUOS) (F035XF613AZ). This is a forest type. Previously classified as Limestone Slopes 13 – 17” p.z. in Land Health Evaluation (BLM 2010). Most recent data collected in 2020. Plant Species Current
Composition Site Guide
Composition Current Score**
Shrubs 39 – 50 % 50 % Amelanchier utahensis
0 – 3 %
Artemisia nova 0 – 1 % Artemisia tridentata ssp. wyomingensis
10 – 29 %
Artemisia tridentata 18 % 18 % Ephedra viridis 2 % 0 – 3 % 2 % Eriogonum leptophyllum
27 % 17 %
Eriogonum microthecum
T
Gutierrezia sarothrae 1 % 0 – 5 % 1 % Mahonia fremontii 0 – 3 % Opuntia polyacantha 0 – 1 % Opuntia sp. 5 % 1 % Opuntia whipplei 2 % 0 – 1 % 1 % Purshia mexicana 10 % 5 – 19 % 10 % Quercus turbinella 0 – 3 % Yucca baccata 0 – 2 % Tree 3 – 10 % 10 % Juniperus osteosperma
8 %
Pinus edulis 9 % Pinus monophylla 7 % Grasses 39 – 50 % 5 % Aristida purpurea var. fendleriana
1 – 5 %
Bouteloua gracilis 10 – 19 % Elymus elymoides 2 % 5 – 15 % 2 % Stipa comata 1 – 5 % Koeleria macrantha 1 % 1 – 5 % 1 % Pleuraphis jamesii 1 – 10 % Poa fendleriana 1 % 10 – 19 % 1 % Poa secunda 1 % 1 %
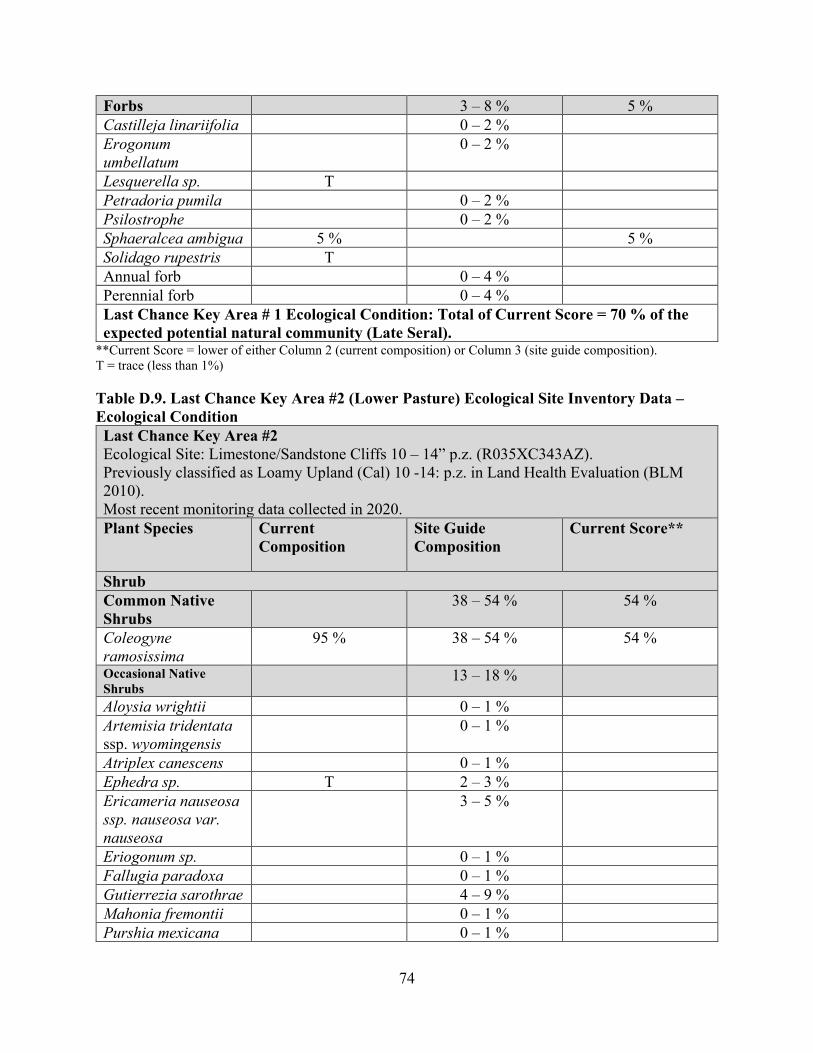
74
Forbs 3 – 8 % 5 % Castilleja linariifolia 0 – 2 % Erogonum umbellatum
0 – 2 %
Lesquerella sp. T Petradoria pumila 0 – 2 % Psilostrophe 0 – 2 % Sphaeralcea ambigua 5 % 5 % Solidago rupestris T Annual forb 0 – 4 % Perennial forb 0 – 4 % Last Chance Key Area # 1 Ecological Condition: Total of Current Score = 70 % of the expected potential natural community (Late Seral).
**Current Score = lower of either Column 2 (current composition) or Column 3 (site guide composition). T = trace (less than 1%)
Table D.9. Last Chance Key Area #2 (Lower Pasture) Ecological Site Inventory Data – Ecological Condition Last Chance Key Area #2 Ecological Site: Limestone/Sandstone Cliffs 10 – 14” p.z. (R035XC343AZ). Previously classified as Loamy Upland (Cal) 10 -14: p.z. in Land Health Evaluation (BLM 2010). Most recent monitoring data collected in 2020. Plant Species Current
Composition Site Guide Composition
Current Score**
Shrub Common Native Shrubs
38 – 54 % 54 %
Coleogyne ramosissima
95 % 38 – 54 % 54 %
Occasional Native Shrubs
13 – 18 %
Aloysia wrightii 0 – 1 % Artemisia tridentata ssp. wyomingensis
0 – 1 %
Atriplex canescens 0 – 1 % Ephedra sp. T 2 – 3 % Ericameria nauseosa ssp. nauseosa var. nauseosa
3 – 5 %
Eriogonum sp. 0 – 1 % Fallugia paradoxa 0 – 1 % Gutierrezia sarothrae 4 – 9 % Mahonia fremontii 0 – 1 % Purshia mexicana 0 – 1 %
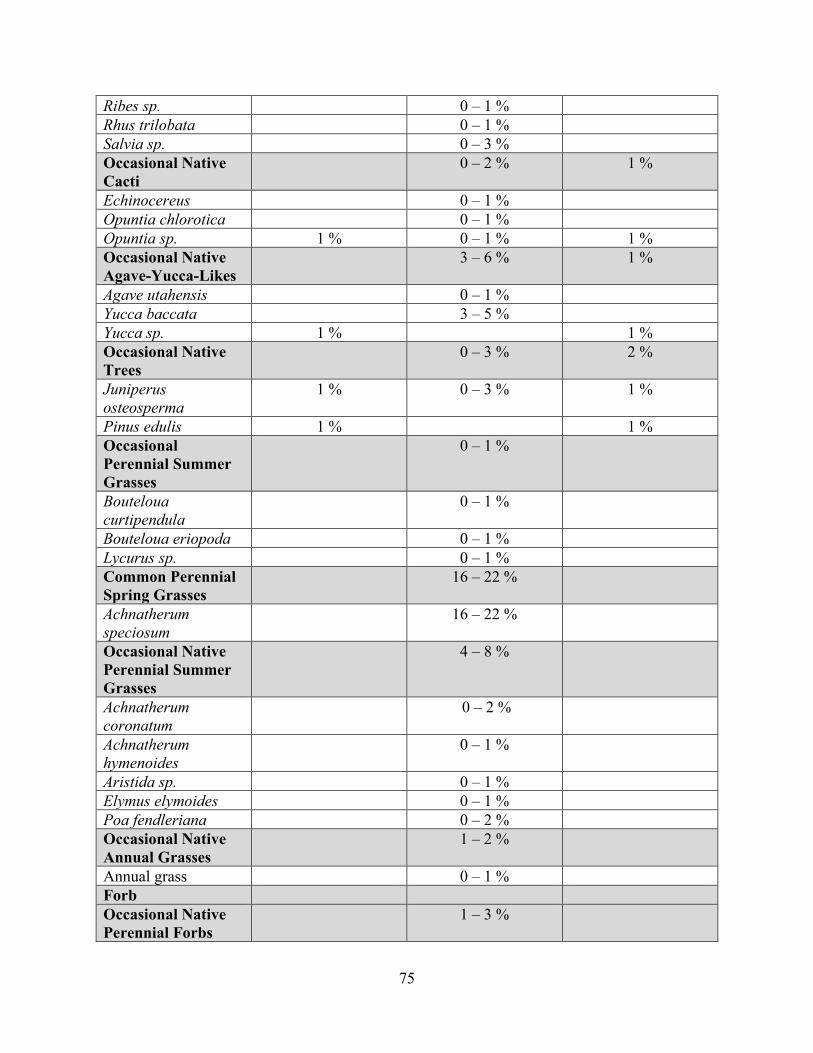
75
Ribes sp. 0 – 1 % Rhus trilobata 0 – 1 % Salvia sp. 0 – 3 % Occasional Native Cacti
0 – 2 % 1 %
Echinocereus 0 – 1 % Opuntia chlorotica 0 – 1 % Opuntia sp. 1 % 0 – 1 % 1 % Occasional Native Agave-Yucca-Likes
3 – 6 % 1 %
Agave utahensis 0 – 1 % Yucca baccata 3 – 5 % Yucca sp. 1 % 1 % Occasional Native Trees
0 – 3 % 2 %
Juniperus osteosperma
1 % 0 – 3 % 1 %
Pinus edulis 1 % 1 % Occasional Perennial Summer Grasses
0 – 1 %
Bouteloua curtipendula
0 – 1 %
Bouteloua eriopoda 0 – 1 % Lycurus sp. 0 – 1 % Common Perennial Spring Grasses
16 – 22 %
Achnatherum speciosum
16 – 22 %
Occasional Native Perennial Summer Grasses
4 – 8 %
Achnatherum coronatum
0 – 2 %
Achnatherum hymenoides
0 – 1 %
Aristida sp. 0 – 1 % Elymus elymoides 0 – 1 % Poa fendleriana 0 – 2 % Occasional Native Annual Grasses
1 – 2 %
Annual grass 0 – 1 % Forb Occasional Native Perennial Forbs
1 – 3 %
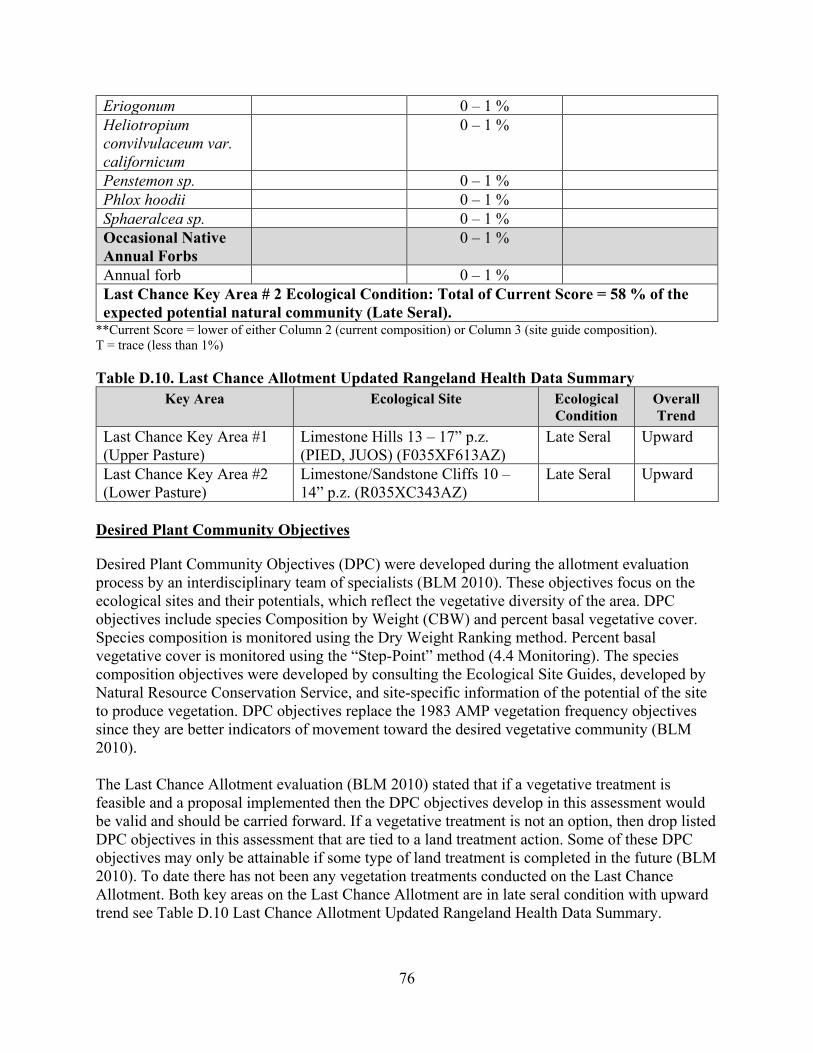
76
Eriogonum 0 – 1 % Heliotropium convilvulaceum var. californicum
0 – 1 %
Penstemon sp. 0 – 1 % Phlox hoodii 0 – 1 % Sphaeralcea sp. 0 – 1 % Occasional Native Annual Forbs
0 – 1 %
Annual forb 0 – 1 % Last Chance Key Area # 2 Ecological Condition: Total of Current Score = 58 % of the expected potential natural community (Late Seral).
**Current Score = lower of either Column 2 (current composition) or Column 3 (site guide composition). T = trace (less than 1%)
Table D.10. Last Chance Allotment Updated Rangeland Health Data Summary Key Area Ecological Site Ecological
Condition Overall Trend
Last Chance Key Area #1 (Upper Pasture)
Limestone Hills 13 – 17” p.z. (PIED, JUOS) (F035XF613AZ)
Late Seral Upward
Last Chance Key Area #2 (Lower Pasture)
Limestone/Sandstone Cliffs 10 – 14” p.z. (R035XC343AZ)
Late Seral Upward
Desired Plant Community Objectives
Desired Plant Community Objectives (DPC) were developed during the allotment evaluation process by an interdisciplinary team of specialists (BLM 2010). These objectives focus on the ecological sites and their potentials, which reflect the vegetative diversity of the area. DPC objectives include species Composition by Weight (CBW) and percent basal vegetative cover. Species composition is monitored using the Dry Weight Ranking method. Percent basal vegetative cover is monitored using the “Step-Point” method (4.4 Monitoring). The species composition objectives were developed by consulting the Ecological Site Guides, developed by Natural Resource Conservation Service, and site-specific information of the potential of the site to produce vegetation. DPC objectives replace the 1983 AMP vegetation frequency objectives since they are better indicators of movement toward the desired vegetative community (BLM 2010). The Last Chance Allotment evaluation (BLM 2010) stated that if a vegetative treatment is feasible and a proposal implemented then the DPC objectives develop in this assessment would be valid and should be carried forward. If a vegetative treatment is not an option, then drop listed DPC objectives in this assessment that are tied to a land treatment action. Some of these DPC objectives may only be attainable if some type of land treatment is completed in the future (BLM 2010). To date there has not been any vegetation treatments conducted on the Last Chance Allotment. Both key areas on the Last Chance Allotment are in late seral condition with upward trend see Table D.10 Last Chance Allotment Updated Rangeland Health Data Summary.
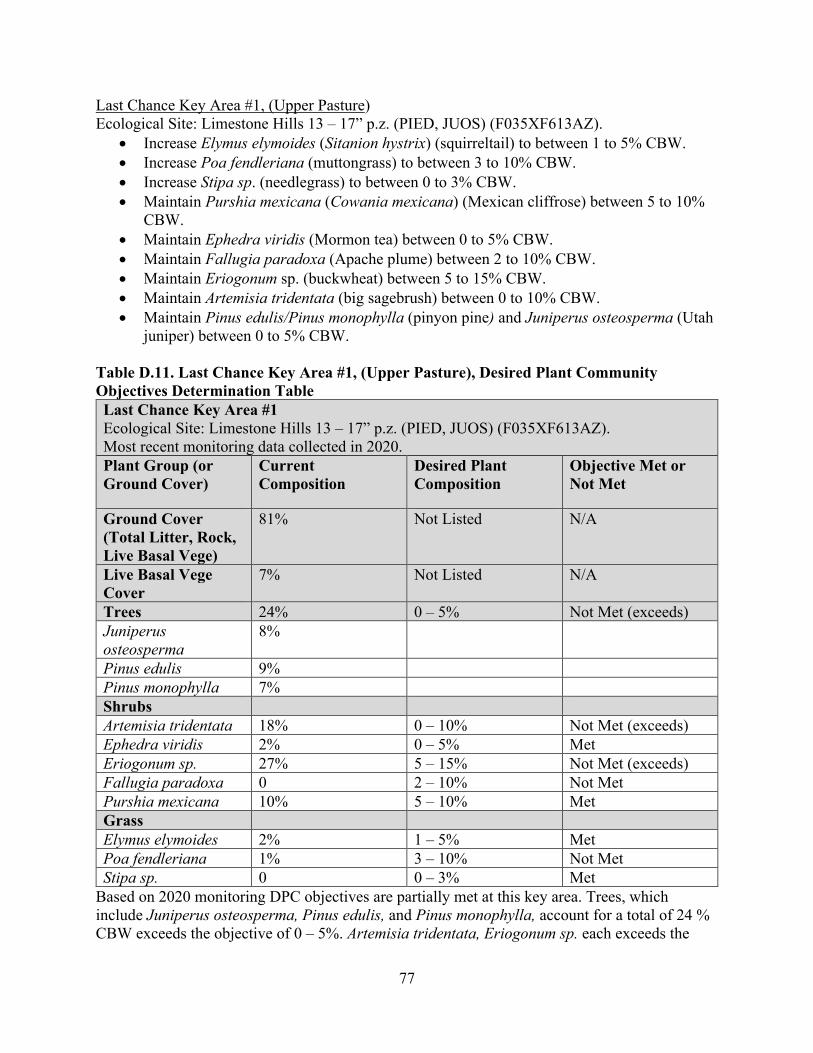
77
Last Chance Key Area #1, (Upper Pasture) Ecological Site: Limestone Hills 13 – 17” p.z. (PIED, JUOS) (F035XF613AZ).
• Increase Elymus elymoides (Sitanion hystrix) (squirreltail) to between 1 to 5% CBW. • Increase Poa fendleriana (muttongrass) to between 3 to 10% CBW. • Increase Stipa sp. (needlegrass) to between 0 to 3% CBW. • Maintain Purshia mexicana (Cowania mexicana) (Mexican cliffrose) between 5 to 10%
CBW. • Maintain Ephedra viridis (Mormon tea) between 0 to 5% CBW. • Maintain Fallugia paradoxa (Apache plume) between 2 to 10% CBW. • Maintain Eriogonum sp. (buckwheat) between 5 to 15% CBW. • Maintain Artemisia tridentata (big sagebrush) between 0 to 10% CBW. • Maintain Pinus edulis/Pinus monophylla (pinyon pine) and Juniperus osteosperma (Utah
juniper) between 0 to 5% CBW. Table D.11. Last Chance Key Area #1, (Upper Pasture), Desired Plant Community Objectives Determination Table Last Chance Key Area #1 Ecological Site: Limestone Hills 13 – 17” p.z. (PIED, JUOS) (F035XF613AZ). Most recent monitoring data collected in 2020. Plant Group (or Ground Cover)
Current Composition
Desired Plant Composition
Objective Met or Not Met
Ground Cover (Total Litter, Rock, Live Basal Vege)
81% Not Listed N/A
Live Basal Vege Cover
7% Not Listed N/A
Trees 24% 0 – 5% Not Met (exceeds) Juniperus osteosperma
8%
Pinus edulis 9% Pinus monophylla 7% Shrubs Artemisia tridentata 18% 0 – 10% Not Met (exceeds) Ephedra viridis 2% 0 – 5% Met Eriogonum sp. 27% 5 – 15% Not Met (exceeds) Fallugia paradoxa 0 2 – 10% Not Met Purshia mexicana 10% 5 – 10% Met Grass Elymus elymoides 2% 1 – 5% Met Poa fendleriana 1% 3 – 10% Not Met Stipa sp. 0 0 – 3% Met
Based on 2020 monitoring DPC objectives are partially met at this key area. Trees, which include Juniperus osteosperma, Pinus edulis, and Pinus monophylla, account for a total of 24 % CBW exceeds the objective of 0 – 5%. Artemisia tridentata, Eriogonum sp. each exceeds the
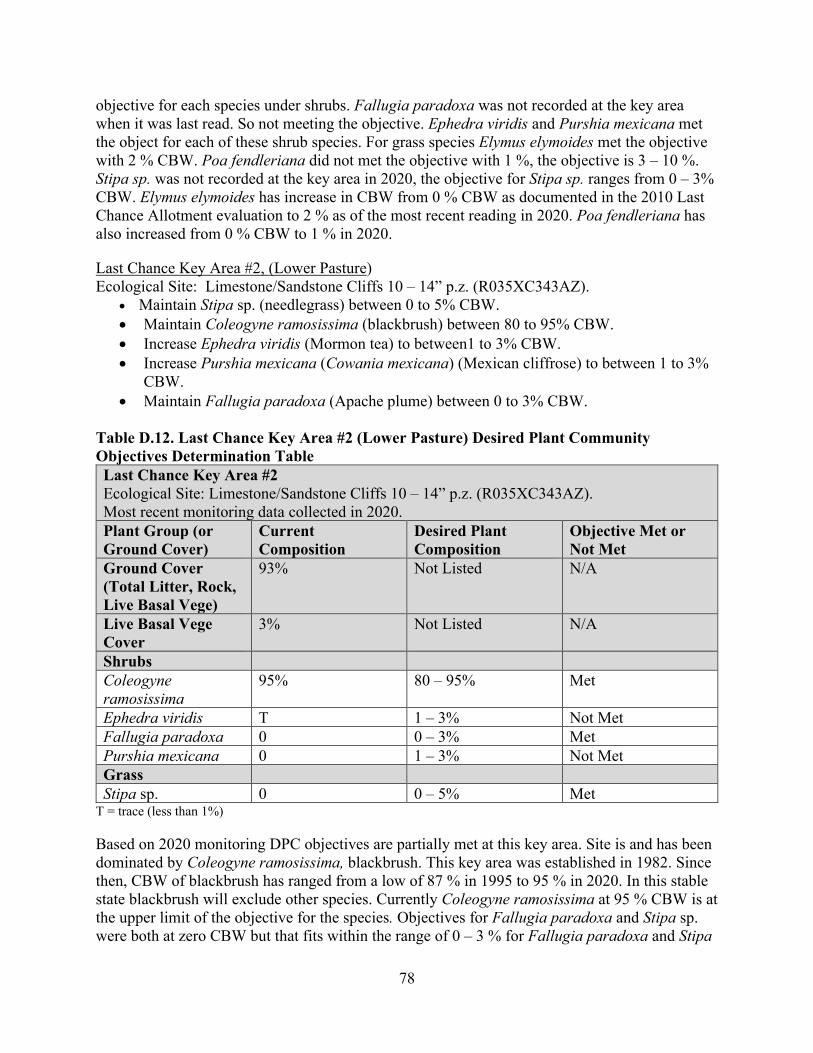
78
objective for each species under shrubs. Fallugia paradoxa was not recorded at the key area when it was last read. So not meeting the objective. Ephedra viridis and Purshia mexicana met the object for each of these shrub species. For grass species Elymus elymoides met the objective with 2 % CBW. Poa fendleriana did not met the objective with 1 %, the objective is 3 – 10 %. Stipa sp. was not recorded at the key area in 2020, the objective for Stipa sp. ranges from 0 – 3% CBW. Elymus elymoides has increase in CBW from 0 % CBW as documented in the 2010 Last Chance Allotment evaluation to 2 % as of the most recent reading in 2020. Poa fendleriana has also increased from 0 % CBW to 1 % in 2020.
Last Chance Key Area #2, (Lower Pasture) Ecological Site: Limestone/Sandstone Cliffs 10 – 14” p.z. (R035XC343AZ).
• Maintain Stipa sp. (needlegrass) between 0 to 5% CBW. • Maintain Coleogyne ramosissima (blackbrush) between 80 to 95% CBW. • Increase Ephedra viridis (Mormon tea) to between1 to 3% CBW. • Increase Purshia mexicana (Cowania mexicana) (Mexican cliffrose) to between 1 to 3%
CBW. • Maintain Fallugia paradoxa (Apache plume) between 0 to 3% CBW.
Table D.12. Last Chance Key Area #2 (Lower Pasture) Desired Plant Community Objectives Determination Table Last Chance Key Area #2 Ecological Site: Limestone/Sandstone Cliffs 10 – 14” p.z. (R035XC343AZ). Most recent monitoring data collected in 2020. Plant Group (or Ground Cover)
Current Composition
Desired Plant Composition
Objective Met or Not Met
Ground Cover (Total Litter, Rock, Live Basal Vege)
93% Not Listed N/A
Live Basal Vege Cover
3% Not Listed N/A
Shrubs Coleogyne ramosissima
95% 80 – 95% Met
Ephedra viridis T 1 – 3% Not Met Fallugia paradoxa 0 0 – 3% Met Purshia mexicana 0 1 – 3% Not Met Grass Stipa sp. 0 0 – 5% Met
T = trace (less than 1%)
Based on 2020 monitoring DPC objectives are partially met at this key area. Site is and has been dominated by Coleogyne ramosissima, blackbrush. This key area was established in 1982. Since then, CBW of blackbrush has ranged from a low of 87 % in 1995 to 95 % in 2020. In this stable state blackbrush will exclude other species. Currently Coleogyne ramosissima at 95 % CBW is at the upper limit of the objective for the species. Objectives for Fallugia paradoxa and Stipa sp. were both at zero CBW but that fits within the range of 0 – 3 % for Fallugia paradoxa and Stipa

79
sp. 0 – 5 %. Fallugia paradoxa, and Purshia mexicana are present in small numbers on the key area but are not in large enough quantities to be represented in the CBW. Needlegrass, Stipa sp., is also present in small amounts on the site but did not occur on the transect.
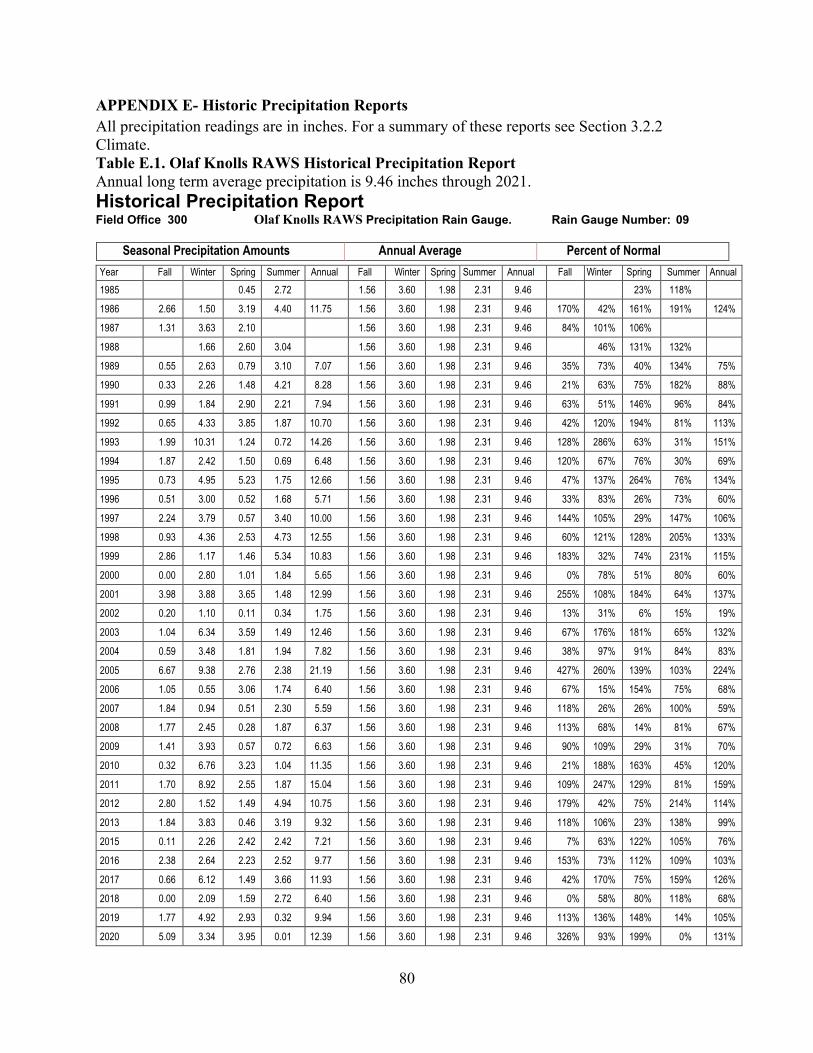
80
APPENDIX E- Historic Precipitation Reports All precipitation readings are in inches. For a summary of these reports see Section 3.2.2 Climate. Table E.1. Olaf Knolls RAWS Historical Precipitation Report Annual long term average precipitation is 9.46 inches through 2021. Historical Precipitation Report Field Office 300 Olaf Knolls RAWS Precipitation Rain Gauge. Rain Gauge Number: 09
Year Fall Winter Spring Summer Annual Fall Winter Spring Summer Annual Fall Winter Spring Summer Annual 1985 0.45 2.72 1.56 3.60 1.98 2.31 9.46 23% 118%
1986 2.66 1.50 3.19 4.40 11.75 1.56 3.60 1.98 2.31 9.46 170% 42% 161% 191% 124%
1987 1.31 3.63 2.10 1.56 3.60 1.98 2.31 9.46 84% 101% 106%
1988 1.66 2.60 3.04 1.56 3.60 1.98 2.31 9.46 46% 131% 132%
1989 0.55 2.63 0.79 3.10 7.07 1.56 3.60 1.98 2.31 9.46 35% 73% 40% 134% 75%
1990 0.33 2.26 1.48 4.21 8.28 1.56 3.60 1.98 2.31 9.46 21% 63% 75% 182% 88%
1991 0.99 1.84 2.90 2.21 7.94 1.56 3.60 1.98 2.31 9.46 63% 51% 146% 96% 84%
1992 0.65 4.33 3.85 1.87 10.70 1.56 3.60 1.98 2.31 9.46 42% 120% 194% 81% 113%
1993 1.99 10.31 1.24 0.72 14.26 1.56 3.60 1.98 2.31 9.46 128% 286% 63% 31% 151%
1994 1.87 2.42 1.50 0.69 6.48 1.56 3.60 1.98 2.31 9.46 120% 67% 76% 30% 69%
1995 0.73 4.95 5.23 1.75 12.66 1.56 3.60 1.98 2.31 9.46 47% 137% 264% 76% 134%
1996 0.51 3.00 0.52 1.68 5.71 1.56 3.60 1.98 2.31 9.46 33% 83% 26% 73% 60%
1997 2.24 3.79 0.57 3.40 10.00 1.56 3.60 1.98 2.31 9.46 144% 105% 29% 147% 106%
1998 0.93 4.36 2.53 4.73 12.55 1.56 3.60 1.98 2.31 9.46 60% 121% 128% 205% 133%
1999 2.86 1.17 1.46 5.34 10.83 1.56 3.60 1.98 2.31 9.46 183% 32% 74% 231% 115%
2000 0.00 2.80 1.01 1.84 5.65 1.56 3.60 1.98 2.31 9.46 0% 78% 51% 80% 60%
2001 3.98 3.88 3.65 1.48 12.99 1.56 3.60 1.98 2.31 9.46 255% 108% 184% 64% 137%
2002 0.20 1.10 0.11 0.34 1.75 1.56 3.60 1.98 2.31 9.46 13% 31% 6% 15% 19%
2003 1.04 6.34 3.59 1.49 12.46 1.56 3.60 1.98 2.31 9.46 67% 176% 181% 65% 132%
2004 0.59 3.48 1.81 1.94 7.82 1.56 3.60 1.98 2.31 9.46 38% 97% 91% 84% 83%
2005 6.67 9.38 2.76 2.38 21.19 1.56 3.60 1.98 2.31 9.46 427% 260% 139% 103% 224%
2006 1.05 0.55 3.06 1.74 6.40 1.56 3.60 1.98 2.31 9.46 67% 15% 154% 75% 68%
2007 1.84 0.94 0.51 2.30 5.59 1.56 3.60 1.98 2.31 9.46 118% 26% 26% 100% 59%
2008 1.77 2.45 0.28 1.87 6.37 1.56 3.60 1.98 2.31 9.46 113% 68% 14% 81% 67%
2009 1.41 3.93 0.57 0.72 6.63 1.56 3.60 1.98 2.31 9.46 90% 109% 29% 31% 70%
2010 0.32 6.76 3.23 1.04 11.35 1.56 3.60 1.98 2.31 9.46 21% 188% 163% 45% 120%
2011 1.70 8.92 2.55 1.87 15.04 1.56 3.60 1.98 2.31 9.46 109% 247% 129% 81% 159%
2012 2.80 1.52 1.49 4.94 10.75 1.56 3.60 1.98 2.31 9.46 179% 42% 75% 214% 114%
2013 1.84 3.83 0.46 3.19 9.32 1.56 3.60 1.98 2.31 9.46 118% 106% 23% 138% 99%
2015 0.11 2.26 2.42 2.42 7.21 1.56 3.60 1.98 2.31 9.46 7% 63% 122% 105% 76%
2016 2.38 2.64 2.23 2.52 9.77 1.56 3.60 1.98 2.31 9.46 153% 73% 112% 109% 103%
2017 0.66 6.12 1.49 3.66 11.93 1.56 3.60 1.98 2.31 9.46 42% 170% 75% 159% 126%
2018 0.00 2.09 1.59 2.72 6.40 1.56 3.60 1.98 2.31 9.46 0% 58% 80% 118% 68%
2019 1.77 4.92 2.93 0.32 9.94 1.56 3.60 1.98 2.31 9.46 113% 136% 148% 14% 105%
2020 5.09 3.34 3.95 0.01 12.39 1.56 3.60 1.98 2.31 9.46 326% 93% 199% 0% 131%
Seasonal Precipitation Amounts Annual Average Percent of Normal
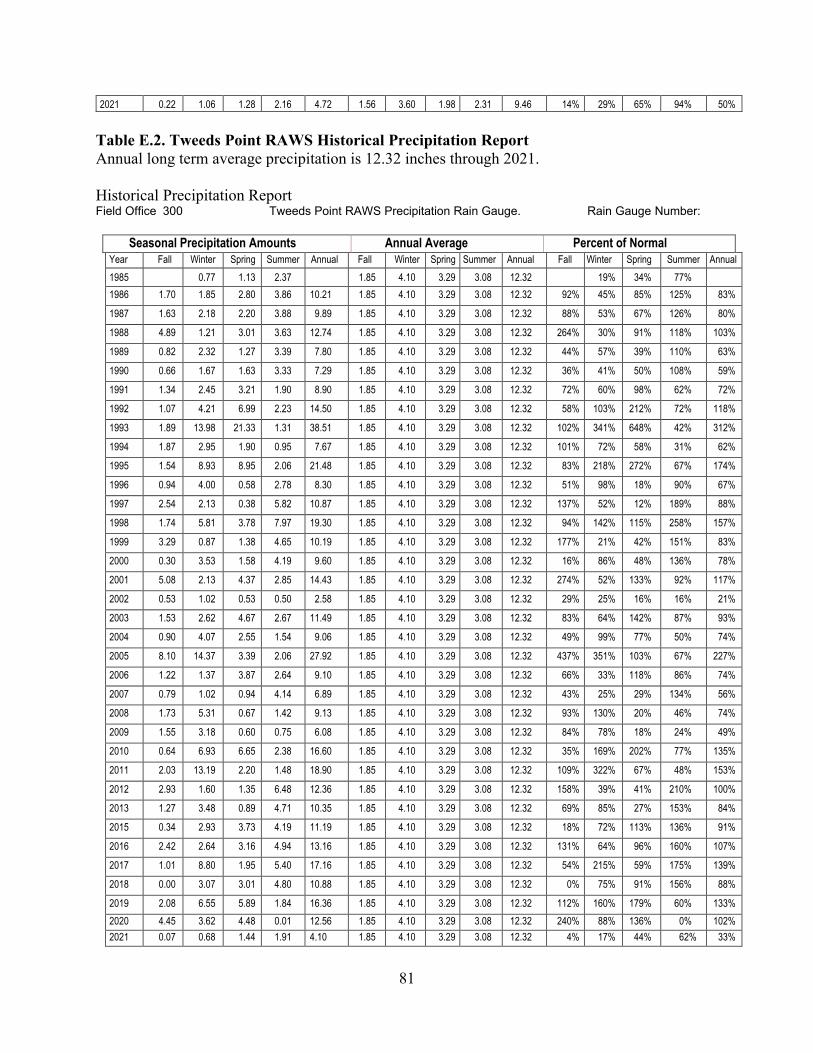
81
2021 0.22 1.06 1.28 2.16 4.72 1.56 3.60 1.98 2.31 9.46 14% 29% 65% 94% 50%
Table E.2. Tweeds Point RAWS Historical Precipitation Report Annual long term average precipitation is 12.32 inches through 2021. Historical Precipitation Report Field Office 300 Tweeds Point RAWS Precipitation Rain Gauge. Rain Gauge Number:
Seasonal Precipitation Amounts Annual Average Percent of Normal Year Fall Winter Spring Summer Annual Fall Winter Spring Summer Annual Fall Winter Spring Summer Annual 1985 0.77 1.13 2.37 1.85 4.10 3.29 3.08 12.32 19% 34% 77%
1986 1.70 1.85 2.80 3.86 10.21 1.85 4.10 3.29 3.08 12.32 92% 45% 85% 125% 83%
1987 1.63 2.18 2.20 3.88 9.89 1.85 4.10 3.29 3.08 12.32 88% 53% 67% 126% 80%
1988 4.89 1.21 3.01 3.63 12.74 1.85 4.10 3.29 3.08 12.32 264% 30% 91% 118% 103%
1989 0.82 2.32 1.27 3.39 7.80 1.85 4.10 3.29 3.08 12.32 44% 57% 39% 110% 63%
1990 0.66 1.67 1.63 3.33 7.29 1.85 4.10 3.29 3.08 12.32 36% 41% 50% 108% 59%
1991 1.34 2.45 3.21 1.90 8.90 1.85 4.10 3.29 3.08 12.32 72% 60% 98% 62% 72%
1992 1.07 4.21 6.99 2.23 14.50 1.85 4.10 3.29 3.08 12.32 58% 103% 212% 72% 118%
1993 1.89 13.98 21.33 1.31 38.51 1.85 4.10 3.29 3.08 12.32 102% 341% 648% 42% 312%
1994 1.87 2.95 1.90 0.95 7.67 1.85 4.10 3.29 3.08 12.32 101% 72% 58% 31% 62%
1995 1.54 8.93 8.95 2.06 21.48 1.85 4.10 3.29 3.08 12.32 83% 218% 272% 67% 174%
1996 0.94 4.00 0.58 2.78 8.30 1.85 4.10 3.29 3.08 12.32 51% 98% 18% 90% 67%
1997 2.54 2.13 0.38 5.82 10.87 1.85 4.10 3.29 3.08 12.32 137% 52% 12% 189% 88%
1998 1.74 5.81 3.78 7.97 19.30 1.85 4.10 3.29 3.08 12.32 94% 142% 115% 258% 157%
1999 3.29 0.87 1.38 4.65 10.19 1.85 4.10 3.29 3.08 12.32 177% 21% 42% 151% 83%
2000 0.30 3.53 1.58 4.19 9.60 1.85 4.10 3.29 3.08 12.32 16% 86% 48% 136% 78%
2001 5.08 2.13 4.37 2.85 14.43 1.85 4.10 3.29 3.08 12.32 274% 52% 133% 92% 117%
2002 0.53 1.02 0.53 0.50 2.58 1.85 4.10 3.29 3.08 12.32 29% 25% 16% 16% 21%
2003 1.53 2.62 4.67 2.67 11.49 1.85 4.10 3.29 3.08 12.32 83% 64% 142% 87% 93%
2004 0.90 4.07 2.55 1.54 9.06 1.85 4.10 3.29 3.08 12.32 49% 99% 77% 50% 74%
2005 8.10 14.37 3.39 2.06 27.92 1.85 4.10 3.29 3.08 12.32 437% 351% 103% 67% 227%
2006 1.22 1.37 3.87 2.64 9.10 1.85 4.10 3.29 3.08 12.32 66% 33% 118% 86% 74%
2007 0.79 1.02 0.94 4.14 6.89 1.85 4.10 3.29 3.08 12.32 43% 25% 29% 134% 56%
2008 1.73 5.31 0.67 1.42 9.13 1.85 4.10 3.29 3.08 12.32 93% 130% 20% 46% 74%
2009 1.55 3.18 0.60 0.75 6.08 1.85 4.10 3.29 3.08 12.32 84% 78% 18% 24% 49%
2010 0.64 6.93 6.65 2.38 16.60 1.85 4.10 3.29 3.08 12.32 35% 169% 202% 77% 135%
2011 2.03 13.19 2.20 1.48 18.90 1.85 4.10 3.29 3.08 12.32 109% 322% 67% 48% 153%
2012 2.93 1.60 1.35 6.48 12.36 1.85 4.10 3.29 3.08 12.32 158% 39% 41% 210% 100%
2013 1.27 3.48 0.89 4.71 10.35 1.85 4.10 3.29 3.08 12.32 69% 85% 27% 153% 84%
2015 0.34 2.93 3.73 4.19 11.19 1.85 4.10 3.29 3.08 12.32 18% 72% 113% 136% 91%
2016 2.42 2.64 3.16 4.94 13.16 1.85 4.10 3.29 3.08 12.32 131% 64% 96% 160% 107%
2017 1.01 8.80 1.95 5.40 17.16 1.85 4.10 3.29 3.08 12.32 54% 215% 59% 175% 139%
2018 0.00 3.07 3.01 4.80 10.88 1.85 4.10 3.29 3.08 12.32 0% 75% 91% 156% 88%
2019 2.08 6.55 5.89 1.84 16.36 1.85 4.10 3.29 3.08 12.32 112% 160% 179% 60% 133% 2020 4.45 3.62 4.48 0.01 12.56 1.85 4.10 3.29 3.08 12.32 240% 88% 136% 0% 102% 2021 0.07 0.68 1.44 1.91 4.10 1.85 4.10 3.29 3.08 12.32 4% 17% 44% 62% 33%
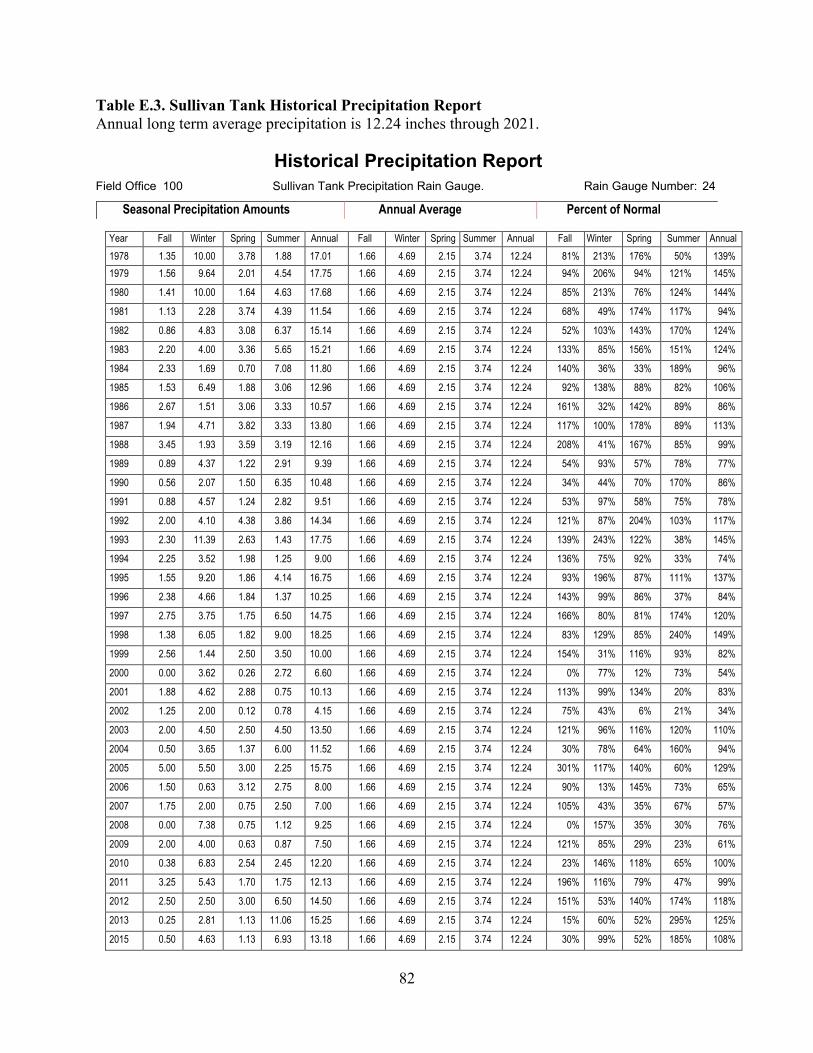
82
Table E.3. Sullivan Tank Historical Precipitation Report Annual long term average precipitation is 12.24 inches through 2021.
Historical Precipitation Report Field Office 100 Sullivan Tank Precipitation Rain Gauge. Rain Gauge Number: 24
Year Fall Winter Spring Summer Annual Fall Winter Spring Summer Annual Fall Winter Spring Summer Annual 1978 1.35 10.00 3.78 1.88 17.01 1.66 4.69 2.15 3.74 12.24 81% 213% 176% 50% 139% 1979 1.56 9.64 2.01 4.54 17.75 1.66 4.69 2.15 3.74 12.24 94% 206% 94% 121% 145%
1980 1.41 10.00 1.64 4.63 17.68 1.66 4.69 2.15 3.74 12.24 85% 213% 76% 124% 144%
1981 1.13 2.28 3.74 4.39 11.54 1.66 4.69 2.15 3.74 12.24 68% 49% 174% 117% 94%
1982 0.86 4.83 3.08 6.37 15.14 1.66 4.69 2.15 3.74 12.24 52% 103% 143% 170% 124%
1983 2.20 4.00 3.36 5.65 15.21 1.66 4.69 2.15 3.74 12.24 133% 85% 156% 151% 124%
1984 2.33 1.69 0.70 7.08 11.80 1.66 4.69 2.15 3.74 12.24 140% 36% 33% 189% 96%
1985 1.53 6.49 1.88 3.06 12.96 1.66 4.69 2.15 3.74 12.24 92% 138% 88% 82% 106%
1986 2.67 1.51 3.06 3.33 10.57 1.66 4.69 2.15 3.74 12.24 161% 32% 142% 89% 86%
1987 1.94 4.71 3.82 3.33 13.80 1.66 4.69 2.15 3.74 12.24 117% 100% 178% 89% 113%
1988 3.45 1.93 3.59 3.19 12.16 1.66 4.69 2.15 3.74 12.24 208% 41% 167% 85% 99%
1989 0.89 4.37 1.22 2.91 9.39 1.66 4.69 2.15 3.74 12.24 54% 93% 57% 78% 77%
1990 0.56 2.07 1.50 6.35 10.48 1.66 4.69 2.15 3.74 12.24 34% 44% 70% 170% 86%
1991 0.88 4.57 1.24 2.82 9.51 1.66 4.69 2.15 3.74 12.24 53% 97% 58% 75% 78%
1992 2.00 4.10 4.38 3.86 14.34 1.66 4.69 2.15 3.74 12.24 121% 87% 204% 103% 117%
1993 2.30 11.39 2.63 1.43 17.75 1.66 4.69 2.15 3.74 12.24 139% 243% 122% 38% 145%
1994 2.25 3.52 1.98 1.25 9.00 1.66 4.69 2.15 3.74 12.24 136% 75% 92% 33% 74%
1995 1.55 9.20 1.86 4.14 16.75 1.66 4.69 2.15 3.74 12.24 93% 196% 87% 111% 137%
1996 2.38 4.66 1.84 1.37 10.25 1.66 4.69 2.15 3.74 12.24 143% 99% 86% 37% 84%
1997 2.75 3.75 1.75 6.50 14.75 1.66 4.69 2.15 3.74 12.24 166% 80% 81% 174% 120%
1998 1.38 6.05 1.82 9.00 18.25 1.66 4.69 2.15 3.74 12.24 83% 129% 85% 240% 149%
1999 2.56 1.44 2.50 3.50 10.00 1.66 4.69 2.15 3.74 12.24 154% 31% 116% 93% 82%
2000 0.00 3.62 0.26 2.72 6.60 1.66 4.69 2.15 3.74 12.24 0% 77% 12% 73% 54%
2001 1.88 4.62 2.88 0.75 10.13 1.66 4.69 2.15 3.74 12.24 113% 99% 134% 20% 83%
2002 1.25 2.00 0.12 0.78 4.15 1.66 4.69 2.15 3.74 12.24 75% 43% 6% 21% 34%
2003 2.00 4.50 2.50 4.50 13.50 1.66 4.69 2.15 3.74 12.24 121% 96% 116% 120% 110%
2004 0.50 3.65 1.37 6.00 11.52 1.66 4.69 2.15 3.74 12.24 30% 78% 64% 160% 94%
2005 5.00 5.50 3.00 2.25 15.75 1.66 4.69 2.15 3.74 12.24 301% 117% 140% 60% 129%
2006 1.50 0.63 3.12 2.75 8.00 1.66 4.69 2.15 3.74 12.24 90% 13% 145% 73% 65%
2007 1.75 2.00 0.75 2.50 7.00 1.66 4.69 2.15 3.74 12.24 105% 43% 35% 67% 57%
2008 0.00 7.38 0.75 1.12 9.25 1.66 4.69 2.15 3.74 12.24 0% 157% 35% 30% 76%
2009 2.00 4.00 0.63 0.87 7.50 1.66 4.69 2.15 3.74 12.24 121% 85% 29% 23% 61%
2010 0.38 6.83 2.54 2.45 12.20 1.66 4.69 2.15 3.74 12.24 23% 146% 118% 65% 100%
2011 3.25 5.43 1.70 1.75 12.13 1.66 4.69 2.15 3.74 12.24 196% 116% 79% 47% 99%
2012 2.50 2.50 3.00 6.50 14.50 1.66 4.69 2.15 3.74 12.24 151% 53% 140% 174% 118%
2013 0.25 2.81 1.13 11.06 15.25 1.66 4.69 2.15 3.74 12.24 15% 60% 52% 295% 125%
2015 0.50 4.63 1.13 6.93 13.18 1.66 4.69 2.15 3.74 12.24 30% 99% 52% 185% 108%
Seasonal Precipitation Amounts Annual Average Percent of Normal

83
2016 2.95 2.81 2.56 3.75 12.08 1.66 4.69 2.15 3.74 12.24 178% 60% 119% 100% 99%
2017 1.19 6.06 1.00 5.38 13.63 1.66 4.69 2.15 3.74 12.24 72% 129% 47% 144% 111%
2018 0.25 2.81 2.81 4.13 10.00 1.66 4.69 2.15 3.74 12.24 15% 60% 131% 110% 82%
2019 2.13 8.63 3.00 0.50 14.25 1.66 4.69 2.15 3.74 12.24 128% 184% 140% 13% 116%
2020 7.00 3.75 0.00 1.66 4.69 2.15 3.74 12.24 149% 175% 0%
2021 0.50 2.00 1.00 3.75 7.25 1.66 4.69 2.15 3.74 12.24 30% 43% 47% 100% 59%
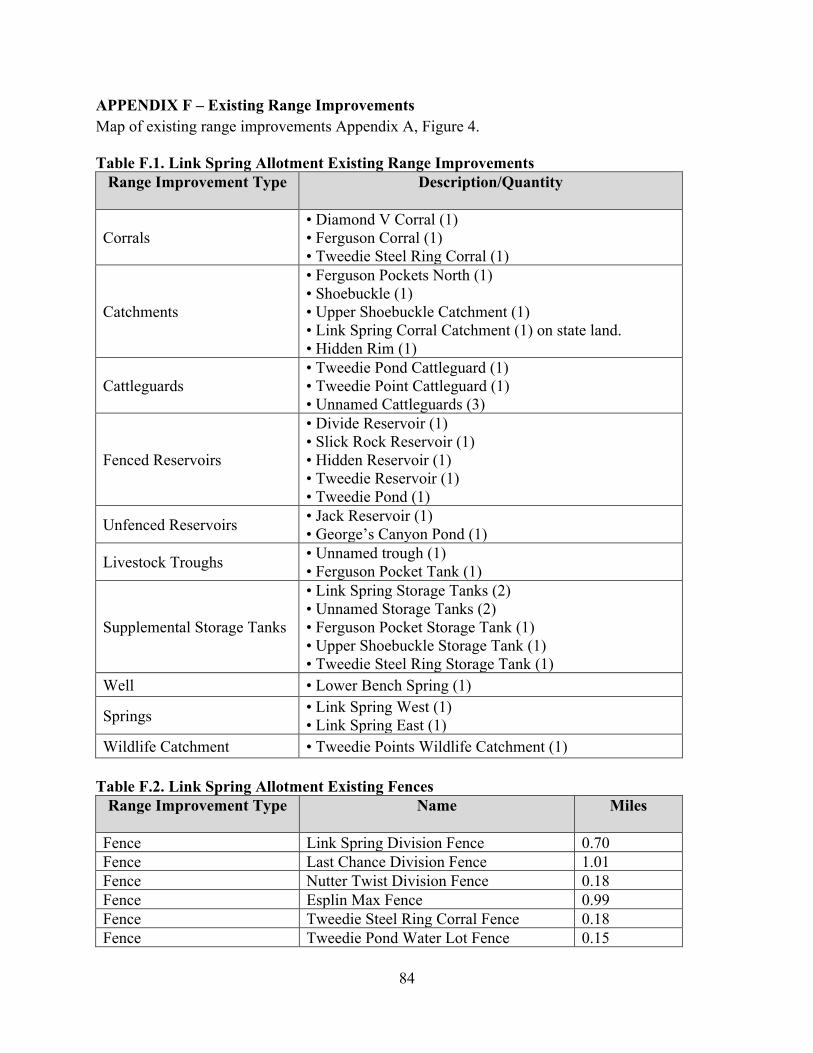
84
APPENDIX F – Existing Range Improvements Map of existing range improvements Appendix A, Figure 4. Table F.1. Link Spring Allotment Existing Range Improvements
Range Improvement Type Description/Quantity
Corrals • Diamond V Corral (1) • Ferguson Corral (1) • Tweedie Steel Ring Corral (1)
Catchments
• Ferguson Pockets North (1) • Shoebuckle (1) • Upper Shoebuckle Catchment (1) • Link Spring Corral Catchment (1) on state land. • Hidden Rim (1)
Cattleguards • Tweedie Pond Cattleguard (1) • Tweedie Point Cattleguard (1) • Unnamed Cattleguards (3)
Fenced Reservoirs
• Divide Reservoir (1) • Slick Rock Reservoir (1) • Hidden Reservoir (1) • Tweedie Reservoir (1) • Tweedie Pond (1)
Unfenced Reservoirs • Jack Reservoir (1) • George’s Canyon Pond (1)
Livestock Troughs • Unnamed trough (1) • Ferguson Pocket Tank (1)
Supplemental Storage Tanks
• Link Spring Storage Tanks (2) • Unnamed Storage Tanks (2) • Ferguson Pocket Storage Tank (1) • Upper Shoebuckle Storage Tank (1) • Tweedie Steel Ring Storage Tank (1)
Well • Lower Bench Spring (1)
Springs • Link Spring West (1) • Link Spring East (1)
Wildlife Catchment • Tweedie Points Wildlife Catchment (1) Table F.2. Link Spring Allotment Existing Fences
Range Improvement Type Name Miles
Fence Link Spring Division Fence 0.70 Fence Last Chance Division Fence 1.01 Fence Nutter Twist Division Fence 0.18 Fence Esplin Max Fence 0.99 Fence Tweedie Steel Ring Corral Fence 0.18 Fence Tweedie Pond Water Lot Fence 0.15
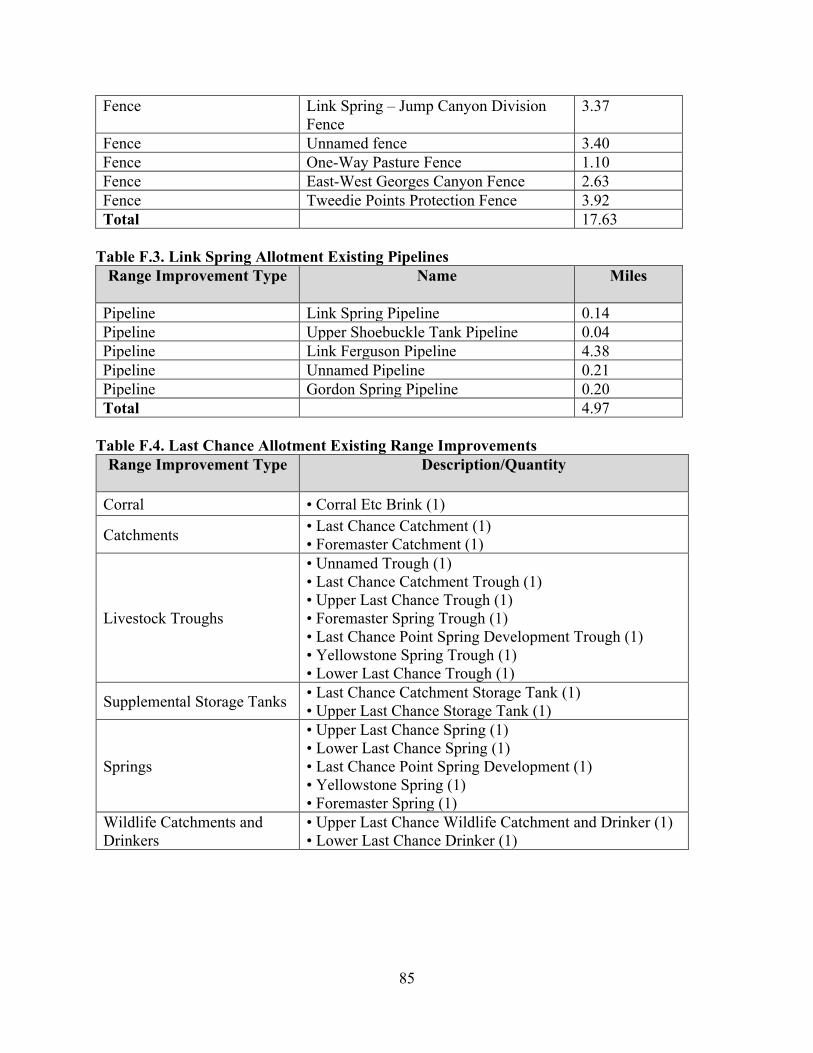
85
Fence Link Spring – Jump Canyon Division Fence
3.37
Fence Unnamed fence 3.40 Fence One-Way Pasture Fence 1.10 Fence East-West Georges Canyon Fence 2.63 Fence Tweedie Points Protection Fence 3.92 Total 17.63
Table F.3. Link Spring Allotment Existing Pipelines
Range Improvement Type Name Miles
Pipeline Link Spring Pipeline 0.14 Pipeline Upper Shoebuckle Tank Pipeline 0.04 Pipeline Link Ferguson Pipeline 4.38 Pipeline Unnamed Pipeline 0.21 Pipeline Gordon Spring Pipeline 0.20 Total 4.97
Table F.4. Last Chance Allotment Existing Range Improvements
Range Improvement Type Description/Quantity
Corral • Corral Etc Brink (1)
Catchments • Last Chance Catchment (1) • Foremaster Catchment (1)
Livestock Troughs
• Unnamed Trough (1) • Last Chance Catchment Trough (1) • Upper Last Chance Trough (1) • Foremaster Spring Trough (1) • Last Chance Point Spring Development Trough (1) • Yellowstone Spring Trough (1) • Lower Last Chance Trough (1)
Supplemental Storage Tanks • Last Chance Catchment Storage Tank (1) • Upper Last Chance Storage Tank (1)
Springs
• Upper Last Chance Spring (1) • Lower Last Chance Spring (1) • Last Chance Point Spring Development (1) • Yellowstone Spring (1) • Foremaster Spring (1)
Wildlife Catchments and Drinkers
• Upper Last Chance Wildlife Catchment and Drinker (1) • Lower Last Chance Drinker (1)
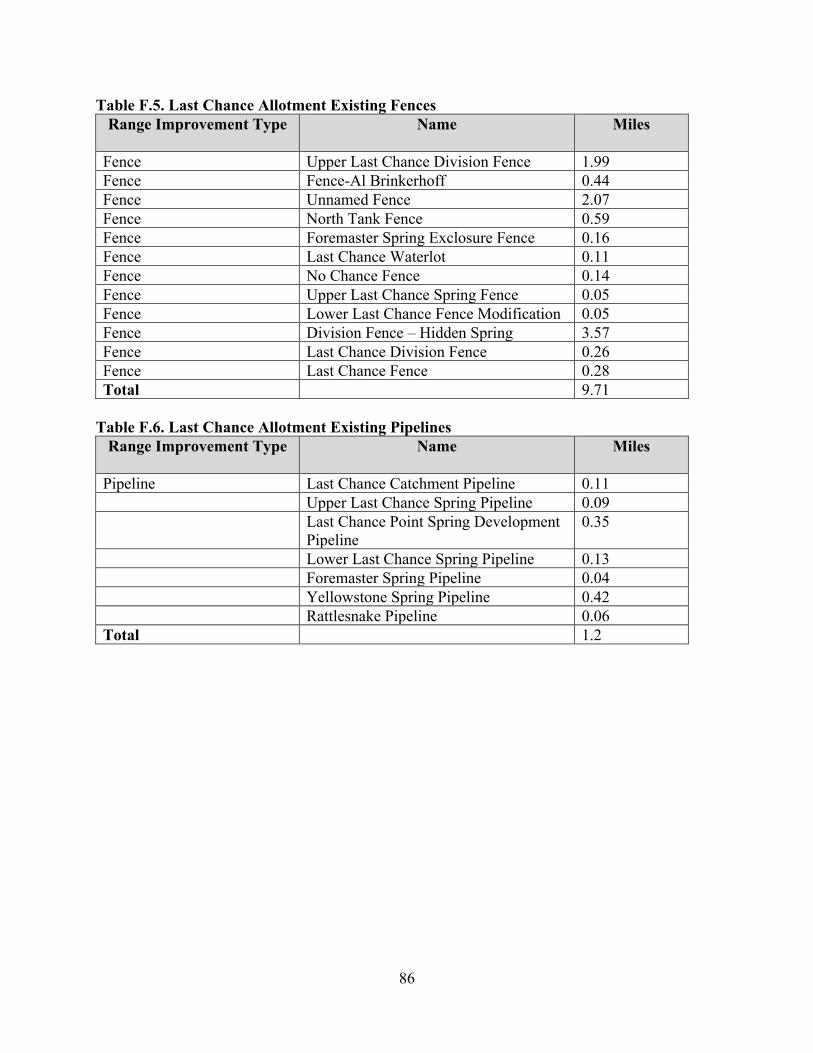
86
Table F.5. Last Chance Allotment Existing Fences Range Improvement Type Name Miles
Fence Upper Last Chance Division Fence 1.99 Fence Fence-Al Brinkerhoff 0.44 Fence Unnamed Fence 2.07 Fence North Tank Fence 0.59 Fence Foremaster Spring Exclosure Fence 0.16 Fence Last Chance Waterlot 0.11 Fence No Chance Fence 0.14 Fence Upper Last Chance Spring Fence 0.05 Fence Lower Last Chance Fence Modification 0.05 Fence Division Fence – Hidden Spring 3.57 Fence Last Chance Division Fence 0.26 Fence Last Chance Fence 0.28 Total 9.71
Table F.6. Last Chance Allotment Existing Pipelines
Range Improvement Type Name Miles
Pipeline Last Chance Catchment Pipeline 0.11 Upper Last Chance Spring Pipeline 0.09 Last Chance Point Spring Development
Pipeline 0.35
Lower Last Chance Spring Pipeline 0.13 Foremaster Spring Pipeline 0.04 Yellowstone Spring Pipeline 0.42 Rattlesnake Pipeline 0.06 Total 1.2
Related Documents


