LINEAR TECHNOLOGY CORPORATION ANALOG EXCELLENCE 2010 ANNUAL REPORT INNOVATION LED RECOVERY

Welcome message from author
This document is posted to help you gain knowledge. Please leave a comment to let me know what you think about it! Share it to your friends and learn new things together.
Transcript

Mixed Sources Product group from well-managed forests, controlled sources and recycled wood or fiber
Cert no. SCS-COC-xxxxxxwww.fsc.org
© 1996 Forest Stewardship Council
This annual report is printed on Sterling White Dull Recycled, smooth finish, which is made with 100% post-consumer recycled fiber and FSC certified. The 10K is printed on 40# Opaque text, which is FSC certified.
LINEAR TECHNOLOGY CORPORATION ANALOG EXCELLENCE2010 ANNUAL REPORT
INNOVAT ION LED RECOVERY1630 McCARTHY BOULEVARD
M ILP ITAS , CA 95035
(408 ) 432-1900 WWW.L INEAR.COM
Corporate Information
BOARD OF DIRECTORS
Robert H. Swanson, Jr.Director since 1981 Executive Chairman Co-founder and Chief Executive Officer from 1981 to January 2005 Linear Technology Corporation
Lothar MaierDirector since 2005 Chief Executive Officer since January 2005 Linear Technology Corporation
Arthur C. Agnos1
Director since 2010 Former Mayor of San Francisco, California
John J. Gordon1, 2
Director since 2010 Senior Investment Officer State Farm Insurance Company
David S. Lee 2
Director since 1988 Chairman eOn Communication Corp.
Richard M. Moley 1, 2
Chairman of Compensation Committee Director since 1994 Former President and Chief Executive Officer StrataCom, Inc.
Thomas S. Volpe 1, 2
Chairman of Audit Committee Director since 1984 Former Chief Executive Officer Dubai Group LLC
TRANSFER AGENT AND REGISTRAR
Computershare Trust Company N.A.PO Box 43078 Providence, Rhode Island 02940-3078
INDEPENDENT REGISTERED PUBLIC ACCOUNTING FIRM
Ernst & Young LLP San Jose, California
LEGAL COUNSEL
Wilson, Sonsini, Goodrich & RosatiProfessional Corporation
CORPORATE AND INVESTOR INFORMATION
Please direct inquiries to:
Paul CoghlanVice President, Finance and CFO Linear Technology Corporation 1630 McCarthy Blvd. Milpitas, California 95035-7417
OFFICERS
Robert H. Swanson, Jr.Co-founder and Executive Chairman
Lothar MaierChief Executive Officer
V. Paul ChantalatVice President, Quality and Reliability
Paul CoghlanVice President, Finance, Chief Financial Officer, and Secretary
Robert C. DobkinCo-founder, Vice President, Engineering, and Chief Technical Officer
Alexander R. McCannVice President and Chief Operating Officer
Richard E. NicksonVice President, North American Sales
Donald E. PaulusVice President, Power Management Products
Steve PietkiewiczVice President, Power Management Products
David A. QuarlesVice President, International Sales
Robert L. ReayVice President, Mixed Signal Products
Erik M. SouleVice President, Signal Conditioning Products
1 Member of the Compensation Committee2 Member of the Audit Committee , LT, LTC, LTM, Linear Technology, the Linear logo and µModule are registered trademarks and Hot Swap is a trademark of Linear Technology Corporation. All other names are trademarks or registered trademarks of their respective companies and manufacturers.Printed in USA, Copyright 2010, Linear Technology Corporation.1630 McCarthy Blvd. Milpitas, CA 95035 (408) 432-1900 www.linear.com
Linear Technology Corporation (Nasdaq: LLTC), a member of the S&P 500, designs, manufactures and markets a broad line of high performance analog integrated circuits for major communications, computer and industrial companies worldwide. Linear (or analog) circuits provide an essential bridge between our analog world and the digital microelectronics used in consumer products, wireless communications, networking products, computers, medical electronics, industrial instrumentation, factory automation, and automotive electronics. Linear Technology provides customers with high performance amplifiers, comparators, voltage references, monolithic filters, linear regulators, DC/DC converters, battery chargers, data converters, communications interface circuits, RF signal conditioning circuits, μModule products, and many other analog functions.
The Company markets over 7,500 products to more than 15,000 original equipment manufacturers. These products compete in the marketplace based on their performance, functional value, quality and reliability. Linear Technology products are produced using state-of-the-art silicon gate CMOS, BiCMOS, Complementary Bipolar, High Voltage and RF wafer fabrication process technologies.
Linear Technology, headquartered in Milpitas, California, employs 4,200 people worldwide and has technical sales and support locations throughout North America, Europe and Asia. In addi-tion to manufacturing, assembly and test facilities in California, Washington, Singapore and Malaysia, the Company has twelve design centers in Arizona, California (3), Colorado, Vermont, Massachusetts, New Hampshire, North Carolina, Texas, Singapore, and Munich, Germany.
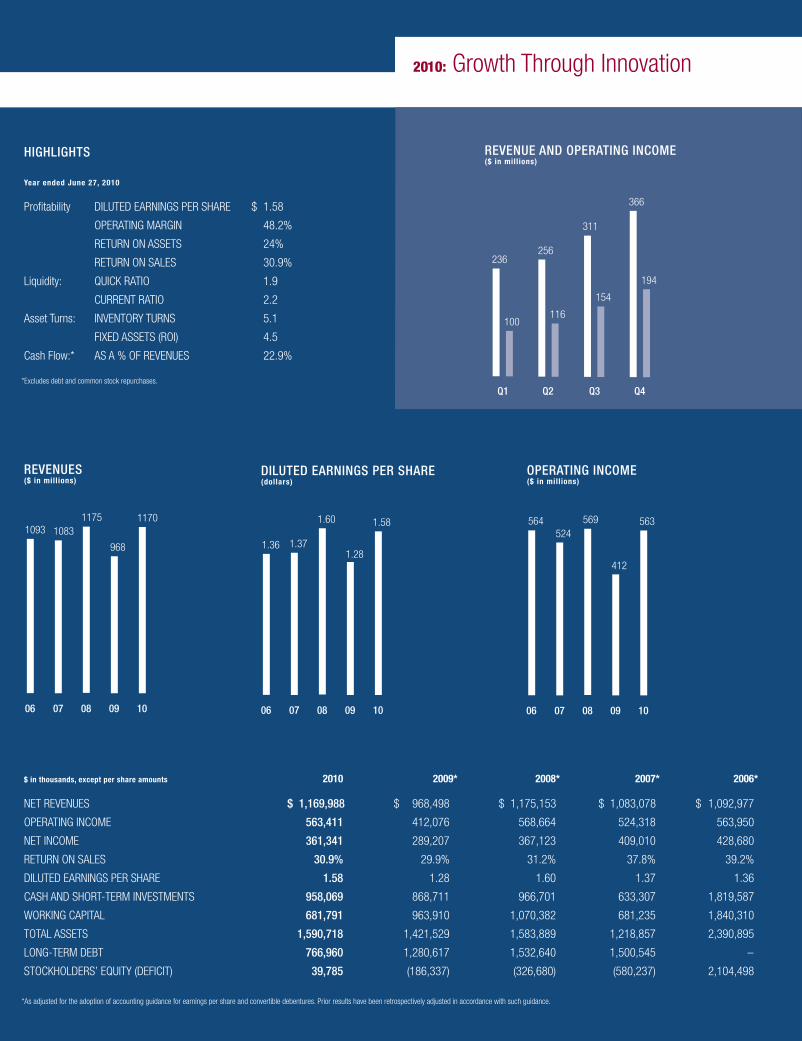
Year ended June 27, 2010
Profitability DILUTED EARNINGS PER SHARE $ 1.58
OPERATING MARGIN 48.2%
RETURN ON ASSETS 24%
RETURN ON SALES 30.9%
Liquidity: QUICK RATIO 1.9
CURRENT RATIO 2.2
Asset Turns: INVENTORY TURNS 5.1
FIXED ASSETS (ROI) 4.5
Cash Flow:* AS A % OF REVENUES 22.9%
2010: Growth Through Innovation
$ in thousands, except per share amounts 2010 2009* 2008* 2007* 2006*
NET REVENUES $ 1,169,988 $ 968,498 $ 1,175,153 $ 1,083,078 $ 1,092,977
OPERATING INCOME 563,411 412,076 568,664 524,318 563,950
NET INCOME 361,341 289,207 367,123 409,010 428,680
RETURN ON SALES 30.9% 29.9% 31.2% 37.8% 39.2%
DILUTED EARNINGS PER SHARE 1.58 1.28 1.60 1.37 1.36
CASH AND SHORT-TERM INVESTMENTS 958,069 868,711 966,701 633,307 1,819,587
WORKING CAPITAL 681,791 963,910 1,070,382 681,235 1,840,310
TOTAL ASSETS 1,590,718 1,421,529 1,583,889 1,218,857 2,390,895
LONG-TERM DEBT 766,960 1,280,617 1,532,640 1,500,545 –
STOCKHOLDERS’ EQUITY (DEFICIT) 39,785 (186,337) (326,680) (580,237) 2,104,498
REVENUES ($ in mill ions)
HIGHLIGHTS
OPERATING INCOME ($ in mill ions)
* As adjusted for the adoption of accounting guidance for earnings per share and convertible debentures. Prior results have been retrospectively adjusted in accordance with such guidance.
* Excludes debt and common stock repurchases.
DILUTED EARNINGS PER SHARE (dollars)
REVENUE AND OPERATING INCOME ($ in mill ions)
06 07 08 09 10
1093 10831175
968
1170
06 07 08 09 10
1.36 1.37
1.60
1.28
1.58
Q1 Q2 Q3 Q4
236256
311
366
100116
154
194
06 07 08 09 10
564524
569
412
563

�
Automotive Electronics >
To Our Stockholders
Fiscal 2010 was a very good year for us as we recovered quicker than we had anticipated from the global recession. Our quarterly revenues grew sequentially over the prior quarters by 14%, 9%, 21% and 18%, thereby surpassing our previous quarterly sales record prior to the recession. We are now exceeding our revenue and operating profit growth trend lines which began prior to the recession.
This has been an innovation led recovery. Prior to the recession, the seeds were planted
for cutting edge products across many end-markets. During the recession, companies
continued to invest in the development of these products. Their emergence recently has
led the recovery. Innovation in multi-protocol basestations, automotive electronics, energy
efficiency, tablet computers and many other products, a few of which are shown on the cover
of this annual report, has fueled market recovery across the industrial, telecommunications,
automotive and computer end-markets. Linear Technology has been at the forefront of
analog innovation, which has played an enabling role in the technological trends driving
these products. This innovation leadership has enabled us to be the fastest growing and
most profitable major analog supplier as demonstrated by our financial results.
Revenues for fiscal 2010 were $1,170 million, up from the $968.5 million reported for
fiscal year 2009. This growth was very broad based as we grew in each major geographical
area—North America, Europe, Japan and Asia Pacific—and in most major end-markets—
industrial, computer and automotive. Net income of $361.3 million was an increase of $72.1
million, or 25% over the $289.2 million reported for fiscal 2009. Diluted EPS was $1.58, an
increase of 23% over $1.28 in the prior fiscal year. Operating profit as a percent of sales was
48.2%, up from 42.5% last year and is nearly double that of our closest competitor.
P R O D U C T S
Amplifiers
Data Converters
Linear Regulators
Switching Regulators
µModule® Power Products
µModule Communications Devices
Battery Chargers & Monitors
LED Drivers
Energy Harvesting Products
Hot Swap™ Products
Power over Ethernet
RF & Wireless
Interface
Filters
Timing Devices
Comparators
Voltage References
LINEAR IS ONE OF A SELECT GROUP OF SEMICONDUCTOR SUPPLIERS WHOSE
PRODUCTS MEET THE DEMANDING QUALITY AND RELIABILITY REQUIREMENTS
OF AUTOMOTIVE MANUFACTURERS. THE COMPANY’S POWER CONVERSION
PRODUCTS, USED THROUGHOUT THE MANY AUTOMOTIVE ELECTRONIC
SYSTEMS, INCLUDE LED DRIVERS TO POWER CONSOLE BACKLIGHTING
AND THE LATEST LED HEADLIGHTS. LINEAR’S BATTERY STACK MONITORS
PROVIDE PRECISION VOLTAGE MONITORING, ENABLING THE USE OF LITHIUM-ION
BATTERIES IN THE NEXT GENERATION OF HYBRID AND ELECTRIC VEHICLES.

Once again the Company generated positive cash flow from operations, this year’s
being $492.5 million versus $416.6 million in fiscal 2009. Cash flow from operations
was positive for the 97th consecutive quarter. During the year the Company reduced
the total outstanding principal of its Convertible debt from $1,405.6 million to $1,240.9 mil-
lion as it purchased $154.9 million of its 3.00% Convertible debt and $9.8 million of its
3.125% Convertible debt. Presently, the Company intends to retire all of its remaining
3.125% Convertible debt of $395.8 million in November 2010 when it is putable and
callable. During the year the Company increased its quarterly dividend from $0.22 per
share to $0.23 per share. This marks the 18th consecutive year, encompassing various
economic cycles, that the Company has increased the dividend since initially declaring
a dividend in 1992.
These industry leading financial results are the culmination of a several year focus on a
strategy to optimize our strengths and differentiate the Company from its competitors.
Our marketplace is the non-commodity traditional high-performance analog market.
In addressing this marketplace, we concentrate on inventing cutting edge products
which we market globally through a technical sales force. We have vertically integrated
manufacturing capabilities, which emphasize timeliness of delivery and the highest
levels of quality and reliability.
With regard to our marketplace, several years ago we fine tuned our strategic direction
to increase our presence in industrial and automotive markets; maintain our presence
in the computer and telecommunications infrastructure and networking markets;
and decrease our exposure in the commodity driven markets of consumer and cell
phone products. Accordingly, in fiscal 2010, the industrial end-market was 36% of our
bookings, automotive was 11% and military/satellite was 7%, up respectively from
32%, 5% and 3% five years ago. Telecommunications infrastructure and networking
< Telecom & Networking
A P P L I C AT I O N S
Automotive
Wireless Infrastructure
Display & Video
Data Storage
Networking
Energy Harvesting
Green Technology Products
Alternative Energy Systems
Industrial
Medical
Instrumentation
Computers
High-End Consumer
Military & Aerospace
�
THE EXPLOSION IN VOICE, DATA AND VIDEO TRAFFIC OVER TODAY’S WIRELESS
NETWORKS IS CAUSING RAPID EXPANSION OF TELECOMMUNICATIONS
INFRASTRUCTURE WORLDWIDE. LINEAR PROVIDES THE KEY SIGNAL CHAIN BUILD-
ING BLOCKS FOR CELLULAR BASESTATIONS, INCLUDING RF DEVICES, HIGH SPEED
ANALOG-TO-DIGITAL CONVERTERS AND µMODULE RECEIVERS, WITH THE PRECI-
SION AND QUALITY DEMANDED BY NEXT-GENERATION WIRELESS NETWORKS.
LINEAR’S POWER AND MIXED SIGNAL PRODUCTS ARE KEY ELEMENTS IN THE
SYSTEMS PRODUCED BY THE FOREMOST NETWORKING COMPANIES.
was 22% of our bookings and computer was 15%, similar to 24% and 11% respectively,
five years ago. Finally, high-end consumer was 7% and cell phone was 2%, down
substantially from 9% and 11%.
Going forward we have an opportunity rich environment. The overall analog market is
forecasted to grow to roughly $45 billion in 2012. We serve approximately one-third of
this market and our areas of emphasis are projected to be the fastest growing.
This emphasis on high-performance analog has driven our product direction. We have
many unique creative products currently populating sales in this innovation driven
recovery in the global marketplace. The latest generation 4G basestations utilize
Linear products from many of our business units, including high speed low power A to
D converters, signal chain µModule products and high frequency mixers, demodulators
and RMS power detectors. Automotive electronics employ our new battery management
systems for hybrid and electric vehicles and also use our drivers for LED lighting and
various other power products in both gas and electric vehicles. Energy efficiency is
particularly prevalent throughout industrial end-markets. Our high efficiency power
products with operation up to 100 volts are one example of solutions that mitigate
thermal challenges in a wide range of factory applications. Our digital power
management products are employed in server farms to monitor and control for
optimum performance. Tablet computer products have become very successful this
year using several of our latest generation switching power managers and battery
charging devices to optimize charging efficiency and run time.
Energy harvesting techniques employing alternative ambient energy sources such as
temperature changes, vibration, wind and solar present unique challenges in storing
and efficiently converting alternative energy. Our new energy harvesting products and
nano-power battery chargers have received wide acceptance in this developing market.
Q U A L I T Y & R E L I A B I L I T Y
Denso Preferred Supplier
Boeing Satellite Systems Gold Supplier Award
Huawei Quality Excellence Award
Northrop Grumman Gold Supplier Award
Panasonic Automotive Systems Europe Quality Award
Fluke Outstanding Supplier Partnership Award
Cisco Excellence in Quality Award
Siemens Quality Supplier Award
Rockwell Collins Supplier of the Year Award
3M Supplier Performance Award
Sony Green Partnership Award
Canon Green Procurement Standard Award
Delphi Absolute Zero Defect Award
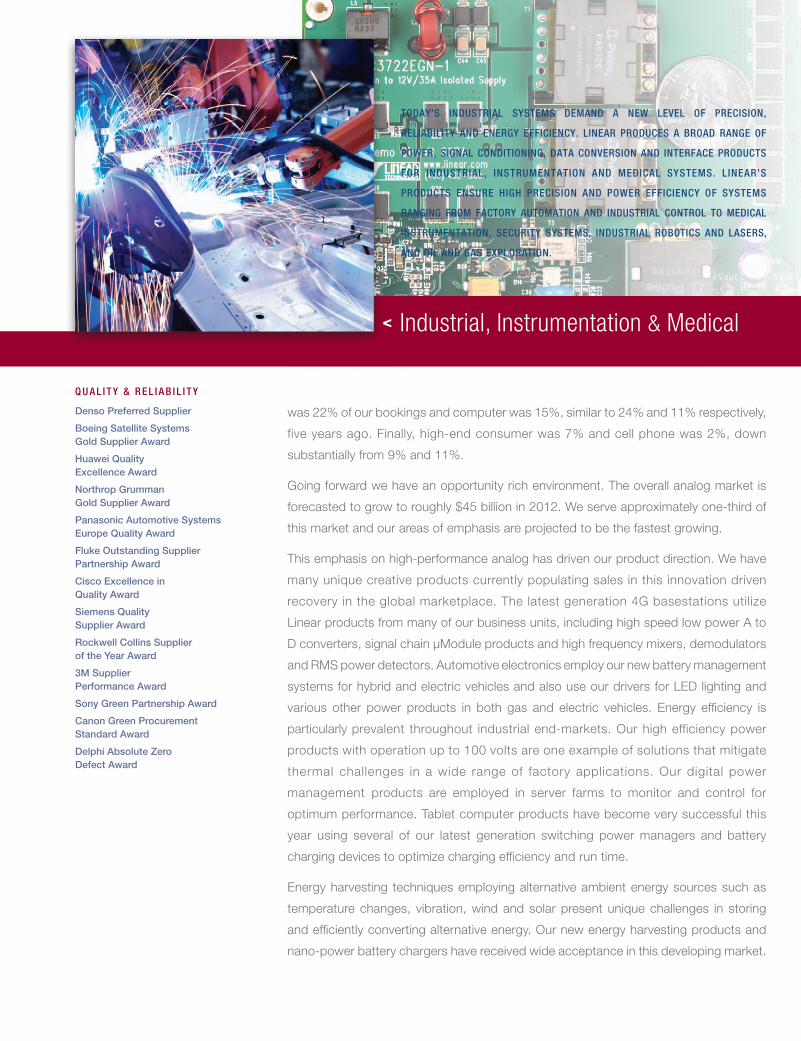
TODAY’S INDUSTRIAL SYSTEMS DEMAND A NEW LEVEL OF PRECISION,
RELIABILITY AND ENERGY EFFICIENCY. LINEAR PRODUCES A BROAD RANGE OF
POWER, SIGNAL CONDITIONING, DATA CONVERSION AND INTERFACE PRODUCTS
FOR INDUSTRIAL, INSTRUMENTATION AND MEDICAL SYSTEMS. LINEAR’S
PRODUCTS ENSURE HIGH PRECISION AND POWER EFFICIENCY OF SYSTEMS
RANGING FROM FACTORY AUTOMATION AND INDUSTRIAL CONTROL TO MEDICAL
INSTRUMENTATION, SECURITY SYSTEMS, INDUSTRIAL ROBOTICS AND LASERS,
AND OIL AND GAS EXPLORATION.
< Industrial, Instrumentation & Medical

Our timely ability to innovate has been matched by our ability to deliver
products to our customers. Two important attributes have been distinguishing
factors to our success this year as there has been a rapid rebound from a
recessionary environment to marketplace growth and limits on the availability
of products. First, our comparatively low lead times and performance to
schedule have given us a competitive advantage and second, our outstanding
quality and reliability have distinguished us as a unique supplier, particularly in
the quality conscious automotive market.
In summary, we believe we are well positioned going forward. Analog
excellence has been our mantra from product design to marketing to
manufacturing to financial performance. We are a good fit for an innovation
rich marketplace. We have a very talented and energized workforce and
discerning customers and investors. We are grateful to all of them for their
efforts, their challenges and their loyalty. This innovation rich environment is
the optimum environment for us.
Sincerely,
PA U L C O G H L A N
Vice President, Finance and Chief Financial Officer
R O B E RT H . S WA N S O N, J R .
Executive ChairmanL OT H A R M A I E R
Chief Executive Officer
LINEAR’S POWER AND BATTERY MANAGEMENT DEVICES ARE KEY COMPONENTS
IN THE LATEST GENERATION OF TABLET COMPUTERS, WHOSE INNOVATIVE
TOUCH-SCREEN COMPUTING PROMISES TO REVOLUTIONIZE PORTABLE
COMPUTING. IN ADDITION, LINEAR’S µMODULE PRODUCTS ARE USED IN SOLID
STATE DRIVES THAT ARE INCREASING MEMORY CAPACITY AND RELIABILITY,
WHILE SHRINKING PRODUCT SIZE.
Tablet Computing & Storage >
Corporate Information
BOARD OF DIRECTORS
Robert H. Swanson, Jr.Director since 1981 Executive Chairman Co-founder and Chief Executive Officer from 1981 to January 2005 Linear Technology Corporation
Lothar MaierDirector since 2005 Chief Executive Officer since January 2005 Linear Technology Corporation
Arthur C. Agnos1
Director since 2010 Former Mayor of San Francisco, California
John J. Gordon1, 2
Director since 2010 Senior Investment Officer State Farm Insurance Company
David S. Lee 2
Director since 1988 Chairman eOn Communication Corp.
Richard M. Moley 1, 2
Chairman of Compensation Committee Director since 1994 Former President and Chief Executive Officer StrataCom, Inc.
Thomas S. Volpe 1, 2
Chairman of Audit Committee Director since 1984 Former Chief Executive Officer Dubai Group LLC
TRANSFER AGENT AND REGISTRAR
Computershare Trust Company N.A.PO Box 43078 Providence, Rhode Island 02940-3078
INDEPENDENT REGISTERED PUBLIC ACCOUNTING FIRM
Ernst & Young LLP San Jose, California
LEGAL COUNSEL
Wilson, Sonsini, Goodrich & RosatiProfessional Corporation
CORPORATE AND INVESTOR INFORMATION
Please direct inquiries to:
Paul CoghlanVice President, Finance and CFO Linear Technology Corporation 1630 McCarthy Blvd. Milpitas, California 95035-7417
OFFICERS
Robert H. Swanson, Jr.Co-founder and Executive Chairman
Lothar MaierChief Executive Officer
V. Paul ChantalatVice President, Quality and Reliability
Paul CoghlanVice President, Finance, Chief Financial Officer, and Secretary
Robert C. DobkinCo-founder, Vice President, Engineering, and Chief Technical Officer
Alexander R. McCannVice President and Chief Operating Officer
Richard E. NicksonVice President, North American Sales
Donald E. PaulusVice President, Power Management Products
Steve PietkiewiczVice President, Power Management Products
David A. QuarlesVice President, International Sales
Robert L. ReayVice President, Mixed Signal Products
Erik M. SouleVice President, Signal Conditioning Products
1 Member of the Compensation Committee2 Member of the Audit Committee , LT, LTC, LTM, Linear Technology, the Linear logo and µModule are registered trademarks and Hot Swap is a trademark of Linear Technology Corporation. All other names are trademarks or registered trademarks of their respective companies and manufacturers.Printed in USA, Copyright 2010, Linear Technology Corporation.1630 McCarthy Blvd. Milpitas, CA 95035 (408) 432-1900 www.linear.com
Linear Technology Corporation (Nasdaq: LLTC), a member of the S&P 500, designs, manufactures and markets a broad line of high performance analog integrated circuits for major communications, computer and industrial companies worldwide. Linear (or analog) circuits provide an essential bridge between our analog world and the digital microelectronics used in consumer products, wireless communications, networking products, computers, medical electronics, industrial instrumentation, factory automation, and automotive electronics. Linear Technology provides customers with high performance amplifiers, comparators, voltage references, monolithic filters, linear regulators, DC/DC converters, battery chargers, data converters, communications interface circuits, RF signal conditioning circuits, μModule products, and many other analog functions.
The Company markets over 7,500 products to more than 15,000 original equipment manufacturers. These products compete in the marketplace based on their performance, functional value, quality and reliability. Linear Technology products are produced using state-of-the-art silicon gate CMOS, BiCMOS, Complementary Bipolar, High Voltage and RF wafer fabrication process technologies.
Linear Technology, headquartered in Milpitas, California, employs 4,200 people worldwide and has technical sales and support locations throughout North America, Europe and Asia. In addi-tion to manufacturing, assembly and test facilities in California, Washington, Singapore and Malaysia, the Company has twelve design centers in Arizona, California (3), Colorado, Vermont, Massachusetts, New Hampshire, North Carolina, Texas, Singapore, and Munich, Germany.
Year ended June 27, 2010
Profitability DILUTED EARNINGS PER SHARE $ 1.58
OPERATING MARGIN 48.2%
RETURN ON ASSETS 24%
RETURN ON SALES 30.9%
Liquidity: QUICK RATIO 1.9
CURRENT RATIO 2.2
Asset Turns: INVENTORY TURNS 5.1
FIXED ASSETS (ROI) 4.5
Cash Flow:* AS A % OF REVENUES 22.9%
2010: Growth Through Innovation
$ in thousands, except per share amounts 2010 2009* 2008* 2007* 2006*
NET REVENUES $ 1,169,988 $ 968,498 $ 1,175,153 $ 1,083,078 $ 1,092,977
OPERATING INCOME 563,411 412,076 568,664 524,318 563,950
NET INCOME 361,341 289,207 367,123 409,010 428,680
RETURN ON SALES 30.9% 29.9% 31.2% 37.8% 39.2%
DILUTED EARNINGS PER SHARE 1.58 1.28 1.60 1.37 1.36
CASH AND SHORT-TERM INVESTMENTS 958,069 868,711 966,701 633,307 1,819,587
WORKING CAPITAL 681,791 963,910 1,070,382 681,235 1,840,310
TOTAL ASSETS 1,590,718 1,421,529 1,583,889 1,218,857 2,390,895
LONG-TERM DEBT 766,960 1,280,617 1,532,640 1,500,545 –
STOCKHOLDERS’ EQUITY (DEFICIT) 39,785 (186,337) (326,680) (580,237) 2,104,498
REVENUES ($ in mill ions)
HIGHLIGHTS
OPERATING INCOME ($ in mill ions)
* As adjusted for the adoption of accounting guidance for earnings per share and convertible debentures. Prior results have been retrospectively adjusted in accordance with such guidance.
* Excludes debt and common stock repurchases.
DILUTED EARNINGS PER SHARE (dollars)
REVENUE AND OPERATING INCOME ($ in mill ions)
06 07 08 09 10
1093 10831175
968
1170
06 07 08 09 10
1.36 1.37
1.60
1.28
1.58
Q1 Q2 Q3 Q4
236256
311
366
100116
154
194
06 07 08 09 10
564524
569
412
563

Mixed Sources Product group from well-managed forests, controlled sources and recycled wood or fiber
Cert no. SCS-COC-xxxxxxwww.fsc.org
© 1996 Forest Stewardship Council
This annual report is printed on Sterling White Dull Recycled, smooth finish, which is made with 100% post-consumer recycled fiber and FSC certified. The 10K is printed on 40# Opaque text, which is FSC certified.
LINEAR TECHNOLOGY CORPORATION ANALOG EXCELLENCE2010 ANNUAL REPORT
INNOVAT ION LED RECOVERY1630 McCARTHY BOULEVARD
M ILP ITAS , CA 95035
(408 ) 432-1900 WWW.L INEAR.COM
1
UNITED STATES SECURITIES AND EXCHANGE COMMISSION
Washington, D.C. 20549 FORM 10-K
(Mark One) ANNUAL REPORT PURSUANT TO SECTION 13 OR 15(D) OF THE SECURITIES EXCHANGE ACT OF 1934
For the fiscal year ended June 27, 2010 TRANSITION REPORT PURSUANT TO SECTION 13 OR 15(D) OF THE SECURITIES EXCHANGE ACT OF 1934
For the transition period from to
Commission File Number 0-14864
LINEAR TECHNOLOGY CORPORATION (Exact name of registrant as specified in its charter)
DELAWARE 94-2778785
(State or other jurisdiction of (I.R.S. Employer Identification No.) incorporation or organization)
1630 McCarthy Boulevard, Milpitas, California 95035
(Address of principal executive offices) (Zip Code)
Registrant’s telephone number, including area code (408) 432-1900
Securities registered pursuant to Section 12(b) of the Act: Name of each exchange on which registered Common Stock, $0.001 par value The Nasdaq Stock Market LLC
Securities registered pursuant to Section 12(g) of the Act:
None
(Title of class)
Indicate by check mark if the registrant is a well-known seasoned issuer, as defined in Rule 405 of the Securities Act. Yes No
Indicate by check mark if the registrant is not required to file reports pursuant to Section 13 or Section 15(d) of the Act. Yes No
Note – Checking the box above will not relieve any registrant required to file reports pursuant to Section 13 or 15(d) of the Exchange Act from their obligations under those Sections.
Indicate by check mark whether the Registrant (1) has filed all reports required to be filed by Section 13 or 15(d) of the Securities Exchange Act of 1934 during the preceding 12 months (or for such shorter period that the Registrant was required to file such reports), and (2) has been subject to such filing requirements for the past 90 days.
Yes No Indicate by check mark whether the registrant has submitted electronically and posted on its corporate Web site, if any, every Interactive Data File required to be
submitted and posted pursuant to Rule 405 of Regulation S-T (§232.405 of this chapter) during the preceding 12 months (or for such shorter period that the registrant was required to submit and post such files).
Indicate by check mark if disclosure of delinquent filers pursuant to Item 405 of Regulation S-K (§ 229.405 of this chapter) is not contained herein, and will not be contained, to the best of the Registrant's knowledge, in definitive proxy or information statements incorporated by reference in Part III of this Form 10-K or any amendment to this Form 10-K.
Indicate by check mark whether the registrant is a large accelerated filer, an accelerated filer, a non-accelerated filer or a smaller reporting company. See the
definitions of “large accelerated filer,” “accelerated filer” and “smaller reporting company” in Rule 12b-2 of the Exchange Act. (Check one):
Large accelerated filer Accelerated filer
Non-accelerated filer ( Do not check if a smaller reporting company) Smaller reporting company Indicate by check mark whether the registrant is a shell company (as defined in Rule 12b-2 of the Exchange Act). Yes No The aggregate market value of voting stock held by non-affiliates of the Registrant was approximately $4,368,000,000 as of December 24, 2009 based upon the
closing sale price on the Nasdaq Global Market reported for such date. Shares of common stock held by each officer and director and by each person who owns 5% or more of the outstanding common stock have been excluded in that such persons may be deemed to be affiliates. This determination of affiliate status is not necessarily a conclusive determination for other purposes.
There were 224,449,024 shares of the registrant's common stock issued and outstanding as of July 23, 2010.
DOCUMENTS INCORPORATED BY REFERENCE:
(1) Items 10, 11, 12 and 14 of Part III incorporate information by reference from the definitive proxy statement (the "2010 Proxy Statement") for the 2010 Annual Meeting of Stockholders, to be filed subsequently.
Yes No
2
LINEAR TECHNOLOGY CORPORATION
FORM 10-K For the Fiscal Year Ended June 27, 2010
TABLE OF CONTENTS
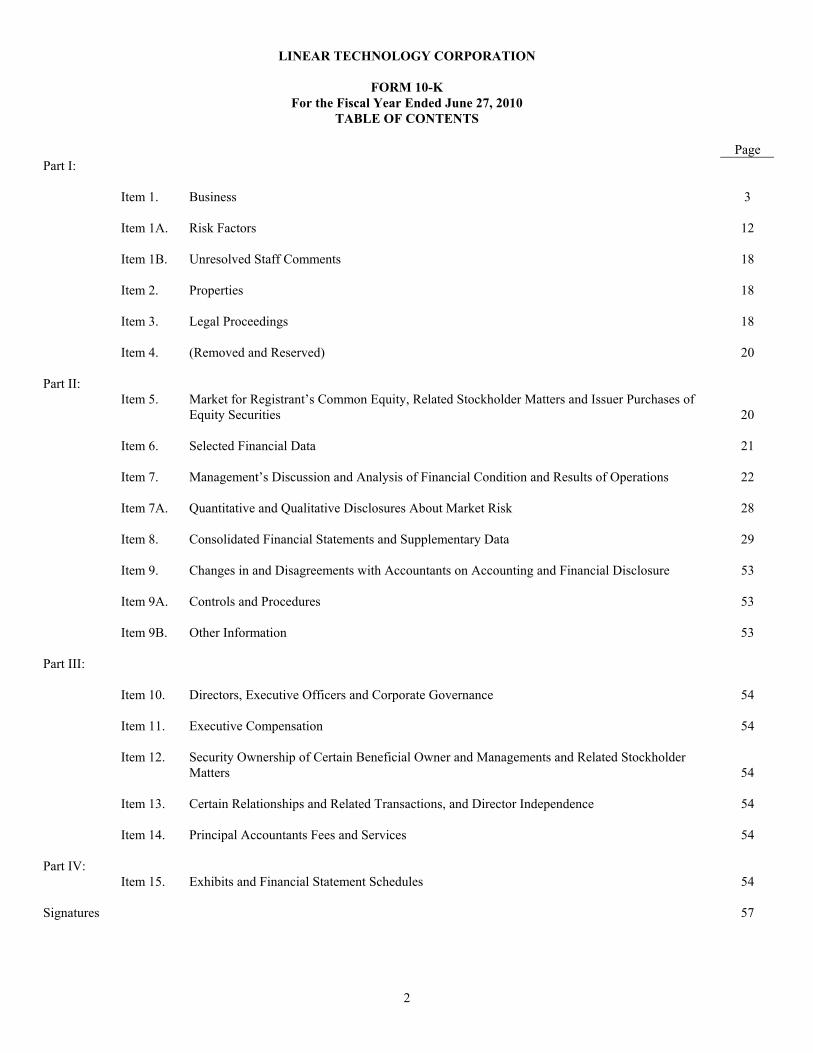
Page Part I: Item 1. Business 3 Item 1A. Risk Factors 12 Item 1B. Unresolved Staff Comments 18 Item 2. Properties 18 Item 3. Legal Proceedings 18 Item 4. (Removed and Reserved) 20 Part II: Item 5. Market for Registrant’s Common Equity, Related Stockholder Matters and Issuer Purchases of
Equity Securities
20 Item 6. Selected Financial Data 21 Item 7. Management’s Discussion and Analysis of Financial Condition and Results of Operations 22 Item 7A. Quantitative and Qualitative Disclosures About Market Risk 28 Item 8. Consolidated Financial Statements and Supplementary Data 29 Item 9. Changes in and Disagreements with Accountants on Accounting and Financial Disclosure 53 Item 9A. Controls and Procedures 53 Item 9B. Other Information 53 Part III: Item 10. Directors, Executive Officers and Corporate Governance 54 Item 11. Executive Compensation 54 Item 12. Security Ownership of Certain Beneficial Owner and Managements and Related Stockholder
Matters
54 Item 13. Certain Relationships and Related Transactions, and Director Independence 54 Item 14. Principal Accountants Fees and Services 54 Part IV: Item 15. Exhibits and Financial Statement Schedules 54 Signatures 57
3
PART I ITEM 1. BUSINESS
Except for historical information contained in this Form 10-K, certain statements set forth herein, including statements regarding future revenues and profits; future conditions in the Company’s markets; availability of resources and manufacturing capacity; resolution of certain tax matters; and the anticipated impact of current and future lawsuits and investigations are forward-looking statements that are dependent on certain risks and uncertainties including such factors, among others, as the timing, volume and pricing of new orders for the Company’s products, timely ramp-up of new facilities, the timely introduction of new processes and products, general conditions in the world economy and financial markets and other factors described below. Therefore, actual outcomes and results may differ materially from what is expressed or forecast in such forward-looking statements. Words such as “expect,” “anticipate,” “intend,” “plan,” “believe,” “seek,” “estimate,” and variations of such words and similar expressions are intended to identify such forward-looking statements. See “Risk Factors” in the “Business” section of this Annual Report on Form 10-K for a more thorough list of potential risks and uncertainties. General
Linear Technology Corporation (together with its consolidated subsidiaries, “Linear Technology” or the “Company”) designs, manufactures and markets a broad line of standard high performance linear integrated circuits. The Company’s products include high performance amplifiers, comparators, voltage references, monolithic filters, linear regulators, DC-DC converters, battery chargers, data converters, communications interface circuits, RF signal conditioning circuits, µModuleTM products, and many other analog functions. Applications for Linear Technology’s high performance circuits include telecommunications, cellular telephones, networking products such as optical switches; tablet, notebook and desktop computers; computer peripherals, video/multimedia, industrial instrumentation, security monitoring devices, high-end consumer products such as digital cameras and global positioning systems, complex medical devices, automotive electronics, factory automation, process control, military, space and other harsh environment systems. The Company is a Delaware corporation; it was originally organized and incorporated in California in 1981. The Company competes primarily on the basis of performance, functional value, quality, reliability and service. Available Information
The Company makes available free of charge through its website, www.linear.com, its Annual Reports on Form 10-K, Quarterly Reports on Form 10-Q, Current Reports on Form 8-K, proxy statements and all amendments to those reports as soon as reasonably practicable after such materials are electronically filed with the Securities and Exchange Commission (“SEC”). These reports may also be requested by contacting Paul Coghlan, Vice President of Finance and Chief Financial Officer, 1630 McCarthy Blvd., Milpitas, CA 95035. The Company’s Internet website and the information contained therein or incorporated therein are not intended to be incorporated into this Annual Report on Form 10-K. In addition, the public may read and copy any materials the Company files with the SEC at the SEC’s Public Reference Room at 450 Fifth Street, NW, Washington, DC 20549 or may obtain information by calling the SEC at 1-800-SEC-0330. Moreover, the SEC maintains an Internet site that contains reports, proxy and information statements, and other information regarding reports that the Company files electronically with them at http://www.sec.gov. The Linear Circuit Industry
Semiconductor components are the electronic building blocks used in electronic systems and equipment. These components are classified as either discrete devices (such as individual transistors) or integrated circuits (in which a number of transistors and other elements are combined to form a more complicated electronic circuit). Integrated circuits ("ICs") may be divided into two general categories, digital and linear (or analog). Digital circuits, such as memory devices and microprocessors, generally process on-off electrical signals, represented by binary digits, “1” and “0.” In contrast, linear integrated circuits monitor, condition, amplify or transform continuous analog signals associated with physical properties, such as temperature, pressure, weight, light, sound or speed, and play an important role in bridging between real world phenomena and a variety of electronic systems. Linear integrated circuits also provide voltage regulation and power control to electronic systems, especially in hand-held battery powered systems where battery management and high power efficiency are needed.
The Company believes that several factors generally distinguish the linear integrated circuit business from the digital
integrated circuit business, including:
Importance of Individual Design Contribution. The Company believes that the creativity of individual design engineers is of particular importance in the linear integrated circuit industry. The design of a linear integrated circuit generally involves greater variety and less repetition of integrated circuit elements than digital design. In addition, the interaction of linear integrated circuit elements is complex, and the exact placement of these elements in the integrated circuit is critical to the circuit's precision and performance. Computer-aided engineering and design tools for linear integrated circuits are not as
4
accurate in modeling circuits as those tools used for designing digital circuits. As a result, the contributions of a relatively small number of individual design engineers are generally of greater importance in the design of linear integrated circuits than in the design of digital circuits.
Smaller Capital Requirements. Digital circuit design attempts to minimize device size and maximize speed by increasing circuit densities. The process technology necessary for increased density requires very expensive wafer fabrication equipment. In contrast, linear integrated circuit design focuses on precise matching and placement of integrated circuit elements, and linear integrated circuits often require large feature sizes to achieve precision and high voltage operation. Accordingly, the linear integrated circuit manufacturing process generally requires smaller initial capital expenditures, particularly for photomasking equipment and clean room facilities, and less frequent replacement of manufacturing equipment because the equipment has, to date, been less vulnerable to technological obsolescence.
Market Diversity; Relative Pricing Stability. Because of the varied applications for linear integrated circuits, manufacturers typically offer a greater variety of device types to a more diverse group of customers, who typically have smaller volume requirements per device, than is true for digital IC manufacturers. As a result, linear integrated circuit manufacturers are often less dependent upon particular products or customers; linear integrated circuit markets are generally more fragmented; and competition within those markets tends to be more diffused.
The Company believes that competition in the integrated linear market is particularly dependent upon performance, functional value, quality, reliability and service. As a result, linear integrated circuit pricing has generally been more stable than most digital circuit pricing.
Products and Markets
Linear Technology produces a wide range of products for a variety of customers and markets. The Company emphasizes standard products and multi-customer application specific products to address larger markets and to reduce the risk of dependency upon a single customer's requirements. The Company targets the high performance segment of the analog integrated circuit market. "High performance" may be characterized by higher precision, higher efficiency, lower noise, lower power, higher linearity, higher speed, more subsystem integration on a single chip and many other special features. The Company focuses virtually all of its design efforts on proprietary products, which at the time of introduction are original designs by the Company offering unique characteristics differentiating them from those offered by competitors.
Although the types and mix of linear products vary by application, the Company’s principal product categories are as follows:
Amplifiers - These circuits amplify the output voltage or current of a device. The amplification represents the ratio of the output voltage or current to the input voltage or current. The most widely used device is the operational amplifier due to its versatility and precision.
High Speed Amplifiers - These amplifiers are used to amplify signals from 5 megahertz to several hundred megahertz for applications such as video, fast data acquisition and communications.
Voltage Regulators - Voltage regulators deliver a tightly controlled voltage to power electronic systems. This category of
product consists primarily of two types, the linear regulator and the switch-mode regulator. Switch-mode regulators are also used to convert voltage up or down within an electronic system for power management and battery charging.
Voltage References - These circuits serve as electronic benchmarks providing a constant voltage for measurement systems usage. Precision references have a constant output independent of input, temperature changes or time.
Interface - Interface circuits act as an intermediary to transfer digital signals between or within electronic systems. These circuits are used in computers, modems, instruments and remote data acquisition systems.
Data Converters - These circuits change linear (analog) signals into digital signals, or vise versa, and are often referred to as data acquisition subsystems, A/D converters and D/A converters. The accuracy and speed with which the analog signal is converted to its digital counterpart (and vise versa) is considered a key characteristic for these devices. Low speed data converters may have resolution up to 24 bits, while high speed converters may operate in the region of 100’s of megahertz sample rates.
Radio Frequency Circuits - These circuits include mixers, modulators, demodulators, amplifiers, drivers, filters, oscillators/synthesizers and power detectors and controllers. They are used in wireless and cable infrastructure, cellphones, and wireless data communications infrastructure.
5
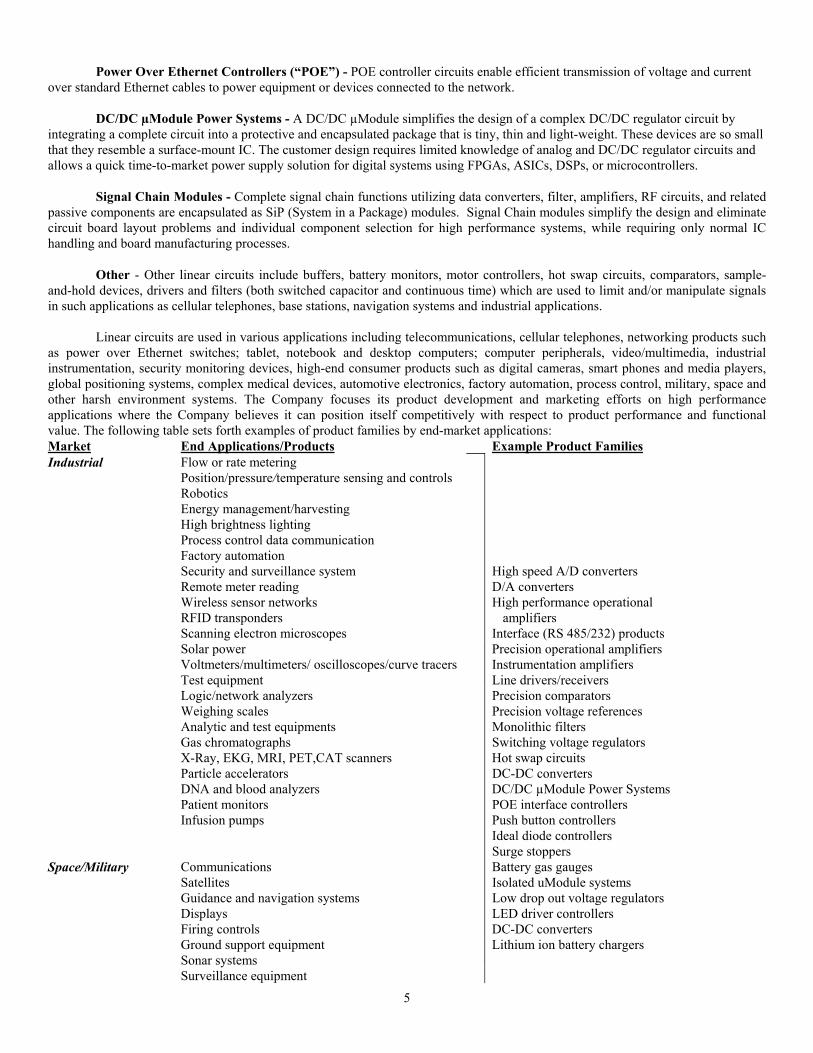
Power Over Ethernet Controllers (“POE”) - POE controller circuits enable efficient transmission of voltage and current
over standard Ethernet cables to power equipment or devices connected to the network. DC/DC µModule Power Systems - A DC/DC µModule simplifies the design of a complex DC/DC regulator circuit by
integrating a complete circuit into a protective and encapsulated package that is tiny, thin and light-weight. These devices are so small that they resemble a surface-mount IC. The customer design requires limited knowledge of analog and DC/DC regulator circuits and allows a quick time-to-market power supply solution for digital systems using FPGAs, ASICs, DSPs, or microcontrollers.
Signal Chain Modules - Complete signal chain functions utilizing data converters, filter, amplifiers, RF circuits, and related passive components are encapsulated as SiP (System in a Package) modules. Signal Chain modules simplify the design and eliminate circuit board layout problems and individual component selection for high performance systems, while requiring only normal IC handling and board manufacturing processes.
Other - Other linear circuits include buffers, battery monitors, motor controllers, hot swap circuits, comparators, sample-
and-hold devices, drivers and filters (both switched capacitor and continuous time) which are used to limit and/or manipulate signals in such applications as cellular telephones, base stations, navigation systems and industrial applications.
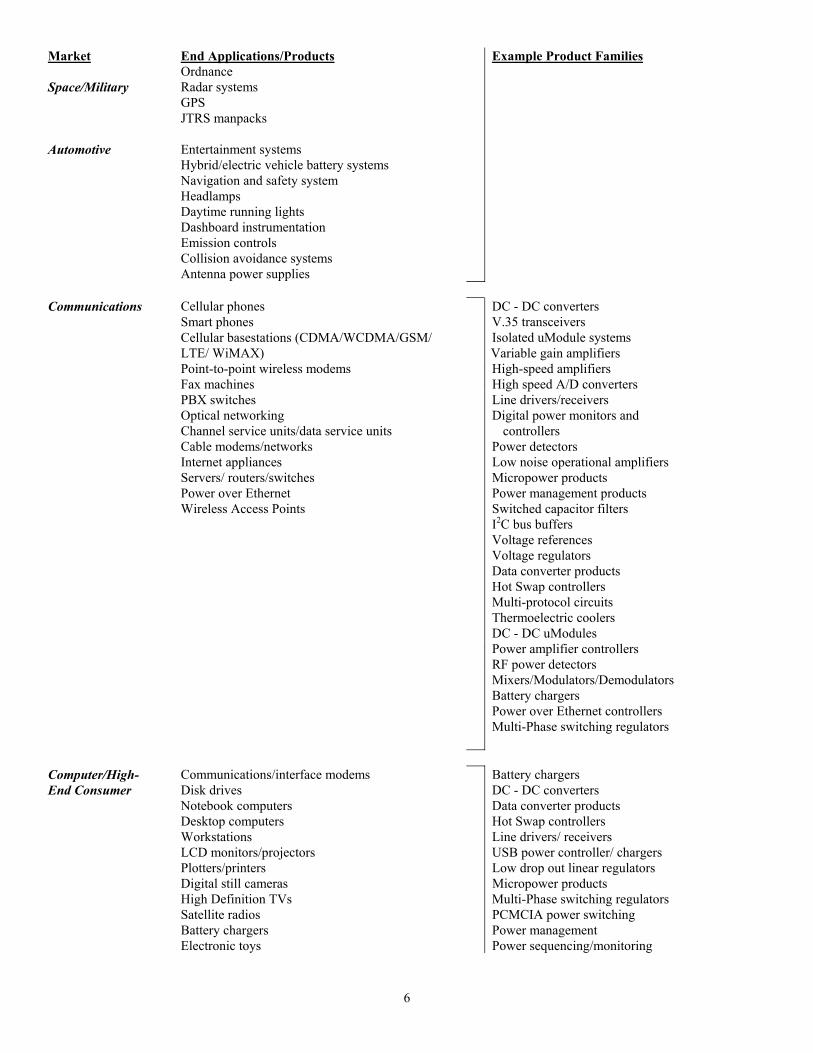
Linear circuits are used in various applications including telecommunications, cellular telephones, networking products such as power over Ethernet switches; tablet, notebook and desktop computers; computer peripherals, video/multimedia, industrial instrumentation, security monitoring devices, high-end consumer products such as digital cameras, smart phones and media players, global positioning systems, complex medical devices, automotive electronics, factory automation, process control, military, space and other harsh environment systems. The Company focuses its product development and marketing efforts on high performance applications where the Company believes it can position itself competitively with respect to product performance and functional value. The following table sets forth examples of product families by end-market applications: Market End Applications/Products Example Product Families Industrial Flow or rate metering Position/pressure/temperature sensing and controls Robotics Energy management/harvesting High brightness lighting Process control data communication Factory automation Security and surveillance system High speed A/D converters Remote meter reading D/A converters Wireless sensor networks High performance operational RFID transponders amplifiers Scanning electron microscopes Interface (RS 485/232) products Solar power Precision operational amplifiers Voltmeters/multimeters/ oscilloscopes/curve tracers Instrumentation amplifiers Test equipment Line drivers/receivers Logic/network analyzers Precision comparators Weighing scales Precision voltage references Analytic and test equipments Monolithic filters Gas chromatographs Switching voltage regulators X-Ray, EKG, MRI, PET,CAT scanners Hot swap circuits Particle accelerators DC-DC converters DNA and blood analyzers DC/DC µModule Power Systems Patient monitors POE interface controllers Infusion pumps Push button controllers Ideal diode controllers Surge stoppers Space/Military Communications Battery gas gauges Satellites Isolated uModule systems Guidance and navigation systems Low drop out voltage regulators Displays LED driver controllers Firing controls DC-DC converters Ground support equipment Lithium ion battery chargers Sonar systems Surveillance equipment
6
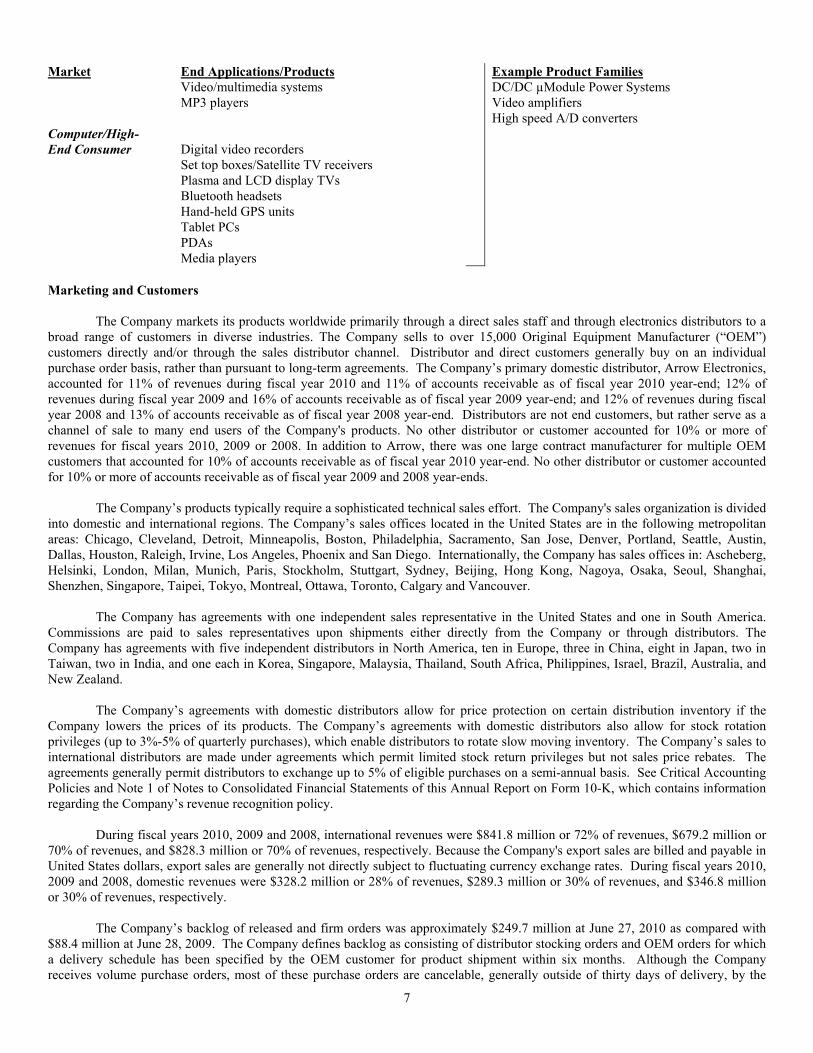
Market End Applications/Products Example Product Families Ordnance Space/Military Radar systems GPS JTRS manpacks Automotive Entertainment systems Hybrid/electric vehicle battery systems Navigation and safety system Headlamps Daytime running lights Dashboard instrumentation Emission controls Collision avoidance systems Antenna power supplies Communications Cellular phones DC - DC converters Smart phones V.35 transceivers Cellular basestations (CDMA/WCDMA/GSM/ Isolated uModule systems LTE/ WiMAX) Variable gain amplifiers Point-to-point wireless modems High-speed amplifiers Fax machines High speed A/D converters PBX switches Line drivers/receivers Optical networking Digital power monitors and Channel service units/data service units controllers Cable modems/networks Power detectors Internet appliances Low noise operational amplifiers Servers/ routers/switches Micropower products Power over Ethernet Power management products Wireless Access Points Switched capacitor filters I2C bus buffers Voltage references Voltage regulators Data converter products Hot Swap controllers Multi-protocol circuits Thermoelectric coolers DC - DC uModules Power amplifier controllers RF power detectors Mixers/Modulators/Demodulators Battery chargers Power over Ethernet controllers Multi-Phase switching regulators Computer/High- Communications/interface modems Battery chargers End Consumer Disk drives DC - DC converters Notebook computers Data converter products Desktop computers Hot Swap controllers Workstations Line drivers/ receivers LCD monitors/projectors USB power controller/ chargers Plotters/printers Low drop out linear regulators Digital still cameras Micropower products High Definition TVs Multi-Phase switching regulators Satellite radios PCMCIA power switching Battery chargers Power management Electronic toys Power sequencing/monitoring
7
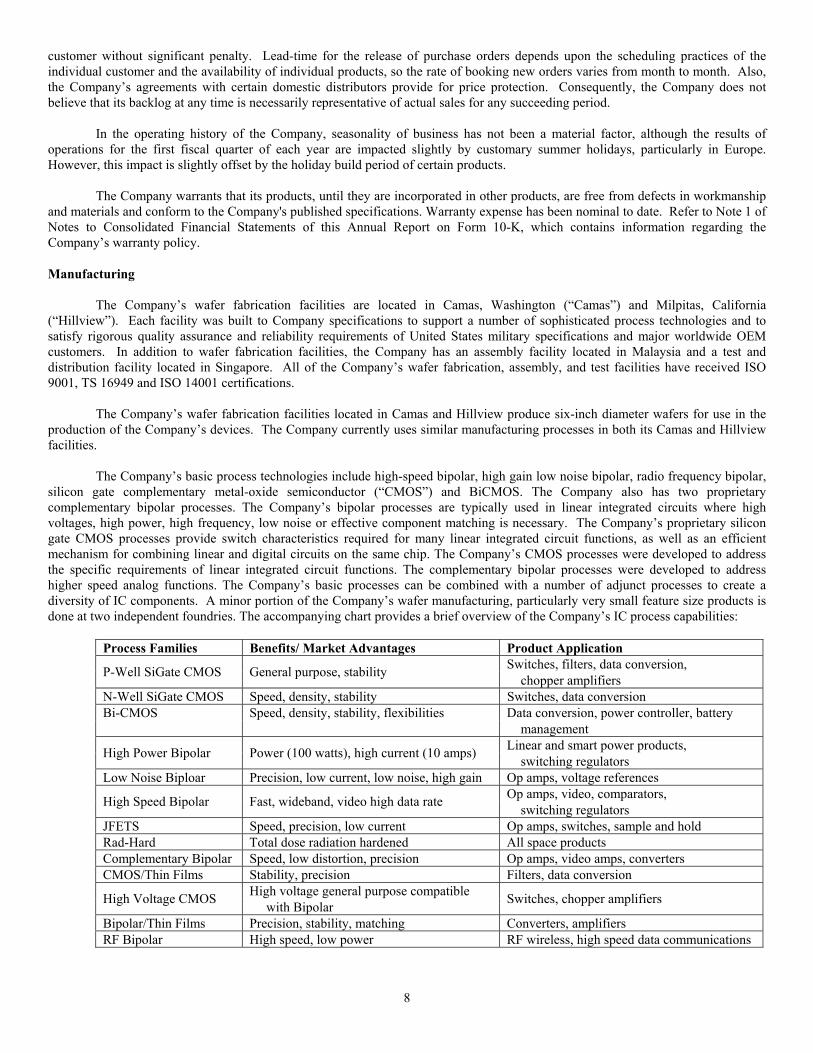
Market End Applications/Products Example Product Families Video/multimedia systems DC/DC µModule Power Systems MP3 players Video amplifiers High speed A/D converters Computer/High- End Consumer Digital video recorders Set top boxes/Satellite TV receivers Plasma and LCD display TVs Bluetooth headsets Hand-held GPS units Tablet PCs PDAs Media players Marketing and Customers
The Company markets its products worldwide primarily through a direct sales staff and through electronics distributors to a broad range of customers in diverse industries. The Company sells to over 15,000 Original Equipment Manufacturer (“OEM”) customers directly and/or through the sales distributor channel. Distributor and direct customers generally buy on an individual purchase order basis, rather than pursuant to long-term agreements. The Company’s primary domestic distributor, Arrow Electronics, accounted for 11% of revenues during fiscal year 2010 and 11% of accounts receivable as of fiscal year 2010 year-end; 12% of revenues during fiscal year 2009 and 16% of accounts receivable as of fiscal year 2009 year-end; and 12% of revenues during fiscal year 2008 and 13% of accounts receivable as of fiscal year 2008 year-end. Distributors are not end customers, but rather serve as a channel of sale to many end users of the Company's products. No other distributor or customer accounted for 10% or more of revenues for fiscal years 2010, 2009 or 2008. In addition to Arrow, there was one large contract manufacturer for multiple OEM customers that accounted for 10% of accounts receivable as of fiscal year 2010 year-end. No other distributor or customer accounted for 10% or more of accounts receivable as of fiscal year 2009 and 2008 year-ends.
The Company’s products typically require a sophisticated technical sales effort. The Company's sales organization is divided into domestic and international regions. The Company’s sales offices located in the United States are in the following metropolitan areas: Chicago, Cleveland, Detroit, Minneapolis, Boston, Philadelphia, Sacramento, San Jose, Denver, Portland, Seattle, Austin, Dallas, Houston, Raleigh, Irvine, Los Angeles, Phoenix and San Diego. Internationally, the Company has sales offices in: Ascheberg, Helsinki, London, Milan, Munich, Paris, Stockholm, Stuttgart, Sydney, Beijing, Hong Kong, Nagoya, Osaka, Seoul, Shanghai, Shenzhen, Singapore, Taipei, Tokyo, Montreal, Ottawa, Toronto, Calgary and Vancouver.
The Company has agreements with one independent sales representative in the United States and one in South America.
Commissions are paid to sales representatives upon shipments either directly from the Company or through distributors. The Company has agreements with five independent distributors in North America, ten in Europe, three in China, eight in Japan, two in Taiwan, two in India, and one each in Korea, Singapore, Malaysia, Thailand, South Africa, Philippines, Israel, Brazil, Australia, and New Zealand.
The Company’s agreements with domestic distributors allow for price protection on certain distribution inventory if the
Company lowers the prices of its products. The Company’s agreements with domestic distributors also allow for stock rotation privileges (up to 3%-5% of quarterly purchases), which enable distributors to rotate slow moving inventory. The Company’s sales to international distributors are made under agreements which permit limited stock return privileges but not sales price rebates. The agreements generally permit distributors to exchange up to 5% of eligible purchases on a semi-annual basis. See Critical Accounting Policies and Note 1 of Notes to Consolidated Financial Statements of this Annual Report on Form 10-K, which contains information regarding the Company’s revenue recognition policy.
During fiscal years 2010, 2009 and 2008, international revenues were $841.8 million or 72% of revenues, $679.2 million or 70% of revenues, and $828.3 million or 70% of revenues, respectively. Because the Company's export sales are billed and payable in United States dollars, export sales are generally not directly subject to fluctuating currency exchange rates. During fiscal years 2010, 2009 and 2008, domestic revenues were $328.2 million or 28% of revenues, $289.3 million or 30% of revenues, and $346.8 million or 30% of revenues, respectively.
The Company’s backlog of released and firm orders was approximately $249.7 million at June 27, 2010 as compared with $88.4 million at June 28, 2009. The Company defines backlog as consisting of distributor stocking orders and OEM orders for which a delivery schedule has been specified by the OEM customer for product shipment within six months. Although the Company receives volume purchase orders, most of these purchase orders are cancelable, generally outside of thirty days of delivery, by the
8
customer without significant penalty. Lead-time for the release of purchase orders depends upon the scheduling practices of the individual customer and the availability of individual products, so the rate of booking new orders varies from month to month. Also, the Company’s agreements with certain domestic distributors provide for price protection. Consequently, the Company does not believe that its backlog at any time is necessarily representative of actual sales for any succeeding period.
In the operating history of the Company, seasonality of business has not been a material factor, although the results of
operations for the first fiscal quarter of each year are impacted slightly by customary summer holidays, particularly in Europe. However, this impact is slightly offset by the holiday build period of certain products.
The Company warrants that its products, until they are incorporated in other products, are free from defects in workmanship
and materials and conform to the Company's published specifications. Warranty expense has been nominal to date. Refer to Note 1 of Notes to Consolidated Financial Statements of this Annual Report on Form 10-K, which contains information regarding the Company’s warranty policy. Manufacturing
The Company’s wafer fabrication facilities are located in Camas, Washington (“Camas”) and Milpitas, California (“Hillview”). Each facility was built to Company specifications to support a number of sophisticated process technologies and to satisfy rigorous quality assurance and reliability requirements of United States military specifications and major worldwide OEM customers. In addition to wafer fabrication facilities, the Company has an assembly facility located in Malaysia and a test and distribution facility located in Singapore. All of the Company’s wafer fabrication, assembly, and test facilities have received ISO 9001, TS 16949 and ISO 14001 certifications.
The Company’s wafer fabrication facilities located in Camas and Hillview produce six-inch diameter wafers for use in the production of the Company’s devices. The Company currently uses similar manufacturing processes in both its Camas and Hillview facilities.
The Company’s basic process technologies include high-speed bipolar, high gain low noise bipolar, radio frequency bipolar,
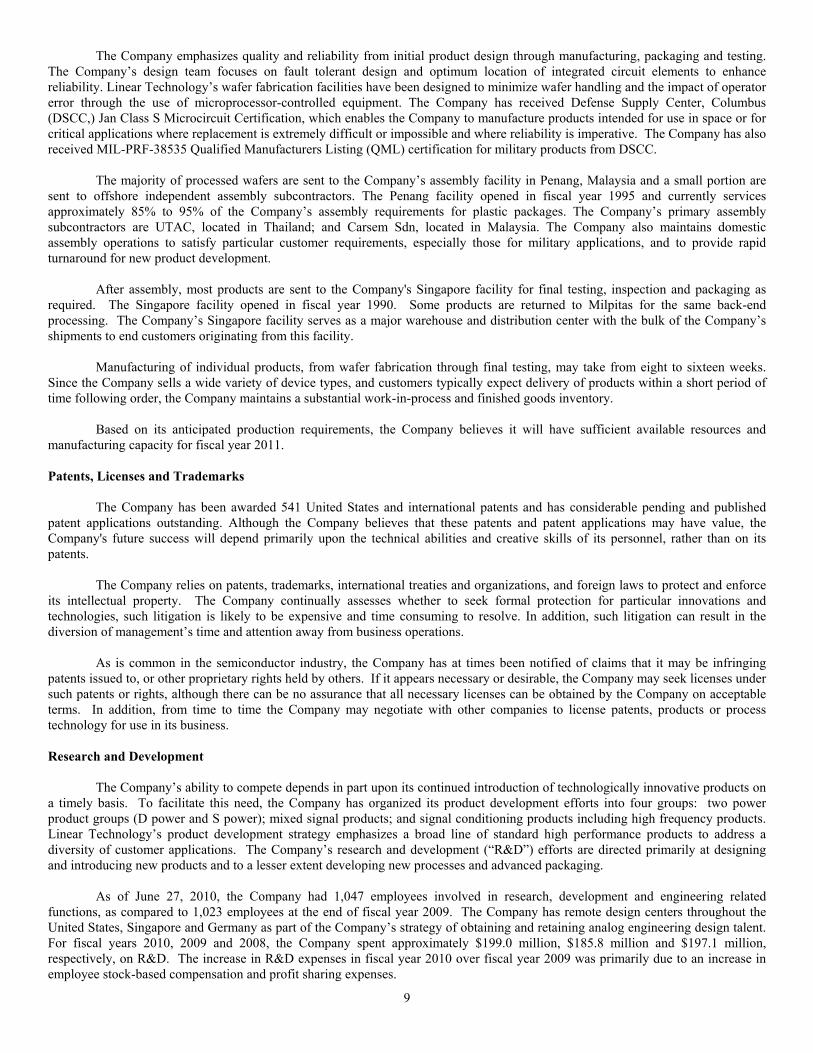
silicon gate complementary metal-oxide semiconductor (“CMOS”) and BiCMOS. The Company also has two proprietary complementary bipolar processes. The Company’s bipolar processes are typically used in linear integrated circuits where high voltages, high power, high frequency, low noise or effective component matching is necessary. The Company’s proprietary silicon gate CMOS processes provide switch characteristics required for many linear integrated circuit functions, as well as an efficient mechanism for combining linear and digital circuits on the same chip. The Company’s CMOS processes were developed to address the specific requirements of linear integrated circuit functions. The complementary bipolar processes were developed to address higher speed analog functions. The Company’s basic processes can be combined with a number of adjunct processes to create a diversity of IC components. A minor portion of the Company’s wafer manufacturing, particularly very small feature size products is done at two independent foundries. The accompanying chart provides a brief overview of the Company’s IC process capabilities:
Process Families Benefits/ Market Advantages Product Application Switches, filters, data conversion,
P-Well SiGate CMOS General purpose, stability chopper amplifiers
N-Well SiGate CMOS Speed, density, stability Switches, data conversion Data conversion, power controller, battery Bi-CMOS Speed, density, stability, flexibilities
management Linear and smart power products,
High Power Bipolar Power (100 watts), high current (10 amps) switching regulators
Low Noise Biploar Precision, low current, low noise, high gain Op amps, voltage references Op amps, video, comparators,
High Speed Bipolar Fast, wideband, video high data rate switching regulators
JFETS Speed, precision, low current Op amps, switches, sample and hold Rad-Hard Total dose radiation hardened All space products Complementary Bipolar Speed, low distortion, precision Op amps, video amps, converters CMOS/Thin Films Stability, precision Filters, data conversion
High voltage general purpose compatible High Voltage CMOS
with Bipolar Switches, chopper amplifiers
Bipolar/Thin Films Precision, stability, matching Converters, amplifiers RF Bipolar High speed, low power RF wireless, high speed data communications
9
The Company emphasizes quality and reliability from initial product design through manufacturing, packaging and testing. The Company’s design team focuses on fault tolerant design and optimum location of integrated circuit elements to enhance reliability. Linear Technology’s wafer fabrication facilities have been designed to minimize wafer handling and the impact of operator error through the use of microprocessor-controlled equipment. The Company has received Defense Supply Center, Columbus (DSCC,) Jan Class S Microcircuit Certification, which enables the Company to manufacture products intended for use in space or for critical applications where replacement is extremely difficult or impossible and where reliability is imperative. The Company has also received MIL-PRF-38535 Qualified Manufacturers Listing (QML) certification for military products from DSCC.
The majority of processed wafers are sent to the Company’s assembly facility in Penang, Malaysia and a small portion are
sent to offshore independent assembly subcontractors. The Penang facility opened in fiscal year 1995 and currently services approximately 85% to 95% of the Company’s assembly requirements for plastic packages. The Company’s primary assembly subcontractors are UTAC, located in Thailand; and Carsem Sdn, located in Malaysia. The Company also maintains domestic assembly operations to satisfy particular customer requirements, especially those for military applications, and to provide rapid turnaround for new product development.
After assembly, most products are sent to the Company's Singapore facility for final testing, inspection and packaging as required. The Singapore facility opened in fiscal year 1990. Some products are returned to Milpitas for the same back-end processing. The Company’s Singapore facility serves as a major warehouse and distribution center with the bulk of the Company’s shipments to end customers originating from this facility.
Manufacturing of individual products, from wafer fabrication through final testing, may take from eight to sixteen weeks.
Since the Company sells a wide variety of device types, and customers typically expect delivery of products within a short period of time following order, the Company maintains a substantial work-in-process and finished goods inventory.
Based on its anticipated production requirements, the Company believes it will have sufficient available resources and manufacturing capacity for fiscal year 2011.
Patents, Licenses and Trademarks
The Company has been awarded 541 United States and international patents and has considerable pending and published patent applications outstanding. Although the Company believes that these patents and patent applications may have value, the Company's future success will depend primarily upon the technical abilities and creative skills of its personnel, rather than on its patents.
The Company relies on patents, trademarks, international treaties and organizations, and foreign laws to protect and enforce
its intellectual property. The Company continually assesses whether to seek formal protection for particular innovations and technologies, such litigation is likely to be expensive and time consuming to resolve. In addition, such litigation can result in the diversion of management’s time and attention away from business operations.
As is common in the semiconductor industry, the Company has at times been notified of claims that it may be infringing
patents issued to, or other proprietary rights held by others. If it appears necessary or desirable, the Company may seek licenses under such patents or rights, although there can be no assurance that all necessary licenses can be obtained by the Company on acceptable terms. In addition, from time to time the Company may negotiate with other companies to license patents, products or process technology for use in its business. Research and Development
The Company’s ability to compete depends in part upon its continued introduction of technologically innovative products on a timely basis. To facilitate this need, the Company has organized its product development efforts into four groups: two power product groups (D power and S power); mixed signal products; and signal conditioning products including high frequency products. Linear Technology’s product development strategy emphasizes a broad line of standard high performance products to address a diversity of customer applications. The Company’s research and development (“R&D”) efforts are directed primarily at designing and introducing new products and to a lesser extent developing new processes and advanced packaging.
As of June 27, 2010, the Company had 1,047 employees involved in research, development and engineering related functions, as compared to 1,023 employees at the end of fiscal year 2009. The Company has remote design centers throughout the United States, Singapore and Germany as part of the Company’s strategy of obtaining and retaining analog engineering design talent. For fiscal years 2010, 2009 and 2008, the Company spent approximately $199.0 million, $185.8 million and $197.1 million, respectively, on R&D. The increase in R&D expenses in fiscal year 2010 over fiscal year 2009 was primarily due to an increase in employee stock-based compensation and profit sharing expenses.
10
Government Contracts
The Company currently has no material U.S. Government contracts.
Employees
As of June 27, 2010, the Company had 4,191 employees, including 429 in marketing and sales, 1,047 in research, development and engineering related functions, 2,609 in manufacturing and production, and 106 in management, administration and finance. The Company has never had a work stoppage, no employees are represented by a labor organization, and the Company considers its employee relations to be good. Competition
The Company competes in the high performance segment of the linear market. The Company’s major competitors include Analog Devices, National Semiconductor, Intersil, Maxim Integrated Products and Texas Instruments. The principal elements of competition include product performance, functional value, quality and reliability, technical service and support, price, diversity of product line and delivery capabilities. The Company believes it competes favorably with respect to these factors, although the Company may be at a disadvantage in comparison to larger companies with broader product lines and greater technical service and support capabilities. Executive Officers of the Registrant
The executive officers of the Company, and their ages as of August 1, 2010, are as follows: Name Age Position Robert H. Swanson, Jr. 71 Executive Chairman of the Board of Directors Lothar Maier 55 Chief Executive Officer Paul Chantalat 60 Vice President Quality and Reliability Paul Coghlan 65 Vice President of Finance and Chief Financial Officer; Secretary Robert C. Dobkin 66 Vice President of Engineering and Chief Technical Officer Alexander R. McCann 44 Vice President and Chief Operating Officer Richard Nickson 60 Vice President of North American Sales David A. Quarles 44 Vice President of International Sales Donald Paulus 53 Vice President and General Manager, D Power Products Steve Pietkiewicz 50 Vice President and General Manager, S Power Products Robert Reay 49 Vice President and General Manager, Mixed Signal Products Erik M. Soule 46 Vice President and General Manager, Signal Conditioning Products
Mr. Swanson, a founder of the Company, has served as Executive Chairman of the Board of Directors since January 2005.
Prior to that time he served as Chairman of the Board of Directors and Chief Executive Officer since April 1999, and prior to that time as President, Chief Executive Officer and a director of the Company since its incorporation in September 1981. From August 1968 to July 1981, he was employed in various positions at National Semiconductor Corporation (“National”), a manufacturer of integrated circuits, including Vice President and General Manager of the Linear Integrated Circuit Operation and Managing Director in Europe. Mr. Swanson has a B.S. degree in Industrial Engineering from Northeastern University.
Mr. Maier was named Chief Executive Officer of Linear Technology in January 2005. Prior to that, Mr. Maier served as the
Company’s Chief Operating Officer from April 1999 to January 2005. Before joining Linear Technology, Mr. Maier held various management positions at Cypress Semiconductor Corp. from July 1983 to March 1999, most recently as Senior Vice President and Executive Vice President of Worldwide Operations. He holds a B.S. degree in Chemical Engineering from the University of California at Berkeley.
Mr. Chantalat has served as Vice President of Quality and Reliability since July 1991. From January 1989 to July 1991, he
held the position of Director of Quality and Reliability. From July 1983 to January 1989, he held the position of Manager of Quality and Reliability. From February 1976 to July 1983, he was employed in various positions at National where his most recent position was Group Manager of Manufacturing Quality Engineering. Mr. Chantalat received a B.S. and an M.S. in Electrical Engineering from Stanford University in 1970 and 1972, respectively.
Mr. Coghlan has served as Vice President of Finance and Chief Financial Officer of the Company since December 1986. From October 1981 until joining the Company, he was employed in various positions at GenRad, Inc., a manufacturer of automated

11
test equipment, including Corporate Controller, Vice President of Corporate Quality and most recently Vice President and General Manager of the Structural Test Products Division. Before joining GenRad, Inc., Mr. Coghlan was associated with Price Waterhouse & Company in the United States and Paris, France for twelve years. Mr. Coghlan received a B.A. from Boston College in 1966 and an MBA from Babson College in 1968.
Mr. Dobkin, a founder of the Company, has served as Vice President of Engineering and Chief Technical Officer since April 1999, and as Vice President of Engineering from September 1981 to April 1999. From January 1969 to July 1981, he was employed in various positions at National, where his most recent position was Director of Advanced Circuit Development. Mr. Dobkin has extensive experience in linear integrated circuit design. Mr. Dobkin attended the Massachusetts Institute of Technology.
Mr. McCann was named Chief Operating Officer of Linear Technology in January 2005, prior to that Mr. McCann served as
Vice President of Operations since January 2004. Prior to joining Linear, he was Vice President of Operations at NanoOpto Corporation in Somerset, NJ from July 2002 to December 2003, Vice President of Worldwide Operations at Anadigics Inc. in Warren, NJ from December 1998 to June 2002 and held various management positions at National Semiconductor UK Ltd. from August 1985 to September 1998. Mr. McCann received a B.S. (equivalent) in Electrical and Electronic Engineering in 1985 from James Watt College and an MBA in 1998 from the University of Glasgow Business School.
Mr. Nickson has served as Vice President of North American Sales since October 2001. From July 2001 until October 2001 he was Director of USA Sales. From February 1998 until July 2001, he was European Sales Director. From August 1993 until January 1998, he held the position of Northwest Area Sales Manager. From April 1991 to August 1993, he was President and Co-founder of Focus Technical Sales. From August 1983 to April 1991, he served with National in various positions where his most recent position was Vice President of North American Sales. Mr. Nickson was Founder and President of Micro-Tex, Inc. from June 1980 to August 1983. Prior to 1980, Mr. Nickson spent seven years in semiconductor sales, including four years with Texas Instruments. He received a B.S. in Mathematics from Illinois Institute of Technology in 1971.
Mr. Quarles has served as Vice President of International Sales since August 2001. From October 2000 to August 2001, he
held the position of Director of Marketing. From July 1996 to September 2000, he held the position of Director of Asia-Pacific Sales stationed in Singapore. From June 1991 to July 1996, he worked as a Sales Engineer and later as District Sales Manager for the Bay Area sales team. Prior to Linear, Mr. Quarles worked two years as a Sales Engineer at National. Mr. Quarles received a B.S. in Electrical Engineering in 1988 from Cornell University.
Mr. Paulus has served as Vice President and General Manager of D Power Products since June 2003. He joined the Company in October 2001 as Director of Satellite Design Centers. Prior to joining the Company, he was a founder of Integrated Sensor Solutions, Inc. (“ISS”) serving as Vice President of Engineering and Chief Operating Officer from November 1991 to August 1999. ISS was acquired by Texas Instruments, Inc. (“TI”) in 1999, and Mr. Paulus served as TI’s General Manager, Automotive Sensors and Controls in San Jose until October 2001. Prior to ISS, Mr. Paulus served in various engineering and management positions with Sierra Semiconductor from February 1989 to November 1991, Honeywell Signal Processing Technologies from December 1984 to February 1989, and Bell Laboratories from June 1979 to December 1984. Mr. Paulus received a B.S. in Electrical Engineering from Lehigh University, an M.S. in Electrical Engineering from Stanford University and an MBA from the University of Colorado.
Mr. Pietkiewicz has served as Vice President and General Manager of S Power Products since July 2007 and as General
Manager of S Power Products since April 2005. From March 1995 until April 2005 he was a Design Engineering Manager responsible for switching regulator and linear regulator integrated circuits. Mr. Pietkiewicz began his employment at LTC as a design engineer in December 1987 after serving as a design engineer at Precision Monolithics, Inc. from May 1981 until July 1985, and Analog Devices Inc. from July 1985 until December 1987. Mr. Pietkiewicz received his BSEE degree from the University of California at Berkeley in 1981.
Mr. Reay has served as Vice President and General Manager of Mixed Signal Products since January 2002 and as General
Manager of Mixed Signal Products since November 2000. From January 1992 to October 2000 he was the Design Engineering Manager responsible for a variety of product families including interface, supervisors, battery chargers and hot swap controllers. Mr. Reay joined Linear Technology in April 1988 as a design engineer after spending four years at GE Intersil. Mr. Reay received a B.S. and M.S. in Electrical Engineering from Stanford University in 1984.
Mr. Soule has served as Vice President and General Manager of Signal Conditioning Products since July 2007 and as General Manager of Signal Conditioning Products since October 2004. He joined the Company in September 2002 as Product Marketing Manager of Signal Conditioning Products. Prior to Linear, Mr. Soule was Director of Marketing at Sensory, Inc. from 1997 to 2002. Prior to Sensory, he held various engineering and management positions at National from 1994 to 1997 and from 1986 to 1990 and Avocet, Inc. from 1990 to 1994. Mr. Soule received a B.S. in Electrical Engineering from Rensselaer Polytechnic Institute in 1986 and an MBA from San Jose State University in 1996.
12
ITEM 1A. RISK FACTORS A description of the risk factors associated with the Company is set forth below. In addition to the risk factors discussed below, see “Factors Affecting Future Operating Results” included in “Management's Discussion and Analysis” for further discussion of other risks and uncertainties that may affect the Company. Erratic consumer and/or corporate spending due to uncertainties in the macroeconomic environment could adversely affect our revenues and profitability.
We depend on demand from the industrial, communication, computer, consumer and automotive end-markets we serve. Our revenues and profitability are based on certain levels of consumer and corporate spending. Reductions or other fluctuations in consumer and/or corporate spending as a result of uncertain conditions in the macroeconomic environment, such as global credit conditions, reduced demand, imbalanced inventory levels, mortgage failures, fluctuations in interest rates, higher energy prices, or other conditions, could adversely affect, our revenues and profitability. Sudden adverse shifts in the business cycle could adversely affect our revenues and profitability.
The semiconductor market has historically been cyclical and subject to significant economic downturns at various times.
The cyclical nature of the semiconductor industry may cause us to experience substantial period-to-period fluctuations in our results of operations, which could adversely affect our revenues and profitability. The growth rate of the global economy is one of the factors affecting demand for semiconductor components. Many factors could adversely affect regional or global economic growth including turmoil or depressed conditions in financial or credit markets, depressed business or consumer confidence, inventory excesses, increased unemployment, increased price inflation for goods, services or materials, rising interest rates in the United States and the rest of the world, a significant act of terrorism which disrupts global trade or consumer confidence, geopolitical tensions including war and civil unrest, reduced levels of economic activity, or disruptions of international transportation.
Typically, our ability to meet our revenue goals and projections is dependent to a large extent on the orders we receive from
our customers within the period and by our ability to match inventory and current production mix with the product mix required to fulfill orders on hand and orders received within a period for delivery in that period. Because of this complexity in our business, no assurance can be given that we will achieve a match of inventory on hand, production units, and shippable orders sufficient to realize quarterly or annual revenue and net income goals.
Volatility in customer demand in the semiconductor industry could affect future levels of sales and profitability and limit our ability to predict such levels.
Historically, we have maintained low lead times, which has enabled customers to place orders close to their true needs for
product. In defining our financial goals and projections, we consider inventory on hand, backlog, production cycles and expected order patterns from customers. If our estimates in these areas become inaccurate, we may not be able to meet our revenue goals and projections. In addition, some customers require us to manufacture product and have it available for shipment, even though the customer is unwilling to make a binding commitment to purchase all, or even some, of the products. As a result, in any quarterly fiscal period we are subject to the risk of cancellation of orders leading to a fall-off of sales and backlog. Further, those orders may be for products that meet the customer’s unique requirements so that those cancelled orders would, in addition, result in an inventory of unsaleable products, and thus potential inventory write-offs. We routinely estimate inventory reserves required for such products, but actual results may differ from these reserve estimates.
We generate revenue from thousands of customers worldwide and our revenues are diversified by end-market and geographical
region. Our results in any period, or sequence of periods, may be positively affected by the fact that a customer has designed one of our products into one of their high selling products. This positive effect may not last, however, as our customers frequently redesign their high selling products, especially to lower their products’ costs. In such redesigns, they may decide to no longer use our product or may seek pricing terms from us that we choose not to accede to, thus resulting in the customer ceasing or significantly decreasing its purchases from us. The loss of, or a significant reduction in purchases by a portion of our customer base, for this or other reasons, such as changes in purchasing practices, could adversely affect our results of operations. In addition, the timing of customers’ inventory adjustments may adversely affect our results of operations.
We may be unsuccessful in developing and selling new products required to maintain or expand our business.
The markets for our products depend on continued demand for our products in the communications, industrial, computer, high-
end consumer and automotive end-markets. The semiconductor industry is characterized by rapid technological change, variations in
13
manufacturing efficiencies of new products, and significant expenditures for capital equipment and product development. New product offerings by competitors and customer demands for increasing linear integrated circuit performance or lower prices may render our products less competitive over time, thus necessitating our continual development of new products. New product introductions are thus a critical factor for maintaining or increasing future sales growth and sustained or increased profitability, but they can present significant business challenges because product development commitments and expenditures must be made well in advance of the related revenues. The success of a new product depends on a variety of factors including accurate forecasts of long-term market demand and future technological developments, accurate anticipation of competitors’ actions and offerings, timely and efficient completion of process design and development, timely and efficient implementation of manufacturing and assembly processes, product performance, quality and reliability of the product, and effective marketing, sales and service.
Although we believe that the high performance segment of the linear integrated circuit market is generally less affected by price
erosion or by significant expenditures for capital equipment and product development than other semiconductor market sectors, future operating results may reflect substantial period-to-period fluctuations due to these or other factors.
Our manufacturing operations may be interrupted or suffer yield problems.
We rely on our internal manufacturing facilities located in California and Washington to fabricate most of our wafers. We
depend on outside silicon foundries for a small portion (less than 5%) of our wafer fabrication. We could be adversely affected in the event of a major earthquake, which could cause temporary loss of capacity, loss of raw materials, and damage to manufacturing equipment. Additionally, we rely on our internal and external assembly and testing facilities located in Singapore and Malaysia. We are subject to economic and political risks inherent to international operations, including changes in local governmental policies, currency fluctuations, transportation delays and the imposition of export controls or increased import tariffs. We could be adversely affected if any such changes are applicable to our foreign operations.
Our manufacturing yields are a function of product design and process technology, both of which are developed by us. The
manufacture and design of integrated circuits is highly complex. We may experience manufacturing problems in achieving acceptable yields or experience product delivery delays in the future as a result of, among other things, capacity constraints, equipment malfunctioning, construction delays, upgrading or expanding existing facilities or changing our process technologies, any of which could result in a loss of future revenues or increases in fixed costs. To the extent we do not achieve acceptable manufacturing yields or there are delays in wafer fabrication, our results of operations could be adversely affected. In addition, operating expenses related to increases in production capacity may adversely affect our operating results if revenues do not increase proportionately.
Our dependence on third party foundries and other manufacturing subcontractors may cause delays beyond our control in delivering our products to our customers.
A portion of our wafers (approximately 5% to 15%) are processed offshore by independent assembly subcontractors located in
Malaysia and Thailand. These subcontractors separate wafers into individual circuits and assemble them into various finished package types. During periods of increasing demand and volatile lead times, sub-contractors can become over committed and therefore unable to meet all of their customer demand requirements thereby causing inconsistencies in availability of supply. In addition, reliability problems experienced by our assemblers could cause problems in delivery and quality, resulting in potential product liability to us. We could also be adversely affected by political disorders, labor disruptions, and natural disasters in these locations.
We are dependent on outside silicon foundries for a small portion (less than 5%) of our wafer fabrication. As a result, we
cannot directly control delivery schedules for these products, which could lead to product shortages, quality assurance problems and increases in the cost of our products. We may experience delays in delivering our products to our customers. If these foundries are unable or unwilling to produce adequate supplies of processed wafers conforming to our quality standards, our business and relationships with our customers for the limited quantities of products produced by these foundries could be adversely affected. Finding alternate sources of supply or initiating internal wafer processing for these products may not be economically feasible. In addition, the manufacture of our products is a highly complex and precise process, requiring production in a highly controlled environment. Changes in manufacturing processes or the inadvertent use of defective or contaminated materials by a third party foundry could adversely affect the foundry’s ability to achieve acceptable manufacturing yields and product reliability. We rely on third party vendors for materials, supplies, critical manufacturing equipment and freight services that may not have adequate capacity or may be impacted by outside influences such as natural disasters that could impact our product delivery requirements.
14
The semiconductor industry has experienced a very large expansion of fabrication capacity and production worldwide over time. As a result of increasing demand from semiconductor and other manufacturers, availability of certain basic materials and supplies, such as chemicals, gases, polysilicon, silicon wafers, ultra-pure metals, lead frames and molding compounds, and of subcontract services, like epitaxial growth, ion implantation and assembly of integrated circuits into packages, have from time to time, over the past several years, been in short supply and could come into short supply again if overall industry demand continues to increase in the future. In addition, from time to time natural disasters can lead to a shortage of some of the above materials due to disruption of the manufacturer’s production. We do not have long-term agreements providing for all of these equipment, materials, supplies, and services, and shortages could occur as a result of capacity limitations or production constraints on suppliers that could have a materially adverse effect on our ability to achieve our planned production.
A number of our products use components that are purchased from third parties. Supplies of these components may not be
sufficient to meet all customer requested delivery dates for products containing the components, which could adversely affect future sales and earnings. Additionally, significant fluctuations in the purchase price for these components could affect gross margins for the products involved. Suppliers could also discontinue the manufacture of such purchased products or could have quality problems that could affect our ability to meet customer commitments.
Our manufacturing processes rely on critical manufacturing equipment purchased from third party suppliers. During periods of
increasing demand we could experience difficulties or delays in obtaining additional critical manufacturing equipment. In addition, suppliers of semiconductor manufacturing equipment are sometimes unable to deliver test and/or fabrication equipment to a schedule or equipment performance specification that meets our requirements. Delays in delivery of equipment needed for growth could adversely affect our ability to achieve our manufacturing and revenue plans in the future.
We rely on third parties including freight forwarders, airlines, and ground transportation companies to deliver our products to
customers. Interruptions in the ability of these third parties to deliver our products to customers due to geological events such volcanic eruptions, earthquakes, hurricanes or other such natural disasters may cause a temporary delay in meeting our shipping estimates and schedules.
We are exposed to business, economic, political and other risks through our significant worldwide operations.
During fiscal year 2010, 72% of our revenues were derived from customers in international markets. Also, the Company has
test and assembly facilities in Singapore and Malaysia. Accordingly, we are subject to the economic and political risks inherent in international sales and operations and their impact on the United States economy in general, including the risks associated with ongoing uncertainties and political and economic instability in many countries around the world as well as the economic disruption from financial and economic declines or turmoil, dysfunction in the credit markets, acts of terrorism, or the response to any of the foregoing by the United States and other major countries.
We are a party to private litigation related to our historical stock option granting practices, in which an unfavorable outcome could have a material adverse effect on our financial results for a particular period or the trading price for our securities.
Several lawsuits have been filed against current and former directors and officers relating to our historical stock option granting
practices. The Company is named as a nominal defendant in those lawsuits. These actions are in the preliminary stages, and their ultimate outcome could have a material adverse effect on our results of operations or cash flows for a particular period or the trading price for our securities. Litigation is time-consuming, expensive and disruptive to our normal business operations, and outcomes are difficult to predict. The defense of these lawsuits has resulted and will continue to result in significant legal expenditures and diversion of our management’s time and attention from business operations. In addition, we have entered into indemnification agreements with our current and former directors and officers, under which we are required to indemnify those persons against expenses, including attorneys’ fees, judgments, fines and settlements, payable by them in connection with this litigation, subject to applicable law. If we were required to pay any amounts to satisfy a judgment or in settlement of any of these claims, these amounts may not be covered by insurance.
For a further discussion on legal matters see “Legal Proceedings” in Part I, Item 3 of this Annual Report on Form 10-K.
We may be unable to adequately protect our proprietary rights, which may impact our ability to compete effectively. Our success depends in part on our proprietary technology. While we attempt to protect our proprietary technology through
patents, copyrights and trade secret protection, we believe that our success also depends on increasing our technological expertise, continuing our development of new products and providing comprehensive support and service to our customers. However, we may be unable to protect our technology in all instances, or our competitors may develop similar or more competitive technology independently. We currently hold a number of United States and foreign patents and pending patent applications. However, other parties may challenge or attempt to invalidate or circumvent any patents the United States or foreign governments issue to us or these
15
governments may fail to issue patents for pending applications. In addition, the rights granted or anticipated under any of these patents or pending patent applications may be narrower than we expect or, in fact provide no competitive advantages. Furthermore, effective patent, trademark, copyright, maskwork and trade secret protection may be unavailable, limited or not applied for in certain foreign countries. We may incur significant legal costs to protect our intellectual property.
We also seek to protect our proprietary technology, including technology that may not be patented or patentable, in part by
confidentiality agreements and, if applicable, inventors’ rights agreements with our collaborators, advisors, employees and consultants. We cannot assure you that these agreements will always be undertaken or will not be breached or that we will have adequate remedies for any breach.
We have received, and may receive in the future, notices of claims of infringement and misappropriation of other parties’
proprietary rights. In the event of an adverse decision in a patent, trademark, copyright, maskwork or trade secret action, we could be required to withdraw the product or products found to be infringing from the market or redesign products offered for sale or under development. Whether or not these infringement claims are successfully asserted, we would likely incur significant costs and diversion of our resources with respect to the defense of these claims. In the event of an adverse outcome in any litigation, we may be required to pay substantial damages, including enhanced damages for willful infringement, and incur significant attorneys’ fees, as well as indemnify customers for damages they might suffer if the products they purchase from us infringe intellectual property rights of others. We could also be required to stop our manufacture, use, sale or importation of infringing products, expend significant resources to develop or acquire non-infringing technology, discontinue the use of some processes, or obtain licenses to intellectual property rights covering products and technology that we may, or have been found to, infringe or misappropriate such intellectual property rights.
Our products may contain defects that could affect our results of operations.
Our products may contain undetected errors or defects. Such problems may cause delays in product introductions and
shipments, result in increased costs and diversion of development resources, cause us to incur increased charges due to obsolete or unusable inventory, require design modifications, or decrease market acceptance or customer satisfaction with these products, which could result in product returns. In addition, we may not find defects or failures in our products until after commencement of commercial shipments, which may result in loss or delay in market acceptance and could significantly harm our operating results. Our current or potential customers also might seek to recover from us any losses resulting from defects or failures in our products; further, such claims might be significantly higher than the revenues and profits we receive from our products involved as we are usually a component supplier with limited value content relative to the value of a complete system or sub-system. Liability claims could require us to spend significant time and money in litigation or to pay significant damages for which we may have insufficient insurance coverage. Any of these claims, whether or not successful, could seriously damage our reputation and business.
If we fail to attract and retain qualified personnel, our business may be harmed.
Our performance is substantially dependent on the performance of our executive officers and key employees. The loss of the
services of key officers, technical personnel or other key employees could harm the business. Our success depends on our ability to identify, hire, train, develop and retain highly qualified technical and managerial personnel. Failure to attract and retain the necessary technical and managerial personnel could harm us.
We may not be able to compete successfully in markets within the semiconductor industry in the future.
We compete in the high performance segment of the linear market. Our competitors include among others, Analog Devices,
Inc., Intersil, Maxim Integrated Products, Inc., National Semiconductor Corporation and Texas Instruments, Inc. Competition among manufacturers of linear integrated circuits is intense, and certain of our competitors may have significantly greater financial, technical, manufacturing and marketing resources than us. The principal elements of competition include product performance, functional value, quality and reliability, technical service and support, price, diversity of product line and delivery capabilities. We believe we compete favorably with respect to these factors, although we may be at a disadvantage in comparison to larger companies with broader product lines and greater technical service and support capabilities.
Environmental liabilities could force us to expend significant capital and incur substantial costs.
Federal, state and local regulations impose various environmental controls on the storage, use, discharge and disposal of certain
chemicals and gases used in semiconductor processing. Our facilities have been designed to comply with these regulations, and we believe that our activities conform to present environmental regulations. Increasing public attention has, however, been focused on the environmental impact of electronics manufacturing operations. While we to date have not experienced any materially adverse business effects from environmental regulations, there can be no assurance that changes in such regulations will not require us to
16
acquire costly remediation equipment or to incur substantial expenses to comply with such regulations. Any failure by us to control the storage, use or disposal of, or adequately restrict the discharge of hazardous substances could subject us to significant liabilities.
Our financial results may be adversely affected by increased tax rates and exposure to additional tax liabilities.
As a global company, our effective tax rate is highly dependent upon the geographic composition of worldwide earnings and
tax regulations governing each region. We are subject to income taxes in both the United States and various foreign jurisdictions, and significant judgment is required to determine worldwide tax liabilities. Our effective tax rate as well as the actual tax ultimately payable could be adversely affected by changes in the split of earnings between countries with differing statutory tax rates, in the valuation of deferred tax assets, in tax laws or by material audit assessments, which could affect our profitability. In addition, the amount of income taxes we pay is subject to ongoing audits in various jurisdictions, and a material assessment by a governing tax authority could affect our profitability. Finally, jurisdictions could change their tax regulations to include profits that were previously exempt.
We are leveraged, and our debt obligations may affect our business, operating results and financial condition.
As of June 27, 2010, we have debt outstanding of $845.1 million aggregate principal amount of our 3.00% Convertible
Senior Notes due May 1, 2027 (the “2027A notes”) and $395.8 million aggregate principal amount of our 3.125% Convertible Senior Notes due May 1, 2027 (the “2027B notes” and collectively with the 2027A notes, the “Notes”). Debt service obligations arising from the Notes could adversely affect us in a number of ways, including by:
limiting our ability to obtain in the future, if needed, financing for working capital, capital expenditures, debt service requirements or other corporate purposes;
limiting our flexibility in implementing our business strategy and in planning for, or reacting to, changes in our business;
placing us at a competitive disadvantage relative to any of our competitors who have lower levels of debt;
decreasing our debt ratings and increasing our cost of borrowed funds;
making us more vulnerable to a downturn in our business or the economy generally;
subjecting us to the risk of being forced to refinance at higher interest rates these amounts when due; and
requiring us to use a substantial portion of our cash to pay principal and interest on our debt instead of contributing those funds to other purposes such as working capital, capital expenditures or other corporate purposes.
Our stock price may be volatile.
The trading price of our common stock may be subject to wide fluctuations. Our stock price may fluctuate in response to a
number of events and factors, such as general United States and world economic and financial conditions, our own quarterly variations in operating results, announcements of technological innovations or new products by us or our competitors, changes in financial estimates and recommendations by securities analysts, the operating and stock price performance of other companies that investors may deem comparable to us, the hedging of our common stock and other derivative transactions by third parties, and new reports relating to trends in our markets or those of our customers. Additionally, lack of positive performance in our stock price may adversely affect our ability to retain key employees.
The stock market in general, and prices for companies in our industry in particular, has experienced extreme volatility that often has been unrelated to the operating performance of a particular company. These broad market and industry fluctuations may adversely affect the price of our common stock, regardless of our operating performance. As our Notes are convertible into shares of our common stock, volatility or depressed prices of our common stock could have a similar effect on the trading price of our Notes. In addition, to the extent we deliver common stock on conversion of the Notes, the ownership interests of our existing stockholders may be diluted. Sales in the public market of common stock issuable upon such conversion could adversely affect prevailing market prices of our common stock, as could the anticipated conversion of the Notes. We may not have the ability to repurchase the Notes or to pay cash upon their conversion if and as required by the indentures governing the Notes.
17
Holders of the Notes have the right to require us to repurchase the Notes for cash on specified dates or upon the occurrence of a fundamental change. The first of these dates is November 1, 2010, at which time we intend to repurchase all of the outstanding $395.8 million principal amount (less any amounts repurchased by us in the open market prior to such time) of our 2027B Notes. We have the ability to repurchase the $395.8 million principal amount of the 2027B Notes on this date.
The $845.1 million principal amount of our 2027A Notes can be redeemed by us at any time on or after May 1, 2014. We
presently intend to repurchase the 2027A Notes on May 1, 2014, however, we may not have sufficient funds to repurchase the 2027A Notes in cash or have the ability to arrange necessary financing on acceptable terms. In addition, upon conversion of the 2027A Notes we will be required to make cash payments to the holders of the 2027A Notes equal to the lesser of the principal amount of the 2027A Notes being converted and the conversion value of those 2027A Notes. Such payments could be significant, and we may not have sufficient funds to make them at such time. Moreover, even if we do have sufficient funds to repurchase the 2027A Notes and make any additional required payments, doing so could reduce our working capital below levels that we believe are necessary or appropriate for the ongoing operation of our business. In such case, we might be forced to raise additional financing at the time of the repurchase or thereafter until cash generated from operations can restore working capital to the desired level.
Our failure to repurchase the Notes or convert the Notes into cash or a combination of cash and shares upon exercise of a
holder’s conversion right in accordance with the provisions of the indentures would constitute a default under the applicable indenture. In addition, a default under either indenture could lead to a default under existing and future agreements governing our indebtedness. If, due to a default, the repayment of the related indebtedness were to be accelerated after any applicable notice or grace periods, we may not have sufficient funds to repay such indebtedness and the Notes.
A fundamental change may also constitute an event of default under, or result in the acceleration of the maturity of, our then-
existing indebtedness. In addition, our ability to repurchase the Notes in cash or make any other required payments may be limited by law or the terms of other agreements relating to our indebtedness outstanding at the time.
The risks referred to above primarily relate to the 2027A Notes whose $845.1 million principal amount can be redeemed by
the Company at any time on or after May 1, 2014, or upon a fundamental change. The terms of the Notes and related provisions in the indentures subject noteholders to risks. Noteholders should be aware of the following risks, in addition to those described for holders of our common stock:
We are not restricted from taking actions or incurring additional debt (including secured debt) which may affect our ability to make payments under the Notes,
The Notes are not secured by any of our assets or those of our subsidiaries and are effectively subordinated to any secured debt we may incur. In any liquidation, dissolution, bankruptcy or other similar proceeding, holders of our secured debt may assert rights against any assets securing such debt in order to receive full payment of their debt before those assets may be used to pay the holders of the Notes. In such an event, we may not have sufficient assets remaining to pay amounts due on any or all of the Notes. In addition, none of our subsidiaries have guaranteed our obligations under, or have any obligation to pay any amounts due on, the Notes. As a result, the Notes are effectively subordinated to all liabilities of our subsidiaries, including trade payables,
The fundamental change provisions in the Notes and the indentures may not require us to offer to repurchase the Notes in the event of certain transactions. For example, any leveraged recapitalization, refinancing, restructuring, or acquisition initiated by us will generally not constitute a fundamental change requiring us to repurchase the Notes;
The liquidity of the trading market in the Notes, and the market price quoted for these Notes, may be adversely affected by, among other things, changes in, or other factors affecting, the market prices of our common stock, changes in the overall market for debt securities, and prevailing interest rates,
The conversion rates of the Notes may not adjust for certain events, such as a third-party tender or exchange offer or an issuance of our common stock for cash. In addition, adjustments in conversion rates may not adequately compensate noteholders for any lost value in the Notes as a result of a particular transaction,
The sale of the Notes and the shares of common stock issuable upon conversion of the Notes depends upon the continued maintenance of a registration statement filed with the SEC covering the resale of the Notes, or an exemption from the registration requirements of the Securities Act and any applicable state securities laws; and,
18
Noteholders are not entitled to any rights as holders of our common stock although, given that the Notes are convertible into shares of our common stock, they may be affected by any change relating to the common stock.
Our certificate of incorporation and by-laws include anti-takeover provisions that may enable our management to resist an unwelcome takeover attempt by a third party.
Our organizational documents and Delaware law contain provisions that might discourage, delay or prevent a change in
control of our company or a change in our management. Our Board of Directors may also choose to adopt further anti-takeover measures without stockholder approval. The existence and adoption of these provisions could adversely affect the voting power of holders of common stock and limit the price that investors might be willing to pay in the future for shares of our common stock. ITEM 1B. UNRESOLVED STAFF COMMMENTS None ITEM 2. PROPERTIES
At June 27, 2010, the Company owned the major facilities described below: No. of Bldgs
Location
Total Sq. Ft
Use
6 Milpitas, California 430,000 Executive and administrative offices, wafer fabrication,
test and assembly operations, research and development, sales and marketing, and warehousing and distribution
1 Camas, Washington 105,000 Wafer fabrication 1 Chelmsford, Massachusetts 30,000 Research and development; sales and administration 1 Colorado Springs, Colorado 20,000 Research and development 1 Auburn, New Hampshire 20,000 Research and development 2 Singapore (A) 260,000 Test and packaging operations, warehousing and
distribution, research and development, and sales and administration
1 Malaysia (B) 220,000 Assembly operations, research and development (A) Leases on the land used for this facility expire in 2021 through 2022 with an option to extend the lease for an additional 30 years. (B) Leases on the land used for this facility expire in 2054 through 2057.
The Company leases design facilities located in: Raleigh, North Carolina; Burlington, Vermont; Santa Barbara, California;
Grass Valley, California; Phoenix, Arizona, and Dallas, Texas. The Company leases sales offices in the United States in the areas of San Jose, Sacramento, Seattle, Denver, Philadelphia, Raleigh, Chicago, Detroit, Austin, Houston, Los Angeles, Irvine, San Diego, Minneapolis, Cleveland; and internationally in London, Stockholm, Helsinki, Ascheberg, Munich, Stuttgart, Paris, Milan, Tokyo, Nagoya, Osaka, Taipei, Singapore, Seoul, Hong Kong, Bejing, Shanghai and Shenzhen. See Note 11 of Notes to Consolidated Financial Statements contained in this Annual Report on Form 10-K. The Company believes that its existing facilities are suitable and adequate for its business purposes through fiscal year 2011.
ITEM 3. LEGAL PROCEEDINGS
The Company is subject to various legal proceedings and claims that arise in the ordinary course of business on a wide range of matters, including, among others, patent suits and employment claims. The Company does not believe that any such current suits will have a material impact on its business or financial condition. However, current lawsuits and any future lawsuits will divert resources and could result in the payment of substantial damages.
Certain current and former directors and officers of the Company have been named as defendants in two consolidated
shareholder derivative actions filed in the United States District Court for the Northern District of California and captioned In re Linear Technology Corporation Shareholder Derivative Litigation (the “Federal Action”), in three consolidated shareholder derivative actions filed in the Superior Court for Santa Clara County, California, also captioned In re Linear Technology Corporation Shareholder Derivative Litigation (the “California State Action”), and in a shareholder derivative action filed in Delaware Chancery Court, captioned Weiss v. Swanson (the “Delaware Action”). The Company has been named in each of these Actions as a nominal defendant against which no recovery is sought.
19
In the Federal Action, the plaintiffs alleged that the individual defendants breached their fiduciary duties by allegedly
backdating stock option grants between 1995 and 2002, and asserted derivative claims against them based on alleged violations of Section 10(b) of the Securities Exchange Act of 1934 (“Exchange Act”) and Rule 10b-5 thereunder. On December 7, 2006, the Court granted Linear’s motion to dismiss the complaint for failure to make a pre-suit demand or to demonstrate that a demand would have been futile. The plaintiffs filed an amended complaint on January 5, 2007 asserting derivative claims against the individual defendants for alleged violations of Sections 10(b), 14(a), and 20(a) of the Exchange Act, and Rules 10b-5 and 14a-9. Pursuant to stipulation, on February 14, 2007, the District Court stayed the Federal Action.
In the California State Action, plaintiffs initially asserted claims against the individual defendants for breaching their, and
aiding and abetting breaches of others’, fiduciary duty in connection with the alleged backdating of stock option grants between 1995 and 2002. The plaintiffs also alleged that certain defendants were unjustly enriched, that defendants wasted corporate assets, and that the officers violated California insider trading laws. The plaintiffs sought unspecified money damages, disgorgement of profits and benefits, restitution, rescission of option contracts, imposition of a constructive trust over option contracts, and attorneys’ fees and costs. On July 13, 2007, the Court sustained the Company’s demurrer, and granted plaintiffs leave to amend the complaint. The Court did not address the individual defendants’ demurrer.
On August 13, 2007, the California plaintiffs filed an amended complaint, asserting claims against the individual defendants
for breaching, and aiding and abetting breaches of fiduciary duty in connection with the grant of allegedly “spring-loaded” and “bullet-dodged” stock options between 1995 and 2005. The amended complaint also alleged that individual defendants were unjustly enriched, and violated California insider trading laws, and that the director defendants wasted corporate assets. Plaintiffs seek unspecified damages, disgorgement of profits and benefits, restitution, rescission of option contracts, imposition of a constructive trust over executory option contracts, and attorneys’ fees and costs. On September 12, 2007, the Company and the individual defendants filed demurrers to the amended complaint. Before the demurrers were fully briefed, the parties stipulated to stay the California State Action pending the resolution of the motion to dismiss the complaint in the Delaware Action.
On May 5, 2008, the individual defendants moved to stay the California State Action; Linear joined in that motion. That
same day, plaintiffs moved to coordinate discovery in the California State Action and the Delaware Action. The individual defendants opposed that motion and Linear joined in their opposition. In a June 18, 2008 order, the Court granted the motion to stay the California State Action, and rejected, in part, the plaintiffs’ request to coordinate discovery. The Court ordered the defendants to supply the California plaintiffs with copies of documents produced and transcripts of depositions conducted in the Delaware Action. Subsequently, on December 31, 2009, the California plaintiffs filed a motion to lift the stay in the California State Action. On January 25, 2010, the individual defendants filed their opposition to this motion. On February 8, 2010, the Court issued an order denying the California plaintiffs’ motion to lift the stay. The Court is continuing to monitor the progress of the Delaware Action.
In the Delaware Action, filed on March 23, 2007, the plaintiff alleges that the defendant directors breached their duty by
granting “spring-loaded” and “bullet-dodged” stock options to certain officers and directors between 1996 and 2005. The plaintiff also asserts claims for unjust enrichment against defendants who received the option grants. The plaintiff seeks unspecified money damages, disgorgement of profits and benefits, restitution, rescission of certain defendants’ option contracts, imposition of a constructive trust over the option contracts, and attorneys’ fees and costs. The defendants moved to dismiss the Delaware Action on May 25, 2007. Rather than respond, the plaintiff filed his first amended complaint on August 10, 2007, making substantially the same allegations as those in the original complaint. On September 19, 2007, the Company and the individual defendants filed a Motion to Dismiss the first amended complaint on the grounds that the plaintiff had failed to make a pre-suit demand on the Board or to plead facts demonstrating that such a demand would have been futile, and that the first amended complaint failed to state a claim against each of the individual defendants. On March 7, 2008, the Court denied the motion. Linear answered the first amended complaint on April 7, 2008.
On January 25, 2010, the plaintiff in the Delaware Action filed a motion to amend the first amended complaint. The second
amended complaint was filed under seal, with a redacted copy filed publicly, on February 15, 2010. The second amended complaint adds allegations that the defendant directors breached their duty by: (1) granting additional stock options (beyond those identified in the first amended complaint) to employees that plaintiff claims were manipulated during the 1996-2005 time period; (2) granting and receiving “backdated” and/or otherwise allegedly manipulated stock options, in addition to the allegedly “spring-loaded” and “bullet-dodged” options; and (3) granting additional stock options whose exercise price did not conform to the terms of the applicable stock option plans. The defendants answered the second amended complaint on March 17, 2010.
On June 10, 2010, the officer and director defendants filed motions for summary judgment. On August 6, 2010, the parties in the Delaware Action stipulated to an extension of time to file opposition and reply briefs, and related pleadings. Opposition briefs and related pleadings are now due on August 24, 2010. Reply briefs and related pleadings are now due on September 29, 2010. Fact discovery has been completed, with the exception of the deposition of plaintiff’s employer which has not been scheduled, and expert discovery is complete. No trial date has been set.
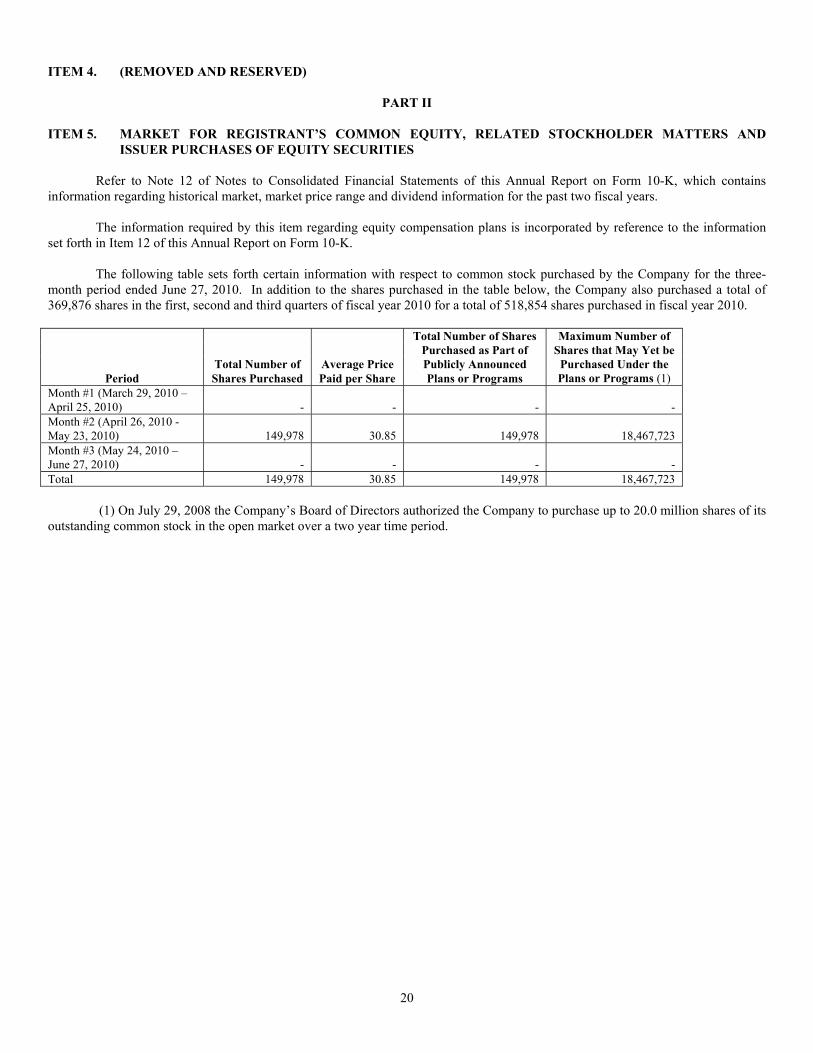
20
ITEM 4. (REMOVED AND RESERVED)
PART II
ITEM 5. MARKET FOR REGISTRANT’S COMMON EQUITY, RELATED STOCKHOLDER MATTERS AND ISSUER PURCHASES OF EQUITY SECURITIES
Refer to Note 12 of Notes to Consolidated Financial Statements of this Annual Report on Form 10-K, which contains
information regarding historical market, market price range and dividend information for the past two fiscal years.
The information required by this item regarding equity compensation plans is incorporated by reference to the information set forth in Item 12 of this Annual Report on Form 10-K.
The following table sets forth certain information with respect to common stock purchased by the Company for the three-month period ended June 27, 2010. In addition to the shares purchased in the table below, the Company also purchased a total of 369,876 shares in the first, second and third quarters of fiscal year 2010 for a total of 518,854 shares purchased in fiscal year 2010.
Total Number of Shares Maximum Number of Purchased as Part of Shares that May Yet be Total Number of Average Price Publicly Announced Purchased Under the
Period Shares Purchased Paid per Share Plans or Programs Plans or Programs (1) Month #1 (March 29, 2010 – April 25, 2010) - - - - Month #2 (April 26, 2010 - May 23, 2010) 149,978 30.85 149,978 18,467,723 Month #3 (May 24, 2010 – June 27, 2010) - - - - Total 149,978 30.85 149,978 18,467,723
(1) On July 29, 2008 the Company’s Board of Directors authorized the Company to purchase up to 20.0 million shares of its outstanding common stock in the open market over a two year time period.
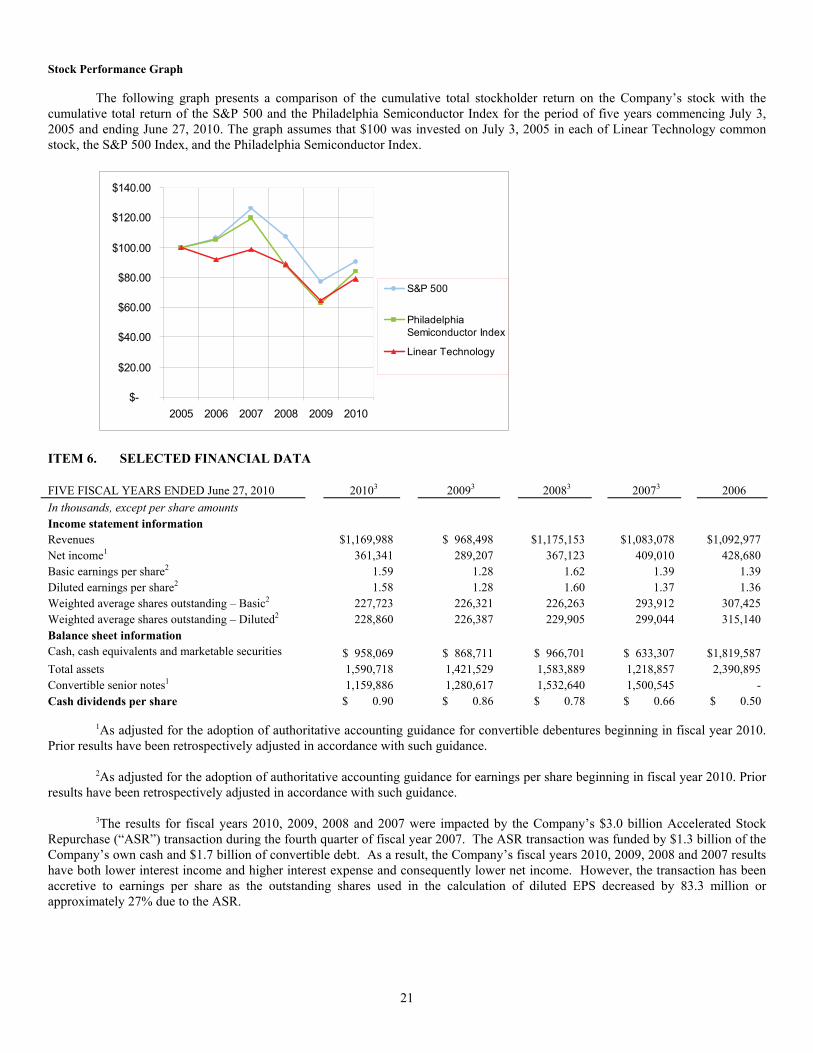
21
Stock Performance Graph
The following graph presents a comparison of the cumulative total stockholder return on the Company’s stock with the cumulative total return of the S&P 500 and the Philadelphia Semiconductor Index for the period of five years commencing July 3, 2005 and ending June 27, 2010. The graph assumes that $100 was invested on July 3, 2005 in each of Linear Technology common stock, the S&P 500 Index, and the Philadelphia Semiconductor Index.
$-
$20.00
$40.00
$60.00
$80.00
$100.00
$120.00
$140.00
2005 2006 2007 2008 2009 2010
S&P 500
PhiladelphiaSemiconductor Index
Linear Technology
ITEM 6. SELECTED FINANCIAL DATA FIVE FISCAL YEARS ENDED June 27, 2010 20103 20093 20083 20073 2006
In thousands, except per share amounts Income statement information Revenues $1,169,988 $ 968,498 $1,175,153 $1,083,078 $1,092,977 Net income1 361,341 289,207 367,123 409,010 428,680 Basic earnings per share2 1.59 1.28 1.62 1.39 1.39 Diluted earnings per share2 1.58 1.28 1.60 1.37 1.36 Weighted average shares outstanding – Basic2 227,723 226,321 226,263 293,912 307,425 Weighted average shares outstanding – Diluted2 228,860 226,387 229,905 299,044 315,140 Balance sheet information Cash, cash equivalents and marketable securities $ 958,069 $ 868,711 $ 966,701 $ 633,307 $1,819,587 Total assets 1,590,718 1,421,529 1,583,889 1,218,857 2,390,895 Convertible senior notes1 1,159,886 1,280,617 1,532,640 1,500,545 - Cash dividends per share $ 0.90 $ 0.86 $ 0.78 $ 0.66 $ 0.50
1As adjusted for the adoption of authoritative accounting guidance for convertible debentures beginning in fiscal year 2010. Prior results have been retrospectively adjusted in accordance with such guidance.
2As adjusted for the adoption of authoritative accounting guidance for earnings per share beginning in fiscal year 2010. Prior
results have been retrospectively adjusted in accordance with such guidance. 3The results for fiscal years 2010, 2009, 2008 and 2007 were impacted by the Company’s $3.0 billion Accelerated Stock
Repurchase (“ASR”) transaction during the fourth quarter of fiscal year 2007. The ASR transaction was funded by $1.3 billion of the Company’s own cash and $1.7 billion of convertible debt. As a result, the Company’s fiscal years 2010, 2009, 2008 and 2007 results have both lower interest income and higher interest expense and consequently lower net income. However, the transaction has been accretive to earnings per share as the outstanding shares used in the calculation of diluted EPS decreased by 83.3 million or approximately 27% due to the ASR.
22
ITEM 7. MANAGEMENT’S DISCUSSION AND ANALYSIS OF FINANCIAL CONDITION AND RESULTS OF
OPERATIONS Overview
Linear Technology Corporation is a manufacturer of high performance linear integrated circuits. The Company generates revenue exclusively from the sale of analog integrated circuits. The Company targets the high performance segment of the analog integrated circuit market. The Company was founded in 1981 and became a public company in 1986. Linear Technology products include high performance amplifiers, comparators, voltage references, monolithic filters, linear regulators, DC-DC converters, battery chargers, data converters, communications interface circuits, RF signal conditioning circuits, µModule products, and many other analog functions. Applications for Linear Technology’s high performance circuits include telecommunications, cellular telephones, networking products such as optical switches; notebook, tablet and desktop computers; computer peripherals, video/multimedia, industrial instrumentation, security monitoring devices, high-end consumer products such as digital cameras and global positioning systems, complex medical devices, automotive electronics, factory automation, process control, military, space and harsh environment systems.
Quarterly revenues of $366.2 million achieved during the fourth quarter of fiscal year 2010 increased $54.8 million or 18% over the third quarter of fiscal year 2010 and increased 76% or $158.2 million over $208.0 million reported in the fourth quarter of fiscal year 2009. Revenues for the fiscal year ended June 27, 2010 were $1.17 billion, an increase of $201.5 million or 21% over revenues of $968.5 million for fiscal year 2009. The Company has recovered from the global economic downturn as third and fourth quarter revenues were record revenue quarters that exceeded pre-recessionary highs. The Company showed improvements in each major geographical region and in most major end-markets. Fourth quarter operating income increased $40.4 million or 26% over the third quarter of fiscal year 2010 and increased $115.3 million or 146% over the fourth quarter of last year. Net income of $124.5 million increased $23.9 million or 24% over the third quarter of fiscal year 2010 and increased $73.1 million or 142% over the fourth quarter of fiscal year 2009. The fourth quarter of fiscal year 2010 included a non-cash loss of $10.5 million on the early retirement of debt. Fourth quarter diluted earnings per share increased $0.10 cents per share over the third quarter of fiscal year 2010 and increased $0.31 cents per share over the fourth quarter of fiscal year 2009. Critical Accounting Policies
The Company’s financial statements have been prepared in accordance with accounting principles generally accepted in the United States, which require it to make estimates and judgments that significantly affect the reported amounts of assets, liabilities, revenues and expenses and related disclosure of contingent assets and liabilities. The Company regularly evaluates these estimates, including those related to stock-based compensation, inventory valuation, revenue recognition and income taxes. These estimates are based on historical experience and on assumptions that are believed by management to be reasonable under the circumstances. Actual results may differ from these estimates, which may impact the carrying values of assets and liabilities.
The Company believes the following critical accounting policies affect the more significant judgments and estimates used in the preparation of the Company’s consolidated financial statements. Revenue Recognition
The Company recognizes revenues when the earnings process is complete, when persuasive evidence of an arrangement exists, the product has been delivered, the price is fixed and determinable and collection is reasonably assured. During fiscal years 2010 and 2009, the Company recognized approximately 15% and 16%, respectively, of net revenues from domestic distributors that are recognized under agreements which provide for certain sales price rebates and limited product return privileges. Given the uncertainties associated with the levels of pricing rebates, the ultimate sales price on domestic distributor sales transactions is not fixed or determinable until domestic distributors sell the merchandise to the end-user. At the time of shipment to domestic distributors, the Company records a trade receivable and deferred revenue at the distributor purchasing price since there is a legally enforceable obligation from the distributor to pay for the products delivered. The Company relieves inventory as title has passed to the distributor and recognizes deferred cost of sales in the same amount. “Deferred income on shipments to distributors” represents the difference between deferred revenue and deferred cost of sales and is recognized as a current liability until such time as the distributor confirms a final sale to its end customer. At June 27, 2010, the Company had approximately $41.6 million of deferred revenue and $7.9 million of deferred cost of sales recognized as $33.7 million of “Deferred income on shipments to distributors.” At June 28, 2009, the Company had approximately $34.7 million of deferred revenue and $6.2 million of deferred cost of sales recognized as $28.5 million of “Deferred income on shipments to distributors.” The Company believes that its deferred costs of revenues have limited risk of material impairment, as the Company offers stock rotation privileges to distributors (up to 3% to 5% of quarterly purchases) which enable distributors to rotate slow moving inventory. In addition, stock rotated inventory that is returned to the Company is generally resalable. The Company reviews distributor ending on-hand inventory balances, as well as orders placed on the
23
Company to ensure that distributors are not overstocking parts and are ordering to forecasted demand. To the extent the Company were to have a significant reduction in distributor price or grant significant price rebates, there could be a material impact on the ultimate revenue and gross profit recognized. The price rebates that have been remitted back to distributors have ranged from $2.2 million to $3.2 million per quarter. The Company’s sales to international distributors are made under agreements which permit limited stock return privileges but not sales price rebates. Revenue on these sales is recognized upon shipment at which time title passes. The Company has reserves to cover expected product returns. If product returns for a particular fiscal period exceed or are below expectations, the Company may determine that additional or less sales return allowances are required to properly reflect its estimated exposure for product returns. Generally, changes to sales return allowances have not had a significant impact on operating margin. Inventory Valuation
The Company values inventories at the lower of cost or market. The Company records charges to write-down inventories for unsalable, excess or obsolete raw materials, work-in-process and finished goods. Newly introduced parts are generally not valued until success in the market place has been determined by a consistent pattern of sales and backlog among other factors. The Company arrives at the estimate for newly released parts by analyzing sales and customer backlog against ending inventory on hand. The Company reviews the assumptions on a quarterly basis and makes decisions with regard to inventory valuation based on the current business climate. In addition to write-downs based on newly introduced parts, judgmental assessments are calculated for the remaining inventory based on salability, obsolescence, historical experience and current business conditions. If actual market conditions are less favorable than those projected by management, additional inventory write-downs may be required that could adversely affect operating results. If actual market conditions are more favorable, the Company may have higher gross margins when products are sold. Sales to date of such products have not had a significant impact on gross margin. Stock-Based Compensation
The Company uses the Black-Scholes valuation model to determine the fair value of its stock options at the date of grant.
The stock options’ fair value is then amortized straight-line over the vesting period, which is generally five years. The Black-Scholes valuation model requires the Company to estimate key assumptions such as expected option term, stock price volatility, dividend yields and risk free interest rates that determine the stock options fair value. Higher volatility and longer expected terms result in a proportional increase to stock-based compensation determined at the date of grant. The expected dividend rate and expected risk-free rate do not have as significant an effect on the calculation of fair value. As a result, if factors change and the Company’s estimates of volatility and expected term were to increase or decrease, the Company’s stock-based compensation expense could be materially different in the future. In addition, if deferred taxes based on the Black-Scholes valuation are greater than or less than the gain on the sale of the associated stock option, the Company’s income tax expense could increase or decrease. Income Taxes
The Company must make certain estimates and judgments in determining income tax expense for financial statement
purposes. These estimates and judgments occur in the calculation of tax credits, tax benefits and deductions and in the calculation of certain tax assets and liabilities, which arise from differences in the timing of recognition of revenue and expense for tax and financial statement purposes. Significant changes to these estimates may result in an increase or decrease to the tax provision in a subsequent period.
The calculation of the Company’s tax liabilities involves uncertainties in the application of complex tax regulations. The
Company recognizes liabilities for uncertain tax positions based on the two-step process prescribed in the authoritative accounting literature. The first step is to evaluate the tax position for recognition by determining if the weight of available evidence indicates that it is more likely than not that the position will be sustained on audit, including resolution of related appeals or litigation processes, if any. The second step requires the Company to estimate and measure the tax benefit as the largest amount that is more than 50% likely to be realized upon ultimate settlement. It is inherently difficult and subjective to estimate such amounts, as the Company has to determine the probability of various possible outcomes. The Company reevaluates these uncertain tax positions on a quarterly basis. This evaluation is based on factors including, but not limited to, changes in facts or circumstances, changes in tax law, effectively settled issues under audit, and new audit activity. Such a change in recognition or measurement would result in the recognition of a tax benefit or an additional charge to the tax provision. Refer to Note 10 of Notes to Consolidated Financial Statements of this Annual Report on Form 10-K for a discussion of current tax matters. Results of Operations
The table below presents the income statement items as a percentage of revenues and provides the percentage change of such items compared to the prior fiscal year amount.
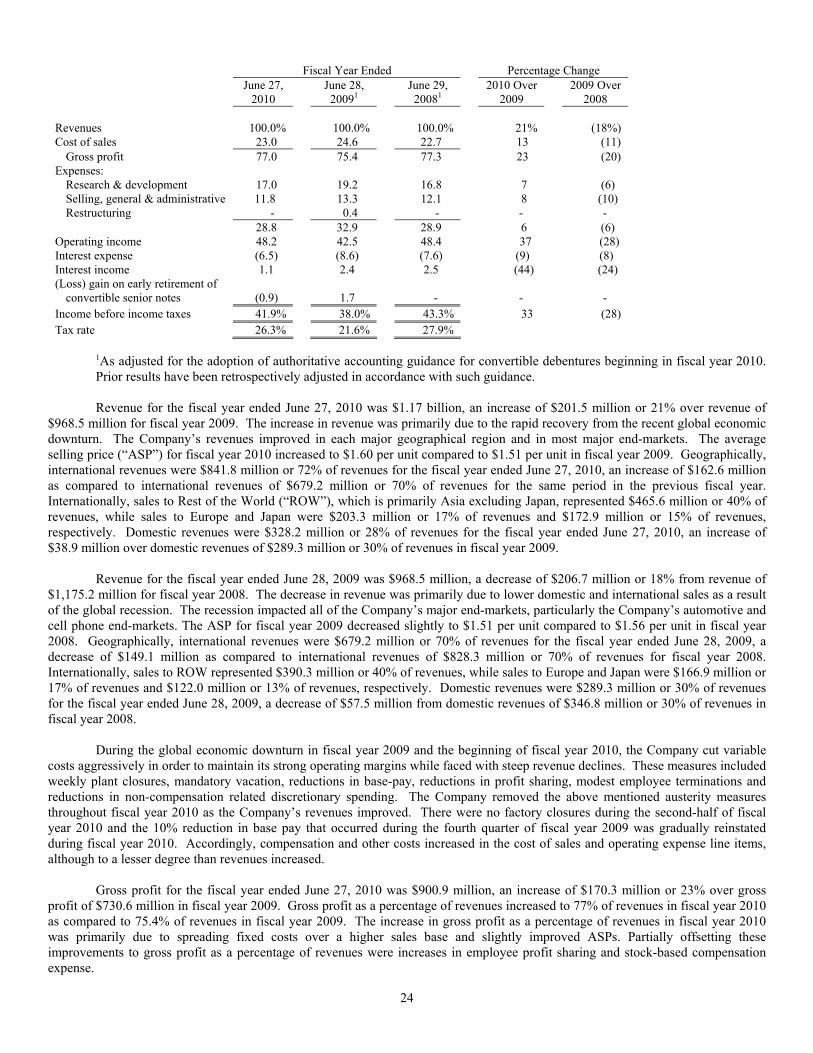
24
Fiscal Year Ended Percentage Change June 27, June 28, June 29, 2010 Over 2009 Over 2010 20091 20081 2009 2008 Revenues 100.0% 100.0% 100.0% 21% (18%) Cost of sales 23.0 24.6 22.7 13 (11)
Gross profit 77.0 75.4 77.3 23 (20) Expenses:
Research & development 17.0 19.2 16.8 7 (6) Selling, general & administrative 11.8 13.3 12.1 8 (10) Restructuring - 0.4 - - -
28.8 32.9 28.9 6 (6) Operating income 48.2 42.5 48.4 37 (28) Interest expense (6.5) (8.6) (7.6) (9) (8) Interest income 1.1 2.4 2.5 (44) (24) (Loss) gain on early retirement of
convertible senior notes (0.9) 1.7 - - - Income before income taxes 41.9% 38.0% 43.3% 33 (28) Tax rate 26.3% 21.6% 27.9%
1As adjusted for the adoption of authoritative accounting guidance for convertible debentures beginning in fiscal year 2010. Prior results have been retrospectively adjusted in accordance with such guidance. Revenue for the fiscal year ended June 27, 2010 was $1.17 billion, an increase of $201.5 million or 21% over revenue of
$968.5 million for fiscal year 2009. The increase in revenue was primarily due to the rapid recovery from the recent global economic downturn. The Company’s revenues improved in each major geographical region and in most major end-markets. The average selling price (“ASP”) for fiscal year 2010 increased to $1.60 per unit compared to $1.51 per unit in fiscal year 2009. Geographically, international revenues were $841.8 million or 72% of revenues for the fiscal year ended June 27, 2010, an increase of $162.6 million as compared to international revenues of $679.2 million or 70% of revenues for the same period in the previous fiscal year. Internationally, sales to Rest of the World (“ROW”), which is primarily Asia excluding Japan, represented $465.6 million or 40% of revenues, while sales to Europe and Japan were $203.3 million or 17% of revenues and $172.9 million or 15% of revenues, respectively. Domestic revenues were $328.2 million or 28% of revenues for the fiscal year ended June 27, 2010, an increase of $38.9 million over domestic revenues of $289.3 million or 30% of revenues in fiscal year 2009.
Revenue for the fiscal year ended June 28, 2009 was $968.5 million, a decrease of $206.7 million or 18% from revenue of
$1,175.2 million for fiscal year 2008. The decrease in revenue was primarily due to lower domestic and international sales as a result of the global recession. The recession impacted all of the Company’s major end-markets, particularly the Company’s automotive and cell phone end-markets. The ASP for fiscal year 2009 decreased slightly to $1.51 per unit compared to $1.56 per unit in fiscal year 2008. Geographically, international revenues were $679.2 million or 70% of revenues for the fiscal year ended June 28, 2009, a decrease of $149.1 million as compared to international revenues of $828.3 million or 70% of revenues for fiscal year 2008. Internationally, sales to ROW represented $390.3 million or 40% of revenues, while sales to Europe and Japan were $166.9 million or 17% of revenues and $122.0 million or 13% of revenues, respectively. Domestic revenues were $289.3 million or 30% of revenues for the fiscal year ended June 28, 2009, a decrease of $57.5 million from domestic revenues of $346.8 million or 30% of revenues in fiscal year 2008.
During the global economic downturn in fiscal year 2009 and the beginning of fiscal year 2010, the Company cut variable
costs aggressively in order to maintain its strong operating margins while faced with steep revenue declines. These measures included weekly plant closures, mandatory vacation, reductions in base-pay, reductions in profit sharing, modest employee terminations and reductions in non-compensation related discretionary spending. The Company removed the above mentioned austerity measures throughout fiscal year 2010 as the Company’s revenues improved. There were no factory closures during the second-half of fiscal year 2010 and the 10% reduction in base pay that occurred during the fourth quarter of fiscal year 2009 was gradually reinstated during fiscal year 2010. Accordingly, compensation and other costs increased in the cost of sales and operating expense line items, although to a lesser degree than revenues increased.
Gross profit for the fiscal year ended June 27, 2010 was $900.9 million, an increase of $170.3 million or 23% over gross
profit of $730.6 million in fiscal year 2009. Gross profit as a percentage of revenues increased to 77% of revenues in fiscal year 2010 as compared to 75.4% of revenues in fiscal year 2009. The increase in gross profit as a percentage of revenues in fiscal year 2010 was primarily due to spreading fixed costs over a higher sales base and slightly improved ASPs. Partially offsetting these improvements to gross profit as a percentage of revenues were increases in employee profit sharing and stock-based compensation expense.
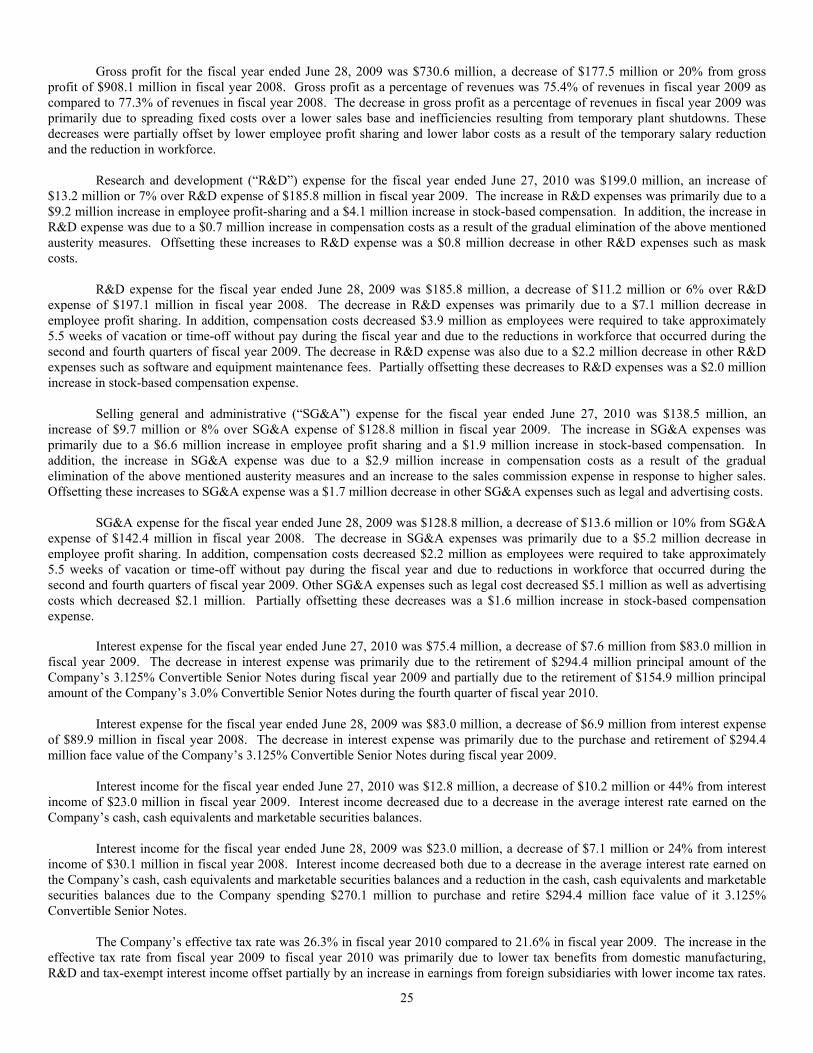
25
Gross profit for the fiscal year ended June 28, 2009 was $730.6 million, a decrease of $177.5 million or 20% from gross
profit of $908.1 million in fiscal year 2008. Gross profit as a percentage of revenues was 75.4% of revenues in fiscal year 2009 as compared to 77.3% of revenues in fiscal year 2008. The decrease in gross profit as a percentage of revenues in fiscal year 2009 was primarily due to spreading fixed costs over a lower sales base and inefficiencies resulting from temporary plant shutdowns. These decreases were partially offset by lower employee profit sharing and lower labor costs as a result of the temporary salary reduction and the reduction in workforce.
Research and development (“R&D”) expense for the fiscal year ended June 27, 2010 was $199.0 million, an increase of
$13.2 million or 7% over R&D expense of $185.8 million in fiscal year 2009. The increase in R&D expenses was primarily due to a $9.2 million increase in employee profit-sharing and a $4.1 million increase in stock-based compensation. In addition, the increase in R&D expense was due to a $0.7 million increase in compensation costs as a result of the gradual elimination of the above mentioned austerity measures. Offsetting these increases to R&D expense was a $0.8 million decrease in other R&D expenses such as mask costs.
R&D expense for the fiscal year ended June 28, 2009 was $185.8 million, a decrease of $11.2 million or 6% over R&D
expense of $197.1 million in fiscal year 2008. The decrease in R&D expenses was primarily due to a $7.1 million decrease in employee profit sharing. In addition, compensation costs decreased $3.9 million as employees were required to take approximately 5.5 weeks of vacation or time-off without pay during the fiscal year and due to the reductions in workforce that occurred during the second and fourth quarters of fiscal year 2009. The decrease in R&D expense was also due to a $2.2 million decrease in other R&D expenses such as software and equipment maintenance fees. Partially offsetting these decreases to R&D expenses was a $2.0 million increase in stock-based compensation expense.
Selling general and administrative (“SG&A”) expense for the fiscal year ended June 27, 2010 was $138.5 million, an
increase of $9.7 million or 8% over SG&A expense of $128.8 million in fiscal year 2009. The increase in SG&A expenses was primarily due to a $6.6 million increase in employee profit sharing and a $1.9 million increase in stock-based compensation. In addition, the increase in SG&A expense was due to a $2.9 million increase in compensation costs as a result of the gradual elimination of the above mentioned austerity measures and an increase to the sales commission expense in response to higher sales. Offsetting these increases to SG&A expense was a $1.7 million decrease in other SG&A expenses such as legal and advertising costs.
SG&A expense for the fiscal year ended June 28, 2009 was $128.8 million, a decrease of $13.6 million or 10% from SG&A
expense of $142.4 million in fiscal year 2008. The decrease in SG&A expenses was primarily due to a $5.2 million decrease in employee profit sharing. In addition, compensation costs decreased $2.2 million as employees were required to take approximately 5.5 weeks of vacation or time-off without pay during the fiscal year and due to reductions in workforce that occurred during the second and fourth quarters of fiscal year 2009. Other SG&A expenses such as legal cost decreased $5.1 million as well as advertising costs which decreased $2.1 million. Partially offsetting these decreases was a $1.6 million increase in stock-based compensation expense.
Interest expense for the fiscal year ended June 27, 2010 was $75.4 million, a decrease of $7.6 million from $83.0 million in
fiscal year 2009. The decrease in interest expense was primarily due to the retirement of $294.4 million principal amount of the Company’s 3.125% Convertible Senior Notes during fiscal year 2009 and partially due to the retirement of $154.9 million principal amount of the Company’s 3.0% Convertible Senior Notes during the fourth quarter of fiscal year 2010.
Interest expense for the fiscal year ended June 28, 2009 was $83.0 million, a decrease of $6.9 million from interest expense
of $89.9 million in fiscal year 2008. The decrease in interest expense was primarily due to the purchase and retirement of $294.4 million face value of the Company’s 3.125% Convertible Senior Notes during fiscal year 2009.
Interest income for the fiscal year ended June 27, 2010 was $12.8 million, a decrease of $10.2 million or 44% from interest
income of $23.0 million in fiscal year 2009. Interest income decreased due to a decrease in the average interest rate earned on the Company’s cash, cash equivalents and marketable securities balances.
Interest income for the fiscal year ended June 28, 2009 was $23.0 million, a decrease of $7.1 million or 24% from interest
income of $30.1 million in fiscal year 2008. Interest income decreased both due to a decrease in the average interest rate earned on the Company’s cash, cash equivalents and marketable securities balances and a reduction in the cash, cash equivalents and marketable securities balances due to the Company spending $270.1 million to purchase and retire $294.4 million face value of it 3.125% Convertible Senior Notes.
The Company’s effective tax rate was 26.3% in fiscal year 2010 compared to 21.6% in fiscal year 2009. The increase in the effective tax rate from fiscal year 2009 to fiscal year 2010 was primarily due to lower tax benefits from domestic manufacturing, R&D and tax-exempt interest income offset partially by an increase in earnings from foreign subsidiaries with lower income tax rates.
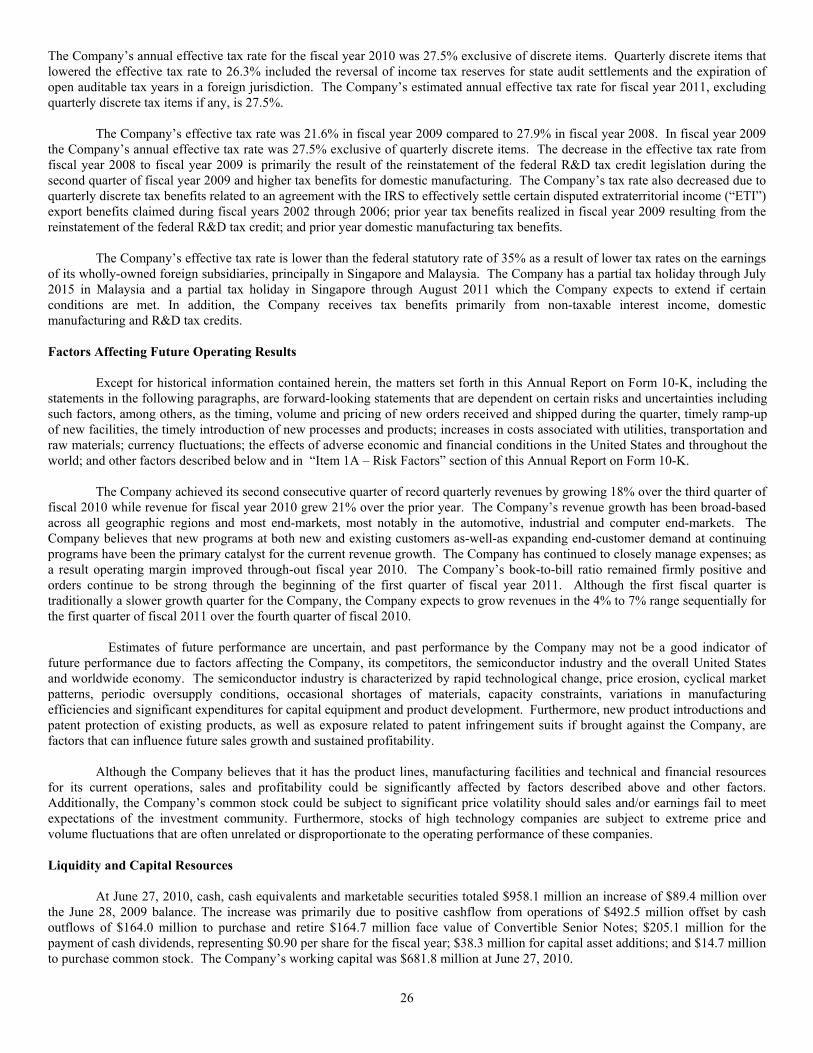
26
The Company’s annual effective tax rate for the fiscal year 2010 was 27.5% exclusive of discrete items. Quarterly discrete items that lowered the effective tax rate to 26.3% included the reversal of income tax reserves for state audit settlements and the expiration of open auditable tax years in a foreign jurisdiction. The Company’s estimated annual effective tax rate for fiscal year 2011, excluding quarterly discrete tax items if any, is 27.5%.
The Company’s effective tax rate was 21.6% in fiscal year 2009 compared to 27.9% in fiscal year 2008. In fiscal year 2009
the Company’s annual effective tax rate was 27.5% exclusive of quarterly discrete items. The decrease in the effective tax rate from fiscal year 2008 to fiscal year 2009 is primarily the result of the reinstatement of the federal R&D tax credit legislation during the second quarter of fiscal year 2009 and higher tax benefits for domestic manufacturing. The Company’s tax rate also decreased due to quarterly discrete tax benefits related to an agreement with the IRS to effectively settle certain disputed extraterritorial income (“ETI”) export benefits claimed during fiscal years 2002 through 2006; prior year tax benefits realized in fiscal year 2009 resulting from the reinstatement of the federal R&D tax credit; and prior year domestic manufacturing tax benefits.
The Company’s effective tax rate is lower than the federal statutory rate of 35% as a result of lower tax rates on the earnings
of its wholly-owned foreign subsidiaries, principally in Singapore and Malaysia. The Company has a partial tax holiday through July 2015 in Malaysia and a partial tax holiday in Singapore through August 2011 which the Company expects to extend if certain conditions are met. In addition, the Company receives tax benefits primarily from non-taxable interest income, domestic manufacturing and R&D tax credits.
Factors Affecting Future Operating Results
Except for historical information contained herein, the matters set forth in this Annual Report on Form 10-K, including the
statements in the following paragraphs, are forward-looking statements that are dependent on certain risks and uncertainties including such factors, among others, as the timing, volume and pricing of new orders received and shipped during the quarter, timely ramp-up of new facilities, the timely introduction of new processes and products; increases in costs associated with utilities, transportation and raw materials; currency fluctuations; the effects of adverse economic and financial conditions in the United States and throughout the world; and other factors described below and in “Item 1A – Risk Factors” section of this Annual Report on Form 10-K.
The Company achieved its second consecutive quarter of record quarterly revenues by growing 18% over the third quarter of fiscal 2010 while revenue for fiscal year 2010 grew 21% over the prior year. The Company’s revenue growth has been broad-based across all geographic regions and most end-markets, most notably in the automotive, industrial and computer end-markets. The Company believes that new programs at both new and existing customers as-well-as expanding end-customer demand at continuing programs have been the primary catalyst for the current revenue growth. The Company has continued to closely manage expenses; as a result operating margin improved through-out fiscal year 2010. The Company’s book-to-bill ratio remained firmly positive and orders continue to be strong through the beginning of the first quarter of fiscal year 2011. Although the first fiscal quarter is traditionally a slower growth quarter for the Company, the Company expects to grow revenues in the 4% to 7% range sequentially for the first quarter of fiscal 2011 over the fourth quarter of fiscal 2010.
Estimates of future performance are uncertain, and past performance by the Company may not be a good indicator of
future performance due to factors affecting the Company, its competitors, the semiconductor industry and the overall United States and worldwide economy. The semiconductor industry is characterized by rapid technological change, price erosion, cyclical market patterns, periodic oversupply conditions, occasional shortages of materials, capacity constraints, variations in manufacturing efficiencies and significant expenditures for capital equipment and product development. Furthermore, new product introductions and patent protection of existing products, as well as exposure related to patent infringement suits if brought against the Company, are factors that can influence future sales growth and sustained profitability.
Although the Company believes that it has the product lines, manufacturing facilities and technical and financial resources
for its current operations, sales and profitability could be significantly affected by factors described above and other factors. Additionally, the Company’s common stock could be subject to significant price volatility should sales and/or earnings fail to meet expectations of the investment community. Furthermore, stocks of high technology companies are subject to extreme price and volume fluctuations that are often unrelated or disproportionate to the operating performance of these companies. Liquidity and Capital Resources
At June 27, 2010, cash, cash equivalents and marketable securities totaled $958.1 million an increase of $89.4 million over the June 28, 2009 balance. The increase was primarily due to positive cashflow from operations of $492.5 million offset by cash outflows of $164.0 million to purchase and retire $164.7 million face value of Convertible Senior Notes; $205.1 million for the payment of cash dividends, representing $0.90 per share for the fiscal year; $38.3 million for capital asset additions; and $14.7 million to purchase common stock. The Company’s working capital was $681.8 million at June 27, 2010.
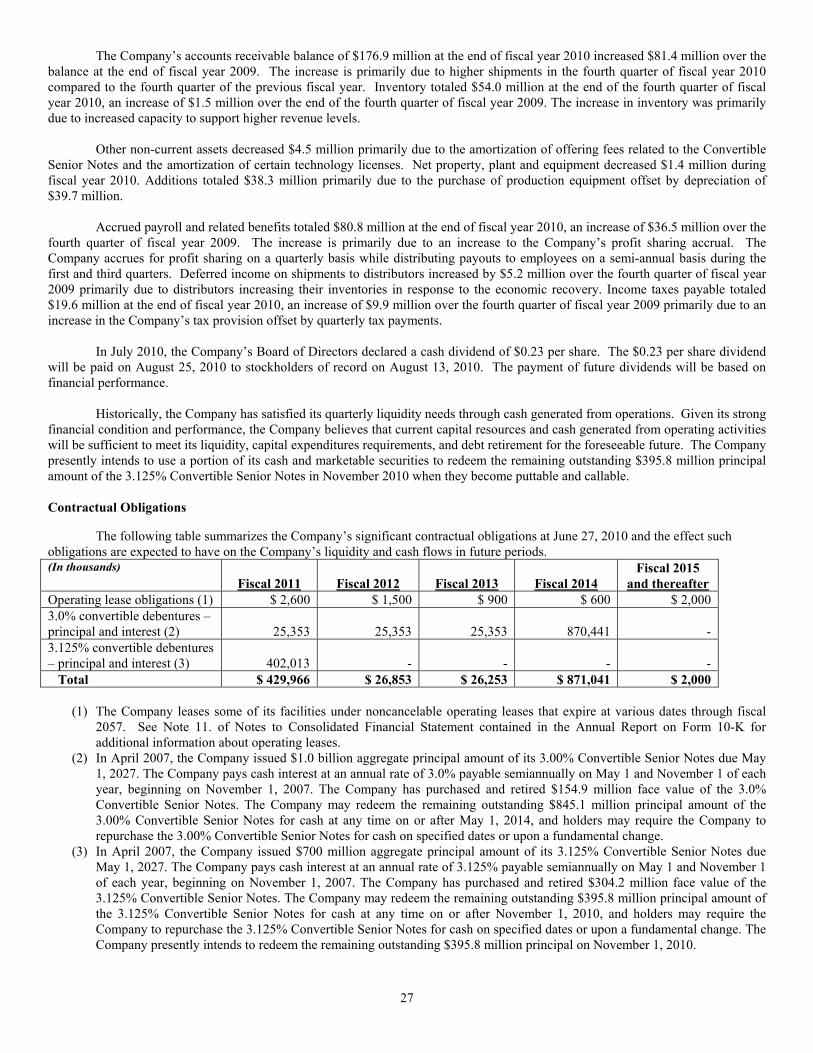
27
The Company’s accounts receivable balance of $176.9 million at the end of fiscal year 2010 increased $81.4 million over the balance at the end of fiscal year 2009. The increase is primarily due to higher shipments in the fourth quarter of fiscal year 2010 compared to the fourth quarter of the previous fiscal year. Inventory totaled $54.0 million at the end of the fourth quarter of fiscal year 2010, an increase of $1.5 million over the end of the fourth quarter of fiscal year 2009. The increase in inventory was primarily due to increased capacity to support higher revenue levels.
Other non-current assets decreased $4.5 million primarily due to the amortization of offering fees related to the Convertible
Senior Notes and the amortization of certain technology licenses. Net property, plant and equipment decreased $1.4 million during fiscal year 2010. Additions totaled $38.3 million primarily due to the purchase of production equipment offset by depreciation of $39.7 million.
Accrued payroll and related benefits totaled $80.8 million at the end of fiscal year 2010, an increase of $36.5 million over the
fourth quarter of fiscal year 2009. The increase is primarily due to an increase to the Company’s profit sharing accrual. The Company accrues for profit sharing on a quarterly basis while distributing payouts to employees on a semi-annual basis during the first and third quarters. Deferred income on shipments to distributors increased by $5.2 million over the fourth quarter of fiscal year 2009 primarily due to distributors increasing their inventories in response to the economic recovery. Income taxes payable totaled $19.6 million at the end of fiscal year 2010, an increase of $9.9 million over the fourth quarter of fiscal year 2009 primarily due to an increase in the Company’s tax provision offset by quarterly tax payments.
In July 2010, the Company’s Board of Directors declared a cash dividend of $0.23 per share. The $0.23 per share dividend
will be paid on August 25, 2010 to stockholders of record on August 13, 2010. The payment of future dividends will be based on financial performance.
Historically, the Company has satisfied its quarterly liquidity needs through cash generated from operations. Given its strong
financial condition and performance, the Company believes that current capital resources and cash generated from operating activities will be sufficient to meet its liquidity, capital expenditures requirements, and debt retirement for the foreseeable future. The Company presently intends to use a portion of its cash and marketable securities to redeem the remaining outstanding $395.8 million principal amount of the 3.125% Convertible Senior Notes in November 2010 when they become puttable and callable. Contractual Obligations
The following table summarizes the Company’s significant contractual obligations at June 27, 2010 and the effect such obligations are expected to have on the Company’s liquidity and cash flows in future periods. (In thousands)
Fiscal 2011
Fiscal 2012
Fiscal 2013
Fiscal 2014 Fiscal 2015
and thereafter Operating lease obligations (1) $ 2,600 $ 1,500 $ 900 $ 600 $ 2,000 3.0% convertible debentures – principal and interest (2)
25,353
25,353
25,353
870,441
-
3.125% convertible debentures – principal and interest (3)
402,013
-
-
-
-
Total $ 429,966 $ 26,853 $ 26,253 $ 871,041 $ 2,000 (1) The Company leases some of its facilities under noncancelable operating leases that expire at various dates through fiscal
2057. See Note 11. of Notes to Consolidated Financial Statement contained in the Annual Report on Form 10-K for additional information about operating leases.
(2) In April 2007, the Company issued $1.0 billion aggregate principal amount of its 3.00% Convertible Senior Notes due May 1, 2027. The Company pays cash interest at an annual rate of 3.0% payable semiannually on May 1 and November 1 of each year, beginning on November 1, 2007. The Company has purchased and retired $154.9 million face value of the 3.0% Convertible Senior Notes. The Company may redeem the remaining outstanding $845.1 million principal amount of the 3.00% Convertible Senior Notes for cash at any time on or after May 1, 2014, and holders may require the Company to repurchase the 3.00% Convertible Senior Notes for cash on specified dates or upon a fundamental change.
(3) In April 2007, the Company issued $700 million aggregate principal amount of its 3.125% Convertible Senior Notes due May 1, 2027. The Company pays cash interest at an annual rate of 3.125% payable semiannually on May 1 and November 1 of each year, beginning on November 1, 2007. The Company has purchased and retired $304.2 million face value of the 3.125% Convertible Senior Notes. The Company may redeem the remaining outstanding $395.8 million principal amount of the 3.125% Convertible Senior Notes for cash at any time on or after November 1, 2010, and holders may require the Company to repurchase the 3.125% Convertible Senior Notes for cash on specified dates or upon a fundamental change. The Company presently intends to redeem the remaining outstanding $395.8 million principal on November 1, 2010.
28
Off-Balance Sheet Arrangements
As of June 27, 2010, the Company had no off-balance sheet financing arrangements.
ITEM 7A. QUANTITATIVE AND QUALITATIVE DISCLOSURES ABOUT MARKET RISK The Company’s cash equivalents and marketable securities are subject to market risk, primarily interest rate and credit risk. The Company’s investments are managed by outside professional managers within investment guidelines set by the Company. Such guidelines include security type, credit quality and maturity and are intended to limit market risk by restricting the Company’s investments to high quality debt instruments with relatively short-term maturities. The Company does not use derivative financial instruments in its investment portfolio. Based upon the weighted average duration of the Company’s investments at June 27, 2010, a hypothetical 100 basis point increase in short-term interest rates would result in an unrealized loss in market value of the Company’s investments totaling approximately $3.8 million. However, because the Company’s debt securities are classified as available-for-sale, no gains or losses are recognized by the Company in its results of operations due to changes in interest rates unless such securities are sold prior to maturity. These investments are reported at fair value with the related unrealized gains or losses reported in accumulated other comprehensive income, a component of stockholders’ deficit. The Company generally holds securities until maturity. The Company’s sales outside the United States are transacted in U.S. dollars; accordingly, the Company’s sales are not generally impacted by foreign currency rate changes.
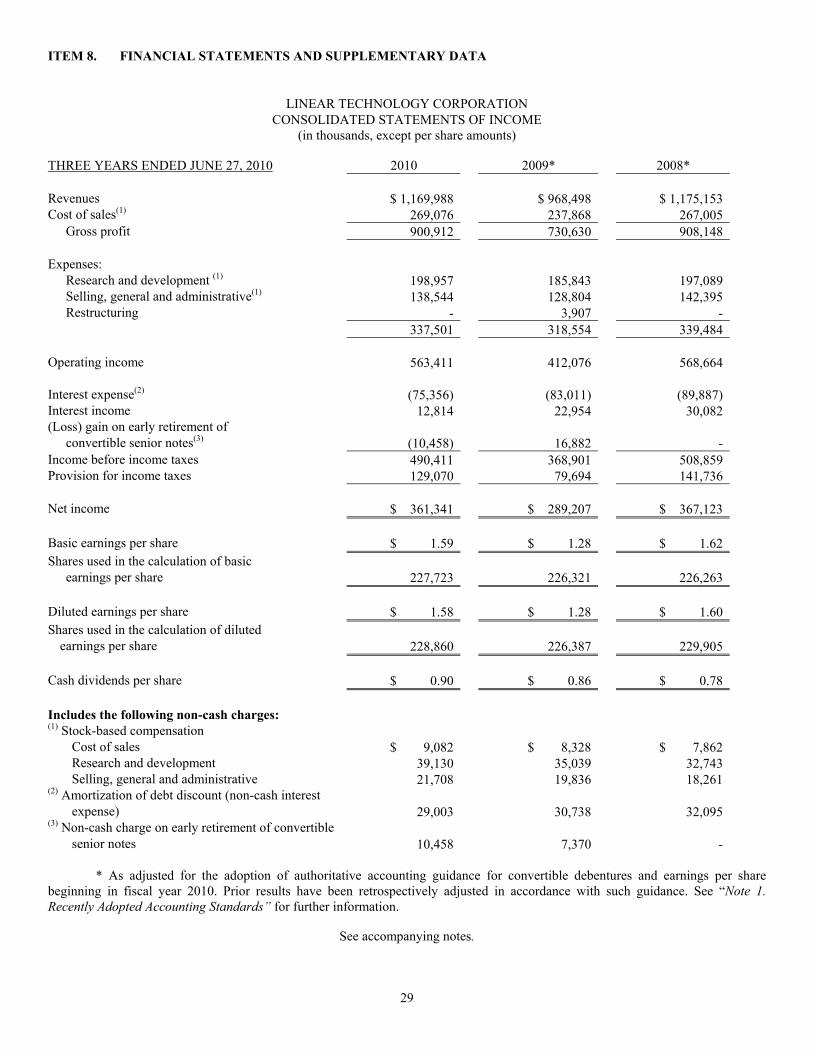
29
ITEM 8. FINANCIAL STATEMENTS AND SUPPLEMENTARY DATA
LINEAR TECHNOLOGY CORPORATION CONSOLIDATED STATEMENTS OF INCOME
(in thousands, except per share amounts)
THREE YEARS ENDED JUNE 27, 2010 2010 2009* 2008*
Revenues $ 1,169,988 $ 968,498 $ 1,175,153 Cost of sales(1) 269,076 237,868 267,005
Gross profit 900,912 730,630 908,148 Expenses:
Research and development (1) 198,957 185,843 197,089 Selling, general and administrative(1) 138,544 128,804 142,395 Restructuring - 3,907 -
337,501 318,554 339,484 Operating income 563,411 412,076 568,664 Interest expense(2) (75,356) (83,011) (89,887) Interest income 12,814 22,954 30,082 (Loss) gain on early retirement of
convertible senior notes(3) (10,458) 16,882 - Income before income taxes 490,411 368,901 508,859 Provision for income taxes 129,070 79,694 141,736 Net income $ 361,341 $ 289,207 $ 367,123 Basic earnings per share $ 1.59 $ 1.28 $ 1.62 Shares used in the calculation of basic
earnings per share 227,723 226,321 226,263 Diluted earnings per share $ 1.58 $ 1.28 $ 1.60 Shares used in the calculation of diluted
earnings per share 228,860 226,387 229,905 Cash dividends per share $ 0.90 $ 0.86 $ 0.78 Includes the following non-cash charges: (1) Stock-based compensation
Cost of sales $ 9,082 $ 8,328 $ 7,862 Research and development 39,130 35,039 32,743 Selling, general and administrative 21,708 19,836 18,261
(2) Amortization of debt discount (non-cash interest expense) 29,003 30,738 32,095 (3) Non-cash charge on early retirement of convertible senior notes 10,458 7,370 -
* As adjusted for the adoption of authoritative accounting guidance for convertible debentures and earnings per share
beginning in fiscal year 2010. Prior results have been retrospectively adjusted in accordance with such guidance. See “Note 1. Recently Adopted Accounting Standards” for further information.
See accompanying notes.
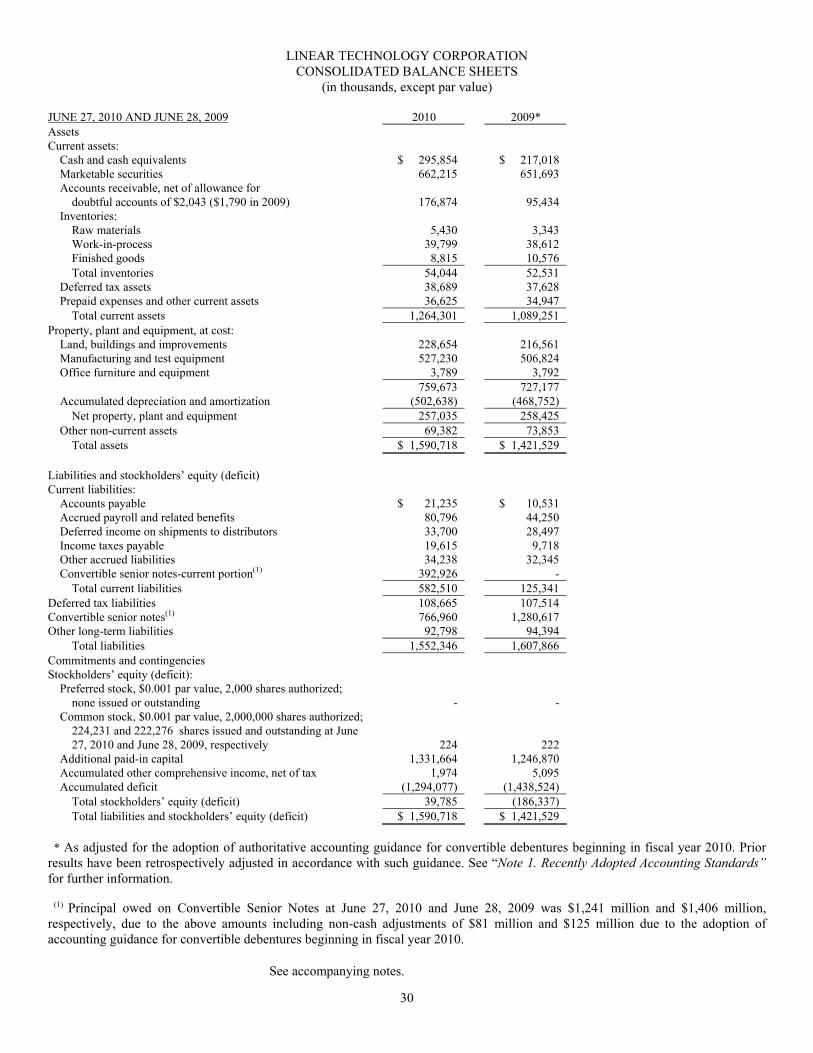
30
LINEAR TECHNOLOGY CORPORATION CONSOLIDATED BALANCE SHEETS
(in thousands, except par value)
JUNE 27, 2010 AND JUNE 28, 2009 2010 2009* Assets Current assets:
Cash and cash equivalents $ 295,854 $ 217,018 Marketable securities 662,215 651,693 Accounts receivable, net of allowance for
doubtful accounts of $2,043 ($1,790 in 2009) 176,874 95,434 Inventories:
Raw materials 5,430 3,343 Work-in-process 39,799 38,612 Finished goods 8,815 10,576 Total inventories 54,044 52,531
Deferred tax assets 38,689 37,628 Prepaid expenses and other current assets 36,625 34,947
Total current assets 1,264,301 1,089,251 Property, plant and equipment, at cost:
Land, buildings and improvements 228,654 216,561 Manufacturing and test equipment 527,230 506,824 Office furniture and equipment 3,789 3,792
759,673 727,177 Accumulated depreciation and amortization (502,638) (468,752)
Net property, plant and equipment 257,035 258,425 Other non-current assets 69,382 73,853
Total assets $ 1,590,718 $ 1,421,529 Liabilities and stockholders’ equity (deficit) Current liabilities:
Accounts payable $ 21,235 $ 10,531 Accrued payroll and related benefits 80,796 44,250 Deferred income on shipments to distributors 33,700 28,497 Income taxes payable 19,615 9,718 Other accrued liabilities 34,238 32,345 Convertible senior notes-current portion(1) 392,926 -
Total current liabilities 582,510 125,341 Deferred tax liabilities 108,665 107,514 Convertible senior notes(1) 766,960 1,280,617 Other long-term liabilities 92,798 94,394
Total liabilities 1,552,346 1,607,866 Commitments and contingencies Stockholders’ equity (deficit):
Preferred stock, $0.001 par value, 2,000 shares authorized; none issued or outstanding - -
Common stock, $0.001 par value, 2,000,000 shares authorized; 224,231 and 222,276 shares issued and outstanding at June 27, 2010 and June 28, 2009, respectively 224 222
Additional paid-in capital 1,331,664 1,246,870 Accumulated other comprehensive income, net of tax 1,974 5,095 Accumulated deficit (1,294,077) (1,438,524)
Total stockholders’ equity (deficit) 39,785 (186,337) Total liabilities and stockholders’ equity (deficit) $ 1,590,718 $ 1,421,529
* As adjusted for the adoption of authoritative accounting guidance for convertible debentures beginning in fiscal year 2010. Prior
results have been retrospectively adjusted in accordance with such guidance. See “Note 1. Recently Adopted Accounting Standards” for further information. (1) Principal owed on Convertible Senior Notes at June 27, 2010 and June 28, 2009 was $1,241 million and $1,406 million,
respectively, due to the above amounts including non-cash adjustments of $81 million and $125 million due to the adoption of accounting guidance for convertible debentures beginning in fiscal year 2010.
See accompanying notes.
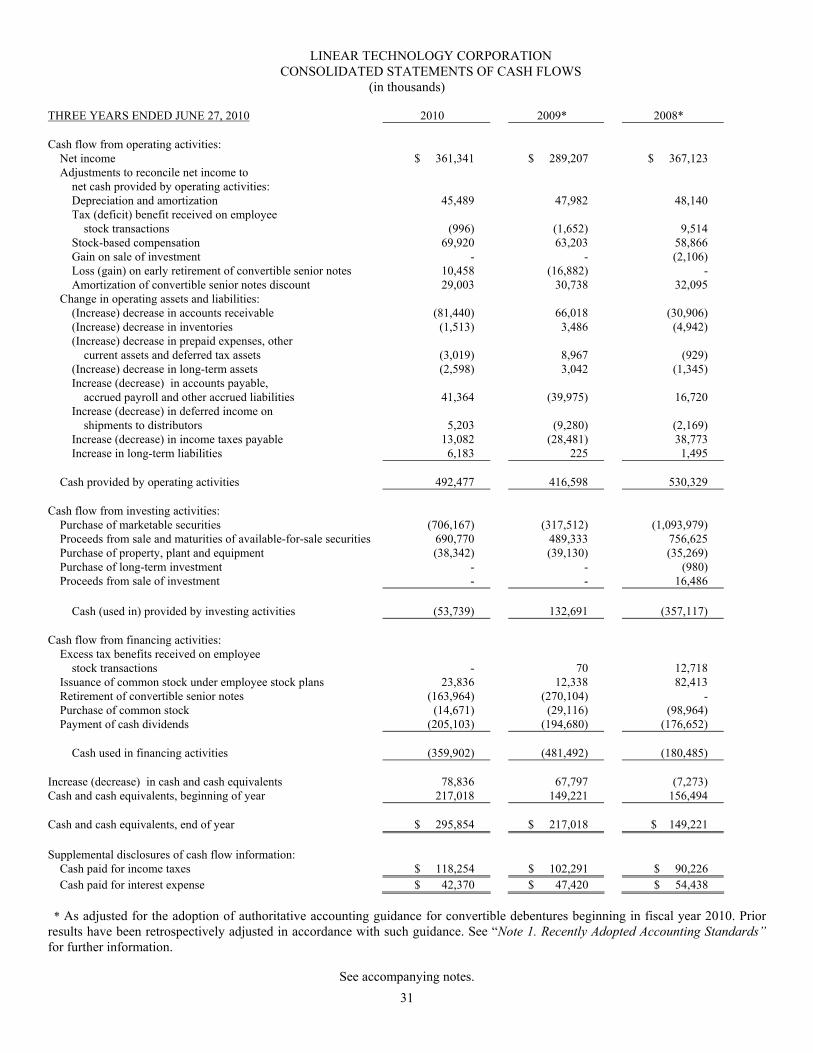
31
LINEAR TECHNOLOGY CORPORATION CONSOLIDATED STATEMENTS OF CASH FLOWS
(in thousands) THREE YEARS ENDED JUNE 27, 2010 2010 2009* 2008* Cash flow from operating activities:
Net income $ 361,341 $ 289,207 $ 367,123 Adjustments to reconcile net income to
net cash provided by operating activities: Depreciation and amortization 45,489 47,982 48,140 Tax (deficit) benefit received on employee
stock transactions (996) (1,652) 9,514 Stock-based compensation 69,920 63,203 58,866
Gain on sale of investment - - (2,106) Loss (gain) on early retirement of convertible senior notes 10,458 (16,882) - Amortization of convertible senior notes discount 29,003 30,738 32,095
Change in operating assets and liabilities: (Increase) decrease in accounts receivable (81,440) 66,018 (30,906) (Increase) decrease in inventories (1,513) 3,486 (4,942) (Increase) decrease in prepaid expenses, other
current assets and deferred tax assets (3,019) 8,967 (929) (Increase) decrease in long-term assets (2,598) 3,042 (1,345) Increase (decrease) in accounts payable,
accrued payroll and other accrued liabilities 41,364 (39,975) 16,720 Increase (decrease) in deferred income on
shipments to distributors 5,203 (9,280) (2,169) Increase (decrease) in income taxes payable 13,082 (28,481) 38,773 Increase in long-term liabilities 6,183 225 1,495
Cash provided by operating activities 492,477 416,598 530,329
Cash flow from investing activities:
Purchase of marketable securities (706,167) (317,512) (1,093,979) Proceeds from sale and maturities of available-for-sale securities 690,770 489,333 756,625 Purchase of property, plant and equipment (38,342) (39,130) (35,269) Purchase of long-term investment - - (980) Proceeds from sale of investment - - 16,486
Cash (used in) provided by investing activities (53,739) 132,691 (357,117)
Cash flow from financing activities:
Excess tax benefits received on employee stock transactions - 70 12,718
Issuance of common stock under employee stock plans 23,836 12,338 82,413 Retirement of convertible senior notes (163,964) (270,104) - Purchase of common stock (14,671) (29,116) (98,964) Payment of cash dividends (205,103) (194,680) (176,652)
Cash used in financing activities (359,902) (481,492) (180,485)
Increase (decrease) in cash and cash equivalents 78,836 67,797 (7,273) Cash and cash equivalents, beginning of year 217,018 149,221 156,494 Cash and cash equivalents, end of year $ 295,854 $ 217,018 $ 149,221 Supplemental disclosures of cash flow information:
Cash paid for income taxes $ 118,254 $ 102,291 $ 90,226 Cash paid for interest expense $ 42,370 $ 47,420 $ 54,438
* As adjusted for the adoption of authoritative accounting guidance for convertible debentures beginning in fiscal year 2010. Prior
results have been retrospectively adjusted in accordance with such guidance. See “Note 1. Recently Adopted Accounting Standards” for further information.
See accompanying notes.
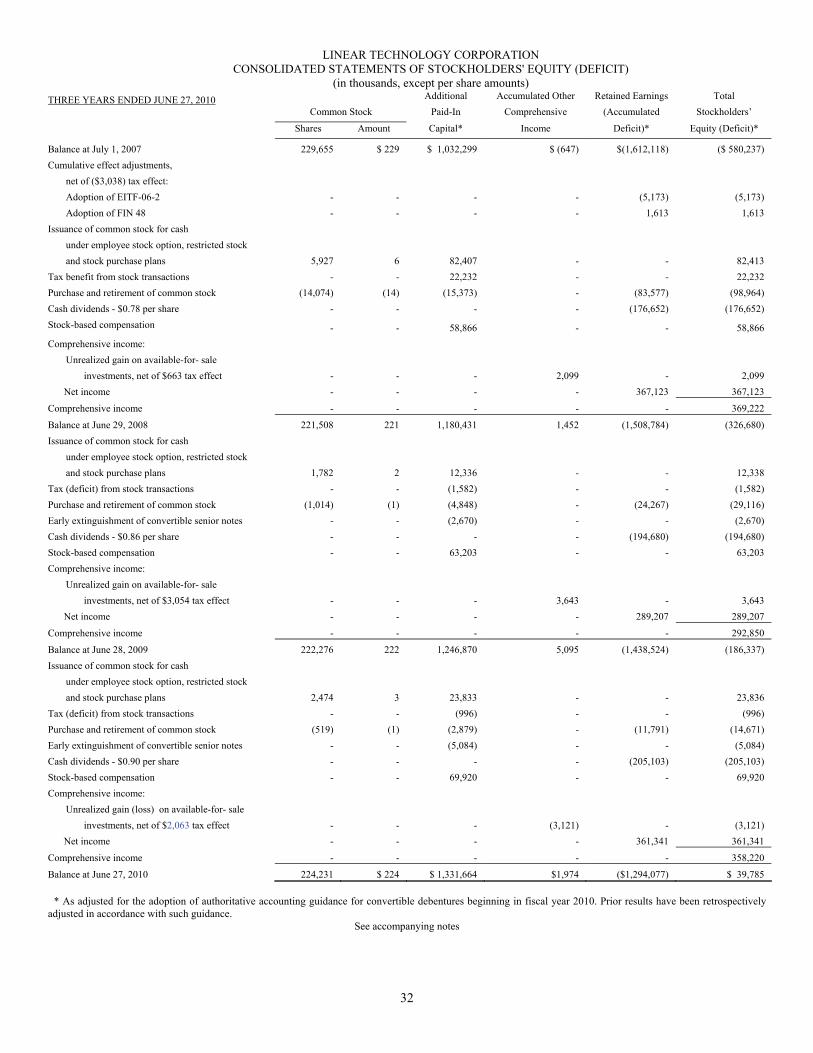
32
LINEAR TECHNOLOGY CORPORATION CONSOLIDATED STATEMENTS OF STOCKHOLDERS' EQUITY (DEFICIT)
(in thousands, except per share amounts) THREE YEARS ENDED JUNE 27, 2010 Additional Accumulated Other Retained Earnings Total
Common Stock Paid-In Comprehensive (Accumulated Stockholders’
Shares Amount Capital* Income Deficit)* Equity (Deficit)*
Balance at July 1, 2007 229,655 $ 229 $ 1,032,299 $ (647) $(1,612,118) ($ 580,237)
Cumulative effect adjustments,
net of ($3,038) tax effect:
Adoption of EITF-06-2 - - - - (5,173) (5,173)
Adoption of FIN 48 - - - - 1,613 1,613
Issuance of common stock for cash
under employee stock option, restricted stock
and stock purchase plans 5,927 6 82,407 - - 82,413
Tax benefit from stock transactions - - 22,232 - - 22,232
Purchase and retirement of common stock (14,074) (14) (15,373) - (83,577) (98,964)
Cash dividends - $0.78 per share - - - - (176,652) (176,652)
Stock-based compensation - - 58,866 - - 58,866
Comprehensive income:
Unrealized gain on available-for- sale
investments, net of $663 tax effect - - - 2,099 - 2,099
Net income - - - - 367,123 367,123
Comprehensive income - - - - - 369,222
Balance at June 29, 2008 221,508 221 1,180,431 1,452 (1,508,784) (326,680)
Issuance of common stock for cash
under employee stock option, restricted stock
and stock purchase plans 1,782 2 12,336 - - 12,338
Tax (deficit) from stock transactions - - (1,582) - - (1,582)
Purchase and retirement of common stock (1,014) (1) (4,848) - (24,267) (29,116)
Early extinguishment of convertible senior notes - - (2,670) - - (2,670)
Cash dividends - $0.86 per share - - - - (194,680) (194,680)
Stock-based compensation - - 63,203 - - 63,203
Comprehensive income:
Unrealized gain on available-for- sale
investments, net of $3,054 tax effect - - - 3,643 - 3,643
Net income - - - - 289,207 289,207
Comprehensive income - - - - - 292,850
Balance at June 28, 2009 222,276 222 1,246,870 5,095 (1,438,524) (186,337)
Issuance of common stock for cash
under employee stock option, restricted stock
and stock purchase plans 2,474 3 23,833 - - 23,836
Tax (deficit) from stock transactions - - (996) - - (996)
Purchase and retirement of common stock (519) (1) (2,879) - (11,791) (14,671)
Early extinguishment of convertible senior notes - - (5,084) - - (5,084)
Cash dividends - $0.90 per share - - - - (205,103) (205,103)
Stock-based compensation - - 69,920 - - 69,920
Comprehensive income:
Unrealized gain (loss) on available-for- sale
investments, net of $2,063 tax effect - - - (3,121) - (3,121)
Net income - - - - 361,341 361,341
Comprehensive income - - - - - 358,220
Balance at June 27, 2010 224,231 $ 224 $ 1,331,664 $1,974 ($1,294,077) $ 39,785
* As adjusted for the adoption of authoritative accounting guidance for convertible debentures beginning in fiscal year 2010. Prior results have been retrospectively
adjusted in accordance with such guidance. See accompanying notes
33
LINEAR TECHNOLOGY CORPORATION NOTES TO CONSOLIDATED FINANCIAL STATEMENTS
Note 1. Description of Business and Significant Accounting Policies Description of Business
Linear Technology Corporation (together with its consolidated subsidiaries, “Linear Technology” or the “Company”)
designs, manufactures and markets a broad line of standard high performance linear integrated circuits. The Company’s products include high performance amplifiers, comparators, voltage references, monolithic filters, linear regulators, DC-DC converters, battery chargers, data converters, communications interface circuits, RF signal conditioning circuits, µModule products, and many other analog functions. Applications for Linear Technology’s high performance circuits include telecommunications, cellular telephones, networking products such as optical switches; notebook, tablet and desktop computers; computer peripherals, video/multimedia, industrial instrumentation, security monitoring devices, high-end consumer products such as digital cameras and global positioning systems, complex medical devices, automotive electronics, factory automation, process control, military, space and other harsh environment systems. The Company is a Delaware corporation; it was organized and incorporated in California in 1981. Basis of Presentation
The Company operates on a 52/53-week fiscal year ending on the Sunday nearest June 30. Fiscal years 2010, 2009 and 2008 were 52-week years. The accompanying consolidated financial statements include the accounts of the Company and its wholly-owned subsidiaries after elimination of all significant inter-company accounts and transactions. Accounts denominated in foreign currencies have been translated using the U.S. dollar as the functional currency.
The preparation of financial statements and related disclosures in conformity with accounting principles generally accepted in
the United States requires management to make estimates and judgments that affect the amounts reported in the consolidated financial statements and accompanying notes. Actual results could differ materially from those estimates. Recently Adopted Accounting Standards
Accounting Standards Codification
In June 2009, the Financial Accounting Standards Board (“FASB”) issued FASB Statement No. 168, The FASB Accounting Standards Codification™ and the Hierarchy of Generally Accepted Accounting Principles (“SFAS 168”). SFAS 168 establishes the FASB Accounting Standards Codification (“ASC”) as the single source of authoritative U.S. generally accepted accounting principles (“GAAP”) recognized by the FASB to be applied by non-governmental entities. Rules and interpretive releases of the Securities and Exchange Commission (“SEC”) under authority of federal securities laws are also sources of authoritative GAAP for SEC registrants. The ASC supersedes all existing non-SEC accounting and reporting standards. All other non-grandfathered, non-SEC accounting literature not included in the ASC is now non-authoritative.
Following the ASC, the FASB will not issue new standards in the form of Statements, FASB Staff Positions or Emerging Issues Task Force Abstracts. Instead, it will issue Accounting Standards Updates, which serves to update the ASC, provide background information about the guidance and provide the basis for conclusions on the changes to the ASC.
GAAP was not intended to change as a result of the ASC project, but the ASC project did change the way the guidance is organized and presented. As a result, these changes have had a significant impact on how companies reference GAAP in their financial statements and in their accounting policies for financial statements issued for interim and annual periods ending after September 15, 2009. The Company has adopted this guidance by providing references to the ASC topics alongside references to the previous standards.
Standard for Convertible Senior Notes
The provisions of FASB Staff Position (“FSP”) No. APB 14-1, Accounting for Convertible Debt Instruments That May Be Settled in Cash upon Conversion (including Partial Cash Settlement) (“FSP APB14-1”), now codified in ASC Topic 470-20-10 to 35, Debt (“ASC 470-20-10 to 35”), were applicable to the Company in the first quarter of fiscal year 2010. The Company was required to retrospectively adopt the provisions of ASC 470-20-10 to 35. The adoption of ASC 470-20-10 to 35 affected the accounting treatment of the Company’s 3.00% Convertible Senior Notes due May 1, 2027 (the “2027A notes”) and its 3.125% Convertible Senior Notes due May 1, 2027 (the “2027B notes” and, together with the 2027A notes, the “Notes”).
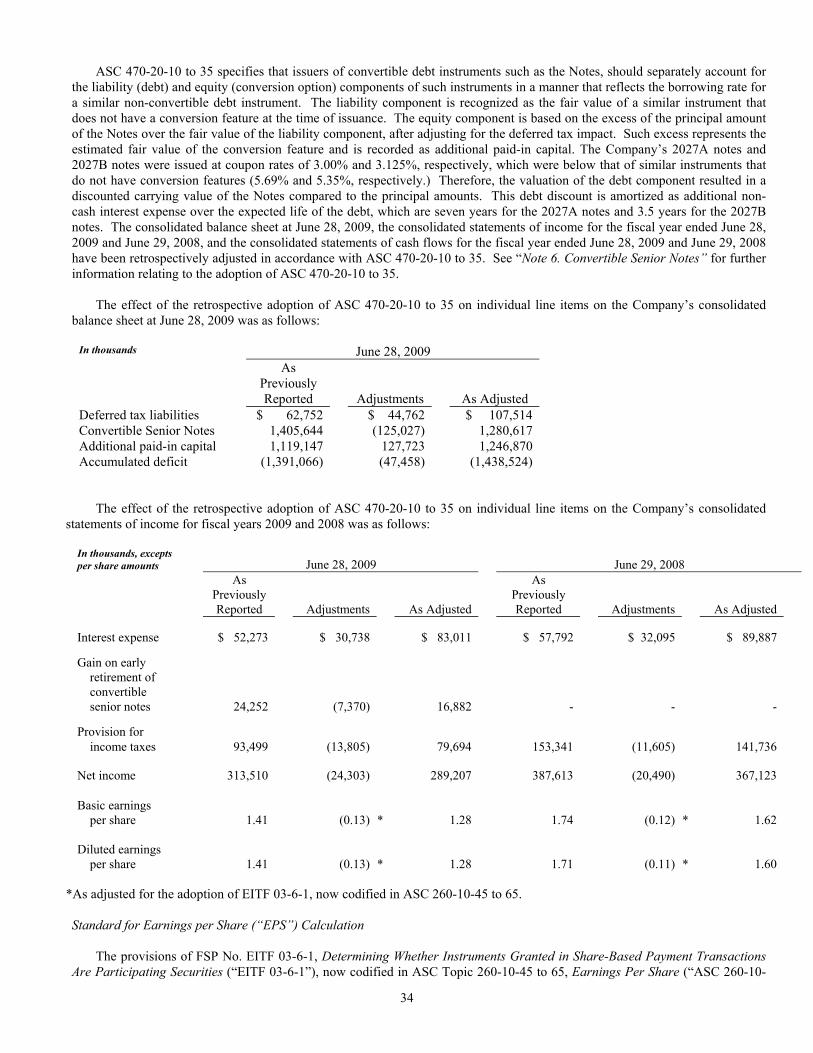
34
ASC 470-20-10 to 35 specifies that issuers of convertible debt instruments such as the Notes, should separately account for
the liability (debt) and equity (conversion option) components of such instruments in a manner that reflects the borrowing rate for a similar non-convertible debt instrument. The liability component is recognized as the fair value of a similar instrument that does not have a conversion feature at the time of issuance. The equity component is based on the excess of the principal amount of the Notes over the fair value of the liability component, after adjusting for the deferred tax impact. Such excess represents the estimated fair value of the conversion feature and is recorded as additional paid-in capital. The Company’s 2027A notes and 2027B notes were issued at coupon rates of 3.00% and 3.125%, respectively, which were below that of similar instruments that do not have conversion features (5.69% and 5.35%, respectively.) Therefore, the valuation of the debt component resulted in a discounted carrying value of the Notes compared to the principal amounts. This debt discount is amortized as additional non-cash interest expense over the expected life of the debt, which are seven years for the 2027A notes and 3.5 years for the 2027B notes. The consolidated balance sheet at June 28, 2009, the consolidated statements of income for the fiscal year ended June 28, 2009 and June 29, 2008, and the consolidated statements of cash flows for the fiscal year ended June 28, 2009 and June 29, 2008 have been retrospectively adjusted in accordance with ASC 470-20-10 to 35. See “Note 6. Convertible Senior Notes” for further information relating to the adoption of ASC 470-20-10 to 35.
The effect of the retrospective adoption of ASC 470-20-10 to 35 on individual line items on the Company’s consolidated
balance sheet at June 28, 2009 was as follows:
In thousands June 28, 2009 As
Previously Reported
Adjustments
As Adjusted Deferred tax liabilities $ 62,752 $ 44,762 $ 107,514 Convertible Senior Notes 1,405,644 (125,027) 1,280,617 Additional paid-in capital 1,119,147 127,723 1,246,870 Accumulated deficit (1,391,066) (47,458) (1,438,524)
The effect of the retrospective adoption of ASC 470-20-10 to 35 on individual line items on the Company’s consolidated
statements of income for fiscal years 2009 and 2008 was as follows:
In thousands, excepts per share amounts
June 28, 2009 June 29, 2008
As Previously Reported Adjustments As Adjusted
As Previously Reported Adjustments As Adjusted
Interest expense $ 52,273 $ 30,738 $ 83,011 $ 57,792 $ 32,095 $ 89,887
Gain on early retirement of convertible senior notes 24,252 (7,370) 16,882 - - -
Provision for income taxes 93,499 (13,805) 79,694 153,341 (11,605) 141,736
Net income
313,510 (24,303) 289,207 387,613 (20,490) 367,123
Basic earnings
per share 1.41 (0.13) * 1.28 1.74 (0.12) * 1.62
Diluted earnings
per share 1.41 (0.13) * 1.28 1.71 (0.11) * 1.60 *As adjusted for the adoption of EITF 03-6-1, now codified in ASC 260-10-45 to 65. Standard for Earnings per Share (“EPS”) Calculation
The provisions of FSP No. EITF 03-6-1, Determining Whether Instruments Granted in Share-Based Payment Transactions Are Participating Securities (“EITF 03-6-1”), now codified in ASC Topic 260-10-45 to 65, Earnings Per Share (“ASC 260-10-
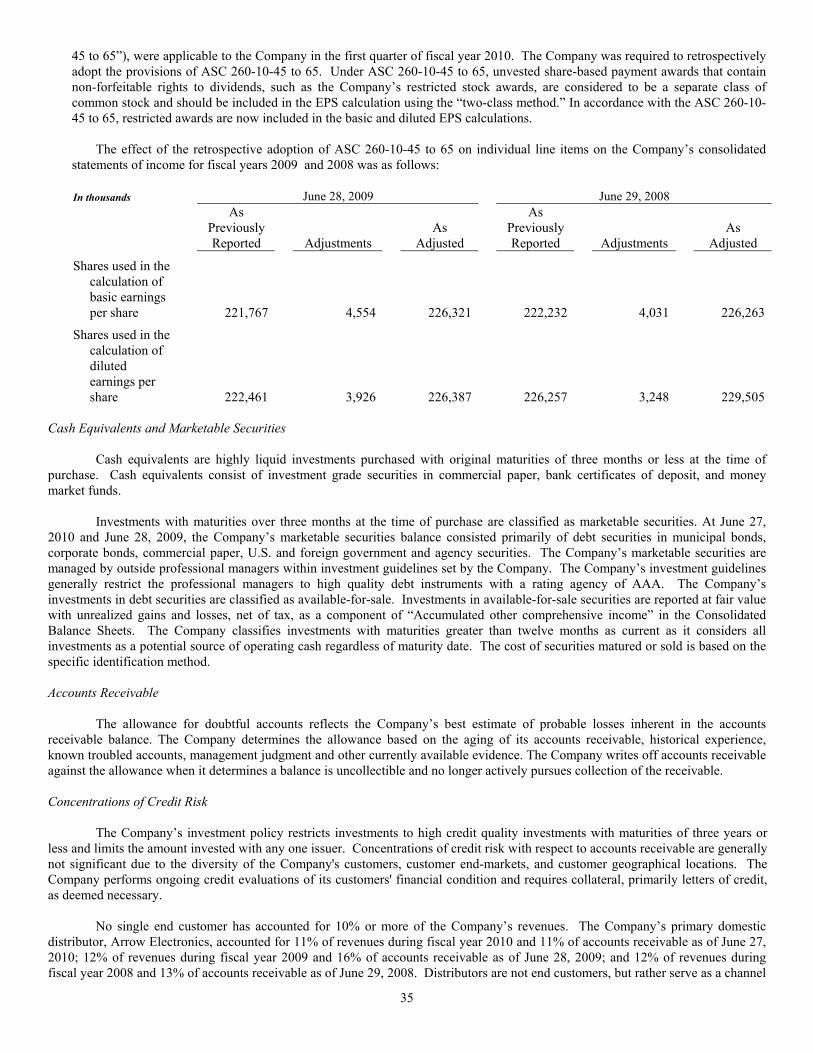
35
45 to 65”), were applicable to the Company in the first quarter of fiscal year 2010. The Company was required to retrospectively adopt the provisions of ASC 260-10-45 to 65. Under ASC 260-10-45 to 65, unvested share-based payment awards that contain non-forfeitable rights to dividends, such as the Company’s restricted stock awards, are considered to be a separate class of common stock and should be included in the EPS calculation using the “two-class method.” In accordance with the ASC 260-10-45 to 65, restricted awards are now included in the basic and diluted EPS calculations.
The effect of the retrospective adoption of ASC 260-10-45 to 65 on individual line items on the Company’s consolidated
statements of income for fiscal years 2009 and 2008 was as follows:
In thousands June 28, 2009 June 29, 2008 As
Previously Reported
Adjustments As
Adjusted
As Previously Reported
Adjustments As
Adjusted
Shares used in the
calculation of basic earnings per share 221,767 4,554 226,321 222,232 4,031 226,263
Shares used in the
calculation of diluted earnings per share 222,461 3,926 226,387 226,257 3,248 229,505
Cash Equivalents and Marketable Securities
Cash equivalents are highly liquid investments purchased with original maturities of three months or less at the time of purchase. Cash equivalents consist of investment grade securities in commercial paper, bank certificates of deposit, and money market funds.
Investments with maturities over three months at the time of purchase are classified as marketable securities. At June 27,
2010 and June 28, 2009, the Company’s marketable securities balance consisted primarily of debt securities in municipal bonds, corporate bonds, commercial paper, U.S. and foreign government and agency securities. The Company’s marketable securities are managed by outside professional managers within investment guidelines set by the Company. The Company’s investment guidelines generally restrict the professional managers to high quality debt instruments with a rating agency of AAA. The Company’s investments in debt securities are classified as available-for-sale. Investments in available-for-sale securities are reported at fair value with unrealized gains and losses, net of tax, as a component of “Accumulated other comprehensive income” in the Consolidated Balance Sheets. The Company classifies investments with maturities greater than twelve months as current as it considers all investments as a potential source of operating cash regardless of maturity date. The cost of securities matured or sold is based on the specific identification method. Accounts Receivable
The allowance for doubtful accounts reflects the Company’s best estimate of probable losses inherent in the accounts receivable balance. The Company determines the allowance based on the aging of its accounts receivable, historical experience, known troubled accounts, management judgment and other currently available evidence. The Company writes off accounts receivable against the allowance when it determines a balance is uncollectible and no longer actively pursues collection of the receivable. Concentrations of Credit Risk
The Company’s investment policy restricts investments to high credit quality investments with maturities of three years or less and limits the amount invested with any one issuer. Concentrations of credit risk with respect to accounts receivable are generally not significant due to the diversity of the Company's customers, customer end-markets, and customer geographical locations. The Company performs ongoing credit evaluations of its customers' financial condition and requires collateral, primarily letters of credit, as deemed necessary.
No single end customer has accounted for 10% or more of the Company’s revenues. The Company’s primary domestic
distributor, Arrow Electronics, accounted for 11% of revenues during fiscal year 2010 and 11% of accounts receivable as of June 27, 2010; 12% of revenues during fiscal year 2009 and 16% of accounts receivable as of June 28, 2009; and 12% of revenues during fiscal year 2008 and 13% of accounts receivable as of June 29, 2008. Distributors are not end customers, but rather serve as a channel
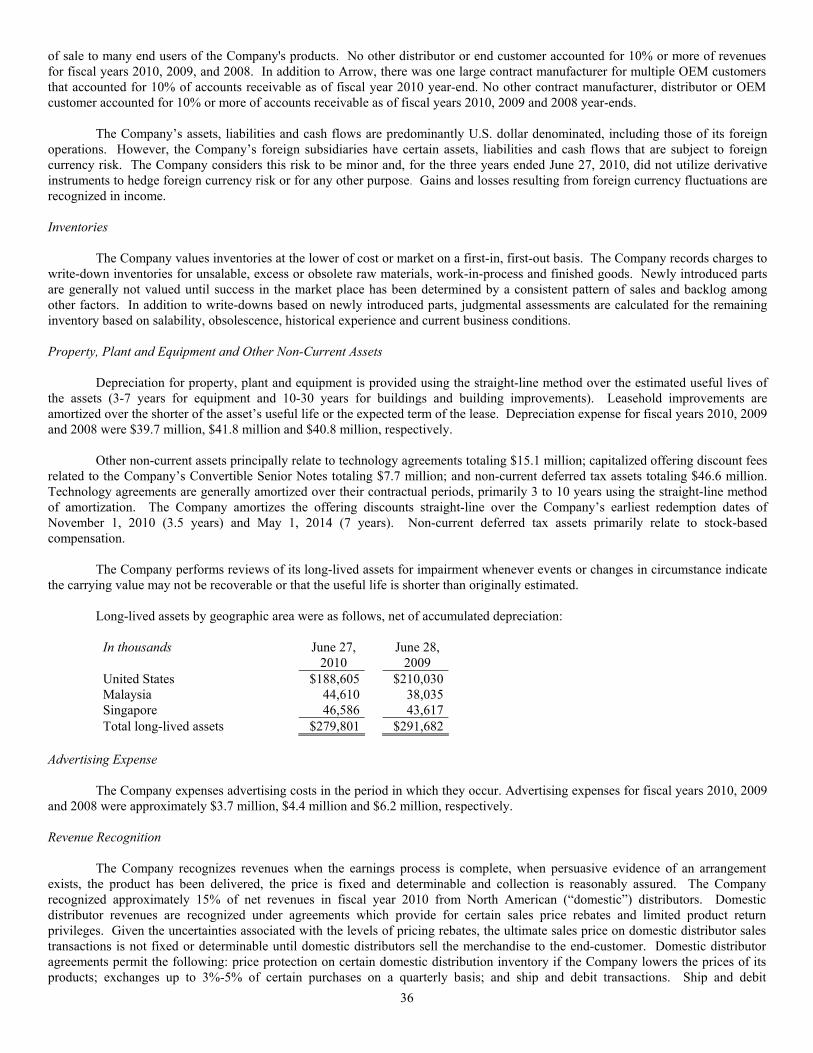
36
of sale to many end users of the Company's products. No other distributor or end customer accounted for 10% or more of revenues for fiscal years 2010, 2009, and 2008. In addition to Arrow, there was one large contract manufacturer for multiple OEM customers that accounted for 10% of accounts receivable as of fiscal year 2010 year-end. No other contract manufacturer, distributor or OEM customer accounted for 10% or more of accounts receivable as of fiscal years 2010, 2009 and 2008 year-ends.
The Company’s assets, liabilities and cash flows are predominantly U.S. dollar denominated, including those of its foreign
operations. However, the Company’s foreign subsidiaries have certain assets, liabilities and cash flows that are subject to foreign currency risk. The Company considers this risk to be minor and, for the three years ended June 27, 2010, did not utilize derivative instruments to hedge foreign currency risk or for any other purpose. Gains and losses resulting from foreign currency fluctuations are recognized in income. Inventories
The Company values inventories at the lower of cost or market on a first-in, first-out basis. The Company records charges to write-down inventories for unsalable, excess or obsolete raw materials, work-in-process and finished goods. Newly introduced parts are generally not valued until success in the market place has been determined by a consistent pattern of sales and backlog among other factors. In addition to write-downs based on newly introduced parts, judgmental assessments are calculated for the remaining inventory based on salability, obsolescence, historical experience and current business conditions. Property, Plant and Equipment and Other Non-Current Assets
Depreciation for property, plant and equipment is provided using the straight-line method over the estimated useful lives of the assets (3-7 years for equipment and 10-30 years for buildings and building improvements). Leasehold improvements are amortized over the shorter of the asset’s useful life or the expected term of the lease. Depreciation expense for fiscal years 2010, 2009 and 2008 were $39.7 million, $41.8 million and $40.8 million, respectively.
Other non-current assets principally relate to technology agreements totaling $15.1 million; capitalized offering discount fees
related to the Company’s Convertible Senior Notes totaling $7.7 million; and non-current deferred tax assets totaling $46.6 million. Technology agreements are generally amortized over their contractual periods, primarily 3 to 10 years using the straight-line method of amortization. The Company amortizes the offering discounts straight-line over the Company’s earliest redemption dates of November 1, 2010 (3.5 years) and May 1, 2014 (7 years). Non-current deferred tax assets primarily relate to stock-based compensation.
The Company performs reviews of its long-lived assets for impairment whenever events or changes in circumstance indicate
the carrying value may not be recoverable or that the useful life is shorter than originally estimated.
Long-lived assets by geographic area were as follows, net of accumulated depreciation:
In thousands June 27, June 28, 2010 2009 United States $188,605 $210,030Malaysia 44,610 38,035Singapore 46,586 43,617Total long-lived assets $279,801 $291,682
Advertising Expense
The Company expenses advertising costs in the period in which they occur. Advertising expenses for fiscal years 2010, 2009 and 2008 were approximately $3.7 million, $4.4 million and $6.2 million, respectively. Revenue Recognition
The Company recognizes revenues when the earnings process is complete, when persuasive evidence of an arrangement exists, the product has been delivered, the price is fixed and determinable and collection is reasonably assured. The Company recognized approximately 15% of net revenues in fiscal year 2010 from North American (“domestic”) distributors. Domestic distributor revenues are recognized under agreements which provide for certain sales price rebates and limited product return privileges. Given the uncertainties associated with the levels of pricing rebates, the ultimate sales price on domestic distributor sales transactions is not fixed or determinable until domestic distributors sell the merchandise to the end-customer. Domestic distributor agreements permit the following: price protection on certain domestic distribution inventory if the Company lowers the prices of its products; exchanges up to 3%-5% of certain purchases on a quarterly basis; and ship and debit transactions. Ship and debit
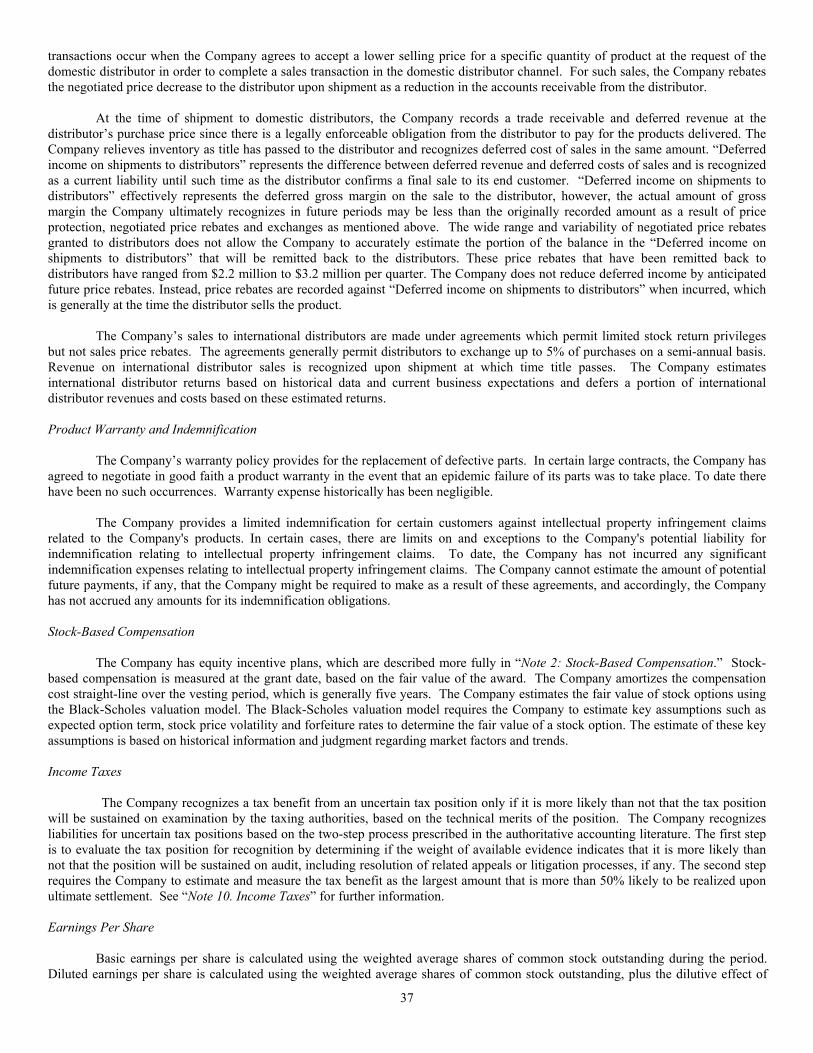
37
transactions occur when the Company agrees to accept a lower selling price for a specific quantity of product at the request of the domestic distributor in order to complete a sales transaction in the domestic distributor channel. For such sales, the Company rebates the negotiated price decrease to the distributor upon shipment as a reduction in the accounts receivable from the distributor.
At the time of shipment to domestic distributors, the Company records a trade receivable and deferred revenue at the
distributor’s purchase price since there is a legally enforceable obligation from the distributor to pay for the products delivered. The Company relieves inventory as title has passed to the distributor and recognizes deferred cost of sales in the same amount. “Deferred income on shipments to distributors” represents the difference between deferred revenue and deferred costs of sales and is recognized as a current liability until such time as the distributor confirms a final sale to its end customer. “Deferred income on shipments to distributors” effectively represents the deferred gross margin on the sale to the distributor, however, the actual amount of gross margin the Company ultimately recognizes in future periods may be less than the originally recorded amount as a result of price protection, negotiated price rebates and exchanges as mentioned above. The wide range and variability of negotiated price rebates granted to distributors does not allow the Company to accurately estimate the portion of the balance in the “Deferred income on shipments to distributors” that will be remitted back to the distributors. These price rebates that have been remitted back to distributors have ranged from $2.2 million to $3.2 million per quarter. The Company does not reduce deferred income by anticipated future price rebates. Instead, price rebates are recorded against “Deferred income on shipments to distributors” when incurred, which is generally at the time the distributor sells the product.
The Company’s sales to international distributors are made under agreements which permit limited stock return privileges
but not sales price rebates. The agreements generally permit distributors to exchange up to 5% of purchases on a semi-annual basis. Revenue on international distributor sales is recognized upon shipment at which time title passes. The Company estimates international distributor returns based on historical data and current business expectations and defers a portion of international distributor revenues and costs based on these estimated returns. Product Warranty and Indemnification
The Company’s warranty policy provides for the replacement of defective parts. In certain large contracts, the Company has agreed to negotiate in good faith a product warranty in the event that an epidemic failure of its parts was to take place. To date there have been no such occurrences. Warranty expense historically has been negligible.
The Company provides a limited indemnification for certain customers against intellectual property infringement claims
related to the Company's products. In certain cases, there are limits on and exceptions to the Company's potential liability for indemnification relating to intellectual property infringement claims. To date, the Company has not incurred any significant indemnification expenses relating to intellectual property infringement claims. The Company cannot estimate the amount of potential future payments, if any, that the Company might be required to make as a result of these agreements, and accordingly, the Company has not accrued any amounts for its indemnification obligations. Stock-Based Compensation
The Company has equity incentive plans, which are described more fully in “Note 2: Stock-Based Compensation.” Stock-
based compensation is measured at the grant date, based on the fair value of the award. The Company amortizes the compensation cost straight-line over the vesting period, which is generally five years. The Company estimates the fair value of stock options using the Black-Scholes valuation model. The Black-Scholes valuation model requires the Company to estimate key assumptions such as expected option term, stock price volatility and forfeiture rates to determine the fair value of a stock option. The estimate of these key assumptions is based on historical information and judgment regarding market factors and trends.
Income Taxes
The Company recognizes a tax benefit from an uncertain tax position only if it is more likely than not that the tax position will be sustained on examination by the taxing authorities, based on the technical merits of the position. The Company recognizes liabilities for uncertain tax positions based on the two-step process prescribed in the authoritative accounting literature. The first step is to evaluate the tax position for recognition by determining if the weight of available evidence indicates that it is more likely than not that the position will be sustained on audit, including resolution of related appeals or litigation processes, if any. The second step requires the Company to estimate and measure the tax benefit as the largest amount that is more than 50% likely to be realized upon ultimate settlement. See “Note 10. Income Taxes” for further information.
Earnings Per Share
Basic earnings per share is calculated using the weighted average shares of common stock outstanding during the period. Diluted earnings per share is calculated using the weighted average shares of common stock outstanding, plus the dilutive effect of
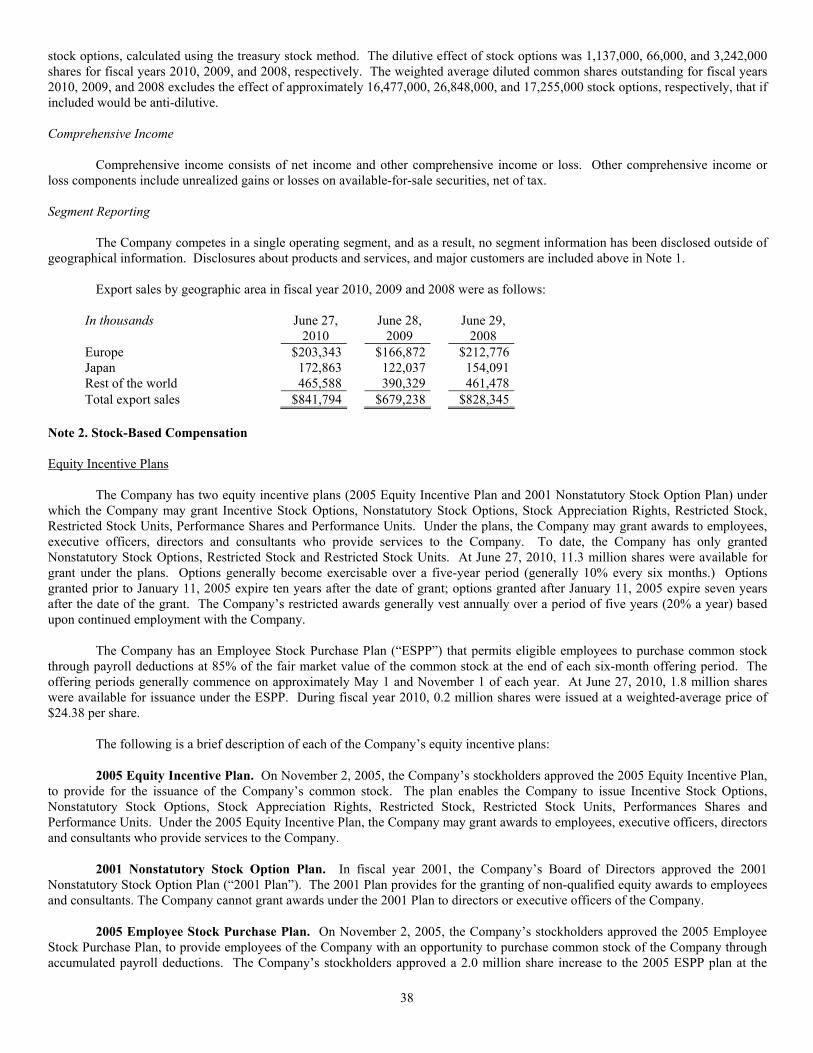
38
stock options, calculated using the treasury stock method. The dilutive effect of stock options was 1,137,000, 66,000, and 3,242,000 shares for fiscal years 2010, 2009, and 2008, respectively. The weighted average diluted common shares outstanding for fiscal years 2010, 2009, and 2008 excludes the effect of approximately 16,477,000, 26,848,000, and 17,255,000 stock options, respectively, that if included would be anti-dilutive. Comprehensive Income
Comprehensive income consists of net income and other comprehensive income or loss. Other comprehensive income or loss components include unrealized gains or losses on available-for-sale securities, net of tax. Segment Reporting
The Company competes in a single operating segment, and as a result, no segment information has been disclosed outside of geographical information. Disclosures about products and services, and major customers are included above in Note 1.
Export sales by geographic area in fiscal year 2010, 2009 and 2008 were as follows:
In thousands June 27, June 28, June 29, 2010 2009 2008 Europe $203,343 $166,872 $212,776Japan 172,863 122,037 154,091Rest of the world 465,588 390,329 461,478Total export sales $841,794 $679,238 $828,345
Note 2. Stock-Based Compensation Equity Incentive Plans
The Company has two equity incentive plans (2005 Equity Incentive Plan and 2001 Nonstatutory Stock Option Plan) under which the Company may grant Incentive Stock Options, Nonstatutory Stock Options, Stock Appreciation Rights, Restricted Stock, Restricted Stock Units, Performance Shares and Performance Units. Under the plans, the Company may grant awards to employees, executive officers, directors and consultants who provide services to the Company. To date, the Company has only granted Nonstatutory Stock Options, Restricted Stock and Restricted Stock Units. At June 27, 2010, 11.3 million shares were available for grant under the plans. Options generally become exercisable over a five-year period (generally 10% every six months.) Options granted prior to January 11, 2005 expire ten years after the date of grant; options granted after January 11, 2005 expire seven years after the date of the grant. The Company’s restricted awards generally vest annually over a period of five years (20% a year) based upon continued employment with the Company.
The Company has an Employee Stock Purchase Plan (“ESPP”) that permits eligible employees to purchase common stock
through payroll deductions at 85% of the fair market value of the common stock at the end of each six-month offering period. The offering periods generally commence on approximately May 1 and November 1 of each year. At June 27, 2010, 1.8 million shares were available for issuance under the ESPP. During fiscal year 2010, 0.2 million shares were issued at a weighted-average price of $24.38 per share.
The following is a brief description of each of the Company’s equity incentive plans: 2005 Equity Incentive Plan. On November 2, 2005, the Company’s stockholders approved the 2005 Equity Incentive Plan,
to provide for the issuance of the Company’s common stock. The plan enables the Company to issue Incentive Stock Options, Nonstatutory Stock Options, Stock Appreciation Rights, Restricted Stock, Restricted Stock Units, Performances Shares and Performance Units. Under the 2005 Equity Incentive Plan, the Company may grant awards to employees, executive officers, directors and consultants who provide services to the Company.
2001 Nonstatutory Stock Option Plan. In fiscal year 2001, the Company’s Board of Directors approved the 2001
Nonstatutory Stock Option Plan (“2001 Plan”). The 2001 Plan provides for the granting of non-qualified equity awards to employees and consultants. The Company cannot grant awards under the 2001 Plan to directors or executive officers of the Company. 2005 Employee Stock Purchase Plan. On November 2, 2005, the Company’s stockholders approved the 2005 Employee Stock Purchase Plan, to provide employees of the Company with an opportunity to purchase common stock of the Company through accumulated payroll deductions. The Company’s stockholders approved a 2.0 million share increase to the 2005 ESPP plan at the
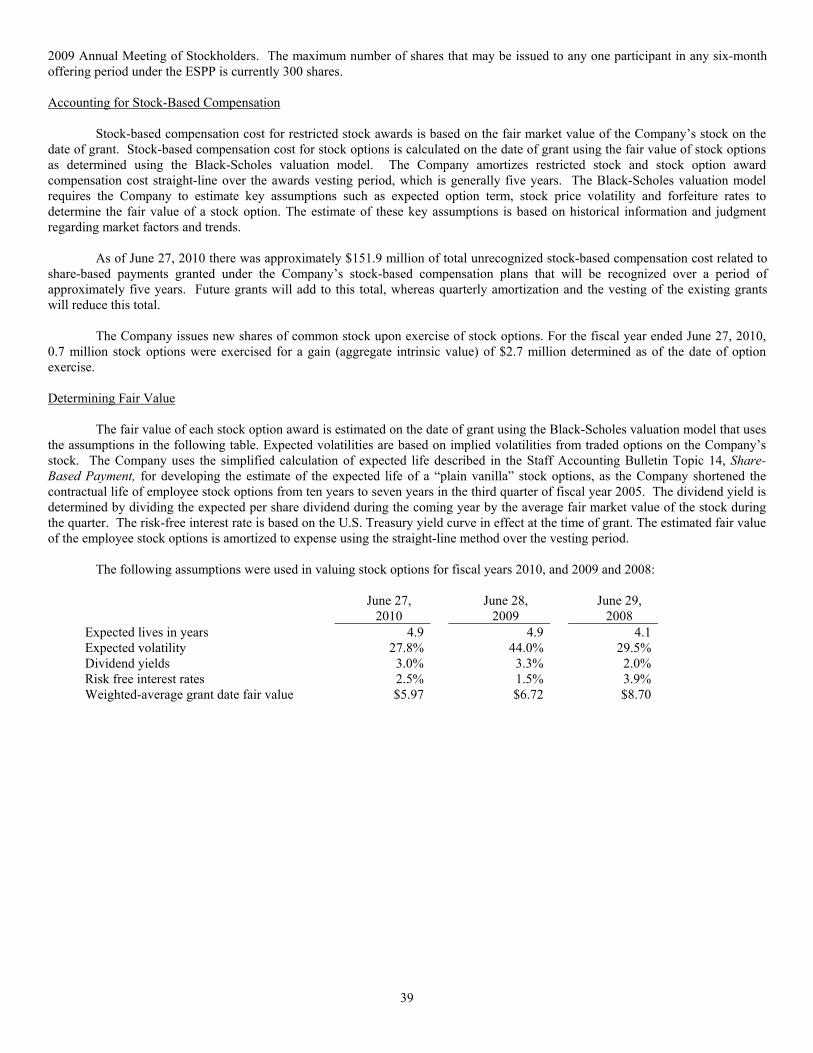
39
2009 Annual Meeting of Stockholders. The maximum number of shares that may be issued to any one participant in any six-month offering period under the ESPP is currently 300 shares. Accounting for Stock-Based Compensation
Stock-based compensation cost for restricted stock awards is based on the fair market value of the Company’s stock on the date of grant. Stock-based compensation cost for stock options is calculated on the date of grant using the fair value of stock options as determined using the Black-Scholes valuation model. The Company amortizes restricted stock and stock option award compensation cost straight-line over the awards vesting period, which is generally five years. The Black-Scholes valuation model requires the Company to estimate key assumptions such as expected option term, stock price volatility and forfeiture rates to determine the fair value of a stock option. The estimate of these key assumptions is based on historical information and judgment regarding market factors and trends.
As of June 27, 2010 there was approximately $151.9 million of total unrecognized stock-based compensation cost related to share-based payments granted under the Company’s stock-based compensation plans that will be recognized over a period of approximately five years. Future grants will add to this total, whereas quarterly amortization and the vesting of the existing grants will reduce this total.
The Company issues new shares of common stock upon exercise of stock options. For the fiscal year ended June 27, 2010, 0.7 million stock options were exercised for a gain (aggregate intrinsic value) of $2.7 million determined as of the date of option exercise.
Determining Fair Value
The fair value of each stock option award is estimated on the date of grant using the Black-Scholes valuation model that uses the assumptions in the following table. Expected volatilities are based on implied volatilities from traded options on the Company’s stock. The Company uses the simplified calculation of expected life described in the Staff Accounting Bulletin Topic 14, Share-Based Payment, for developing the estimate of the expected life of a “plain vanilla” stock options, as the Company shortened the contractual life of employee stock options from ten years to seven years in the third quarter of fiscal year 2005. The dividend yield is determined by dividing the expected per share dividend during the coming year by the average fair market value of the stock during the quarter. The risk-free interest rate is based on the U.S. Treasury yield curve in effect at the time of grant. The estimated fair value of the employee stock options is amortized to expense using the straight-line method over the vesting period.
The following assumptions were used in valuing stock options for fiscal years 2010, and 2009 and 2008:
June 27, June 28, June 29, 2010 2009 2008
Expected lives in years 4.9 4.9 4.1 Expected volatility 27.8% 44.0% 29.5% Dividend yields 3.0% 3.3% 2.0% Risk free interest rates 2.5% 1.5% 3.9% Weighted-average grant date fair value $5.97 $6.72 $8.70
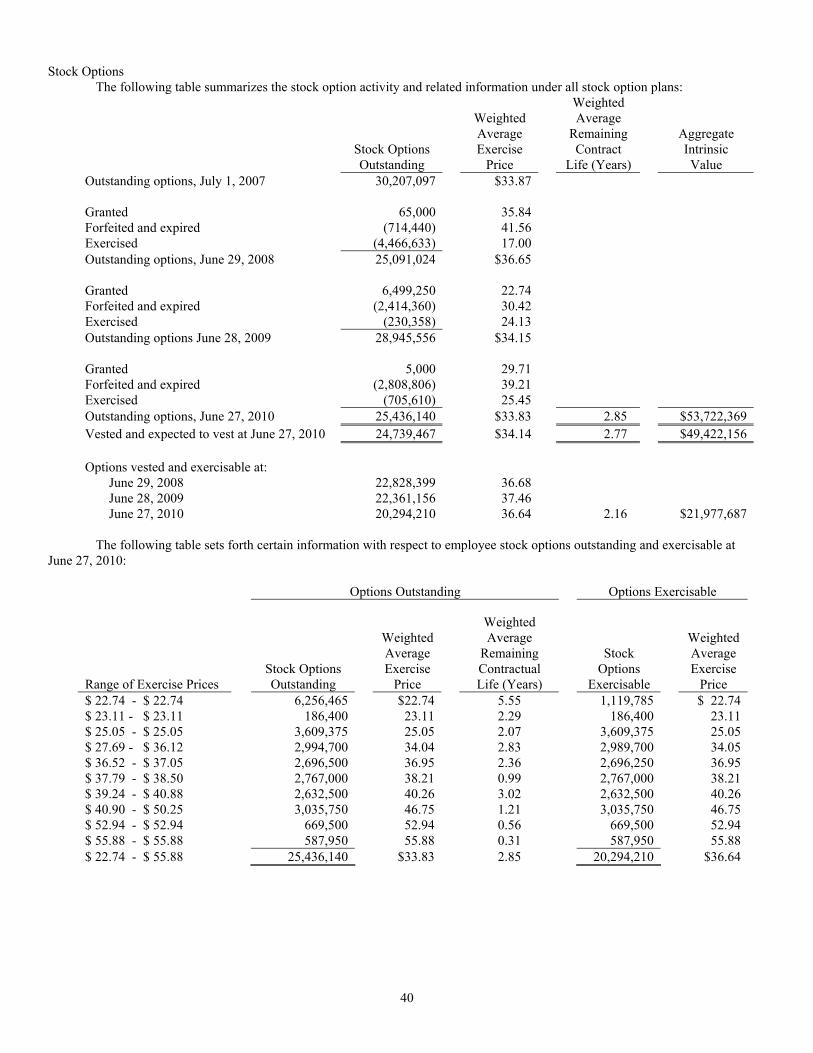
40
Stock Options
The following table summarizes the stock option activity and related information under all stock option plans: Weighted Weighted Average Average Remaining Aggregate Stock Options Exercise Contract Intrinsic Outstanding Price Life (Years) Value
Outstanding options, July 1, 2007 30,207,097 $33.87 Granted 65,000 35.84 Forfeited and expired (714,440) 41.56 Exercised (4,466,633) 17.00 Outstanding options, June 29, 2008 25,091,024 $36.65 Granted 6,499,250 22.74 Forfeited and expired (2,414,360) 30.42 Exercised (230,358) 24.13 Outstanding options June 28, 2009 28,945,556 $34.15 Granted 5,000 29.71 Forfeited and expired (2,808,806) 39.21 Exercised (705,610) 25.45 Outstanding options, June 27, 2010 25,436,140 $33.83 2.85 $53,722,369 Vested and expected to vest at June 27, 2010 24,739,467 $34.14 2.77 $49,422,156 Options vested and exercisable at:
June 29, 2008 22,828,399 36.68 June 28, 2009 22,361,156 37.46 June 27, 2010 20,294,210 36.64 2.16 $21,977,687
The following table sets forth certain information with respect to employee stock options outstanding and exercisable at
June 27, 2010:
Options Outstanding Options Exercisable
Range of Exercise Prices
Stock Options Outstanding
Weighted Average Exercise
Price
Weighted Average
Remaining Contractual Life (Years)
Stock Options
Exercisable
Weighted Average Exercise
Price $ 22.74 - $ 22.74 6,256,465 $22.74 5.55 1,119,785 $ 22.74 $ 23.11 - $ 23.11 186,400 23.11 2.29 186,400 23.11 $ 25.05 - $ 25.05 3,609,375 25.05 2.07 3,609,375 25.05 $ 27.69 - $ 36.12 2,994,700 34.04 2.83 2,989,700 34.05 $ 36.52 - $ 37.05 2,696,500 36.95 2.36 2,696,250 36.95 $ 37.79 - $ 38.50 2,767,000 38.21 0.99 2,767,000 38.21 $ 39.24 - $ 40.88 2,632,500 40.26 3.02 2,632,500 40.26 $ 40.90 - $ 50.25 3,035,750 46.75 1.21 3,035,750 46.75 $ 52.94 - $ 52.94 669,500 52.94 0.56 669,500 52.94 $ 55.88 - $ 55.88 587,950 55.88 0.31 587,950 55.88 $ 22.74 - $ 55.88 25,436,140 $33.83 2.85 20,294,210 $36.64
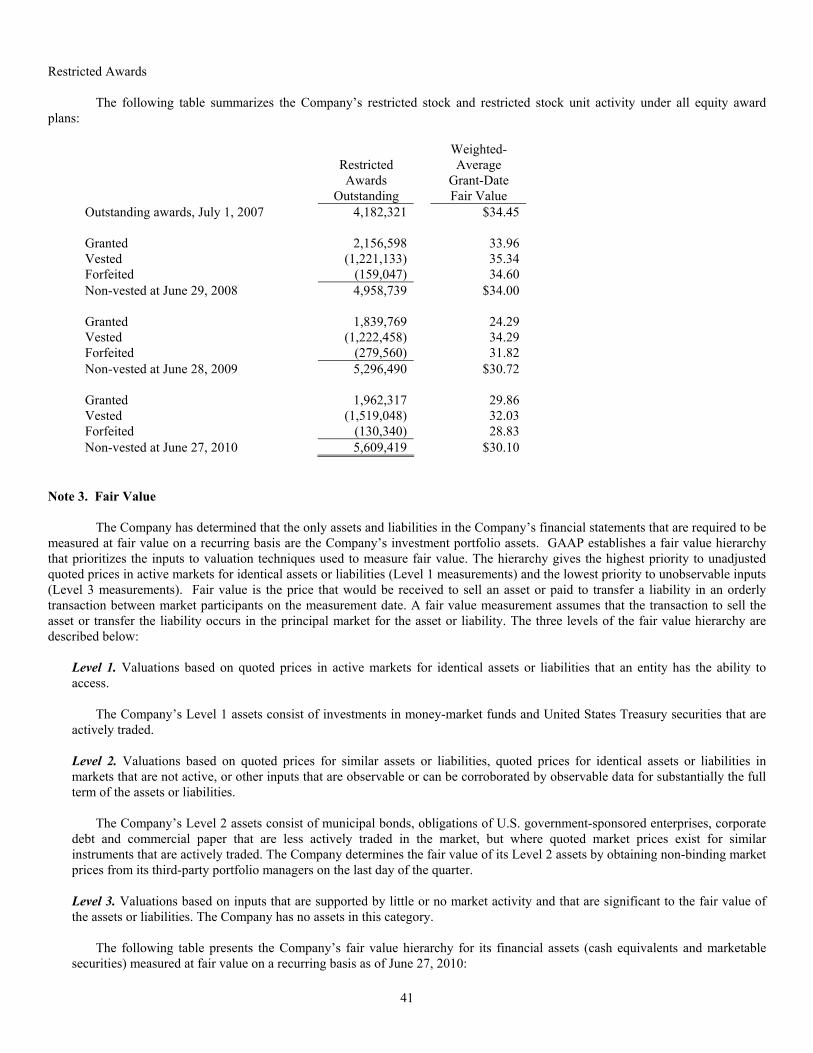
41
Restricted Awards
The following table summarizes the Company’s restricted stock and restricted stock unit activity under all equity award plans:
Restricted Awards
Outstanding
Weighted-Average
Grant-Date Fair Value
Outstanding awards, July 1, 2007 4,182,321 $34.45 Granted 2,156,598 33.96 Vested (1,221,133) 35.34 Forfeited (159,047) 34.60 Non-vested at June 29, 2008 4,958,739 $34.00 Granted 1,839,769 24.29 Vested (1,222,458) 34.29 Forfeited (279,560) 31.82 Non-vested at June 28, 2009 5,296,490 $30.72 Granted 1,962,317 29.86 Vested (1,519,048) 32.03 Forfeited (130,340) 28.83 Non-vested at June 27, 2010 5,609,419 $30.10
Note 3. Fair Value
The Company has determined that the only assets and liabilities in the Company’s financial statements that are required to be measured at fair value on a recurring basis are the Company’s investment portfolio assets. GAAP establishes a fair value hierarchy that prioritizes the inputs to valuation techniques used to measure fair value. The hierarchy gives the highest priority to unadjusted quoted prices in active markets for identical assets or liabilities (Level 1 measurements) and the lowest priority to unobservable inputs (Level 3 measurements). Fair value is the price that would be received to sell an asset or paid to transfer a liability in an orderly transaction between market participants on the measurement date. A fair value measurement assumes that the transaction to sell the asset or transfer the liability occurs in the principal market for the asset or liability. The three levels of the fair value hierarchy are described below:
Level 1. Valuations based on quoted prices in active markets for identical assets or liabilities that an entity has the ability to access.
The Company’s Level 1 assets consist of investments in money-market funds and United States Treasury securities that are
actively traded.
Level 2. Valuations based on quoted prices for similar assets or liabilities, quoted prices for identical assets or liabilities in markets that are not active, or other inputs that are observable or can be corroborated by observable data for substantially the full term of the assets or liabilities.
The Company’s Level 2 assets consist of municipal bonds, obligations of U.S. government-sponsored enterprises, corporate
debt and commercial paper that are less actively traded in the market, but where quoted market prices exist for similar instruments that are actively traded. The Company determines the fair value of its Level 2 assets by obtaining non-binding market prices from its third-party portfolio managers on the last day of the quarter.
Level 3. Valuations based on inputs that are supported by little or no market activity and that are significant to the fair value of the assets or liabilities. The Company has no assets in this category.
The following table presents the Company’s fair value hierarchy for its financial assets (cash equivalents and marketable securities) measured at fair value on a recurring basis as of June 27, 2010:
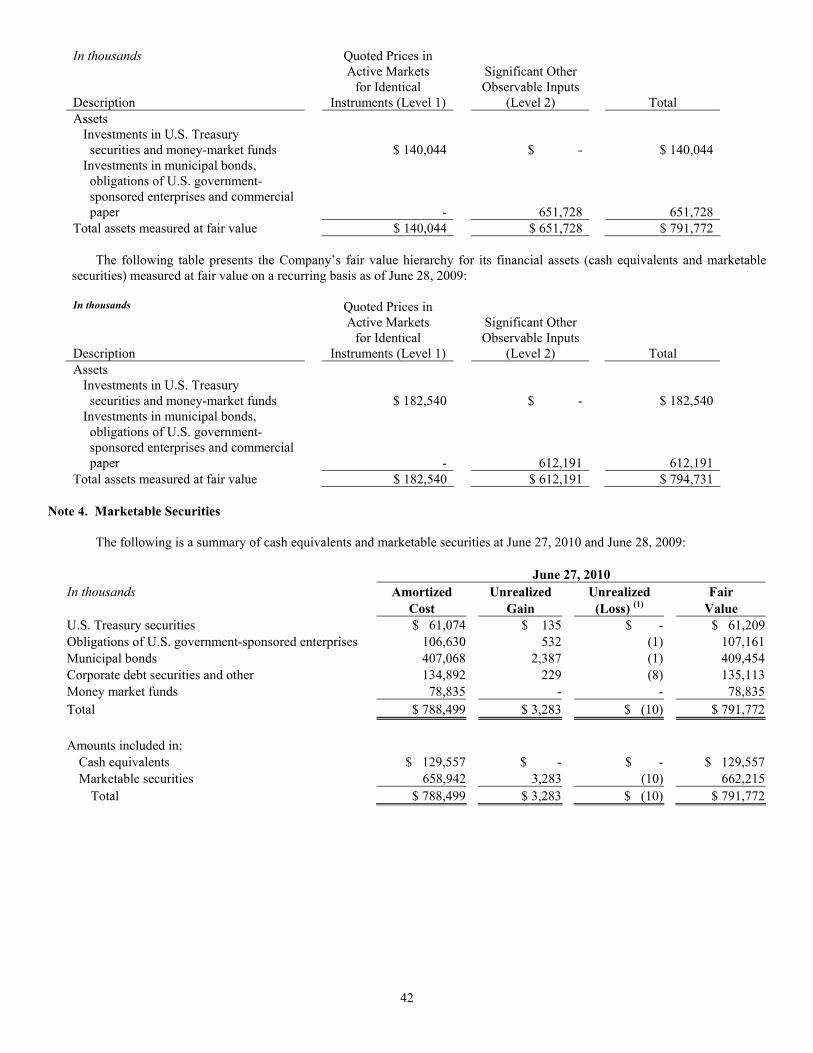
42
In thousands Quoted Prices in Active Markets Significant Other for Identical Observable Inputs Description Instruments (Level 1) (Level 2) Total Assets Investments in U.S. Treasury securities and money-market funds
$ 140,044
$ -
$ 140,044
Investments in municipal bonds, obligations of U.S. government- sponsored enterprises and commercial paper
-
651,728
651,728 Total assets measured at fair value $ 140,044 $ 651,728 $ 791,772
The following table presents the Company’s fair value hierarchy for its financial assets (cash equivalents and marketable
securities) measured at fair value on a recurring basis as of June 28, 2009:
In thousands Quoted Prices in Active Markets Significant Other for Identical Observable Inputs Description Instruments (Level 1) (Level 2) Total Assets Investments in U.S. Treasury securities and money-market funds
$ 182,540
$ -
$ 182,540
Investments in municipal bonds, obligations of U.S. government- sponsored enterprises and commercial paper
-
612,191
612,191 Total assets measured at fair value $ 182,540 $ 612,191 $ 794,731
Note 4. Marketable Securities
The following is a summary of cash equivalents and marketable securities at June 27, 2010 and June 28, 2009:
June 27, 2010 In thousands Amortized Unrealized Unrealized Fair Cost Gain (Loss) (1) Value U.S. Treasury securities $ 61,074 $ 135 $ - $ 61,209Obligations of U.S. government-sponsored enterprises 106,630 532 (1) 107,161Municipal bonds 407,068 2,387 (1) 409,454Corporate debt securities and other 134,892 229 (8) 135,113Money market funds 78,835 - - 78,835Total $ 788,499 $ 3,283 $ (10) $ 791,772
Amounts included in:
Cash equivalents $ 129,557 $ - $ - $ 129,557Marketable securities 658,942 3,283 (10) 662,215
Total $ 788,499 $ 3,283 $ (10) $ 791,772
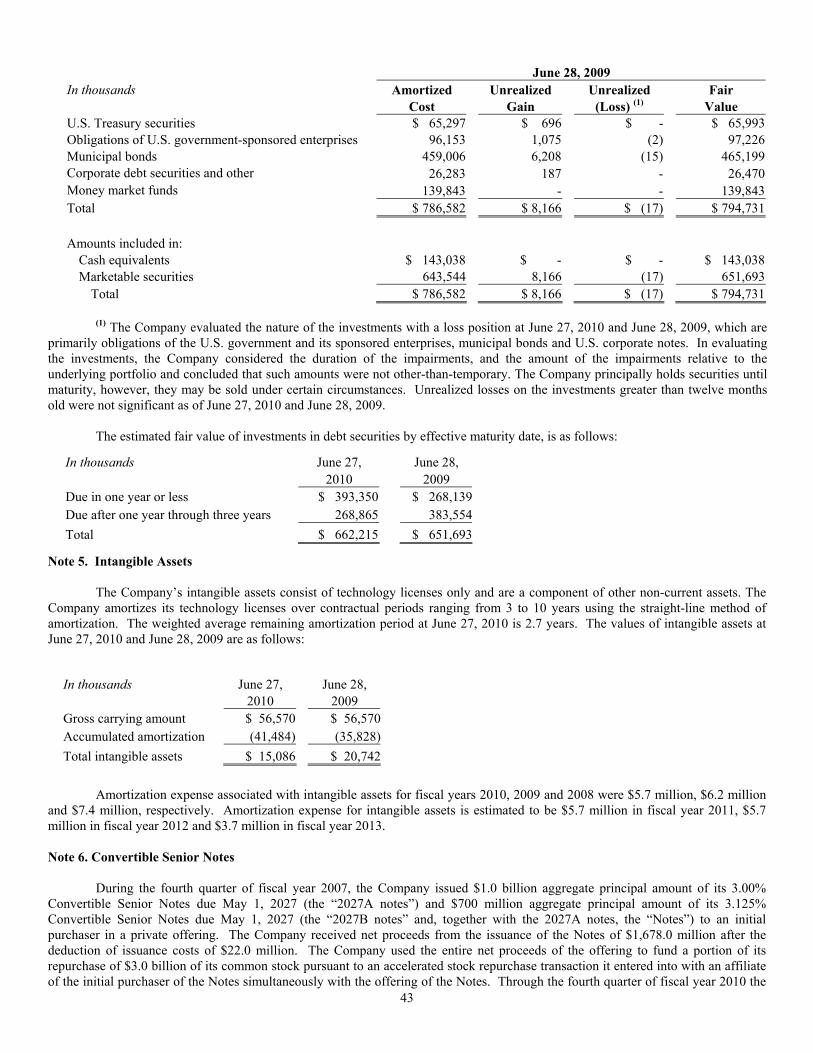
43
June 28, 2009 In thousands Amortized Unrealized Unrealized Fair Cost Gain (Loss) (1) Value U.S. Treasury securities $ 65,297 $ 696 $ - $ 65,993Obligations of U.S. government-sponsored enterprises 96,153 1,075 (2) 97,226Municipal bonds 459,006 6,208 (15) 465,199Corporate debt securities and other 26,283 187 - 26,470Money market funds 139,843 - - 139,843Total $ 786,582 $ 8,166 $ (17) $ 794,731
Amounts included in:
Cash equivalents $ 143,038 $ - $ - $ 143,038Marketable securities 643,544 8,166 (17) 651,693
Total $ 786,582 $ 8,166 $ (17) $ 794,731
(1) The Company evaluated the nature of the investments with a loss position at June 27, 2010 and June 28, 2009, which are primarily obligations of the U.S. government and its sponsored enterprises, municipal bonds and U.S. corporate notes. In evaluating the investments, the Company considered the duration of the impairments, and the amount of the impairments relative to the underlying portfolio and concluded that such amounts were not other-than-temporary. The Company principally holds securities until maturity, however, they may be sold under certain circumstances. Unrealized losses on the investments greater than twelve months old were not significant as of June 27, 2010 and June 28, 2009.
The estimated fair value of investments in debt securities by effective maturity date, is as follows:
Note 5. Intangible Assets
The Company’s intangible assets consist of technology licenses only and are a component of other non-current assets. The Company amortizes its technology licenses over contractual periods ranging from 3 to 10 years using the straight-line method of amortization. The weighted average remaining amortization period at June 27, 2010 is 2.7 years. The values of intangible assets at June 27, 2010 and June 28, 2009 are as follows:
Amortization expense associated with intangible assets for fiscal years 2010, 2009 and 2008 were $5.7 million, $6.2 million
and $7.4 million, respectively. Amortization expense for intangible assets is estimated to be $5.7 million in fiscal year 2011, $5.7 million in fiscal year 2012 and $3.7 million in fiscal year 2013.
Note 6. Convertible Senior Notes
During the fourth quarter of fiscal year 2007, the Company issued $1.0 billion aggregate principal amount of its 3.00%
Convertible Senior Notes due May 1, 2027 (the “2027A notes”) and $700 million aggregate principal amount of its 3.125% Convertible Senior Notes due May 1, 2027 (the “2027B notes” and, together with the 2027A notes, the “Notes”) to an initial purchaser in a private offering. The Company received net proceeds from the issuance of the Notes of $1,678.0 million after the deduction of issuance costs of $22.0 million. The Company used the entire net proceeds of the offering to fund a portion of its repurchase of $3.0 billion of its common stock pursuant to an accelerated stock repurchase transaction it entered into with an affiliate of the initial purchaser of the Notes simultaneously with the offering of the Notes. Through the fourth quarter of fiscal year 2010 the
In thousands June 27, June 28, 2010 2009 Due in one year or less $ 393,350 $ 268,139Due after one year through three years 268,865 383,554
Total $ 662,215 $ 651,693
In thousands June 27, June 28, 2010 2009 Gross carrying amount $ 56,570 $ 56,570Accumulated amortization (41,484) (35,828)
Total intangible assets $ 15,086 $ 20,742
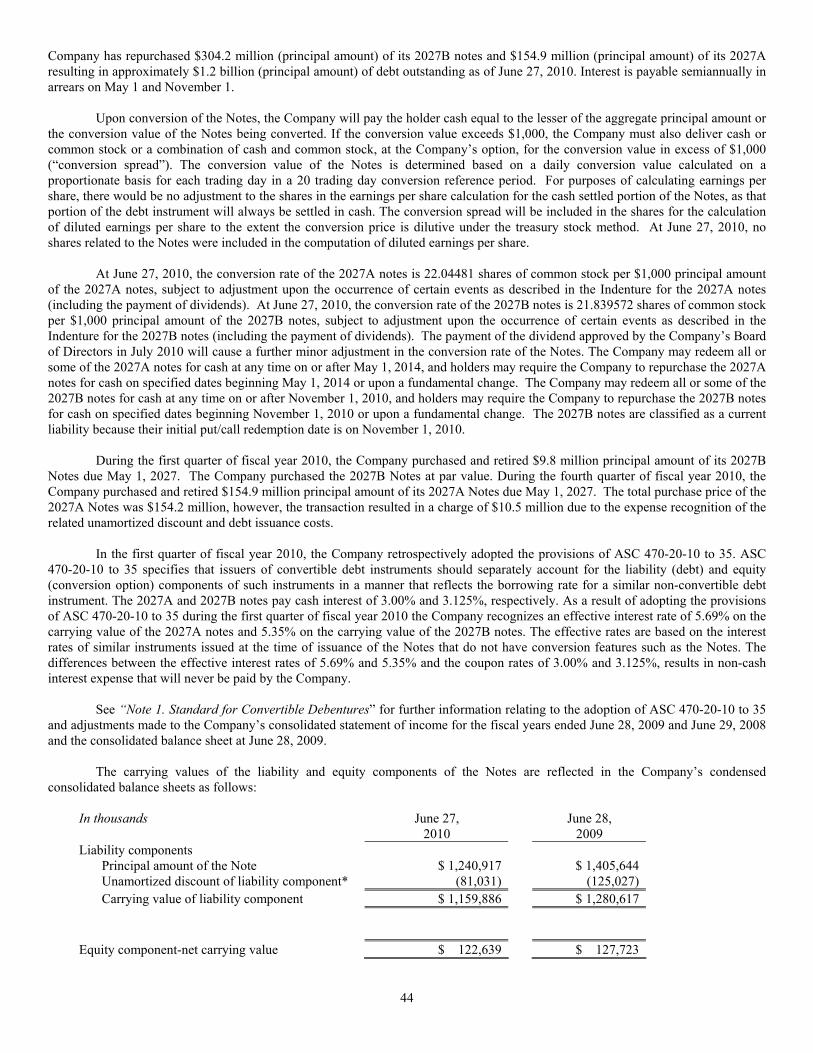
44
Company has repurchased $304.2 million (principal amount) of its 2027B notes and $154.9 million (principal amount) of its 2027A resulting in approximately $1.2 billion (principal amount) of debt outstanding as of June 27, 2010. Interest is payable semiannually in arrears on May 1 and November 1.
Upon conversion of the Notes, the Company will pay the holder cash equal to the lesser of the aggregate principal amount or
the conversion value of the Notes being converted. If the conversion value exceeds $1,000, the Company must also deliver cash or common stock or a combination of cash and common stock, at the Company’s option, for the conversion value in excess of $1,000 (“conversion spread”). The conversion value of the Notes is determined based on a daily conversion value calculated on a proportionate basis for each trading day in a 20 trading day conversion reference period. For purposes of calculating earnings per share, there would be no adjustment to the shares in the earnings per share calculation for the cash settled portion of the Notes, as that portion of the debt instrument will always be settled in cash. The conversion spread will be included in the shares for the calculation of diluted earnings per share to the extent the conversion price is dilutive under the treasury stock method. At June 27, 2010, no shares related to the Notes were included in the computation of diluted earnings per share.
At June 27, 2010, the conversion rate of the 2027A notes is 22.04481 shares of common stock per $1,000 principal amount
of the 2027A notes, subject to adjustment upon the occurrence of certain events as described in the Indenture for the 2027A notes (including the payment of dividends). At June 27, 2010, the conversion rate of the 2027B notes is 21.839572 shares of common stock per $1,000 principal amount of the 2027B notes, subject to adjustment upon the occurrence of certain events as described in the Indenture for the 2027B notes (including the payment of dividends). The payment of the dividend approved by the Company’s Board of Directors in July 2010 will cause a further minor adjustment in the conversion rate of the Notes. The Company may redeem all or some of the 2027A notes for cash at any time on or after May 1, 2014, and holders may require the Company to repurchase the 2027A notes for cash on specified dates beginning May 1, 2014 or upon a fundamental change. The Company may redeem all or some of the 2027B notes for cash at any time on or after November 1, 2010, and holders may require the Company to repurchase the 2027B notes for cash on specified dates beginning November 1, 2010 or upon a fundamental change. The 2027B notes are classified as a current liability because their initial put/call redemption date is on November 1, 2010.
During the first quarter of fiscal year 2010, the Company purchased and retired $9.8 million principal amount of its 2027B
Notes due May 1, 2027. The Company purchased the 2027B Notes at par value. During the fourth quarter of fiscal year 2010, the Company purchased and retired $154.9 million principal amount of its 2027A Notes due May 1, 2027. The total purchase price of the 2027A Notes was $154.2 million, however, the transaction resulted in a charge of $10.5 million due to the expense recognition of the related unamortized discount and debt issuance costs.
In the first quarter of fiscal year 2010, the Company retrospectively adopted the provisions of ASC 470-20-10 to 35. ASC
470-20-10 to 35 specifies that issuers of convertible debt instruments should separately account for the liability (debt) and equity (conversion option) components of such instruments in a manner that reflects the borrowing rate for a similar non-convertible debt instrument. The 2027A and 2027B notes pay cash interest of 3.00% and 3.125%, respectively. As a result of adopting the provisions of ASC 470-20-10 to 35 during the first quarter of fiscal year 2010 the Company recognizes an effective interest rate of 5.69% on the carrying value of the 2027A notes and 5.35% on the carrying value of the 2027B notes. The effective rates are based on the interest rates of similar instruments issued at the time of issuance of the Notes that do not have conversion features such as the Notes. The differences between the effective interest rates of 5.69% and 5.35% and the coupon rates of 3.00% and 3.125%, results in non-cash interest expense that will never be paid by the Company.
See “Note 1. Standard for Convertible Debentures” for further information relating to the adoption of ASC 470-20-10 to 35
and adjustments made to the Company’s consolidated statement of income for the fiscal years ended June 28, 2009 and June 29, 2008 and the consolidated balance sheet at June 28, 2009.
The carrying values of the liability and equity components of the Notes are reflected in the Company’s condensed consolidated balance sheets as follows:
In thousands June 27, June 28, 2010 2009 Liability components Principal amount of the Note $ 1,240,917 $ 1,405,644 Unamortized discount of liability component* (81,031) (125,027) Carrying value of liability component $ 1,159,886 $ 1,280,617 Equity component-net carrying value $ 122,639 $ 127,723
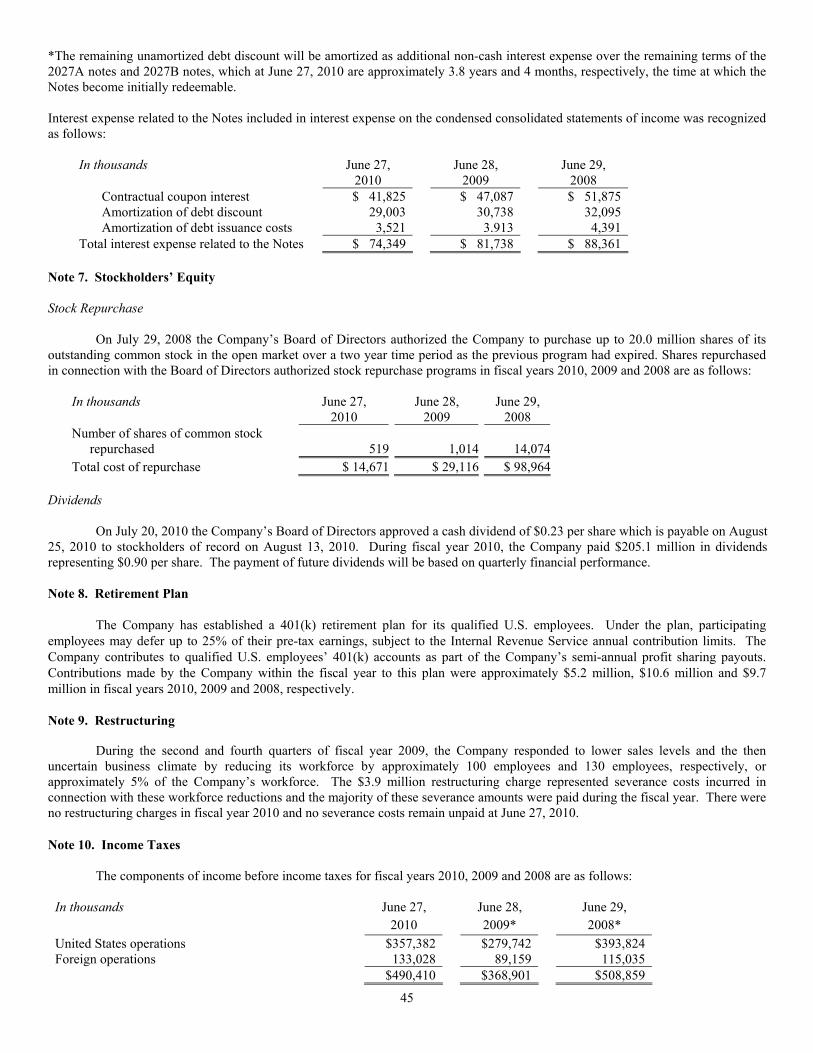
45
*The remaining unamortized debt discount will be amortized as additional non-cash interest expense over the remaining terms of the 2027A notes and 2027B notes, which at June 27, 2010 are approximately 3.8 years and 4 months, respectively, the time at which the Notes become initially redeemable. Interest expense related to the Notes included in interest expense on the condensed consolidated statements of income was recognized as follows:
In thousands June 27, June 28, June 29, 2010 2009 2008 Contractual coupon interest $ 41,825 $ 47,087 $ 51,875 Amortization of debt discount 29,003 30,738 32,095 Amortization of debt issuance costs 3,521 3.913 4,391 Total interest expense related to the Notes $ 74,349 $ 81,738 $ 88,361
Note 7. Stockholders’ Equity
Stock Repurchase
On July 29, 2008 the Company’s Board of Directors authorized the Company to purchase up to 20.0 million shares of its
outstanding common stock in the open market over a two year time period as the previous program had expired. Shares repurchased in connection with the Board of Directors authorized stock repurchase programs in fiscal years 2010, 2009 and 2008 are as follows:
In thousands June 27, June 28, June 29, 2010 2009 2008 Number of shares of common stock
repurchased 519 1,014 14,074Total cost of repurchase $ 14,671 $ 29,116 $ 98,964
Dividends
On July 20, 2010 the Company’s Board of Directors approved a cash dividend of $0.23 per share which is payable on August
25, 2010 to stockholders of record on August 13, 2010. During fiscal year 2010, the Company paid $205.1 million in dividends representing $0.90 per share. The payment of future dividends will be based on quarterly financial performance. Note 8. Retirement Plan The Company has established a 401(k) retirement plan for its qualified U.S. employees. Under the plan, participating employees may defer up to 25% of their pre-tax earnings, subject to the Internal Revenue Service annual contribution limits. The Company contributes to qualified U.S. employees’ 401(k) accounts as part of the Company’s semi-annual profit sharing payouts. Contributions made by the Company within the fiscal year to this plan were approximately $5.2 million, $10.6 million and $9.7 million in fiscal years 2010, 2009 and 2008, respectively. Note 9. Restructuring
During the second and fourth quarters of fiscal year 2009, the Company responded to lower sales levels and the then
uncertain business climate by reducing its workforce by approximately 100 employees and 130 employees, respectively, or approximately 5% of the Company’s workforce. The $3.9 million restructuring charge represented severance costs incurred in connection with these workforce reductions and the majority of these severance amounts were paid during the fiscal year. There were no restructuring charges in fiscal year 2010 and no severance costs remain unpaid at June 27, 2010. Note 10. Income Taxes The components of income before income taxes for fiscal years 2010, 2009 and 2008 are as follows:
In thousands June 27, June 28, June 29, 2010 2009* 2008*
United States operations $357,382 $279,742 $393,824 Foreign operations 133,028 89,159 115,035 $490,410 $368,901 $508,859
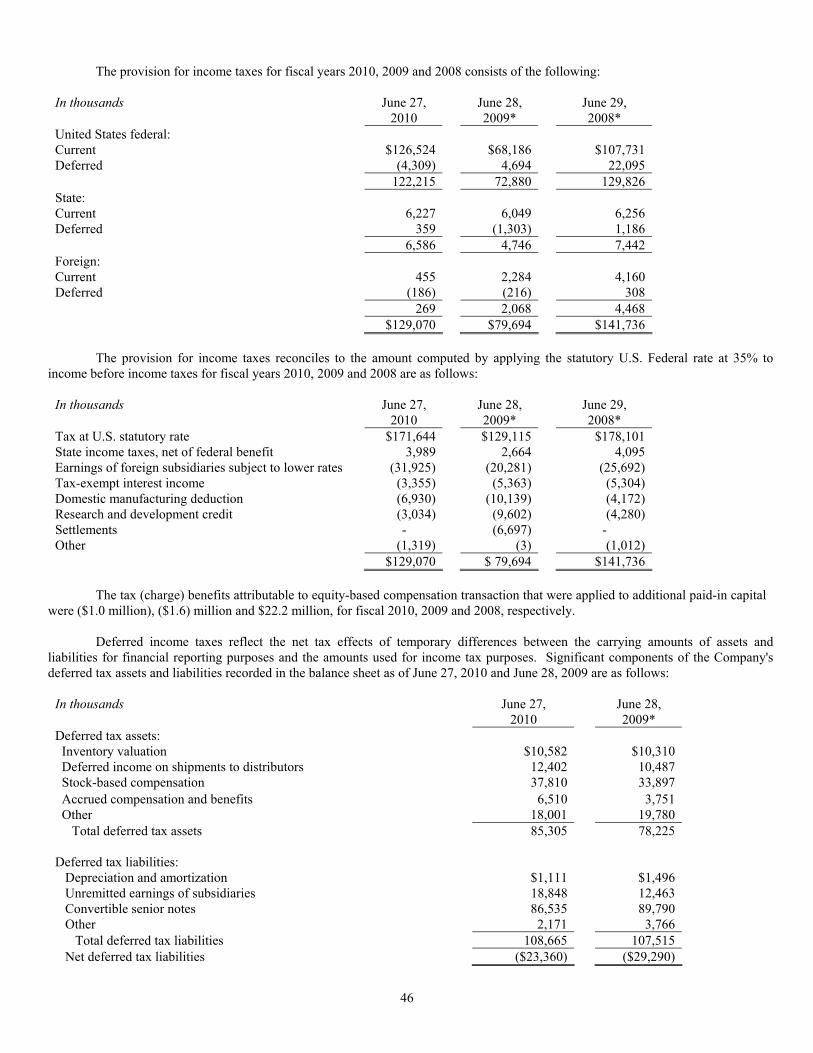
46
The provision for income taxes for fiscal years 2010, 2009 and 2008 consists of the following:
In thousands June 27, June 28, June 29, 2010 2009* 2008* United States federal: Current $126,524 $68,186 $107,731 Deferred (4,309) 4,694 22,095 122,215 72,880 129,826 State: Current 6,227 6,049 6,256 Deferred 359 (1,303) 1,186 6,586 4,746 7,442 Foreign: Current 455 2,284 4,160 Deferred (186) (216) 308 269 2,068 4,468 $129,070 $79,694 $141,736
The provision for income taxes reconciles to the amount computed by applying the statutory U.S. Federal rate at 35% to
income before income taxes for fiscal years 2010, 2009 and 2008 are as follows:
In thousands June 27, June 28, June 29, 2010 2009* 2008* Tax at U.S. statutory rate $171,644 $129,115 $178,101 State income taxes, net of federal benefit 3,989 2,664 4,095 Earnings of foreign subsidiaries subject to lower rates (31,925) (20,281) (25,692) Tax-exempt interest income (3,355) (5,363) (5,304) Domestic manufacturing deduction (6,930) (10,139) (4,172) Research and development credit (3,034) (9,602) (4,280) Settlements - (6,697) - Other (1,319) (3) (1,012) $129,070 $ 79,694 $141,736
The tax (charge) benefits attributable to equity-based compensation transaction that were applied to additional paid-in capital
were ($1.0 million), ($1.6) million and $22.2 million, for fiscal 2010, 2009 and 2008, respectively. Deferred income taxes reflect the net tax effects of temporary differences between the carrying amounts of assets and liabilities for financial reporting purposes and the amounts used for income tax purposes. Significant components of the Company's deferred tax assets and liabilities recorded in the balance sheet as of June 27, 2010 and June 28, 2009 are as follows:
In thousands June 27, June 28, 2010 2009* Deferred tax assets: Inventory valuation $10,582 $10,310 Deferred income on shipments to distributors 12,402 10,487 Stock-based compensation 37,810 33,897 Accrued compensation and benefits 6,510 3,751 Other 18,001 19,780 Total deferred tax assets 85,305 78,225 Deferred tax liabilities: Depreciation and amortization $1,111 $1,496 Unremitted earnings of subsidiaries 18,848 12,463 Convertible senior notes 86,535 89,790 Other 2,171 3,766 Total deferred tax liabilities 108,665 107,515 Net deferred tax liabilities ($23,360) ($29,290)
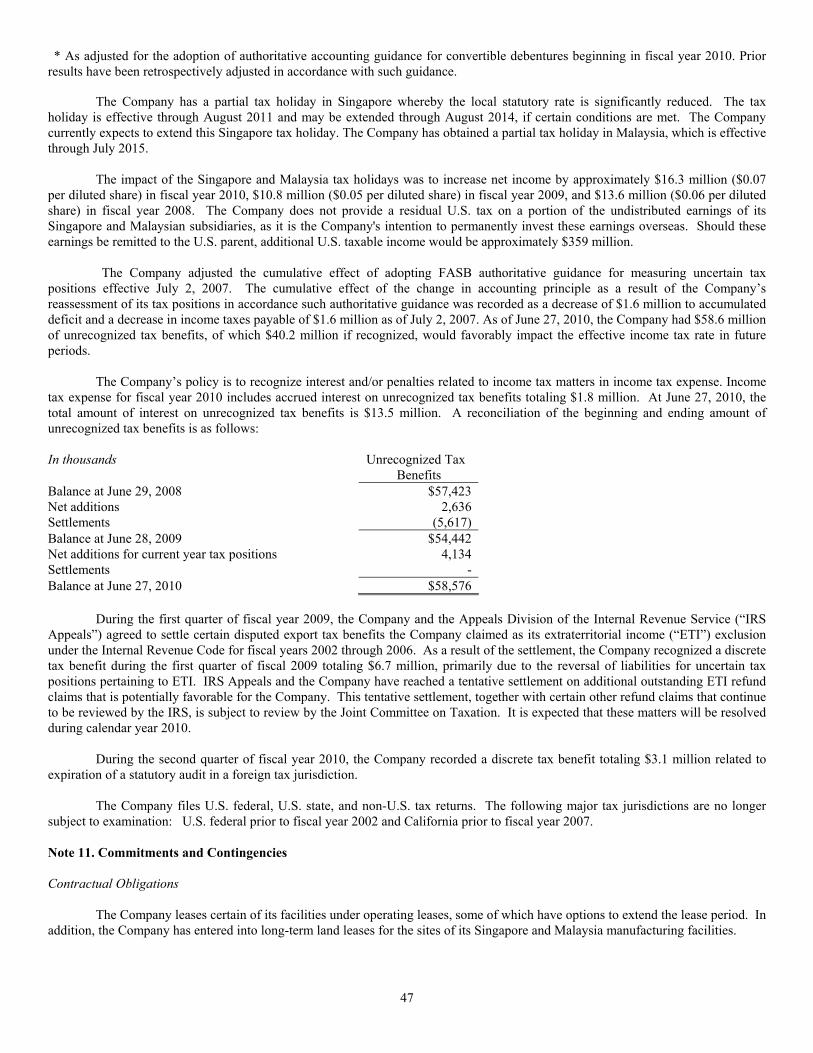
47
* As adjusted for the adoption of authoritative accounting guidance for convertible debentures beginning in fiscal year 2010. Prior results have been retrospectively adjusted in accordance with such guidance.
The Company has a partial tax holiday in Singapore whereby the local statutory rate is significantly reduced. The tax holiday is effective through August 2011 and may be extended through August 2014, if certain conditions are met. The Company currently expects to extend this Singapore tax holiday. The Company has obtained a partial tax holiday in Malaysia, which is effective through July 2015.
The impact of the Singapore and Malaysia tax holidays was to increase net income by approximately $16.3 million ($0.07
per diluted share) in fiscal year 2010, $10.8 million ($0.05 per diluted share) in fiscal year 2009, and $13.6 million ($0.06 per diluted share) in fiscal year 2008. The Company does not provide a residual U.S. tax on a portion of the undistributed earnings of its Singapore and Malaysian subsidiaries, as it is the Company's intention to permanently invest these earnings overseas. Should these earnings be remitted to the U.S. parent, additional U.S. taxable income would be approximately $359 million.
The Company adjusted the cumulative effect of adopting FASB authoritative guidance for measuring uncertain tax
positions effective July 2, 2007. The cumulative effect of the change in accounting principle as a result of the Company’s reassessment of its tax positions in accordance such authoritative guidance was recorded as a decrease of $1.6 million to accumulated deficit and a decrease in income taxes payable of $1.6 million as of July 2, 2007. As of June 27, 2010, the Company had $58.6 million of unrecognized tax benefits, of which $40.2 million if recognized, would favorably impact the effective income tax rate in future periods.
The Company’s policy is to recognize interest and/or penalties related to income tax matters in income tax expense. Income
tax expense for fiscal year 2010 includes accrued interest on unrecognized tax benefits totaling $1.8 million. At June 27, 2010, the total amount of interest on unrecognized tax benefits is $13.5 million. A reconciliation of the beginning and ending amount of unrecognized tax benefits is as follows:
In thousands Unrecognized Tax Benefits Balance at June 29, 2008 $57,423 Net additions 2,636 Settlements (5,617) Balance at June 28, 2009 $54,442 Net additions for current year tax positions 4,134 Settlements - Balance at June 27, 2010 $58,576
During the first quarter of fiscal year 2009, the Company and the Appeals Division of the Internal Revenue Service (“IRS
Appeals”) agreed to settle certain disputed export tax benefits the Company claimed as its extraterritorial income (“ETI”) exclusion under the Internal Revenue Code for fiscal years 2002 through 2006. As a result of the settlement, the Company recognized a discrete tax benefit during the first quarter of fiscal 2009 totaling $6.7 million, primarily due to the reversal of liabilities for uncertain tax positions pertaining to ETI. IRS Appeals and the Company have reached a tentative settlement on additional outstanding ETI refund claims that is potentially favorable for the Company. This tentative settlement, together with certain other refund claims that continue to be reviewed by the IRS, is subject to review by the Joint Committee on Taxation. It is expected that these matters will be resolved during calendar year 2010.
During the second quarter of fiscal year 2010, the Company recorded a discrete tax benefit totaling $3.1 million related to
expiration of a statutory audit in a foreign tax jurisdiction.
The Company files U.S. federal, U.S. state, and non-U.S. tax returns. The following major tax jurisdictions are no longer subject to examination: U.S. federal prior to fiscal year 2002 and California prior to fiscal year 2007. Note 11. Commitments and Contingencies Contractual Obligations
The Company leases certain of its facilities under operating leases, some of which have options to extend the lease period. In addition, the Company has entered into long-term land leases for the sites of its Singapore and Malaysia manufacturing facilities.
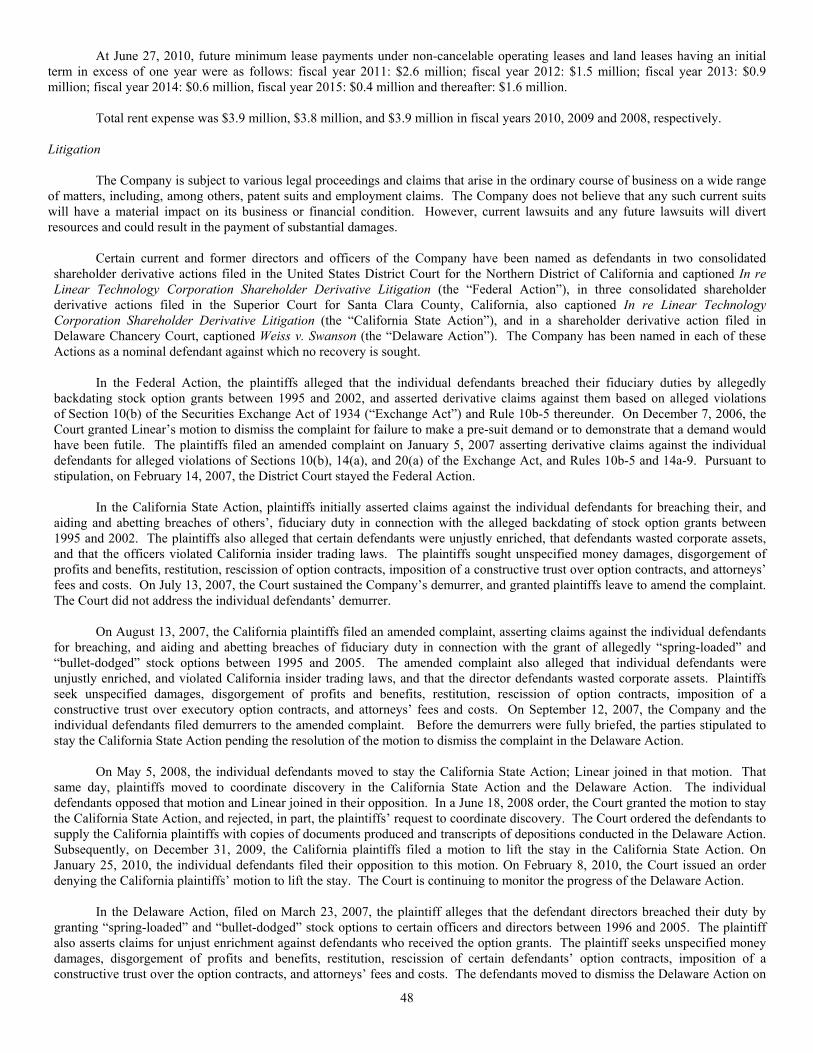
48
At June 27, 2010, future minimum lease payments under non-cancelable operating leases and land leases having an initial term in excess of one year were as follows: fiscal year 2011: $2.6 million; fiscal year 2012: $1.5 million; fiscal year 2013: $0.9 million; fiscal year 2014: $0.6 million, fiscal year 2015: $0.4 million and thereafter: $1.6 million.
Total rent expense was $3.9 million, $3.8 million, and $3.9 million in fiscal years 2010, 2009 and 2008, respectively. Litigation
The Company is subject to various legal proceedings and claims that arise in the ordinary course of business on a wide range of matters, including, among others, patent suits and employment claims. The Company does not believe that any such current suits will have a material impact on its business or financial condition. However, current lawsuits and any future lawsuits will divert resources and could result in the payment of substantial damages.
Certain current and former directors and officers of the Company have been named as defendants in two consolidated
shareholder derivative actions filed in the United States District Court for the Northern District of California and captioned In re Linear Technology Corporation Shareholder Derivative Litigation (the “Federal Action”), in three consolidated shareholder derivative actions filed in the Superior Court for Santa Clara County, California, also captioned In re Linear Technology Corporation Shareholder Derivative Litigation (the “California State Action”), and in a shareholder derivative action filed in Delaware Chancery Court, captioned Weiss v. Swanson (the “Delaware Action”). The Company has been named in each of these Actions as a nominal defendant against which no recovery is sought.
In the Federal Action, the plaintiffs alleged that the individual defendants breached their fiduciary duties by allegedly
backdating stock option grants between 1995 and 2002, and asserted derivative claims against them based on alleged violations of Section 10(b) of the Securities Exchange Act of 1934 (“Exchange Act”) and Rule 10b-5 thereunder. On December 7, 2006, the Court granted Linear’s motion to dismiss the complaint for failure to make a pre-suit demand or to demonstrate that a demand would have been futile. The plaintiffs filed an amended complaint on January 5, 2007 asserting derivative claims against the individual defendants for alleged violations of Sections 10(b), 14(a), and 20(a) of the Exchange Act, and Rules 10b-5 and 14a-9. Pursuant to stipulation, on February 14, 2007, the District Court stayed the Federal Action.
In the California State Action, plaintiffs initially asserted claims against the individual defendants for breaching their, and
aiding and abetting breaches of others’, fiduciary duty in connection with the alleged backdating of stock option grants between 1995 and 2002. The plaintiffs also alleged that certain defendants were unjustly enriched, that defendants wasted corporate assets, and that the officers violated California insider trading laws. The plaintiffs sought unspecified money damages, disgorgement of profits and benefits, restitution, rescission of option contracts, imposition of a constructive trust over option contracts, and attorneys’ fees and costs. On July 13, 2007, the Court sustained the Company’s demurrer, and granted plaintiffs leave to amend the complaint. The Court did not address the individual defendants’ demurrer.
On August 13, 2007, the California plaintiffs filed an amended complaint, asserting claims against the individual defendants
for breaching, and aiding and abetting breaches of fiduciary duty in connection with the grant of allegedly “spring-loaded” and “bullet-dodged” stock options between 1995 and 2005. The amended complaint also alleged that individual defendants were unjustly enriched, and violated California insider trading laws, and that the director defendants wasted corporate assets. Plaintiffs seek unspecified damages, disgorgement of profits and benefits, restitution, rescission of option contracts, imposition of a constructive trust over executory option contracts, and attorneys’ fees and costs. On September 12, 2007, the Company and the individual defendants filed demurrers to the amended complaint. Before the demurrers were fully briefed, the parties stipulated to stay the California State Action pending the resolution of the motion to dismiss the complaint in the Delaware Action.
On May 5, 2008, the individual defendants moved to stay the California State Action; Linear joined in that motion. That
same day, plaintiffs moved to coordinate discovery in the California State Action and the Delaware Action. The individual defendants opposed that motion and Linear joined in their opposition. In a June 18, 2008 order, the Court granted the motion to stay the California State Action, and rejected, in part, the plaintiffs’ request to coordinate discovery. The Court ordered the defendants to supply the California plaintiffs with copies of documents produced and transcripts of depositions conducted in the Delaware Action. Subsequently, on December 31, 2009, the California plaintiffs filed a motion to lift the stay in the California State Action. On January 25, 2010, the individual defendants filed their opposition to this motion. On February 8, 2010, the Court issued an order denying the California plaintiffs’ motion to lift the stay. The Court is continuing to monitor the progress of the Delaware Action.
In the Delaware Action, filed on March 23, 2007, the plaintiff alleges that the defendant directors breached their duty by
granting “spring-loaded” and “bullet-dodged” stock options to certain officers and directors between 1996 and 2005. The plaintiff also asserts claims for unjust enrichment against defendants who received the option grants. The plaintiff seeks unspecified money damages, disgorgement of profits and benefits, restitution, rescission of certain defendants’ option contracts, imposition of a constructive trust over the option contracts, and attorneys’ fees and costs. The defendants moved to dismiss the Delaware Action on
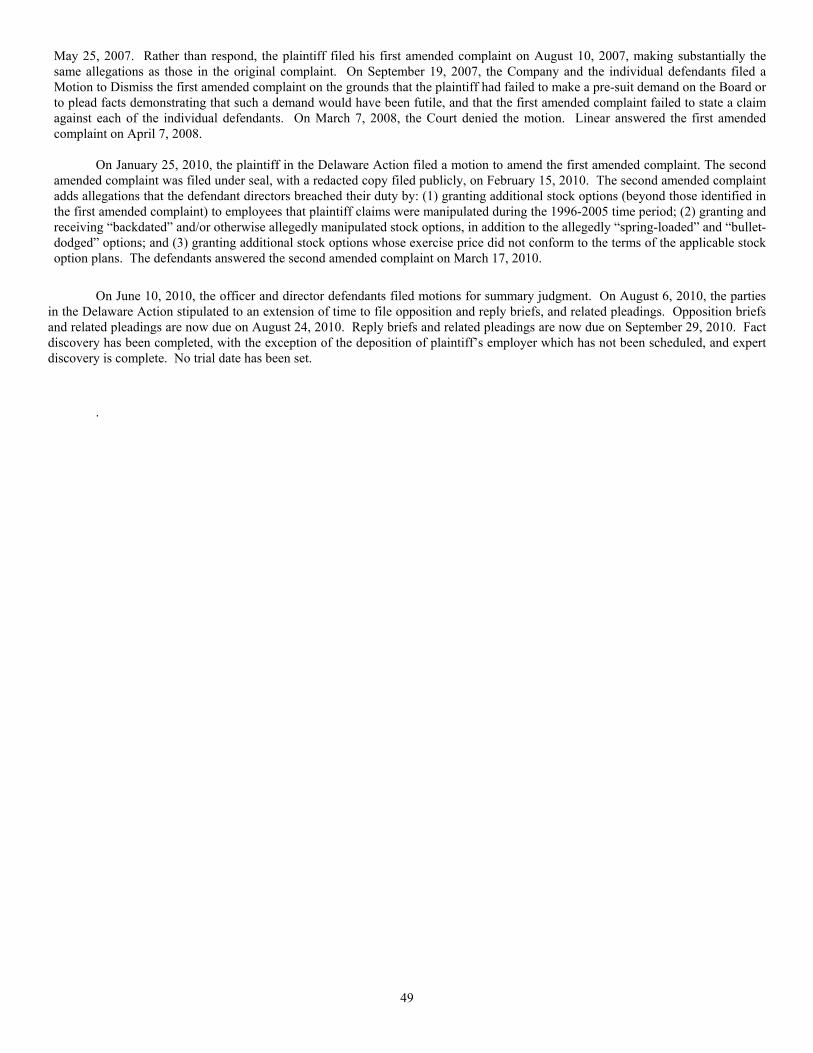
49
May 25, 2007. Rather than respond, the plaintiff filed his first amended complaint on August 10, 2007, making substantially the same allegations as those in the original complaint. On September 19, 2007, the Company and the individual defendants filed a Motion to Dismiss the first amended complaint on the grounds that the plaintiff had failed to make a pre-suit demand on the Board or to plead facts demonstrating that such a demand would have been futile, and that the first amended complaint failed to state a claim against each of the individual defendants. On March 7, 2008, the Court denied the motion. Linear answered the first amended complaint on April 7, 2008.
On January 25, 2010, the plaintiff in the Delaware Action filed a motion to amend the first amended complaint. The second
amended complaint was filed under seal, with a redacted copy filed publicly, on February 15, 2010. The second amended complaint adds allegations that the defendant directors breached their duty by: (1) granting additional stock options (beyond those identified in the first amended complaint) to employees that plaintiff claims were manipulated during the 1996-2005 time period; (2) granting and receiving “backdated” and/or otherwise allegedly manipulated stock options, in addition to the allegedly “spring-loaded” and “bullet-dodged” options; and (3) granting additional stock options whose exercise price did not conform to the terms of the applicable stock option plans. The defendants answered the second amended complaint on March 17, 2010.
On June 10, 2010, the officer and director defendants filed motions for summary judgment. On August 6, 2010, the parties in the Delaware Action stipulated to an extension of time to file opposition and reply briefs, and related pleadings. Opposition briefs and related pleadings are now due on August 24, 2010. Reply briefs and related pleadings are now due on September 29, 2010. Fact discovery has been completed, with the exception of the deposition of plaintiff’s employer which has not been scheduled, and expert discovery is complete. No trial date has been set.
.
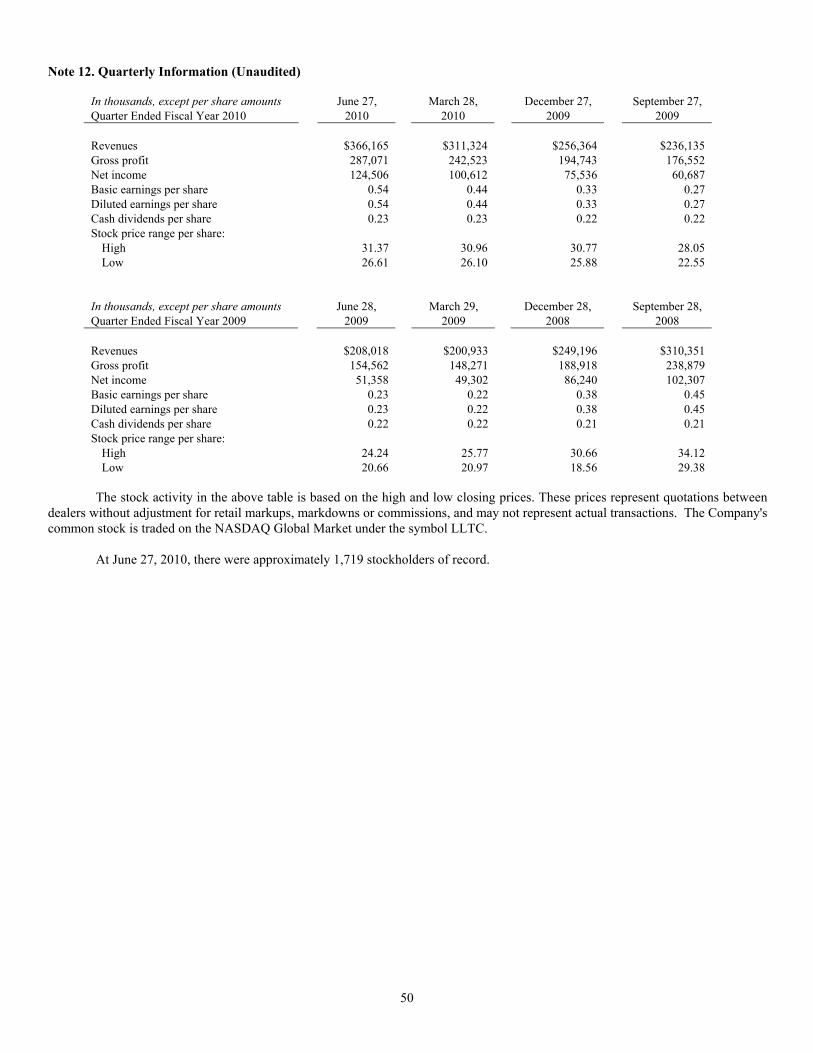
50
Note 12. Quarterly Information (Unaudited)
In thousands, except per share amounts June 27, March 28, December 27, September 27, Quarter Ended Fiscal Year 2010 2010 2010 2009 2009 Revenues $366,165 $311,324 $256,364 $236,135 Gross profit 287,071 242,523 194,743 176,552 Net income 124,506 100,612 75,536 60,687 Basic earnings per share 0.54 0.44 0.33 0.27 Diluted earnings per share 0.54 0.44 0.33 0.27 Cash dividends per share 0.23 0.23 0.22 0.22 Stock price range per share:
High 31.37 30.96 30.77 28.05 Low 26.61 26.10 25.88 22.55
In thousands, except per share amounts June 28, March 29, December 28, September 28, Quarter Ended Fiscal Year 2009 2009 2009 2008 2008 Revenues $208,018 $200,933 $249,196 $310,351 Gross profit 154,562 148,271 188,918 238,879 Net income 51,358 49,302 86,240 102,307 Basic earnings per share 0.23 0.22 0.38 0.45 Diluted earnings per share 0.23 0.22 0.38 0.45 Cash dividends per share 0.22 0.22 0.21 0.21 Stock price range per share:
High 24.24 25.77 30.66 34.12 Low 20.66 20.97 18.56 29.38
The stock activity in the above table is based on the high and low closing prices. These prices represent quotations between
dealers without adjustment for retail markups, markdowns or commissions, and may not represent actual transactions. The Company's common stock is traded on the NASDAQ Global Market under the symbol LLTC.
At June 27, 2010, there were approximately 1,719 stockholders of record.
51
REPORT OF INDEPENDENT REGISTERED PUBLIC ACCOUNTING FIRM The Board of Directors and Shareholders of Linear Technology Corporation We have audited the accompanying consolidated balance sheets of Linear Technology Corporation as of June 27, 2010 and June 28, 2009, and the related consolidated statements of income, stockholders' equity (deficit) and cash flows for each of the three fiscal years in the period ended June 27, 2010. Our audits also included the financial statement schedule listed in the Index at Item 15(a)2. These financial statements and schedule are the responsibility of the Company's management. Our responsibility is to express an opinion on these financial statements and schedule based on our audits. We conducted our audits in accordance with the standards of the Public Company Accounting Oversight Board (United States). Those standards require that we plan and perform the audit to obtain reasonable assurance about whether the financial statements are free of material misstatement. An audit includes examining, on a test basis, evidence supporting the amounts and disclosures in the financial statements. An audit also includes assessing the accounting principles used and significant estimates made by management, as well as evaluating the overall financial statement presentation. We believe that our audits provide a reasonable basis for our opinion. In our opinion, the consolidated financial statements referred to above present fairly, in all material respects, the consolidated financial position of Linear Technology Corporation as of June 27, 2010 and June 28, 2009, and the consolidated results of its operations and its cash flows for each of the three fiscal years in the period ended June 27, 2010, in conformity with U.S. generally accepted accounting principles. Also, in our opinion, the related financial statement schedule, when considered in relation to the basic financial statements taken as a whole, presents fairly in all material respects the information set forth therein. We also have audited, in accordance with the standards of the Public Company Accounting Oversight Board (United States), Linear Technology Corporation’s internal control over financial reporting as of June 27, 2010, based on criteria established in Internal Control-Integrated Framework issued by the Committee of Sponsoring Organizations of the Treadway Commission and our report dated August 19, 2010 expressed an unqualified opinion thereon.
/s/Ernst & Young LLP
San Jose, California August 19, 2010
52
REPORT OF INDEPENDENT REGISTERED PUBLIC ACCOUNTING FIRM The Board of Directors and Shareholders of Linear Technology Corporation We have audited Linear Technology Corporation’s internal control over financial reporting as of June 27, 2010, based on criteria established in Internal Control—Integrated Framework issued by the Committee of Sponsoring Organizations of the Treadway Commission (the COSO criteria). Linear Technology Corporation’s management is responsible for maintaining effective internal control over financial reporting, and for its assessment of the effectiveness of internal control over financial reporting included in the accompanying Management’s Report on Internal Control Over Financial Reporting. Our responsibility is to express an opinion on the company’s internal control over financial reporting based on our audit. We conducted our audit in accordance with the standards of the Public Company Accounting Oversight Board (United States). Those standards require that we plan and perform the audit to obtain reasonable assurance about whether effective internal control over financial reporting was maintained in all material respects. Our audit included obtaining an understanding of internal control over financial reporting, assessing the risk that a material weakness exists, testing and evaluating the design and operating effectiveness of internal control based on the assessed risk and performing such other procedures as we considered necessary in the circumstances. We believe that our audit provides a reasonable basis for our opinion. A company’s internal control over financial reporting is a process designed to provide reasonable assurance regarding the reliability of financial reporting and the preparation of financial statements for external purposes in accordance with generally accepted accounting principles. A company’s internal control over financial reporting includes those policies and procedures that (1) pertain to the maintenance of records that, in reasonable detail, accurately and fairly reflect the transactions and dispositions of the assets of the company; (2) provide reasonable assurance that transactions are recorded as necessary to permit preparation of financial statements in accordance with generally accepted accounting principles, and that receipts and expenditures of the company are being made only in accordance with authorizations of management and directors of the company; and (3) provide reasonable assurance regarding prevention or timely detection of unauthorized acquisition, use or disposition of the company’s assets that could have a material effect on the financial statements. Because of its inherent limitations, internal control over financial reporting may not prevent or detect misstatements. Also, projections of any evaluation of effectiveness to future periods are subject to the risk that controls may become inadequate because of changes in conditions, or that the degree of compliance with the policies or procedures may deteriorate.
In our opinion, Linear Technology Corporation maintained, in all material respects, effective internal control over financial reporting as of June 27, 2010, based on the COSO criteria. We also have audited, in accordance with the standards of the Public Company Accounting Oversight Board (United States), the consolidated balance sheets of Linear Technology Corporation as of June 27, 2010 and June 28, 2009, and the related consolidated statements of income, shareholders’ equity (deficit) and cash flows for each of the three fiscal years in the period ended June 27, 2010 of Linear Technology Corporation and our report dated August 19, 2010 expressed an unqualified opinion thereon.
/s/Ernst & Young LLP
San Jose, California August 19, 2010
53
ITEM 9. CHANGES IN AND DISAGREEMENTS WITH ACCOUNTANTS ON ACCOUNTING AND FINANCIAL DISCLOSURE
None
ITEM 9A. CONTROLS AND PROCEDURES Evaluation of Disclosure Controls and Procedures
The Company’s management, with the participation of its Chief Executive Officer and Chief Financial Officer, evaluated the effectiveness of the Company’s disclosure controls and procedures as of the end of the period covered by this Annual Report on Form 10-K. For purposes of this section, the term disclosure controls and procedures means controls and other procedures of an issuer that are designed to ensure that information required to be disclosed by the issuer in the reports that it files or submits under the Act (15 U.S.C. 78a et seq.) is recorded, processed, summarized and reported within the time periods specified in the Commission's rules and forms. Disclosure controls and procedures include, without limitation, controls and procedures designed to ensure that information required to be disclosed by an issuer in the reports that it files or submits under the Act is accumulated and communicated to the issuer's management, including its principal executive and principal financial officers, or persons performing similar functions, as appropriate to allow timely decisions regarding required disclosure.
The Company’s management evaluated, with the participation of its Chief Executive Officer and Chief Financial Officer, the effectiveness of the Company’s disclosure controls and procedures for the quarter ended June 27, 2010. Based on this evaluation, the Company’s Chief Executive Officer and Chief Financial Officer have concluded that the Company’s disclosure controls and procedures are effective to ensure that information it is required to disclose in reports that it files or submits under the Securities Exchange Act of 1934 is accumulated and communicated to the Company’s management, including its principal executive and principal financial officers, as appropriate to allow timely decisions regarding required disclosure, and that such information is recorded, processed, summarized and reported within the time periods specified in Securities and Exchange Commission rules and forms. Management’s Report on Internal Control Over Financial Reporting
The management of Linear Technology is responsible for establishing and maintaining adequate internal control over financial reporting as defined in Exchange Act Rules 13a-15(f). The Company’s internal control system was designed to provide reasonable assurance to the Company’s management and Board of Directors regarding the reliability of financial reporting and the preparation and fair presentation of financial statements issued for external purposes in accordance with generally accepted accounting principles.
All internal control systems, no matter how well designed, have inherent limitations and may not prevent or detect misstatements. Therefore, even those systems determined to be effective can only provide reasonable assurance with respect to financial reporting reliability and financial statement preparation and presentation.
The Company’s management assessed the effectiveness of its internal control over financial reporting as of June 27, 2010. In making this assessment, it used the criteria set forth by the Committee of Sponsoring Organizations (COSO) of the Treadway Commission in Internal Control—Integrated Framework. Based on its assessment management believes that, as of June 27, 2010, the Company’s internal control over financial reporting is effective based on the COSO criteria.
Management’s assessment of the effectiveness of internal control over financial reporting as of June 27, 2010 has been
audited by Ernst and Young LLP, an independent registered public accounting firm, as stated in their report which is included herein. Changes in Internal Controls Over Financial Reporting
There was no change in the Company’s internal controls over financial reporting (as defined in Rules 13a-15(f) and 15d-15(f) under the Exchange Act) that occurred during the fourth quarter of fiscal year 2010 that have materially affected, or is reasonably likely to materially affect, its internal controls over financial reporting. ITEM 9B. OTHER INFORMATION
None
54
PART III
ITEM 10. DIRECTORS, EXECUTIVE OFFICERS AND CORPORATE GOVERNANCE
The information required by this item for the Company’s directors is incorporated herein by reference to the 2010 Proxy Statement, under the caption “Proposal One - Election of Directors,” and for the executive officers of the Company, the information is included in Part I hereof under the caption “Executive Officers of the Registrant.” The information required by this item with respect to compliance with Section 16(a) of the Securities Exchange Act of 1934 is incorporated by reference to the 2010 Proxy Statement under the caption “Section 16(a) Beneficial Ownership Reporting Compliance.”
The Company had adopted a Code of Business Conduct and Ethics that applies to all of its employees, including its Chief
Executive Officer, Chief Financial Officer, and its principal accounting officers. The Company’s Code of Business Conduct and Ethics is posted on its website at http://www.linear.com/. The Company intends to satisfy the disclosure requirement under Item 5.05 of Form 8-K regarding any amendment to, or waiver from, a provision of the Code of Business Conduct and Ethics by posting such information on its website, at the address specified above. ITEM 11. EXECUTIVE COMPENSATION
Incorporated by reference to the 2010 Proxy Statement, under the section titled “Executive Compensation.” ITEM 12. SECURITY OWNERSHIP OF CERTAIN BENEFICIAL OWNERS AND MANAGEMENT AND RELATED
STOCKHOLDER MATTERS
Incorporated by reference to the 2010 Proxy Statement, under the section titled “Beneficial Security Ownership of Directors, Executive Officers and Certain Other Beneficial Owners” and “Securities Authorized for Issuance Under Equity Compensation Plans.” ITEM 13. CERTAIN RELATIONSHIPS AND RELATED TRANSACTIONS, AND DIRECTOR INDEPENDENCE
Not applicable.
ITEM 14. PRINCIPAL ACCOUNTING FEES AND SERVICES
Incorporated by reference to the 2010 Proxy Statement, under the section titled “Fees Paid To Ernst & Young.”
PART IV
ITEM 15. EXHIBITS AND FINANCIAL STATEMENT SCHEDULES (a) 1. Financial Statements
The following consolidated financial statements are included in Item 8:
Consolidated Statements of Income for each of the three years in the period ended June 27, 2010 Consolidated Balance Sheets as of June 27, 2010 and June 28, 2009 Consolidated Statements of Cash Flows for each of the three years in the period ended June 27, 2010 Consolidated Statements of Stockholders’ Equity (Deficit) for each of the three years in the period ended June 27, 2010 Reports of Independent Registered Public Accounting Firm
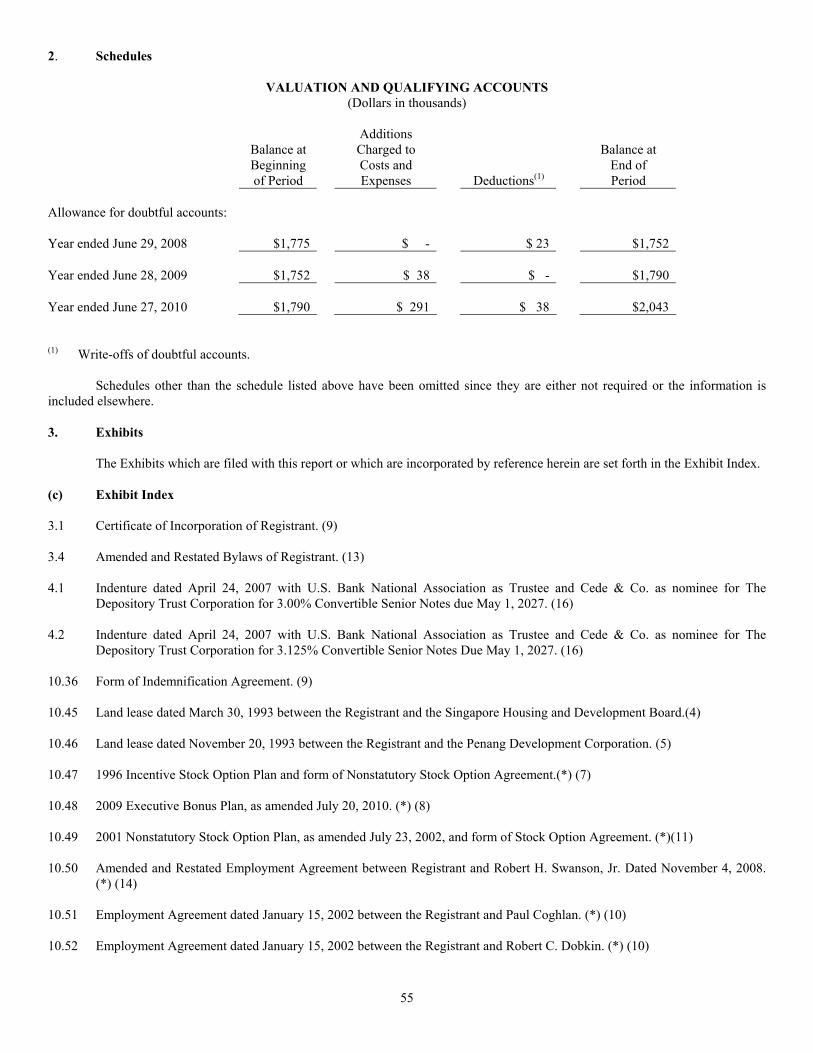
55
2. Schedules
VALUATION AND QUALIFYING ACCOUNTS (Dollars in thousands)
Additions Balance at Charged to Balance at Beginning Costs and End of of Period Expenses Deductions(1) Period Allowance for doubtful accounts: Year ended June 29, 2008 $1,775 $ - $ 23 $1,752 Year ended June 28, 2009 $1,752 $ 38 $ - $1,790 Year ended June 27, 2010 $1,790 $ 291 $ 38 $2,043
(1) Write-offs of doubtful accounts. Schedules other than the schedule listed above have been omitted since they are either not required or the information is
included elsewhere. 3. Exhibits
The Exhibits which are filed with this report or which are incorporated by reference herein are set forth in the Exhibit Index. (c) Exhibit Index 3.1 Certificate of Incorporation of Registrant. (9) 3.4 Amended and Restated Bylaws of Registrant. (13) 4.1 Indenture dated April 24, 2007 with U.S. Bank National Association as Trustee and Cede & Co. as nominee for The
Depository Trust Corporation for 3.00% Convertible Senior Notes due May 1, 2027. (16) 4.2 Indenture dated April 24, 2007 with U.S. Bank National Association as Trustee and Cede & Co. as nominee for The
Depository Trust Corporation for 3.125% Convertible Senior Notes Due May 1, 2027. (16) 10.36 Form of Indemnification Agreement. (9) 10.45 Land lease dated March 30, 1993 between the Registrant and the Singapore Housing and Development Board.(4) 10.46 Land lease dated November 20, 1993 between the Registrant and the Penang Development Corporation. (5) 10.47 1996 Incentive Stock Option Plan and form of Nonstatutory Stock Option Agreement.(*) (7) 10.48 2009 Executive Bonus Plan, as amended July 20, 2010. (*) (8) 10.49 2001 Nonstatutory Stock Option Plan, as amended July 23, 2002, and form of Stock Option Agreement. (*)(11) 10.50 Amended and Restated Employment Agreement between Registrant and Robert H. Swanson, Jr. Dated November 4, 2008.
(*) (14) 10.51 Employment Agreement dated January 15, 2002 between the Registrant and Paul Coghlan. (*) (10) 10.52 Employment Agreement dated January 15, 2002 between the Registrant and Robert C. Dobkin. (*) (10)
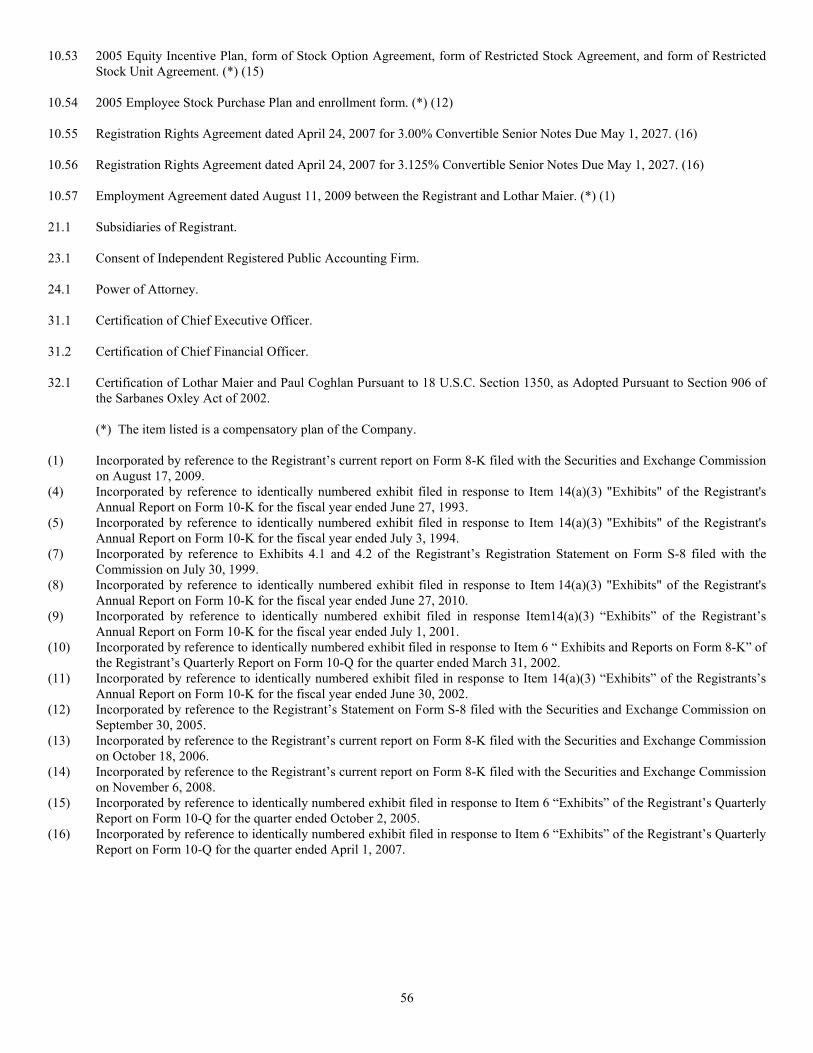
56
10.53 2005 Equity Incentive Plan, form of Stock Option Agreement, form of Restricted Stock Agreement, and form of Restricted Stock Unit Agreement. (*) (15)
10.54 2005 Employee Stock Purchase Plan and enrollment form. (*) (12) 10.55 Registration Rights Agreement dated April 24, 2007 for 3.00% Convertible Senior Notes Due May 1, 2027. (16) 10.56 Registration Rights Agreement dated April 24, 2007 for 3.125% Convertible Senior Notes Due May 1, 2027. (16) 10.57 Employment Agreement dated August 11, 2009 between the Registrant and Lothar Maier. (*) (1) 21.1 Subsidiaries of Registrant. 23.1 Consent of Independent Registered Public Accounting Firm. 24.1 Power of Attorney. 31.1 Certification of Chief Executive Officer. 31.2 Certification of Chief Financial Officer. 32.1 Certification of Lothar Maier and Paul Coghlan Pursuant to 18 U.S.C. Section 1350, as Adopted Pursuant to Section 906 of
the Sarbanes Oxley Act of 2002.
(*) The item listed is a compensatory plan of the Company. (1) Incorporated by reference to the Registrant’s current report on Form 8-K filed with the Securities and Exchange Commission
on August 17, 2009. (4) Incorporated by reference to identically numbered exhibit filed in response to Item 14(a)(3) "Exhibits" of the Registrant's
Annual Report on Form 10-K for the fiscal year ended June 27, 1993. (5) Incorporated by reference to identically numbered exhibit filed in response to Item 14(a)(3) "Exhibits" of the Registrant's
Annual Report on Form 10-K for the fiscal year ended July 3, 1994. (7) Incorporated by reference to Exhibits 4.1 and 4.2 of the Registrant’s Registration Statement on Form S-8 filed with the
Commission on July 30, 1999. (8) Incorporated by reference to identically numbered exhibit filed in response to Item 14(a)(3) "Exhibits" of the Registrant's
Annual Report on Form 10-K for the fiscal year ended June 27, 2010. (9) Incorporated by reference to identically numbered exhibit filed in response Item14(a)(3) “Exhibits” of the Registrant’s
Annual Report on Form 10-K for the fiscal year ended July 1, 2001. (10) Incorporated by reference to identically numbered exhibit filed in response to Item 6 “ Exhibits and Reports on Form 8-K” of
the Registrant’s Quarterly Report on Form 10-Q for the quarter ended March 31, 2002. (11) Incorporated by reference to identically numbered exhibit filed in response to Item 14(a)(3) “Exhibits” of the Registrants’s
Annual Report on Form 10-K for the fiscal year ended June 30, 2002. (12) Incorporated by reference to the Registrant’s Statement on Form S-8 filed with the Securities and Exchange Commission on
September 30, 2005. (13) Incorporated by reference to the Registrant’s current report on Form 8-K filed with the Securities and Exchange Commission
on October 18, 2006. (14) Incorporated by reference to the Registrant’s current report on Form 8-K filed with the Securities and Exchange Commission
on November 6, 2008. (15) Incorporated by reference to identically numbered exhibit filed in response to Item 6 “Exhibits” of the Registrant’s Quarterly
Report on Form 10-Q for the quarter ended October 2, 2005. (16) Incorporated by reference to identically numbered exhibit filed in response to Item 6 “Exhibits” of the Registrant’s Quarterly
Report on Form 10-Q for the quarter ended April 1, 2007.
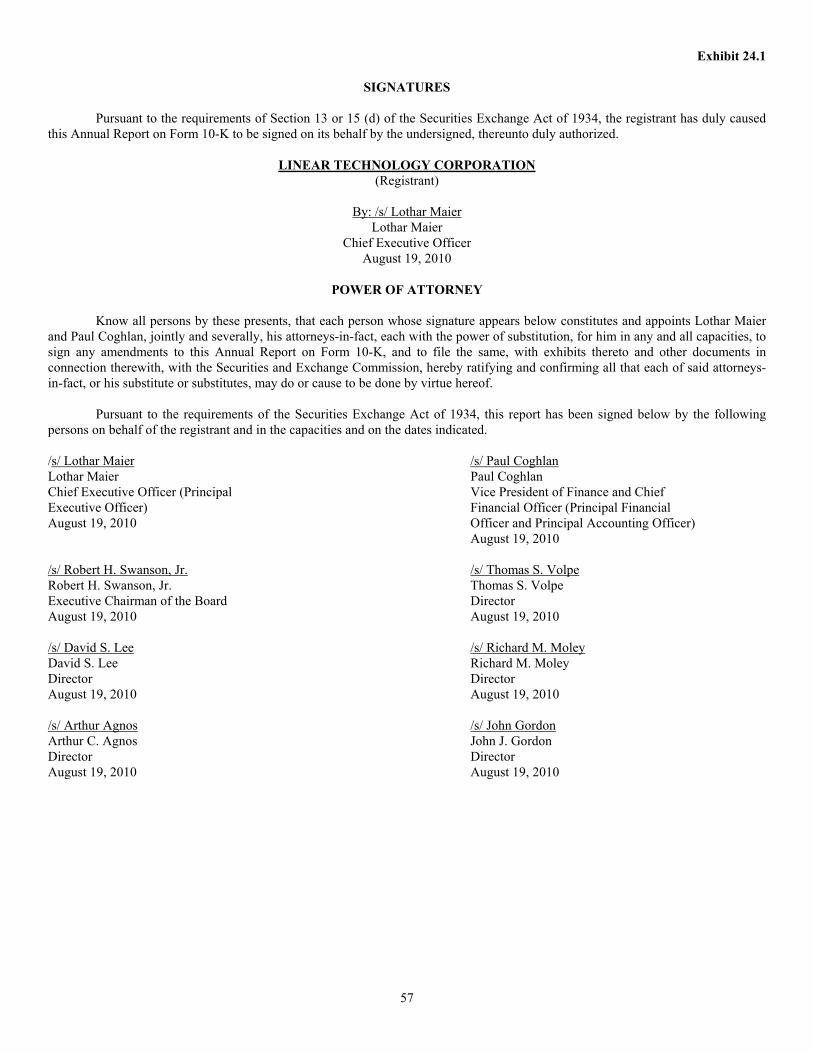
57
Exhibit 24.1
SIGNATURES
Pursuant to the requirements of Section 13 or 15 (d) of the Securities Exchange Act of 1934, the registrant has duly caused this Annual Report on Form 10-K to be signed on its behalf by the undersigned, thereunto duly authorized.
LINEAR TECHNOLOGY CORPORATION (Registrant)
By: /s/ Lothar Maier
Lothar Maier Chief Executive Officer
August 19, 2010
POWER OF ATTORNEY
Know all persons by these presents, that each person whose signature appears below constitutes and appoints Lothar Maier and Paul Coghlan, jointly and severally, his attorneys-in-fact, each with the power of substitution, for him in any and all capacities, to sign any amendments to this Annual Report on Form 10-K, and to file the same, with exhibits thereto and other documents in connection therewith, with the Securities and Exchange Commission, hereby ratifying and confirming all that each of said attorneys-in-fact, or his substitute or substitutes, may do or cause to be done by virtue hereof.
Pursuant to the requirements of the Securities Exchange Act of 1934, this report has been signed below by the following persons on behalf of the registrant and in the capacities and on the dates indicated. /s/ Lothar Maier /s/ Paul Coghlan Lothar Maier Paul Coghlan Chief Executive Officer (Principal Vice President of Finance and Chief Executive Officer) Financial Officer (Principal Financial August 19, 2010 Officer and Principal Accounting Officer) August 19, 2010 /s/ Robert H. Swanson, Jr. /s/ Thomas S. Volpe Robert H. Swanson, Jr. Thomas S. Volpe Executive Chairman of the Board Director August 19, 2010 August 19, 2010 /s/ David S. Lee /s/ Richard M. Moley David S. Lee Richard M. Moley Director Director August 19, 2010 August 19, 2010 /s/ Arthur Agnos /s/ John Gordon Arthur C. Agnos John J. Gordon Director Director August 19, 2010 August 19, 2010
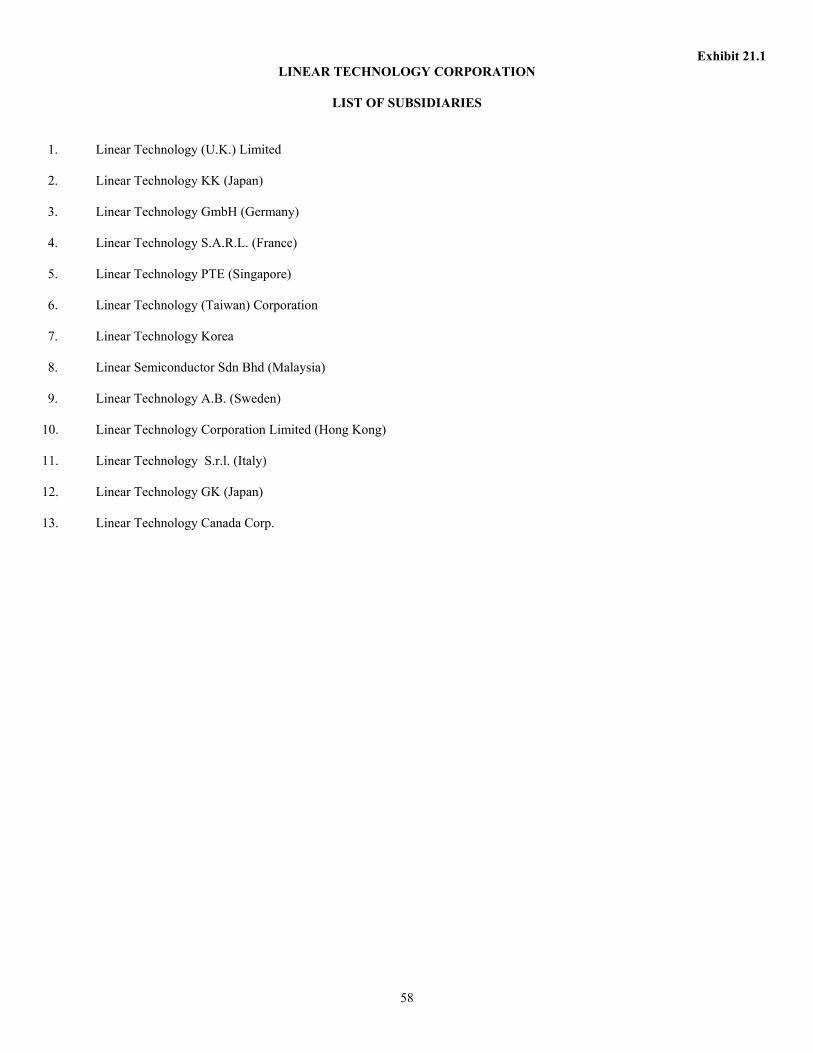
58
Exhibit 21.1 LINEAR TECHNOLOGY CORPORATION
LIST OF SUBSIDIARIES
1. Linear Technology (U.K.) Limited 2. Linear Technology KK (Japan) 3. Linear Technology GmbH (Germany) 4. Linear Technology S.A.R.L. (France) 5. Linear Technology PTE (Singapore) 6. Linear Technology (Taiwan) Corporation 7. Linear Technology Korea 8. Linear Semiconductor Sdn Bhd (Malaysia) 9. Linear Technology A.B. (Sweden)
10. Linear Technology Corporation Limited (Hong Kong) 11. Linear Technology S.r.l. (Italy)
12. Linear Technology GK (Japan)
13. Linear Technology Canada Corp.
59
Exhibit 23.1 CONSENT OF INDEPENDENT REGISTERED PUBLIC ACCOUNTING FIRM
We consent to the incorporation by reference in the Registration Statements (Form S-8 Nos. 33-8306, 33-27367, 33-37432, 333-40595, 33-57330, 33-58745, 333-84149, 333-60946, 333-102542, 333-128747, 333-129856, 333-158743 and Form S-3ASR No. 333-144193) of Linear Technology Corporation of our reports dated August 19, 2010, with respect to the consolidated financial statements and schedule of Linear Technology Corporation, and the effectiveness of internal control over financial reporting of Linear Technology Corporation, included in this Annual Report (Form 10-K) for the fiscal year ended June 27, 2010.
/s/Ernst & Young LLP
San Jose, California August 19, 2010
60
Exhibit 31.1
CERTIFICATION PURSUANT TO EXCHANGE ACT RULES 13a-14(a) AND 15d-14(a), AS ADOPTED PURSUANT TO SECTION 302 OF THE SARBANES-OXLEY ACT OF 2002
Principal Executive Officer I, Lothar Maier, certify that:
1) I have reviewed this Annual Report on Form 10-K of Linear Technology Corporation; 2) Based on my knowledge, this report does not contain any untrue statement of a material fact or omit to state a material fact
necessary to make the statements made, in light of the circumstances under which such statements were made, not misleading with respect to the period covered by this report;
3) Based on my knowledge, the financial statements, and other financial information included in this report, fairly present in all
material respects the financial condition, results of operations and cash flows of the registrant as of, and for, the periods presented in this report;
4) The registrant's other certifying officer and I are responsible for establishing and maintaining disclosure controls and
procedures (as defined in Exchange Act Rules 13a-15(e) and 15d-15(e)) and internal control over financial reporting (as defined in Exchange Act Rules 13a-15(f) and 15d-15(f)) for the registrant and have:
(a) Designed such disclosure controls and procedures, or caused such disclosure controls and procedures to be
designed under our supervision, to ensure that material information relating to the registrant, including its consolidated subsidiaries, is made known to us by others within those entities, particularly during the period in which this report is being prepared;
(b) Designed such internal control over financial reporting, or caused such internal control over financial reporting to be designed under our supervision, to provide reasonable assurance regarding the reliability of financial reporting and the preparation of financial statements for external purposes in accordance with generally accepted accounting principles;
(c) Evaluated the effectiveness of the registrant's disclosure controls and procedures and presented in this report our conclusions about the effectiveness of the disclosure controls and procedures, as of the end of the period covered by this report based on such evaluation; and
(d) Disclosed in this report any change in the registrant's internal control over financial reporting that occurred during the registrant's most recent fiscal quarter that has materially affected, or is reasonably likely to materially affect, the registrant's internal control over financial reporting; and
5) The registrant's other certifying officer and I have disclosed, based on our most recent evaluation of internal control over financial reporting, to the registrant's auditors and the audit committee of the registrant's board of directors (or persons performing the equivalent functions):
(a) All significant deficiencies and material weaknesses, in the design or operation of internal control over
financial reporting which are reasonably likely to adversely affect the registrant's ability to record, process, summarize and report financial information; and
(b) Any fraud, whether or not material, that involves management or other employees who have a significant role in the registrant's internal control over financial reporting.
Date: August 19, 2010 /s/ Lothar Maier Lothar Maier Chief Executive Officer
(Principal Executive Officer)
61
Exhibit 31.2
CERTIFICATION PURSUANT TO EXCHANGE ACT RULES 13a-14(a) AND 15d-14(a), AS ADOPTED PURSUANT TO SECTION 302 OF THE SARBANES-OXLEY ACT OF 2002 Principal Financial Officer and Principal Accounting Officer
I, Paul Coghlan, certify that:
1) I have reviewed this Annual Report on Form 10-K of Linear Technology Corporation; 2) Based on my knowledge, this report does not contain any untrue statement of a material fact or omit to state a material fact
necessary to make the statements made, in light of the circumstances under which such statements were made, not misleading with respect to the period covered by this report;
3) Based on my knowledge, the financial statements, and other financial information included in this report, fairly present in all
material respects the financial condition, results of operations and cash flows of the registrant as of, and for, the periods presented in this report;
4) The registrant's other certifying officer and I are responsible for establishing and maintaining disclosure controls and
procedures (as defined in Exchange Act Rules 13a-15(e) and 15d-15(e)) and internal control over financial reporting (as defined in Exchange Act Rules 13a-15(f) and 15d-15(f)) for the registrant and have:
(a) Designed such disclosure controls and procedures, or caused such disclosure controls and procedures to be
designed under our supervision, to ensure that material information relating to the registrant, including its consolidated subsidiaries, is made known to us by others within those entities, particularly during the period in which this report is being prepared;
(b) Designed such internal control over financial reporting, or caused such internal control over financial reporting to be designed under our supervision, to provide reasonable assurance regarding the reliability of financial reporting and the preparation of financial statements for external purposes in accordance with generally accepted accounting principles;
(c) Evaluated the effectiveness of the registrant's disclosure controls and procedures and presented in this report our conclusions about the effectiveness of the disclosure controls and procedures, as of the end of the period covered by this report based on such evaluation; and
(d) Disclosed in this report any change in the registrant's internal control over financial reporting that occurred during the registrant's most recent fiscal quarter that has materially affected, or is reasonably likely to materially affect, the registrant's internal control over financial reporting; and
5) The registrant's other certifying officer and I have disclosed, based on our most recent evaluation of internal control over financial reporting, to the registrant's auditors and the audit committee of the registrant's board of directors (or persons performing the equivalent functions):
(a) All significant deficiencies and material weaknesses, in the design or operation of internal control over
financial reporting which are reasonably likely to adversely affect the registrant's ability to record, process, summarize and report financial information; and
(b) Any fraud, whether or not material, that involves management or other employees who have a significant role in the registrant's internal control over financial reporting.
Date: August 19, 2010 /s/ Paul Coghlan Paul Coghlan Vice President of Finance and Chief Financial
Officer (Principal Financial Officer and Principal Accounting Officer)
62
Exhibit 32.1
CERTIFICATION OF CHIEF EXECUTIVE OFFICER AND CHIEF FINANCIAL OFFICER
PURSUANT TO 18 U.S.C. SECTION 1350, AS ADOPTED PURSUANT TO SECTION 906 OF THE SARBANES-OXLEY ACT OF 2002
I, Lothar Maier, certify, pursuant to 18 U.S.C. Section 1350, as adopted pursuant to Section 906 of the Sarbanes-Oxley Act of 2002, that the Annual Report of Linear Technology Corporation on Form 10-K for the fiscal year ended June 27, 2010 fully complies with the requirements of Section 13(a) or 15(d) of the Securities Exchange Act of 1934 and that information contained in such Annual Report on Form 10-K fairly presents in all material respects the financial condition and results of operations of Linear Technology Corporation.
Date: August 19, 2010 By: /s/ Lothar Maier Name: Lothar Maier Title: Chief Executive Officer
I, Paul Coghlan, certify, pursuant to 18 U.S.C. Section 1350, as adopted pursuant to Section 906 of the Sarbanes-Oxley Act of 2002, that the Annual Report of Linear Technology Corporation on Form 10-K for the fiscal year ended June 27, 2010 fully complies with the requirements of Section 13(a) or 15(d) of the Securities Exchange Act of 1934 and that information contained in such Annual Report on Form 10-K fairly presents in all material respects the financial condition and results of operations of Linear Technology Corporation.
Date: August 19, 2010 By: /s/ Paul Coghlan Name: Paul Coghlan Title: Chief Financial Officer
Related Documents