Linear Model using Excel 2013 Trendline XL2A 4/3/2017 V0L www.StatLit.org/pdf/Excel2013-Model-Trendline-Linear-Slides.pdf 1 Model Trendline Linear Excel 2013 XL2A V0L 1 by Milo Schield Member: International Statistical Institute US Rep: International Statistical Literacy Project Director, W. M. Keck Statistical Literacy Project Slides at: www.StatLit.org/pdf /Excel2013-Model-Trendline-Linear-Slides.pdf Model using Trendline (Linear) in Excel 2013 Model Trendline Linear Excel 2013 XL2A V0L 2 Goal: Summarize association between two variables 1. Create three charts involving two quantitative variables. Slides 15, 19 & 21. 2. Show trend-line for the association. Show the equation and R 2 : the goodness of fit. 3. Describe trend (qualitative and quantitative) in words for each graph. See slides 15 & 20. 4. [Optional] Describe R 2 and model in words. Data source: www.StatLit.org/excel/pulse.xls Model Trendline Linear Excel 2013 XL2A V0L 3 Approach: Data Selection Three approaches to selecting data 1. Select X and Y axis data before inserting chart 2. Select just the Y-axis data before inserting chart 3. Select X and Y axis data after inserting chart. Evaluation: #1: best if X-axis data is to the left of Y-axis data #2: best if X-axis data is to the right of Y-axis data #3: allows the most control. Model Trendline Linear Excel 2013 XL2A V0L 4 #1 Select columns (Ht & Wt) Insert Scatter (XY) chart . Model Trendline Linear Excel 2013 XL2A V0L 5 If you select a column, Excel ignores row 1 if text. Do not include row 1; Excel translates text to zero. Model Trendline Linear Excel 2013 XL2A V0L 6 First Chart Next: Remove white space

Welcome message from author
This document is posted to help you gain knowledge. Please leave a comment to let me know what you think about it! Share it to your friends and learn new things together.
Transcript
Linear Model using Excel 2013 Trendline XL2A 4/3/2017 V0L
www.StatLit.org/pdf/Excel2013-Model-Trendline-Linear-Slides.pdf 1
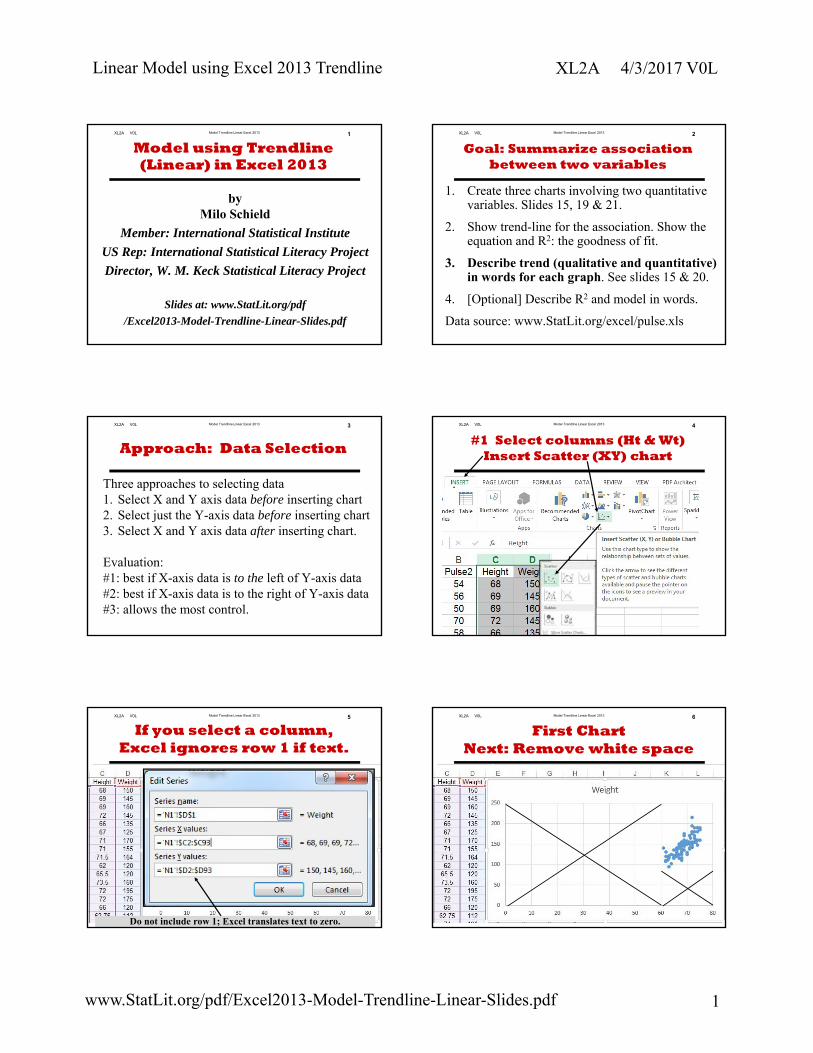
Model Trendline Linear Excel 2013XL2A V0L 1
byMilo Schield
Member: International Statistical Institute
US Rep: International Statistical Literacy Project
Director, W. M. Keck Statistical Literacy Project
Slides at: www.StatLit.org/pdf
/Excel2013-Model-Trendline-Linear-Slides.pdf
Model using Trendline (Linear) in Excel 2013
Model Trendline Linear Excel 2013XL2A V0L 2
Goal: Summarize association between two variables
1. Create three charts involving two quantitative variables. Slides 15, 19 & 21.
2. Show trend-line for the association. Show the equation and R2: the goodness of fit.
3. Describe trend (qualitative and quantitative) in words for each graph. See slides 15 & 20.
4. [Optional] Describe R2 and model in words.
Data source: www.StatLit.org/excel/pulse.xls
Model Trendline Linear Excel 2013XL2A V0L 3
Approach: Data Selection
Three approaches to selecting data1. Select X and Y axis data before inserting chart2. Select just the Y-axis data before inserting chart3. Select X and Y axis data after inserting chart.
Evaluation:#1: best if X-axis data is to the left of Y-axis data#2: best if X-axis data is to the right of Y-axis data #3: allows the most control.
Model Trendline Linear Excel 2013XL2A V0L 4
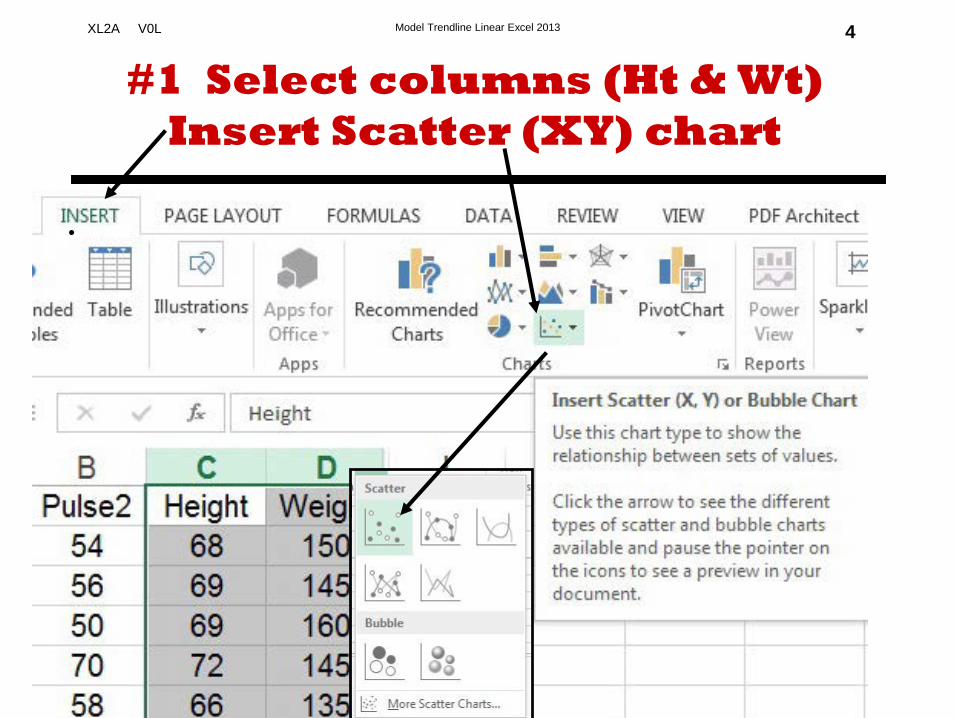
#1 Select columns (Ht & Wt)Insert Scatter (XY) chart
.
Model Trendline Linear Excel 2013XL2A V0L 5
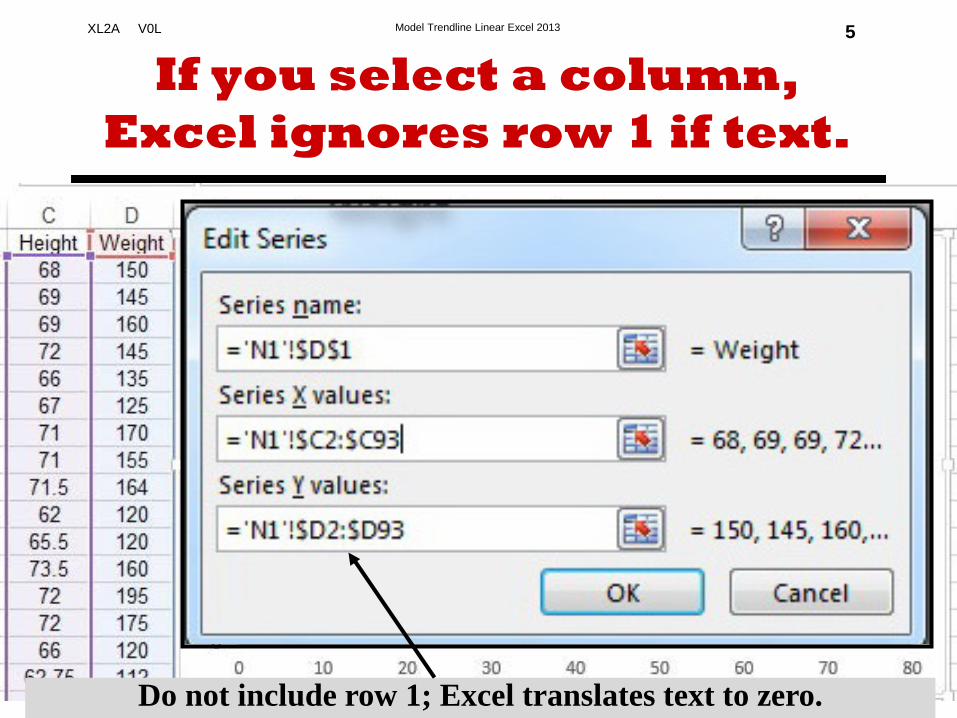
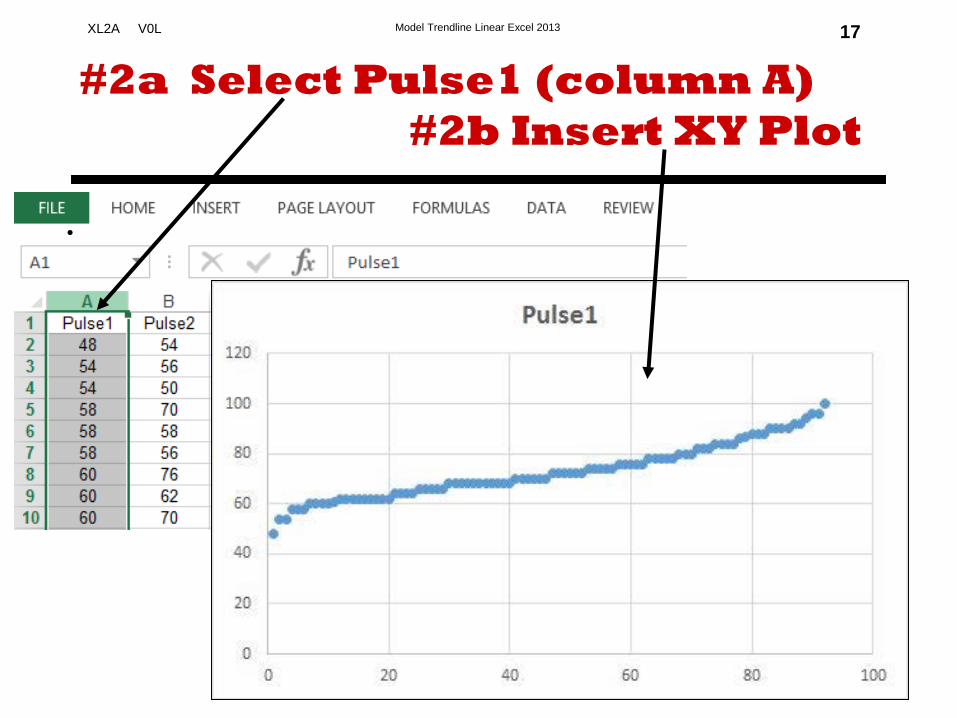
If you select a column, Excel ignores row 1 if text.
Do not include row 1; Excel translates text to zero.
Model Trendline Linear Excel 2013XL2A V0L 6
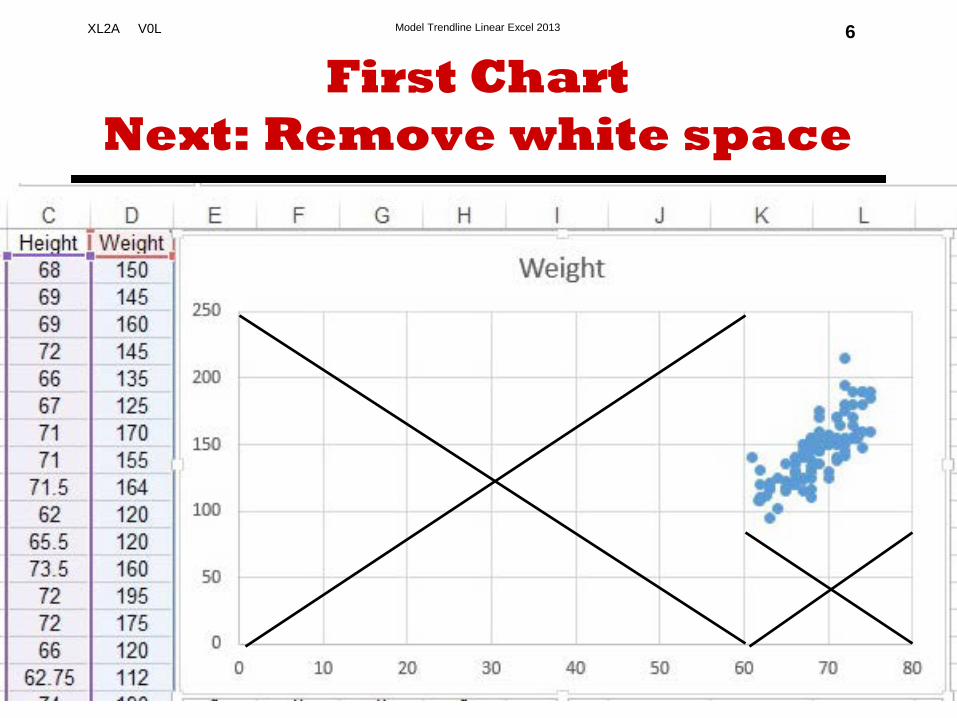
First ChartNext: Remove white space
Linear Model using Excel 2013 Trendline XL2A 4/3/2017 V0L
www.StatLit.org/pdf/Excel2013-Model-Trendline-Linear-Slides.pdf 2
Model Trendline Linear Excel 2013XL2A V0L 7
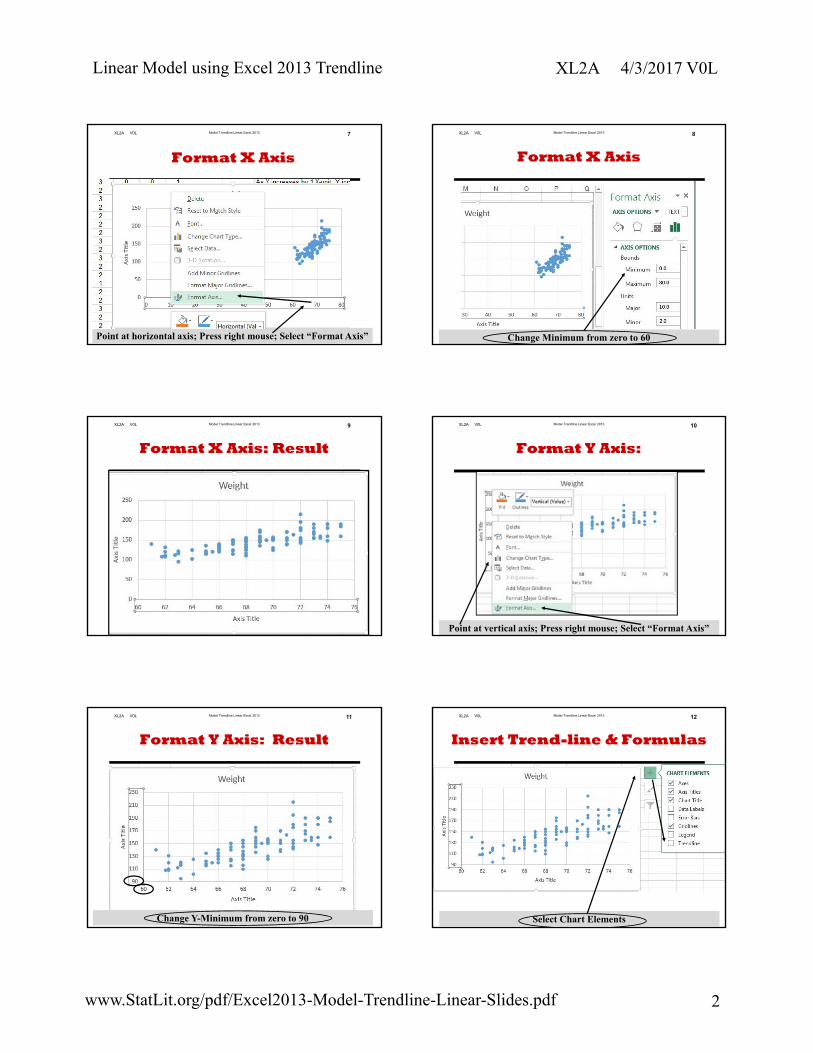
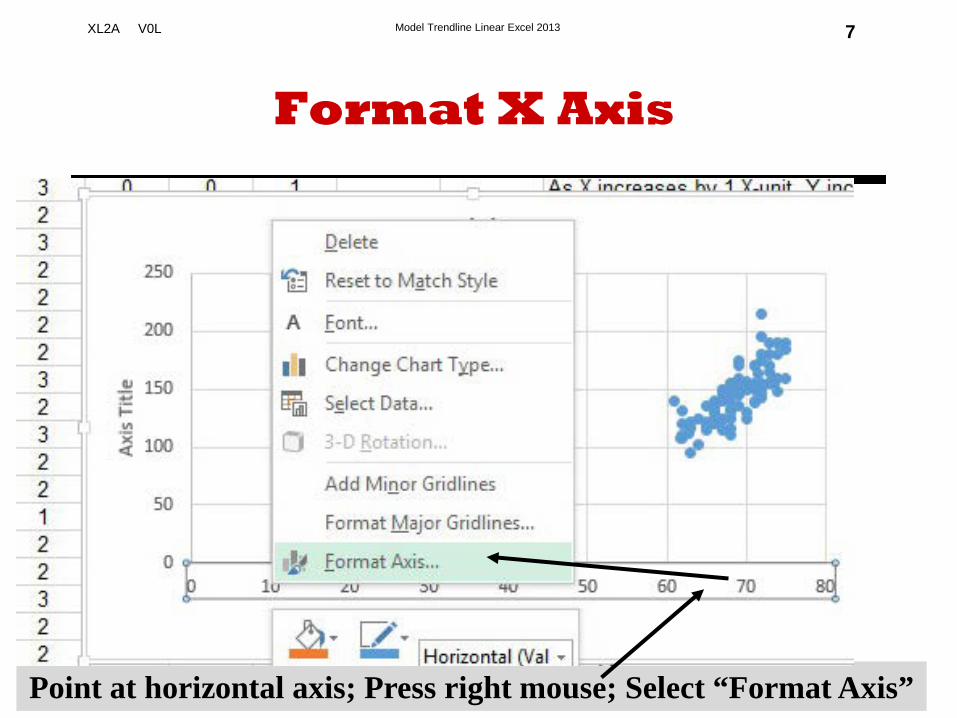
Format X Axis
Point at horizontal axis; Press right mouse; Select “Format Axis”
Model Trendline Linear Excel 2013XL2A V0L 8
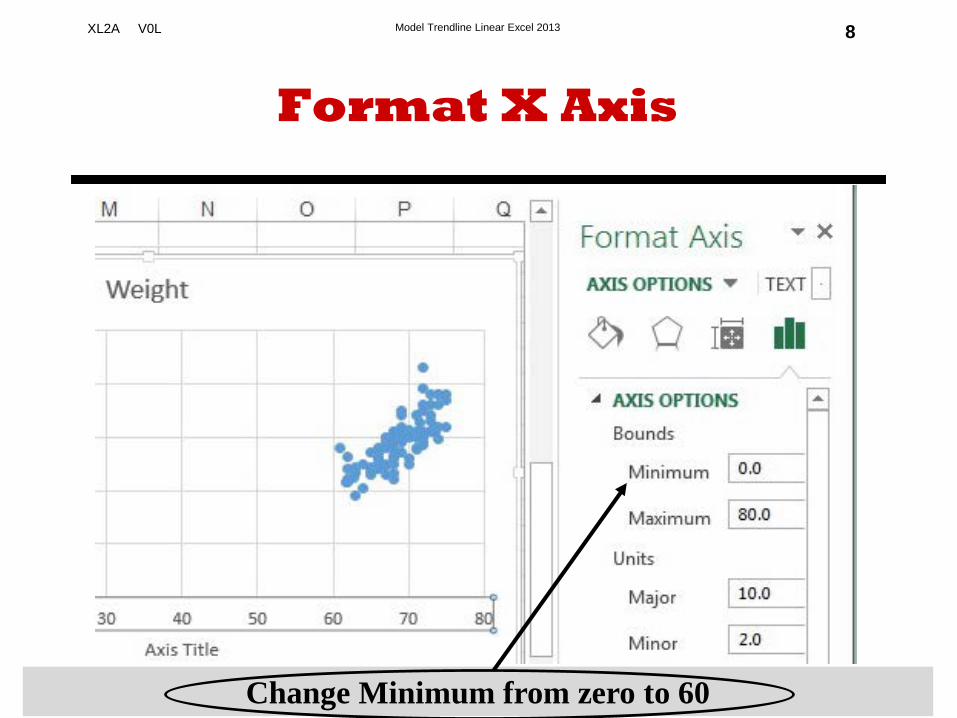
Format X Axis
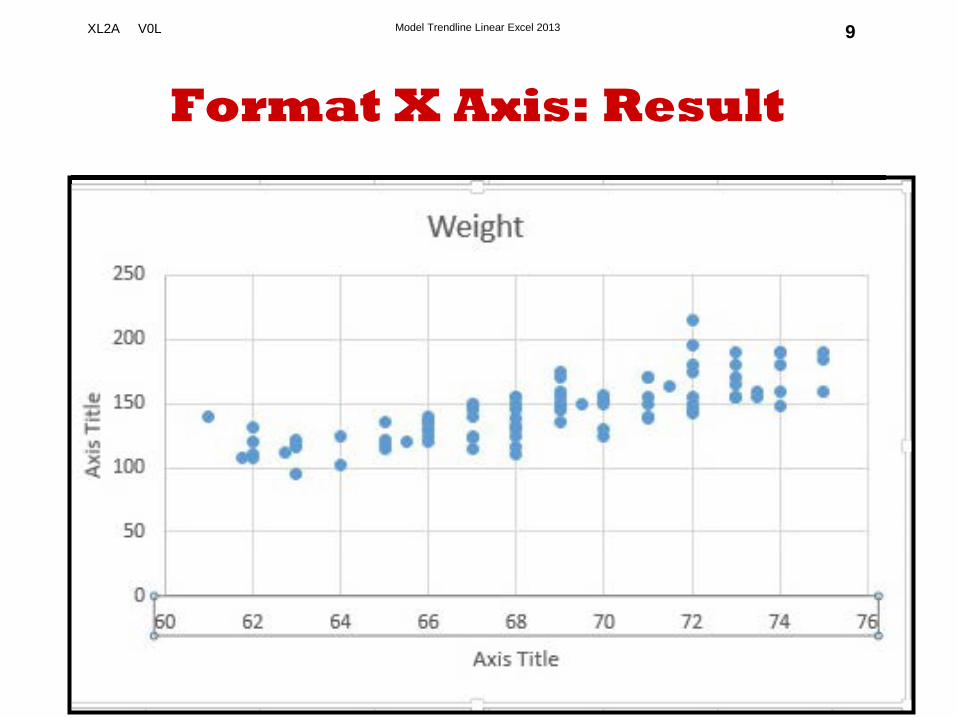
Change Minimum from zero to 60
Model Trendline Linear Excel 2013XL2A V0L 9
Format X Axis: Result
Model Trendline Linear Excel 2013XL2A V0L 10
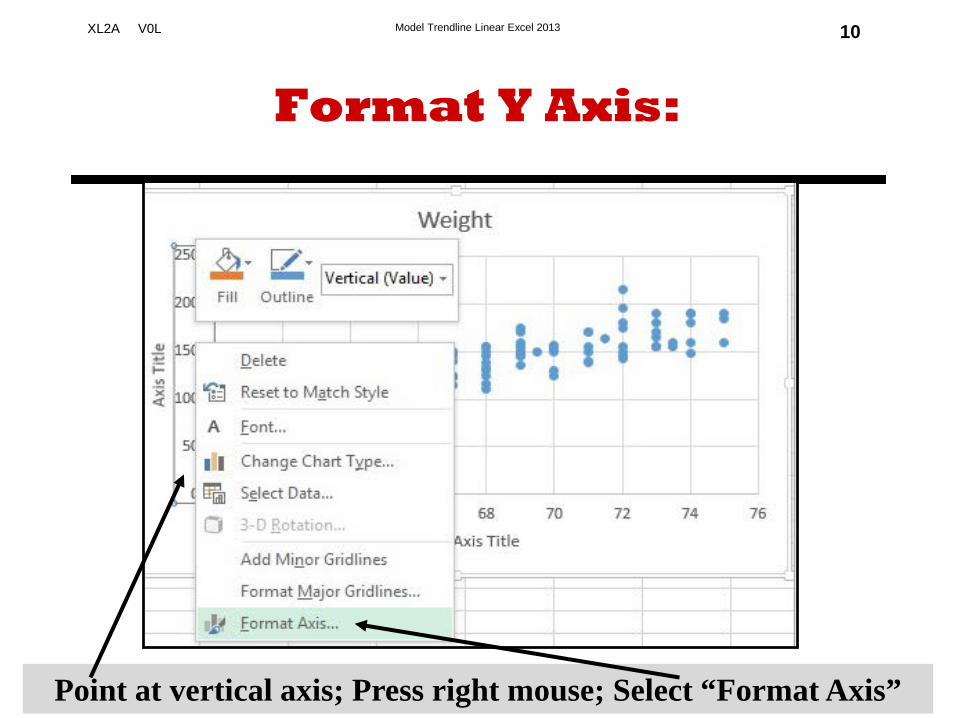
Format Y Axis:
Point at vertical axis; Press right mouse; Select “Format Axis”
Model Trendline Linear Excel 2013XL2A V0L 11
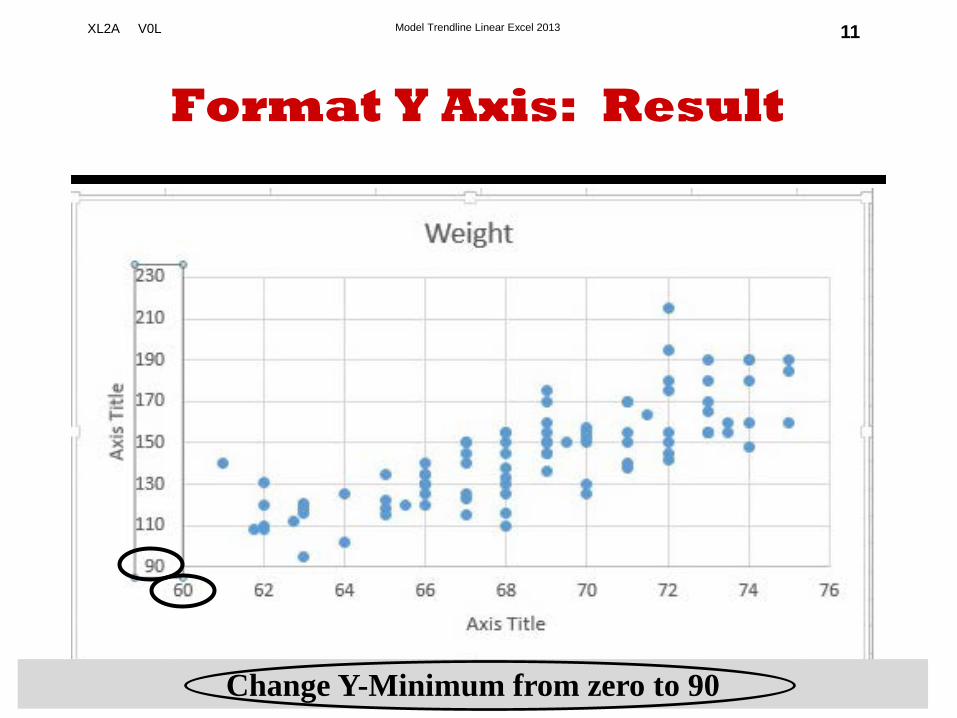
Format Y Axis: Result
Change Y-Minimum from zero to 90
Model Trendline Linear Excel 2013XL2A V0L 12
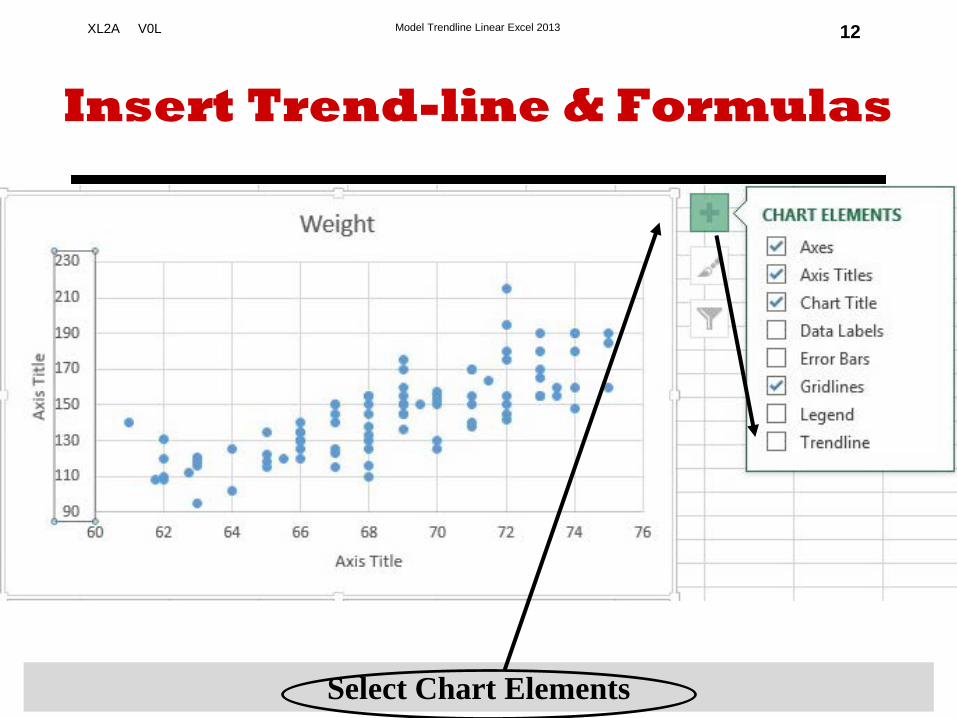
Insert Trend-line & Formulas
Select Chart Elements
Linear Model using Excel 2013 Trendline XL2A 4/3/2017 V0L
www.StatLit.org/pdf/Excel2013-Model-Trendline-Linear-Slides.pdf 3
Model Trendline Linear Excel 2013XL2A V0L 13
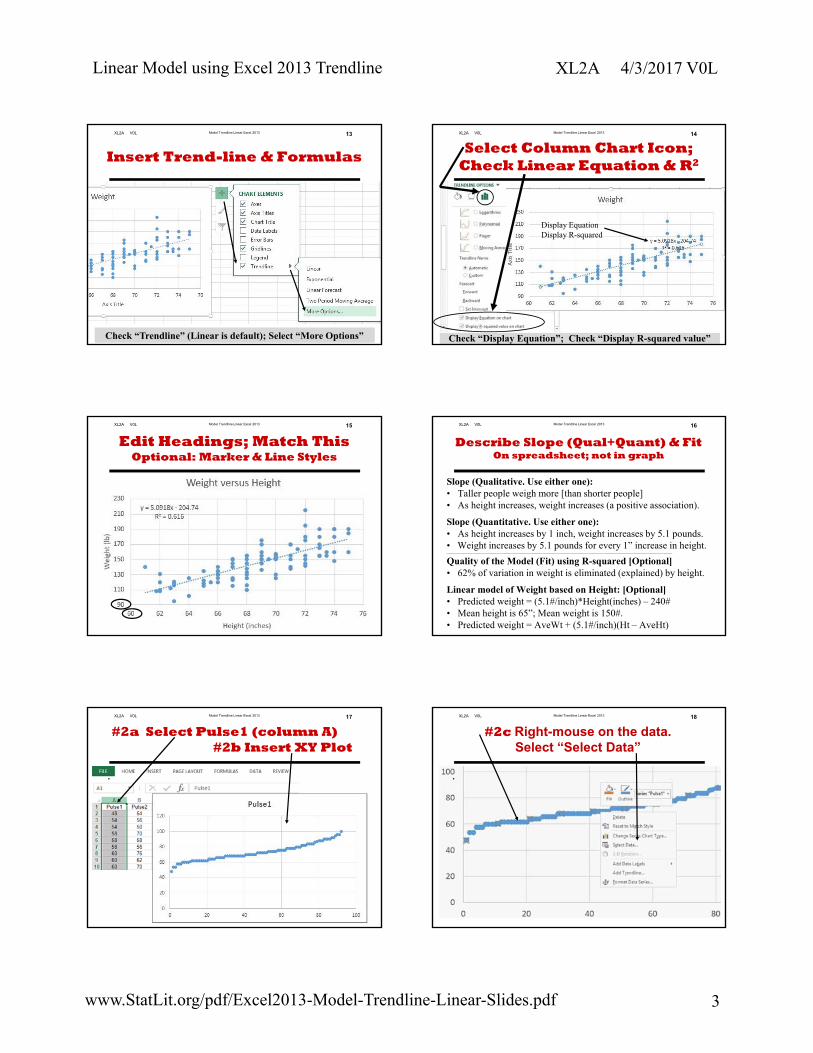
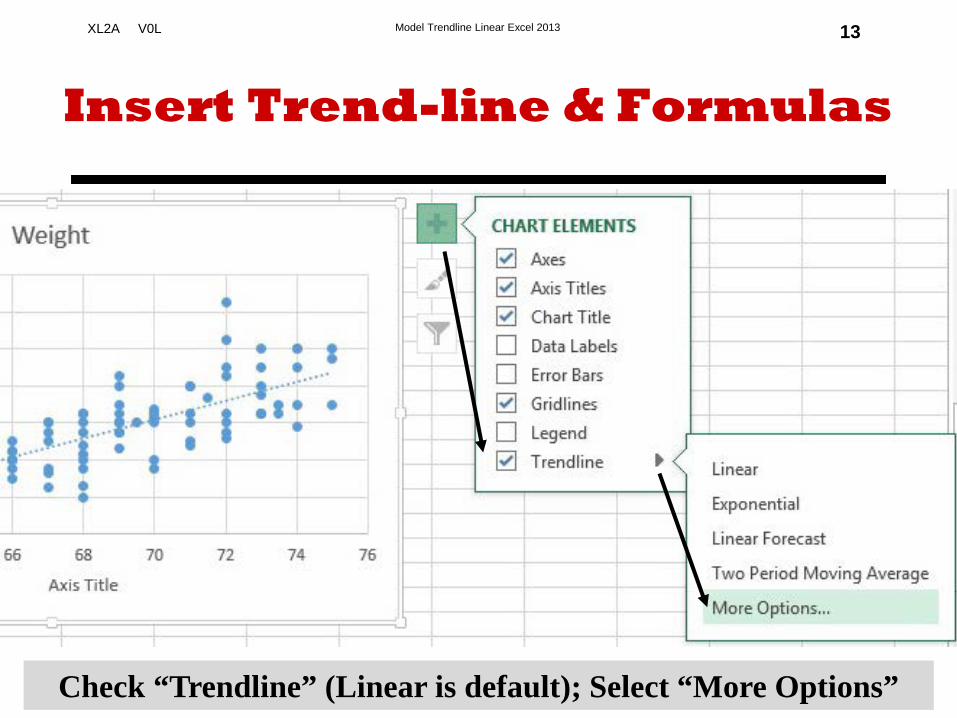
Insert Trend-line & Formulas
Check “Trendline” (Linear is default); Select “More Options”
Model Trendline Linear Excel 2013XL2A V0L 14
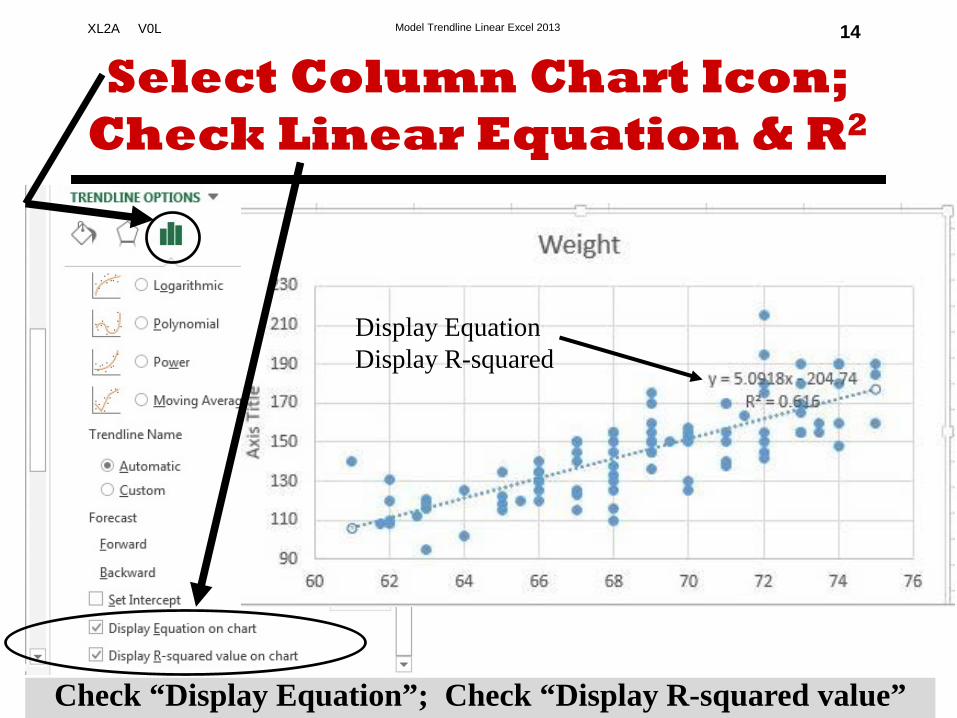
Select Column Chart Icon;Check Linear Equation & R2
Check “Display Equation”; Check “Display R-squared value”
Display EquationDisplay R-squared
Model Trendline Linear Excel 2013XL2A V0L 15
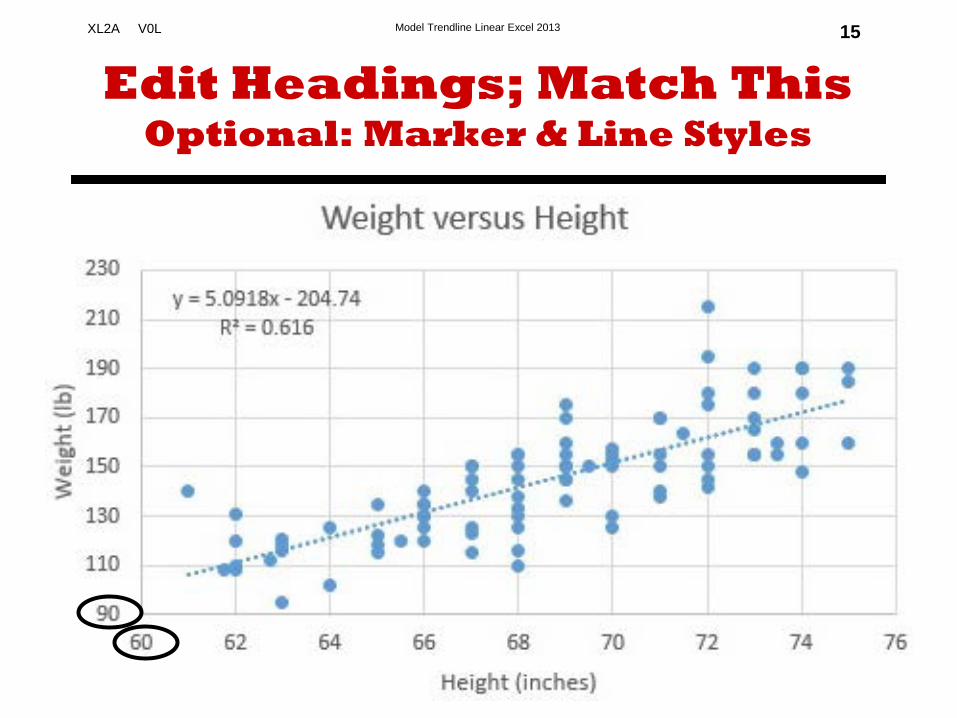
Edit Headings; Match ThisOptional: Marker & Line Styles
Model Trendline Linear Excel 2013XL2A V0L 16
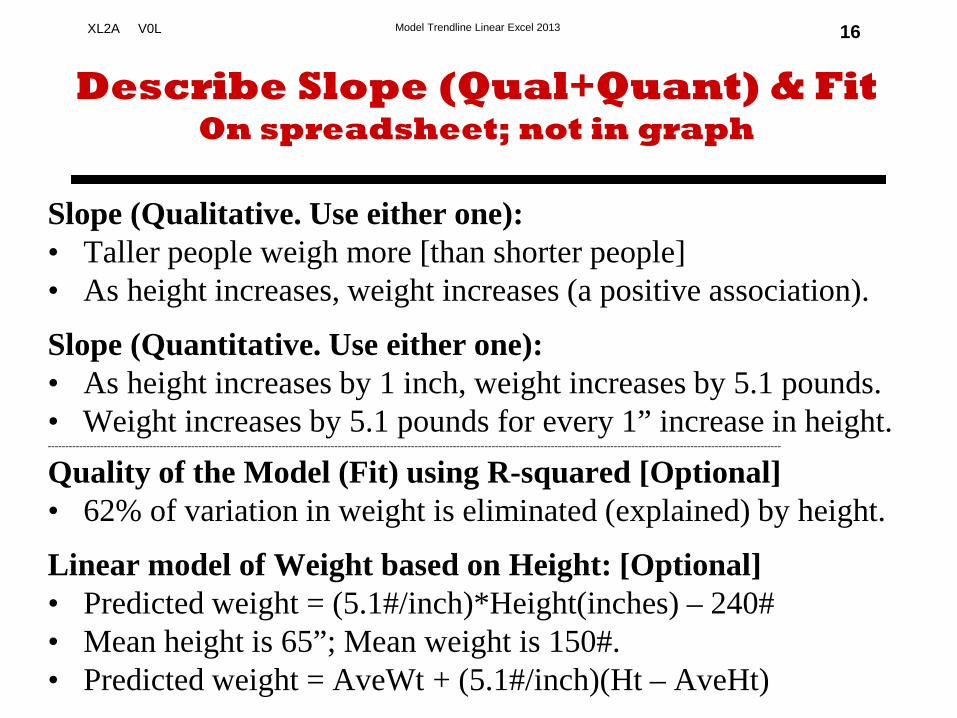
Describe Slope (Qual+Quant) & FitOn spreadsheet; not in graph
Slope (Qualitative. Use either one): • Taller people weigh more [than shorter people]• As height increases, weight increases (a positive association).
Slope (Quantitative. Use either one): • As height increases by 1 inch, weight increases by 5.1 pounds.• Weight increases by 5.1 pounds for every 1” increase in height.------------------------------------------------------------------------------------------------------------------------------------------------------------------------------------------------------------------
Quality of the Model (Fit) using R-squared [Optional]• 62% of variation in weight is eliminated (explained) by height.
Linear model of Weight based on Height: [Optional]• Predicted weight = (5.1#/inch)*Height(inches) – 240#• Mean height is 65”; Mean weight is 150#.• Predicted weight = AveWt + (5.1#/inch)(Ht – AveHt)
Model Trendline Linear Excel 2013XL2A V0L
.
17
#2a Select Pulse1 (column A)#2b Insert XY Plot
Model Trendline Linear Excel 2013XL2A V0L 18
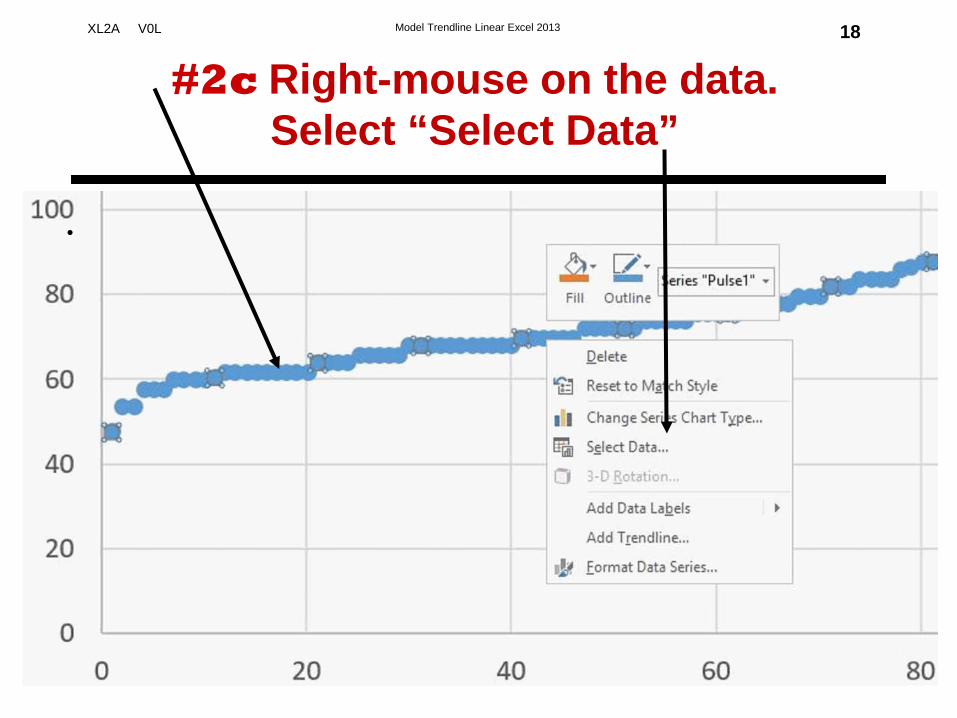
#2c Right-mouse on the data. Select “Select Data”
.
Linear Model using Excel 2013 Trendline XL2A 4/3/2017 V0L
www.StatLit.org/pdf/Excel2013-Model-Trendline-Linear-Slides.pdf 4
Model Trendline Linear Excel 2013XL2A V0L
.
19
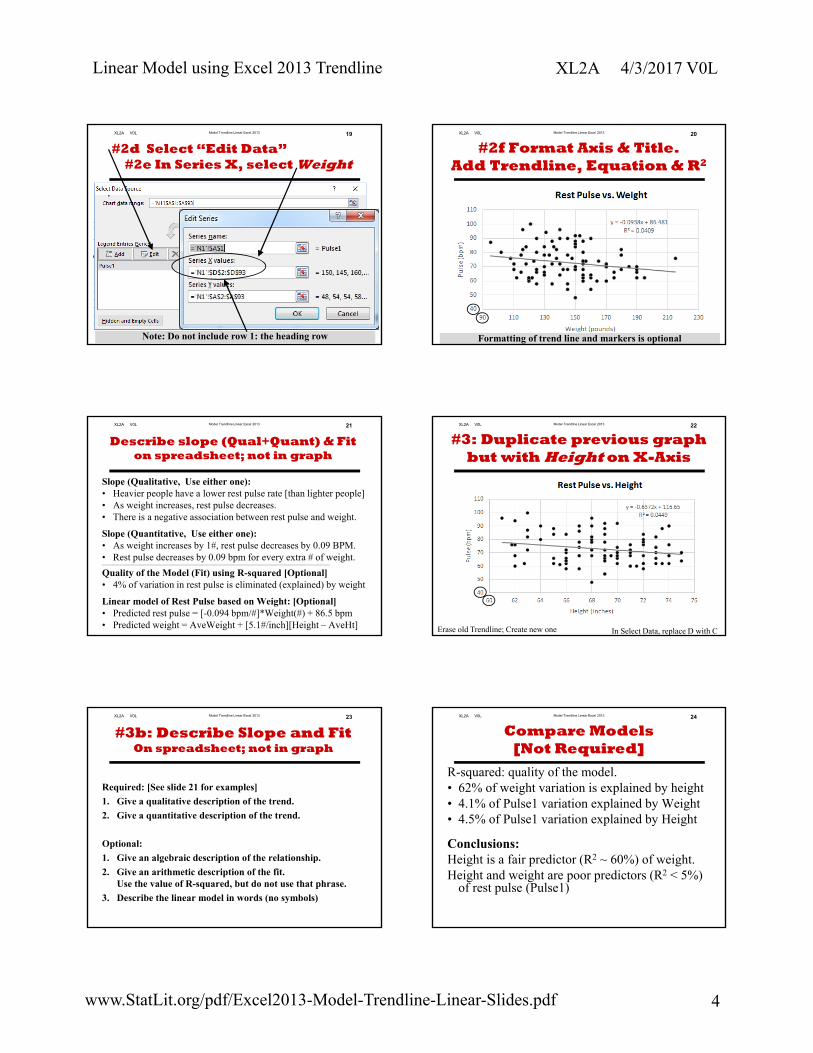
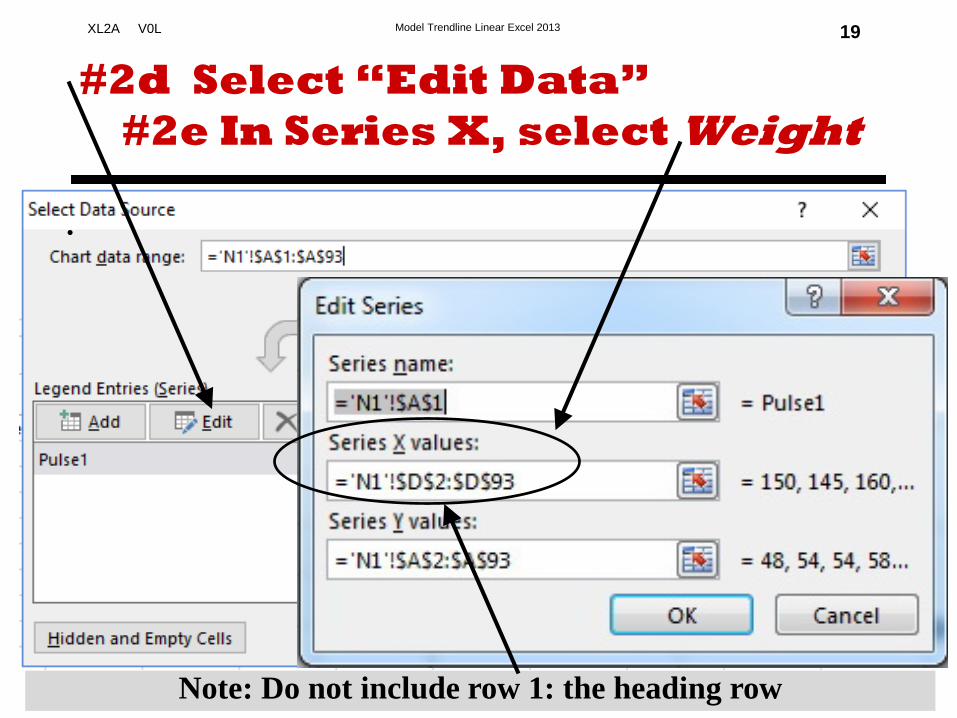
#2d Select “Edit Data”#2e In Series X, select Weight
Note: Do not include row 1: the heading row
Model Trendline Linear Excel 2013XL2A V0L 20
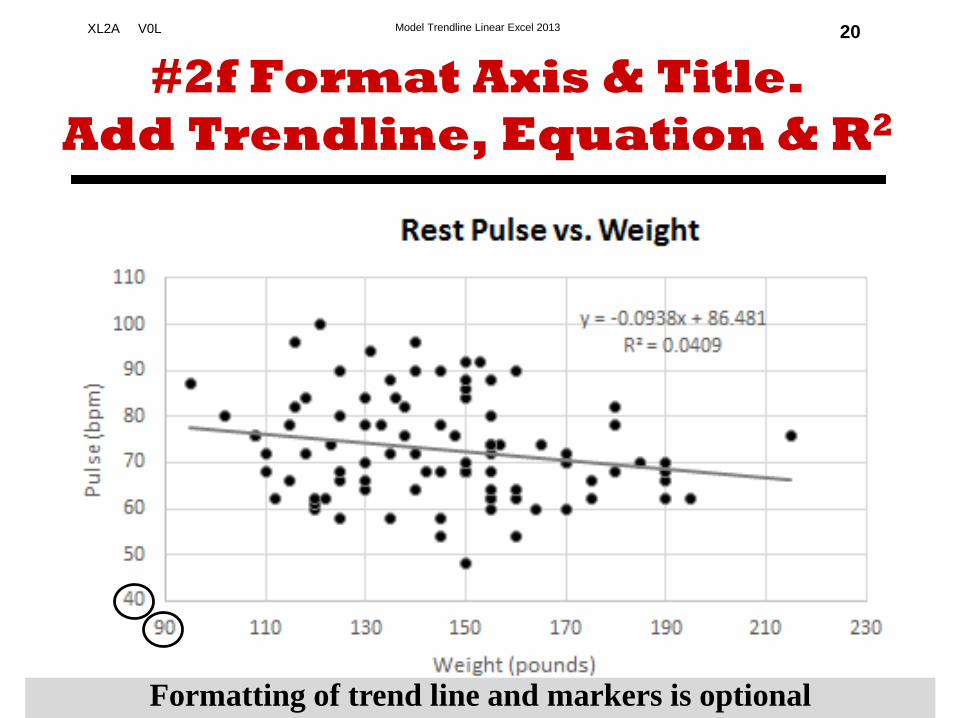
#2f Format Axis & Title. Add Trendline, Equation & R2
Formatting of trend line and markers is optional
Model Trendline Linear Excel 2013XL2A V0L 21
Describe slope (Qual+Quant) & Fiton spreadsheet; not in graph
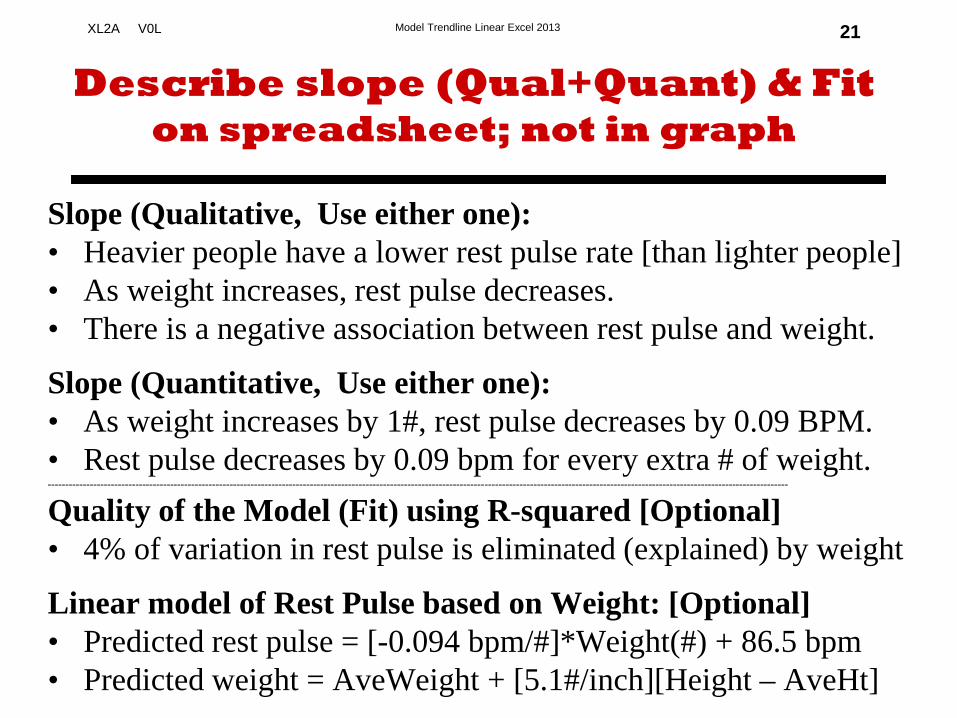
Slope (Qualitative, Use either one): • Heavier people have a lower rest pulse rate [than lighter people]• As weight increases, rest pulse decreases.• There is a negative association between rest pulse and weight.
Slope (Quantitative, Use either one): • As weight increases by 1#, rest pulse decreases by 0.09 BPM.• Rest pulse decreases by 0.09 bpm for every extra # of weight. --------------------------------------------------------------------------------------------------------------------------------------------------------------------------------------------------------------------
Quality of the Model (Fit) using R-squared [Optional]• 4% of variation in rest pulse is eliminated (explained) by weight
Linear model of Rest Pulse based on Weight: [Optional]• Predicted rest pulse = [-0.094 bpm/#]*Weight(#) + 86.5 bpm• Predicted weight = AveWeight + [5.1#/inch][Height – AveHt]
Model Trendline Linear Excel 2013XL2A V0L 22
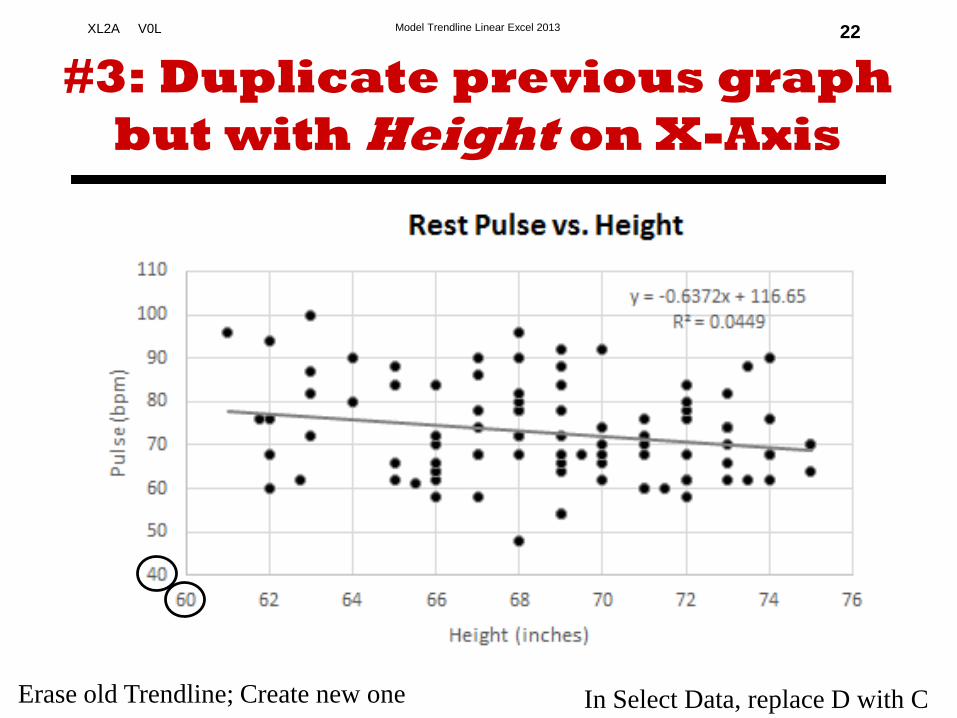
#3: Duplicate previous graph but with Height on X-Axis
Erase old Trendline; Create new one In Select Data, replace D with C
Model Trendline Linear Excel 2013XL2A V0L 23
#3b: Describe Slope and FitOn spreadsheet; not in graph
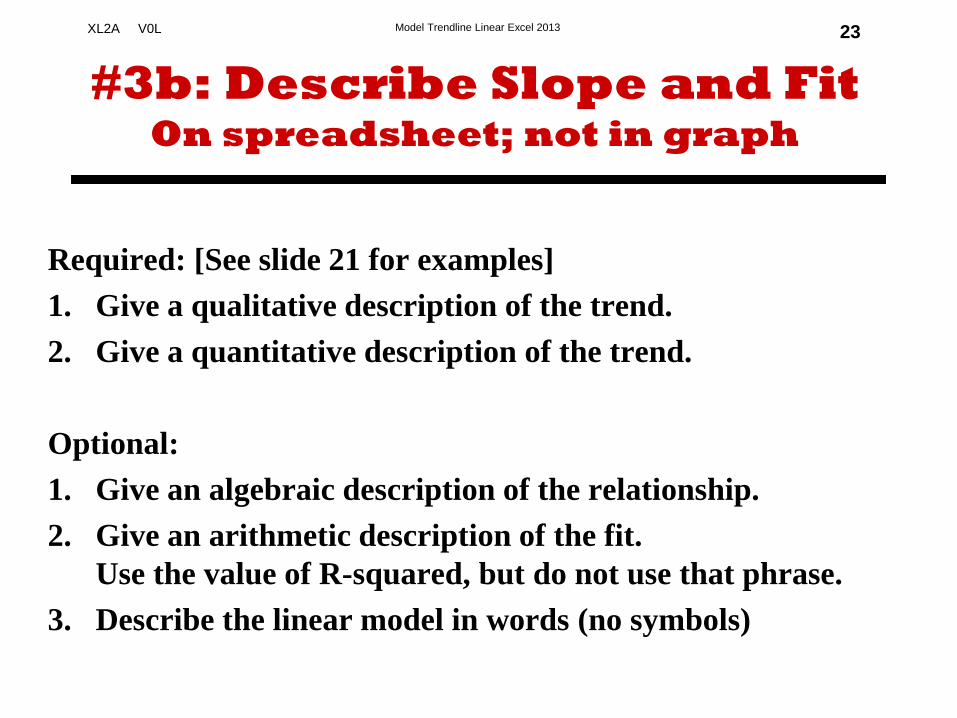
Required: [See slide 21 for examples]
1. Give a qualitative description of the trend.
2. Give a quantitative description of the trend.
Optional:
1. Give an algebraic description of the relationship.
2. Give an arithmetic description of the fit. Use the value of R-squared, but do not use that phrase.
3. Describe the linear model in words (no symbols)
Model Trendline Linear Excel 2013XL2A V0L 24
Compare Models[Not Required]
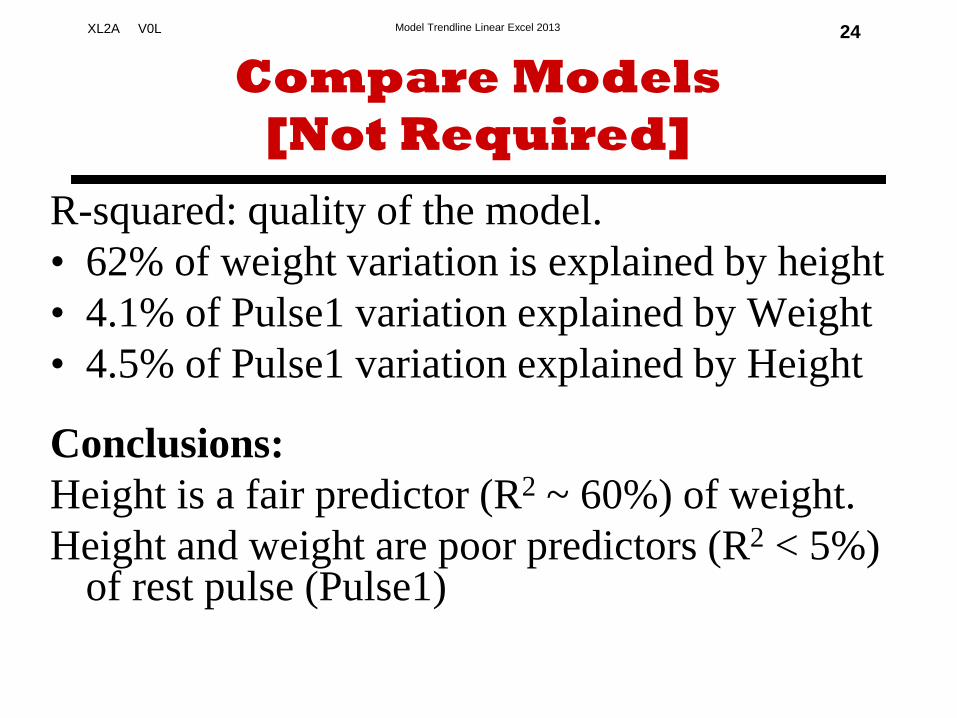
R-squared: quality of the model. • 62% of weight variation is explained by height• 4.1% of Pulse1 variation explained by Weight• 4.5% of Pulse1 variation explained by Height
Conclusions:Height is a fair predictor (R2 ~ 60%) of weight.Height and weight are poor predictors (R2 < 5%)
of rest pulse (Pulse1)
Model Trendline Linear Excel 2013XL2A V0L 1
byMilo Schield
Member: International Statistical InstituteUS Rep: International Statistical Literacy ProjectDirector, W. M. Keck Statistical Literacy Project
Slides at: www.StatLit.org/pdf/Excel2013-Model-Trendline-Linear-Slides.pdf
Model using Trendline (Linear) in Excel 2013
Model Trendline Linear Excel 2013XL2A V0L 2
Goal: Summarize association between two variables
1. Create three charts involving two quantitative variables. Slides 15, 19 & 21.
2. Show trend-line for the association. Show the equation and R2: the goodness of fit.
3. Describe trend (qualitative and quantitative) in words for each graph. See slides 15 & 20.
4. [Optional] Describe R2 and model in words.
Data source: www.StatLit.org/excel/pulse.xls
Model Trendline Linear Excel 2013XL2A V0L 3
Approach: Data Selection
Three approaches to selecting data1. Select X and Y axis data before inserting chart2. Select just the Y-axis data before inserting chart3. Select X and Y axis data after inserting chart.
Evaluation:#1: best if X-axis data is to the left of Y-axis data#2: best if X-axis data is to the right of Y-axis data #3: allows the most control.
Model Trendline Linear Excel 2013XL2A V0L 4
#1 Select columns (Ht & Wt)Insert Scatter (XY) chart
.
Model Trendline Linear Excel 2013XL2A V0L 5
If you select a column, Excel ignores row 1 if text.
Do not include row 1; Excel translates text to zero.
Model Trendline Linear Excel 2013XL2A V0L 6
First ChartNext: Remove white space
Model Trendline Linear Excel 2013XL2A V0L 7
Format X Axis
Point at horizontal axis; Press right mouse; Select “Format Axis”
Model Trendline Linear Excel 2013XL2A V0L 8
Format X Axis
Change Minimum from zero to 60
Model Trendline Linear Excel 2013XL2A V0L 9
Format X Axis: Result
Model Trendline Linear Excel 2013XL2A V0L 10
Format Y Axis:
Point at vertical axis; Press right mouse; Select “Format Axis”
Model Trendline Linear Excel 2013XL2A V0L 11
Format Y Axis: Result
Change Y-Minimum from zero to 90
Model Trendline Linear Excel 2013XL2A V0L 12
Insert Trend-line & Formulas
Select Chart Elements
Model Trendline Linear Excel 2013XL2A V0L 13
Insert Trend-line & Formulas
Check “Trendline” (Linear is default); Select “More Options”
Model Trendline Linear Excel 2013XL2A V0L 14
Select Column Chart Icon;Check Linear Equation & R2
Check “Display Equation”; Check “Display R-squared value”
Display EquationDisplay R-squared
Model Trendline Linear Excel 2013XL2A V0L 15
Edit Headings; Match ThisOptional: Marker & Line Styles
Model Trendline Linear Excel 2013XL2A V0L 16
Describe Slope (Qual+Quant) & FitOn spreadsheet; not in graph
Slope (Qualitative. Use either one): • Taller people weigh more [than shorter people]• As height increases, weight increases (a positive association).
Slope (Quantitative. Use either one): • As height increases by 1 inch, weight increases by 5.1 pounds.• Weight increases by 5.1 pounds for every 1” increase in height.------------------------------------------------------------------------------------------------------------------------------------------------------------------------------------------------------------------
Quality of the Model (Fit) using R-squared [Optional]• 62% of variation in weight is eliminated (explained) by height.
Linear model of Weight based on Height: [Optional]• Predicted weight = (5.1#/inch)*Height(inches) – 240#• Mean height is 65”; Mean weight is 150#.• Predicted weight = AveWt + (5.1#/inch)(Ht – AveHt)
Model Trendline Linear Excel 2013XL2A V0L
.
17
#2a Select Pulse1 (column A)#2b Insert XY Plot
Model Trendline Linear Excel 2013XL2A V0L 18
#2c Right-mouse on the data. Select “Select Data”
.
Model Trendline Linear Excel 2013XL2A V0L
.
19
#2d Select “Edit Data”#2e In Series X, select Weight
Note: Do not include row 1: the heading row
Model Trendline Linear Excel 2013XL2A V0L 20
#2f Format Axis & Title. Add Trendline, Equation & R2
Formatting of trend line and markers is optional
Model Trendline Linear Excel 2013XL2A V0L 21
Describe slope (Qual+Quant) & Fiton spreadsheet; not in graph
Slope (Qualitative, Use either one): • Heavier people have a lower rest pulse rate [than lighter people]• As weight increases, rest pulse decreases.• There is a negative association between rest pulse and weight.
Slope (Quantitative, Use either one): • As weight increases by 1#, rest pulse decreases by 0.09 BPM.• Rest pulse decreases by 0.09 bpm for every extra # of weight. --------------------------------------------------------------------------------------------------------------------------------------------------------------------------------------------------------------------
Quality of the Model (Fit) using R-squared [Optional]• 4% of variation in rest pulse is eliminated (explained) by weight
Linear model of Rest Pulse based on Weight: [Optional]• Predicted rest pulse = [-0.094 bpm/#]*Weight(#) + 86.5 bpm• Predicted weight = AveWeight + [5.1#/inch][Height – AveHt]
Model Trendline Linear Excel 2013XL2A V0L 22
#3: Duplicate previous graph but with Height on X-Axis
Erase old Trendline; Create new one In Select Data, replace D with C
Model Trendline Linear Excel 2013XL2A V0L 23
#3b: Describe Slope and FitOn spreadsheet; not in graph
Required: [See slide 21 for examples]1. Give a qualitative description of the trend.2. Give a quantitative description of the trend.
Optional: 1. Give an algebraic description of the relationship.2. Give an arithmetic description of the fit.
Use the value of R-squared, but do not use that phrase.3. Describe the linear model in words (no symbols)
Model Trendline Linear Excel 2013XL2A V0L 24
Compare Models[Not Required]
R-squared: quality of the model. • 62% of weight variation is explained by height• 4.1% of Pulse1 variation explained by Weight• 4.5% of Pulse1 variation explained by Height
Conclusions:Height is a fair predictor (R2 ~ 60%) of weight.Height and weight are poor predictors (R2 < 5%)
of rest pulse (Pulse1)
Related Documents


![Trendline [mag] Ed 006](https://static.cupdf.com/doc/110x72/568c39cf1a28ab0235a3c599/trendline-mag-ed-006.jpg)

![Trendline [mag] Ed 003](https://static.cupdf.com/doc/110x72/568c37411a28ab02359afba6/trendline-mag-ed-003.jpg)