1 Linear Methods for Classification ● Linear and Logistic Regression, LDA, QDA, ● k-NN (k Nearest Neighbors) ● optimal separating hyperplane – will be later (SVM) Some Figures from Elem. of Stat. Learning (advanced book), the rest from Introduction to SL.

Welcome message from author
This document is posted to help you gain knowledge. Please leave a comment to let me know what you think about it! Share it to your friends and learn new things together.
Transcript

1
Linear Methods for Classification●Linear and Logistic Regression, LDA, QDA,
●k-NN (k Nearest Neighbors)
● optimal separating hyperplane – will be later (SVM)
Some Figures from Elem. of Stat. Learning (advanced book), the rest from Introduction to SL.
2
Classification● We have a qualitative (categorical) goal variable
G.● The goal: classify to the true class g from G.● Often: probability P(G=g | X) is predicted.● Regression can be used,● LOGISTIC regression is preffered over linear.● Alternatives:
● LDA linear discriminant analysis● k-NN k-nearest neighbours● SVM, decision trees and derived methods.

3
Example: Default Dataset● Goal:
● Will individual default on his/her payment?● Data:<Income, Balance, Student, G=Default>● Often displayed as color map.● Only a fraction of non-default individual
depicted.● Individuals with default
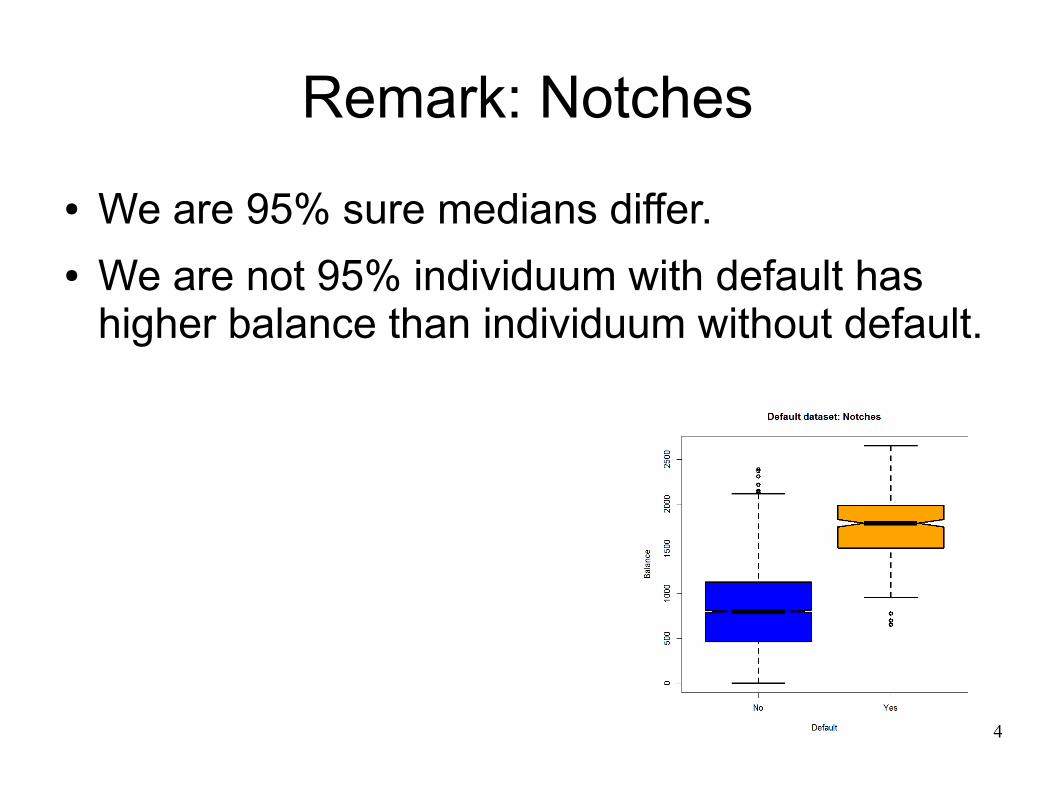
tend to have higher balances.
4
Remark: Notches● We are 95% sure medians differ.● We are not 95% individuum with default has
higher balance than individuum without default.

5
Why Not Linear Regression?● Really bad approach is to code diagnosis
numerically ● (since there is no ordering no scale).
● Different coding could lead to very different model.
● If G has natural ordering ● AND the gaps between values are similar the coding 1,2,3 would be reasonable.

6
Binary Goal Variable● Coding 0/1 or -1/1 is possible.● Still, logistic regession is prefered
● no masking, no negative probabilities.

7
● We have three dummy variables Green, Blue, Orange, linear regression for each .
better model:● or even linear cuts are possible.
Masking in Linear Regression for G
P (g i / x)

8
Logistic Regession● logit function● We create linear model for transfored input
● The 'inverse' is called logistic function
9
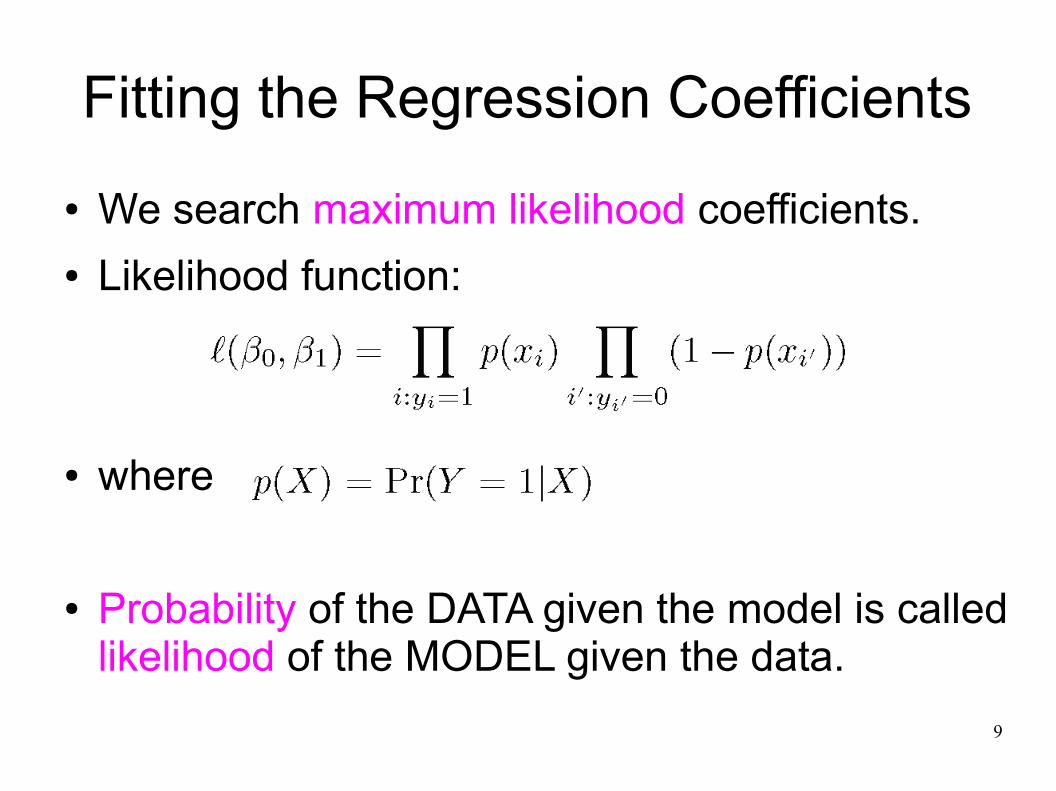
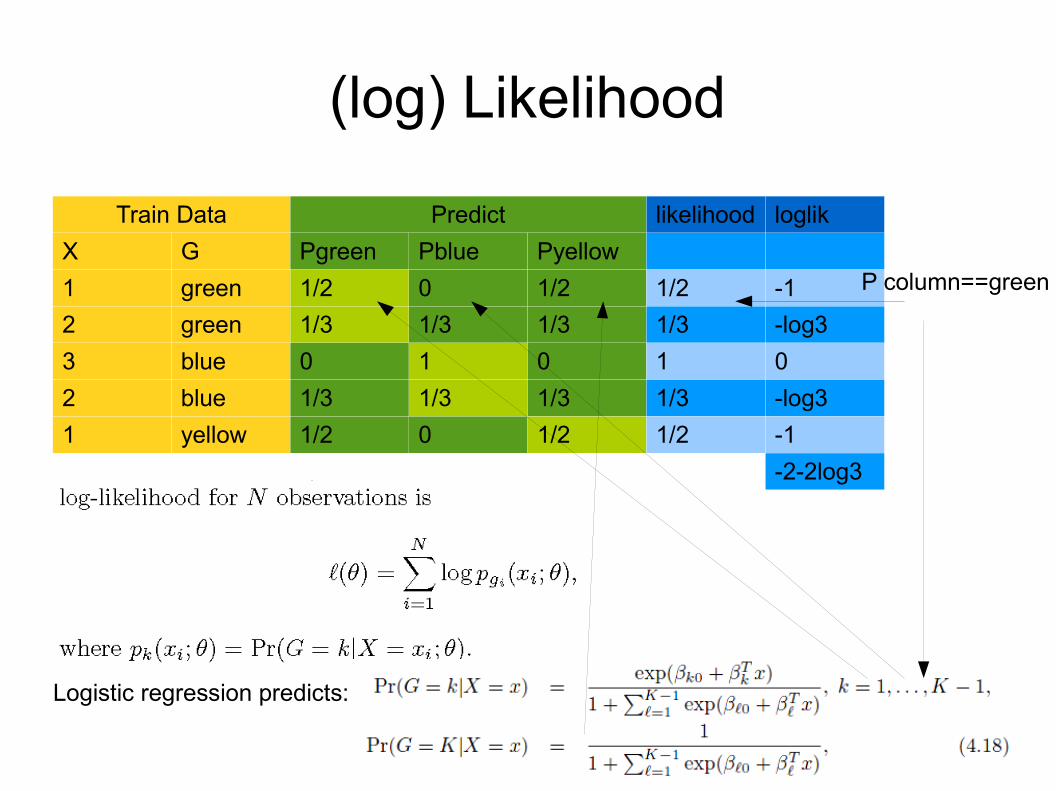
Fitting the Regression Coefficients● We search maximum likelihood coefficients.● Likelihood function:
● where
● Probability of the DATA given the model is called likelihood of the MODEL given the data.
10
(log) Likelihood
Train Data Predict likelihood loglikX G Pgreen Pblue Pyellow1 green 1/2 0 1/2 1/2 -12 green 1/3 1/3 1/3 1/3 -log33 blue 0 1 0 1 02 blue 1/3 1/3 1/3 1/3 -log31 yellow 1/2 0 1/2 1/2 -1
-2-2log3
Logistic regression predicts:
P column==green

11
Fitted Model
● therefore
● generally:
P (default /balance)= e−10.6513+0.0055balance
1+e−10.6513+0.0055balance
P (¬default /balance)= 11+e−10.6513+0.0055balance
fit.g=glm(default~balance, family='binomial',data=Wage)

12
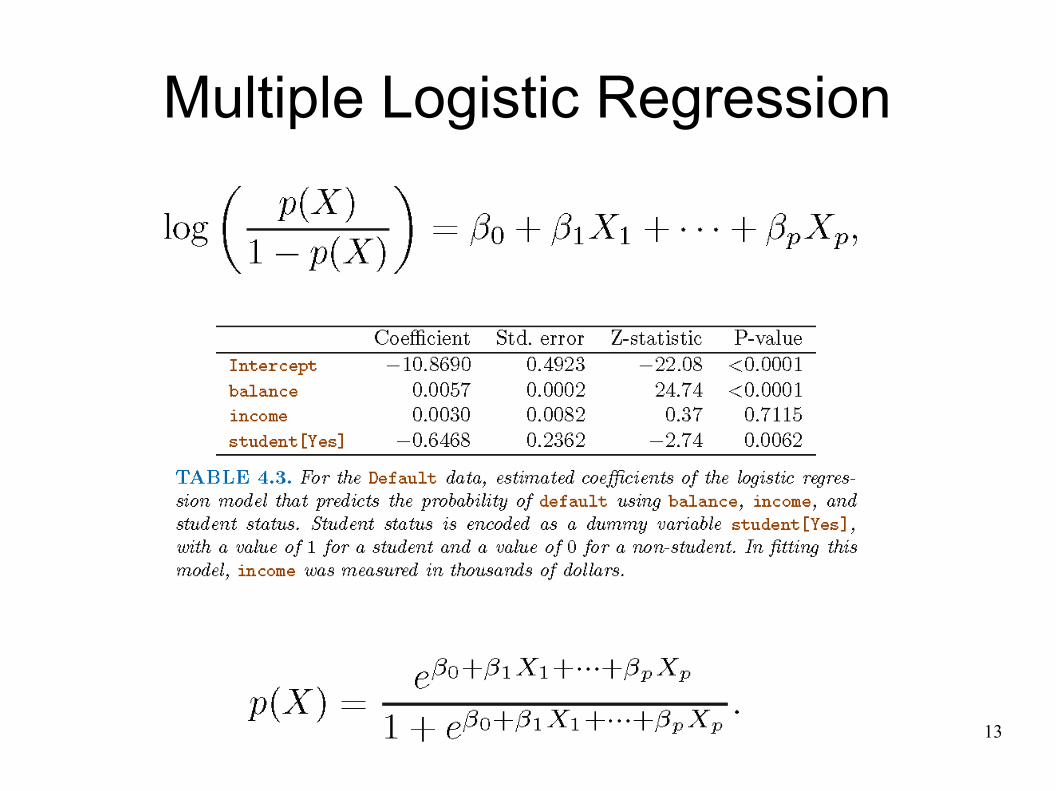
Discrete X: Codding (Automatic)● Each except one value has its dummy variable.
13
Multiple Logistic Regression

14
More Response Classes● Model has the form:
● To probabilities:

15
Confounding

16
LDA - Linear Discriminant Analysis● assumes Normal distibution X for each class g,
17
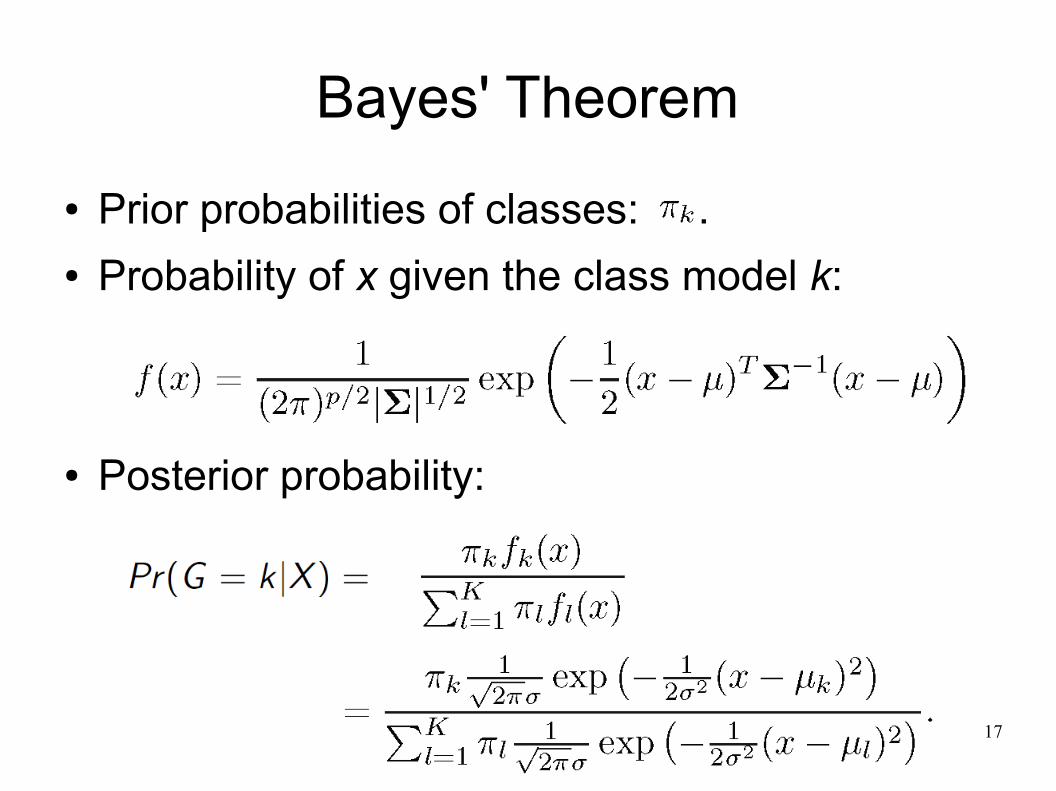
Bayes' Theorem● Prior probabilities of classes: .● Probability of x given the class model k:
● Posterior probability:

18
Example:
● If prior probability of green class is lower, the decision boundary moves to the left.

19
Bayes Boundary● Assume we know the true distribution of data.● For each x, predict the class g
j with the highest
P(G=gj|X=x).
● No better prediction can be made.● The error of such model is called Bayes error
this gives lower bound for our classifiers.

20
LDA – One Dimension● We calcultate from the data:
● We predict the class with maximal:
It comes from the logarithm of probabilities, terms in all deltas are errased.
21
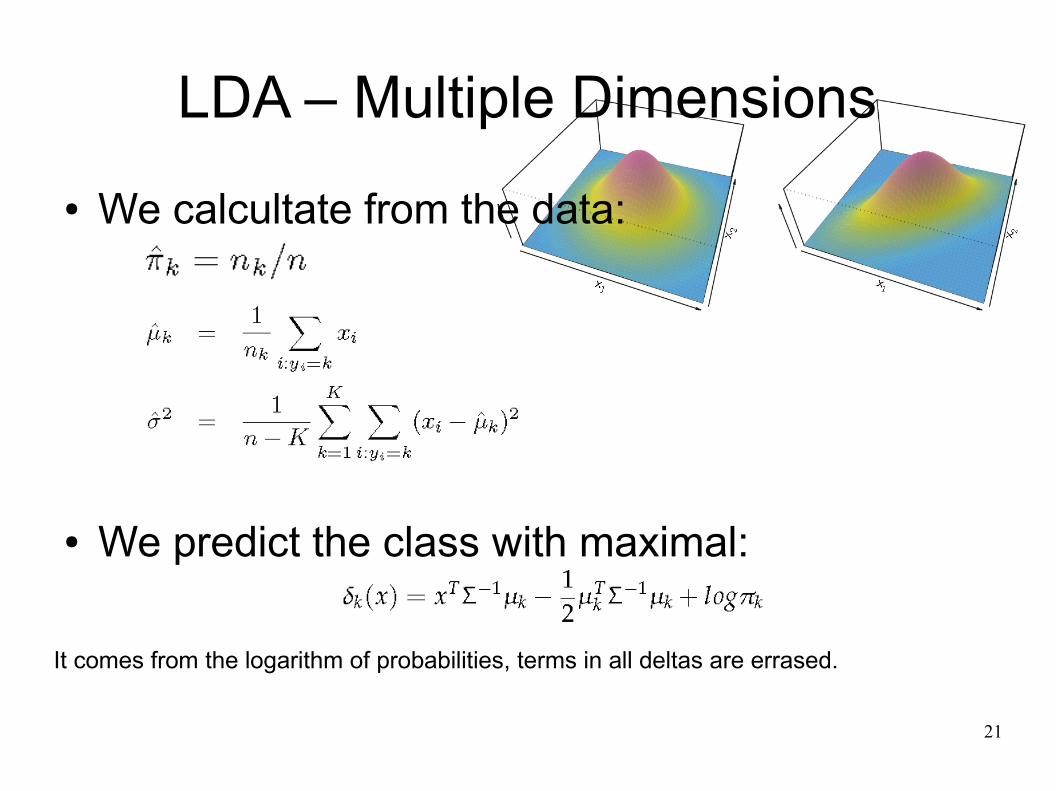
LDA – Multiple Dimensions● We calcultate from the data:
● We predict the class with maximal:
It comes from the logarithm of probabilities, terms in all deltas are errased.

22
Confusion matrixEvaluation of a Classifier
● Classification error: (252+23)/10000=0.0275● Is this classifier:
– almost perfect– slightly better then trivial– bad?

23
Different Error Costs
● Default occured 333, we recognized 81 – it is we missed 252 defaults.
● We can consider as risky all with p >0.2, then we miss less defaults.● green: total error● blue: 'default=Y' error● orange: non-default

24
ROC Curve

25
QDA – k Covariance Matrices
„Elipses may be different for each class“.● More parameters in the model.● Both LDA and QDA are often used.

26
Classification (discrete G)● Error Cost matrix L dim KxK, K number of g in G.● 0 on the diagonal, non-negative everywhere
L(k,l) cost of predict true Gk to be G
l.
● Bayes classifier, bayes rate.

27
QDA or Basis Expansion usually not a big difference

28
Comparison of Classifiers● LDA – assumes normal distribution,● logistic regression assumes less,● both leads to linear decision boundary.
gaussian true dist. corellated x t-distribution (more flat)

29
Comparison 2
● if assumptions are met – better prediction with fewer data,
● assumptions not met – often worst prediction.
gaussian,different covariances
gauss., non-corellgoal f. X
12,X
22,X
1X
2
gauss., non-corell.,complex goal function
30
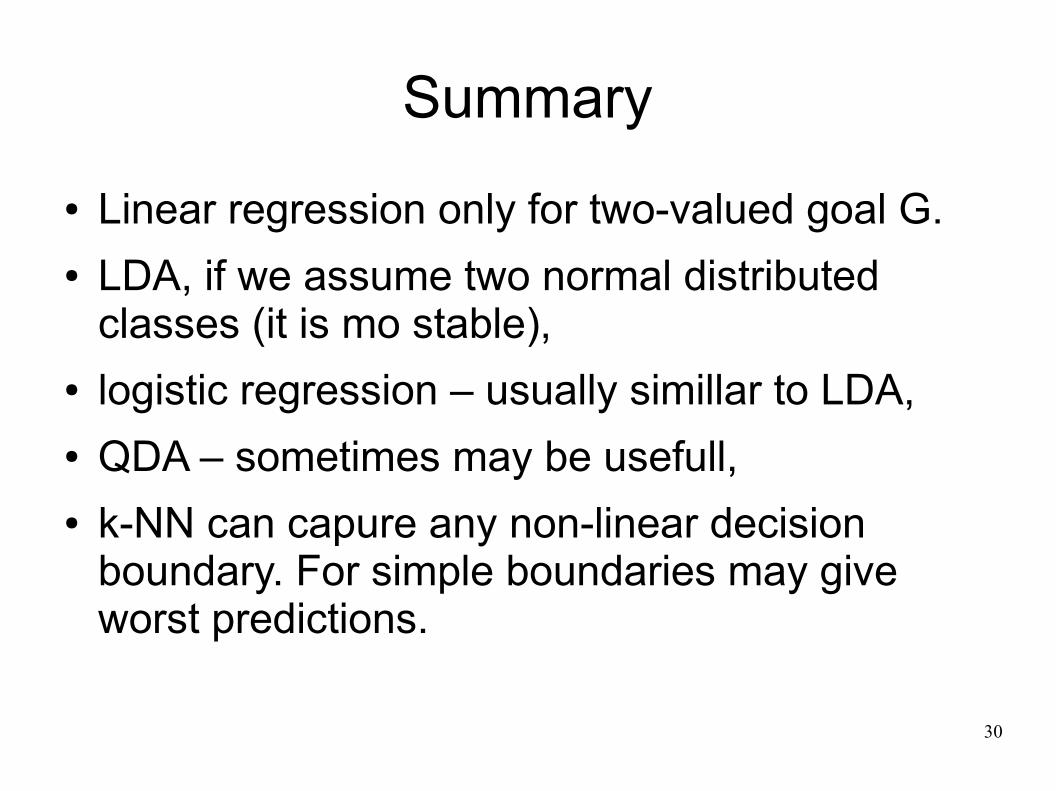
Summary● Linear regression only for two-valued goal G.● LDA, if we assume two normal distributed
classes (it is mo stable),● logistic regression – usually simillar to LDA,● QDA – sometimes may be usefull,● k-NN can capure any non-linear decision
boundary. For simple boundaries may give worst predictions.

31
Ahead:

32
Optimal Separating Hyperplane
33
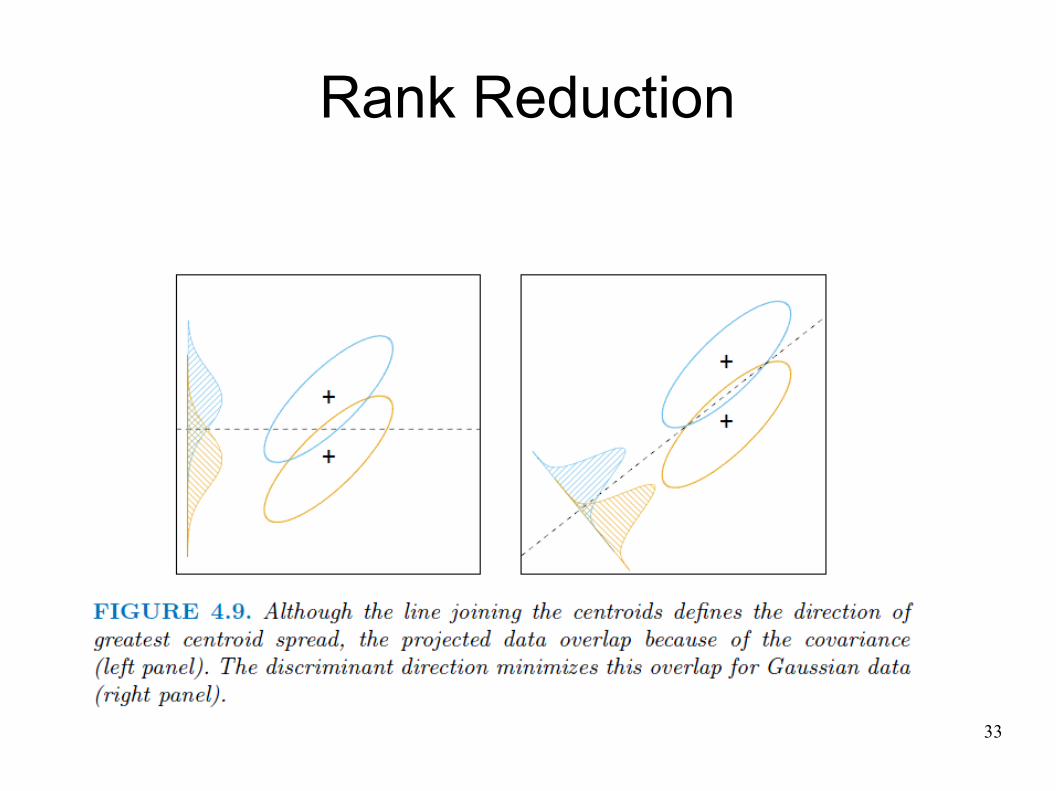
Rank Reduction
Related Documents