Line-transect survey of Hector’s dolphin abundance between Farewell Spit and Motunau DOC SCIENCE INTERNAL SERIES 22 Deanna Clement, Elisabeth Slooten, Stephen Dawson and Sam DuFresne Published by Department of Conservation P.O. Box 10-420 Wellington, New Zealand

Welcome message from author
This document is posted to help you gain knowledge. Please leave a comment to let me know what you think about it! Share it to your friends and learn new things together.
Transcript
Line-transect survey of Hector’sdolphin abundance betweenFarewell Spit and Motunau
DOC SCIENCE INTERNAL SERIES 22
Deanna Clement, Elisabeth Slooten, Stephen Dawson and Sam DuFresne
Published by
Department of Conservation
P.O. Box 10-420
Wellington, New Zealand
DOC Science Internal Series is a published record of scientific research carried out, or advice given, by
Department of Conservation staff, or external contractors funded by DOC. It comprises progress
reports and short communications that are generally peer-reviewed within DOC, but not always
externally refereed. Fully refereed contract reports funded from the Conservation Services Levy are
also included.
Individual contributions to the series are first released on the departmental intranet in pdf form.
Hardcopy is printed, bound, and distributed at regular intervals. Titles are listed in the DOC Science
Publishing catalogue on the departmental website http://www.doc.govt.nz and electronic copies of
CSL papers can be downloaded from http://csl.doc.govt.nz
© December 2001, New Zealand Department of Conservation
ISSN 1175–6519
ISBN 0–478–22180–0
This is a client report funded from the Conservation Services Levy on contract 3075. It was prepared
for publication by DOC Science Publishing, Science & Research Unit; editing by Lynette Clelland and
layout by Geoff Gregory. Publication was approved by the Manager, Science & Research Unit, Science
Technology and Information Services, Department of Conservation, Wellington.
CONTENTS
Abstract 5
1. Introduction 6
2. Methods 6
2.1 Farewell Spit–Motunau line transect survey 6
2.2 Field methods 9
2.3 Data analysis: Abundance estimation 9
3. Results 11
3.1 Survey effort and sightings 11
3.2 Abundance estimates for 2000 Farewell Spit–Motunau survey 11
4. Discussion 13
5. Acknowledgements 14
6. References 15
5DOC Science Internal Series 22
© December 2001, New Zealand Department of Conservation. This paper may be cited as:
Clement, D.; Slooten, E.; Dawson, S.; DuFresne, S. 2001. Line-transect survey of Hector’s dolphin
abundance between Farewell Spit and Motunau. DOC Science Internal Series 22.
Department of Conservation, Wellington. 15 p.
Line-transect survey of Hector’sdolphin abundance betweenFarewell Spit and Motunau
Deanna Clement1, Elisabeth Slooten1, Stephen Dawson2 and SamDuFresne2
1Environmental Science, University of Otago, P.O. Box 56, Dunedin, New
Zealand.
2Marine Science Department, University of Otago, P.O. Box 56, Dunedin, New
Zealand.
A B S T R A C T
This report summarises the results of line-transect surveys undertaken in 1999/
2000 to quantify the abundance of Hector’s dolphins (Cephalorhynchus
hectori) in the coastal area between Farewell Spit and Motunau, along the
north-east coast of the South Island, New Zealand. A total of 23 sightings were
recorded in 766 km of trackline. Greatest dolphin densities were found within
Queen Charlotte Sound, Cloudy and Clifford Bays, and between Cape Campbell
and Motunau, South Island, New Zealand. No sightings were reported within
Golden Bay or Tasman Bay, within Pelorus Sound, or seaward of the
Marlborough Sounds. The total corrected abundance estimate for the survey
area (to 4 n.m. offshore) is 285 dolphins (95% CI = 137–590). The total
abundance estimate, summing the two previous surveys and the current survey
(Farewell Spit to Long Point) is 1882 dolphins (95% CI = 1246–2843).
Keywords: Hector’s dolphins, Cephalorhynchus hectori, abundance estimates,
South Island, New Zealand.
6 Clement et al.—Hector’s dolphin abundance, Farewell Spit–Motunau
1. Introduction
The third of an on-going programme of line-transect surveys to estimate
abundance of Hector’s dolphins (Cephalorhynchus hectori) was completed
between December 1999 and February 2000, covering the area from Farewell
Spit to Motunau (north-east coast of the South Island, New Zealand; Figs 1, 2).
The first survey encompassed the area between Motunau and Timaru during the
summer of 1998 (Dawson et al. 2000). The second survey extended coverage
from Timaru to Long Point in the 1998/99 summer (DuFresne et al. 2001).
Surveys of the west coasts of the North Island and South Island will complete a
population survey for Hector’s dolphins. There are occasional sightings in other
areas, but these are too infrequent to allow abundance estimation by any
standard survey method.
Current and accurate abundance estimates are a basic requirement for
management. Effective conservation management is of key importance for
Hector’s dolphin due to their slow population growth and limited distribution
(Dawson & Slooten 1988), genetically different sub-populations (Pichler et al.
1998), and mortality in gillnet fishing (Dawson 1991).
2. Methods
2 . 1 F A R E W E L L S P I T – M O T U N A U L I N E T R A N S E C T
S U R V E Y
The line-transect survey methods used were the same as for the previous two
surveys, and we used the same correction factor for dolphin attraction and
missed sightings (Dawson et al. 2000, DuFresne et al. 2001). We used the same
vessel (RV Catalyst) which is equipped with a purpose-built observer platform,
providing a 6 m eye height. Catalyst has a cruising speed of 9–10 knots and a
minimum working depth of 2 m.
The survey design consisted of transect lines laid out across factors known to
influence Hector’s dolphin density (Figs 1, 2). As in our previous line-transect
surveys, transects were placed at 45° to the coast to account for dolphin
movement alongshore (Slooten & Dawson 1994) and declining density with
distance offshore (Dawson & Slooten 1988).
Transect line spacing was decided mainly on the basis of existing data on
dolphin distribution (Dawson & Slooten 1988), and reports of recent sightings.
As in the previous two surveys, the goal was to put most survey effort into areas
of relatively high density because these will contribute most to the overall
abundance estimate. Inshore transects (from the coast to 4 nautical miles (n.m.)
offshore) were spaced at 8 n.m. apart between Farewell Spit and Cape
Koamaru, as previous information indicated very low dolphin densities in this
7DOC Science Internal Series 22
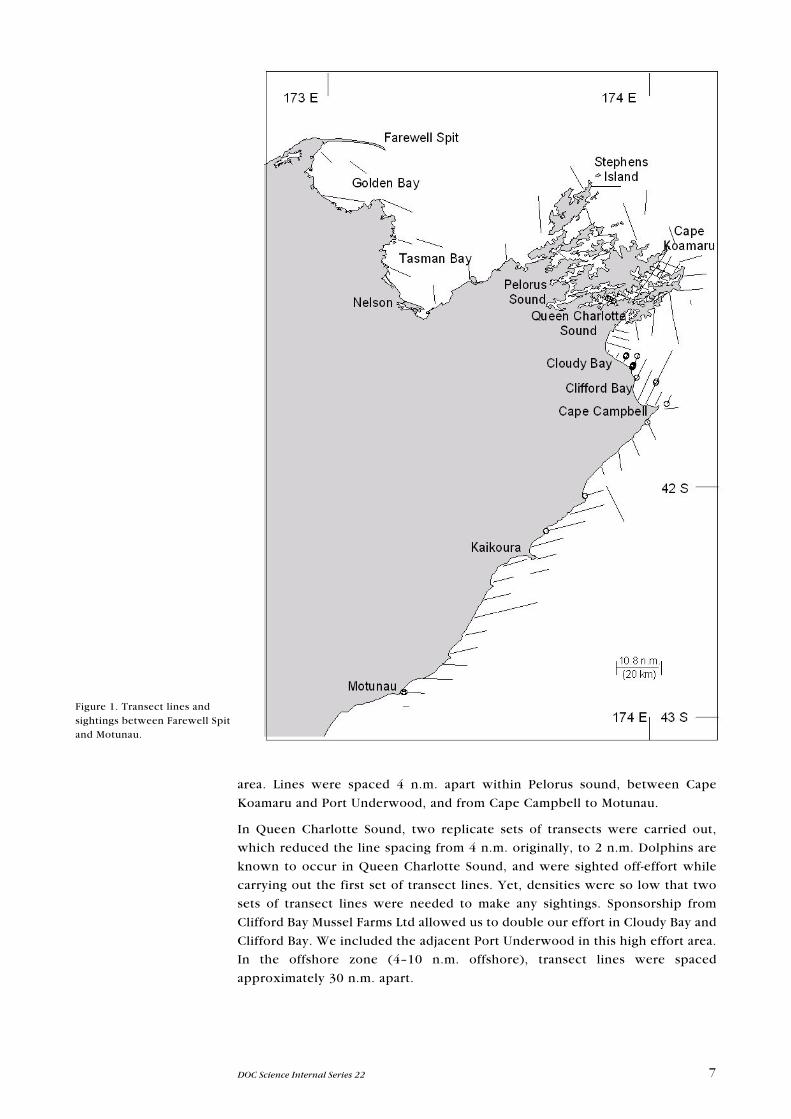
Figure 1. Transect lines andsightings between Farewell Spitand Motunau.
area. Lines were spaced 4 n.m. apart within Pelorus sound, between Cape
Koamaru and Port Underwood, and from Cape Campbell to Motunau.
In Queen Charlotte Sound, two replicate sets of transects were carried out,
which reduced the line spacing from 4 n.m. originally, to 2 n.m. Dolphins are
known to occur in Queen Charlotte Sound, and were sighted off-effort while
carrying out the first set of transect lines. Yet, densities were so low that two
sets of transect lines were needed to make any sightings. Sponsorship from
Clifford Bay Mussel Farms Ltd allowed us to double our effort in Cloudy Bay and
Clifford Bay. We included the adjacent Port Underwood in this high effort area.
In the offshore zone (4–10 n.m. offshore), transect lines were spaced
approximately 30 n.m. apart.
8 Clement et al.—Hector’s dolphin abundance, Farewell Spit–Motunau
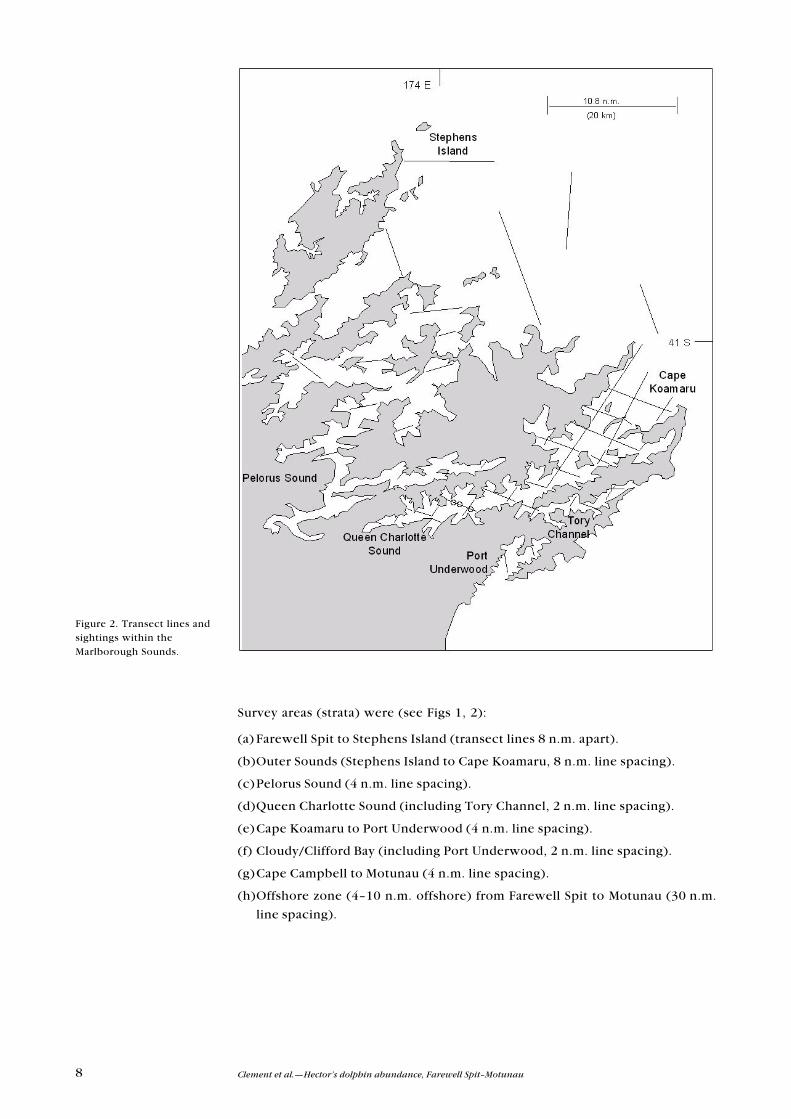
Survey areas (strata) were (see Figs 1, 2):
(a) Farewell Spit to Stephens Island (transect lines 8 n.m. apart).
(b)Outer Sounds (Stephens Island to Cape Koamaru, 8 n.m. line spacing).
(c)Pelorus Sound (4 n.m. line spacing).
(d)Queen Charlotte Sound (including Tory Channel, 2 n.m. line spacing).
(e)Cape Koamaru to Port Underwood (4 n.m. line spacing).
(f) Cloudy/Clifford Bay (including Port Underwood, 2 n.m. line spacing).
(g)Cape Campbell to Motunau (4 n.m. line spacing).
(h)Offshore zone (4–10 n.m. offshore) from Farewell Spit to Motunau (30 n.m.
line spacing).
Figure 2. Transect lines andsightings within theMarlborough Sounds.
9DOC Science Internal Series 22
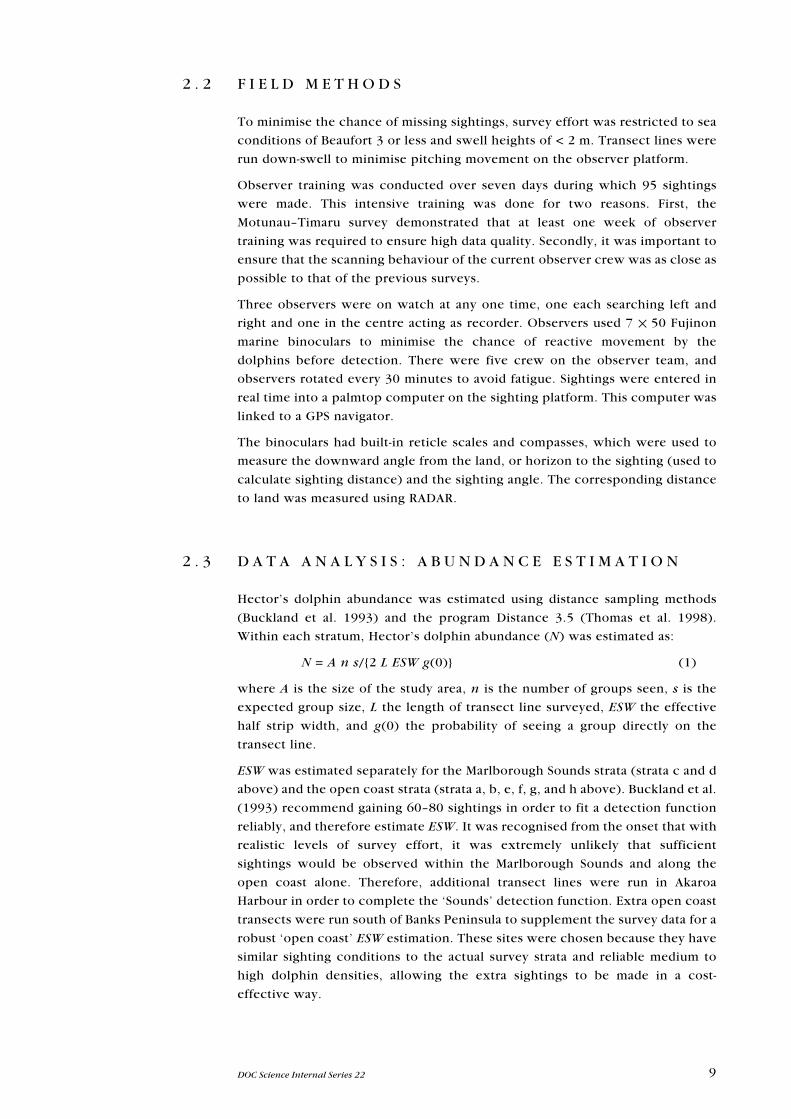
2 . 2 F I E L D M E T H O D S
To minimise the chance of missing sightings, survey effort was restricted to sea
conditions of Beaufort 3 or less and swell heights of < 2 m. Transect lines were
run down-swell to minimise pitching movement on the observer platform.
Observer training was conducted over seven days during which 95 sightings
were made. This intensive training was done for two reasons. First, the
Motunau–Timaru survey demonstrated that at least one week of observer
training was required to ensure high data quality. Secondly, it was important to
ensure that the scanning behaviour of the current observer crew was as close as
possible to that of the previous surveys.
Three observers were on watch at any one time, one each searching left and
right and one in the centre acting as recorder. Observers used 7 ✕ 50 Fujinon
marine binoculars to minimise the chance of reactive movement by the
dolphins before detection. There were five crew on the observer team, and
observers rotated every 30 minutes to avoid fatigue. Sightings were entered in
real time into a palmtop computer on the sighting platform. This computer was
linked to a GPS navigator.
The binoculars had built-in reticle scales and compasses, which were used to
measure the downward angle from the land, or horizon to the sighting (used to
calculate sighting distance) and the sighting angle. The corresponding distance
to land was measured using RADAR.
2 . 3 D A T A A N A L Y S I S : A B U N D A N C E E S T I M A T I O N
Hector’s dolphin abundance was estimated using distance sampling methods
(Buckland et al. 1993) and the program Distance 3.5 (Thomas et al. 1998).
Within each stratum, Hector’s dolphin abundance (N) was estimated as:
N = A n s/{2 L ESW g(0)} (1)
where A is the size of the study area, n is the number of groups seen, s is the
expected group size, L the length of transect line surveyed, ESW the effective
half strip width, and g(0) the probability of seeing a group directly on the
transect line.
ESW was estimated separately for the Marlborough Sounds strata (strata c and d
above) and the open coast strata (strata a, b, e, f, g, and h above). Buckland et al.
(1993) recommend gaining 60–80 sightings in order to fit a detection function
reliably, and therefore estimate ESW. It was recognised from the onset that with
realistic levels of survey effort, it was extremely unlikely that sufficient
sightings would be observed within the Marlborough Sounds and along the
open coast alone. Therefore, additional transect lines were run in Akaroa
Harbour in order to complete the ‘Sounds’ detection function. Extra open coast
transects were run south of Banks Peninsula to supplement the survey data for a
robust ‘open coast’ ESW estimation. These sites were chosen because they have
similar sighting conditions to the actual survey strata and reliable medium to
high dolphin densities, allowing the extra sightings to be made in a cost-
effective way.
10 Clement et al.—Hector’s dolphin abundance, Farewell Spit–Motunau
Using Distance 3.5 (Thomas et al. 1998) a hazard key function with cosine
adjustments (Sounds strata) and a uniform key function with cosine adjustments
(open coast strata) were fitted to perpendicular distance data to estimate ESW.
Akaike’s Information Criterion was used to select among models fitted to the
data. Potential model choices were: hazard/cosine, hazard/polynomial, half-
normal/cosine, half-normal/hermite, and uniform/cosine. Perpendicular sight-
ing distances were truncated at 5%, as recommended by Buckland et al. (1993),
and binned manually for f(0) estimation. Sightings for which range (radial
distance) was estimated by eye were removed before f(0) estimation, but were
used for density estimation.
The coefficient of variation (CV) of the uncorrected abundance estimates (NS)
were calculated from the CV of each variable in Equation 1:
CV(N) = √ {CV2(n) + CV2(s) + CV2(ESW)} (2)
The CV(n) was estimated empirically as recommended by Buckland et al.
(1993):
CV(n) = √ {var(n)/n2} (3)
where: var(n) = L ∑ li(n
i/l
i – n/L)2/(k – 1) (4)
where li was the length of transect line i, n
i was the number of sightings on
transect i, and k was the total number of transect lines within that stratum.
The CV(s) was estimated from the standard error of the mean group size. The
CV(ESW) was estimated using the Distance 3.5 bootstrapping option. This
process incorporates uncertainty in model fitting and model selection.
Abundance estimates (NS) were then corrected using the correction factor (c)
generated from the 1999 survey (DuFresne et al. 2001). The corrected
abundance estimates (NU) were calculated by:
NU = c N
S(5)
The CVs of the corrected abundance estimates (NU) were estimated by:
CV(NU) = √ {CV2(c) + CV2(N
S)} (6)
where: CV(c) = SE(c)/c (7)
Upper and lower 95% confidence intervals (CI) for NU were calculated using the
Satterthwaite degrees of freedom procedure outlined in Buckland et al. (1993).
This procedure assumes a log-normal distribution, using:
CIL = N
U/C
and CIU = N
U C (8)
where: C = exp{tdf(0.025) √ log
e (1 + CV2(N
U))} (9)
and: df = CV4(NU)/{CV4(c)/(B – 1) + CV4(N
S)/df
S} (10)
where B is the number of bootstrap samples, and dfS is the Satterthwaite degrees
of freedom for the uncorrected abundance estimate (NS). The Satterthwaite
degrees of freedom (dfS) were calculated by:
dfS = CV4(N
S)/{CV4(n)/(k – 1) + CV4(ESW)/n} (11)
(See Buckland et al. (1993) for a detailed explanation of this procedure.)
11DOC Science Internal Series 22
The CV for the total corrected abundance estimate (NU) for Farewell Spit to
Motunau was calculated by:
CV(NU) = SE(N
U)/N
U(12)
where: SE(NU) = √ {SE2(N
1) + SE2(N
2) + ... SE2(N
i)} (13)
3. Results
3 . 1 S U R V E Y E F F O R T A N D S I G H T I N G S
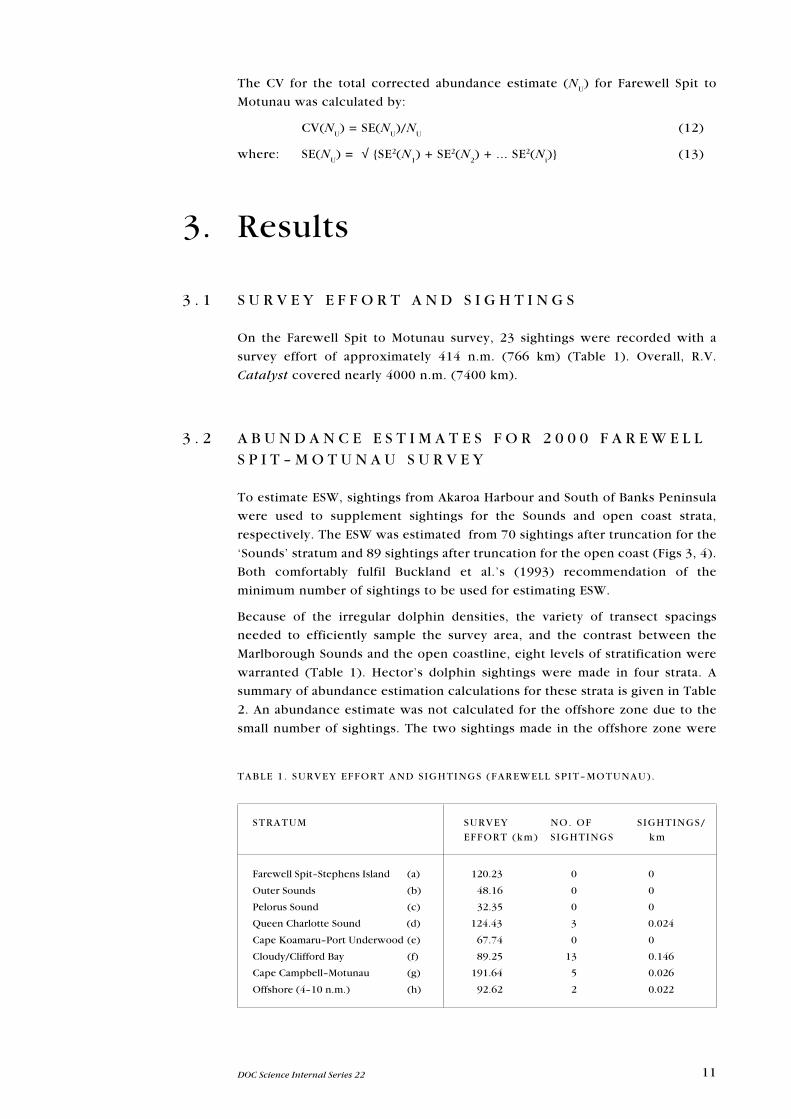
On the Farewell Spit to Motunau survey, 23 sightings were recorded with a
survey effort of approximately 414 n.m. (766 km) (Table 1). Overall, R.V.
Catalyst covered nearly 4000 n.m. (7400 km).
3 . 2 A B U N D A N C E E S T I M A T E S F O R 2 0 0 0 F A R E W E L LS P I T – M O T U N A U S U R V E Y
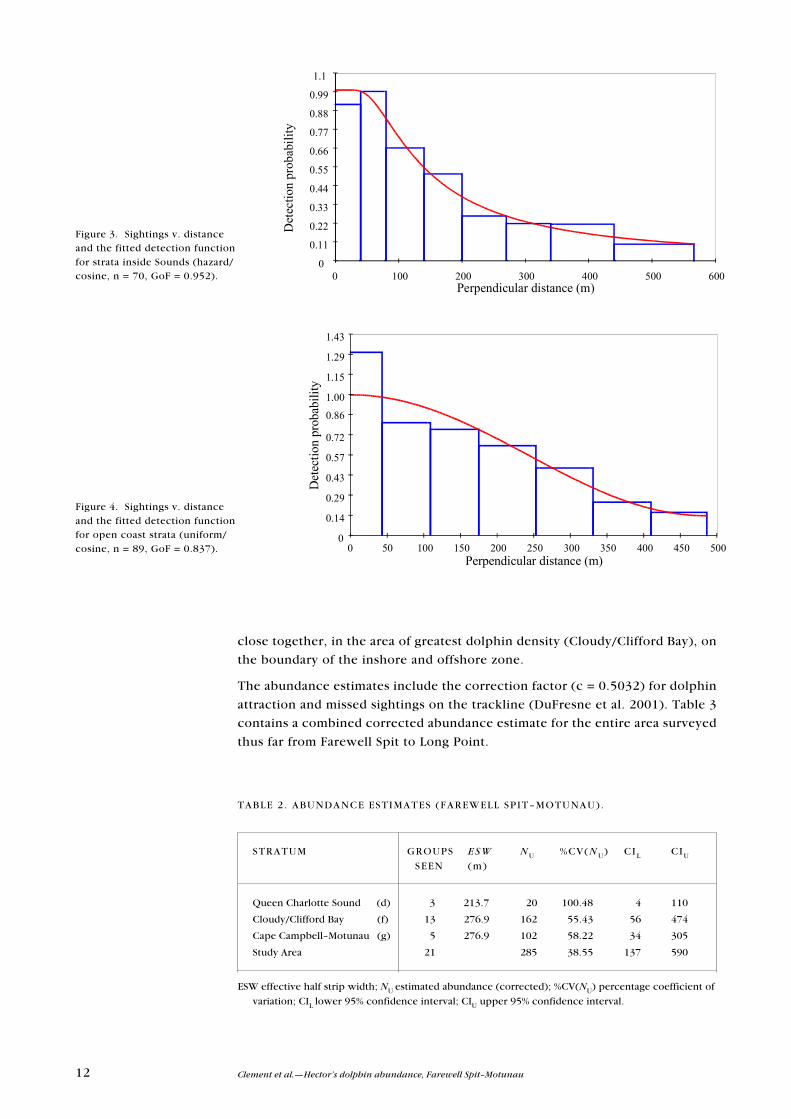
To estimate ESW, sightings from Akaroa Harbour and South of Banks Peninsula
were used to supplement sightings for the Sounds and open coast strata,
respectively. The ESW was estimated from 70 sightings after truncation for the
‘Sounds’ stratum and 89 sightings after truncation for the open coast (Figs 3, 4).
Both comfortably fulfil Buckland et al.’s (1993) recommendation of the
minimum number of sightings to be used for estimating ESW.
Because of the irregular dolphin densities, the variety of transect spacings
needed to efficiently sample the survey area, and the contrast between the
Marlborough Sounds and the open coastline, eight levels of stratification were
warranted (Table 1). Hector’s dolphin sightings were made in four strata. A
summary of abundance estimation calculations for these strata is given in Table
2. An abundance estimate was not calculated for the offshore zone due to the
small number of sightings. The two sightings made in the offshore zone were
TABLE 1 . SURVEY EFFORT AND SIGHTINGS (FAREWELL SPIT–MOTUNAU).
STRATUM SURVEY NO. OF SIGHTINGS/
EFFORT (km) SIGHTINGS km
Farewell Spit–Stephens Island (a) 120.23 0 0
Outer Sounds (b) 48.16 0 0
Pelorus Sound (c) 32.35 0 0
Queen Charlotte Sound (d) 124.43 3 0.024
Cape Koamaru–Port Underwood (e) 67.74 0 0
Cloudy/Clifford Bay (f) 89.25 13 0.146
Cape Campbell–Motunau (g) 191.64 5 0.026
Offshore (4–10 n.m.) (h) 92.62 2 0.022
12 Clement et al.—Hector’s dolphin abundance, Farewell Spit–Motunau
Figure 3. Sightings v. distanceand the fitted detection functionfor strata inside Sounds (hazard/cosine, n = 70, GoF = 0.952).
Figure 4. Sightings v. distanceand the fitted detection functionfor open coast strata (uniform/cosine, n = 89, GoF = 0.837).
0
0.14
0.29
0.43
0.57
0.72
0.86
1.00
1.15
1.29
1.43
0 50 100 150 200 250 300 350 400 450 500 Perpendicular distance (m)
Det
ectio
n pr
obab
ility
TABLE 2 . ABUNDANCE ESTIMATES (FAREWELL SPIT–MOTUNAU).
STRATUM GROUPS ESW NU %CV(N U) CIL CIU
SEEN (m)
Queen Charlotte Sound (d) 3 213.7 20 100.48 4 110
Cloudy/Clifford Bay (f) 13 276.9 162 55.43 56 474
Cape Campbell–Motunau (g) 5 276.9 102 58.22 34 305
Study Area 21 285 38.55 137 590
ESW effective half strip width; NU estimated abundance (corrected); %CV(NU) percentage coefficient of
variation; CIL lower 95% confidence interval; CIU upper 95% confidence interval.
close together, in the area of greatest dolphin density (Cloudy/Clifford Bay), on
the boundary of the inshore and offshore zone.
The abundance estimates include the correction factor (c = 0.5032) for dolphin
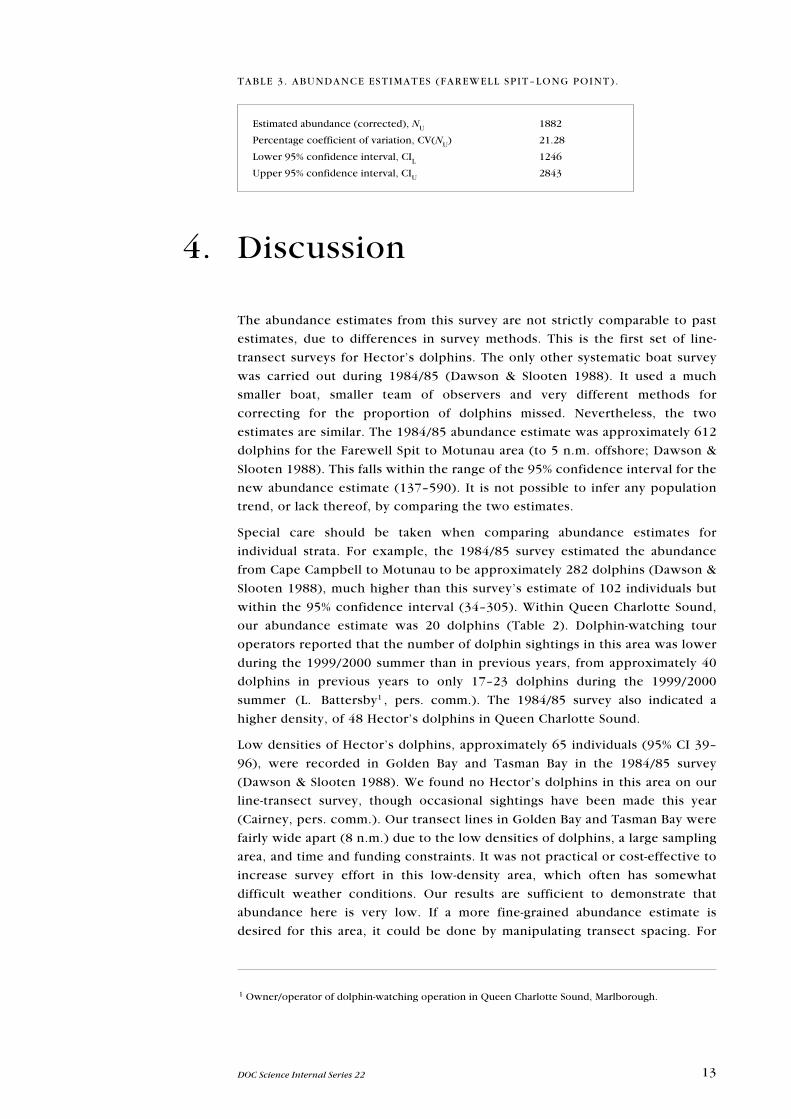
attraction and missed sightings on the trackline (DuFresne et al. 2001). Table 3
contains a combined corrected abundance estimate for the entire area surveyed
thus far from Farewell Spit to Long Point.
Det
ectio
n pr
obab
ility
0
0.11
0.22
0.33
0.44
0.55
0.66
0.77
0.88
0.99
1.1
0 100 200 300 400 500 600Perpendicular distance (m)
13DOC Science Internal Series 22
4. Discussion
The abundance estimates from this survey are not strictly comparable to past
estimates, due to differences in survey methods. This is the first set of line-
transect surveys for Hector’s dolphins. The only other systematic boat survey
was carried out during 1984/85 (Dawson & Slooten 1988). It used a much
smaller boat, smaller team of observers and very different methods for
correcting for the proportion of dolphins missed. Nevertheless, the two
estimates are similar. The 1984/85 abundance estimate was approximately 612
dolphins for the Farewell Spit to Motunau area (to 5 n.m. offshore; Dawson &
Slooten 1988). This falls within the range of the 95% confidence interval for the
new abundance estimate (137–590). It is not possible to infer any population
trend, or lack thereof, by comparing the two estimates.
Special care should be taken when comparing abundance estimates for
individual strata. For example, the 1984/85 survey estimated the abundance
from Cape Campbell to Motunau to be approximately 282 dolphins (Dawson &
Slooten 1988), much higher than this survey’s estimate of 102 individuals but
within the 95% confidence interval (34–305). Within Queen Charlotte Sound,
our abundance estimate was 20 dolphins (Table 2). Dolphin-watching tour
operators reported that the number of dolphin sightings in this area was lower
during the 1999/2000 summer than in previous years, from approximately 40
dolphins in previous years to only 17–23 dolphins during the 1999/2000
summer (L. Battersby1 , pers. comm.). The 1984/85 survey also indicated a
higher density, of 48 Hector’s dolphins in Queen Charlotte Sound.
Low densities of Hector’s dolphins, approximately 65 individuals (95% CI 39–
96), were recorded in Golden Bay and Tasman Bay in the 1984/85 survey
(Dawson & Slooten 1988). We found no Hector’s dolphins in this area on our
line-transect survey, though occasional sightings have been made this year
(Cairney, pers. comm.). Our transect lines in Golden Bay and Tasman Bay were
fairly wide apart (8 n.m.) due to the low densities of dolphins, a large sampling
area, and time and funding constraints. It was not practical or cost-effective to
increase survey effort in this low-density area, which often has somewhat
difficult weather conditions. Our results are sufficient to demonstrate that
abundance here is very low. If a more fine-grained abundance estimate is
desired for this area, it could be done by manipulating transect spacing. For
1 Owner/operator of dolphin-watching operation in Queen Charlotte Sound, Marlborough.
TABLE 3 . ABUNDANCE ESTIMATES (FAREWELL SPIT–LONG POINT) .
Estimated abundance (corrected), NU 1882
Percentage coefficient of variation, CV(NU) 21.28
Lower 95% confidence interval, CIL 1246
Upper 95% confidence interval, CIU 2843
14 Clement et al.—Hector’s dolphin abundance, Farewell Spit–Motunau
example, an effective design would be to start with transect lines 4 n.m. apart,
then add lines spaced 2 n.m. (adding new lines between the transect lines
already covered) and even 1 n.m. if necessary, to obtain an abundance estimate
with the desired level of precision.
Overall, the population estimate from this survey fell within the confidence
interval of the last population estimate. Care should be taken in comparing
abundance estimates for smaller regions.
5. Acknowledgements
This survey was funded principally by Department of Conservation contract
SCO-3075. A portion of this contract was funded by a Conservation Services
Levy from the commercial fishing industry. Clifford Bay Mussel Farms Ltd
funded an increase in the number of transect lines in the Cloudy Bay, Clifford
Bay area. Significant contributions to equipment used in the survey were made
by the New Zealand Whale and Dolphin Trust and the University of Otago. The
survey vessel was made available by Liz Slooten and Steve Dawson. We are very
grateful for the help of Ellie Dickson, Guen Jones, and Will Rayment, who were
fine observers and cheerful crew members. Akaroa Harbour Cruises and
Dolphin Encounters provided much-appreciated field support. Daryl Coup
wrote the sightings programme we used to collect data in the field. Otago
University’s Department of Surveying very helpfully provided access to Arc/
View for plotting transect lines and sightings.
15DOC Science Internal Series 22
6. References
Buckland, S.T.; Anderson, D.R.; Burnham, K.P.; Laake, J.L. 1993: Distance Sampling: Estimating
Abundance of Biological Populations. Chapman & Hall, London, reprinted 1999 by RUWPA,
University of St. Andrews, Scotland. 446 p.
Dawson, S.M. 1991: Incidental catch of Hector’s dolphins in inshore gillnets. Marine Mammal
Science 7(3): 283–295.
Dawson, S.M.; Slooten, E. 1988: Hector’s dolphin Cephalorhynchus hectori: Distribution and
abundance. Report of the International Whaling Commission (Special Issue) 9: 315–324.
Dawson, S.; DuFresne, S.; Slooten, E.; Wade, P. 2000: Line-transect survey of Hector’s dolphin
abundance between Motunau and Timaru. Published Client Report on contract 3072,
funded by Conservation Services Levy. Department of Conservation, Wellington. 18 p.
http://csl.doc.govt.nz
DuFresne, S.; Dawson, S.; Slooten, E. 2001: Line-transect survey of Hector’s dolphin abundance
between Timaru and Long Point, and effect of attraction to survey vessel. DOC Science
Internal Series 1. 19 p. http://csl.doc.govt.nz
Pichler, F.B.; Dawson, S.M.; Slooten, E.; Baker, C.S. 1998: Geographic isolation of Hector’s dolphin
populations described by mitochondrial DNA sequences. Conservation Biology 12(3):
676–682.
Slooten, E.; Dawson, S.M. 1994: Hector’s Dolphin. Pp. 311–333 in: S.H. Ridgway, S.H.; Harrison, R.
(eds) Handbook of Marine Mammals. Vol. V. Delphinidae and Phocoenidae. Academic
Press. New York.
Thomas, L.; Laake, J.L.; Derry, J.F.; Buckland, S.T.; Borchers, D.L.; Anderson, D.R.; Burnham, K.P.;
Strindberg, S.; Hedley, S.L.; Burt, M.L.; Marques, F.; Pollard, J.H.; Fewster, R.M. 1998:
Distance 3.5. Research Unit for Wildlife Population Assessment, University of St. Andrews,
UK.
Related Documents