Limits to Growth Human Population Growth 5-2 and 5-3

Welcome message from author
This document is posted to help you gain knowledge. Please leave a comment to let me know what you think about it! Share it to your friends and learn new things together.
Transcript

Limits to GrowthHuman Population Growth
5-2 and 5-3

Population Growth Is Limited
• Limiting Factor: factor that causes population growth to decrease
• 2 kinds of limiting factors1. Density-Dependent Factors: depends
on populations size2. Density-Independent Factors: affect all
populations in similar ways, regardless of size

Density Dependent Limiting Factors
• Density: the number of organisms per unit area
1. Competition-
(food, shelter, mate)
2. Predation
3. Parasitism
4. Disease• Be able to explain why these factors are present
in crowded populations (hi-density populations)

Predator-Prey Relationship

Density Independent Limiting Factor
• Affects all populations in the same way, regardless of size
1. Unusual weather
2. Natural disasters
3. Human activities
4. Seasonal cycles
• Can you give an example for each listed above?

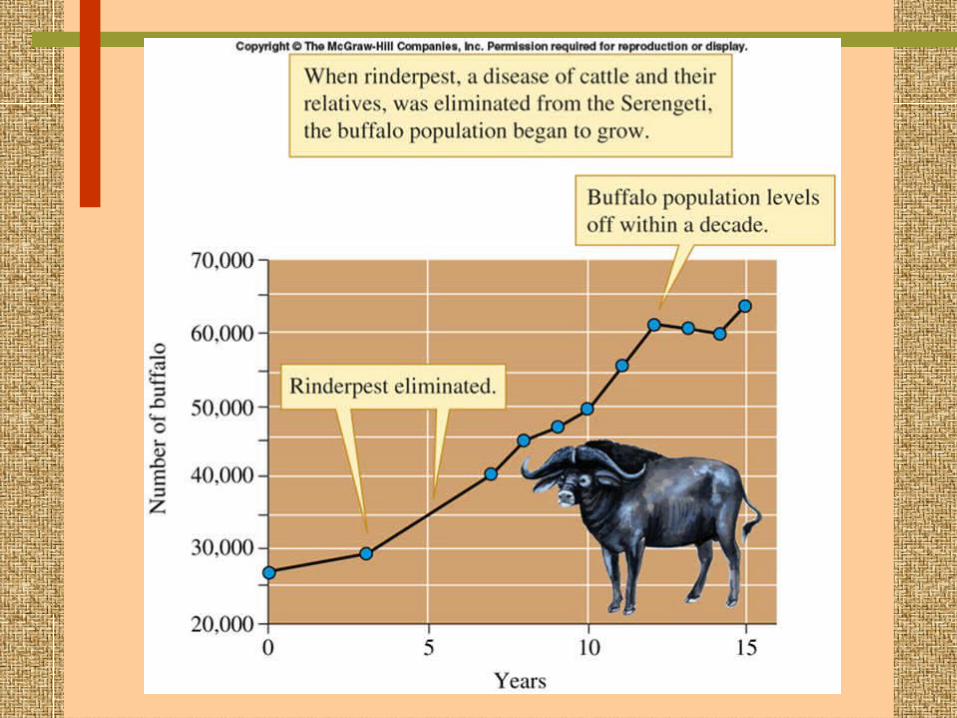
Human Populations
• In history, human population remained constant (no growth or decline)
• High birth rate and high death rate

Population Growth Goes Exponential!
• 500 years ago, human population began to explode…– Agriculture– Industry– Medicine– Improved Sanitation– Healthcare
• This drastically reduced the death rate, but didn’t change birth rate

Modeling Growth
• Demography: Scientific study of human populations
• Observation: US, Japan, Europe growth slows
• Experiment: collect data (US Census)• Model: “Demographic Transition”
Hypothesis

Comment on the Graph Below

Demographic Transition
:A dramatic change in birth rate and death rate• Stage 1: High birthrate and high death rate
– Most countries in early history• Stage 2: High birthrate and low death rate
– US (1790-1910), developing countries• Stage 3: Low birthrate and low death rate
– US (now), Europe, and Japan

Age Structure Diagrams• Population profiles to predict future growth
STABLE
RAPID GROWTH
DECLINE

Growing Populations

Not Growing

Check Yourself
• What type of growth does each graph show?

Explain This Age Structure Diagram
Related Documents