ENVIRONMENTAL SCIENCES SUSTAINABILITY SCIENCE Limiting global-mean temperature increase to 1.5–2 ◦ C could reduce the incidence and spatial spread of dengue fever in Latin America Felipe J. Col ´ on-Gonz ´ alez a,b,1 , Ian Harris a , Timothy J. Osborn a , Christine Steiner S ˜ ao Bernardo c , Carlos A. Peres a , Paul R. Hunter d , and Iain R. Lake a a School of Environmental Sciences, University of East Anglia, Norwich NR4 7TJ, United Kingdom; b Tyndall Centre for Climate Change Research, University of East Anglia, Norwich NR4 7TJ, United Kingdom; c Laboratorio de Mastozoologia, Programa de P ´ os-Graduac ¸˜ ao em Ci ˆ encias Ambientais, Universidade do Estado de Mato Grosso, Cavalhada, C ´ aceres, Mato Grosso, Brazil 78200-000; and d Norwich Medical School, University of East Anglia, Norwich NR4 7TJ, United Kingdom Edited by B. L. Turner, Arizona State University, Tempe, AZ, and approved April 27, 2018 (received for review October 30, 2017) The Paris Climate Agreement aims to hold global-mean temper- ature well below 2 ◦ C and to pursue efforts to limit it to 1.5 ◦ C above preindustrial levels. While it is recognized that there are benefits for human health in limiting global warming to 1.5 ◦ C, the magnitude with which those societal benefits will be accrued remains unquantified. Crucial to public health preparedness and response is the understanding and quantification of such impacts at different levels of warming. Using dengue in Latin America as a study case, a climate-driven dengue generalized additive mixed model was developed to predict global warming impacts using five different global circulation models, all scaled to represent multiple global-mean temperature assumptions. We show that policies to limit global warming to 2 ◦ C could reduce dengue cases by about 2.8 (0.8–7.4) million cases per year by the end of the cen- tury compared with a no-policy scenario that warms by 3.7 ◦ C. Limiting warming further to 1.5 ◦ C produces an additional drop in cases of about 0.5 (0.2–1.1) million per year. Furthermore, we found that by limiting global warming we can limit the expansion of the disease toward areas where incidence is currently low. We anticipate our study to be a starting point for more comprehen- sive studies incorporating socioeconomic scenarios and how they may further impact dengue incidence. Our results demonstrate that although future climate change may amplify dengue trans- mission in the region, impacts may be avoided by constraining the level of warming. climate change impacts | disease modeling | Latin America T here is a growing concern about the potential impacts of climate change upon human health (1–4). The effects of cli- mate change on vector-borne infectious diseases have caught a great deal of attention (5–9) because climatic factors such as tem- perature, precipitation, and humidity modulate many aspects of their biology such as the reproduction rate of the vector and the transmission rate of the pathogens they carry (10–12). Vector- borne diseases impose a large health and economic burden in many regions (13–15), and so it is crucial, from a public health perspective, to quantify the impacts of climate change on such diseases. Dengue is a rapidly spreading vector-borne viral disease that is endemic to over 100 countries. Dengue has been recently esti- mated to cause ∼390 million cases per year, using a statistical and cartographic approach (16) [almost four times the ∼100 million cases per year previously estimated by the World Health Organization based on country-specific reporting (17)]. About 54 million of these cases occur in Latin America and the Caribbean (LATAM) (16). Several studies have investigated the poten- tial impacts of climate change upon future dengue occurrence, but most of those studies are ≥15 y old, have used a maxi- mum of three general circulation models (GCMs), and are based on low-resolution climate model data for their computations of dengue risk (18–21). More recent studies have investigated the effects of climate change on the spatial distribution of the dengue mosquito vector Aedes aegypti (22), but the presence of the vector in an area does not mean that human cases will occur. Climatic and nonclimatic factors could prevent disease from occurring. For example, low temperatures increase the extrinsic incubation (12, 23) period of the virus, which may exceed the temperature- sensitive longevity of A. aegypti mosquitoes [i.e., the maximum longevity in the field is only about 33 d at temperatures of about 27 ◦ C (24, 25)], reducing the risk of transmission. Moreover, even if the climate was conducive for dengue, access to preventive measures such as air conditioning and window screening could inhibit disease occurrence (26). Also, most previous research has focused on the impacts of climate change associated with a warming of 2 ◦ C or more (27–29). The Paris Agreement under the United Nations Framework Convention on Climate Change aims to hold global-mean tem- perature well below 2 ◦ C and to pursue efforts to limit it to 1.5 ◦ C above preindustrial levels this century (30). Recent research reveals that a reduction of warming from 2 ◦ C to 1.5 ◦ C could lead to shorter heat waves, lower risk of coral reef degradation, shorter dry spells, and a 10-cm lower global sea-level rise by 2100 Significance This study is a multigeneral circulation model, multiscenario modeling exercise developed to quantify the dengue-related health benefits of limiting global warming to 1.5–2.0 ◦ C above preindustrial levels in Latin America and the Caribbean. We estimate the impact of future climate change and population growth on the additional number of dengue cases and provide insights about the regions and periods most likely affected by changes in the length of the transmission season. Here, we show that future climate change may amplify dengue transmission and that significant impacts could be avoided by constraining global warming to 1.5 ◦ C above preindus- trial levels. Our work could be a starting point for future risk assessments incorporating other important drivers of disease such as urbanization and international traveling. Author contributions: F.J.C.-G., P.R.H., and I.R.L. designed research; F.J.C.-G., I.H., T.J.O., C.S.S.B., C.A.P., and I.R.L. performed research; F.J.C.-G., I.H., and T.J.O. contributed new reagents/analytic tools; F.J.C.-G., I.H., T.J.O., and P.R.H. analyzed data; and F.J.C.-G., I.H., T.J.O., C.S.S.B., C.A.P., P.R.H., and I.R.L. wrote the paper. The authors declare no conflict of interest. This article is a PNAS Direct Submission. This open access article is distributed under Creative Commons Attribution- NonCommercial-NoDerivatives License 4.0 (CC BY-NC-ND). 1 To whom correspondence should be addressed. Email: [email protected]. This article contains supporting information online at www.pnas.org/lookup/suppl/doi:10. 1073/pnas.1718945115/-/DCSupplemental. Published online May 29, 2018. www.pnas.org/cgi/doi/10.1073/pnas.1718945115 PNAS | June 12, 2018 | vol. 115 | no. 24 | 6243–6248

Welcome message from author
This document is posted to help you gain knowledge. Please leave a comment to let me know what you think about it! Share it to your friends and learn new things together.
Transcript

ENV
IRO
NM
ENTA
LSC
IEN
CES
SUST
AIN
ABI
LITY
SCIE
NCE
Limiting global-mean temperature increase to1.5–2 ◦C could reduce the incidence and spatialspread of dengue fever in Latin AmericaFelipe J. Colon-Gonzaleza,b,1, Ian Harrisa, Timothy J. Osborna, Christine Steiner Sao Bernardoc, Carlos A. Peresa,Paul R. Hunterd, and Iain R. Lakea
aSchool of Environmental Sciences, University of East Anglia, Norwich NR4 7TJ, United Kingdom; bTyndall Centre for Climate Change Research, Universityof East Anglia, Norwich NR4 7TJ, United Kingdom; cLaboratorio de Mastozoologia, Programa de Pos-Graduacao em Ciencias Ambientais, Universidade doEstado de Mato Grosso, Cavalhada, Caceres, Mato Grosso, Brazil 78200-000; and dNorwich Medical School, University of East Anglia, Norwich NR4 7TJ,United Kingdom
Edited by B. L. Turner, Arizona State University, Tempe, AZ, and approved April 27, 2018 (received for review October 30, 2017)
The Paris Climate Agreement aims to hold global-mean temper-ature well below 2 ◦C and to pursue efforts to limit it to 1.5 ◦Cabove preindustrial levels. While it is recognized that there arebenefits for human health in limiting global warming to 1.5 ◦C,the magnitude with which those societal benefits will be accruedremains unquantified. Crucial to public health preparedness andresponse is the understanding and quantification of such impactsat different levels of warming. Using dengue in Latin America asa study case, a climate-driven dengue generalized additive mixedmodel was developed to predict global warming impacts usingfive different global circulation models, all scaled to representmultiple global-mean temperature assumptions. We show thatpolicies to limit global warming to 2 ◦C could reduce dengue casesby about 2.8 (0.8–7.4) million cases per year by the end of the cen-tury compared with a no-policy scenario that warms by 3.7 ◦C.Limiting warming further to 1.5 ◦C produces an additional dropin cases of about 0.5 (0.2–1.1) million per year. Furthermore, wefound that by limiting global warming we can limit the expansionof the disease toward areas where incidence is currently low. Weanticipate our study to be a starting point for more comprehen-sive studies incorporating socioeconomic scenarios and how theymay further impact dengue incidence. Our results demonstratethat although future climate change may amplify dengue trans-mission in the region, impacts may be avoided by constrainingthe level of warming.
climate change impacts | disease modeling | Latin America
There is a growing concern about the potential impacts ofclimate change upon human health (1–4). The effects of cli-
mate change on vector-borne infectious diseases have caught agreat deal of attention (5–9) because climatic factors such as tem-perature, precipitation, and humidity modulate many aspects oftheir biology such as the reproduction rate of the vector and thetransmission rate of the pathogens they carry (10–12). Vector-borne diseases impose a large health and economic burden inmany regions (13–15), and so it is crucial, from a public healthperspective, to quantify the impacts of climate change on suchdiseases.
Dengue is a rapidly spreading vector-borne viral disease thatis endemic to over 100 countries. Dengue has been recently esti-mated to cause ∼390 million cases per year, using a statisticaland cartographic approach (16) [almost four times the ∼100million cases per year previously estimated by the World HealthOrganization based on country-specific reporting (17)]. About 54million of these cases occur in Latin America and the Caribbean(LATAM) (16). Several studies have investigated the poten-tial impacts of climate change upon future dengue occurrence,but most of those studies are ≥15 y old, have used a maxi-mum of three general circulation models (GCMs), and are basedon low-resolution climate model data for their computations of
dengue risk (18–21). More recent studies have investigated theeffects of climate change on the spatial distribution of the denguemosquito vector Aedes aegypti (22), but the presence of the vectorin an area does not mean that human cases will occur. Climaticand nonclimatic factors could prevent disease from occurring.For example, low temperatures increase the extrinsic incubation(12, 23) period of the virus, which may exceed the temperature-sensitive longevity of A. aegypti mosquitoes [i.e., the maximumlongevity in the field is only about 33 d at temperatures of about27 ◦C (24, 25)], reducing the risk of transmission. Moreover, evenif the climate was conducive for dengue, access to preventivemeasures such as air conditioning and window screening couldinhibit disease occurrence (26). Also, most previous researchhas focused on the impacts of climate change associated with awarming of 2 ◦C or more (27–29).
The Paris Agreement under the United Nations FrameworkConvention on Climate Change aims to hold global-mean tem-perature well below 2 ◦C and to pursue efforts to limit it to 1.5 ◦Cabove preindustrial levels this century (30). Recent researchreveals that a reduction of warming from 2 ◦C to 1.5 ◦C couldlead to shorter heat waves, lower risk of coral reef degradation,shorter dry spells, and a 10-cm lower global sea-level rise by 2100
Significance
This study is a multigeneral circulation model, multiscenariomodeling exercise developed to quantify the dengue-relatedhealth benefits of limiting global warming to 1.5–2.0 ◦C abovepreindustrial levels in Latin America and the Caribbean. Weestimate the impact of future climate change and populationgrowth on the additional number of dengue cases and provideinsights about the regions and periods most likely affectedby changes in the length of the transmission season. Here,we show that future climate change may amplify denguetransmission and that significant impacts could be avoidedby constraining global warming to 1.5 ◦C above preindus-trial levels. Our work could be a starting point for future riskassessments incorporating other important drivers of diseasesuch as urbanization and international traveling.
Author contributions: F.J.C.-G., P.R.H., and I.R.L. designed research; F.J.C.-G., I.H., T.J.O.,C.S.S.B., C.A.P., and I.R.L. performed research; F.J.C.-G., I.H., and T.J.O. contributed newreagents/analytic tools; F.J.C.-G., I.H., T.J.O., and P.R.H. analyzed data; and F.J.C.-G., I.H.,T.J.O., C.S.S.B., C.A.P., P.R.H., and I.R.L. wrote the paper.
The authors declare no conflict of interest.
This article is a PNAS Direct Submission.
This open access article is distributed under Creative Commons Attribution-NonCommercial-NoDerivatives License 4.0 (CC BY-NC-ND).1 To whom correspondence should be addressed. Email: [email protected].
This article contains supporting information online at www.pnas.org/lookup/suppl/doi:10.1073/pnas.1718945115/-/DCSupplemental.
Published online May 29, 2018.
www.pnas.org/cgi/doi/10.1073/pnas.1718945115 PNAS | June 12, 2018 | vol. 115 | no. 24 | 6243–6248

(relative to year 2000 levels) (31). While it is recognized that lim-iting global warming to 1.5 ◦C could also be beneficial for humanhealth, a fundamental unknown is the impact upon dengue fever.Here, we use a multi-GCM, multiscenario approach to investi-gate and quantify the risks avoided by limiting global-mean tem-perature to 1.5 ◦C above preindustrial levels compared with thatoccurring at 2 ◦C or 3.7 ◦C. Using the ClimGen pattern-scalingtool (32), we generated climate projections from five CoupledModel Intercomparison Project Phase 5 (CMIP5) climate mod-els (33). We scaled the simulated patterns of climate change ofeach model, using the Integrated Model to Assess the GlobalEnvironment (IMAGE) modeling framework, which identifiessocioeconomic pathways and projects the climatic implicationsof different climate and energy policy scenarios (34). Specifically,we investigated a business-as-usual scenario where global-meantemperature rises by 3.7 ◦C by 2100. We compared this sce-nario with two alternative scenarios where, due to mitigationstrategies, there is a 66% probability of holding global-meantemperature increase below 1.5 ◦C and 2.0 ◦C.
We quantified the likely number of dengue cases and changesin the length of the dengue transmission season for the period1961–1990 and for each of the three scenarios for the peri-ods 2040–2069 (2050s) and 2086–2115 (2100). The estimatednumber of cases was computed using clinical and laboratory-confirmed dengue reports for the three most populated coun-tries in LATAM (Brazil, Colombia, and Mexico) and fittinga climate-driven empirical model of dengue incidence thataccounts for long-term and seasonal trends (35) and whose struc-ture and climatic parameters were selected using time-seriescross-validation (TSCV) (36) so that the model captured thespatial and temporal variations in observed dengue data.
ResultsWe fitted different model specifications for our empirical denguemodel, regressing the dengue data for Brazil, Colombia, andMexico with all possible combinations of climatic predictorsusing TSCV (Materials and Methods). The lowest mean abso-lute error (MAE = 103 cases per month) was achieved with anegative binomial generalized additive mixed model (GAMM)including temperature lagged 0–2 mo (T0:2) and potentialevapotranspiration (PET) lagged 0–2 mo (PET0:2) as climaticcovariates. That model was selected for projecting the potentialimpacts of climate change. The model output captures well theobserved temporal trends on dengue transmission in the threecountries with most observed reports falling within the confi-dence intervals (SI Appendix, Fig. S1). The country-specific MAEestimates were 99, 48, and 188 monthly dengue cases for Brazil,Colombia, and Mexico, respectively.
The effects of future climate on the population at risk fordengue for the multimodel ensemble mean were then projectedfor LATAM from Mexico to northern Argentina and are sum-marized in Table 1. We averaged the mean predicted numberof cases across all climate change scenarios and compared themwith the baseline (SI Appendix, Fig. S2). The number of denguecases for the 2050s period was, on average, 260% larger than the1961–1990 baseline scenario with about 6.9 million extra cases
Table 1. Multi-GCM ensemble mean (and range) of the predictednumber of dengue cases (million cases per year) in LATAM underdifferent climate change scenarios
Scenario Baseline 2050s 2100
1.5 ◦C 4.3 (3.0–6.1) 10.7 (7.0–16.7) 8.8 (5.9–13.6)2.0 ◦C 11.0 (7.1–17.2) 9.3 (6.1–14.7)3.7 ◦C 11.8 (7.4–19.2) 12.1 (6.9–22.1)
The baseline values are the same for all climate change scenarios.
30°S
20°S
10°S
0°
10°N
20°N
30°N
100°W 80°W 60°W 40°W
< −5 −2 0 2 > 5
Fig. 1. Multi-GCM ensemble mean of the predicted additional (to the pre-dicted number of cases for the 1961–1990 baseline) number of dengue casesunder a 1.5 ◦C scenario for the 2050s period (thousands).
per year. A 234% average increase was estimated for the 2100period with 5.8 million extra cases per year. We note that thepopulation at risk for dengue is estimated to be lower by the endof the century, but only for the 1.5 ◦C and 2.0 ◦C scenarios.
Critically, we show that limiting global warming to about2.0 ◦C above preindustrial levels could reduce the number ofdengue cases by ∼0.8 (0.3–2.0) million cases per year comparedwith a no-policy scenario with a 3.7 ◦C warming for the 2050speriod and by ∼2.8 (0.8–7.4) million cases per year for the 2100period. Constraining global warming to 1.5 ◦C produces an addi-tional drop in dengue cases of ∼0.3 (0.1–0.5) million avoidedcases by the middle of the century and ∼0.5 (0.2–1.1) millionavoided cases by the end of the century. It is important tonote that when comparing the 3.7 ◦C scenario with the 1.5 ◦Cscenario, the estimated benefit by the end of the century corre-sponds to ∼77% (25–200%) of the estimated mean number ofcases for the baseline period (1961–1990).
Fig. 1 highlights the areas likely to experience significantchanges in the expected number of dengue cases under the1.5 ◦C scenario for the 2050s period. We note that southern Mex-ico, many Caribbean Island states, northern Ecuador, Colombia,Venezuela, and the coastal Brazilian states will be most affectedby increases in dengue cases. Similar geographical patterns wereobserved under the 2.0 ◦C and 3.7 ◦C scenarios both for the2050s and the 2100 periods.
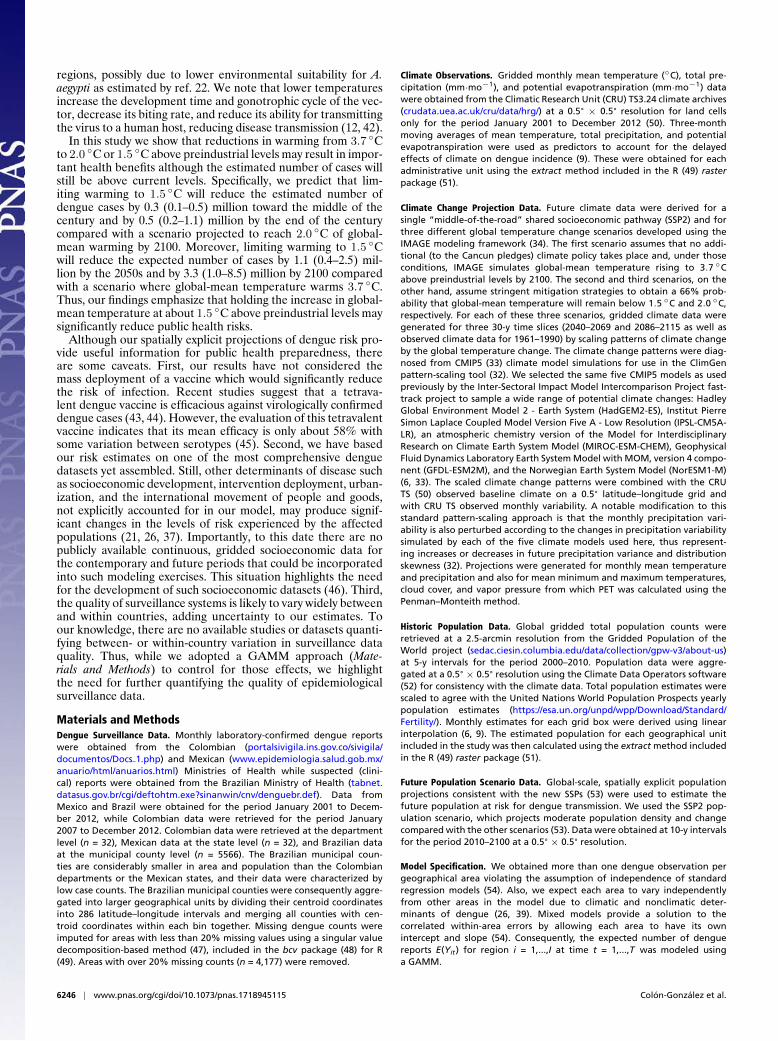
Table 2 presents the difference in the predicted number ofcases per country, comparing the 3.7 ◦C scenario to the 1.5 ◦Cscenario. It is noted that Brazil will benefit the most from lim-iting global warming to 1.5 ◦C with an estimated 0.5 (0.2–1.0)million avoided cases per year by the 2050s and 1.4 (0.5–3.1) mil-lion avoided cases by 2100. The benefit in disease burden in the2050s period is over five times the estimated absolute benefitin dengue cases for Colombia which we project to be the sec-ond most benefited country in the region. Except for Argentina,the countries with the largest benefits are also the countries withsome of the largest dengue incidences in the region (16).
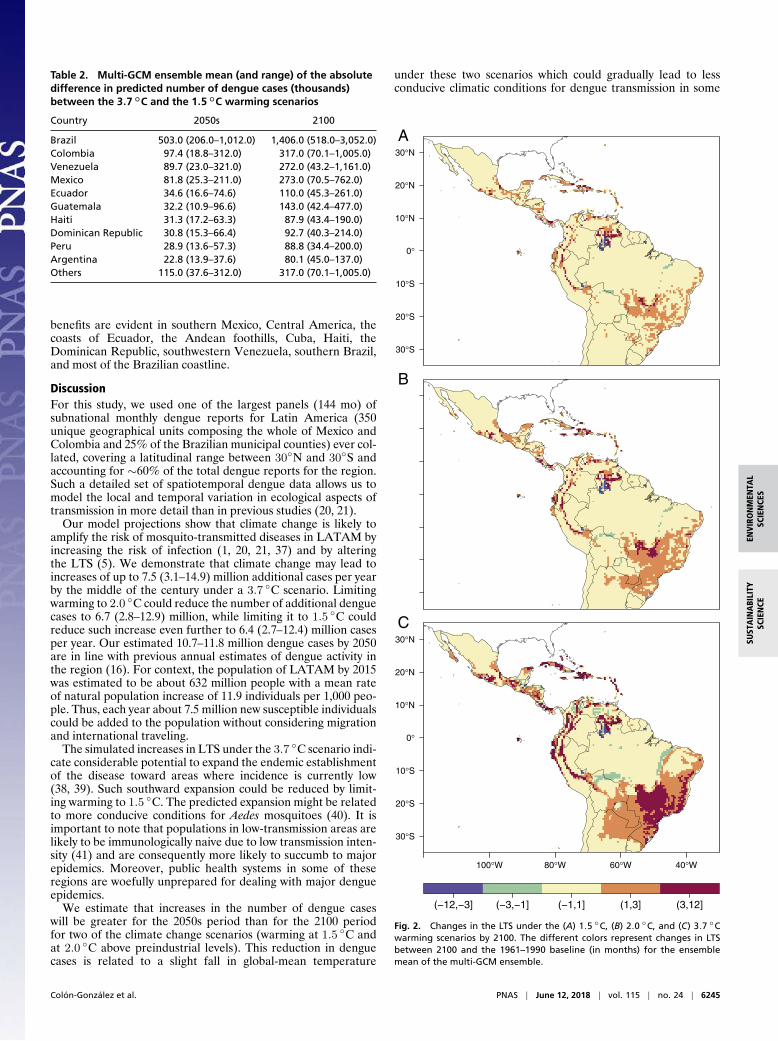
Fig. 2 depicts the changes in the length of the dengue transmis-sion season (LTS) compared against the baseline scenario. Fig. 2shows that the areas experiencing increases in LTS of more than3 mo show considerably lower increase if warming is constrainedto 1.5 ◦C compared with a 3.7 ◦C warming scenario. Such
6244 | www.pnas.org/cgi/doi/10.1073/pnas.1718945115 Colon-Gonzalez et al.
ENV
IRO
NM
ENTA
LSC
IEN
CES
SUST
AIN
ABI
LITY
SCIE
NCE
Table 2. Multi-GCM ensemble mean (and range) of the absolutedifference in predicted number of dengue cases (thousands)between the 3.7 ◦C and the 1.5 ◦C warming scenarios
Country 2050s 2100
Brazil 503.0 (206.0–1,012.0) 1,406.0 (518.0–3,052.0)Colombia 97.4 (18.8–312.0) 317.0 (70.1–1,005.0)Venezuela 89.7 (23.0–321.0) 272.0 (43.2–1,161.0)Mexico 81.8 (25.3–211.0) 273.0 (70.5–762.0)Ecuador 34.6 (16.6–74.6) 110.0 (45.3–261.0)Guatemala 32.2 (10.9–96.6) 143.0 (42.4–477.0)Haiti 31.3 (17.2–63.3) 87.9 (43.4–190.0)Dominican Republic 30.8 (15.3–66.4) 92.7 (40.3–214.0)Peru 28.9 (13.6–57.3) 88.8 (34.4–200.0)Argentina 22.8 (13.9–37.6) 80.1 (45.0–137.0)Others 115.0 (37.6–312.0) 317.0 (70.1–1,005.0)
benefits are evident in southern Mexico, Central America, thecoasts of Ecuador, the Andean foothills, Cuba, Haiti, theDominican Republic, southwestern Venezuela, southern Brazil,and most of the Brazilian coastline.
DiscussionFor this study, we used one of the largest panels (144 mo) ofsubnational monthly dengue reports for Latin America (350unique geographical units composing the whole of Mexico andColombia and 25% of the Brazilian municipal counties) ever col-lated, covering a latitudinal range between 30◦N and 30◦S andaccounting for ∼60% of the total dengue reports for the region.Such a detailed set of spatiotemporal dengue data allows us tomodel the local and temporal variation in ecological aspects oftransmission in more detail than in previous studies (20, 21).
Our model projections show that climate change is likely toamplify the risk of mosquito-transmitted diseases in LATAM byincreasing the risk of infection (1, 20, 21, 37) and by alteringthe LTS (5). We demonstrate that climate change may lead toincreases of up to 7.5 (3.1–14.9) million additional cases per yearby the middle of the century under a 3.7 ◦C scenario. Limitingwarming to 2.0 ◦C could reduce the number of additional denguecases to 6.7 (2.8–12.9) million, while limiting it to 1.5 ◦C couldreduce such increase even further to 6.4 (2.7–12.4) million casesper year. Our estimated 10.7–11.8 million dengue cases by 2050are in line with previous annual estimates of dengue activity inthe region (16). For context, the population of LATAM by 2015was estimated to be about 632 million people with a mean rateof natural population increase of 11.9 individuals per 1,000 peo-ple. Thus, each year about 7.5 million new susceptible individualscould be added to the population without considering migrationand international traveling.
The simulated increases in LTS under the 3.7 ◦C scenario indi-cate considerable potential to expand the endemic establishmentof the disease toward areas where incidence is currently low(38, 39). Such southward expansion could be reduced by limit-ing warming to 1.5 ◦C. The predicted expansion might be relatedto more conducive conditions for Aedes mosquitoes (40). It isimportant to note that populations in low-transmission areas arelikely to be immunologically naive due to low transmission inten-sity (41) and are consequently more likely to succumb to majorepidemics. Moreover, public health systems in some of theseregions are woefully unprepared for dealing with major dengueepidemics.
We estimate that increases in the number of dengue caseswill be greater for the 2050s period than for the 2100 periodfor two of the climate change scenarios (warming at 1.5 ◦C andat 2.0 ◦C above preindustrial levels). This reduction in denguecases is related to a slight fall in global-mean temperature
under these two scenarios which could gradually lead to lessconducive climatic conditions for dengue transmission in some
30°S
20°S
10°S
0°
10°N
20°N
30°N
30°S
20°S
10°S
0°
10°N
20°N
30°N
100°W 80°W 60°W 40°W
(−12,−3] (−3,−1] (−1,1] (1,3] (3,12]
A
B
C
Fig. 2. Changes in the LTS under the (A) 1.5 ◦C, (B) 2.0 ◦C, and (C) 3.7 ◦Cwarming scenarios by 2100. The different colors represent changes in LTSbetween 2100 and the 1961–1990 baseline (in months) for the ensemblemean of the multi-GCM ensemble.
Colon-Gonzalez et al. PNAS | June 12, 2018 | vol. 115 | no. 24 | 6245
regions, possibly due to lower environmental suitability for A.aegypti as estimated by ref. 22. We note that lower temperaturesincrease the development time and gonotrophic cycle of the vec-tor, decrease its biting rate, and reduce its ability for transmittingthe virus to a human host, reducing disease transmission (12, 42).
In this study we show that reductions in warming from 3.7 ◦Cto 2.0 ◦C or 1.5 ◦C above preindustrial levels may result in impor-tant health benefits although the estimated number of cases willstill be above current levels. Specifically, we predict that lim-iting warming to 1.5 ◦C will reduce the estimated number ofdengue cases by 0.3 (0.1–0.5) million toward the middle of thecentury and by 0.5 (0.2–1.1) million by the end of the centurycompared with a scenario projected to reach 2.0 ◦C of global-mean warming by 2100. Moreover, limiting warming to 1.5 ◦Cwill reduce the expected number of cases by 1.1 (0.4–2.5) mil-lion by the 2050s and by 3.3 (1.0–8.5) million by 2100 comparedwith a scenario where global-mean temperature warms 3.7 ◦C.Thus, our findings emphasize that holding the increase in global-mean temperature at about 1.5 ◦C above preindustrial levels maysignificantly reduce public health risks.
Although our spatially explicit projections of dengue risk pro-vide useful information for public health preparedness, thereare some caveats. First, our results have not considered themass deployment of a vaccine which would significantly reducethe risk of infection. Recent studies suggest that a tetrava-lent dengue vaccine is efficacious against virologically confirmeddengue cases (43, 44). However, the evaluation of this tetravalentvaccine indicates that its mean efficacy is only about 58% withsome variation between serotypes (45). Second, we have basedour risk estimates on one of the most comprehensive denguedatasets yet assembled. Still, other determinants of disease suchas socioeconomic development, intervention deployment, urban-ization, and the international movement of people and goods,not explicitly accounted for in our model, may produce signif-icant changes in the levels of risk experienced by the affectedpopulations (21, 26, 37). Importantly, to this date there are nopublicly available continuous, gridded socioeconomic data forthe contemporary and future periods that could be incorporatedinto such modeling exercises. This situation highlights the needfor the development of such socioeconomic datasets (46). Third,the quality of surveillance systems is likely to vary widely betweenand within countries, adding uncertainty to our estimates. Toour knowledge, there are no available studies or datasets quanti-fying between- or within-country variation in surveillance dataquality. Thus, while we adopted a GAMM approach (Mate-rials and Methods) to control for those effects, we highlightthe need for further quantifying the quality of epidemiologicalsurveillance data.
Materials and MethodsDengue Surveillance Data. Monthly laboratory-confirmed dengue reportswere obtained from the Colombian (portalsivigila.ins.gov.co/sivigila/documentos/Docs 1.php) and Mexican (www.epidemiologia.salud.gob.mx/anuario/html/anuarios.html) Ministries of Health while suspected (clini-cal) reports were obtained from the Brazilian Ministry of Health (tabnet.datasus.gov.br/cgi/deftohtm.exe?sinanwin/cnv/denguebr.def). Data fromMexico and Brazil were obtained for the period January 2001 to Decem-ber 2012, while Colombian data were retrieved for the period January2007 to December 2012. Colombian data were retrieved at the departmentlevel (n = 32), Mexican data at the state level (n = 32), and Brazilian dataat the municipal county level (n = 5566). The Brazilian municipal coun-ties are considerably smaller in area and population than the Colombiandepartments or the Mexican states, and their data were characterized bylow case counts. The Brazilian municipal counties were consequently aggre-gated into larger geographical units by dividing their centroid coordinatesinto 286 latitude–longitude intervals and merging all counties with cen-troid coordinates within each bin together. Missing dengue counts wereimputed for areas with less than 20% missing values using a singular valuedecomposition-based method (47), included in the bcv package (48) for R(49). Areas with over 20% missing counts (n = 4,177) were removed.
Climate Observations. Gridded monthly mean temperature (◦C), total pre-cipitation (mm·mo−1), and potential evapotranspiration (mm·mo−1) datawere obtained from the Climatic Research Unit (CRU) TS3.24 climate archives(crudata.uea.ac.uk/cru/data/hrg/) at a 0.5° × 0.5° resolution for land cellsonly for the period January 2001 to December 2012 (50). Three-monthmoving averages of mean temperature, total precipitation, and potentialevapotranspiration were used as predictors to account for the delayedeffects of climate on dengue incidence (9). These were obtained for eachadministrative unit using the extract method included in the R (49) rasterpackage (51).
Climate Change Projection Data. Future climate data were derived for asingle “middle-of-the-road” shared socioeconomic pathway (SSP2) and forthree different global temperature change scenarios developed using theIMAGE modeling framework (34). The first scenario assumes that no addi-tional (to the Cancun pledges) climate policy takes place and, under thoseconditions, IMAGE simulates global-mean temperature rising to 3.7 ◦Cabove preindustrial levels by 2100. The second and third scenarios, on theother hand, assume stringent mitigation strategies to obtain a 66% prob-ability that global-mean temperature will remain below 1.5 ◦C and 2.0 ◦C,respectively. For each of these three scenarios, gridded climate data weregenerated for three 30-y time slices (2040–2069 and 2086–2115 as well asobserved climate data for 1961–1990) by scaling patterns of climate changeby the global temperature change. The climate change patterns were diag-nosed from CMIP5 (33) climate model simulations for use in the ClimGenpattern-scaling tool (32). We selected the same five CMIP5 models as usedpreviously by the Inter-Sectoral Impact Model Intercomparison Project fast-track project to sample a wide range of potential climate changes: HadleyGlobal Environment Model 2 - Earth System (HadGEM2-ES), Institut PierreSimon Laplace Coupled Model Version Five A - Low Resolution (IPSL-CM5A-LR), an atmospheric chemistry version of the Model for InterdisciplinaryResearch on Climate Earth System Model (MIROC-ESM-CHEM), GeophysicalFluid Dynamics Laboratory Earth System Model with MOM, version 4 compo-nent (GFDL-ESM2M), and the Norwegian Earth System Model (NorESM1-M)(6, 33). The scaled climate change patterns were combined with the CRUTS (50) observed baseline climate on a 0.5° latitude–longitude grid andwith CRU TS observed monthly variability. A notable modification to thisstandard pattern-scaling approach is that the monthly precipitation vari-ability is also perturbed according to the changes in precipitation variabilitysimulated by each of the five climate models used here, thus represent-ing increases or decreases in future precipitation variance and distributionskewness (32). Projections were generated for monthly mean temperatureand precipitation and also for mean minimum and maximum temperatures,cloud cover, and vapor pressure from which PET was calculated using thePenman–Monteith method.
Historic Population Data. Global gridded total population counts wereretrieved at a 2.5-arcmin resolution from the Gridded Population of theWorld project (sedac.ciesin.columbia.edu/data/collection/gpw-v3/about-us)at 5-y intervals for the period 2000–2010. Population data were aggre-gated at a 0.5°× 0.5° resolution using the Climate Data Operators software(52) for consistency with the climate data. Total population estimates werescaled to agree with the United Nations World Population Prospects yearlypopulation estimates (https://esa.un.org/unpd/wpp/Download/Standard/Fertility/). Monthly estimates for each grid box were derived using linearinterpolation (6, 9). The estimated population for each geographical unitincluded in the study was then calculated using the extract method includedin the R (49) raster package (51).
Future Population Scenario Data. Global-scale, spatially explicit populationprojections consistent with the new SSPs (53) were used to estimate thefuture population at risk for dengue transmission. We used the SSP2 pop-ulation scenario, which projects moderate population density and changecompared with the other scenarios (53). Data were obtained at 10-y intervalsfor the period 2010–2100 at a 0.5° × 0.5° resolution.
Model Specification. We obtained more than one dengue observation pergeographical area violating the assumption of independence of standardregression models (54). Also, we expect each area to vary independentlyfrom other areas in the model due to climatic and nonclimatic deter-minants of dengue (26, 39). Mixed models provide a solution to thecorrelated within-area errors by allowing each area to have its ownintercept and slope (54). Consequently, the expected number of denguereports E(Yit) for region i = 1,...,I at time t = 1,...,T was modeled usinga GAMM.
6246 | www.pnas.org/cgi/doi/10.1073/pnas.1718945115 Colon-Gonzalez et al.

ENV
IRO
NM
ENTA
LSC
IEN
CES
SUST
AIN
ABI
LITY
SCIE
NCE
Negative binomial and quasi–maximum-likelihood Poisson models werefitted to investigate possible overdispersion in the data. The model specifica-tion with the lowest dispersion parameter and the lowest MAE was selected.The general algebraic definition of the models is given by
Log(µit) = ηit
ηit =α+ Log(Nit) + t′ +P∑
p=1
g(xit) + di ,
where ηit is a logarithmic link function of the expectation E(Yit ≡µit), andYit is the time series of monthly dengue reports. The term α denotesthe intercept; Log(Nit) is the logarithm of the population at risk (N) forregion i and time t included as an offset to normalize the dengue data bypopulation. Long-term and seasonal trends are controlled for using a time-stratified model including an indicator variable for each year and month(t′) (35). The term g(xit) denotes the smoothed and delayed relationshipsbetween the climatic predictors and dengue incidence defined by thin-plate splines (55). Area-specific random effects (di) were included to accountfor the effects of unknown or unobserved variables in the model such asmosquito control measures.
Best Subset of Climatic Predictors. The best subset of climatic predictors pro-ducing the lowest prediction error was defined using a TSCV algorithm (36).Models were fitted using all climatic predictors in isolation, as well as alltheir possible combinations. Thus, we iteratively fitted all possible modelscontaining one climatic predictor, then two climatic predictors, and so on,until all climatic predictors were included in a single model. The accuracy ofeach model was evaluated, calculating their MAE.
Training and test sets were created to implement the TSCV. The initialtraining set comprised 90% of the total number of observations (n = 144) perregion. At each time step (k), a further observation per region was added tothe training set. Consequently, at time step k = 1, the training set comprisedobservations for month t = 1,...,130; at k = 2 it comprised observations fort = 2,...,131, and so on until the training set contained the observations for
t = n− 1, where n is the total number of months in the dataset. The testset contained the first observation for each region immediately after thelast observation in the training set. Thus, at time step k = 1, the test setcontained all observations for t = 131; at k = 2, it contained all observationsfor t = 132, and so on until the test set contained the observations for montht = n. We calculated the MAE at each time step k = 1,...,K, and for each subsetof climatic predictors h = 1,...,H as in the following matrix:
MAEk,h =
MAE1,1 MAE1,2 . . . MAE1,H
MAE2,1 MAE2,2 . . . MAE2,H
......
. . ....
MAEK,1 MAEK,2 . . . MAEK,H
.
The MAE for each subset of climatic predictors (MAEk,h) was calculated byaveraging the subset-specific values across all time steps.
Model Predictions Under Climate Change. Cross-validated model outputswere used to generate spatially explicit predictions of dengue cases at a0.5° × 0.5° resolution for the periods 2050s and 2100. Model predictionswere computed based on future climate and population scenario data. Thepredicted number of cases for a grid box was then multiplied by a factor of11.5 to account for potential underreporting in the dengue data (56). Wethen evaluated changes in the number of dengue cases and in the lengthof the transmission season. The LTS was calculated from the predicted inci-dence rate per month. LTS = 1 for a given month if the predicted incidencerate per 100,000 people >10.
ACKNOWLEDGMENTS. F.J.C.-G., T.J.O., and I.H. received funding from theUnited Kingdom Government, Department for Business, Energy, and Indus-trial Strategy, as part of the implications of global warming of 1.5 ◦C and2.0 ◦C project. F.J.C.-G., P.R.H., and I.R.L. were supported by the NationalInstitute for Health Research, Health Protection Research Unit in EmergencyPreparedness and Response at King’s College London. C.A.P. and C.S.S.B.were supported by a Global Innovation Initiative grant.
1. Messina J, et al. (2015) The many projected futures of dengue. Nat Rev Micro 13:230–239 .
2. Watts N, et al. (2015) Health and climate change: Policy responses to protect publichealth. Lancet 386:1861–1914.
3. Campbell-Lendrum D, Bertollini R, Neira M, Ebi K, McMichael A (2009) Health andclimate change: A roadmap for applied research. Lancet 373:1663–1665.
4. Frumkin H, McMichael A, Hess JJ (2008) Climate change and the health of the public.Am J Prev Med 35:401–402.
5. Caminade C, et al. (2014) Impact of climate change on global malaria distribution.Proc Natl Acad Sci USA 114:3286–3291.
6. Piontek F, et al. (2014) Multisectoral climate impact hotspots in a warming world.Proc Natl Acad Sci USA 111:3233–3238.
7. Ogden NH (2014) Estimated effects of projected climate change on the basic repro-ductive number of the Lyme disease vector Ixodes Scapularis. Environ Health Perspect122:631–638.
8. Bouzid M, Colon-Gonzalez FJ, Lung T, Lake IR, Hunter PR (2014) Climate change andthe emergence of vector-borne diseases in Europe: Case study of dengue fever. BMCPublic Health 14:781.
9. Colon-Gonzalez FJ, Fezzi C, Lake IR, Hunter PR (2013) The effects of weather andclimate change on dengue. PloS Negl Trop Dis 7:e2503.
10. Jansen CC, Beebe NW (2010) The dengue vector Aedes aegypti : What comes next.Microbes Infect 12:272–279.
11. Rogers D, Randolph S (2006) Climate change and vector-borne diseases. Adv Parasitol62:345–381.
12. Watts D, Burke D, Harrison B, Whitmire R, Nisalak A (1987) Effect of temperatureon the vector efficiency of Aedes aegypti for dengue 2 virus. Am J Trop Med Hyg36:143–152.
13. Murray C, et al. (2012) Disability-adjusted life years (DALYs) for 291 diseases andinjuries in 21 regions, 2012 injuries in 21 regions, 1990–2010: A systematic analysisfor the global burden of disease study 2010. Lancet 380:2197–2223.
14. Shepard DS, et al. (2014) Approaches to refining estimates of global burden andeconomics of dengue. Plos Negl Trop Dis 8:e3306.
15. Garg P, Nagpal J, Khairnar P, Seneviratne SL (2012) Economic burden of dengueinfections in India. Trans R Soc Trop Med Hyg 102:570–577.
16. Bhatt S, et al. (2013) The global distribution and burden of dengue. Nature 496:504–507.
17. WHO (2012) Handbook for Integrated Vector Management (World Health Organisa-tion, Geneva), Report WHO/HTM/NTD/VEM/2012.3.
18. Patz J, Martenad W, Focks D, Jetten TH (1998) Dengue fever epidemic potential asprojected by general circulation models of global climate change. Environ HealthPerspect 106:147–153.
19. Jetten T, Focks D (1997) Potential changes in the distribution of dengue transmissionunder climate warming. Am J Trop Med Hyg 57:285–297.
20. Hales S, deWet N, Maindonald J, Woodward A (2002) Potential effect of populationand climate changes on global distribution of dengue fever: An empirical model.Lancet 360:830–834.
21. Astrom C, et al. (2012) Potential distribution of dengue fever under scenarios ofclimate change and economic development. Ecohealth 9:448–454 .
22. Khormi HM, Kumar L (2014) Climate change and the potential global distributionof Aedes aegypti : Spatial modelling using geographical information system andCLIMEX. Geospat Health 8:405–415.
23. Chan M, Johansson MA (2012) The incubation periods of dengue viruses. PLoS One7:e50972.
24. Brady OJ, et al. (2013) Modelling Aedes aegypti and Ae. albopictus survival atdifferent temperatures in laboratory and field settings. Parasit Vectors 6:351.
25. Goindin D, Delannay C, Ramdini C, Gustave J, Fouque F (2015) Parity and longevity ofAedes aegypti according to temperatures in controlled conditions and consequenceson dengue transmission risks. PLoS One 10:e0135489.
26. Reiter P (2001) Climate change and m-borne disease. Environ Health Perspect109:141–161.
27. Knutti R, Rogelj J, Sedlacek J, Fischer M (2015) A scientific critique of the two-degreeclimate change target. Nat Geosci 9:13–18.
28. Victor D, Kennel CF (2014) Climate policy: Ditch the 2°C warming goal. Nature 514:30–31.
29. Sedlacek J, Knutti R (2012) Half of the world’s population experience robust changesin the water cycle for a 2°C warmer world. Environ Res Lett 9:448–454.
30. UNFCCC (2015) Adoption of the Paris Agreement (United Nations FrameworkConvention on Climate Change, Paris), Report FCCC/CP/2015/L.9/Rev.1.
31. Schleussner C-F (2016) Differential climate impacts for policy-relevant limits to globalwarming: The case of 1.5°C and 2°C. Earth Syst Dynam 7:327–351.
32. Osborn TJ, Wallace CJ, Harris IC, Melvin TM (2016) Pattern scaling using ClimGen:Monthly resolution future climate scenarios including changes in the variability ofprecipitation. Clim Change 134:353–369.
33. Taylor KE, Stouffer RJ, Meehl GA (2012) An overview of CMIP5 and the experimentdesign. Bull Am Met Soc 93:485–498.
34. Stehfest E (2014) Integrated Assessment of Global Environmental Change with IMAGE3.0. Model Description and Policy Applications (PBL Netherlands EnvironmentalAssessment Agency, The Hague), Report 735.
35. Bhaskaran K, Gasparrini A, Hajat S, Smeeth L, Armstrong B (2013) Time seriesregression studies in environmental epidemiology. Int J Epidemiol 42:1187–1195.
36. Hyndman RJ, Athanasopoulos G (2014) Forecasting: Principles and Practice. Availableat https://www.otexts.org/book/fpp. Accessed August 12, 2014.
37. Ebi K, Nealon J (2016) Dengue in a changing climate. Environ Res 151:115–123.38. Antonio FJ, de Picoli AS, Teixeira JJV, Mendes RdS (2016) Spatial patterns of dengue
cases in Brazil. PLoS One 12:e0180715.
Colon-Gonzalez et al. PNAS | June 12, 2018 | vol. 115 | no. 24 | 6247

39. Barcellos C, Lowe R (2014) Expansion of the dengue transmission area in Brazil: Therole of climate and cities. Trop Med Int Health 19:159–168.
40. Campbell LP, et al. (2015) Climate change influences on global distributions ofdengue and chikungunya virus vectors. Philos Trans R Soc B 370:20140135.
41. Doolan DL, Dobano C, Baird JK (2009) Acquired immunity to malaria. Clin MicrobiolRev 22:1338.
42. Caminade C, et al. (2016) Global risk model for vector-borne transmission of Zika virusreveals the role of El Nino 2015. Proc Natl Acad Sci USA 114:119–124.
43. Villar L, et al. (2015) Efficacy of a tetravalent dengue vaccine in children in LatinAmerica. N Engl J Med 372:113–123.
44. Scott LJ (2016) Tetravalent dengue vaccine: A review in the prevention of denguedisease. Drugs 76:1301–1312.
45. Capeding MR, et al. (2014) Clinical efficacy and safety of a novel tetravalent denguevaccine in healthy children in Asia: A phase 3, randomised, observer-masked, placebo-controlled trial. Lancet 384:1358–1365.
46. Messina JP, et al. (2016) Mapping global environmental suitability for Zika virus. eLife5:e15272.
47. Troyanskaya O, et al. (2001) Missing value estimation methods for DNA microarrays.Bioinformatics 17:520–525.
48. Perry PO (2009) Bcv: Cross-Validation for the SVD (Bi-Cross-Validation), R pack-age version 1.0. Available at https://cran.r-project.org/web/packages/bcv/index.html.Accessed June 13, 2017.
49. R Development Core Team (2010) R: A Language and Environment for StatisticalComputing (R Foundation for Statistical Computing, Vienna).
50. Harris I, Jones PD, Osborn TJ, Lister DH (2014) Updated high-resolution grids ofmonthly climatic observations - The CRU TS3.10 dataset. Int J Climatol 34:623–642.
51. Hijmans RJ (2013) Raster: Geographic Data Analysis and Modeling. Available atCRAN.R-project.org/package=raster. Accessed April 5, 2015.
52. CDO (2015) Climate Data Operators. Available at www.mpimet.mpg.de/cdo. AccessedMarch 12, 2017.
53. Jones B, Neill BCO (2016) Spatially explicit global population scenarios consistent withthe Shared Socioeconomic Pathway. Environ Res Lett 11:84003.
54. Venables B, Ripley B (2013) Modern Applied Statistics with S (Springer, New York).55. Wood SN (2006) Generalized Additive Models: An Introduction with R (Chapman &
Hall/CRC, Boca Raton, FL).56. Sarti E, et al. (2016) A comparative study on active and passive epidemiological
surveillance for dengue in five countries of Latin America. Int J Infect Dis 44:44–49.
6248 | www.pnas.org/cgi/doi/10.1073/pnas.1718945115 Colon-Gonzalez et al.
Related Documents


