Likelihood Ratio Test Polarimetric SAR Ship Detection Application Chen Liu and Allan Meek Defence R&D Canada √ Ottawa TECHNICAL MEMORANDUM DRDC Ottawa TM 2005-243 December 2005

Welcome message from author
This document is posted to help you gain knowledge. Please leave a comment to let me know what you think about it! Share it to your friends and learn new things together.
Transcript

Likelihood Ratio Test Polarimetric SAR Ship Detection Application
Chen Liu and Allan Meek
Defence R&D Canada √ Ottawa TECHNICAL MEMORANDUM
DRDC Ottawa TM 2005-243 December 2005

Likelihood Ratio Test Polarimetric SAR Ship Detection Application
Chen Liu Defence R&D Canada – Ottawa
Allan Meek W.E. Thorp Associates Limited
Defence R&D Canada – Ottawa Technical Memorandum DRDC Ottawa TM 2005-243 December 2005

© Her Majesty the Queen as represented by the Minister of National Defence, 2005
© Sa majesté la reine, représentée par le ministre de la Défense nationale, 2005

DRDC Ottawa TM 2005-243 i
Abstract
This technical memorandum describes the algorithms, features and implementation of the Likelihood Ratio Test (LRT) Polarimetric SAR (PolSAR) Ship Detection Application. The detection algorithm is based on the likelihood ratio test with Neyman-Pearson criterion. The detection algorithm is applicable to many PolSAR system configurations, including quad polarimetric, dual polarimetric and single-channel. The detection threshold is calculated from image statistics to achieve a desired false alarm probability. Other statistical quantities are also calculated, such as covariance and correlation of polarimetric channels, as well as mean and standard deviation of the decision variable. A Pauli decomposition algorithm is included as an initial step for a future target classification capability.
Examples of typical results are given. The report contains a user guide and design diagrams for the algorithm implementation. The detection algorithms were developed for C-band airborne PolSAR data from the EC CV-580, C-band polarimetric SAR sensor flown on the EC CV-580 but are also applicable to ENVISAT ASAR and RADARSAT-1/-2 images.

ii DRDC Ottawa TM 2005-243
Résumé
Le présent résumé décrit les algorithmes, les fonctions et la mise en œuvre de l’application de détection de navires par radar polarimétrique à synthèse d'ouverture (PolSAR), faisant appel au test du rapport des vraisemblances (LRT). L’algorithme de détection est basé sur le test du rapport des vraisemblances avec le critère de Neyman-Pearson. L’algorithme de détection s’applique à de nombreuses configurations du système PolSAR, y compris la configuration polarimétrique quadruple, la configuration polarimétrique double et celle à un seul canal. Le seuil de détection est calculé à partir de statistiques d’image de façon à obtenir la probabilité de fausse alarme voulue. D’autres grandeurs statistiques sont aussi calculées, comme la covariance et la corrélation des canaux polarimétriques, ainsi que la moyenne et l’écart-type de la variable de décision. On inclut également un algorithme de décomposition de Pauli, comme une première étape dans la mise au point d’une fonction de classification des cibles.
Le rapport fournit des exemples des résultats types obtenus. Il comprend un guide de l’utilisateur et des schémas de conception pour la mise en œuvre d’algorithmes. Les algorithmes de détection ont été mis au point à partir de données PolSAR (en bande C aéroporté) du capteur SAR, transporté à bord du CV-580 d’Environnement Canada, mais s’appliquent aussi aux images d’ENVISAT ASAR et de RADARSAT-1/-2.

DRDC Ottawa TM 2005-243 iii
Executive summary One of the key requirements of the Canadian Forces (CF) is the availability of an efficient wide area ocean surveillance system from space1. Such a system must have the ability to automatically detect ships with a lower false alarm rate than present systems and should also have an automatic target classification capability. A key fundamental component of such a system is a high performance ship detection algorithm. The upcoming launch of RADARSAT-2 will provide a spaceborne polarimetric SAR. Previous work2 found that a nearly optimum solution to point detection of ships was to apply statistical decision theory directly to the components of the scattering matrix. The best point detection algorithm is a Likelihood Ratio Test with a Neyman-Pearson criterion. This leads to a formula for a decision variable which can be used to decide whether an image pixel is from a ship or from the ocean. Decision variables for a number of polarimetric system configurations were developed, including quad polarimetric, dual polarimetric with amplitude and phase, dual polarimetric with amplitude only and single-channel. The detection performance and false alarm probabilities were estimated from C-band images from the CCRS C-band SAR sensor. This calculation showed that either a quad polarimetric system or a dual polarimetric system with HH and VV amplitude and phase would provide a significant improvement over single-channel systems. In order to implement these algorithms, a Likelihood Ratio Test (LRT) Polarimetric SAR (PolSAR) Ship Detection Application has been developed to provide both a research tool and a basis on which to build a complete ship detection capability. The detection algorithms can be applied to various types of polarimetric and single-channel systems such as RADARSAT-1, ENVISAT, ASAR and RADARSAT-2. However, the main objective is to prepare for the operational use of RADARSAT-2, which will have many polarimetric modes, including quad polarimetric. This technical memorandum describes the algorithms, implementation and gives some examples of applications. A User Guide is included in an Annex. The features of the LRT PolSAR Ship Detection Application include: a) Point detection of ships using the likelihood ratio test and a threshold calculation to achieve
a desired false alarm probability for the point detection, applicable to many polarimetric system configurations from quad polarimetric to single-channel;
b) Calculation of various statistical quantities such as the covariance and correlation of scattering matrix components, and the mean and standard deviation of the decision variable;
c) Pauli decomposition to support target feature extraction;
1 Quinn, R.J. (2005). “Project Polar Epsilon: Joint Space-Based Wide Area Surveillance and Support
Capability”, 8th International Conference on Remote Sensing for Marine and Coastal Environments proceeding, Halifax, Nova Scotia, Canada, 17-19 May 2005
2 Liu, C., Vachon, P.W., and Geling, G.W. (2005). Improved Ship Detection with Airborne Polarimetric SAR data. Canadian Journal of Remote Sensing, Vol. 31, No.1, pp. 122-131.
iv DRDC Ottawa TM 2005-243
d) Various image display options. The application software has a modular construction to permit easy modification and the addition of new features. It is intended that the present application software will be upgraded to provide a ship detection and classification capability. To achieve this, it will be necessary to add a clustering and segmentation capability to extract ships, automatic ambiguity removal, automatic land area removal and further polarimetric decomposition algorithms. With these added features, the LRT PolSAR Ship Detection Application will be able to provide a ship detection and feature extraction capability using RADARSAT-2 images to contribute to the requirements of the Canadian Forces for wide area ocean surveillance.
Liu, C., Meek, A. 2005. Likehood Ratio Test Polarimetric SAR Ship Detection Application. DRDC Ottawa TM 2005-243. Defence R & D Canada – Ottawa.
DRDC Ottawa TM 2005-243 v
Sommaire La disponibilité d’un système efficace de surveillance des océans à couverture étendue, basé dans l’espace, constitue un des besoins principaux des Forces canadiennes (FC)3. Un tel système doit être capable de détecter automatiquement les navires avec un taux de fausse alarme plus bas que celui des systèmes actuels et devrait posséder une fonction de classification automatique des cibles. Un algorithme de haute performance pour la détection des navires représente un élément fondamental de ce genre de système. La mise en orbite prochaine de RADARSAT-2 fournira un radar à synthèse d’ouverture (SAR) polarimétrique spatial capable de faire la détection en tout temps. Des travaux effectués auparavant4 ont permis de conclure que l’application directe de la théorie statistique de la décision aux éléments de la matrice de diffusion était une solution quasi optimale pour la détection ponctuelle de navires. Si on suppose que les éléments de diffusion sont caractérisés par une distribution gaussienne, le meilleur algorithme de détection ponctuelle est basé sur un test du rapport des vraisemblances avec le critère de Neyman-Pearson. La résultante est une formule correspondant à une variable de décision, qui peut être utilisée pour déterminer si un pixel d’une image correspond à un navire ou simplement à l’océan. Des variables de décision pour un certain nombre de configurations de systèmes polarimétriques ont été développées, y compris la configuration polarimétrique quadruple, la configuration polarimétrique double avec amplitude et phase, la configuration à deux avec amplitude et la configuration à un seul canal. L’efficacité de détection et les probabilités de fausse alarme ont été estimées à partir d’images en bande C provenant du capteur SAR en bande C du CCT. Ces calculs ont montré qu’un système polarimétrique quadruple ou un système polarimétrique double avec amplitude et phase HH et VV permettent d’obtenir des résultants nettement supérieurs à ceux obtenus avec les systèmes à un seul canal. Pour la mise en œuvre de ces algorithmes, une application de détection de navires par radar polarimétrique à synthèse d'ouverture (PolSAR), faisant appel au test du rapport des vraisemblances (LRT), a été développée afin de servir à la fois d’outil de recherche et de base pour la mise au point d’une fonction complète de détection des navires. Les algorithmes de détection peuvent être appliqués à divers types de systèmes polarimétriques et de systèmes à un seul canal, tels RADARSAT-1, ENVISAT ASAR et RADARSAT-2. Toutefois, l’objectif principal demeure la préparation pour l’utilisation de RADARSAT-2, qui compte de nombreux modes polarimétriques, y compris le mode polarimétrique quadruple. Le présent résumé décrit les algorithmes et leur mise en œuvre et fournit quelques exemples des résultats obtenus. De plus, un guide de l’utilisateur est joint au rapport dans une annexe. Voici quelques-unes des fonctions de l’application de détection de navires PolSAR LRT:
3 Quinn, R.J. (2005). “Project Polar Epsilon: Joint Space-Based Wide Area Surveillance and Support
Capability”, 8th International Conference on Remote Sensing for Marine and Coastal Environments proceeding, Halifax, Nova Scotia, Canada, 17-19 May 2005
4 Liu, C., Vachon, P.W., and Geling, G.W. (2005). Improved Ship Detection with Airborne Polarimetric SAR data. Canadian Journal of Remote Sensing, Vol. 31, No.1, pp. 122-131.
vi DRDC Ottawa TM 2005-243
a) détection ponctuelle des navires à l’aide du test du rapport des vraisemblances et d’un calcul de seuil de façon à obtenir la probabilité de fausse alarme voulue, applicable à de nombreuses configurations de système polarimétrique (de la configuration polarimétrique quadruple à la configuration à un seul canal);
b) calcul de différentes grandeurs statistiques d’intérêt, telles la covariance et la corrélation des éléments de la matrice de diffusion, et la moyenne et l’écart-type de la variable de décision;
c) algorithme de décomposition de Pauli pour permettre l’extraction des caractéristiques des cibles;
d) différentes options d’affichage d’images. La structure modulaire du logiciel d’application permet de le modifier facilement et d’ajouter de nouvelles fonctions. On prévoit la mise à niveau du logiciel d’application actuel afin de fournir une fonction de détection et de classification de navires. Pour ce faire, il faudra ajouter une fonction de groupement et de segmentation pour l’extraction des caractéristiques des navires, un algorithme de levée automatique d’ambiguïté, un algorithme de suppression automatique de la zone terrestre, ainsi que d’autres algorithmes de décomposition. Grâce à ces fonctions supplémentaires et en utilisant des images de RADARSAT-2, l’application de détection de navires PolSAR LRT sera en mesure de fournir des fonctions de détection et d’extraction des caractéristiques des navires pour aider à répondre aux besoins des Forces canadiennes en matière de surveillance à couverture étendue des océans.
Liu, C., Meek, A. 2005. Likehood Ratio Test Polarimetric SAR Ship Detection Application. DRDC Ottawa TM 2005-243. R & D pour la défense Canada – Ottawa.
DRDC Ottawa TM 2005-243 vii
Table of contents
Abstract ....................................................................................................................................... i
Executive summary ................................................................................................................... iii
Sommaire.................................................................................................................................... v
Table of contents ...................................................................................................................... vii
List of figures ............................................................................................................................ ix
List of tables ............................................................................................................................... x
1. Introduction ................................................................................................................... 1
2. Algorithms..................................................................................................................... 3 2.1 Quad and Dual Polarimetric System ................................................................ 4 2.2 Dual- and Single- Channel System .................................................................. 4
3. Implementation.............................................................................................................. 6 3.1 Software Design ............................................................................................... 6 3.2 Description of Functions .................................................................................. 7
3.2.1 Statistical Decision Parameter Calculation ......................................... 7 3.2.2 Threshold Calculation ......................................................................... 7 3.2.3 Pixel Detection .................................................................................... 9 3.2.4 Calculations of Other Statistical Parameters ....................................... 9 3.2.5 Polarimetric Decomposition Method ................................................ 10
3.3 Graphical User Interface ................................................................................ 10
4. Applications ................................................................................................................ 13
5. Conclusions and Future Work..................................................................................... 22
6. References ................................................................................................................... 23
Annex A. User Guide .............................................................................................................. 25 A.1 Overview ........................................................................................................ 25 A.2 Installing and Starting the Application Software ........................................... 25

viii DRDC Ottawa TM 2005-243
A.3 GUI................................................................................................................. 25 A.4 Menu Items..................................................................................................... 27
A.4.1 File Menu .......................................................................................... 27 A.4.2 View Menu........................................................................................ 28 A.4.3 Ship Detection Menu......................................................................... 30 A.4.4 Matlab™ Menu ................................................................................. 32 A.4.5 Other Calculations............................................................................. 33 A.4.6. Help Menu......................................................................................... 33
A.5 Toolbar ........................................................................................................... 33 A.6 Keyboard and Mouse Sequences for the Image Viewing Areas .................... 34 A.7 Descriptions of Techniques and Algorithms .................................................. 35
A.7.1 Basic RGB Representation of a PolGASP/COASP Image ............... 35 A.7.2 Calculating the Section Boundaries of a PolGASP/COASP Image .. 36 A.7.3 Peak Clutter Reduction (Removal of Non Ocean Pixels) ................. 37 A.7.4 Quad Polarimetric Ship Detection Algorithm ................................... 37 A.7.5 Dual Polarimetric Ship Detection Algorithm................................... 40 A.7.6 Dual-Channel (Amplitude, Correlated) Ship Detection Algorithm... 41 A.7.7 Dual-Channel (Amplitude, Uncorrelated) Ship Detection Algorithm42 A.7.8 Single-channel Ship Detection Algorithm ........................................ 43 A.7.9 Pauli Display and Decomposition of a PolGASP/COASP Image.... 44
A.8 Output Data File ............................................................................................. 45
List of symbols/abbreviations/acronyms/initialisms ................................................................ 46

DRDC Ottawa TM 2005-243 ix
List of figures
Figure 1: LRT PolSAR Ship Detection Application implementation overview. ...................... 6
Figure 2: FAR vs. T data and fit for extrapolation. ................................................................... 8
Figure 3. Screenshot of the application software's main window. .......................................... 12
Figure 4: Detected ships from a CV-580 PolSAR image (l4p6, 23 March 2004)................... 14
Figure 5: Detected ships from a CV-580 PolSAR image (l1p8, 23 September 2004). ........... 15
Figure 6. Detected ships from an ENVISAT ASAR HH-VV image. ..................................... 18
Figure 7. Detected ships from a RADARSAT-1 image. ......................................................... 20
Figure 8: Screenshot of the application software's main window. .......................................... 26
Figure 9: Open PolGASP Image file dialog. ........................................................................... 27
Figure 10: RGB Display window. ........................................................................................... 28
Figure 11: Dataset Metadata window...................................................................................... 29
Figure 12: Set Main Display Axis Limits window.................................................................. 29
Figure 13: The program prompts the user to enter a detection threshold value. ..................... 30
Figure 14: Ship Detection Parameters window. ...................................................................... 32
Figure 15: Basic RGB representation of a PolGASP image. .................................................. 36
Figure 16: An image that has been divided into eight sections. .............................................. 37
Figure 17: Point targets defining a ship in a PolGASP image................................................. 39
Figure 18: Pauli Display representation of a PolGASP image. ............................................... 44
Figure 19: Pauli Decomposition of a ship in a PolGASP image. ............................................ 45

x DRDC Ottawa TM 2005-243
List of tables
Table 1: Ship dimensions. ........................................................................................................ 13
Table 2: Detected ship information. ........................................................................................ 19
DRDC Ottawa TM 2005-243 xi
Acknowledgements The authors would like to acknowledge the support of the data acquisition, PolSAR image calibration devices deployment, and sea-truth information gathering teams from DRDC Ottawa, Environmental Canada, Canada Centre for Remote Sensing, and DRDC Atlantic for many trials conducted by DRDC Ottawa. The authors would like to extend our thanks to Bill Bayer for the many trial mission planning, Mr. Terry Potter for the data processing and image extraction, and Mr. Alan Higginson for his contributions to the software development. We greatly appreciate the financial support of D Space D for DRDC Ottawa PolSAR trials. We appreciate very much Dr. Ryan English at DRDC Ottawa for his helpful discussions and comments on this report, and the support of the RADARSAT-1 ground truthing information by Dr. English and Dr. Paris Vachon. We also appreciate very much the ENVISAT data provided through the European Space Agency's Envisat Mission Announcement of Opportunity, Project 255.

xii DRDC Ottawa TM 2005-243
This page intentionally left blank

DRDC Ottawa TM 2005-243 1
1. Introduction
Existing spaceborne SARs are either single-polarization systems, or dual-polarized systems offering amplitude information. In particular, RADARSAT-1 transmits H polarized waves and receives H polarized scattered fields, i.e., a HH polarization system. ENVISAT offers a combination of dual polarizations, HH–VV, VV–VH or HH–HV with amplitude modes. RADARSAT-2, however, will offer many modes, including quad polarimetric (i.e., simultaneous HH, HV, VH and VV), dual polarimetric with amplitude and phase, dual-polarization with amplitude, and single-polarization modes.
The use of polarimetric SAR imagery, including both amplitude and phase information, promises significant improvement for ship detection [2] and ship classification compared to single-channel systems. The Canadian Forces, through D Space D, is looking at using RADARSAT-2 imagery for wide area ocean surveillance when RADARSAT-2 becomes operational. Since RADARSAT-2 will offer polarimetric SAR modes, it is therefore highly desirable to develop tools to exploit these capabilities in support of the Canadian Forces. The algorithms of the Likelihood Ratio Test Polarimetric SAR Ship Detection Application are based on statistical decision theory and are applied directly to the components of the scattering matrix to obtain a function of these components (defined as a decision variable) which is used to make a decision on the nature of each image pixel. A likelihood ratio test with Neyman-Pearson criterion is used to define a point detection criterion [2]. The detection variables were calculated using measured data from DRDC Ottawa trials. This provides actual performance in the context of observed environmental conditions, including wind speed, wind direction and sea state. The LRT PolSAR Ship Detection Application developed at DRDC Ottawa will enable investigation of the capabilities of PolSAR applications in ship detection and ship classification. The application software was validated using airborne C-band polarimetric SAR data from the CCRS C-band SAR sensor, flown aboard the EC CV-580, which offers quad polarimetric capability. The algorithms developed for quad PolSAR systems are also modified to be applicable to any possible combination of polarimetric SAR systems. The software can perform ship detection on data from various PolSAR systems, including quad polarimetric, dual polarimetric with amplitude and phase, dual polarimetric amplitude and single-channel. It can be applied to spaceborne SAR system, such as RADARSAT-1, ENVISAT and RADARSAT-2. The software was developed using several open source tools to provide a graphical user interface. The detection algorithms were developed in Matlab and implemented in C++ in the application software. The software is structured with a link to Matlab to permit a continuing development of ship detection and classification algorithms within the basic structure of the present application software. At the present time, the software performs single point (pixel) detection. However, the application will be upgraded to include clustering and segmentation components; this will provide ship detection and classification capabilities. Other planned features include automatic ambiguity removal, automatic land removal, further decomposition algorithms, and support for RADARSAT-2 imagery. With these additions, the LRT PolSAR Ship Detection Application will contribute to fulfilling the Canadian Forces’ requirements for wide area ocean surveillance.

2 DRDC Ottawa TM 2005-243
This technical memorandum describes the algorithms for single point detection, their implementation, provides examples of applications, and the User Guide.
DRDC Ottawa TM 2005-243 3
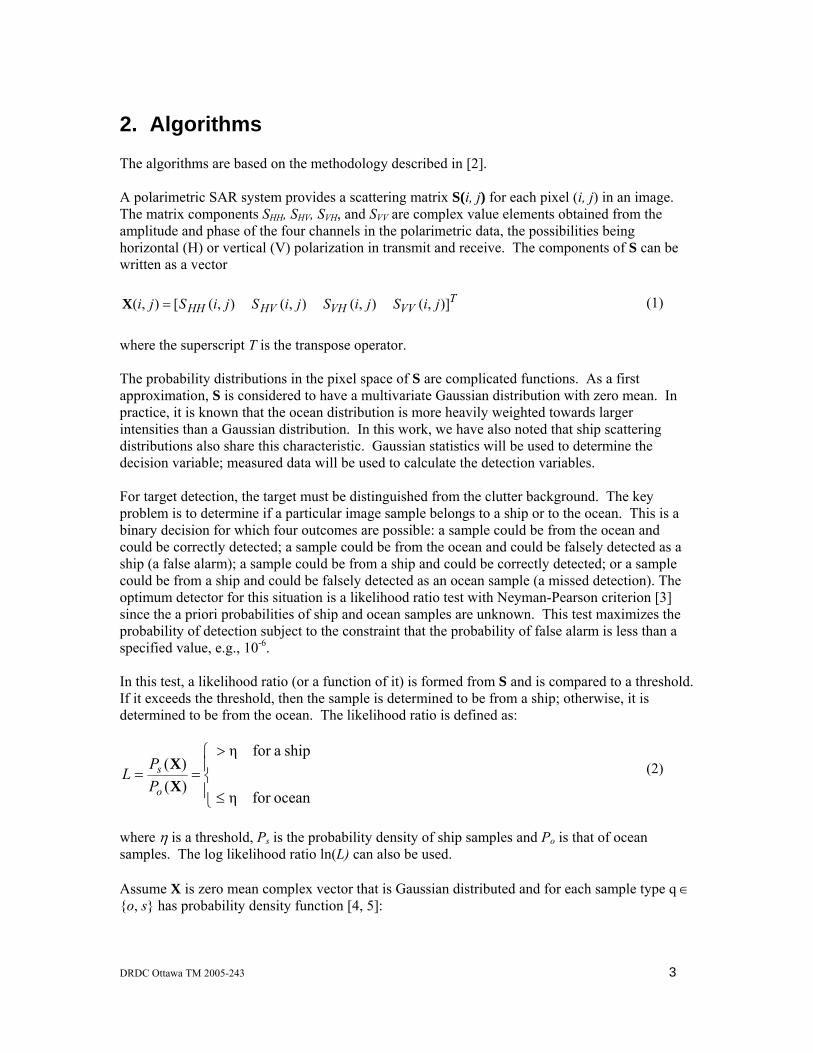
2. Algorithms The algorithms are based on the methodology described in [2]. A polarimetric SAR system provides a scattering matrix S(i, j) for each pixel (i, j) in an image. The matrix components SHH, SHV, SVH, and SVV are complex value elements obtained from the amplitude and phase of the four channels in the polarimetric data, the possibilities being horizontal (H) or vertical (V) polarization in transmit and receive. The components of S can be written as a vector
TVVVHHVHH jiSjiSjiSjiSji )],(),(),(),([),( =X (1)
where the superscript T is the transpose operator. The probability distributions in the pixel space of S are complicated functions. As a first approximation, S is considered to have a multivariate Gaussian distribution with zero mean. In practice, it is known that the ocean distribution is more heavily weighted towards larger intensities than a Gaussian distribution. In this work, we have also noted that ship scattering distributions also share this characteristic. Gaussian statistics will be used to determine the decision variable; measured data will be used to calculate the detection variables. For target detection, the target must be distinguished from the clutter background. The key problem is to determine if a particular image sample belongs to a ship or to the ocean. This is a binary decision for which four outcomes are possible: a sample could be from the ocean and could be correctly detected; a sample could be from the ocean and could be falsely detected as a ship (a false alarm); a sample could be from a ship and could be correctly detected; or a sample could be from a ship and could be falsely detected as an ocean sample (a missed detection). The optimum detector for this situation is a likelihood ratio test with Neyman-Pearson criterion [3] since the a priori probabilities of ship and ocean samples are unknown. This test maximizes the probability of detection subject to the constraint that the probability of false alarm is less than a specified value, e.g., 10-6. In this test, a likelihood ratio (or a function of it) is formed from S and is compared to a threshold. If it exceeds the threshold, then the sample is determined to be from a ship; otherwise, it is determined to be from the ocean. The likelihood ratio is defined as:
⎪⎩
⎪⎨
⎧
≤
>==
oceanfor η
ship afor η
)()(
XX
o
s
PP
L (2)
where η is a threshold, Ps is the probability density of ship samples and Po is that of ocean samples. The log likelihood ratio ln(L) can also be used. Assume X is zero mean complex vector that is Gaussian distributed and for each sample type q ∈ {o, s} has probability density function [4, 5]:

4 DRDC Ottawa TM 2005-243
XXX1
||π1)(
−−= qH C
qpq e
CP (3)
Where H is the conjugate transpose operator, Cq = E(XqXq
H) is the covariance matrix, E(·) being the expected value function; |·| denotes the determinant; p is the number of elements in X which, for a quad polarimetric system, has p = 4.
2.1 Quad and Dual Polarimetric System In general, the elements of Cs are much larger than those of Co [2]. Therefore, the term of XHCs
-
1X can be neglected compared to XHCo-1X, and the likelihood ratio of Equation (2) becomes, after
taking logarithms and absorbing terms into a new threshold, η′:
⎪⎩
⎪⎨
⎧
≤
>=−
oceanfor '
ship afor ')( 1
η
ηXX o
H C (4)
where η′ = ln(η) − ln(|Co|/|Cs|). In order to treat η′ as approximately constant, we must restrict application to appropriate conditions. Some criteria have already been implemented (see Section 3.2). In this approximation, the ship covariance matrix is not required. This forms the basis for developing practical ship-detection algorithms, as only ocean statistics are needed in the detection algorithm. A dual polarimetric system with amplitude and phase consists of a combination of any two scattering components, except HV and VH since they are reciprocal to each other. The statistical decision variable described in Equation (4) can therefore be applied using appropriately redefined definitions of X and the covariance matrices. For a quad polarimetric system, X is defined in Equation (1); for a dual polarimetric system, X can be reduced to a vector with two terms, i.e. X = [S1 S2] where S1 and S2 are the polarimetric components provided by the system.
2.2 Dual- and Single- Channel System For a dual-channel system with amplitude only, in which the channels are independent, Equation (4) can be written as:
⎪⎩
⎪⎨
⎧
≤
>=⎟
⎟
⎠
⎞
⎜⎜
⎝
⎛∑= oceanfor 'η
ship afor 'η
σ1|| 2
22
1 okk
kX (5)
where |Xk| is the amplitude of the complex variable Xk, and σk
2 = E(|Xk|2). This is approximately true for polarization combinations that include HH−HV, HH−VH, VV−HV and VV−VH [2]. However, since the HH and VV channels are highly correlated for the ocean regions [2,6], we

DRDC Ottawa TM 2005-243 5
must retain the cross terms for the ocean. An approximate decision variable for a dual-channel amplitude system is:
⎪⎩
⎪⎨
⎧
≤
>=
⋅−
−⎟⎟⎠
⎞⎜⎜⎝
⎛
−+⎟⎟
⎠
⎞⎜⎜⎝
⎛
−oceanfor 'η
ship afor 'η
σσ||||
ρ1ρ2
)ρ1(σ1||
)ρ1(σ1||
21
21222
2
2222
1
21
oooo
XXXX (6)
where ρ is the amplitude of the ocean correlation coefficient and it is assumed that the ship variables are uncorrelated. For a single-channel system, the decision equation is derived from Equation (5) with X2 = 0.
6 DRDC Ottawa TM 2005-243
3. Implementation
3.1 Software Design
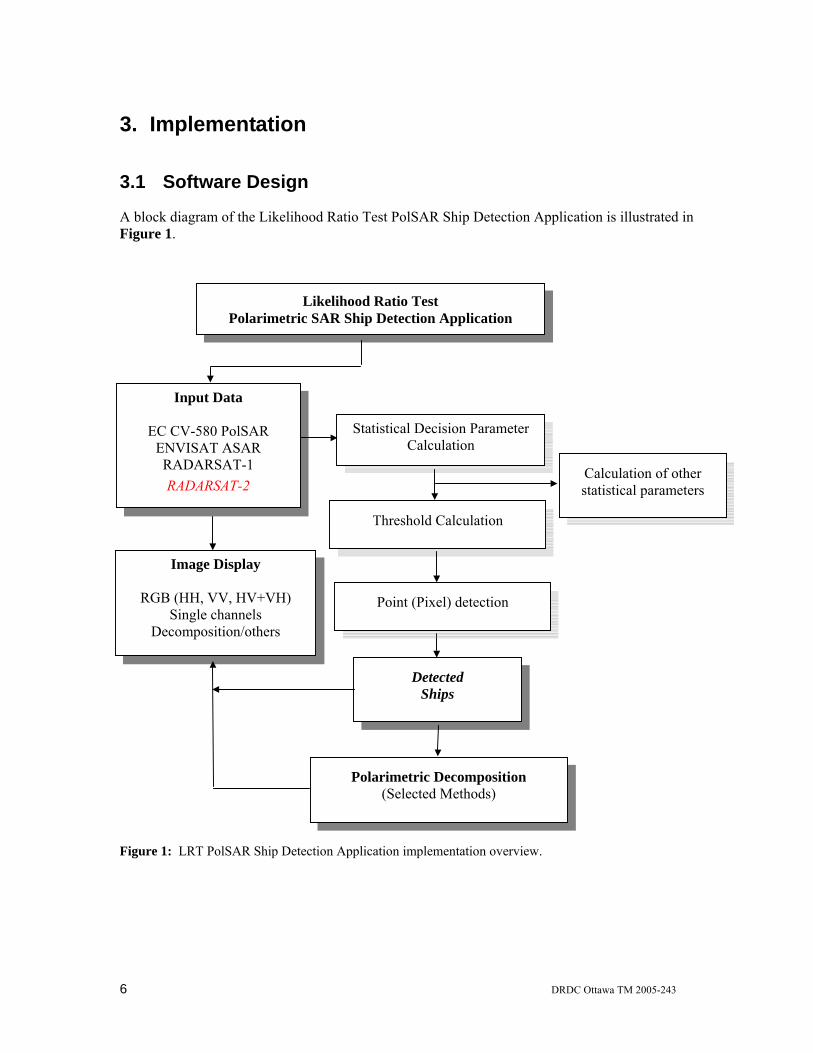
A block diagram of the Likelihood Ratio Test PolSAR Ship Detection Application is illustrated in Figure 1.
Figure 1: LRT PolSAR Ship Detection Application implementation overview.
Polarimetric Decomposition (Selected Methods)
Likelihood Ratio Test Polarimetric SAR Ship Detection Application
Statistical Decision Parameter Calculation
Threshold Calculation
Input Data
EC CV-580 PolSAR ENVISAT ASAR RADARSAT-1 RADARSAT-2
Detected Ships
Image Display
RGB (HH, VV, HV+VH) Single channels
Decomposition/others
Point (Pixel) detection
Calculation of other statistical parameters

DRDC Ottawa TM 2005-243 7
3.2 Description of Functions The LRT PolSAR Ship Detection Application has the capability to handle large data files. Within a radar image swath width, the incidence angle varies. For example, in the CV-580 PolSAR system, the range-gating typically limits the incidence angle from 28° to 74° [7]. The statistical decision variable varies with the incidence angle because the covariance matrix changes as the mean signal level changes, which decreases with increasing incidence angle. In order to avoid significant variation of the statistical decision variable due to large difference of incidence angle of each scene, each image is divided into strips with an incidence angle difference of 5° which are processed individually. This 5° incidence angle difference is chosen based on the trade-off between the number of samples in the calculation of the statistical average and the variation of the statistics with incidence angle. This may not be the optimum number of sections, but this number has been used here to demonstrate the operation of the software. It can be changed, if necessary.
3.2.1 Statistical Decision Parameter Calculation The statistical decision variables are calculated for each different type of system as described in Section 2 (Equations (4) to (6)). However, only calculations for the quad polarimetric system are presented since the calculations for other systems are similar. The statistical decision variable for the quad polarimetric system is described by Equation (4) as:
XX )( 1−= oH CU (7)
where the ocean covariance is calculated from:
)( Hooo XXEC = (8)
where Xo is the scattering vector (Equation (1)) from the ocean pixels. The covariance is calculated over an entire azimuth strip of 5°. The set of Xo can be selected in two ways. The first is to use all of the pixels in the strip if there are not many ships present. The second is to iterate and use the Xo values which are less than 3 times mean U of the strip. This is called peak clutter reduction which is used if there are many ships present.
3.2.2 Threshold Calculation A threshold η′ is calculated based on a specified false alarm rate (FAR) using a combination of extrapolation and curve fitting methods. A series of thresholds Tk are defined and corresponding FAR values calculated using the image pixels. The curve of threshold vs log(FAR) is fitted with a 2nd order polynomial equation. The desired threshold η′ is then calculated from the equation for the specified FAR.

8 DRDC Ottawa TM 2005-243
The decision variable U is calculated for each pixel of the image strip using the measured data. This is followed by the calculation of its median. The median Ũ is used as an initial threshold T0 = Ũ because it is less affected than the mean by the presence of large pixel amplitudes if ships are present. The other thresholds are calculated in increments of half of the median. A curve of FAR as a function of these thresholds is then calculated. The number of pixels is limited in a specific image, consequently, the FAR calculated from the measured data is limited. In order to obtain a specified FAR, such as 10-6, 10-8, etc., an extrapolation method is used to fit a 2nd order polynomial equation,
2cxbxaT ++= (9) using least squares. In this equation, x = log(FAR). By solving Equation (9), the FAR vs Ti. curve can be calculated, and the threshold η′ corresponding to the specified FAR can therefore be obtained. An example plot of FAR vs T is illustrated in Figure 2, where the calculation from the measured data is indicated in red circles, while the extrapolation values are indicated by a blue line. Here, 2×10⁶ ocean pixel data was obtained from the Quest trial, l1p1, 7 October 2003, conducted by DRDC Ottawa [8]. The median of the decision variable, Ũ = 3.315, i.e. threshold T0 = 3.315. Tk = (1+k/2)T0, k = 0, …, 9 were used to obtain with FAR = 10-8, x = –8, and by Equation (9), η′ = T = 67.20.
0 10 20 30 40 50 60 70−8
−7
−6
−5
−4
−3
−2
−1
0
T
log(
FA
R)
Measured dataExtrapolated value
Figure 2: FAR vs. T data and fit for extrapolation.

DRDC Ottawa TM 2005-243 9
3.2.3 Pixel Detection After the calculation of the decision variables and the threshold η′ from the specified FAR, pixel detection is performed using Equation (4). The decision variable of each pixel is compared to the threshold. If it is greater than the threshold, the pixel is considered to belong to a ship.
3.2.4 Calculations of Other Statistical Parameters To study ocean and ship characteristics, some statistical parameters, such as the mean of the decision variable and its standard deviation as well as the correlation coefficient and covariance of polarimetric channels, are also calculated. If peak clutter reduction is not applied, then these parameters are calculated for the entire image strip and are considered to represent the ocean. These parameters are also calculated for the detected ship pixels. If peak clutter reduction is applied, the ocean parameters are calculated using only the pixels with decision variable less than the selected peak clutter. The mean of the decision variable is
∑=
=M
iiU
MU
1
1 (10)
where M is the number of pixels in the calculation, and the standard deviation is given by
21
2
1)(1σ ⎥⎦
⎤⎢⎣⎡ −= ∑
=
M
ii UU
M (11)
The correlation coefficient for polarimetric channels are calculated by
),(),(),(),(
nnCmmCnmCnmR = (12)
where C(m, n) is an element of the covariance matrix. The correlation coefficient of different polarization channels indicates the degree of similarity between them. After potential ships are detected, the intensities (amplitude squared) of individual target pixels for each polarimetric channel are also calculated to permit study of target-to-clutter ratio (TCR). The correlation coefficient and covariance of the polarimetric channels of each target pixel are also calculated. The estimated statistical parameters of the detected ship targets will support future capabilities involving ship classification.

10 DRDC Ottawa TM 2005-243
3.2.5 Polarimetric Decomposition Method Pauli Scattering Vector The Pauli scattering vector is the scattering matrix S expressed in the Pauli basis [9],
⎪⎭
⎪⎬⎫
⎪⎩
⎪⎨⎧
⎥⎥⎦
⎤
⎢⎢⎣
⎡ −
⎥⎥⎦
⎤
⎢⎢⎣
⎡
⎥⎥⎦
⎤
⎢⎢⎣
⎡
−⎥⎥⎦
⎤
⎢⎢⎣
⎡=
0
02
01
102
10
012
10
012Ψ
i
ip (13)
It permits the extraction of physical information from the 2×2 coherent scattering matrix. The Pauli scattering vector is given by [9]
THVVHVHHVVVHHVVHH SSiSSSSSSk )]([
21 −+−+= (14)
In practice, almost all targets are approximately reciprocal (i.e., SHV ≅ SVH) [10]. Therefore, in this application software, the final term of Equation (14) can be set to zero. The (SHH + SVV) component would tend to be large for single bounce scattering, while (SHH – SVV) would be large for double bounce, and (SHV + SVH) presents the volume scattering. Pauli Decomposition Method The application software implements a decomposition method based on the Pauli vector. Each pixel is assigned to one of three classes, depending on which of the components is the largest in amplitude. For class 1, (SHH + SVV) is the largest, for class 2, (SHH – SVV) is the largest and for class 3 (SHV + SVH) is the largest.
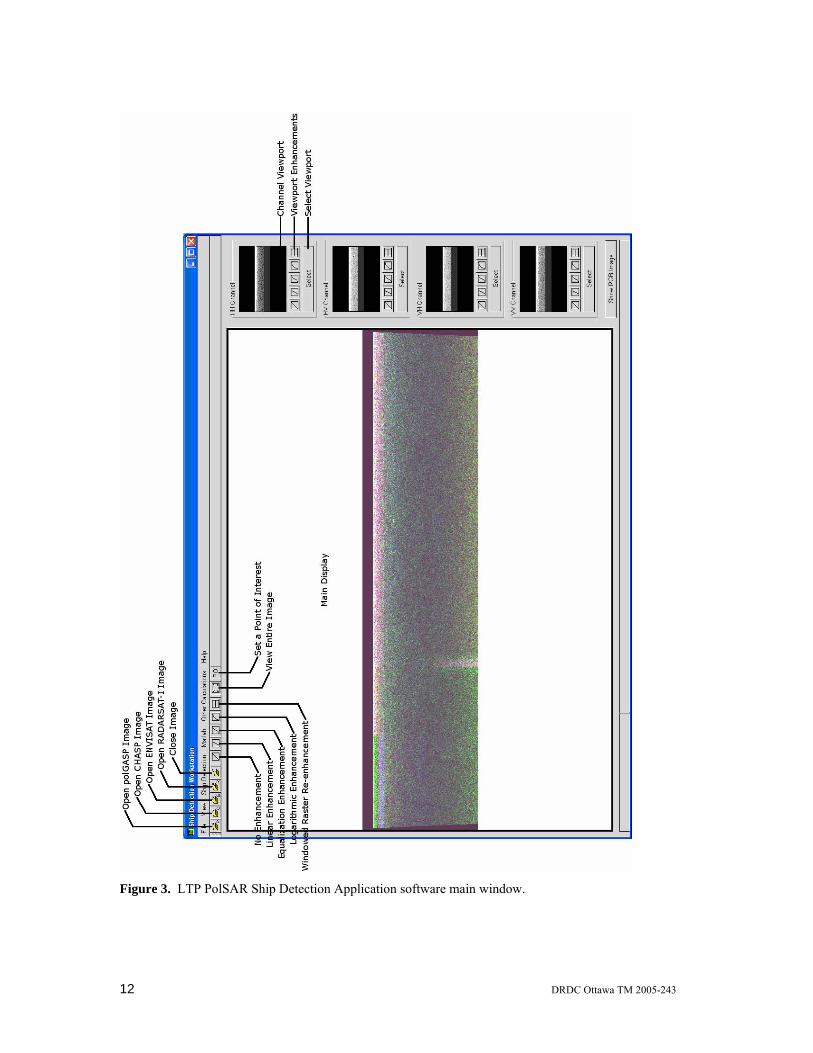
3.3 Graphical User Interface The LRT PolSAR Ship Detection Application is developed for use with the Windows Operating Systems. The main window of the application software contains an image viewing area, shown in Figure 3. In this area, the user can view the individual channels of an image, or various combinations of the channels. For example, images from EC CV-580 polarimetric SAR system can be displayed in a number of ways including a basic Red, Green and Blue (RGB) composite (red = |HH|, green = |HV+VH|, blue = |VV|) and the Pauli Decomposition (red = double bounce, green = volume scatter, blue = single bounce). On the right side of the window are four viewing areas in which the channels of an image are shown individually. Additionally, a small window displaying the RGB overview of the image can be toggled via the Edit menu. The RGB overview is user selectable to be either the basic RGB composite or the Pauli decomposition. Four image enhancement settings/look-up tables are provided for each of the viewing areas. Also, the user can zoom in and out on the image (or even rotate it) in any of the viewing areas. The File menu contains items for opening the four supported image formats, closing the current image, and exiting. In the Edit menu, the user can toggle the RGB window, toggle the channel

DRDC Ottawa TM 2005-243 11
viewing areas, view the contents of header files, and set the axis limits in the main viewing area. All of the detection functions for the supported image types are found under the Ship Detection menu. Under the Matlab menu, the user can export an area of an image to the Matlab™ MAT file format, as well as call RGB image and Pauli decomposition functions in Matlab™. Items in the Other Calculations menu include gathering statistics for both ships and ocean areas. The Matlab™ files are user selectable. System Architecture The application software consists of several individual units: Python source code, the Python Gimp Tool Kit (PyGTK) library for Graphical User Interface (GUI) implementation and management, the Geospatial Data Abstraction Library (GDAL) and Open Earth View (OpenEV) libraries for reading and viewing images, and C++ source code for the ship detection functions. The main modules of the applications are written in the Python programming language [11]. Python allows for rapid development, and various libraries are freely available for accomplishing simple tasks such as plotting data on a graph. The PyGTK library [12] provides the various GUI objects for the application such as windows, menu items, and text boxes. PyGTK is an open source project. The GDAL provides support for reading in various formats of images [13]. GDAL features built-in support for the RADARSAT-1 and ENVISAT formats, but custom additions had to be written for the CV-580 PolSAR data formats. GDAL is an open source project using the OpenEV library [14]. This library provides the Application software’s image viewing capabilities. OpenEV is another open source initiative, released under the GNU Lesser General Public License. The ship detection functions were written in C++ and compiled into Dynamic Link Libraries (DLLs) for Windows XP. There are four libraries, one for each data format. The code was written in and compiled by Microsoft Visual C++, NET 2003.
12 DRDC Ottawa TM 2005-243
Figure 3. LTP PolSAR Ship Detection Application software main window.

DRDC Ottawa TM 2005-243 13
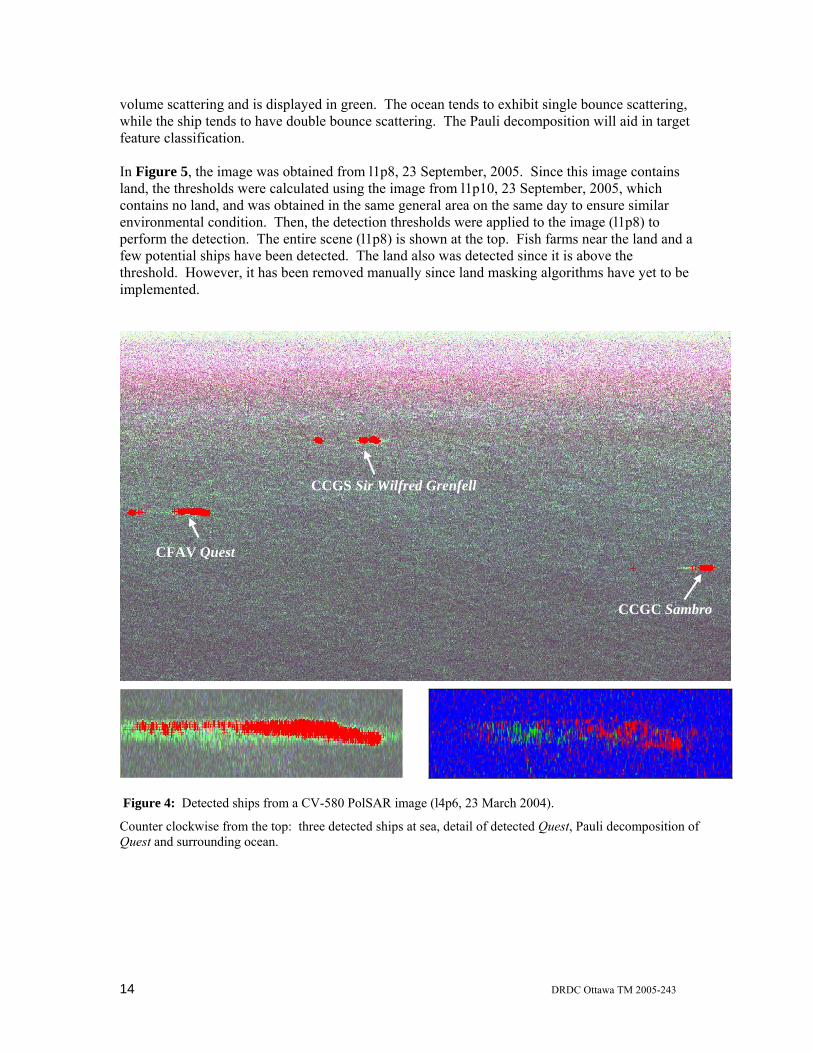
4. Applications The applications of the LRT PolSAR Ship Detection Application are illustrated in this section. At the present time, the Application software performs single pixel detection. The detected ships (pixels) from quad polarimetric SAR algorithms are shown in Figures 4 and 5. The data were obtained from DRDC Ottawa the MarCoPola Polarimetric SAR trial [15] and the CoCoNaut Polarimetric SAR Signature Trial [16] using the EC CV-580 C-Band PolSAR sensor. The range-gating typically limits the incidence angle from 28° to 74° for this sensor [7]. The radar was set to SAW-1 Off configuration [17] which provides a resolution of roughly 9 m in slant range and 1 m in azimuth for single-look data. The sample spacing is 4 m in slant range and 0.4 m in azimuth. Three controlled ships, the Canadian Forces Auxiliary Vessel (CFAV) Quest, Canadian Coast Guard ship (CCGS) Sir Wilfred Grenfell and CCG Cutter (CCGC) Sambro participated in the MarCoPola trial. For ground truthing purposes, a 3-axis accelerometer was available on the Quest and a Trimble GPS was installed on each CCG vessel. The ship locations, speeds and courses were obtained from this equipment. In order to avoid significant variation of the statistical decision variable due to large incidence angle difference, each image was divided into strips with an incidence angle difference of 5° to calculate the detection thresholds; incidence angles between 30° to 60° are considered. The threshold was calculated with the FAR set to 10-8. The figures show detected pixels as red crosses superimposed on the RGB display in which the amplitude of the HH channel is displayed in red, the amplitude of VV in blue, and the amplitude of HV and VH in green. Each red cross represents the top left corner of the detected pixel. In Figure 4, the image was obtained from l4p6, 23 March, 2004. The entire scene is shown at the top. Three controll ships, the CFAV Quest, CCGS Sir Wilfred Grenfell and CCGC Sambro, were detected. A detail of Quest is also shown in Figure 4 (bottom left). The incidence angle at the center target, Quest, is 48°. The ships have a velocity of 5.14 m/s (10 kts) towards the sensor with an aspect angle of 45°. The dimensions of each ship are indicated in Table 1. However, the ambiguities that arise from azimuth sampling [18] were also detected. Algorithms for ambiguity removal have yet to be implemented.
Table 1: Ship dimensions.
Name Dimension (m) CFAV Quest 76 x 12.6 CCGS Sir Wilfred Grenfell 68.48 x 15 CCGC Sambro 16.25 x 5.18
An example of the Pauli decomposition of the Quest and surrounding sea is also shown in Figure 4 (bottom right). Each pixel is assigned to one of three classes, depending on which of the components is the largest in amplitude. Class 1 represents single bounce scattering and is displayed in red. Class 2 represents a double bounce and is displayed in blue. Class 3 represents
14 DRDC Ottawa TM 2005-243
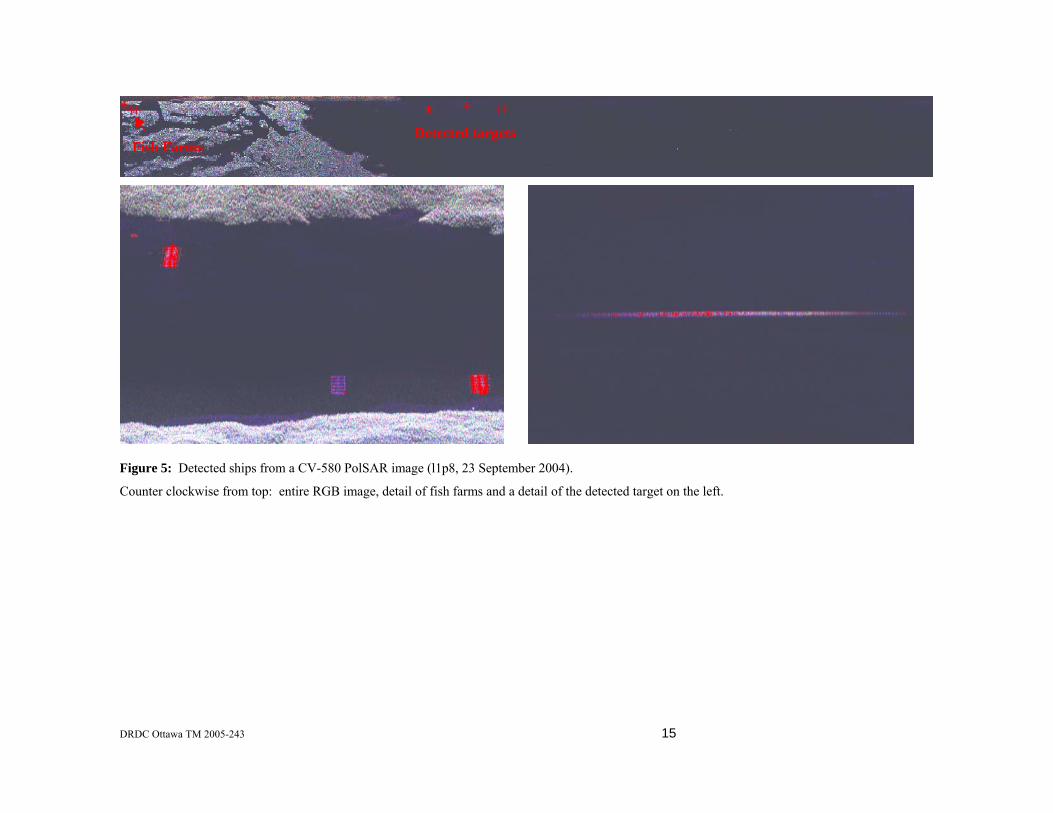
volume scattering and is displayed in green. The ocean tends to exhibit single bounce scattering, while the ship tends to have double bounce scattering. The Pauli decomposition will aid in target feature classification. In Figure 5, the image was obtained from l1p8, 23 September, 2005. Since this image contains land, the thresholds were calculated using the image from l1p10, 23 September, 2005, which contains no land, and was obtained in the same general area on the same day to ensure similar environmental condition. Then, the detection thresholds were applied to the image (l1p8) to perform the detection. The entire scene (l1p8) is shown at the top. Fish farms near the land and a few potential ships have been detected. The land also was detected since it is above the threshold. However, it has been removed manually since land masking algorithms have yet to be implemented.
Figure 4: Detected ships from a CV-580 PolSAR image (l4p6, 23 March 2004).
Counter clockwise from the top: three detected ships at sea, detail of detected Quest, Pauli decomposition of Quest and surrounding ocean.
CCGS Sir Wilfred Grenfell
CFAV Quest
CCGC Sambro
DRDC Ottawa TM 2005-243 15
Figure 5: Detected ships from a CV-580 PolSAR image (l1p8, 23 September 2004).
Counter clockwise from top: entire RGB image, detail of fish farms and a detail of the detected target on the left.
Fish Farms Detected targets
DRDC Ottawa TM 2005-243 16
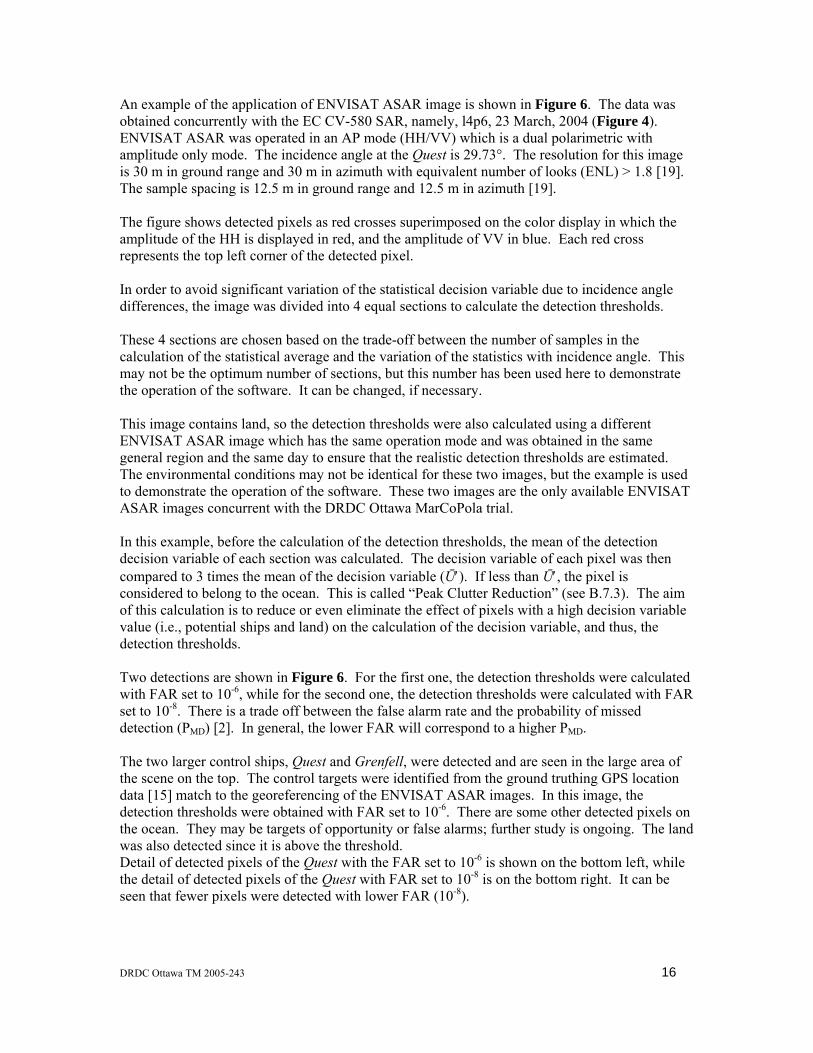
An example of the application of ENVISAT ASAR image is shown in Figure 6. The data was obtained concurrently with the EC CV-580 SAR, namely, l4p6, 23 March, 2004 (Figure 4). ENVISAT ASAR was operated in an AP mode (HH/VV) which is a dual polarimetric with amplitude only mode. The incidence angle at the Quest is 29.73°. The resolution for this image is 30 m in ground range and 30 m in azimuth with equivalent number of looks (ENL) > 1.8 [19]. The sample spacing is 12.5 m in ground range and 12.5 m in azimuth [19]. The figure shows detected pixels as red crosses superimposed on the color display in which the amplitude of the HH is displayed in red, and the amplitude of VV in blue. Each red cross represents the top left corner of the detected pixel. In order to avoid significant variation of the statistical decision variable due to incidence angle differences, the image was divided into 4 equal sections to calculate the detection thresholds. These 4 sections are chosen based on the trade-off between the number of samples in the calculation of the statistical average and the variation of the statistics with incidence angle. This may not be the optimum number of sections, but this number has been used here to demonstrate the operation of the software. It can be changed, if necessary. This image contains land, so the detection thresholds were also calculated using a different ENVISAT ASAR image which has the same operation mode and was obtained in the same general region and the same day to ensure that the realistic detection thresholds are estimated. The environmental conditions may not be identical for these two images, but the example is used to demonstrate the operation of the software. These two images are the only available ENVISAT ASAR images concurrent with the DRDC Ottawa MarCoPola trial. In this example, before the calculation of the detection thresholds, the mean of the detection decision variable of each section was calculated. The decision variable of each pixel was then compared to 3 times the mean of the decision variable (Ū′). If less than Ū′, the pixel is considered to belong to the ocean. This is called “Peak Clutter Reduction” (see B.7.3). The aim of this calculation is to reduce or even eliminate the effect of pixels with a high decision variable value (i.e., potential ships and land) on the calculation of the decision variable, and thus, the detection thresholds. Two detections are shown in Figure 6. For the first one, the detection thresholds were calculated with FAR set to 10-6, while for the second one, the detection thresholds were calculated with FAR set to 10-8. There is a trade off between the false alarm rate and the probability of missed detection (PMD) [2]. In general, the lower FAR will correspond to a higher PMD. The two larger control ships, Quest and Grenfell, were detected and are seen in the large area of the scene on the top. The control targets were identified from the ground truthing GPS location data [15] match to the georeferencing of the ENVISAT ASAR images. In this image, the detection thresholds were obtained with FAR set to 10-6. There are some other detected pixels on the ocean. They may be targets of opportunity or false alarms; further study is ongoing. The land was also detected since it is above the threshold. Detail of detected pixels of the Quest with the FAR set to 10-6 is shown on the bottom left, while the detail of detected pixels of the Quest with FAR set to 10-8 is on the bottom right. It can be seen that fewer pixels were detected with lower FAR (10-8).
DRDC Ottawa TM 2005-243 17
In general, the FAR can be high for pixel detection (e.g. 10-5 or 10-6). To obtain a low PMD, the desired low FAR (e.g. 10-8 or 10-9) can be obtained through clustering of the detected pixels. It can also be seen that some light colored pixels are not detected. However, they may not actually be part of the ship. They could represent smearing and therefore their statistics fall below the detection threshold.

18 DRDC Ottawa TM 2005-243
Figure 6. Detected ships from an ENVISAT ASAR HH-VV image.
Counter clockwise from top: Large area of color image (FAR=10-6), detail of Quest (FAR=10-6) and detail of Quest (FAR=10-8).
CFAV Quest
CCGS Sir Wilfred Grenfell
DRDC Ottawa TM 2005-243 19
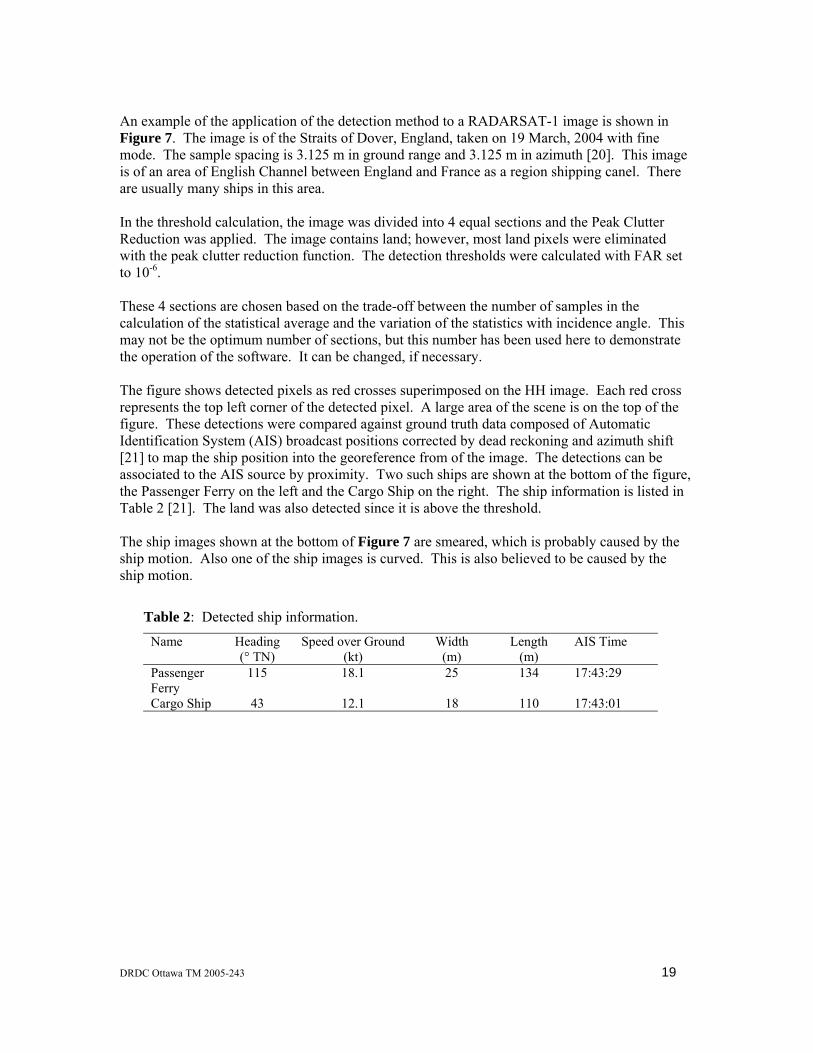
An example of the application of the detection method to a RADARSAT-1 image is shown in Figure 7. The image is of the Straits of Dover, England, taken on 19 March, 2004 with fine mode. The sample spacing is 3.125 m in ground range and 3.125 m in azimuth [20]. This image is of an area of English Channel between England and France as a region shipping canel. There are usually many ships in this area. In the threshold calculation, the image was divided into 4 equal sections and the Peak Clutter Reduction was applied. The image contains land; however, most land pixels were eliminated with the peak clutter reduction function. The detection thresholds were calculated with FAR set to 10-6. These 4 sections are chosen based on the trade-off between the number of samples in the calculation of the statistical average and the variation of the statistics with incidence angle. This may not be the optimum number of sections, but this number has been used here to demonstrate the operation of the software. It can be changed, if necessary. The figure shows detected pixels as red crosses superimposed on the HH image. Each red cross represents the top left corner of the detected pixel. A large area of the scene is on the top of the figure. These detections were compared against ground truth data composed of Automatic Identification System (AIS) broadcast positions corrected by dead reckoning and azimuth shift [21] to map the ship position into the georeference from of the image. The detections can be associated to the AIS source by proximity. Two such ships are shown at the bottom of the figure, the Passenger Ferry on the left and the Cargo Ship on the right. The ship information is listed in Table 2 [21]. The land was also detected since it is above the threshold. The ship images shown at the bottom of Figure 7 are smeared, which is probably caused by the ship motion. Also one of the ship images is curved. This is also believed to be caused by the ship motion.
Table 2: Detected ship information.
Name Heading (° TN)
Speed over Ground (kt)
Width (m)
Length (m)
AIS Time
Passenger Ferry
115 18.1 25 134 17:43:29
Cargo Ship 43 12.1 18 110 17:43:01

20 DRDC Ottawa TM 2005-243
Figure 7. Detected ships from a RADARSAT-1 image.
Counter clockwise from top: Large area of Passenger Ferry, detail of Cargo Ship.
Cargo Ship
Passenger Ferry

DRDC Ottawa TM 2005-243 21
At the present time, there is no RADARSAT-2 data available. However, evaluation through simulated RADARSAT-2 data from EC CV-580 C-band PolSAR data is an important aspect of ongoing research. It is believed that the point detection algorithms of LRT PolSAR Ship Detection Application can be applied to RADARSAT-2 for the following reasons: firstly, EC CV-580 PolSAR is a fully polarimetric system, operates at the same C-band frequency that RADARSAT-2 will offer, and is designed to provide comparable polarimetric mode. Secondly, the applications of the software to the spaceborne SAR systems, such as RADARSAT-1 and ENVISAT have been demonstrated to show robustness to a wide variety of variables. RADARSAT-2 will have similar radar system parameters and geometry as the single channel RADARSAT-1. At the present time, the full software capabilities are limited to images without land or with only a small area of land. If the image contains a large amount land, an alternative is to first use another image which covers ocean only and was obtained under the similar environmental conditions for calibration of the parameters. The examples in this section illustrate the application of the software to various polarimetric SAR modes. They are intended as demonstrations of the capabilities of the software rather than a detailed detection analysis. The calculations used in this section may not be optimum. The alternative images used to calculate the thresholds for the detection in a different image may not represent identical environmental conditions. However, the examples are presented here to demonstrate the operation of the software. The optimization and refinement of the operational parameters is an ongoing process based on user feedback and the further analysis of the detection results.
22 DRDC Ottawa TM 2005-243
5. Conclusions and Future Work
The Likelihood Ratio Test Polarimetric SAR Ship Detection Application has been developed to provide a ship detection capability for various PolSAR system configurations. The application software implements a point detection process using a likelihood ratio test with Neyman-Peason criterion. The detection threshold can be set to produce a desired probability of false alarm. This detector, when used with quad polarimetric system, has a significantly improved detection performance compared to a single-channel system because it uses both the amplitude and phase information [2]. It can be used for data from both airborne and spaceborne SAR systems, such as RADARSAT-2, ENVISAT ASAR, RADARSAT-1, etc. The algorithms of this detector have been developed from the optimal likelihood ratio test with the added assumption that the target return is not close to the clutter level. This produces a great simplification in the implementation, but implies that the detection performance for weak targets is suboptimal. Further optimization for weak targets is a subject of ongoing research.
The optimization of the application software is ongoing, including modifying threshold calculation algorithms for application to small image areas, and optimizing algorithms for weak target detection. The optimization of algorithms to reduce the processing time is also considered. The application of the software to a variety of data sources, including CV-580 SAR, ENVISAT ASAR and RADARSAT-1 are continuing. The application of the software to RADARSAT-2 data will be performed when the data becomes available. In the meantime, a RADARSAT-2 simulation software package has been provided by Canadian Space Agency (CSA) as a research tool. The CV-580 SAR data can be used to generate RADARSAT-2 style data for various modes. The resolution is scaled and the system parameters are adjusted approximately. The evaluation of RADARSAT-2 simulated data from CV-580 SAR data is a part of the research activities. The simulated RADARSAT-2 data will be tested using LRT PolSAR Ship Detection Application software, and the detection results will be compared with CV-580 SAR data. The main features of the application software currently include point detection, statistical calculations, Pauli decomposition, and various image displays. At the present time, the application software serves as a research tool and a basis on which to build a complete ship detection capability. Enhancements and new ship detection features as well as classification algorithms are under development to provide a comprehensive ship detection and classification capability. One necessary feature is a clustering and segmentation capability to extract ships and reduce false alarms. Additional features will also be implemented, including various combinations of PolSAR channels to aid in reducing false alarms; land masking and ambiguity removal algorithms; and various decomposition methods. With these added features, the LRT PolSAR Ship Detection Application will be able to provide a ship detection and feature extraction capability for RADARSAT-2 images to contribute to the requirements of the Canadian Forces for wide area ocean surveillance

DRDC Ottawa TM 2005-243 23
6. References 1. Quinn, R.J. (2005). “Project Polar Epsilon: Joint Space-Based Wide Area Surveillance
and Support Capability”, 8th International Conference on Remote Sensing for Marine and Coastal Environments proceeding, Halifax, Nova Scotia, Canada, 17-19 May 2005.
2. Liu, C., Vachon, P.W., and Geling, G.W. (2005). Improved Ship Detection with Airborne Polarimetric SAR data. Canadian Journal of Remote Sensing, Vol. 31, No.1, pp. 122-131, 2005.
3. Scharf, L.L. (1991). “Statistical Signal Processing – Detection, Estimation, and Time Series Analysis”, Addison-Wesley Publishing Company.
4. Goodman, J.W. (1963). “Statistical Analysis Based on a Certain Multivariate Complex Gaussian Distribution (An Introduction)”, Annals of Mathematical Statistics, Vol. 34, No. 152, pp 152-180, 1963.
5. Goodman, J.W. (1985). “Statistical Optics”, John Wiley and Sons Inc., New York, 1985.
6. Lee, J.-S., Hoppel, K.W., Mango, S.A. (1994). “Intensity and Phase Statistics of Multilook Polarimetric and Interferometric SAR Imagery”, IEEE Transactions on Geoscience and Remote Sensing, Vol. 32, No. 5, pp. 1017-1028, Sept. 1994.
7. Livingstone, C.E., Gray, A.L., Hawkins, R.K., Vachon, P.W., Lukowski, T.I., and Lalonde, M. (1995). “The CCRS airborne SAR systems: Radar for remote sensing research”, Canadian Journal of Remote Sensing, Vol. 21, pp. 468-491, 1995.
8. Liu, C., Gallop, L., and Schlingmeier, D. (2004). Quest-2003 Polarimetric Signature Trial: Experiment Design, SAR Calibration, Data Acquisition and Initial Results. (DRDC Ottawa TM 2004-207). Defence R&D Canada – Ottawa.
9. Cloud, S.R. and Pottier, E. (1996). “A Review of Target Decomposition Theorems in Radar Polarimetry”, IEEE Transactions on Geoscience and Remote Sensing, Vol. 34, No. 2, March 1996.
10. Pottier, E. (2003). “Polarimetry: From Basics to Application”, Tutorial 3, IEEE International Geoscience and Remote Sensing Symposium (IGARSS), Toulouse, France, 21-25 July 2003.
11. Python Software Foundation (2005). Python Programming Language. (Online) Python Software Foundation. http://www.python.org (November 1, 2005).
12. The GNOME Project (2004). PyGTK. (Online) The GNOME Project. http://www.pygtk.org (November 1, 2005).
24 DRDC Ottawa TM 2005-243
13. OpenEV Developers (2005). OpenEV Home. (Online) OpenEV Developers. http://openev.sourceforge.net (December 1, 2005).
14. Warmerdam, Frank (2005). GDAL - Geospatial Data Abstraction Library. (Online) Warmerdam, Frank. http://www.gdal.org (November 1, 2005).
15. Liu, C., Sandirasegaram, N., English, R.A., Gallop, L. and Schlingmeier, D, (2005). “MarCoPola Polarimetric SAR Trial: Signatures of Multiple Vessels with Aligned Operating Conditions”. (DRDC Ottawa TM 2005-134). Defence R&D Canada – Ottawa.
16. English, R.A., Liu, C., Schlingmeier, D. and Vachon, P.W. (2006) “CoCoNaut Polarimetric SAR Signature Trial: Small Vessels of opportunity Collection off Tofino, BC”, DRDC Ottawa TM, in preparation.
17. Hawkins, R.K. and Vachon, P.W. (1998). SAR gain and point target measurements - The saturation problem. CCRS-TN-1998-27, 10p, 1998.
18. Curlander, J.C. and McDonough, R.N, (1991). “Synthetic aperture radar – systems and signal processing”, John Wiley & sons, Inc.
19. Kramer, Herbert J. (2005). eoPortal directory: ENVISAT. (Online) eoPortal. http://directory.eoportal.org/pres_ENVISAT.html (November 28, 2005).
20. CSA (2005). CSA - RADARSAT-1. (Online) Canadian Space Agency. http://www.space.gc.ca/asc/eng/satellites/radarsat1/default.asp (November 28, 2005).
21 English, R. (2005), “ATR Workbench – Maritime Classification in SAR”, DRDC Ottawa. November 24, 2005
22. Murnaghan, K. (2001). Convair 580 C-Band PolSAR Data Processing. Course notes, Integrated Computation, Ottawa, Canada.
23. Dragosevic, M.V. and Vachon, P.W (2006), “The COASP and CHASP processors for stripmaps and adaptive EC CV-580 SAR processing algorithms and software description”, DRDC Ottawa TM, in preparation.
24. Class GvViewArea - Gtk geographic view area. (2005) (Online) http://openev.sourceforge.net/ py_html/gview.GvViewArea.html#gview.GvViewArea.fit_extents (November 24, 2005).
25. View Area Button/Key Sequences. (Online) http://openev.sourceforge.net/app/viewarea_keys.html (November 1, 2005).
26. Strang, G. (2003). “Introduction to Linear Algebra”, 3rd Edition, Wellesley-Cambridge Press.

DRDC Ottawa TM 2005-243 25
Annex A. User Guide
A.1 Overview The Likelihood Ratio Test Polarimetric SAR Ship Detection Application has been developed to detect vessels in polarimetric SAR imagery acquired by Environment Canada’s Convair-580 aircraft and processed by PolGASP [22] or COASP [23], and in ENVISAT ASAR and RADARSAT-1 imagery. The features include:
• Point detection of ships using the likelihood ratio test and a threshold calculation to achieve a desired false alarm probability for the point detection
• The application of Pauli decomposition • The ability to view each channel of an image individually, or all channels
simultaneously as an RGB composite • A viewer for PolGASP and COASP header files • Zoom and rotation tools • Lookup tables/image enhancement tools • Customizable parameters to improve the detection algorithm’s accuracy
The image viewing capabilities are provided by OpenEV, an open source library developed by Vexcel Canada and released under the GNU Lesser General Public License [13]. Support for ENVISAT ASAR and RADARSAT-1 imagery is provided by the Geospatial Data Abstraction Library (GDAL) [14]. PolGASP and COASP images are supported by custom additions to GDAL. This user guide includes instructions for installing and starting the application software, a screenshot of the application software’s main window, descriptions of the menu and toolbar items in the main window, and descriptions of various algorithms used in the application software.
A.2 Installing and Starting the Application Software The LRT PolSAR Ship Detection Application is developed for use with Windows Operating Systems. To install the application software, copy all of the files from the distribution disk to c:\shipDetWkstn. The application software can be installed in another directory, but the value of SOURCEPATH in the batch file shipDetWkstn.bat must be changed to the new directory. To start the application software, run shipDetWkstn.bat.
A.3 GUI Figure 8 is a screenshot of the Likelihood Ratio Test Polarimetric SAR Ship Detection Application’s main window. Various elements of the GUI are noted.

26 DRDC Ottawa TM 2005-243
Figure 8: Screenshot of the Application software's main window.

DRDC Ottawa TM 2005-243 27
A.4 Menu Items The following are descriptions of the functions of each menu item in the main window.
A.4.1 File Menu Open PolGASP Image Displays an Open File dialog (see Figure 9) that allows the user to choose the HH header file of a four-channel PolGASP image. If the image has not been loaded in the workstation before, three files that combine to form a basic RGB composite representation of the image are generated (Red=|HH|, green=|HV+VH|, blue=|VV|). Then, six files that combine to form the Pauli Decomposition of the image are generated. Finally, a single file is generated to show the result of the operation |HV-VH|. The image is then displayed in the main display. If the channel viewports are turned on, the HH channel is shown in the first viewport, the HV channel in the second, the VH channel in the third, and the VV channel in the fourth.
Figure 9: Open PolGASP Image file dialog.
Open COASP Image Performs the same function as Open PolGASP Image, but for a COASP image. The user chooses the HH header file of a four-channel COASP image in the Open File dialog. Open ENVISAT ASAR Image Displays an Open File dialog that allows the user to choose an ENVISAT ASAR image. Opens a processed dual-pol image acquired by ENVISAT. The main display shows a two-colour image where red represents the first channel, and green represents the second channel. If the channel viewports are turned on, the first channel is shown in the first viewport, and the second channel is shown in the second viewport. The other two viewports are left blank.

28 DRDC Ottawa TM 2005-243
Open RADARSAT−1 Image Displays an Open File dialog that allows the user to choose the .img file of a RADARSAT-1 image. The main display shows the image’s one channel. If the channel viewports are turned on, the channel is shown in the first viewport. The other three viewports are left blank. Close Closes the current image (if one is open), and leaves a blank display. Additionally, any ship detection results and section boundaries being displayed are cleared. Quit Terminates the application.
A.4.2 View Menu Toggle Viewports Turns the four channel viewports on the right side of the application window on/off. Toggle RGB View Shows/hides a small window displaying the RGB representation of the current image, or a blank display if no image is open (see Figure 10).
Figure 10: RGB Display window.
Show Metadata (PolGASP & COASP) If the current image is in the PolGASP or COASP format, displays the contents of the image’s header files. The user can switch between channels using the drop-down list at the top of the window (Figure 11).

DRDC Ottawa TM 2005-243 29
Figure 11: Dataset Metadata window.
Set Axis Limits (PolGASP & COASP) Displays a window that allows the user to set the axis limits of the main display (Figure 12). If the aspect ratio of the specified coordinates does not match that of the main display, the values will be automatically adjusted to show the requested area, with extra area in one dimension [24], i.e. the display is in terms of pixels, and can use non-square pixels. At the present time, for CV-580 PolSAR data the slant range scale is set to be six times of the azimuth.
Figure 12: Set Main Display Axis Limits window.
Image Representation If the current image is in the PolGASP or COASP format, the user can switch between four RGB representations of the image: basic RGB (red = |HH|, green = |HV+VH|, blue = |VV|), Pauli Display (red = |HH-VV|, green = |HV+VH|, blue = |HH+VV|), Pauli Decomposition (red = double bounce, green = volume scatter, blue = single bounce). A fourth option, |HV-VH| is also available, although it is a grayscale image. If the current image is not PolGASP or COASP, only the basic RGB representation is available; see Sections B.7.1 and B.7.9 for more detailed descriptions of these image representations.
30 DRDC Ottawa TM 2005-243
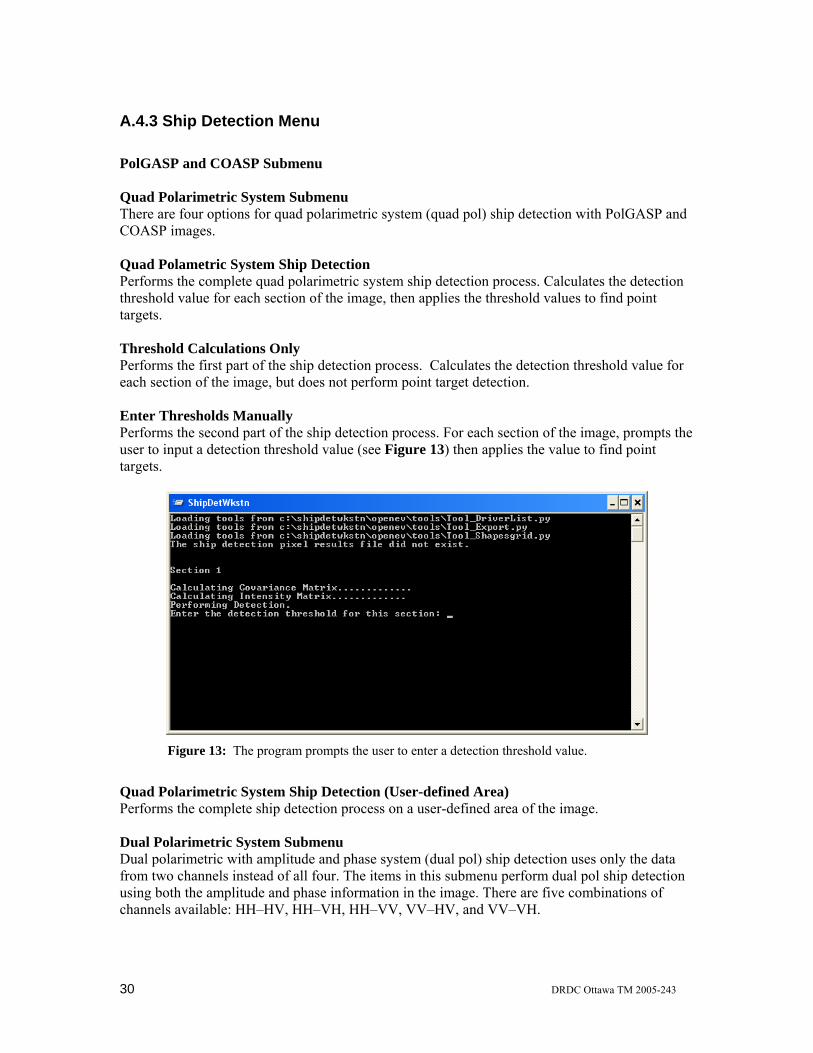
A.4.3 Ship Detection Menu PolGASP and COASP Submenu Quad Polarimetric System Submenu There are four options for quad polarimetric system (quad pol) ship detection with PolGASP and COASP images. Quad Polametric System Ship Detection Performs the complete quad polarimetric system ship detection process. Calculates the detection threshold value for each section of the image, then applies the threshold values to find point targets. Threshold Calculations Only Performs the first part of the ship detection process. Calculates the detection threshold value for each section of the image, but does not perform point target detection. Enter Thresholds Manually Performs the second part of the ship detection process. For each section of the image, prompts the user to input a detection threshold value (see Figure 13) then applies the value to find point targets.
Figure 13: The program prompts the user to enter a detection threshold value.
Quad Polarimetric System Ship Detection (User-defined Area) Performs the complete ship detection process on a user-defined area of the image. Dual Polarimetric System Submenu Dual polarimetric with amplitude and phase system (dual pol) ship detection uses only the data from two channels instead of all four. The items in this submenu perform dual pol ship detection using both the amplitude and phase information in the image. There are five combinations of channels available: HH–HV, HH–VH, HH–VV, VV–HV, and VV–VH.

DRDC Ottawa TM 2005-243 31
Dual-Channel System (Amplitude, Correlated) Submenu A dual-channel with amplitude system has only one combination of channels available for this dual pol detection mode: HH and VV. Dual-Channel System (Amplitude, Uncorrelated) Submenu There are five combinations of channels available for this dual pol detection mode: HH–HV, HH–VH, HH–VV, HV–VV, and VV–VH. Single-Channel System Submenu A single-channel system (single pol) ship detection uses only the data from a single channel. All four channels are available for this detection mode. ENVISAT ASAR Submenu Dual Pol Amplitude Uncorrelated Ship Detection Performs dual pol detection using the two channels of an ENVISAT ASAR image. This follows the same algorithm as the Dual Pol (Amplitude, Uncorrelated) detection for PolGASP and COASP images. Dual Pol Amplitude Uncorrelated Ship Detection (Enter Threshold Manually) Performs the same method for ship detection as the previous item; however, for each section of the image, prompts the user to input a detection threshold value. This value is then applied to find point targets. RADARSAT-1 Submenu HH Ship Detection Performs single pol detection using the HH channel (the only polarization available in RADARSAT-1 images). This follows the same algorithm as the single pol detection for PolGASP and COASP images. HH Ship Detection (Enter Threshold Manually) Perform the same method for ship detection as the previous item; however, for each section of the image, prompts the user to input a detection threshold value. This value is then applied to find point targets. Show Ship Detection Results If the file containing results from the ship detection process (<imgname>detectionresults.txt) exists, the results are displayed over the image in the main display. If the results file cannot be found, an error message is displayed. Hide Ship Detection Results Clears any detection results being shown in the main display. Show Section Boundaries Shows the strip boundaries that would be used for ship detection. If the current image is a PolGASP or COASP image, the boundaries are drawn according to the minimum and maximum incidence angle and section width specified in the Ship Detection Parameters window. If the
32 DRDC Ottawa TM 2005-243
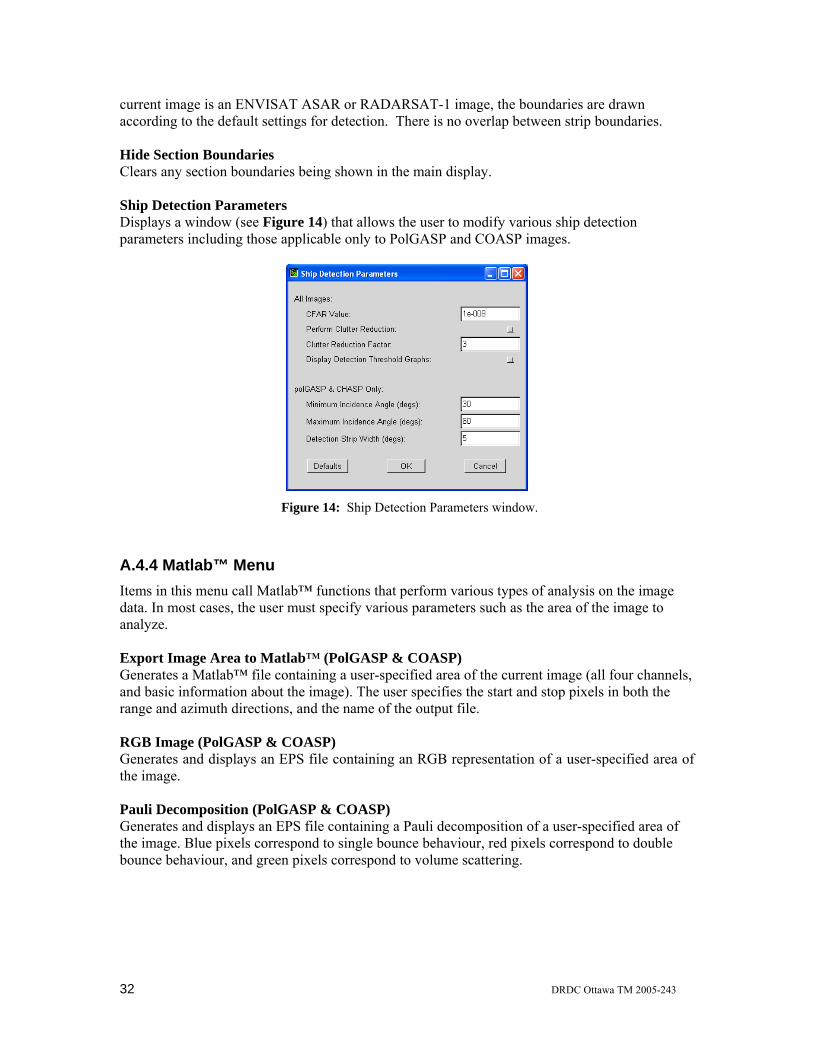
current image is an ENVISAT ASAR or RADARSAT-1 image, the boundaries are drawn according to the default settings for detection. There is no overlap between strip boundaries. Hide Section Boundaries Clears any section boundaries being shown in the main display. Ship Detection Parameters Displays a window (see Figure 14) that allows the user to modify various ship detection parameters including those applicable only to PolGASP and COASP images.
Figure 14: Ship Detection Parameters window.
A.4.4 Matlab™ Menu Items in this menu call Matlab™ functions that perform various types of analysis on the image data. In most cases, the user must specify various parameters such as the area of the image to analyze. Export Image Area to Matlab™ (PolGASP & COASP) Generates a Matlab™ file containing a user-specified area of the current image (all four channels, and basic information about the image). The user specifies the start and stop pixels in both the range and azimuth directions, and the name of the output file. RGB Image (PolGASP & COASP) Generates and displays an EPS file containing an RGB representation of a user-specified area of the image. Pauli Decomposition (PolGASP & COASP) Generates and displays an EPS file containing a Pauli decomposition of a user-specified area of the image. Blue pixels correspond to single bounce behaviour, red pixels correspond to double bounce behaviour, and green pixels correspond to volume scattering.

DRDC Ottawa TM 2005-243 33
A.4.5 Other Calculations Covariance (PolGASP & COASP) Calculates the covariance matrices for each section of the image, given the current minimum and maximum incidence angles, and the width of each section. Correlation Coefficients (PolGASP & COASP) Calculates the correlation coefficients for each section of the image, given the current minimum and maximum incidence angles, and the width of each section. Ship Statistics (PolGASP & COASP) Calculates various statistics for a user-selected group of point targets. The user defines the top-left and bottom-right corners of a rectangle in the image; all point targets in this region are included in the calculations (or, if detection has not yet been performed, all pixels in the region are used). The following statistics are calculated: mean of each channel, standard deviation from the mean for each channel, covariance matrix, correlation coefficients, mean of all pixels in the section (ie. including the pixels not classified as point targets), and target-to-clutter ratio for each channel. Windows Notepad displays the results. Ocean Statistics (PolGASP & COASP) Calculates various statistics for a user-specified area of the image. The user defines the top-left and bottom-right corners of a rectangle in the image. All pixels in this area are used to calculate the following: covariance matrix, correlation coefficients, mean intensity, and standard deviation from the mean intensity. Windows Notepad displays the results.
A.4.6. Help Menu About... Displays a window containing information about the workstation.
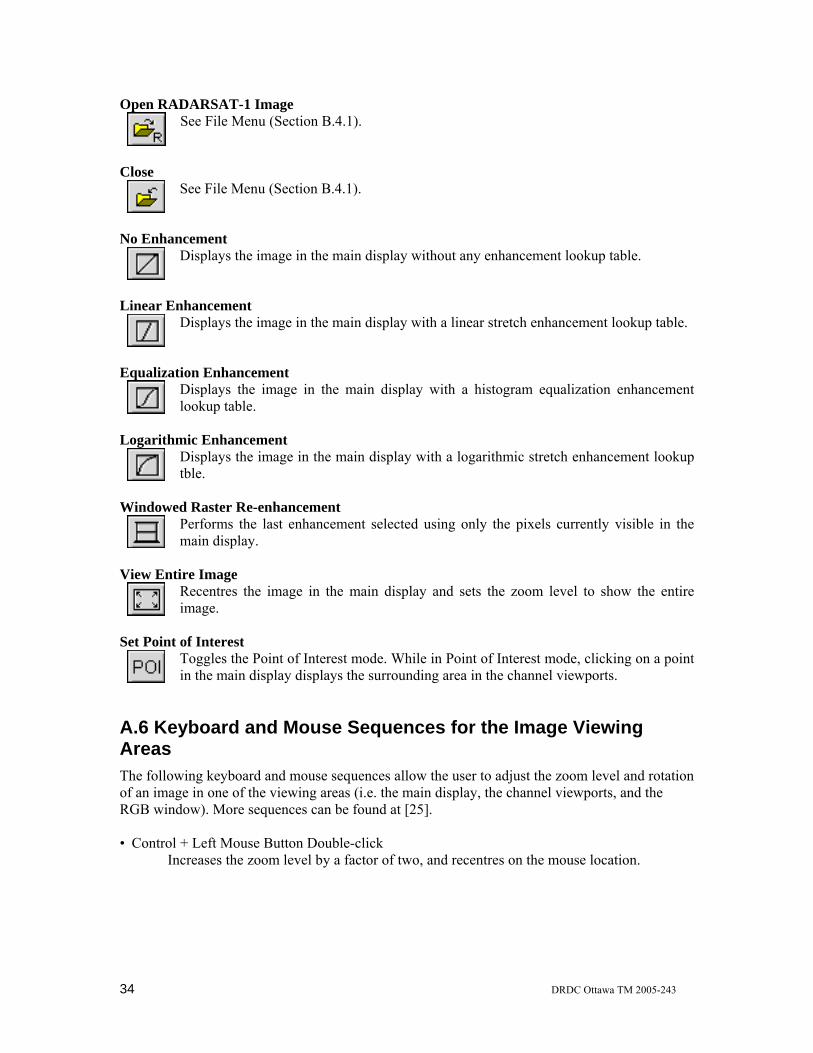
A.5 Toolbar The following are descriptions of each of the icons found in the toolbar. Open PolGASP Image
See File Menu (Section B.4.1).
Open COASP Image
See File Menu (Section B.4.1).
Open ENVISAT ASAR Image
See File Menu (Section B.4.1).
34 DRDC Ottawa TM 2005-243
Open RADARSAT-1 Image
See File Menu (Section B.4.1).
Close
See File Menu (Section B.4.1).
No Enhancement
Displays the image in the main display without any enhancement lookup table.
Linear Enhancement
Displays the image in the main display with a linear stretch enhancement lookup table.
Equalization Enhancement
Displays the image in the main display with a histogram equalization enhancement lookup table.
Logarithmic Enhancement
Displays the image in the main display with a logarithmic stretch enhancement lookup tble.
Windowed Raster Re-enhancement
Performs the last enhancement selected using only the pixels currently visible in the main display.
View Entire Image
Recentres the image in the main display and sets the zoom level to show the entire image.
Set Point of Interest
Toggles the Point of Interest mode. While in Point of Interest mode, clicking on a point in the main display displays the surrounding area in the channel viewports.
A.6 Keyboard and Mouse Sequences for the Image Viewing Areas The following keyboard and mouse sequences allow the user to adjust the zoom level and rotation of an image in one of the viewing areas (i.e. the main display, the channel viewports, and the RGB window). More sequences can be found at [25]. • Control + Left Mouse Button Double-click Increases the zoom level by a factor of two, and recentres on the mouse location.

DRDC Ottawa TM 2005-243 35
• Control + Left Mouse Button + Drag Creates a zoom rectangle. Zooms in on the defined area when the mouse button is released.
• Control + Hold Down Left Mouse Button Continuous zoom in. • Control + Right Mouse Button Double-click Decreases the zoom level by a factor of two. • Control + Hold Down Right Mouse Button Continuous zoom out. • Shift + Left Mouse Button + Drag Rotates the image about its centre.
A.7 Descriptions of Techniques and Algorithms The following sub-section presents descriptions of various techniques and algorithms used in the application software. They are presented in non-technical language where possible, and with mathematical theory where necessary.
A.7.1 Basic RGB Representation of a PolGASP/COASP Image PolGASP and COASP images consist of four image/header pairs, one for each channel (HH, HV, VH, and VV). In each channel, a pixel is represented by a complex 32-bit floating point value. PolGASP images are displayed in the application software using the pixels’ amplitude – the absolute value of a pixel’s value which may be complex. The amplitudes of pixels in the HH and VV channels tend to fall in the range (0, 125]; pixels in the HV and VH channels tend to fall in the range (0, 25] (the maxima of these two ranges are only estimates). Pixel amplitude decreases as slant range distance increases; additionally, there is a sharp drop-off in amplitude around an incidence angle of 20°-25° attributable to the configuration of the radar on the CV-580; after this point, amplitudes for all four channels tend to fall in the range (0, 1]. The RGB representation consists of three files, one for each colour. The red file contains the HH channel amplitude (|HH|) mapped from [0, 1] to [0, 255] (any amplitudes greater than 1 are mapped to 255). The blue file contains the VV channel amplitude (|VV|) mapped in the same way. The green file contains |HV+VH| mapped in the same way. The values for the RGB image are saved to the three files as 8-bit integers. Figure15 shows an example of an RGB representation of a PolGASP image. Note the bright white area near at the top of the image; this represents an area where the values of |HH|, |HV+VH|, and |VV| are all greater than 1. The faintly visible bright spot near the centre of the image is a potential vessel.

36 DRDC Ottawa TM 2005-243
Figure 15: Basic RGB representation of a PolGASP image.
A.7.2 Calculating the Section Boundaries of a PolGASP/COASP Image As mentioned in Section B.7.1, pixel amplitude in PolGASP and COASP images decreases as slant range distance (and, correspondingly, incidence angle) increases. Because of this, the ship detection algorithm for these images is more accurate and effective when an image is divided into areas of similar incidence angle and each area is processed individually. The application software allows the user to define an area to process by specifying the minimum incidence angle (θincmin), maximum incidence angle (θincmax), and width of each section in the area (∆). The default values are 30°, 60°, and 5°, respectively. However, the default parameters can be adjusted. The algorithm for calculating the section boundaries of the given image area runs as follows: 1) Start at the range line whose incidence angle is θincmin. This range line marks the beginning
of section 0. 2) Go forward one range line until the range line with incidence angle θincmin + ∆ is found.
This range line marks the beginning of section 1. 3) Repeat step 2 until θincmax is reached. The range line with incidence angle θincmin + (∆i)
marks the beginning of section i. 4) Return an array containing the range line numbers corresponding to the beginning of each
section, as well as the range line number corresponding to the end of the last section. The following formulas are used to convert an incidence angle value to its corresponding range line, and vica versa:
1
_
cos4inc
slt n
hR x
θ −⎛ ⎞
= ⎜ ⎟⎜ ⎟+⎝ ⎠ (B.1)
( )_
4 cos 4slt n
inc
Rhxθ
= −×
(B.2)
Let: θinc be the incidence angle in radians. x be the range line with incidence angle θinc (integer). h be the altitude of the aircraft* in meters. Rslt_n be the near slant range distance of the image* in meters. * h and Rslt_n are both found in the HH header file as altitude and near_srd.

DRDC Ottawa TM 2005-243 37
Figure 16 shows an image that has been divided into sections 5° wide, between 30° and 60°. The green lines represent the section boundaries.
Figure 16: An image that has been divided into eight sections.
A.7.3 Peak Clutter Reduction (Removal of Non Ocean Pixels) The goal of peak clutter reduction is to reduce or even eliminate the effect of pixels with high statistical decision variable values (i.e. potential ships, land) on the calculation of the median of the statistical decision variable value, and thus, the detection thresholds. When the “Perform Peak Clutter Reduction” option is selected and a peak clutter factor is given in the Ship Detection Parameters, only the pixels with statistical decision variable values less than the mean statistical decision variable multiplied by the peak clutter factor are used to calculate the median. This will reduce the calculated median statistical decision variable by a small amount. The default peak clutter factor is 3, but it can be adjusted.
A.7.4 Quad Polarimetric Ship Detection Algorithm The quad polarimetric system ship detection algorithm is an eight-step process:
1) Calculate the covariance matrix of the defined area of the image. 2) Calculate the inverse of the covariance matrix. 3) Calculate the correlation coefficients. 4) Calculate the decision variable matrix.
38 DRDC Ottawa TM 2005-243
5) Calculate the mean value of the decision variable matrix. 6) Calculate the median value of the decision variable matrix. Peak clutter reduction
(removal of non ocean pixels) may be performed. 7) Calculate the ship detection threshold from the median statistics decision variable and
the statistics decision variable matrix. 8) Perform point target detection.
The covariance matrix is calculated as follows:
( *) ( *) ( *) ( *)( *) ( *) ( *) ( *)( *) ( *) ( *) ( *)( *) ( *) ( *) ( *)
HH HH HH HV HH VH HH VV
HV HH HV HV HV VH HV VV
VH HH VH HV VH VH VH VV
VV HH VV HV VV VH VV VV
E S S E S S E S S E S SE S S E S S E S S E S SE S S E S S E S S E S SE S S E S S E S S E S S
× × × ×⎡ ⎤⎢ ⎥× × × ×⎢ ⎥⎢ ⎥× × × ×⎢ ⎥× × × ×⎣ ⎦
The inverse of the covariance matrix is calculated by an algorithm [26] designed for large (i.e. larger than 2×2) matrices of complex numbers. Given a matrix C, the algorithm returns C-1, the inverse of C, such that the following formula holds:
ICC =× −1 (B-3) where I is the identity matrix. The correlation coefficients are calculated as follows:
(1, 2) (1,3) (1, 4)1.0(1,1) (2, 2) (1,1) (3,3) (1,1) (4, 4)
(2,1) (2,3) (2, 4)1.0(2, 2) (1,1) (2, 2) (3,3) (2, 2) (4, 4)
(3,1) (3, 2) (3, 4)1.0(3,3) (1,1) (3,3) (2, 2) (3,3) (4, 4)
(4,1)(4, 4) (1,1)
C C CC C C C C C
C C CC C C C C C
C C CC C C C C C
C CC C
× × ×
× × ×
× × ×
×(4, 2) (4,3) 1.0
(4, 4) (2, 2) (4, 4) (3,3)C
C C C C
⎡ ⎤⎢ ⎥⎢ ⎥⎢ ⎥⎢ ⎥⎢ ⎥⎢ ⎥⎢ ⎥⎢ ⎥⎢ ⎥⎢ ⎥⎢ ⎥× ×⎣ ⎦
where C(m, n) refers to the value in the mth row and nth column of the covariance matrix. The statistical decision variable U of the quad polarimetric system for each element (pixel (i,j)) calculated as (Equation 7): U(i,j) = SHH(i,j)* x (C-1(1,1)xSHH(i,j) + C-1(1,2)xSHV(i,j) + C-1(1,3)xSVH(i,j) + C-1(1,4)xSVV(i,j)) + SHV(i,j)* x (C-1(2,1)xSHH(i,j) + C-1(2,2)xSHV(i,j) + C-1(2,3)xSVH(i,j) + C-1(2,4)xSVV(i,j)) + SVH(i,j)* x (C-1(3,1)xSHH(i,j) + C-1(3,2)xSHV(i,j) + C-1(3,3)xSVH(i,j) + C-1(3,4)xSVV(i,j)) + SVV(i,j)* x (C-1(4,1)xSHH(i,j) + C-1(4,2)xSHV(i,j) + C-1(4,3)xSVH(i,j) + C-1(4,4)xSVV(i,j)) where C-1 is the inverse of the covariance matrix (Equation 8).

DRDC Ottawa TM 2005-243 39
The mean of the statistical decision variable (Equation 14) is calculated by adding up all the values in the matrix and dividing the sum by the number of elements in the matrix. The median of the statistical decision variable is calculated. Peak clutter reduction may be performed at this step (see Section B.7.3). Next, the detection thresholds Tk (see Section 3.2.2) are calculated. A user selectable number of bins (typically twenty) are created, each with two associated values: a threshold value and a false alarm rate (FAR). The first bin’s threshold value is set to the median statistical decision variable calculated in the previous step (medianIntensity); subsequent bins’ threshold values are calculated as: ( ) nsitymedianIntekkTkBinThreshold ×+= 5.01)(__ where k = 1, …, 19 (the first bin is considered to be bin 0). For each bin, the FAR is calculated from number of pixels whose decision variable is greater than the bin’s associated threshold Tk value. It is assumed that the number of targets in the image is small. If this is not the case, the peak clutter reduction feature should be applied. A second order extraction technique is then used to derive the threshold η′ value at the user-specified FAR value entered in the Ship Detection Parameters window (the default value is 10-8. Finally, point target detection is performed. The statistics decision variable value of each pixel is compared to the threshold calculated in the previous step. If the statistical decision variable value is greater than the threshold, then the pixel is classified as a point target; otherwise, the pixel is ignored. Figure 17 shows an example of a set of point targets that have been detected; these pixels, marked by red crosses, reveal a ship in open water.
Figure 17: Point targets defining a ship in a PolGASP image.
This algorithm can be applied to PolGASP and COASP images in the application software. Note: Pixels in PolGASP/COASP images that have SHH = SHV = SVH = SVV = 0 or SHH = SHV = SVH = SVV = NaN (not a number) are not valid pixels and are discarded before any calculations are performed.

40 DRDC Ottawa TM 2005-243
A.7.5 Dual Polarimetric Ship Detection Algorithm The dual polarimetric with amplitude and phase system ship detection algorithm is an eight-step process:
1) Calculate the covariance matrix of the defined area of the image. 2) Calculate the inverse of the covariance matrix. 3) Calculate the correlation coefficients. 4) Calculate the decision variable matrix. 5) Calculate the mean value of the decision variable matrix. 6) Calculate the median value of the decision variable matrix. Peak clutter reduction may
be performed. 7) Calculate the ship detection threshold from the median statistics decision variable and
the statistics decision variable matrix. 8) Perform point target detection.
The covariance matrix is calculated as follows:
( *) ( *)( *) ( *)
ChanA ChanA ChanA ChanB
ChanB ChanA ChanB ChanB
E S S E S SE S S E S S
× ×⎡ ⎤⎢ ⎥× ×⎣ ⎦
The inverse of the covariance matrix C-1 (Equation B-3) is calculated by an algorithm designed for 2×2 matrices of complex numbers instead of 4×4 matrices in quad polarimetric system. The correlation coefficients are calculated as follows:
(1, 2)1.0(1,1) (2,2)
(2,1) 1.0(2,2) (1,1)
CC C
CC C
⎡ ⎤⎢ ⎥×⎢ ⎥⎢ ⎥⎢ ⎥
×⎣ ⎦
where C(m,n) refers to the value in the mth row and nth column of the covariance matrix. The statistical decision variable matrix is calculated as: U(i,j) = SChanA(i,j)* x (C-1(1,1)xSChanA(i,j) + C-1(1,2)xSChanB(i,j) + SChanB(i,j)* x (C-1(2,1)xSChanA(i,j) + C-1(2,2)xSChanB(i,j) The mean and median of the statistical decision variable matrix, and the ship detection threshold are calculated by the same methods described in Section B.7.4. Point target detection is performed in the same way as described in Section B.7.4. This algorithm can be applied to PolGASP and COASP images in the application software. Note: Pixels in PolGASP/COASP images that have SHH = SHV = SVH = SVV = 0 or SHH = SHV = SVH = SVV = NaN (not a number) are not valid pixels and are discarded before any calculations are performed.

DRDC Ottawa TM 2005-243 41
A.7.6 Dual-Channel (Amplitude, Correlated) Ship Detection Algorithm The dual-channel with amplitude system and correlated ship detection algorithm is a nine-step process:
1) Calculate the mean of each channel squared for the defined area of the image. 2) Calculate the covariance matrix. 3) Calculate the correlation coefficients. 4) Calculate two values related to correlation. 5) Calculate the intensity matrix. 6) Calculate the mean value of the intensity matrix. 7) Calculate the median value of the intensity matrix. Peak clutter reduction may be
performed. 8) Calculate the ship detection threshold factor from the median statistics decision
variable and the statistics decision variable matrix. 9) Perform point target detection.
The mean of each channel squared over the image pixels of a strip is calculated as follows: ( )( )chanchan SconjSmeanlSquaredmeanChanne ×= . where the .× operator is element-by-element multiplication and Schan refers to the specified channel of the image. For amplitude data, Schan = conj(Schan). The covariance matrix is calculated as follows:
( *) ( *)( *) ( *)
ChanA ChanA ChanA ChanB
ChanB ChanA ChanB ChanB
E S S E S SE S S E S S
× ×⎡ ⎤⎢ ⎥× ×⎣ ⎦
where ChanA and ChanB refer to the two channels being used for the dual pol detection. The correlation coefficients [a1]are calculated as follows:
(1, 2)1.0(1,1) (2, 2)
(2,1) 1.0(2, 2) (1,1)
CC C
DC
C C
⎡ ⎤⎢ ⎥×⎢ ⎥=⎢ ⎥⎢ ⎥
×⎣ ⎦
where C(m,n) refers to the value in the mth row and nth column of the covariance matrix. The following two values are required to calculate the statistical decision variable matrix: (Equation 6 in Section 2.3):[a2] ( )( )( )2
21 ( ) 1 0,1ChanA
Acor E S D= ÷ × −
( )( )( )2
21 ( ) 1 0,1ChanB
Bcor E S D= ÷ × −

42 DRDC Ottawa TM 2005-243
Each value in the statistical decision variable matrix is calculated as (Equation 6)
( )( ) ( )
( )( ) 2 2
2
, ( ( ) ) ( ( ) )
2 (0,1)
1 0,1 ( ) ( )
ChanA ChanA ChanB ChanB
ChanA ChanB
ChanA ChanB
U i j S conj S Acor S conj S Bcor
D abs S abs S
D E S E S
= × × + × × −
× × ×
− × ×
where U(i,j) is the value at the ith row and jth column of the intensity matrix, SchanA(i,j) refers to the value of the pixel at the ith row and jth column of the first channel being used for detection, SchanB refers to the second channel being used, and corrcoef(0,1) refers to the correlation coefficient between the two channels. The mean and median of the statistical decision variable matrix, and the ship detection threshold are calculated by the same methods described in Section B.7.4. Point target detection is performed in the same way as described in Section B.7.4. This algorithm can be applied to PolGASP and COASP images in the workstation. Note: Pixels in PolGASP/COASP images that have SHH = SHV = SVH = SVV = 0 or SHH = SHV = SVH = SVV = NaN (not a number) are not valid pixels and are discarded before any calculations are performed.
A.7.7 Dual-Channel (Amplitude, Uncorrelated) Ship Detection Algorithm The dual-channel with amplitude system and uncorrelated ship detection algorithm is a seven-step process:
1) Calculate the mean of each channel squared for the defined area of the image. 2) Calculate the inverses of those two values. 3) Calculate the intensity matrix. 4) Calculate the mean value of the intensity matrix. 5) Calculate the median value of the intensity matrix. Peak clutter reduction may be
performed. 6) Calculate the ship detection threshold factor from the median statistics decision
variable and the statistics decision variable matrix. 7) Perform point target detection.
The mean of each channel squared over the image pixels of a strip is calculated as follows: ( )( )chanchan SconjSmeanlSquaredmeanChanne ×= . where the .× operator is element-by-element multiplication and Schan refers to the specified channel of the image. Each value in the statistical decision variable matrix is calculated as (Equation 5):
DRDC Ottawa TM 2005-243 43
( ) ( ) ( )( ) ( ) ( )( )lBSquaredMeanChanne
SconjSlASquaredMeanChanne
SconjSjiU
jijijiji chanBchanBchanAchanA ,,,,,
×+
×=
where U(i,j) is the value at the ith row and jth column of the statistical decision variable matrix, SchanA(i,j) refers to the value of the pixel at the ith row and jth column of the first channel being used for detection, and SchanB refers to the second channel. The mean and median of the statistical decision variable matrix, and the ship detection threshold are calculated by the same methods described in Section B.7.4. Point target detection is performed in the same way as described in Section B.7.4. This algorithm can be applied to PolGASP, COASP, and ENVISAT ASAR images in the workstation. Note: Pixels in PolGASP/COASP images that have SHH = SHV = SVH = SVV = 0 or SHH = SHV = SVH = SVV = NaN (not a number) are not valid pixels and are discarded before any calculations are performed.
A.7.8 Single-channel Ship Detection Algorithm The single-channel system ship detection algorithm is a seven-step process:
1) Calculate the mean of the channel squared for the defined area of the image. 2) Calculate the inverse of that value. 3) Calculate the intensity matrix. 4) Calculate the mean value of the intensity matrix. 5) Calculate the median value of the intensity matrix. Peak clutter reduction may be
performed. 6) Calculate the ship detection threshold factor from the median statistics decision
variable and the statistics decision variable matrix. 7) Perform point target detection. The mean of the channel squared is calculated as follows:
( )( )chanchan SconjSmeanlSquaredmeanChanne ×= . where the .× operator is element-by-element multiplication and Schan refers to the specified channel of the image. Each value in the statistical decision variable matrix is calculated as (Section 2.4):
( ) ( ) ( )( )lSquaredMeanChanne
SconjSjiU
jiji chanchan ,,,
×=
where U(i,j) is the value at the ith row and jth column of the intensity matrix and Schan(i,j) refers to the value of the pixel at the ith row and jth column of the specified channel of the image.

44 DRDC Ottawa TM 2005-243
The mean and median of the statistical decision variable matrix, and the ship detection threshold factor are calculated by the same methods described in Section B7.4. Point target detection is performed in the same way as described in Section B7.4. This algorithm can be applied to PolGASP, COASP, and RADARAST-1 images in the workstation. Note: Pixels in PolGASP/COASP images that have SHH = SHV = SVH = SVV = 0 or SHH = SHV = SVH = SVV = NaN (not a number) are not valid pixels and are discarded before any calculations are performed.
A.7.9 Pauli Display and Decomposition of a PolGASP/COASP Image The method for generating Pauli Display files is similar to the method for generating the basic RGB files. The red file, representing double bounce, is calculated by the formula |HH−VV|. The green file, representing volume scatter, is calculated by |HV+VH|. The blue file, representing single bounce, is calculated by |HH+VV|. As with the basic RGB files, values are mapped from [0, 1] to [0, 255] and written to the files as 8-bit integers. Figure 18 shows an example of a Pauli Display representation of the same PolGASP image as in Figure 15.
Figure 18: Pauli Display representation of a PolGASP image.
The Pauli Decomposition is made up of three files consisting of 8-bit integers: red (double bounce), green (volume scatter), and blue (single bounce). Unlike the Pauli Display, whose pixels are a blend of red, green, and blue, the pixels of the Pauli Decomposition can only be one of those three colours. A pixel S = [SHH SHV SVH SVV] is set to red if the result of |SHH−SVV| is greater than both |SHV+SVH| and |SHH+SVV|; the pixel is set to green if |PHV+PVH| is greater than the other two results; and, the pixel is set to blue if |SHH+SVV| is the greatest.[a3] Figure 19 shows an example of a Pauli Decomposition. The image, containing a ship (indicated by the clustering of red and green pixels), was taken from a larger PolGASP image.
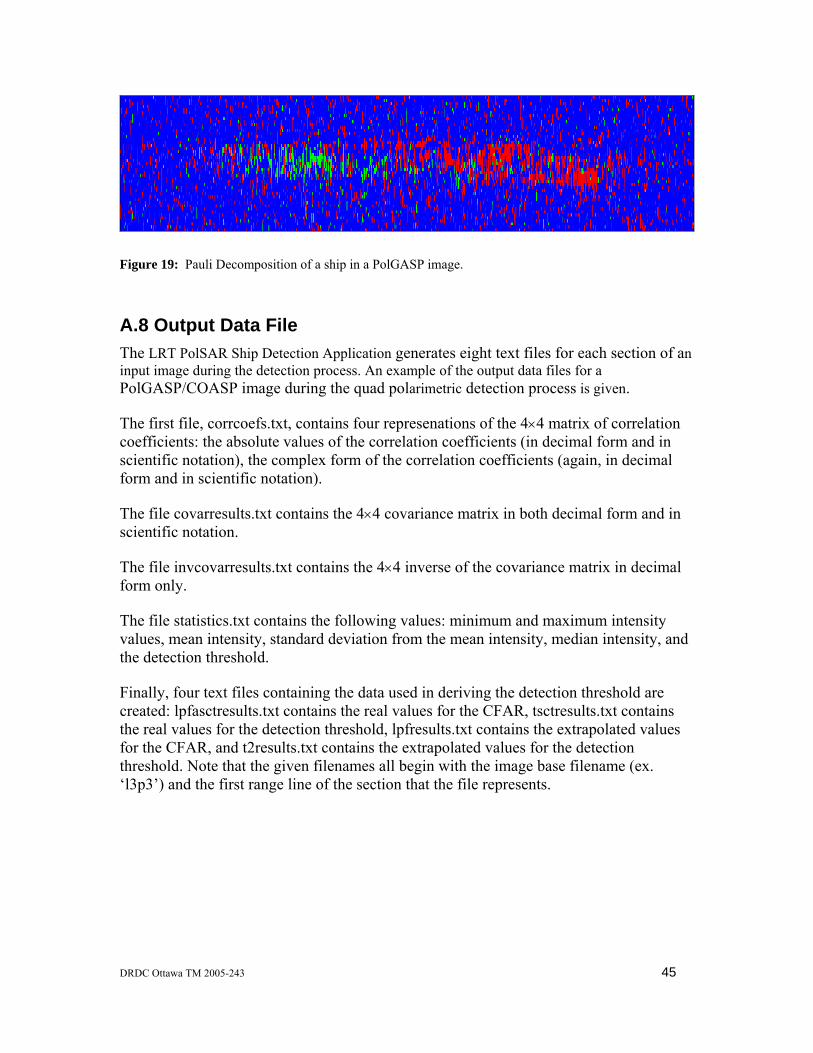
DRDC Ottawa TM 2005-243 45
Figure 19: Pauli Decomposition of a ship in a PolGASP image.
A.8 Output Data File The LRT PolSAR Ship Detection Application generates eight text files for each section of an input image during the detection process. An example of the output data files for a PolGASP/COASP image during the quad polarimetric detection process is given. The first file, corrcoefs.txt, contains four represenations of the 4×4 matrix of correlation coefficients: the absolute values of the correlation coefficients (in decimal form and in scientific notation), the complex form of the correlation coefficients (again, in decimal form and in scientific notation). The file covarresults.txt contains the 4×4 covariance matrix in both decimal form and in scientific notation. The file invcovarresults.txt contains the 4×4 inverse of the covariance matrix in decimal form only. The file statistics.txt contains the following values: minimum and maximum intensity values, mean intensity, standard deviation from the mean intensity, median intensity, and the detection threshold. Finally, four text files containing the data used in deriving the detection threshold are created: lpfasctresults.txt contains the real values for the CFAR, tsctresults.txt contains the real values for the detection threshold, lpfresults.txt contains the extrapolated values for the CFAR, and t2results.txt contains the extrapolated values for the detection threshold. Note that the given filenames all begin with the image base filename (ex. ‘l3p3’) and the first range line of the section that the file represents.

46 DRDC Ottawa TM 2005-243
List of symbols/abbreviations/acronyms/initialisms
CCG Canadian Coast Gaurd
CCGC Canadian Coast Guard Cutter
CCRS Canada Centre for Remote Sensing
CF Canadian Forces
CFAV Canadian Forces Auxiliary Vessel
CSA Canadian Space Agency
CV-580 Convair-580
DRDC Defence Research and Development Canada
D Space D Director of Space Development
EC Environment Canada
FAR False Alarm Rate
GDAL Geospatial Data Abstraction Library
GTK GIMP Tool Kit
GUI Graphical User Interface
LRT Likelihood ratio test
OpenEV Open Earth View
PMD Probability of missed detection
PolSAR Polarimetric SAR
RGB Read, Green, Blue
SAR Synthetic Aperture Radar
TCR Target to Clutter Ratio

UNCLASSIFIED SECURITY CLASSIFICATION OF FORM
(highest classification of Title, Abstract, Keywords)
DOCUMENT CONTROL DATA (Security classification of title, body of abstract and indexing annotation must be entered when the overall document is classified)
1. ORIGINATOR (the name and address of the organization preparing the document. Organizations for whom the document was prepared, e.g. Establishment sponsoring a contractor’s report, or tasking agency, are entered in section 8.)
Defence R&D Canada – Ottawa 3701 Carling Avenue Ottawa, Ontario, K1A 0Z4, Canada
2. SECURITY CLASSIFICATION (overall security classification of the document,
including special warning terms if applicable) UNCLASSIFIED
3. TITLE (the complete document title as indicated on the title page. Its classification should be indicated by the appropriate abbreviation (S,C or U) in parentheses after the title.)
Likelihood Ratio Test Polarimetric SAR Ship Detection Application (U)
4. AUTHORS (Last name, first name, middle initial)
Liu, Chen; Meek, Allan
5. DATE OF PUBLICATION (month and year of publication of document)
December 2005
6a. NO. OF PAGES (total containing information. Include Annexes, Appendices, etc.)
58
6b. NO. OF REFS (total cited in document)
26
7. DESCRIPTIVE NOTES (the category of the document, e.g. technical report, technical note or memorandum. If appropriate, enter the type of report, e.g. interim, progress, summary, annual or final. Give the inclusive dates when a specific reporting period is covered.)
Technical Memorandum
8. SPONSORING ACTIVITY (the name of the department project office or laboratory sponsoring the research and development. Include the address.)
DRDC Ottawa, Radar Application and Space Technology
9a. PROJECT OR GRANT NO. (if appropriate, the applicable research and development project or grant number under which the document was written. Please specify whether project or grant)
15es12
9b. CONTRACT NO. (if appropriate, the applicable number under which the document was written)
10a. ORIGINATOR’S DOCUMENT NUMBER (the official document number by which the document is identified by the originating activity. This number must be unique to this document.)
DRDC Ottawa TM 2005-243
10b. OTHER DOCUMENT NOS. (Any other numbers which may be assigned this document either by the originator or by the sponsor)
11. DOCUMENT AVAILABILITY (any limitations on further dissemination of the document, other than those imposed by security classification) ( X ) Unlimited distribution ( ) Distribution limited to defence departments and defence contractors; further distribution only as approved ( ) Distribution limited to defence departments and Canadian defence contractors; further distribution only as approved ( ) Distribution limited to government departments and agencies; further distribution only as approved ( ) Distribution limited to defence departments; further distribution only as approved ( ) Other (please specify):
12. DOCUMENT ANNOUNCEMENT (any limitation to the bibliographic announcement of this document. This will normally correspond to
the Document Availability (11). However, where further distribution (beyond the audience specified in 11) is possible, a wider announcement audience may be selected.)
Unlimited
UNCLASSIFIED
SECURITY CLASSIFICATION OF FORM DDCCDD0033 22//0066//8877

UNCLASSIFIED SECURITY CLASSIFICATION OF FORM
13. ABSTRACT ( a brief and factual summary of the document. It may also appear elsewhere in the body of the document itself. It is highly desirable that the abstract of classified documents be unclassified. Each paragraph of the abstract shall begin with an indication of the security classification of the information in the paragraph (unless the document itself is unclassified) represented as (S), (C), or (U). It is not necessary to include here abstracts in both official languages unless the text is bilingual).
(U) This technical memorandum describes the algorithms, features and implementation of the Likelihood Ratio Test (LRT) Polarimetric SAR (PolSAR) Ship Detection Application. The detection algorithm is based on the likelihood ratio test with Neyman-Pearson criterion. The detection algorithm is applicable to many PolSAR system configurations, including quad polarimetric, dual polarimetric and single-channel. The detection threshold is calculated from image statistics to achieve a desired false alarm probability. Other statistical quantities are also calculated, such as covariance and correlation of polarimetric channels, as well as mean and standard deviation of the decision variable. A Pauli decomposition algorithm is included as an initial step for a future target classification capability. (U) Examples of typical results are given. The report contains a user guide and design diagrams for the algorithm implementation. The detection algorithms were developed for C-band airborne PolSAR data from the EC CV-580, C-band polarimetric SAR sensor flown on the EC CV-580 but are also applicable to ENVISAT ASAR and RADARSAT-1/-2 images.
14. KEYWORDS, DESCRIPTORS or IDENTIFIERS (technically meaningful terms or short phrases that characterize a document and could be helpful in cataloguing the document. They should be selected so that no security classification is required. Identifiers such as equipment model designation, trade name, military project code name, geographic location may also be included. If possible keywords should be selected from a published thesaurus. e.g. Thesaurus of Engineering and Scientific Terms (TEST) and that thesaurus-identified. If it is not possible to select indexing terms which are Unclassified, the classification of each should be indicated as with the title.)
Polarimetric Syntheture Aperature Radar (PolSAR), Ship Detection Application, Likelihood Ratio Test (LRT), LRT PolSAR Ship Detection Application
UNCLASSIFIED
SECURITY CLASSIFICATION OF FORM

Related Documents