Lighthouse Investment Management Equity Market Monitor - December 2013 Page 1 Equity Market Monitor December 2013

Lighthouse - Equity Market Monitor - 2013-12
Oct 24, 2015
What kind of real stock market returns can we expect, and how sustainable are they? What drives those returns? What drives GDP growth, and why are company profits at record levels (in % o GDP) despite sluggish growth and stagnant real incomes?
Answers to these fundamental questions can be found in this report.
Answers to these fundamental questions can be found in this report.
Welcome message from author
This document is posted to help you gain knowledge. Please leave a comment to let me know what you think about it! Share it to your friends and learn new things together.
Transcript

Lighthouse Investment Management
Equity Market Monitor - December 2013 Page 1
Equity Market Monitor
December 2013
Lighthouse Investment Management
Equity Market Monitor - December 2013 Page 2
Contents
Introduction .................................................................................................................................................. 3
Performance: How to Visualize It ................................................................................................................. 4
Performance: Nominal or Real ..................................................................................................................... 5
Performance: The Importance of Time ......................................................................................................... 6
Valuation: Price-Earnings .............................................................................................................................. 8
Valuation: CAPE ............................................................................................................................................ 9
Valuation: CAPE Histogram ......................................................................................................................... 10
Valuation: CAPE Entry and Exit ................................................................................................................... 11
GDP and Profits: 2 Models .......................................................................................................................... 12
GDP: Components of Growth ..................................................................................................................... 13
GDP: Employment Growth .......................................................................................................................... 14
GDP: Capital ................................................................................................................................................ 16
GDP: Productivity ........................................................................................................................................ 17
GDP: Model versus Reality .......................................................................................................................... 18
Corporate Profits - The Kalecki Equation .................................................................................................... 19
War, Inflation and Stock Market ................................................................................................................. 26

Lighthouse Investment Management
Equity Market Monitor - December 2013 Page 3
Introduction
The stock market. Source of unknown riches - but not necessarily for investors.
So-called "professional" investors offer to manage your money. However, their fees are based on the
level of assets managed, not performance. Hence their goal is to maximize assets, not performance, and
prey for markets to behave.
You will never hear a bad word about stocks from a professional money manager. If he was bearish, his
financial duty would require to sell. However, charging a fee on zero-yielding cash lying on the sidelines
is probably not okay with investors. Also, the by-laws of many mutual funds do not allow the manager to
have cash levels above 5% of assets. He has to be invested at least 95% at all times.
On one hand, it is probably right to force money managers to concentrate on stock picking, not market
timing. Different cash levels would make performance comparisson difficult among peers and obscure
the 'real' skill.
On the other hand, this puts the onus of market timing onto the inidiviual investors. But why would he
be better suited to decide on market timing than the "professionals"? Didn't he outsource the
management of his money exactly because he doesn't feel comfortable doing it himself?
The money management industry would like to have their clients' assets indefinitely, through bull- and
bear markets. Ride the wave during good times. And simply state that "nobody could have foreseen
this", "we don't have a crystal ball" or "it's too late to sell now" in case of a crash.
There must be a better way to invest.
This publication tries to assess the following questions:
1. What kind of return can be reasonably expected from stock market investments? Is that rate
sustainable?
2. What kind of simple tools exist to tell if the stock market is cheap or expensive?
3. Are stock market returns mean-reverting?
4. Are we going to continue to see similar cyclical fluctuations in the future, or are we in the midst
of a structural break?
I will try to keep things as simple as possible. Finance doesn't have to be complex (people make it
complex). A picture says more than a thousand words - I hope the following charts help.
Lighthouse Investment Management
Equity Market Monitor - December 2013 Page 4
Performance: How to Visualize It
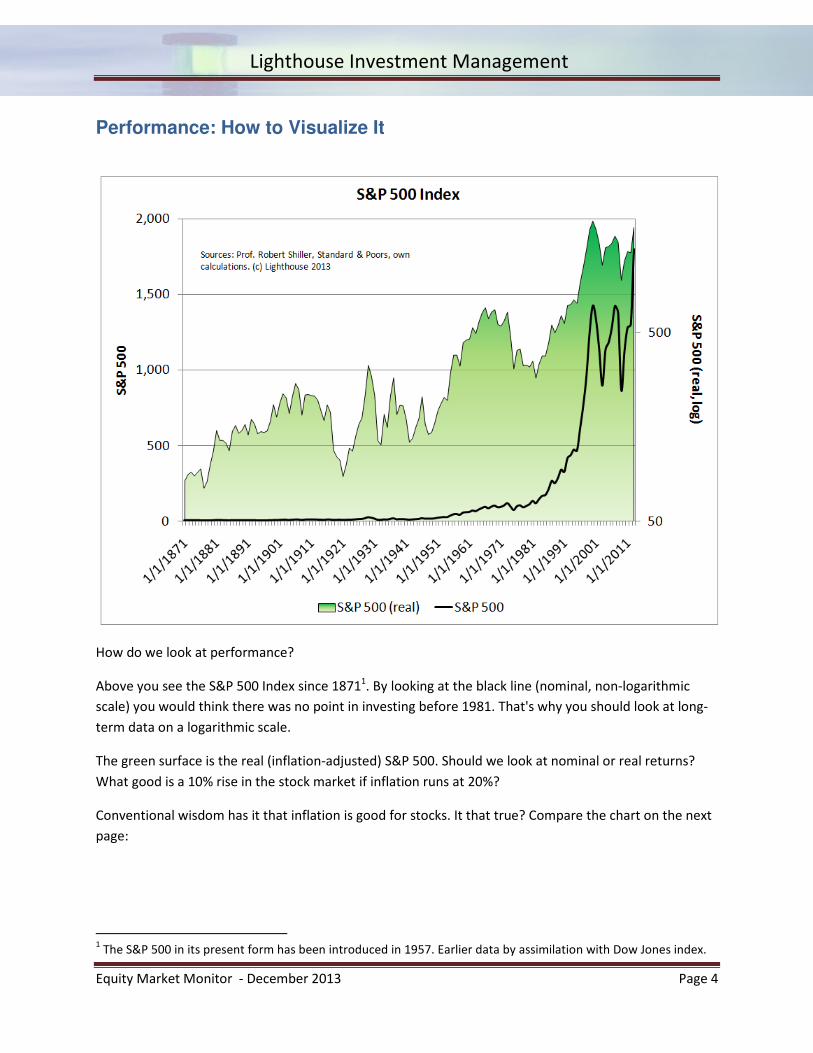
How do we look at performance?
Above you see the S&P 500 Index since 18711. By looking at the black line (nominal, non-logarithmic
scale) you would think there was no point in investing before 1981. That's why you should look at long-
term data on a logarithmic scale.
The green surface is the real (inflation-adjusted) S&P 500. Should we look at nominal or real returns?
What good is a 10% rise in the stock market if inflation runs at 20%?
Conventional wisdom has it that inflation is good for stocks. It that true? Compare the chart on the next
page:
1 The S&P 500 in its present form has been introduced in 1957. Earlier data by assimilation with Dow Jones index.
Lighthouse Investment Management
Equity Market Monitor - December 2013 Page 5
Performance: Nominal or Real
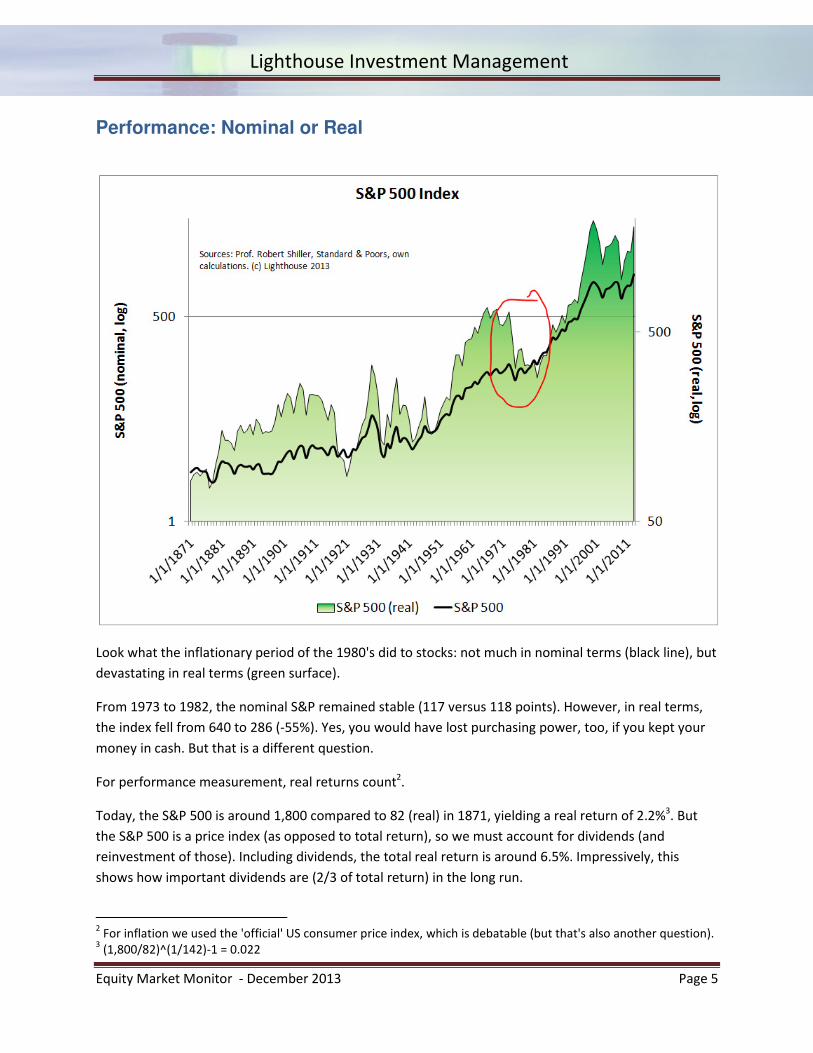
Look what the inflationary period of the 1980's did to stocks: not much in nominal terms (black line), but
devastating in real terms (green surface).
From 1973 to 1982, the nominal S&P remained stable (117 versus 118 points). However, in real terms,
the index fell from 640 to 286 (-55%). Yes, you would have lost purchasing power, too, if you kept your
money in cash. But that is a different question.
For performance measurement, real returns count2.
Today, the S&P 500 is around 1,800 compared to 82 (real) in 1871, yielding a real return of 2.2%3. But
the S&P 500 is a price index (as opposed to total return), so we must account for dividends (and
reinvestment of those). Including dividends, the total real return is around 6.5%. Impressively, this
shows how important dividends are (2/3 of total return) in the long run.
2 For inflation we used the 'official' US consumer price index, which is debatable (but that's also another question).
3 (1,800/82)^(1/142)-1 = 0.022
Lighthouse Investment Management
Equity Market Monitor - December 2013 Page 6
Performance: The Importance of Time
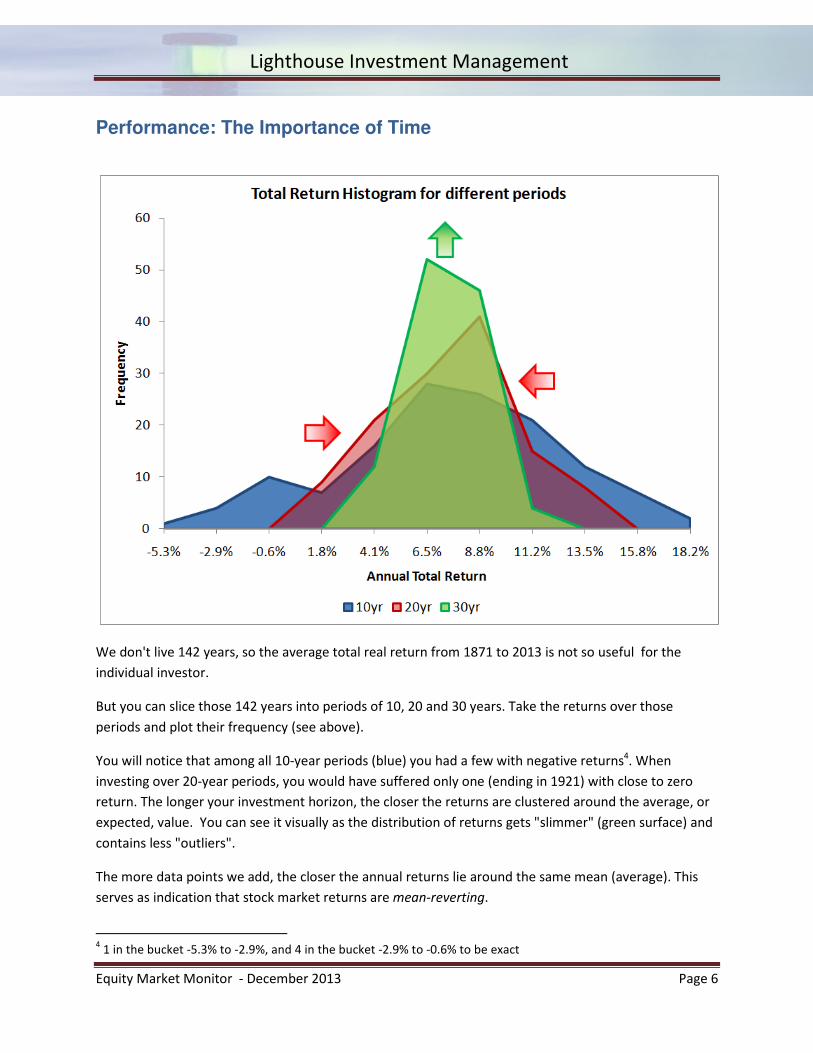
We don't live 142 years, so the average total real return from 1871 to 2013 is not so useful for the
individual investor.
But you can slice those 142 years into periods of 10, 20 and 30 years. Take the returns over those
periods and plot their frequency (see above).
You will notice that among all 10-year periods (blue) you had a few with negative returns4. When
investing over 20-year periods, you would have suffered only one (ending in 1921) with close to zero
return. The longer your investment horizon, the closer the returns are clustered around the average, or
expected, value. You can see it visually as the distribution of returns gets "slimmer" (green surface) and
contains less "outliers".
The more data points we add, the closer the annual returns lie around the same mean (average). This
serves as indication that stock market returns are mean-reverting.
4 1 in the bucket -5.3% to -2.9%, and 4 in the bucket -2.9% to -0.6% to be exact
Lighthouse Investment Management
Equity Market Monitor - December 2013 Page 7
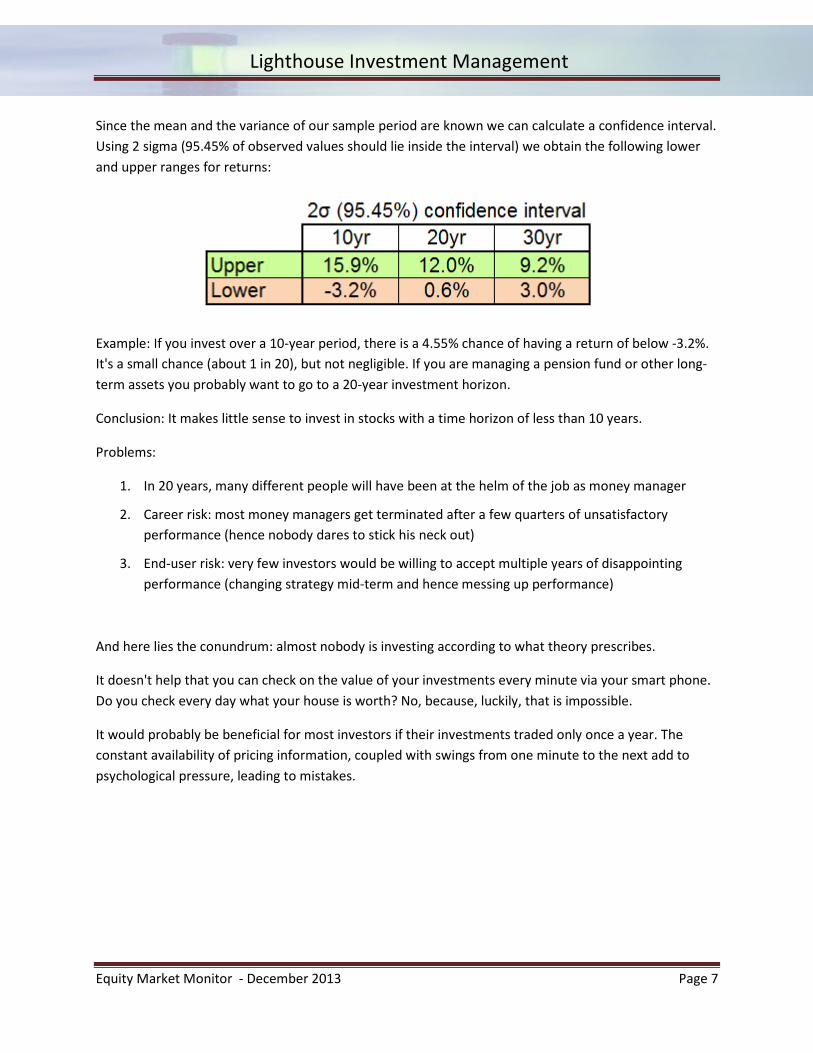
Since the mean and the variance of our sample period are known we can calculate a confidence interval.
Using 2 sigma (95.45% of observed values should lie inside the interval) we obtain the following lower
and upper ranges for returns:
Example: If you invest over a 10-year period, there is a 4.55% chance of having a return of below -3.2%.
It's a small chance (about 1 in 20), but not negligible. If you are managing a pension fund or other long-
term assets you probably want to go to a 20-year investment horizon.
Conclusion: It makes little sense to invest in stocks with a time horizon of less than 10 years.
Problems:
1. In 20 years, many different people will have been at the helm of the job as money manager
2. Career risk: most money managers get terminated after a few quarters of unsatisfactory
performance (hence nobody dares to stick his neck out)
3. End-user risk: very few investors would be willing to accept multiple years of disappointing
performance (changing strategy mid-term and hence messing up performance)
And here lies the conundrum: almost nobody is investing according to what theory prescribes.
It doesn't help that you can check on the value of your investments every minute via your smart phone.
Do you check every day what your house is worth? No, because, luckily, that is impossible.
It would probably be beneficial for most investors if their investments traded only once a year. The
constant availability of pricing information, coupled with swings from one minute to the next add to
psychological pressure, leading to mistakes.

Lighthouse Investment Management
Equity Market Monitor - December 2013 Page 8
Valuation: Price-Earnings
The previous chapter assumes you don't try to time the market (you just invest whenever funds are
available and lock them up for at least 20 years). But the stock market rarely trades at fair value. It is
either over- or undervalued. What if you could actually determine those valuations? And what do you
base valuation on?
In the long run, stocks are driven by earnings:
The problem: company profits are very cyclical. Meaning: in every recession they decline by large
amounts, only to recover strongly afterwards.
From 2006 to 2008, for example, real earnings for the S&P 500 declined from $94.70 to $28.50 (-70%).
The price-earnings multiple, or P/E-ratio, rose from 15.7 to 52.7 despite a drop in share prices. Stocks
seem expensive when they are not and vice versa.
So Professor Robert Shiller (Yale) came up with a simple solution to smooth out cyclicality: take the
average earnings from the last 10 years. Boom and bust should even out.
Lighthouse Investment Management
Equity Market Monitor - December 2013 Page 9
Valuation: CAPE
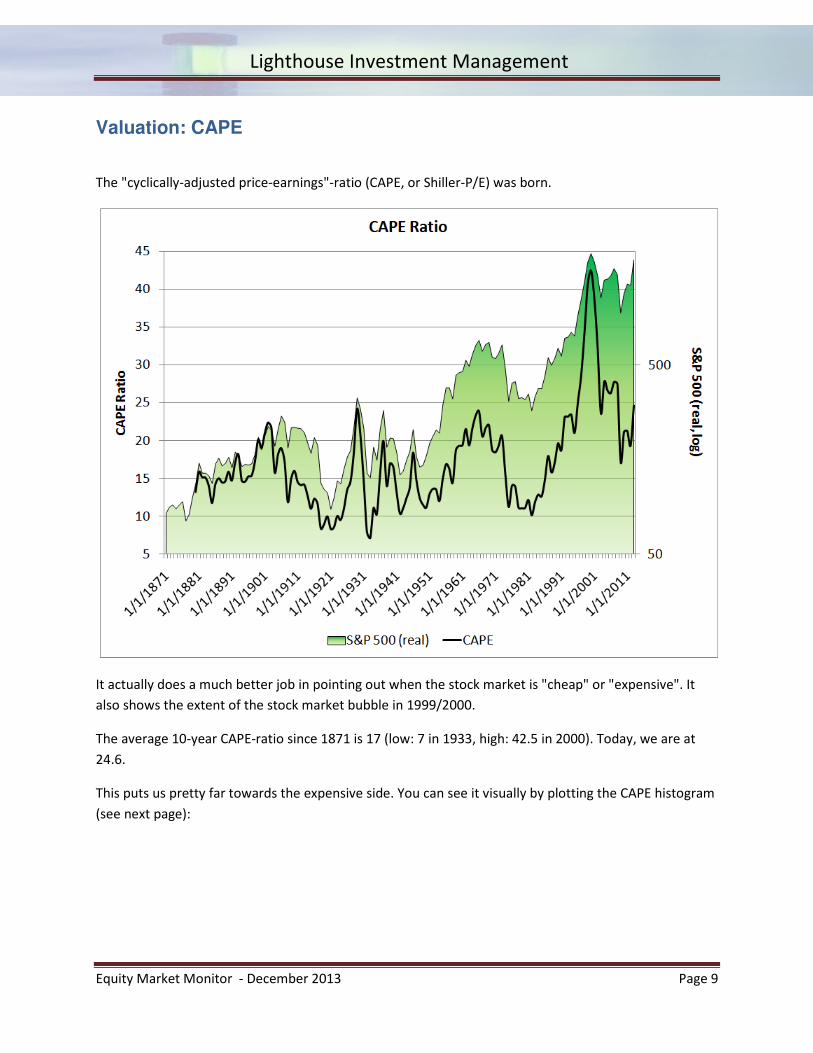
The "cyclically-adjusted price-earnings"-ratio (CAPE, or Shiller-P/E) was born.
It actually does a much better job in pointing out when the stock market is "cheap" or "expensive". It
also shows the extent of the stock market bubble in 1999/2000.
The average 10-year CAPE-ratio since 1871 is 17 (low: 7 in 1933, high: 42.5 in 2000). Today, we are at
24.6.
This puts us pretty far towards the expensive side. You can see it visually by plotting the CAPE histogram
(see next page):
Lighthouse Investment Management
Equity Market Monitor - December 2013 Page 10
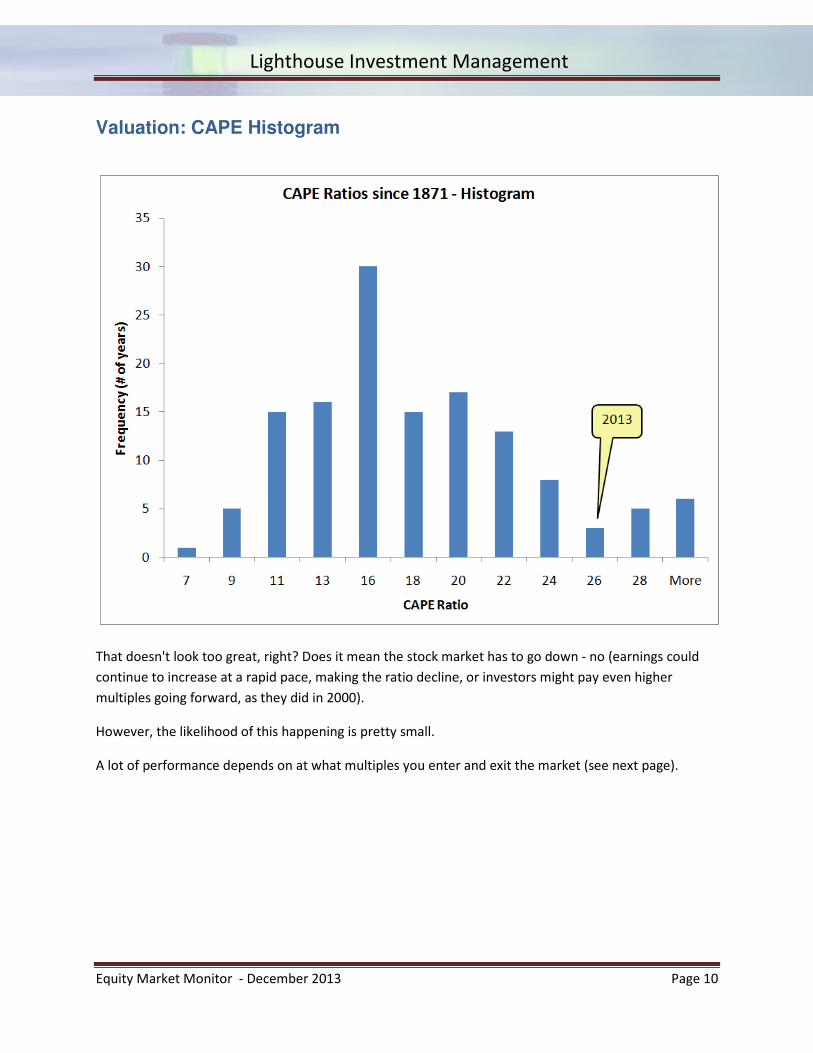
Valuation: CAPE Histogram
That doesn't look too great, right? Does it mean the stock market has to go down - no (earnings could
continue to increase at a rapid pace, making the ratio decline, or investors might pay even higher
multiples going forward, as they did in 2000).
However, the likelihood of this happening is pretty small.
A lot of performance depends on at what multiples you enter and exit the market (see next page).
Lighthouse Investment Management
Equity Market Monitor - December 2013 Page 11
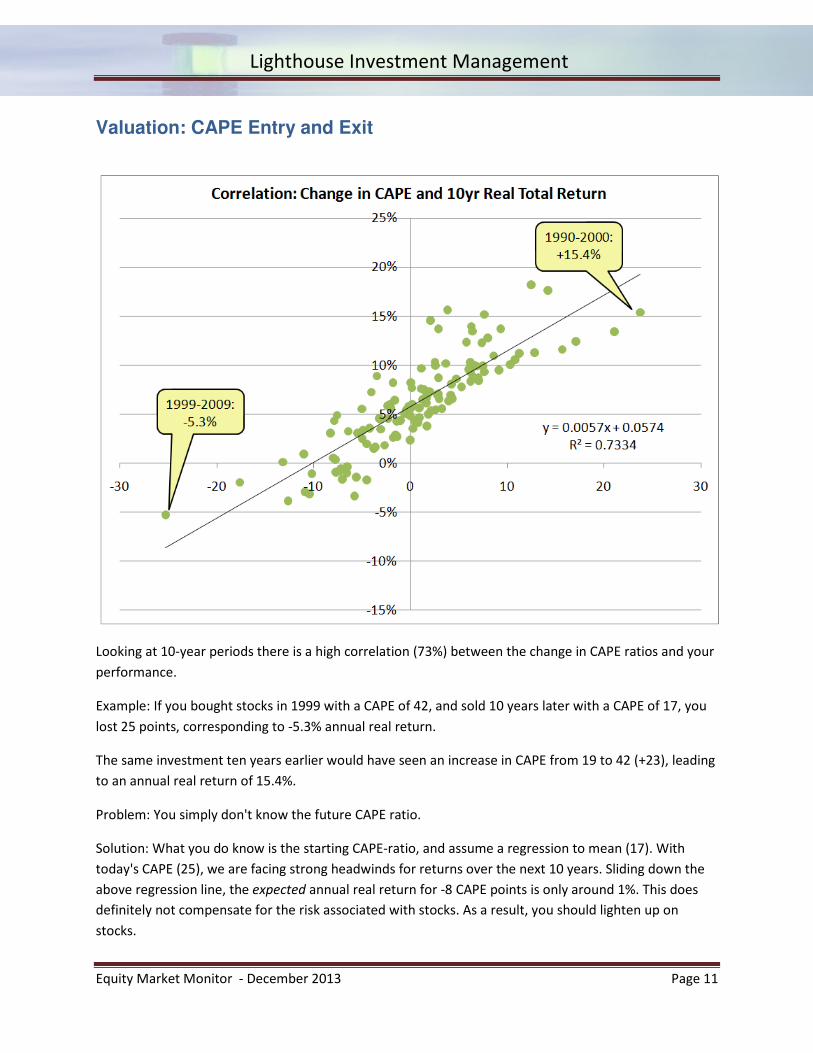
Valuation: CAPE Entry and Exit
Looking at 10-year periods there is a high correlation (73%) between the change in CAPE ratios and your
performance.
Example: If you bought stocks in 1999 with a CAPE of 42, and sold 10 years later with a CAPE of 17, you
lost 25 points, corresponding to -5.3% annual real return.
The same investment ten years earlier would have seen an increase in CAPE from 19 to 42 (+23), leading
to an annual real return of 15.4%.
Problem: You simply don't know the future CAPE ratio.
Solution: What you do know is the starting CAPE-ratio, and assume a regression to mean (17). With
today's CAPE (25), we are facing strong headwinds for returns over the next 10 years. Sliding down the
above regression line, the expected annual real return for -8 CAPE points is only around 1%. This does
definitely not compensate for the risk associated with stocks. As a result, you should lighten up on
stocks.

Lighthouse Investment Management
Equity Market Monitor - December 2013 Page 12
GDP and Profits: 2 Models
The price of a stock can be broken down into earnings and an earnings multiple. We dealt with the
earnings multiple in the previous pages.
Earnings can be broken down into revenues times margins. Revenues in aggregate should broadly follow
GDP (Gross Domestic Product). Margins are company profits over revenues:
So all we have to do is to break down the components of GDP growth and company profits.

Lighthouse Investment Management
Equity Market Monitor - December 2013 Page 13
GDP: Components of Growth
Growth in GDP is driven by the following three factors:
1. Number of workers
2. Capital
3. Productivity
Let's begin with the easiest: number of workers.
And that begins with population growth:
Since the beginning of the 1990's, population growth has almost halved to around 0.7% per annum.

Lighthouse Investment Management
Equity Market Monitor - December 2013 Page 14
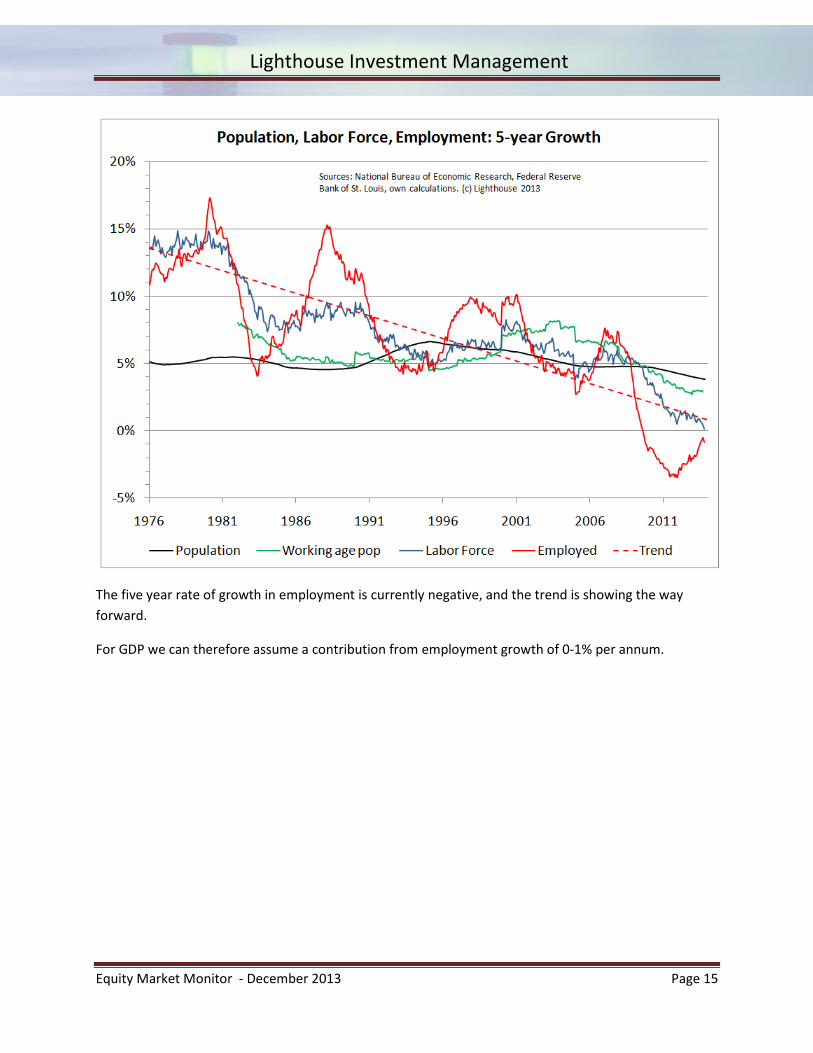
GDP: Employment Growth
The working-age population excludes adolescent and seniors. The labor force excludes the disabled and
discouraged workers. Subtract the unemployed and you get the number of workers.
The above chart shows how the number of workers today is lower than 7 years ago (the peak was 146.4
million in January 2008, at the beginning of the 'great' recession).
On the next page you'll see the declining growth rates over time.
Lighthouse Investment Management
Equity Market Monitor - December 2013 Page 15
The five year rate of growth in employment is currently negative, and the trend is showing the way
forward.
For GDP we can therefore assume a contribution from employment growth of 0-1% per annum.

Lighthouse Investment Management
Equity Market Monitor - December 2013 Page 16
GDP: Capital
Adding a new machine can increase output with the same number of workers, hence increasing GDP.
Net investments (after depreciation for aging equipment) are thought to increase output.
Looking at growth rates of net investment by sector you will notice a slowing trend. Total net
investment is currently growing at 0.7% only. The government (red) is currently reducing investments
(reducing deficits), compensated by increases from corporations and households. For our purposes, we
assume future growth of 0.5-1%.
Lighthouse Investment Management
Equity Market Monitor - December 2013 Page 17
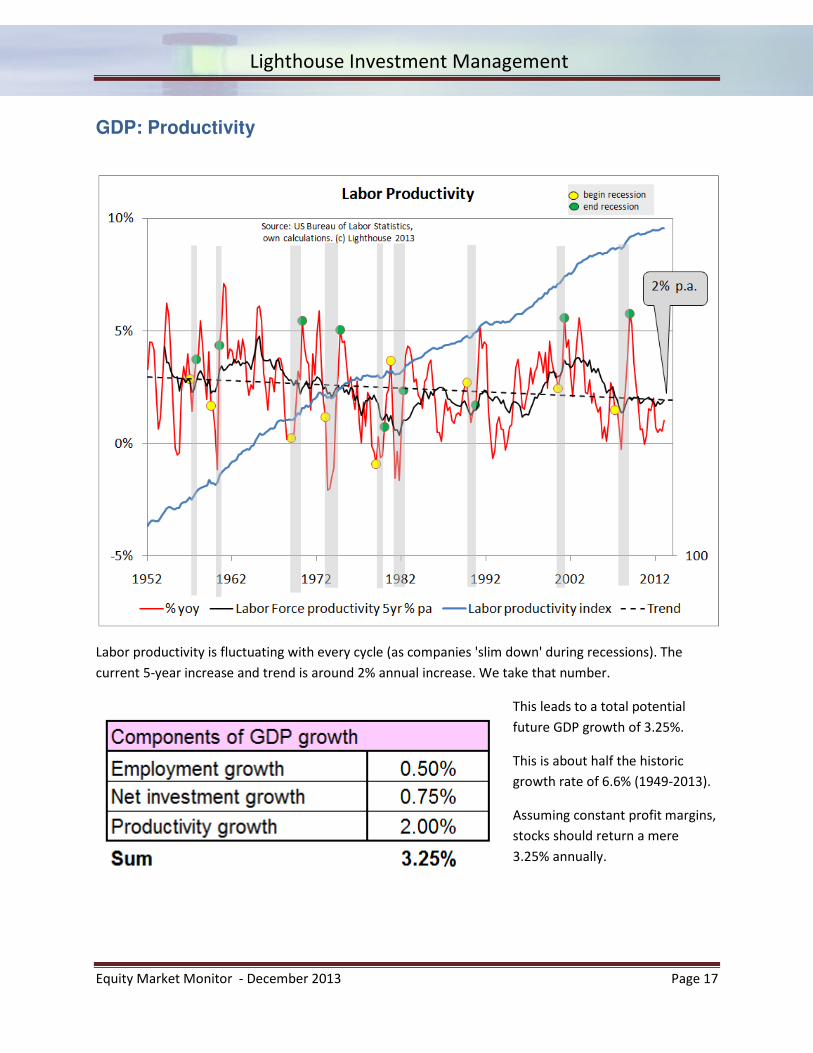
GDP: Productivity
Labor productivity is fluctuating with every cycle (as companies 'slim down' during recessions). The
current 5-year increase and trend is around 2% annual increase. We take that number.
This leads to a total potential
future GDP growth of 3.25%.
This is about half the historic
growth rate of 6.6% (1949-2013).
Assuming constant profit margins,
stocks should return a mere
3.25% annually.
Lighthouse Investment Management
Equity Market Monitor - December 2013 Page 18
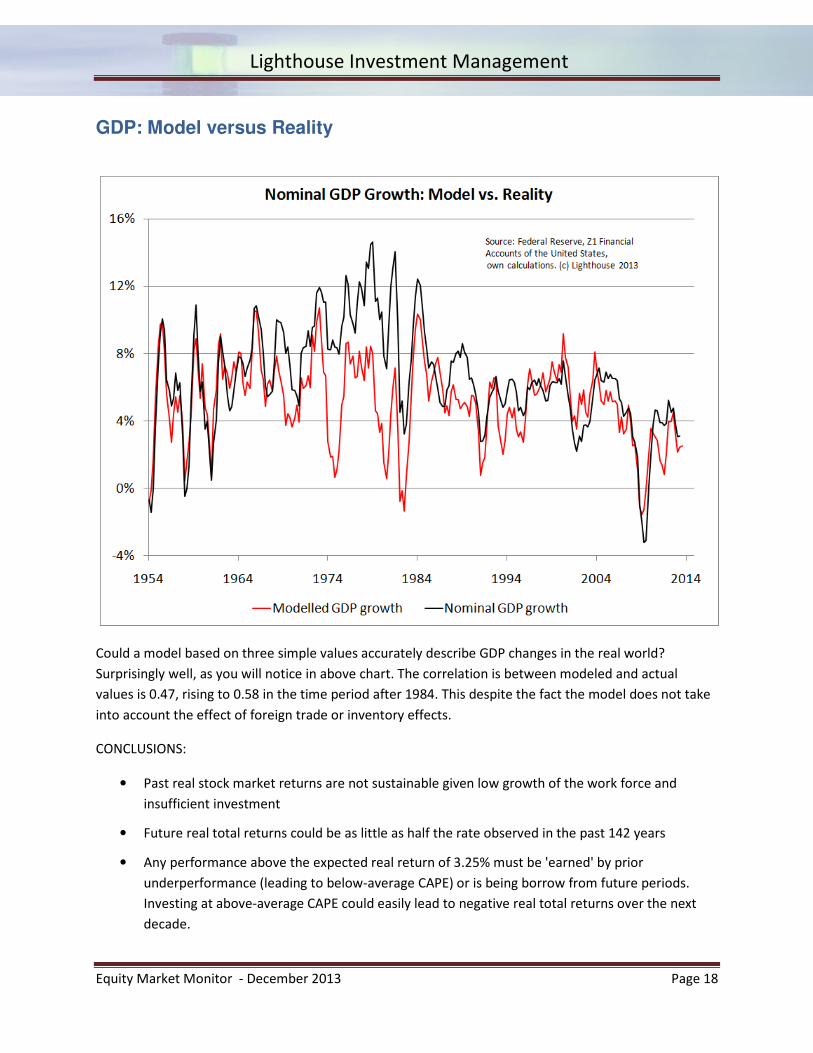
GDP: Model versus Reality
Could a model based on three simple values accurately describe GDP changes in the real world?
Surprisingly well, as you will notice in above chart. The correlation is between modeled and actual
values is 0.47, rising to 0.58 in the time period after 1984. This despite the fact the model does not take
into account the effect of foreign trade or inventory effects.
CONCLUSIONS:
• Past real stock market returns are not sustainable given low growth of the work force and
insufficient investment
• Future real total returns could be as little as half the rate observed in the past 142 years
• Any performance above the expected real return of 3.25% must be 'earned' by prior
underperformance (leading to below-average CAPE) or is being borrow from future periods.
Investing at above-average CAPE could easily lead to negative real total returns over the next
decade.
Lighthouse Investment Management
Equity Market Monitor - December 2013 Page 19
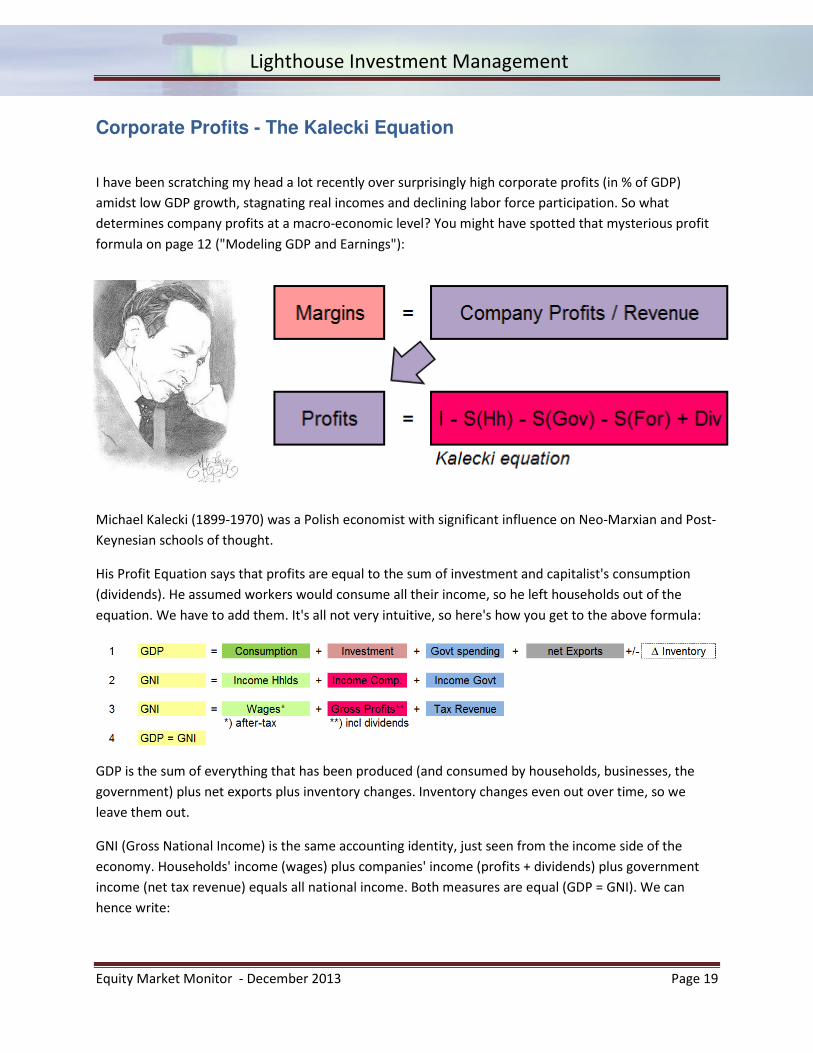
Corporate Profits - The Kalecki Equation
I have been scratching my head a lot recently over surprisingly high corporate profits (in % of GDP)
amidst low GDP growth, stagnating real incomes and declining labor force participation. So what
determines company profits at a macro-economic level? You might have spotted that mysterious profit
formula on page 12 ("Modeling GDP and Earnings"):
Michael Kalecki (1899-1970) was a Polish economist with significant influence on Neo-Marxian and Post-
Keynesian schools of thought.
His Profit Equation says that profits are equal to the sum of investment and capitalist's consumption
(dividends). He assumed workers would consume all their income, so he left households out of the
equation. We have to add them. It's all not very intuitive, so here's how you get to the above formula:
GDP is the sum of everything that has been produced (and consumed by households, businesses, the
government) plus net exports plus inventory changes. Inventory changes even out over time, so we
leave them out.
GNI (Gross National Income) is the same accounting identity, just seen from the income side of the
economy. Households' income (wages) plus companies' income (profits + dividends) plus government
income (net tax revenue) equals all national income. Both measures are equal (GDP = GNI). We can
hence write:
Lighthouse Investment Management
Equity Market Monitor - December 2013 Page 20
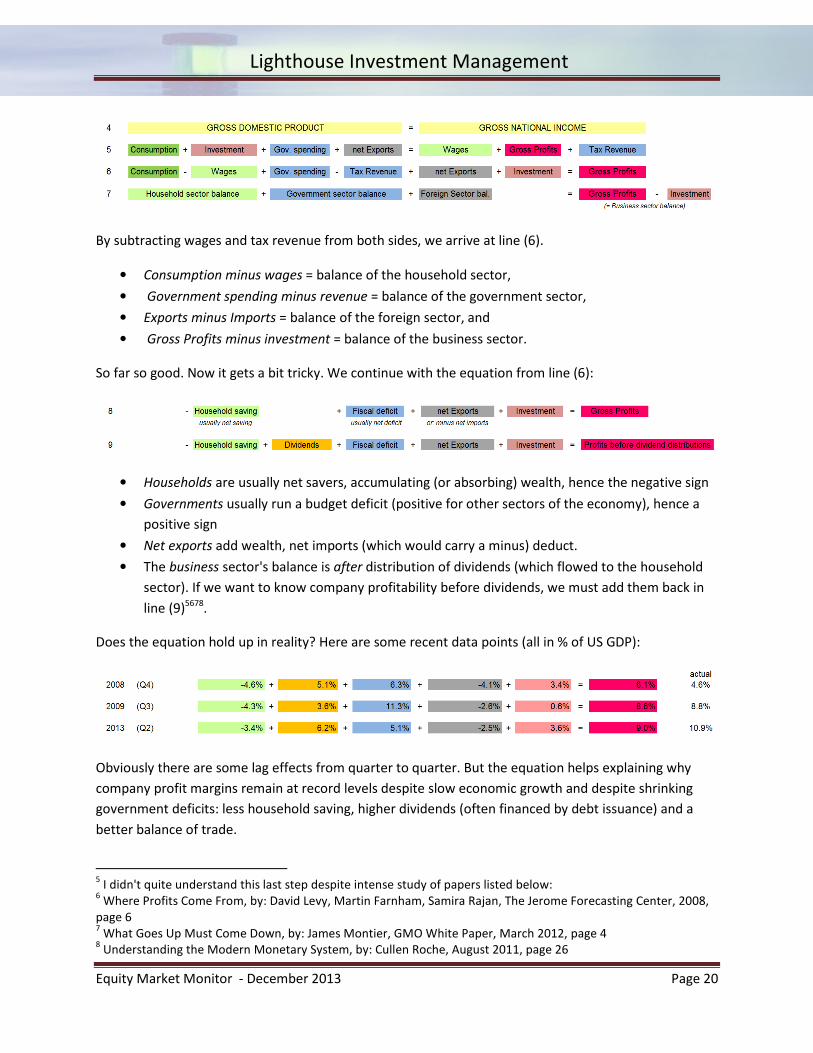
By subtracting wages and tax revenue from both sides, we arrive at line (6).
• Consumption minus wages = balance of the household sector,
• Government spending minus revenue = balance of the government sector,
• Exports minus Imports = balance of the foreign sector, and
• Gross Profits minus investment = balance of the business sector.
So far so good. Now it gets a bit tricky. We continue with the equation from line (6):
• Households are usually net savers, accumulating (or absorbing) wealth, hence the negative sign
• Governments usually run a budget deficit (positive for other sectors of the economy), hence a
positive sign
• Net exports add wealth, net imports (which would carry a minus) deduct.
• The business sector's balance is after distribution of dividends (which flowed to the household
sector). If we want to know company profitability before dividends, we must add them back in
line (9)5678.
Does the equation hold up in reality? Here are some recent data points (all in % of US GDP):
Obviously there are some lag effects from quarter to quarter. But the equation helps explaining why
company profit margins remain at record levels despite slow economic growth and despite shrinking
government deficits: less household saving, higher dividends (often financed by debt issuance) and a
better balance of trade.
5 I didn't quite understand this last step despite intense study of papers listed below:
6 Where Profits Come From, by: David Levy, Martin Farnham, Samira Rajan, The Jerome Forecasting Center, 2008,
page 6 7 What Goes Up Must Come Down, by: James Montier, GMO White Paper, March 2012, page 4
8 Understanding the Modern Monetary System, by: Cullen Roche, August 2011, page 26
Lighthouse Investment Management
Equity Market Monitor - December 2013 Page 21
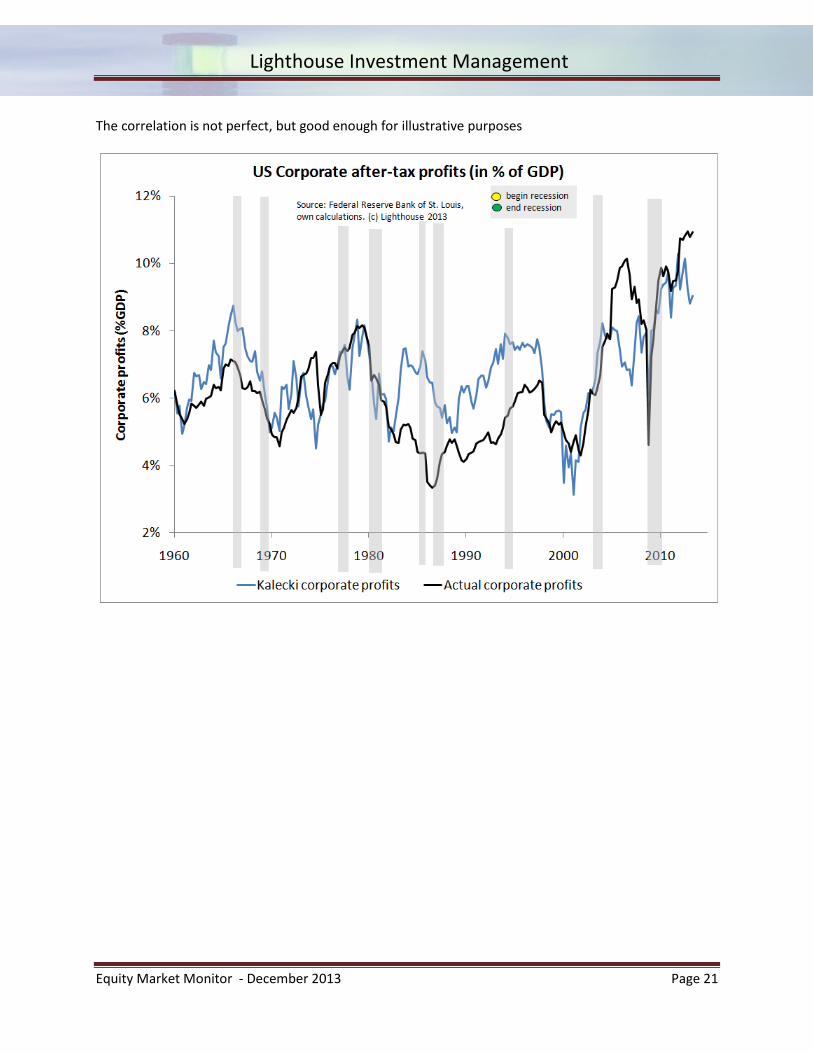
The correlation is not perfect, but good enough for illustrative purposes

Lighthouse Investment Management
Equity Market Monitor - December 2013 Page 22
Charting actual data since 1960:
Lighthouse Investment Management
Equity Market Monitor - December 2013 Page 23
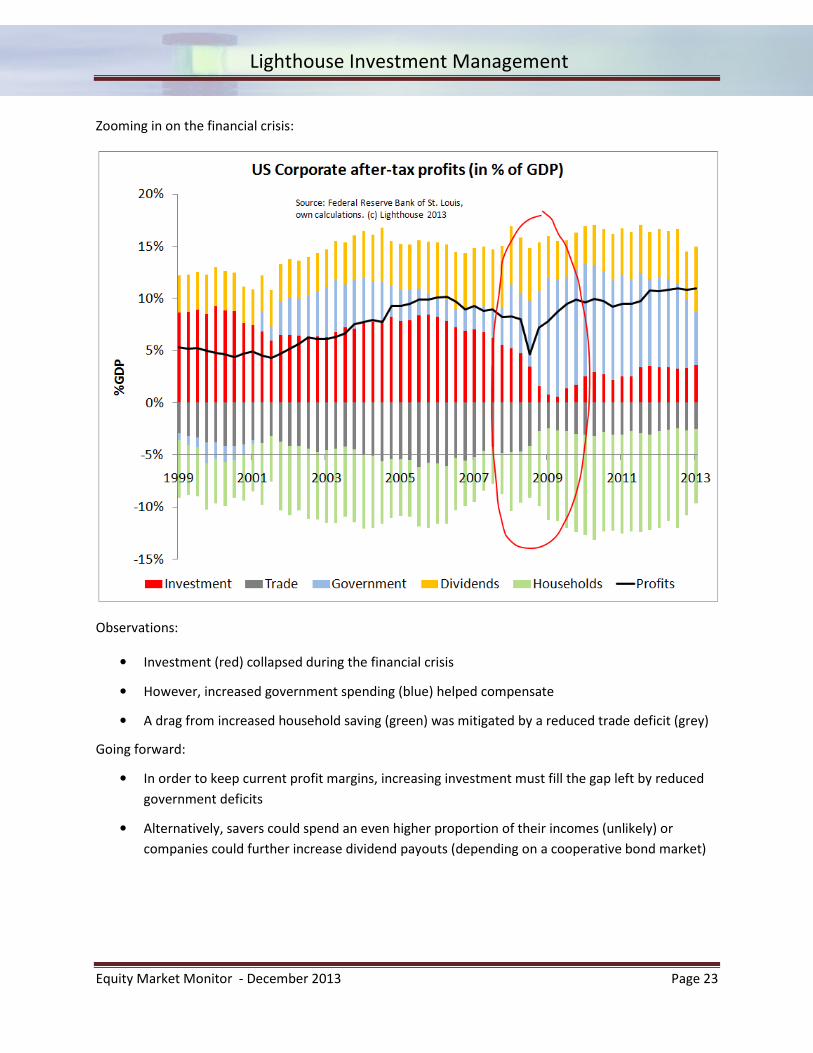
Zooming in on the financial crisis:
Observations:
• Investment (red) collapsed during the financial crisis
• However, increased government spending (blue) helped compensate
• A drag from increased household saving (green) was mitigated by a reduced trade deficit (grey)
Going forward:
• In order to keep current profit margins, increasing investment must fill the gap left by reduced
government deficits
• Alternatively, savers could spend an even higher proportion of their incomes (unlikely) or
companies could further increase dividend payouts (depending on a cooperative bond market)
Lighthouse Investment Management
Equity Market Monitor - December 2013 Page 24
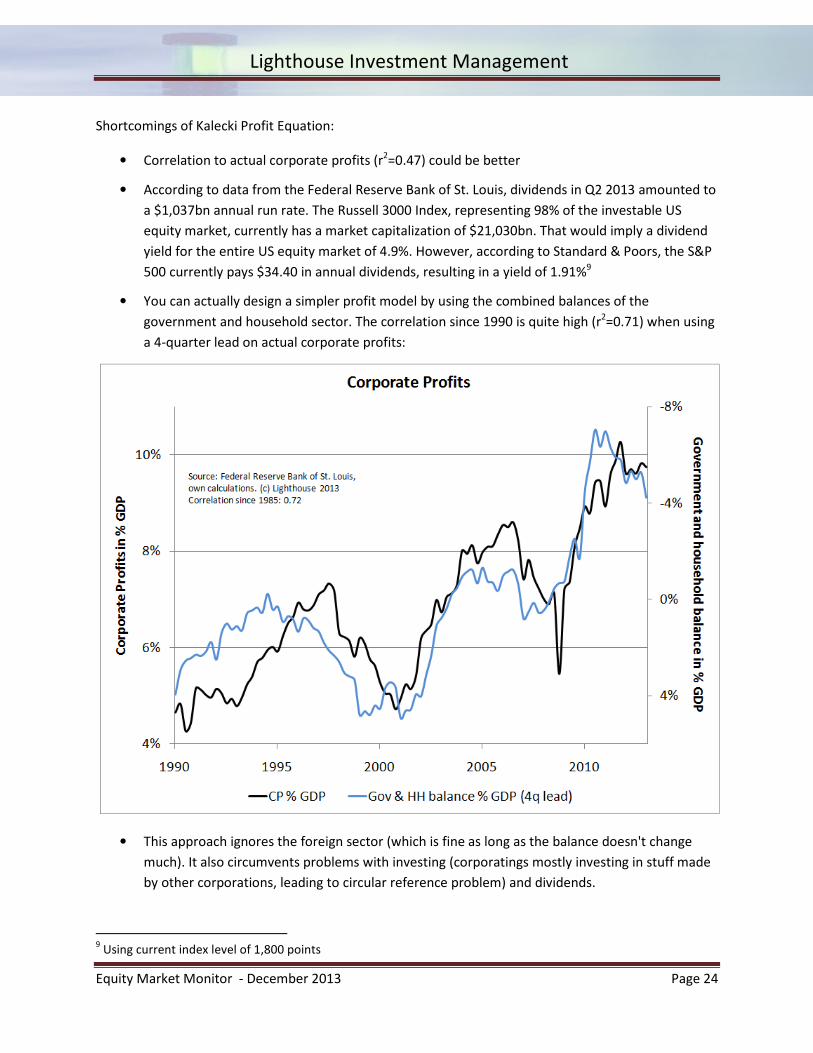
Shortcomings of Kalecki Profit Equation:
• Correlation to actual corporate profits (r2=0.47) could be better
• According to data from the Federal Reserve Bank of St. Louis, dividends in Q2 2013 amounted to
a $1,037bn annual run rate. The Russell 3000 Index, representing 98% of the investable US
equity market, currently has a market capitalization of $21,030bn. That would imply a dividend
yield for the entire US equity market of 4.9%. However, according to Standard & Poors, the S&P
500 currently pays $34.40 in annual dividends, resulting in a yield of 1.91%9
• You can actually design a simpler profit model by using the combined balances of the
government and household sector. The correlation since 1990 is quite high (r2=0.71) when using
a 4-quarter lead on actual corporate profits:
• This approach ignores the foreign sector (which is fine as long as the balance doesn't change
much). It also circumvents problems with investing (corporatings mostly investing in stuff made
by other corporations, leading to circular reference problem) and dividends.
9 Using current index level of 1,800 points

Lighthouse Investment Management
Equity Market Monitor - December 2013 Page 25
• Another explanation for elevated corporate profits comes from a declining share of labor (wages
in percent of GDP). However, the correlation is weak; from 1960-2000, corporate profits
fluctuated broadly between 4-8% when labor fell from 52% to 44% in a relatively steady fashion:
• An alternative explanation: companies used the past two recessions (2001, 2009) to take
advantage of automation and internet technology, reducing the need for jobs with high wages.
CONCLUSIONS:
• The Kalecki equation offers one possible explanation for elevated corporate profits
• Increasing government deficits boost corporate profits
• Reducing government deficits will adversely affect corporate profits unless the gap is filled by
less household saving, better trade balance, increased investment or higher dividend payments
Lighthouse Investment Management
Equity Market Monitor - December 2013 Page 26
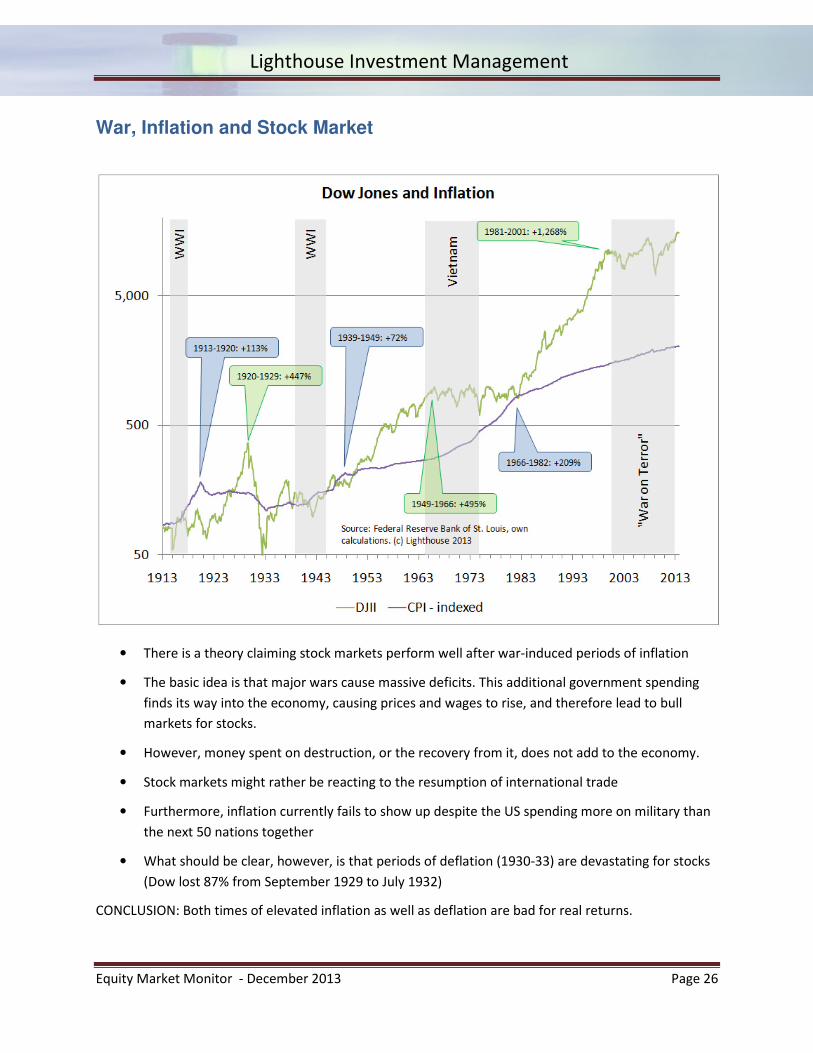
War, Inflation and Stock Market
• There is a theory claiming stock markets perform well after war-induced periods of inflation
• The basic idea is that major wars cause massive deficits. This additional government spending
finds its way into the economy, causing prices and wages to rise, and therefore lead to bull
markets for stocks.
• However, money spent on destruction, or the recovery from it, does not add to the economy.
• Stock markets might rather be reacting to the resumption of international trade
• Furthermore, inflation currently fails to show up despite the US spending more on military than
the next 50 nations together
• What should be clear, however, is that periods of deflation (1930-33) are devastating for stocks
(Dow lost 87% from September 1929 to July 1932)
CONCLUSION: Both times of elevated inflation as well as deflation are bad for real returns.

Lighthouse Investment Management
Equity Market Monitor - December 2013 Page 27
Any questions or feedback welcome.
Disclaimer: It should be self-evident this is for informational and educational purposes only and shall not be
taken as investment advice. Nothing posted here shall constitute a solicitation, recommendation or
endorsement to buy or sell any security or other financial instrument. You shouldn't be surprised that
accounts managed by Lighthouse Investment Management or the author may have financial interests in any
instruments mentioned in these posts. We may buy or sell at any time, might not disclose those actions and
we might not necessarily disclose updated information should we discover a fault with our analysis. The
author has no obligation to update any information posted here. We reserve the right to make investment
decisions inconsistent with the views expressed here. We can't make any representations or warranties as to
the accuracy, completeness or timeliness of the information posted. All liability for errors, omissions,
misinterpretation or misuse of any information posted is excluded.
+ + + + + + + + + + + + + + + + + + + + + + + + + + + + + + + + + + + + + + +
All clients have their own individual accounts held at an independent, well-known brokerage company (US)
or bank (Europe). This institution executes trades, sends confirms and statements. Lighthouse Investment
Management does not take custody of any client assets.
Related Documents