Light Harvesting Strategies of Cryptophyte Algae by Scott McKay A thesis submitted in conformity with the requirements for the degree of Master of Science Graduate Department of Chemistry University of Toronto © Copyright by Scott McKay 2015

Welcome message from author
This document is posted to help you gain knowledge. Please leave a comment to let me know what you think about it! Share it to your friends and learn new things together.
Transcript
Light Harvesting Strategies of Cryptophyte Algae
by
Scott McKay
A thesis submitted in conformity with the requirements for the degree of Master of Science
Graduate Department of Chemistry University of Toronto
© Copyright by Scott McKay 2015
ii
Light Harvesting Strategies of Cryptophyte Algae
Scott McKay
Master of Science
Department of Chemistry
University of Toronto
2015
Abstract
Cryptophyte algae employ a unique system of free floating phycobiliproteins that shuttle
photosynthetic excitations to membrane bound chlorophyll a/c complexes which in turn are
connected to the photosystem reaction center (Larkum, 2010). Using absorption, emission and
excitation spectroscopy, we attempt to determine, firstly, the manner in which the algae first
absorb incoming photons and then shuttle the excitation from the outlying peripheral proteins to
the core complex reaction centers and secondly, how efficient this process is within the
organism.
The complex relationship between light harvesting efficiency and the antenna proteins was
examined by performing experiments on organisms that varied in their antenna structure both
energetically and structurally. The adaptability to varying environmental conditions was also
studied by exposing organisms to varying ambient light intensity, a factor which is well known
to influence photosynthetic efficiency (Falkowski & Owens, 1980). Contributions of alternate
dissipative pathways were determined by chemically decoupling key systems in the electron
transport chain.

iii
Acknowledgments
There is one Dilbert comic that I am particularly fond of, in it, the Pointy Haired Boss is
tasked with finding a new CEO for the company. During the welcoming speech for the new
CEO, the Pointy Haired Boss reveals to the company that the new hire has no relevant
experience or knowledge in their field. The Pointy Haired Boss informs the company that this
was done on purpose as they wanted someone who “Didn’t know what can’t be done”. I often
think how well this sums up my career in academia.
With that I would like to thank my supervisor, Dr. Greg Scholes, for taking me on as a
graduate student. I am very grateful for being given the opportunity to work under such a
passionate and knowledgeable person.
I would also like to extend my deepest gratitude to Dr. Tihana Mirkovic, who mentored
me, and supervised my day to day work. She was an invaluable source of knowledge and worked
very hard to keep me from screwing up too many experiments.
The rest of the Scholes group were a constant source of entertainment and wisdom and I
am indebted to them for making the daily grind bearable and for putting up with all my stupid
questions and humoring my often ridiculous ideas. Dan, Cathal, Desmond, Elsa, Jacob, Shann,
Ryan, Yin, Yasser, Tia and Evgeny, thank you for all your technical and existential wisdom over
the last year and a half.
Outside of life in the lab, I would like to thank Jacquie, Rita, Frank, Rhys, Rebecca,
Oliver, Bryan and Mark for making Toronto a second home for me.
Back home I would like to thank my family for their ongoing support over the last six and
a half years, despite my constant indecision about what I wanted to be when I grew up.
While not directly involved in my time at the University of Toronto, I would like to thank
Dr. Georg Schreckenbach and Dr. James Xidos who, at a very dark time in my life, kept me
going forward with my studies when I thought I was ready to quit them. Without your guidance
and support, I would not be where I am today.

iv
Gǣð ā Wyrd swā hīo scel!
-Beowulf
v
Contents
Acknowledgments .......................................................................................................................... iii
List of Figures ............................................................................................................................... vii
Abbreviations and Acronyms ........................................................................................................ xi
Chapter 1 ......................................................................................................................................... 1
Introduction ..................................................................................................................................... 1
1.1 Photosynthesis ..................................................................................................................... 1
1.2 Light Harvesting Architecture ............................................................................................ 4
Chromophores and Proteins .................................................................................... 4
Photochemical Quenching ...................................................................................... 6
Other Dissipative Pathways .................................................................................... 8
1.3 Spectroscopy ....................................................................................................................... 9
Linear Absorption ................................................................................................... 9
Fluorescence ........................................................................................................... 9
Chapter 2 ...................................................................................................................................... 12
Energy Transfer under Standard Conditions ................................................................................. 12
2.1 Methods and Introduction ................................................................................................. 12
2.2 Spectroscopic Investigation under Normal Conditions .................................................... 13
Absorbance Spectroscopy ..................................................................................... 14
Fluorescence Spectroscopy ................................................................................... 15
Chapter 3 ....................................................................................................................................... 24
Contributions of Dissipative Pathways ......................................................................................... 24
3.1 Non Photochemical Quenching ........................................................................................ 27
3.2 Photochemical Quenching ................................................................................................ 28
Chapter 4 ....................................................................................................................................... 39
Conclusions ................................................................................................................................... 39

vi
References ..................................................................................................................................... 41
vii
List of Figures
Figure 1.) Simplified timeline of the evolution of photosynthetic eukaryotes. a) A heterotrophic
eukaryotic cell engulfs an ancestral cyanobacterium b) The eukaryote does not digest the
cyanobacterium and instead incorporates it into its physiology c) The early progenitor of the
photosynthetic eukaryotes gives rise the major classes we see today, including the Red Algae d)
During a secondary endosymbiotic event, an ancestral Red Algae is engulfed by an early
eukaryote e) The Red Algae is incorporated into the eukaryote, losing its plastid and giving rise
to the Cryptophyte lineage. Adapted from Reference .................................................................... 2
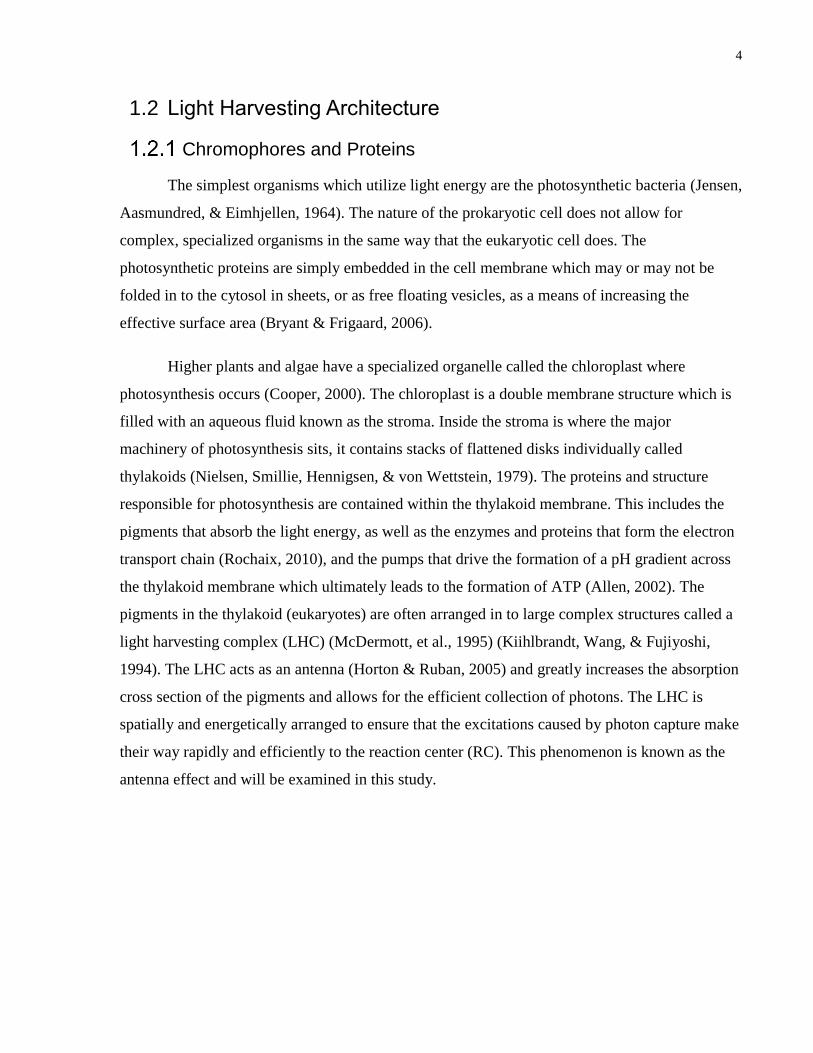
Figure 2.) Schematic of the antenna effect, chromophores far from the reaction center are higher
in energy, chromophores nearer the RC are lower in energy with the RC being the lowest. This
ensures that excitations are funneled in to the RC .......................................................................... 5
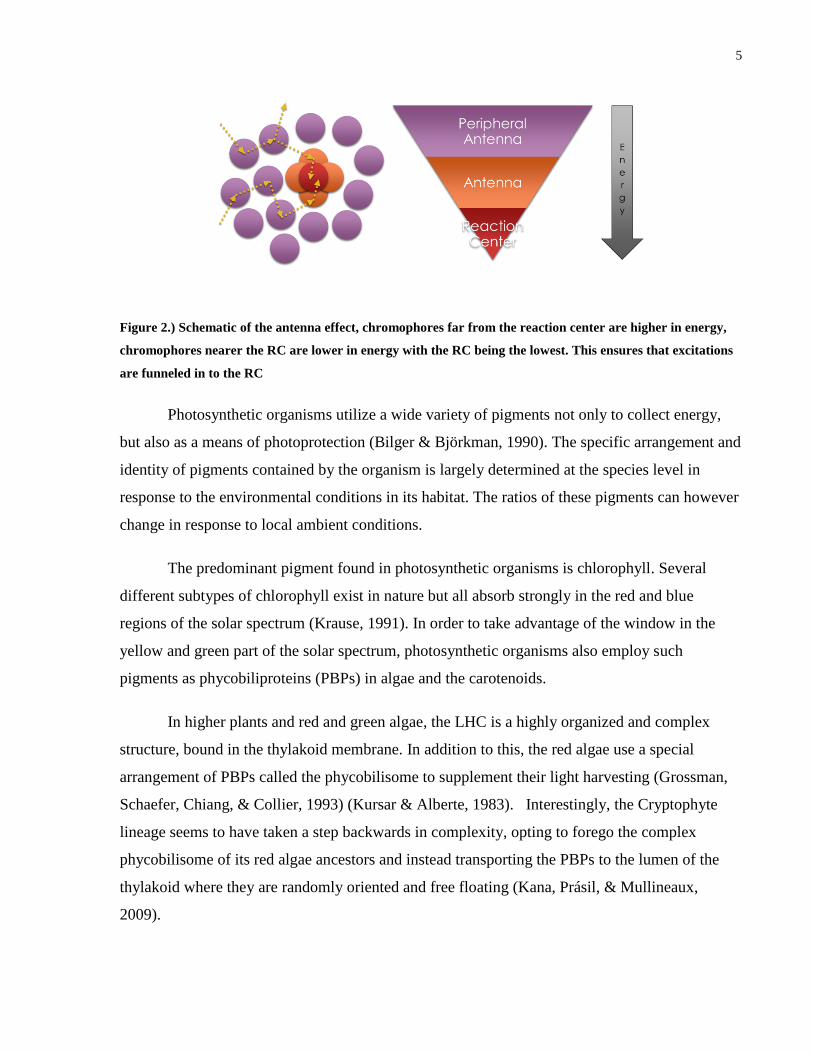
Figure 3.) The top right is a cartoon depiction of the complex arrangement of phycobiliproteins
in the red algae phycobilisome. The bottom shows the disorganized arrangement of the
Cryptophyte antenna. ...................................................................................................................... 6
Figure 4.) Z-Scheme of Photosynthesis. Light is collected by the photosystem antenna system
(Green circles) and funneled to the reaction center. PSII now in an excited state rapidly
undergoes charges separation, passing off an electron to a series of membrane bound proteins
which include pheophytin (Pheo) and a one and two electron accepting plastoquinone (QA and
QB). These electrons are picked up by a mobile plastoquinone (PlQ) which shuttles the charges to
the Iron-Sulphur containing cytochrome complex. Finally the electrons are brought to PSI via the
mobile plastocyanin molecule. Absorbing a second photon in PSI the electrons are again charge
separated and passed off to A0 and A1 which are a specialized chlorophyll, and vitamin K1
respectively. Finally the electrons are passed through three iron-sulphur centers, Fx, FA, and FB
and lastly on to Ferredoxin (Fd) where they are used to convert two NADP+ to two NADPH. ..... 7
Figure 5.) The efficiency of energy transfer between two chromophores can be determined with
the normalized absorption and fluorescence excitation spectrum. In this example we consider a
simple system of two chromophores, called A and D, where A is the acceptor with an absorption
maximum λ=510 nm and D is the donor with absorption maximum λ=490 nm. Both spectra are
viii
normalized at 510 nm and the ratio at 490 nm is determined. In this case the transfer efficiency is
found to be 70% ............................................................................................................................ 10
Figure 6.) Normalized absorption spectra of H. Pacifica and P. Sulcata, containing PC and PE
respectively. The major contributors to the absorbance profile are: chlorophyll a S2 (440nm),
chlorophyll c2 S2 (470 nm), alloxanthin (490 nm), phycoerythrin (545-555 nm), phycoerythrin
(575-625 nm), chlorophyll c2 S1 (630 nm), and chlorophyll a S1 (680 nm). Overlap of PC and
ChlA /C complicates the energy transfer efficiency calculations. ................................................ 13
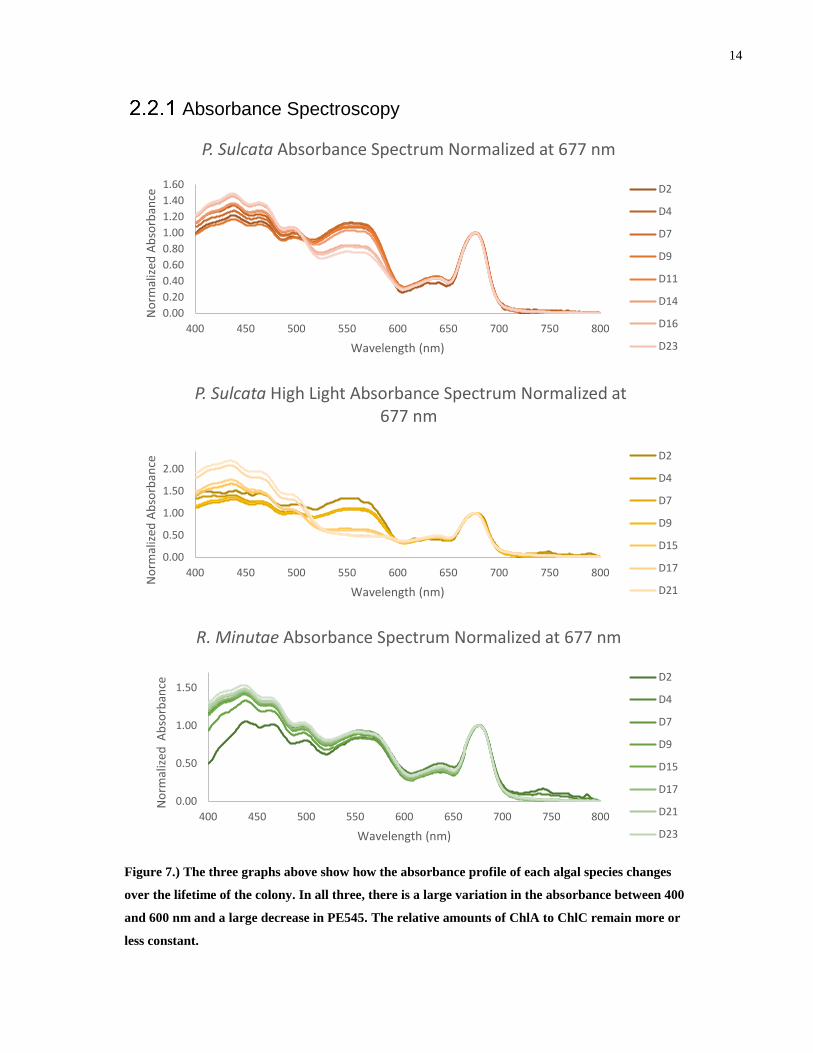
Figure 7.) The three graphs above show how the absorbance profile of each algal species changes
over the lifetime of the colony. In all three, there is a large variation in the absorbance between
400 and 600 nm and a large decrease in PE545. The relative amounts of ChlA to ChlC remain
more or less constant. .................................................................................................................... 14
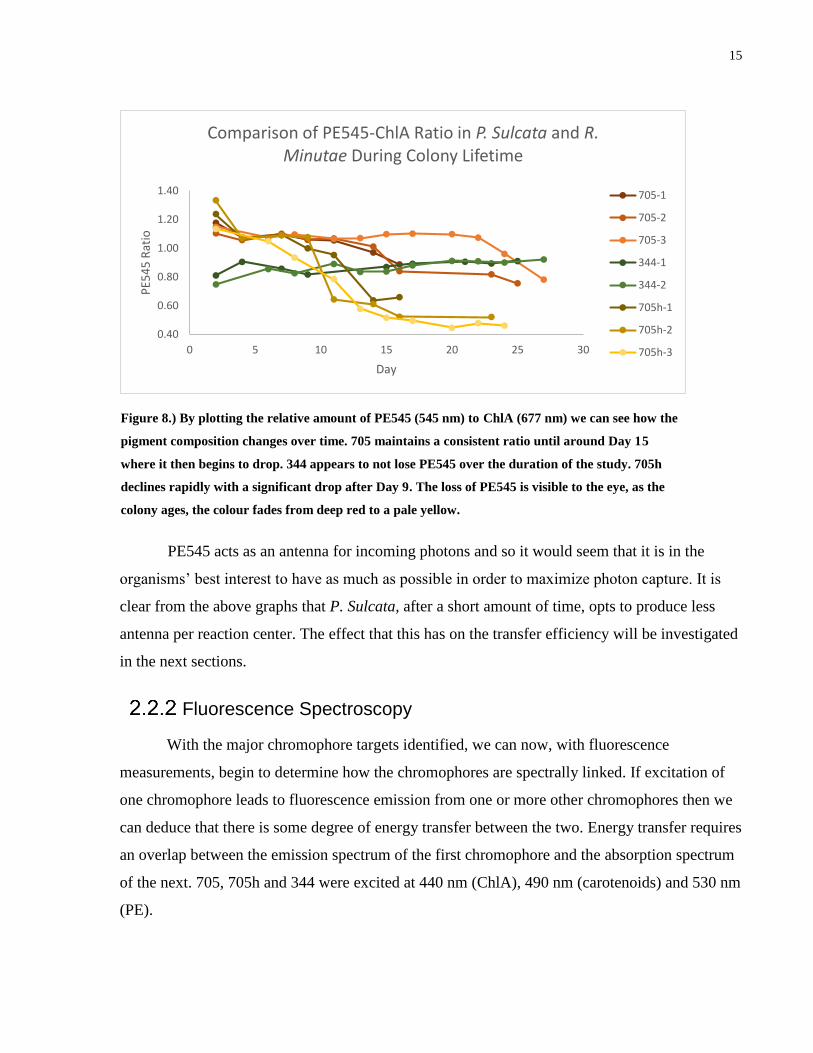
Figure 8.) By plotting the relative amount of PE545 (545 nm) to ChlA (677 nm) we can see how
the pigment composition changes over time. 705 maintains a consistent ratio until around Day 15
where it then begins to drop. 344 appears to not lose PE545 over the duration of the study. 705h
declines rapidly with a significant drop after Day 9. The loss of PE545 is visible to the eye, as the
colony ages, the colour fades from deep red to a pale yellow. ..................................................... 15
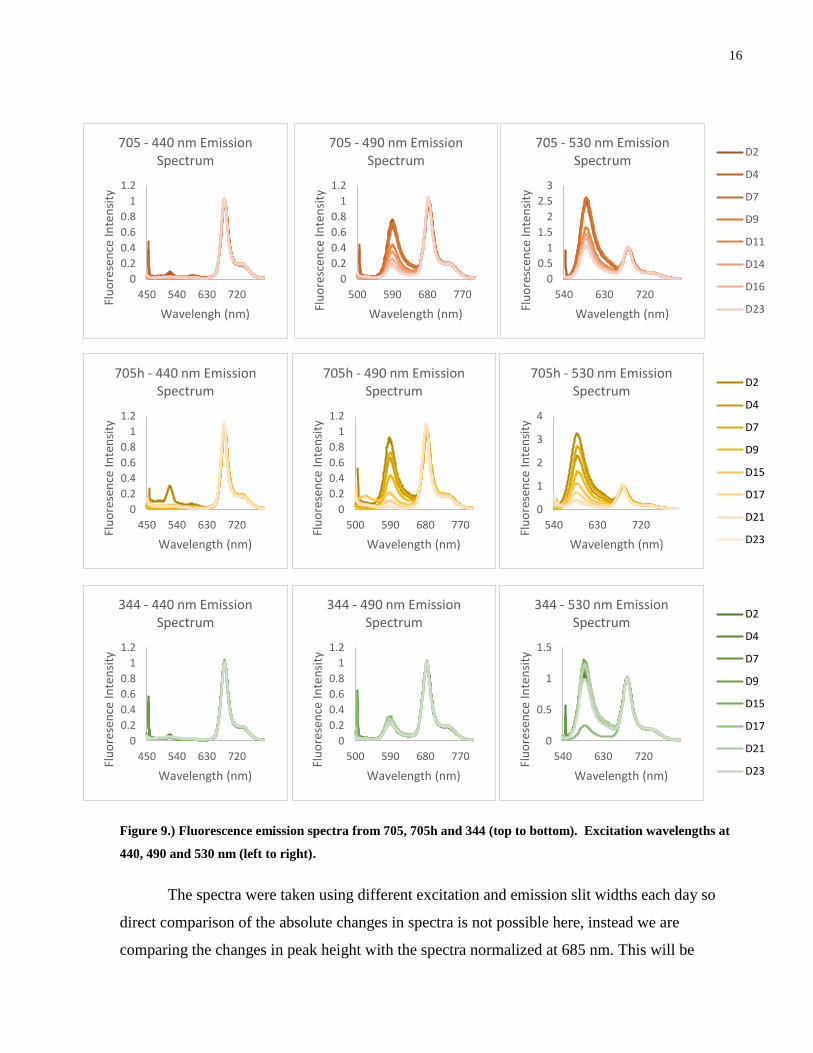
Figure 9.) Fluorescence emission spectra from 705, 705h and 344 (top to bottom). Excitation
wavelengths at 440, 490 and 530 nm (left to right). ..................................................................... 16
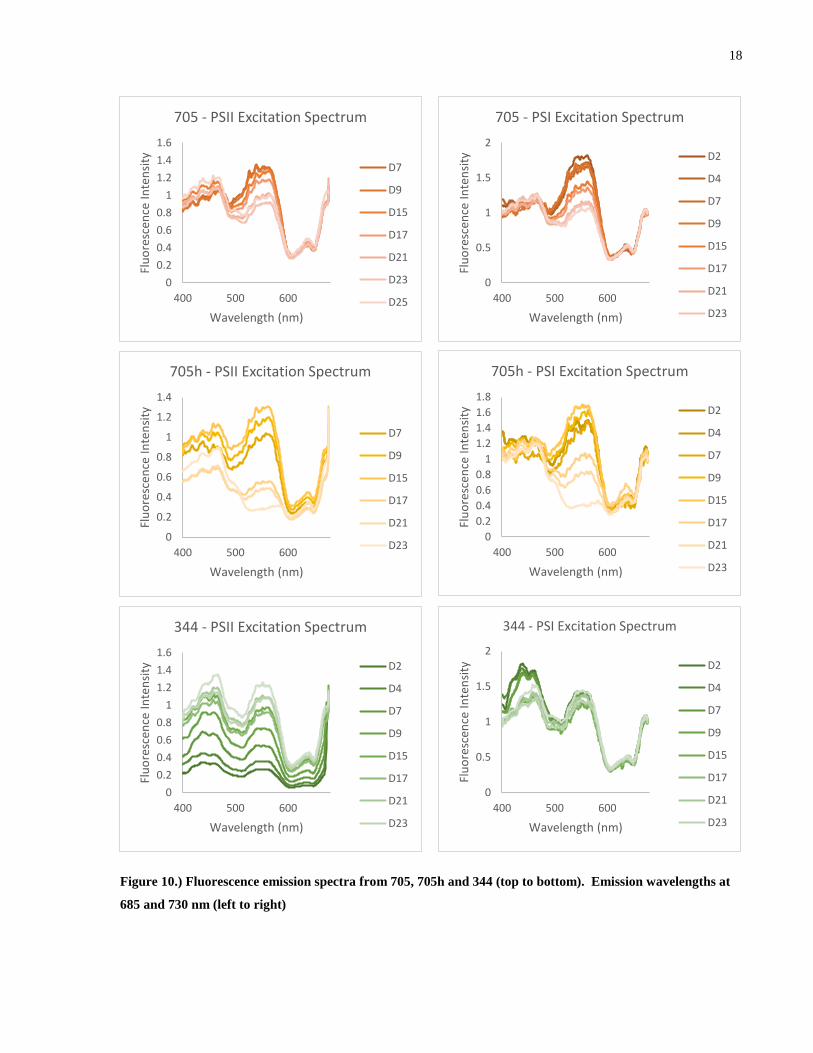
Figure 10.) Fluorescence emission spectra from 705, 705h and 344 (top to bottom). Emission
wavelengths at 685 and 730 nm (left to right) .............................................................................. 18
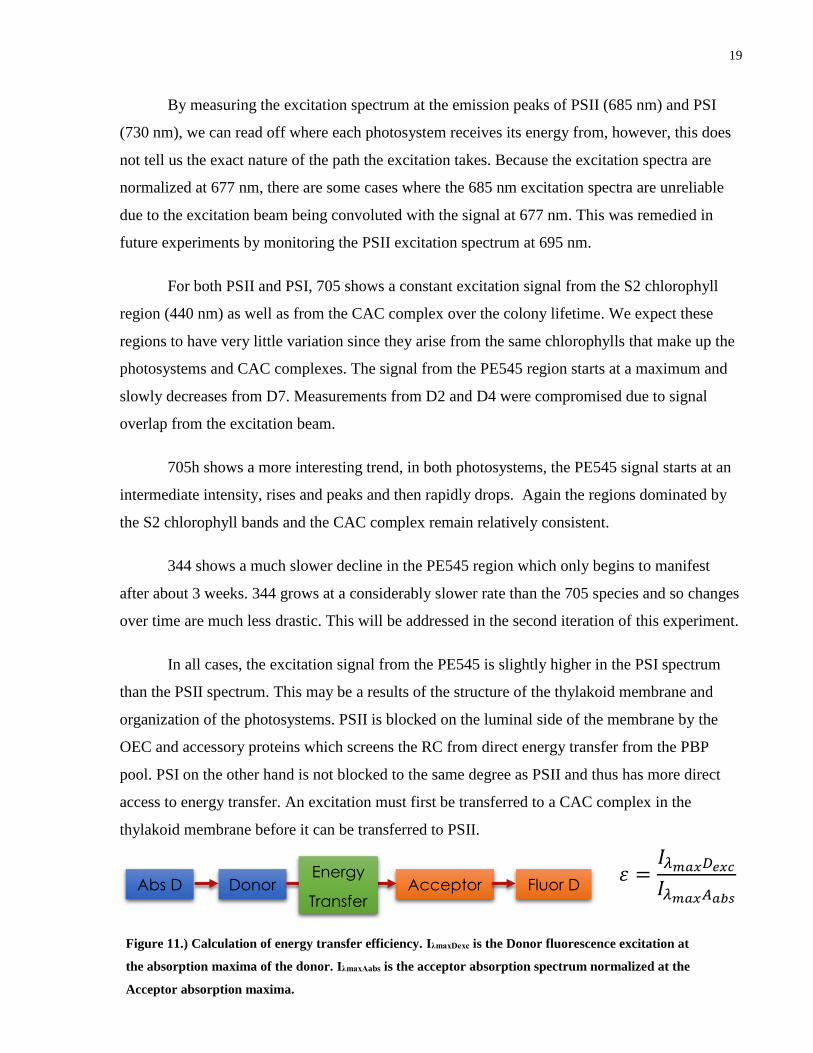
Figure 11.) Calculation of energy transfer efficiency. IλmaxDexc is the Donor fluorescence
excitation at the absorption maxima of the donor. IλmaxAabs is the acceptor absorption spectrum
normalized at the Acceptor absorption maxima. .......................................................................... 19
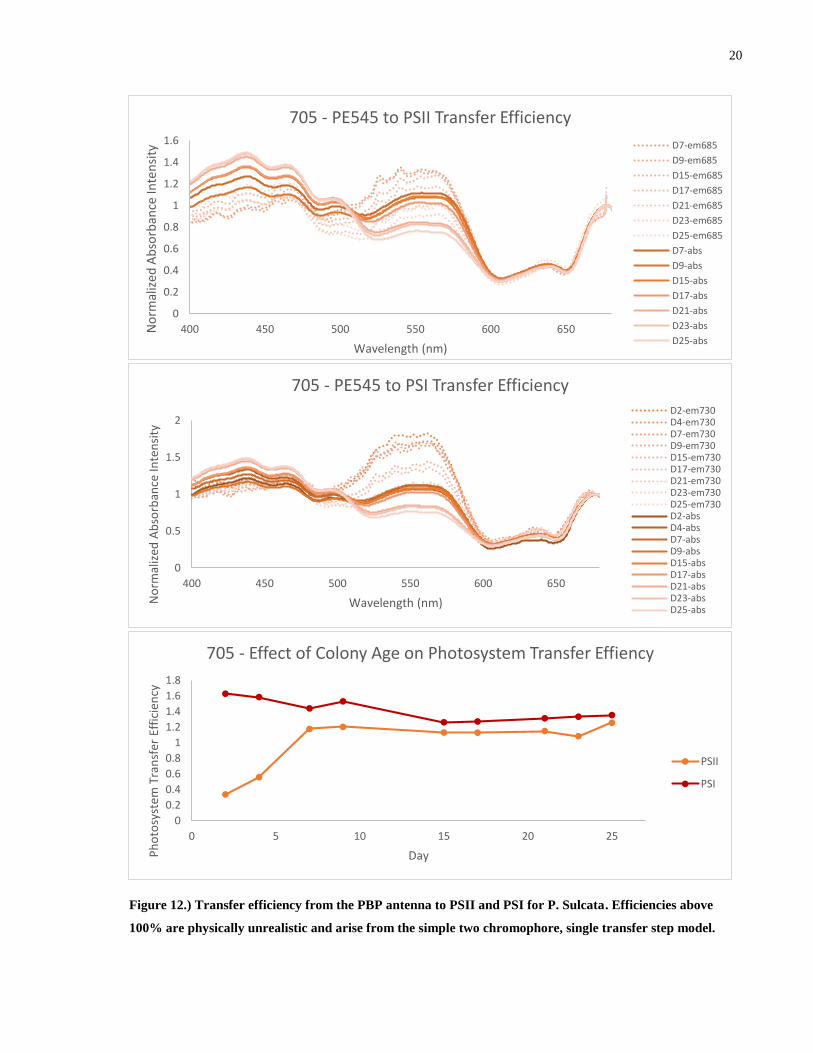
Figure 12.) Transfer efficiency from the PBP antenna to PSII and PSI for P. Sulcata. Efficiencies
above 100% are physically unrealistic and arise from the simple two chromophore, single
transfer step model. ....................................................................................................................... 20
ix
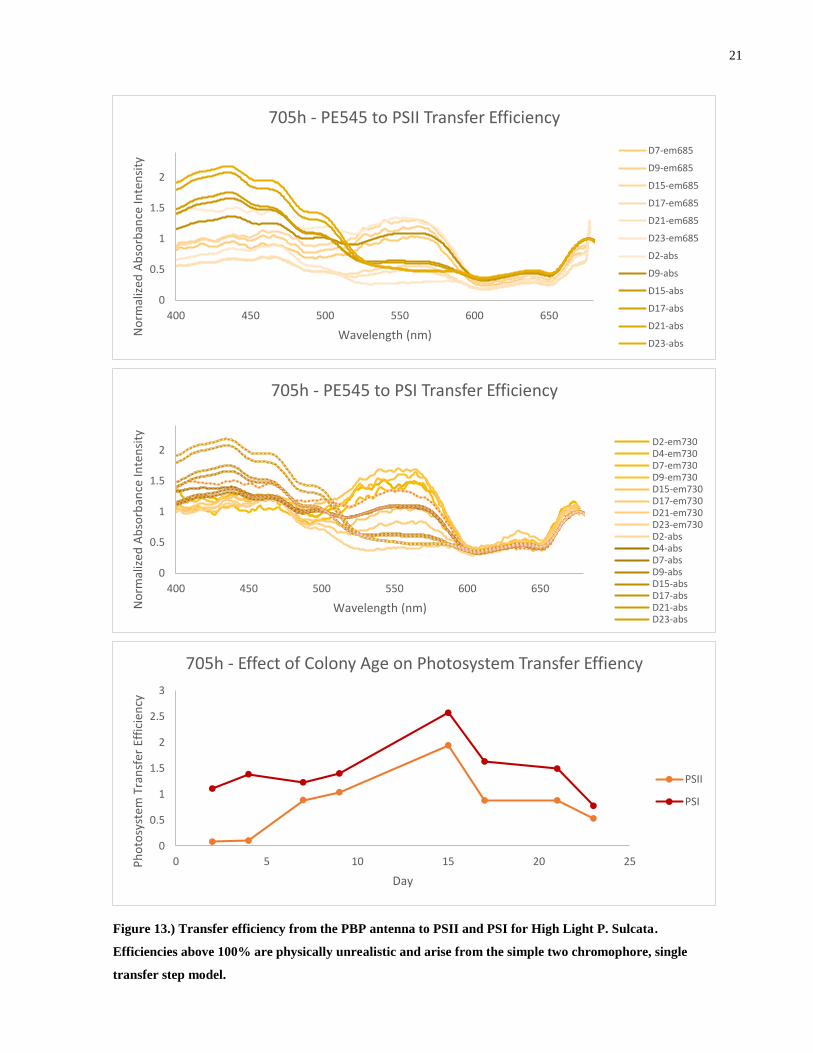
Figure 13.) Transfer efficiency from the PBP antenna to PSII and PSI for High Light P. Sulcata.
Efficiencies above 100% are physically unrealistic and arise from the simple two chromophore,
single transfer step model. ............................................................................................................ 21
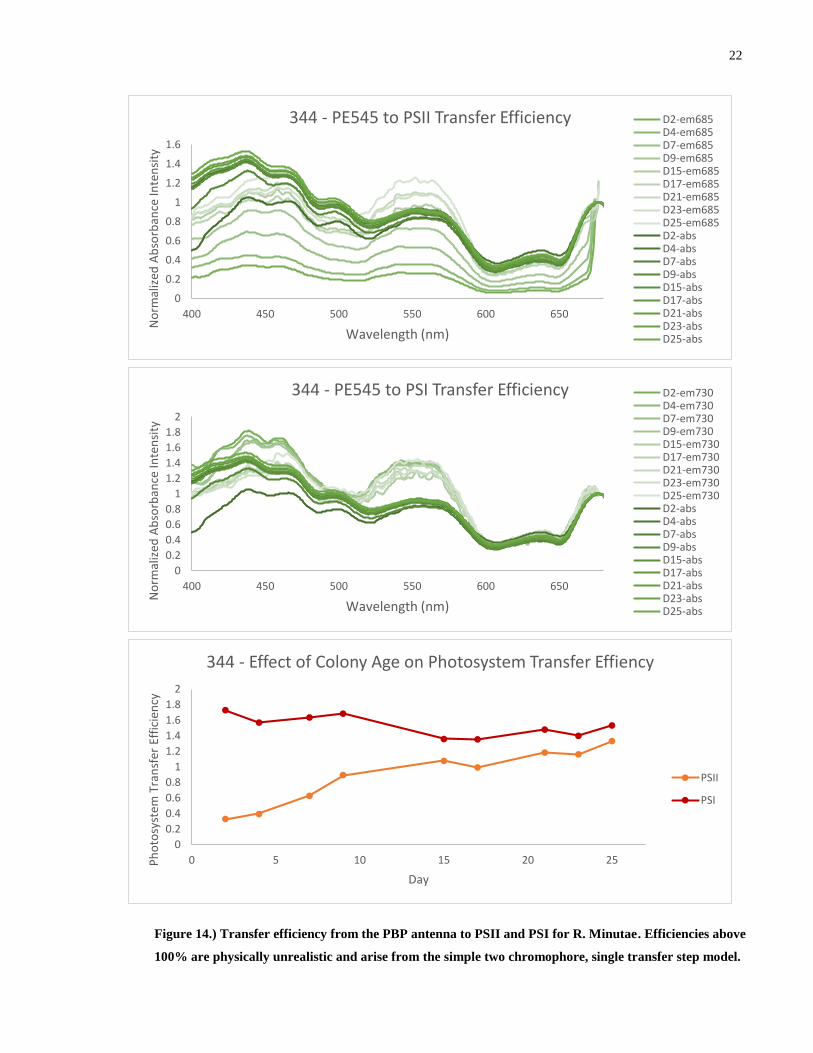
Figure 14.) Transfer efficiency from the PBP antenna to PSII and PSI for R. Minutae.
Efficiencies above 100% are physically unrealistic and arise from the simple two chromophore,
single transfer step model. ............................................................................................................ 22
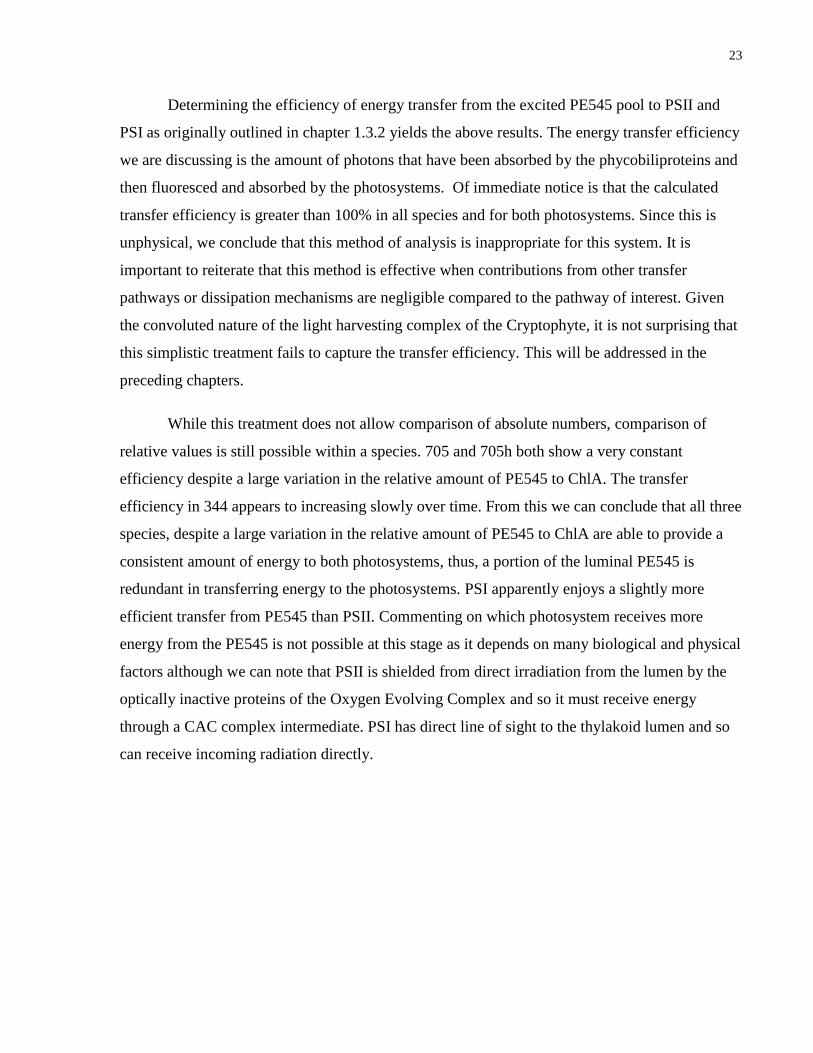
Figure 15.) Full complexity model of energy transfer in the Cryptophyte. J545 and J677 are the 545
and 677 nm photon flux. PEL and PEM are the luminal and membrane associated PE. JLF is
fluorescence from luminal PE. ELM is transfer between PEL and PEM. EM(I) is energy transfer
from the PEM to PSI. NPQCH and JCF are NPQ and fluorescence from the CAC complex. EC(I) and
EC(II) are energy transfer from the CAC complex to PSI and PSII. J(II)F and J(I)F are fluorescence
from PSII and PSI. E(II)(I) is energy transfer from PSII to PSI. E(II)PQ and E(I)PQ are energy transfer
via charge separation from PSII and PSI. ..................................................................................... 24
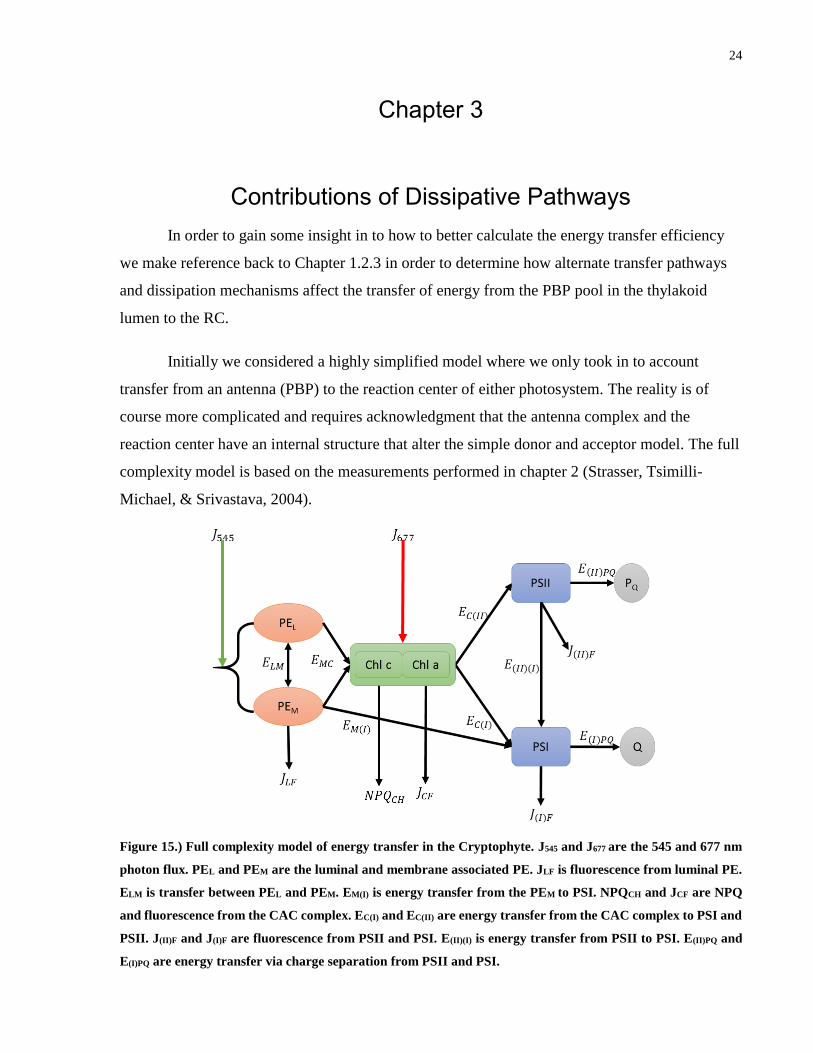
Figure 16.) Showing the overlap between PE545 and the absorption spectrum of 705, we can see
that despite the high fluorescence yield of PE545, only a small portion of it is of the appropriate
wavelength to transfer energy to the CAC complex or the photosystems. ................................... 25
Figure 17.) Transfer efficiency from the PBP antenna to PSII and PSI. ...................................... 27
Figure 18.) Location of action of DCMU. PlQ is prevented from replenishing the quinone pool
associated with PSII. After all the quinones are reduced, the quinone pool will be unable to pass
additional electrons to the rest of the ETC and so they will be fluoresced from PSII. (Tóth,
Schansker, & Strasser, 2005) ........................................................................................................ 29
Figure 19.) Absolute (top) and normalized (bottom) fluorescence emission spectra of P. Sulcata,
before and after addition of DCMU. WT refers to measurements performed without DCMU .... 30
Figure 20.) Absolute (top) and normalized (bottom) fluorescence excitation spectra of P. Sulcata,
before and after addition of DCMU. WT refers to measurements performed without DCMU .... 31
Figure 21.) Schematic for efficiency calculation. J545 is the absorbed photon flux at 545 nm.
J590 is the fluorescence from PE545. ET1 is energy transfer from PE545 to the CAC complex,
x
qH1 is thermal dissipation from the CAC complex. ET2 is energy transfer from the CAC
complex to a photosystem (PSII). J685 is fluorescence from PSII. qH2 is thermal dissipation
from PSII, PQ is photochemical quenching at PSII. If NPQ is deactivated (dark adapted) then
qH1 = qH2 = 0. With DCMU, PQ = 0 .......................................................................................... 32
Figure 22.) ChlA (top), ChlC (middle) s2 band, and carotenoid (bottom) absolute emission
spectra before and after addition of DCMU ................................................................................. 33
Figure 23.) PE545 (top and bottom) absolute and normalized emission spectra before and after
addition of DCMU ........................................................................................................................ 34
Figure 24.) Comparison of PE545 (top) and PSII (bottom) fluorescence with and without DCMU
over colony lifetime. ..................................................................................................................... 35
Figure 25.) P. Sulcata Energy Transfer from PE545 to PSII, taking in to account PSII
photochemical quenching by addition of DCMU ......................................................................... 36
Figure 26.) P. Sulcata Energy Transfer from PE545 to PSI, taking in to account PSII
photochemical quenching by addition of DCMU ......................................................................... 37
xi
Abbreviations and Acronyms
269 Chroomonas Mesostigmatica
344 Rhodomonas Minutae
705 Proteomonas Sulcata
705h Proteomonas Sulcata grown under high light conditions
706 Hemiselmis Pacifica
abs Absorbance
APC Allophycocyanin
ADP adenosine diphosphate
ATP adenosine triphosphate
CAC complex chlorophyll a/c complex
ChlA chlorophyll a
ChlC chlorophyll c2
DCMU 3-(3,4-dichlorophenyl)-1,1-dimethylurea
em Fluorescence emission
exc Fluorescence excitation
GA billions of years ago
LHC light harvesting complex
NADP nicotenamide-adenine dinucleotide phosphate
NPQ non photochemical quenching
PC577 phycocyanin 577 isolated from Hemiselmis Pacifica
PC645 phycocyanin 645 isolated from Chroomonas Mesostigmatica
PE545 phycoerythrin 545 isolated from Rhodomonas Minutae or Proteomonas Sulcata
PSI photosystem I
PSII photosystem II
PBP phycobiliprotein
Pheo pheophytin
PlC plastocyanin
PlQ plastoquinone
PQ photochemical quenching
QA/B terminal electron acceptors in PSII
qH vibrational quenching
qR radiative quenching (fluorescence)
RC reaction center
WT algae without DCMU
1
Chapter 1
Introduction
1.1 Photosynthesis
Every second, a tremendous amount of energy in the form of solar radiation is deposited
on the surface of the Earth (Larkum, 2010). Less than a billion years (Hohmann-Marriott &
Blankenship, 2011) after our planet coalesced out of the primordial debris surrounding the infant
sun, the first organisms capable of anaerobic photosynthesis (Xiong & Bauer, 2002) made their
eternal mark on the biosphere. Now, in the present day, these early ancestors have sired an
impressive lineage of light harvesting organisms that form the foundation of all life on Earth.
Three billion years of evolutionary tinkering have produced a diverse set of methods for making
use of solar energy (Koziol, et al., 2007) (Ruban, 2014). From the capture of photons, to ensuring
their safe and rapid journey to the photosynthetic reaction centers, Nature has provided us with
many models to investigate and motivate the design of our own solar devices (Scholes, Fleming,
Olaya-Castro, & van Grondelle, 2011).
Aerobic photosynthesis is the process by which an organism sequesters carbon dioxide
from the atmosphere and fixes it into sugar (Arnon, 1971). This is driven by electrons produced
through the splitting of water molecules by captured photons (Åkerlund, Jansson, & Andersson,
1982). For phototrophs, such as plants, algae and some bacteria, this is the primary mode for
energy production. Heterotrophs consume these so called primary producers as their source of
energy. The waste product of photosynthesis, molecular oxygen, is necessary for sustaining
aerobic life on earth (Dismukes, et al., 2001). Photosynthesis is a global phenomenon, active in
terrestrial and aquatic environments (Antoine, André, & Morel, 1996). Annually, photosynthesis
produces an equivalent of 450 (Pisciotta, Zou, & Baskakov, 2010) TW of energy and over 100
billion tons of biomass.
2.5 billion years ago, ancestral cyanobacteria evolved (Drews, 2011) to utilize water
splitting to drive their biochemistry, after a few millions of years, the waste oxygen produced
reached toxic levels in the atmosphere, leading to a major extinction event, the “Oxygen
2
Catastrophe” (Hsia, Schmitz, Lambertz, Perry, & Maina, 2013), which was responsible for the
death of most anaerobic life on earth.
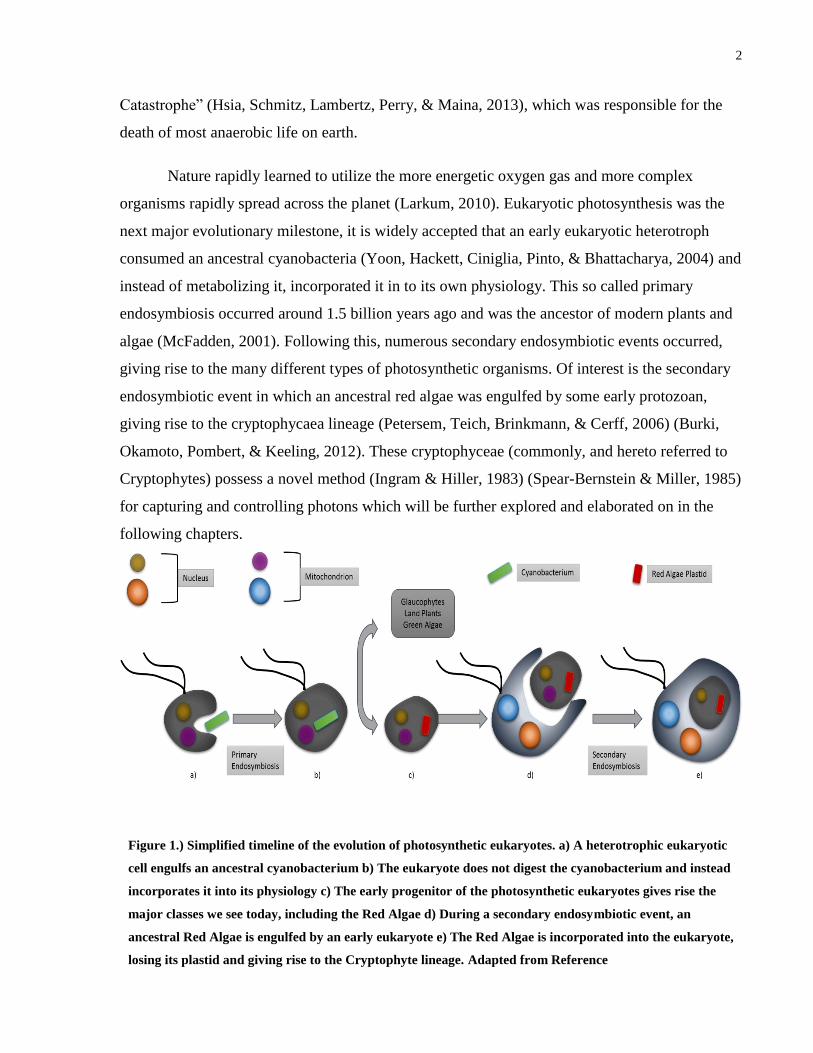
Nature rapidly learned to utilize the more energetic oxygen gas and more complex
organisms rapidly spread across the planet (Larkum, 2010). Eukaryotic photosynthesis was the
next major evolutionary milestone, it is widely accepted that an early eukaryotic heterotroph
consumed an ancestral cyanobacteria (Yoon, Hackett, Ciniglia, Pinto, & Bhattacharya, 2004) and
instead of metabolizing it, incorporated it in to its own physiology. This so called primary
endosymbiosis occurred around 1.5 billion years ago and was the ancestor of modern plants and
algae (McFadden, 2001). Following this, numerous secondary endosymbiotic events occurred,
giving rise to the many different types of photosynthetic organisms. Of interest is the secondary
endosymbiotic event in which an ancestral red algae was engulfed by some early protozoan,
giving rise to the cryptophycaea lineage (Petersem, Teich, Brinkmann, & Cerff, 2006) (Burki,
Okamoto, Pombert, & Keeling, 2012). These cryptophyceae (commonly, and hereto referred to
Cryptophytes) possess a novel method (Ingram & Hiller, 1983) (Spear-Bernstein & Miller, 1985)
for capturing and controlling photons which will be further explored and elaborated on in the
following chapters.
Figure 1.) Simplified timeline of the evolution of photosynthetic eukaryotes. a) A heterotrophic eukaryotic
cell engulfs an ancestral cyanobacterium b) The eukaryote does not digest the cyanobacterium and instead
incorporates it into its physiology c) The early progenitor of the photosynthetic eukaryotes gives rise the
major classes we see today, including the Red Algae d) During a secondary endosymbiotic event, an
ancestral Red Algae is engulfed by an early eukaryote e) The Red Algae is incorporated into the eukaryote,
losing its plastid and giving rise to the Cryptophyte lineage. Adapted from Reference
3
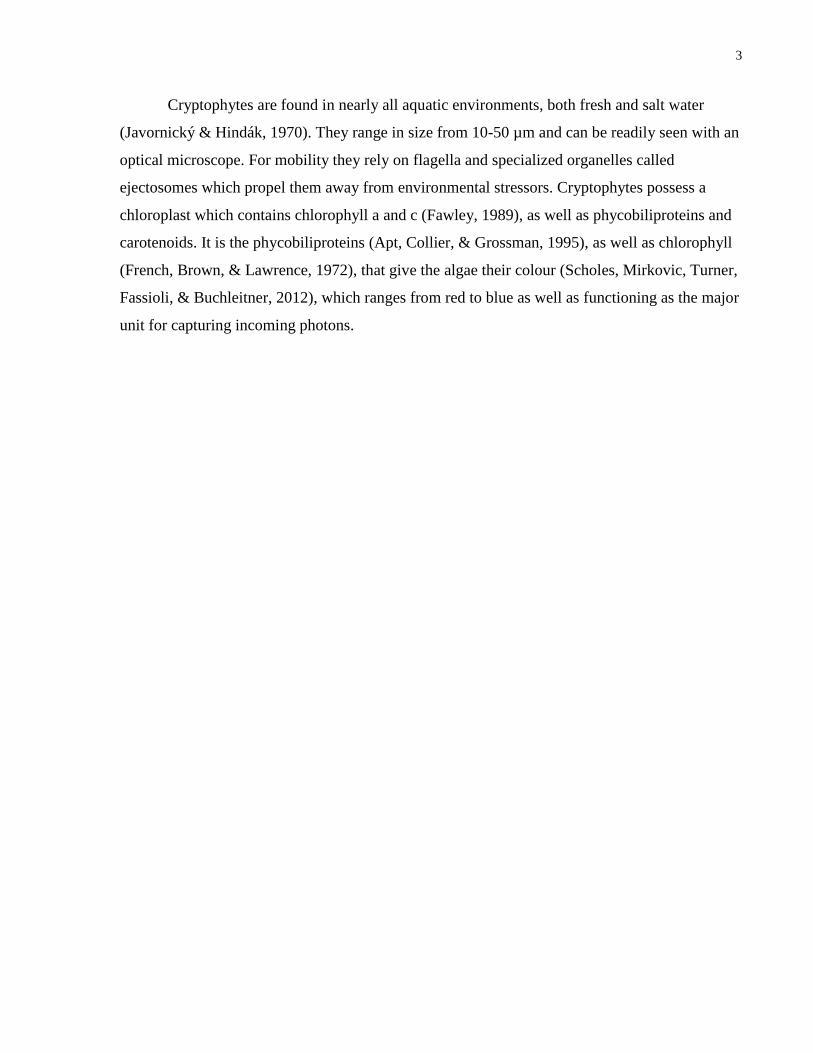
Cryptophytes are found in nearly all aquatic environments, both fresh and salt water
(Javornický & Hindák, 1970). They range in size from 10-50 µm and can be readily seen with an
optical microscope. For mobility they rely on flagella and specialized organelles called
ejectosomes which propel them away from environmental stressors. Cryptophytes possess a
chloroplast which contains chlorophyll a and c (Fawley, 1989), as well as phycobiliproteins and
carotenoids. It is the phycobiliproteins (Apt, Collier, & Grossman, 1995), as well as chlorophyll
(French, Brown, & Lawrence, 1972), that give the algae their colour (Scholes, Mirkovic, Turner,
Fassioli, & Buchleitner, 2012), which ranges from red to blue as well as functioning as the major
unit for capturing incoming photons.
4
1.2 Light Harvesting Architecture
Chromophores and Proteins
The simplest organisms which utilize light energy are the photosynthetic bacteria (Jensen,
Aasmundred, & Eimhjellen, 1964). The nature of the prokaryotic cell does not allow for
complex, specialized organisms in the same way that the eukaryotic cell does. The
photosynthetic proteins are simply embedded in the cell membrane which may or may not be
folded in to the cytosol in sheets, or as free floating vesicles, as a means of increasing the
effective surface area (Bryant & Frigaard, 2006).
Higher plants and algae have a specialized organelle called the chloroplast where
photosynthesis occurs (Cooper, 2000). The chloroplast is a double membrane structure which is
filled with an aqueous fluid known as the stroma. Inside the stroma is where the major
machinery of photosynthesis sits, it contains stacks of flattened disks individually called
thylakoids (Nielsen, Smillie, Hennigsen, & von Wettstein, 1979). The proteins and structure
responsible for photosynthesis are contained within the thylakoid membrane. This includes the
pigments that absorb the light energy, as well as the enzymes and proteins that form the electron
transport chain (Rochaix, 2010), and the pumps that drive the formation of a pH gradient across
the thylakoid membrane which ultimately leads to the formation of ATP (Allen, 2002). The
pigments in the thylakoid (eukaryotes) are often arranged in to large complex structures called a
light harvesting complex (LHC) (McDermott, et al., 1995) (Kiihlbrandt, Wang, & Fujiyoshi,
1994). The LHC acts as an antenna (Horton & Ruban, 2005) and greatly increases the absorption
cross section of the pigments and allows for the efficient collection of photons. The LHC is
spatially and energetically arranged to ensure that the excitations caused by photon capture make
their way rapidly and efficiently to the reaction center (RC). This phenomenon is known as the
antenna effect and will be examined in this study.
5
Photosynthetic organisms utilize a wide variety of pigments not only to collect energy,
but also as a means of photoprotection (Bilger & Björkman, 1990). The specific arrangement and
identity of pigments contained by the organism is largely determined at the species level in
response to the environmental conditions in its habitat. The ratios of these pigments can however
change in response to local ambient conditions.
The predominant pigment found in photosynthetic organisms is chlorophyll. Several
different subtypes of chlorophyll exist in nature but all absorb strongly in the red and blue
regions of the solar spectrum (Krause, 1991). In order to take advantage of the window in the
yellow and green part of the solar spectrum, photosynthetic organisms also employ such
pigments as phycobiliproteins (PBPs) in algae and the carotenoids.
In higher plants and red and green algae, the LHC is a highly organized and complex
structure, bound in the thylakoid membrane. In addition to this, the red algae use a special
arrangement of PBPs called the phycobilisome to supplement their light harvesting (Grossman,
Schaefer, Chiang, & Collier, 1993) (Kursar & Alberte, 1983). Interestingly, the Cryptophyte
lineage seems to have taken a step backwards in complexity, opting to forego the complex
phycobilisome of its red algae ancestors and instead transporting the PBPs to the lumen of the
thylakoid where they are randomly oriented and free floating (Kana, Prásil, & Mullineaux,
2009).
Figure 2.) Schematic of the antenna effect, chromophores far from the reaction center are higher in energy,
chromophores nearer the RC are lower in energy with the RC being the lowest. This ensures that excitations
are funneled in to the RC
6
The Cryptophytes, in addition to their unique spatial arrangement of pigments, have a
combination of pigments not seen in any other photosynthetic lineage (van der Weij-De Wit, et
al., How Energy Funnels from the Phycoerythrin Antenna Complex to Photosystem I and
Photosystem II in Cryptophyte Rhodomonas CS24 Cells, 2006). Phycoerythrin (PE) and
Phycocyanin (PC) are the main light harvesting pigments residing in the thylakoid lumen, they
absorb yellow and green light and range from red to green, and purple to blue in colour (Scholes,
Mirkovic, Turner, Fassioli, & Buchleitner, 2012). A particular species of Cryptophyte will have
either PE or PC but not both. The membrane bound portion of the LHC in Cryptophyte contain
Chlorophyll a/c (CAC) complexes with chlorophyll c2 as the main component. The CAC
complex receives energy as fluorescence emission from the PBP. Also contained within the CAC
complex is the carotenoid alloxanthin. The exact function of alloxanthin is not precisely known
but it is likely that it acts as a photo protective pigment much like the carotenes of higher plants.
The CAC complex then passes excitations on to Photosystem I and II (PSI/PSII) where the
excitation is converted into a charge separated pair which is passed off through the ETC in a
series of oxidation-reduction reactions.
Photochemical Quenching
In the context of this manuscript, Photochemical Quenching (PQ) broadly refers to the
fate of the photo induced excitation once it reaches one of the photosystem RCs. This process is
Figure 3.) The top right is a cartoon depiction of the complex arrangement of phycobiliproteins in the red
algae phycobilisome. The bottom shows the disorganized arrangement of the Cryptophyte antenna.

7
outlined in the so called ‘Z-Scheme”, where an electron starting at PSII is shuttled through a
series of proteins and charge carriers including Plastoquinone (PlQ), cytochrome b6f,
Plastocyanin (PlC), PSI and terminating at ferredoxin where it drives the formation of NADPH
from NADP (Stirbet & Govindjee, 2011).
In addition to producing ATP and NADPH, oxygenic photosynthesis produces protons
which establish a chemiosmotic gradient which is used to power the conversion of ADP to ATP
by ATP Synthase. Maximal production of ATP is achieved when PQ is the main sink for
excitations, however there are two other major pathways that compete with PQ which do not
result in the formation of ATP. It is worthwhile to note that while producing as much ATP as
possible is crucial to the growth and reproduction of the organism, it is often advantageous to the
organism to operate at a submaximal rate as this provides it with the capability to buffer changes
in the environment that might otherwise prove fatal.
The net production from the Z-Scheme or oxygenic photosynthesis is
2𝐻2𝑂 + 2𝑁𝐴𝐷𝑃+ + 3𝐴𝐷𝑃 + 3𝑃𝑖 → 𝑂2 + 2𝑁𝐴𝐷𝑃𝐻 + 3𝐴𝑇𝑃 + 2𝐻+
Figure 4.) Z-Scheme of Photosynthesis. Light is collected by the photosystem antenna system (Green circles)
and funneled to the reaction center. PSII now in an excited state rapidly undergoes charges separation,
passing off an electron to a series of membrane bound proteins which include pheophytin (Pheo) and a one
and two electron accepting plastoquinone (QA and QB). These electrons are picked up by a mobile
plastoquinone (PlQ) which shuttles the charges to the Iron-Sulphur containing cytochrome complex. Finally
the electrons are brought to PSI via the mobile plastocyanin molecule. Absorbing a second photon in PSI the
electrons are again charge separated and passed off to A0 and A1 which are a specialized chlorophyll, and
vitamin K1 respectively. Finally the electrons are passed through three iron-sulphur centers, Fx, FA, and FB
and lastly on to Ferredoxin (Fd) where they are used to convert two NADP+ to two NADPH.
8
Other Dissipative Pathways
In addition to PQ we introduce the idea of non-photochemical quenching (NPQ) which
manifests itself in two basic ways. NPQ broadly refers to any quenching of a photo induced
excitation which does not lead to inclusion in the ETC. Here NPQ will be considered to be either
radiative quenching (qR) or dissipative quenching (qH) (Govindjee, 1995).
Radiative quenching is any fluorescence event after absorption of a photon. There are a
number of steps in excitation transfer where this can occur. In Cryptophytes, fluorescence is
mostly observed from the PBP and from PSII with some contribution from PSI.
Dissipative quenching is the conversion of an excitation to heat energy, in the context of
a photo protective mechanism (Muller, Li, & Niyogi, 2001). The exact nature of this in
Cryptophytes is not currently known. In higher plants, qH is mediated by the carotenoids.
9
1.3 Spectroscopy
In this study of the Cryptophytes, basic steady-state spectroscopy will be used to
determine the parameters used for quantifying the energy transfer efficiency and excitation
pathways in the Cryptophyte LHC. While many sophisticated methods have been used to study
in detail, elements of the Cryptophyte LHC (Doust, et al., 2004) (Curutchet, et al., 2013) (van der
Weij-De Wit, et al., How Energy Funnels from the Phycoerythrin Antenna Complex to
Photosystem I and Photosystem II in Cryptophyte Rhodomonas CS24 Cells, 2006), these more
straightforward methods will be more useful to a global investigation.
Linear Absorption
Linear absorption is a measure the degree that a material absorbs an incident beam of
light. The absorption of a chemical species in solution can be calculated using the Beer-Lambert
law
𝐴 = − log10 (𝐼0𝐼) 𝜀𝑙𝑐
Where I0 and I are the intensity of the incident and transmitted light respectively. ε is the molar
absorptivity, l is the path length of the sample and c is the concentration of the sample. The
molar absorptivity is wavelength dependent and unique to each chemical present. Thus the total
absorption of a material at a given wavelength is, to first order, a linear combination of the
absorption of each chemical species contained within the sample. Absorption spectroscopy will
be used to map out the energy landscape of the Cryptophyte chromophores as a first step to
determining how they function as a cohesive unit. It will also be used to estimate the relative
amount of each chromophore in a sample of algae.
Fluorescence
When a molecule becomes excited, it can relax back to its ground state in a number of
ways. It often accomplishes this by emission of a photon some short time after excitation.
Fluorescence occurs from the first singlet excited state. If a molecule is excited to the second
excited state, it will typically vibrationally relax to the first excited state before fluorescing. The
emitted photon is red shifted relative to where it was absorbed, thus the fluorescence emission
10
spectrum will be reminiscent of the absorption spectrum. Fluorescence can be measured in two
ways, we can measure the emission spectrum by exciting the sample at a specific wavelength and
then monitor the intensity of the emissions at longer wavelengths. Fluorescence emission can be
used to infer the presence of energy transfer between two chromophores. Fluorescence from a
second chromophore after excitation of an initial chromophore indicates that energy transfer has
occurred between the two.
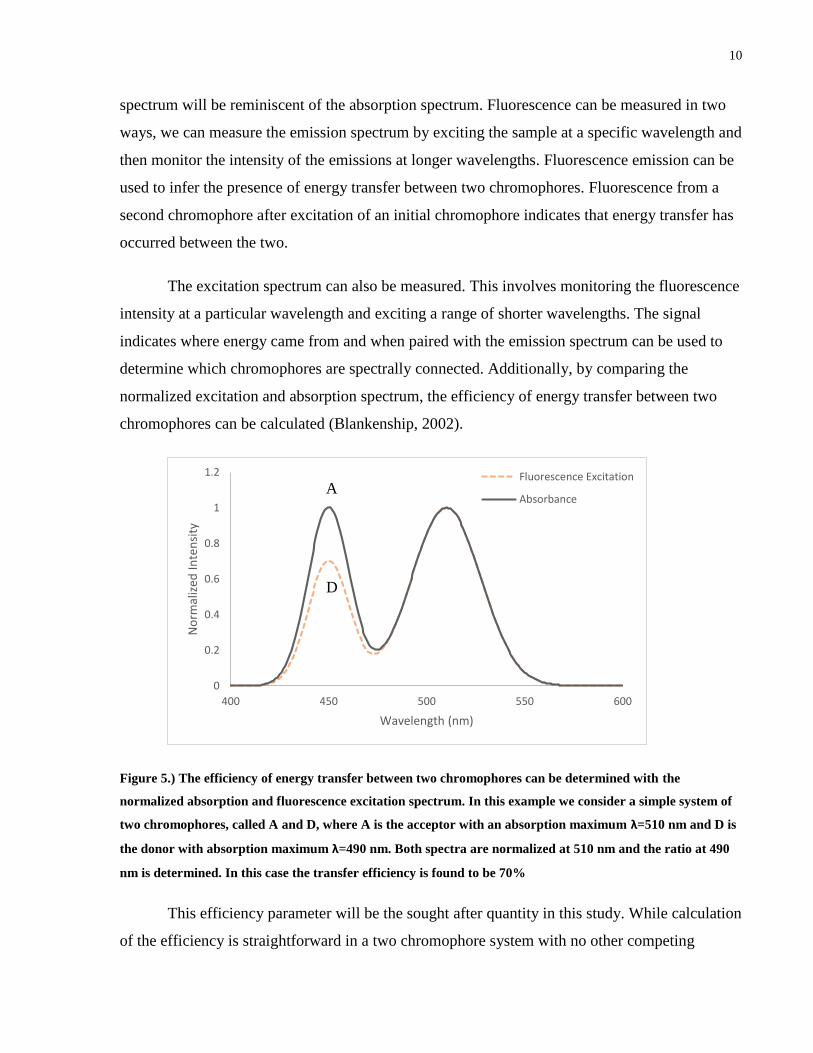
The excitation spectrum can also be measured. This involves monitoring the fluorescence
intensity at a particular wavelength and exciting a range of shorter wavelengths. The signal
indicates where energy came from and when paired with the emission spectrum can be used to
determine which chromophores are spectrally connected. Additionally, by comparing the
normalized excitation and absorption spectrum, the efficiency of energy transfer between two
chromophores can be calculated (Blankenship, 2002).
Figure 5.) The efficiency of energy transfer between two chromophores can be determined with the
normalized absorption and fluorescence excitation spectrum. In this example we consider a simple system of
two chromophores, called A and D, where A is the acceptor with an absorption maximum λ=510 nm and D is
the donor with absorption maximum λ=490 nm. Both spectra are normalized at 510 nm and the ratio at 490
nm is determined. In this case the transfer efficiency is found to be 70%
This efficiency parameter will be the sought after quantity in this study. While calculation
of the efficiency is straightforward in a two chromophore system with no other competing
0
0.2
0.4
0.6
0.8
1
1.2
400 450 500 550 600
No
rmal
ized
Inte
nsi
ty
Wavelength (nm)
Fluorescence Excitation
AbsorbanceA
D

11
dissipation pathways, the analysis rapidly becomes intractable in a system with multiple
chromophores with significant spectral overlap and with numerous transfer and dissipation
pathways.
12
Chapter 2
Energy Transfer under Standard Conditions
2.1 Methods and Introduction
The light harvesting structures employed by the Cryptophytes shows a novel design with
a compliment of chromophores found nowhere else in nature. We are interested in knowing how
efficient the Cryptophyte light harvesting complex is and how robust it is to changes in
environmental conditions. Originally, four species of Cryptophyte, varying in phycobiliproteins
compositions were investigated for periods of two to three weeks in order to determine the effect
that aging of the algal colony had on the composition and efficiency of the Cryptophyte LHC.
The four species investigated were Proteomonas Sulcata (PE545), Rhodomonas Minutae
(PE545), Hemiselmis Pacifica (PC577), and Chroomonas Mesostigmatica (PC645). Only P.
Sulcata will be reported here as it was the only species that was investigated in all three
experiments. The spectra of the other species were considered to be too convoluted due to
overlap of multiple chromophores to be of use to this study.
Algal colonies were grown in Erlenmeyer flasks and kept on a 12 hour day-night cycle.
The closed nature of the flask meant that the colony would eventually perish due to nutrient
deficiency and exposure to toxic metabolic and life cycle byproducts. The flasks were kept at a
constant distance from their light source to ensure consistent illumination. An additional colony
of P.Sulcata was grown at a much closer distance to the light source to simulate a high light
stress environment. Measurements were performed every 2 to 3 days during the lifetime of the
colony in order to follow changes in photosynthetic behavior through exponential growth and
eventually death. Measurement consisted of linear, steady state absorption in the visible region,
and fluorescence emission and excitation. Fluorescence targets were identified by matching
peaks in the absorption spectrum to chromophores previous identified in the Cryptophyte.
Absorbance measurements were performed on a Varian Cary 6000i UV-Vis-
NIRspectrophotometer and fluorescence measurements were performed on Cary Eclipse
Fluorometer. This method was devised by Dr. Tihana Mirkovic and Laura Campitelli in an
13
earlier initial study of the Cryptophytes. Of the five species outlined above P. Sulcata and R.
Minutae were selected for initial study because of their lesser spectral overlap between their
PBPs and photosystems. Dr. Mirkovic also provided a great service in maintaining the algae
colonies for this experiment as well as assisting in collecting the spectra shown in this chapter.
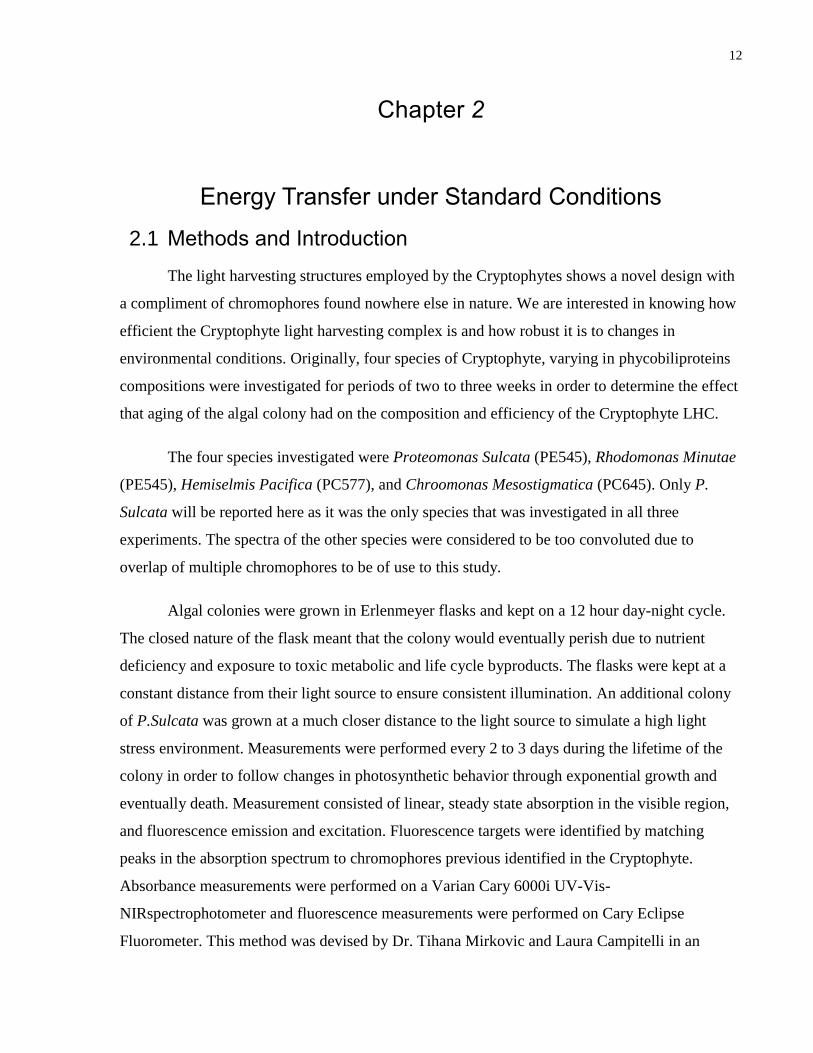
2.2 Spectroscopic Investigation under Normal Conditions
The first part of the experiment sought to determine the light harvesting and transfer
efficiency of the algal species under ‘normal’ conditions to set a baseline for the future
experiments. This was meant intended as a breadth study to see what common trends could be
identified in all species. Due to the congested absorbance profile of the PC containing species,
attention was initially given to the two PE containing species as well as the high light P.Sulcata.
Figure 6.) Normalized absorption spectra of H. Pacifica and P. Sulcata, containing PC and PE respectively.
The major contributors to the absorbance profile are: chlorophyll a S2 (440nm), chlorophyll c2 S2 (470 nm),
alloxanthin (490 nm), phycoerythrin (545-555 nm), phycoerythrin (575-625 nm), chlorophyll c2 S1 (630 nm),
and chlorophyll a S1 (680 nm). Overlap of PC and ChlA /C complicates the energy transfer efficiency
calculations.
0
0.2
0.4
0.6
0.8
1
1.2
1.4
1.6
400 450 500 550 600 650 700 750 800
No
rmal
ized
Ab
sorb
ance
Inte
nsi
ty
Wavelength (nm)
Chart Title
H. Pacifica
P. Sulcata
R. Minutae
C. Mesostigmatica
P. Sulcata h
Chlorophyll
Carotenoids
Phycobiliproteins
Chlorophyll
Reaction Center
14
Absorbance Spectroscopy
0.00
0.20
0.40
0.60
0.80
1.00
1.20
1.40
1.60
400 450 500 550 600 650 700 750 800
No
rmal
ized
Ab
sorb
ance
Wavelength (nm)
P. Sulcata Absorbance Spectrum Normalized at 677 nm
D2
D4
D7
D9
D11
D14
D16
D23
0.00
0.50
1.00
1.50
400 450 500 550 600 650 700 750 800
No
rmal
ized
Ab
sorb
ance
Wavelength (nm)
R. Minutae Absorbance Spectrum Normalized at 677 nm
D2
D4
D7
D9
D15
D17
D21
D23
0.00
0.50
1.00
1.50
2.00
400 450 500 550 600 650 700 750 800
No
rmal
ized
Ab
sorb
ance
Wavelength (nm)
P. Sulcata High Light Absorbance Spectrum Normalized at 677 nm
D2
D4
D7
D9
D15
D17
D21
Figure 7.) The three graphs above show how the absorbance profile of each algal species changes
over the lifetime of the colony. In all three, there is a large variation in the absorbance between 400
and 600 nm and a large decrease in PE545. The relative amounts of ChlA to ChlC remain more or
less constant.
15
PE545 acts as an antenna for incoming photons and so it would seem that it is in the
organisms’ best interest to have as much as possible in order to maximize photon capture. It is
clear from the above graphs that P. Sulcata, after a short amount of time, opts to produce less
antenna per reaction center. The effect that this has on the transfer efficiency will be investigated
in the next sections.
Fluorescence Spectroscopy
With the major chromophore targets identified, we can now, with fluorescence
measurements, begin to determine how the chromophores are spectrally linked. If excitation of
one chromophore leads to fluorescence emission from one or more other chromophores then we
can deduce that there is some degree of energy transfer between the two. Energy transfer requires
an overlap between the emission spectrum of the first chromophore and the absorption spectrum
of the next. 705, 705h and 344 were excited at 440 nm (ChlA), 490 nm (carotenoids) and 530 nm
(PE).
0.40
0.60
0.80
1.00
1.20
1.40
0 5 10 15 20 25 30
PE5
45
Rat
io
Day
Comparison of PE545-ChlA Ratio in P. Sulcata and R. Minutae During Colony Lifetime
705-1
705-2
705-3
344-1
344-2
705h-1
705h-2
705h-3
Figure 8.) By plotting the relative amount of PE545 (545 nm) to ChlA (677 nm) we can see how the
pigment composition changes over time. 705 maintains a consistent ratio until around Day 15
where it then begins to drop. 344 appears to not lose PE545 over the duration of the study. 705h
declines rapidly with a significant drop after Day 9. The loss of PE545 is visible to the eye, as the
colony ages, the colour fades from deep red to a pale yellow.
16
The spectra were taken using different excitation and emission slit widths each day so
direct comparison of the absolute changes in spectra is not possible here, instead we are
comparing the changes in peak height with the spectra normalized at 685 nm. This will be
Figure 9.) Fluorescence emission spectra from 705, 705h and 344 (top to bottom). Excitation wavelengths at
440, 490 and 530 nm (left to right).
D2
D4
D7
D9
D11
D14
D16
D23
0
0.5
1
1.5
2
2.5
3
540 630 720
Flu
ore
scen
ce I
nte
nsi
ty
Wavelength (nm)
705 - 530 nm Emission Spectrum
0
0.2
0.4
0.6
0.8
1
1.2
450 540 630 720
Flu
ore
sen
ce I
nte
nsi
ty
Wavelengh (nm)
705 - 440 nm Emission Spectrum
0
0.2
0.4
0.6
0.8
1
1.2
500 590 680 770
Flu
ore
scen
ce I
nte
nsi
tyWavelength (nm)
705 - 490 nm Emission Spectrum
D2
D4
D7
D9
D15
D17
D21
D23
0
0.2
0.4
0.6
0.8
1
1.2
450 540 630 720
Flu
ore
sen
ce I
nte
nsi
ty
Wavelength (nm)
705h - 440 nm Emission Spectrum
0
0.2
0.4
0.6
0.8
1
1.2
500 590 680 770
Flu
ore
sen
ce I
nte
nsi
ty
Wavelength (nm)
705h - 490 nm Emission Spectrum
0
1
2
3
4
540 630 720Fl
uo
rese
nce
In
ten
sity
Wavelength (nm)
705h - 530 nm Emission Spectrum
0
0.2
0.4
0.6
0.8
1
1.2
500 590 680 770
Flu
ore
sen
ce I
nte
nsi
ty
Wavelength (nm)
344 - 490 nm Emission Spectrum
0
0.2
0.4
0.6
0.8
1
1.2
450 540 630 720
Flu
ore
sen
ce I
nte
nsi
ty
Wavelength (nm)
344 - 440 nm Emission Spectrum
D2
D4
D7
D9
D15
D17
D21
D23
0
0.5
1
1.5
540 630 720
Flu
ore
sen
ce I
nte
nsi
ty
Wavelength (nm)
344 - 530 nm Emission Spectrum
17
addressed in Chapter 3. Each of the PE545 containing species show similar trends in there
emission spectrum. Deviations from the general trends on D2, D4, and D21, D23 are attributed
to low algae concentration and presence of cellular debris respectively.
Excitation at 440 nm corresponds to exciting the s2 band of ChlA. The excited ChlA
rapidly converts to the s1 excited state (677 nm) where it is then fluoresced by PSII (685 nm) and
PSI (740 nm). The ratio of the fluorescence emission from PSII and PSI is very consistent over
the lifetime of the algal colony and between the three species at approximately 16-18%. This
suggests that the relative quantities and spatial relationships between PSII and PSI are fixed over
the lifetime of the colony. The small emission peaks at 530 and 590 nm are likely artefacts of
exciting the blue edge of the carotenoids and PE545.
Excitation at 490 nm corresponds, broadly, to the carotenoids present in that region,
particularly alloxanthin. Despite the three major emission bands that appear, it is thought that the
fluorescence contribution from the carotenoids is minimal as they are expected to vibrationally
relax to the ground state, thus emitting no photon. The large fluorescence emission at 590 nm is
from PE545, which has a broad absorption peak which overlaps with carotenoids. Emission at
PSII and PSI arises from the excited PE545 transferring energy to the Chlorophyll a/c complex.
The difference in the maximum peak height and rate of decay between the three species at 590
nm correlates with the relative amount of PE545 as measured by absorption spectroscopy.
Direct excitation of the PE545 at 530 nm produces a much larger emission band at 590
nm as well the expected emission at 685 and 740 nm. Despite having a similar PE545/ChlA
ratio, 705 and 705h show a considerable difference in the maximum and minimum height of the
590 nm band, with 705h having both a greater maximum and a smaller minimum. If the relative
amount of PE545 is the same, then increased emission at 590 nm may be interpreted as a greater
fluorescence leakage from the PE545, that is, a greater proportion of the photons absorbed by the
PE545 do not make it to the CAC complex. The rapid decrease in emission by 705h again can be
rationalized by the loss of PE545 as per absorption measurements.
18
0
0.2
0.4
0.6
0.8
1
1.2
1.4
1.6
400 500 600
Flu
ore
scen
ce I
nte
nsi
ty
Wavelength (nm)
705 - PSII Excitation Spectrum
D7
D9
D15
D17
D21
D23
D25
0
0.5
1
1.5
2
400 500 600
Flu
ore
scen
ce I
nte
nsi
ty
Wavelength (nm)
705 - PSI Excitation Spectrum
D2
D4
D7
D9
D15
D17
D21
D23
0
0.2
0.4
0.6
0.8
1
1.2
1.4
1.6
400 500 600
Flu
ore
scen
ce I
nte
nsi
ty
Wavelength (nm)
344 - PSII Excitation Spectrum
D2
D4
D7
D9
D15
D17
D21
D23
0
0.5
1
1.5
2
400 500 600
Flu
ore
scen
ce I
nte
nsi
ty
Wavelength (nm)
344 - PSI Excitation Spectrum
D2
D4
D7
D9
D15
D17
D21
D23
0
0.2
0.4
0.6
0.8
1
1.2
1.4
400 500 600
Flu
ore
scen
ce I
nte
nsi
ty
Wavelength (nm)
705h - PSII Excitation Spectrum
D7
D9
D15
D17
D21
D230
0.2
0.4
0.6
0.8
1
1.2
1.4
1.6
1.8
400 500 600
Flu
ore
scen
ce I
nte
nsi
ty
Wavelength (nm)
705h - PSI Excitation Spectrum
D2
D4
D7
D9
D15
D17
D21
D23
Figure 10.) Fluorescence emission spectra from 705, 705h and 344 (top to bottom). Emission wavelengths at
685 and 730 nm (left to right)
19
By measuring the excitation spectrum at the emission peaks of PSII (685 nm) and PSI
(730 nm), we can read off where each photosystem receives its energy from, however, this does
not tell us the exact nature of the path the excitation takes. Because the excitation spectra are
normalized at 677 nm, there are some cases where the 685 nm excitation spectra are unreliable
due to the excitation beam being convoluted with the signal at 677 nm. This was remedied in
future experiments by monitoring the PSII excitation spectrum at 695 nm.
For both PSII and PSI, 705 shows a constant excitation signal from the S2 chlorophyll
region (440 nm) as well as from the CAC complex over the colony lifetime. We expect these
regions to have very little variation since they arise from the same chlorophylls that make up the
photosystems and CAC complexes. The signal from the PE545 region starts at a maximum and
slowly decreases from D7. Measurements from D2 and D4 were compromised due to signal
overlap from the excitation beam.
705h shows a more interesting trend, in both photosystems, the PE545 signal starts at an
intermediate intensity, rises and peaks and then rapidly drops. Again the regions dominated by
the S2 chlorophyll bands and the CAC complex remain relatively consistent.
344 shows a much slower decline in the PE545 region which only begins to manifest
after about 3 weeks. 344 grows at a considerably slower rate than the 705 species and so changes
over time are much less drastic. This will be addressed in the second iteration of this experiment.
In all cases, the excitation signal from the PE545 is slightly higher in the PSI spectrum
than the PSII spectrum. This may be a results of the structure of the thylakoid membrane and
organization of the photosystems. PSII is blocked on the luminal side of the membrane by the
OEC and accessory proteins which screens the RC from direct energy transfer from the PBP
pool. PSI on the other hand is not blocked to the same degree as PSII and thus has more direct
access to energy transfer. An excitation must first be transferred to a CAC complex in the
thylakoid membrane before it can be transferred to PSII.
Donor Acceptor Abs D Fluor D Energy
Transfer
𝜀 =𝐼𝜆𝑚𝑎𝑥𝐷𝑒𝑥𝑐
𝐼𝜆𝑚𝑎𝑥𝐴𝑎𝑏𝑠
Figure 11.) Calculation of energy transfer efficiency. IλmaxDexc is the Donor fluorescence excitation at
the absorption maxima of the donor. IλmaxAabs is the acceptor absorption spectrum normalized at the
Acceptor absorption maxima.
20
0
0.2
0.4
0.6
0.8
1
1.2
1.4
1.6
400 450 500 550 600 650No
rmal
ize
d A
bso
rban
ce In
ten
sity
Wavelength (nm)
705 - PE545 to PSII Transfer Efficiency
D7-em685
D9-em685
D15-em685
D17-em685
D21-em685
D23-em685
D25-em685
D7-abs
D9-abs
D15-abs
D17-abs
D21-abs
D23-abs
D25-abs
0
0.5
1
1.5
2
400 450 500 550 600 650
No
rmal
ized
Ab
sorb
ance
Inte
nsi
ty
Wavelength (nm)
705 - PE545 to PSI Transfer EfficiencyD2-em730D4-em730D7-em730D9-em730D15-em730D17-em730D21-em730D23-em730D25-em730D2-absD4-absD7-absD9-absD15-absD17-absD21-absD23-absD25-abs
0
0.2
0.4
0.6
0.8
1
1.2
1.4
1.6
1.8
0 5 10 15 20 25
Ph
oto
syst
em T
ran
sfer
Eff
icie
ncy
Day
705 - Effect of Colony Age on Photosystem Transfer Effiency
PSII
PSI
Figure 12.) Transfer efficiency from the PBP antenna to PSII and PSI for P. Sulcata. Efficiencies above
100% are physically unrealistic and arise from the simple two chromophore, single transfer step model.
21
0
0.5
1
1.5
2
400 450 500 550 600 650
No
rmal
ized
Ab
sorb
ance
Inte
nsi
ty
Wavelength (nm)
705h - PE545 to PSII Transfer Efficiency
D7-em685
D9-em685
D15-em685
D17-em685
D21-em685
D23-em685
D2-abs
D9-abs
D15-abs
D17-abs
D21-abs
D23-abs
0
0.5
1
1.5
2
400 450 500 550 600 650
No
rmal
ized
Ab
sorb
ance
Inte
nsi
ty
Wavelength (nm)
705h - PE545 to PSI Transfer Efficiency
D2-em730D4-em730D7-em730D9-em730D15-em730D17-em730D21-em730D23-em730D2-absD4-absD7-absD9-absD15-absD17-absD21-absD23-abs
Figure 13.) Transfer efficiency from the PBP antenna to PSII and PSI for High Light P. Sulcata.
Efficiencies above 100% are physically unrealistic and arise from the simple two chromophore, single
transfer step model.
0
0.5
1
1.5
2
2.5
3
0 5 10 15 20 25Ph
oto
syst
em T
ran
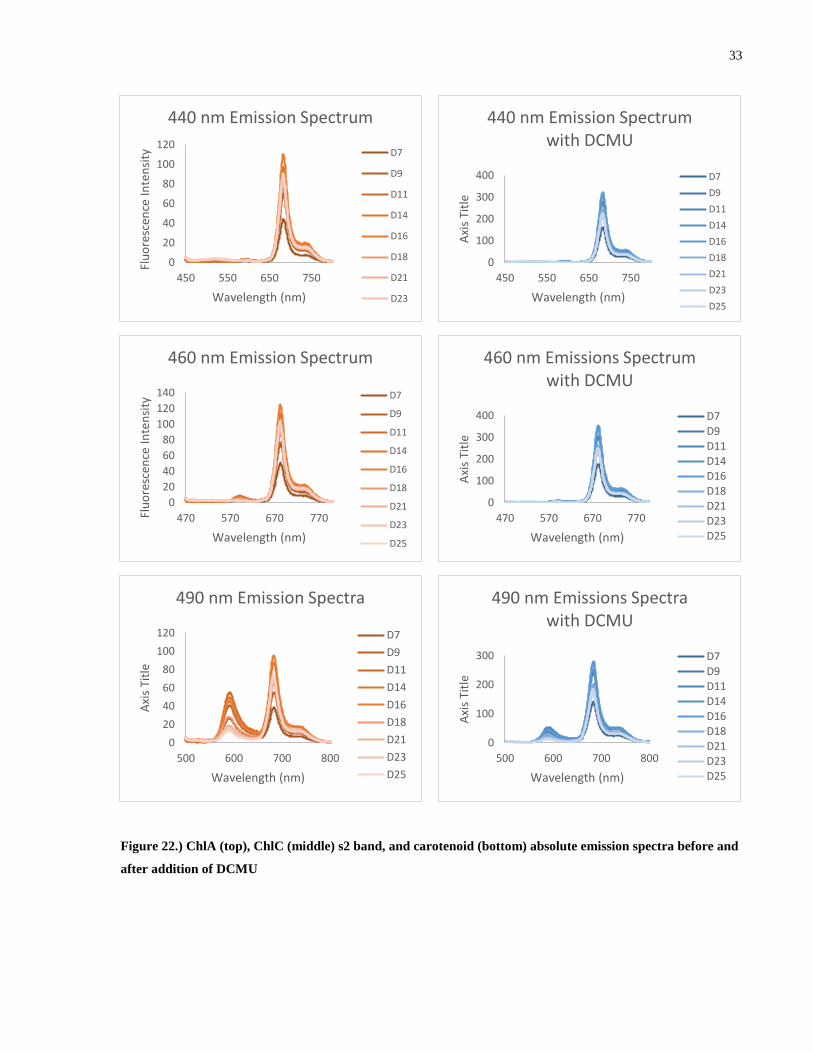
sfer
Eff
icie
ncy
Day
705h - Effect of Colony Age on Photosystem Transfer Effiency
PSII
PSI
22
0
0.2
0.4
0.6
0.8
1
1.2
1.4
1.6
400 450 500 550 600 650
No
rmal
ized
Ab
sorb
ance
Inte
nsi
ty
Wavelength (nm)
344 - PE545 to PSII Transfer Efficiency D2-em685D4-em685D7-em685D9-em685D15-em685D17-em685D21-em685D23-em685D25-em685D2-absD4-absD7-absD9-absD15-absD17-absD21-absD23-absD25-abs
0
0.2
0.4
0.6
0.8
1
1.2
1.4
1.6
1.8
2
400 450 500 550 600 650
No
rmal
ized
Ab
sorb
ance
Inte
nsi
ty
Wavelength (nm)
344 - PE545 to PSI Transfer Efficiency D2-em730D4-em730D7-em730D9-em730D15-em730D17-em730D21-em730D23-em730D25-em730D2-absD4-absD7-absD9-absD15-absD17-absD21-absD23-absD25-abs
0
0.2
0.4
0.6
0.8
1
1.2
1.4
1.6
1.8
2
0 5 10 15 20 25Ph
oto
syst
em T
ran
sfer
Eff
icie
ncy
Day
344 - Effect of Colony Age on Photosystem Transfer Effiency
PSII
PSI
Figure 14.) Transfer efficiency from the PBP antenna to PSII and PSI for R. Minutae. Efficiencies above
100% are physically unrealistic and arise from the simple two chromophore, single transfer step model.
23
Determining the efficiency of energy transfer from the excited PE545 pool to PSII and
PSI as originally outlined in chapter 1.3.2 yields the above results. The energy transfer efficiency
we are discussing is the amount of photons that have been absorbed by the phycobiliproteins and
then fluoresced and absorbed by the photosystems. Of immediate notice is that the calculated
transfer efficiency is greater than 100% in all species and for both photosystems. Since this is
unphysical, we conclude that this method of analysis is inappropriate for this system. It is
important to reiterate that this method is effective when contributions from other transfer
pathways or dissipation mechanisms are negligible compared to the pathway of interest. Given
the convoluted nature of the light harvesting complex of the Cryptophyte, it is not surprising that
this simplistic treatment fails to capture the transfer efficiency. This will be addressed in the
preceding chapters.
While this treatment does not allow comparison of absolute numbers, comparison of
relative values is still possible within a species. 705 and 705h both show a very constant
efficiency despite a large variation in the relative amount of PE545 to ChlA. The transfer
efficiency in 344 appears to increasing slowly over time. From this we can conclude that all three
species, despite a large variation in the relative amount of PE545 to ChlA are able to provide a
consistent amount of energy to both photosystems, thus, a portion of the luminal PE545 is
redundant in transferring energy to the photosystems. PSI apparently enjoys a slightly more
efficient transfer from PE545 than PSII. Commenting on which photosystem receives more
energy from the PE545 is not possible at this stage as it depends on many biological and physical
factors although we can note that PSII is shielded from direct irradiation from the lumen by the
optically inactive proteins of the Oxygen Evolving Complex and so it must receive energy
through a CAC complex intermediate. PSI has direct line of sight to the thylakoid lumen and so
can receive incoming radiation directly.
24
Chapter 3
Contributions of Dissipative Pathways
In order to gain some insight in to how to better calculate the energy transfer efficiency
we make reference back to Chapter 1.2.3 in order to determine how alternate transfer pathways
and dissipation mechanisms affect the transfer of energy from the PBP pool in the thylakoid
lumen to the RC.
Initially we considered a highly simplified model where we only took in to account
transfer from an antenna (PBP) to the reaction center of either photosystem. The reality is of
course more complicated and requires acknowledgment that the antenna complex and the
reaction center have an internal structure that alter the simple donor and acceptor model. The full
complexity model is based on the measurements performed in chapter 2 (Strasser, Tsimilli-
Michael, & Srivastava, 2004).
Figure 15.) Full complexity model of energy transfer in the Cryptophyte. J545 and J677 are the 545 and 677 nm
photon flux. PEL and PEM are the luminal and membrane associated PE. JLF is fluorescence from luminal PE.
ELM is transfer between PEL and PEM. EM(I) is energy transfer from the PEM to PSI. NPQCH and JCF are NPQ
and fluorescence from the CAC complex. EC(I) and EC(II) are energy transfer from the CAC complex to PSI and
PSII. J(II)F and J(I)F are fluorescence from PSII and PSI. E(II)(I) is energy transfer from PSII to PSI. E(II)PQ and
E(I)PQ are energy transfer via charge separation from PSII and PSI.
25
In coming up with the above map we begin by considering first the thylakoid lumen, the
location of the antenna, the PBPs can be subdivided in to two groups. The first is what will be
called the membrane associated PBPs, these are the ones in close proximity to the thylakoid
membrane and hence, close to the CAC complex and photosystems. The second group is luminal
PBPs, these are farther out from the membrane and have no line of sight with it. If we consider a
membrane associated PBP, fluorescence can be readily absorbed by the adjacent CAC complex,
a LPBP however is screened on all sides by other PBPs and so fluorescence from a luminal PBP
is less likely to contribute to energy transfer ending in a PS. From these results we hypothesize
that while every phycobiliprotein in the thylakoid lumen is capable of absorbing an incoming
photon, they do not have equal probabilities of transferring that excitation to a photosystem. The
excitation may hop from PBP to PBP until it reaches its destination but generally the probability
decreases as distance, and therefore number of intermediate hops, from the thylakoid membrane
increases.
Examining the absorption and emission spectra of the PBPs, there is non negligible
overlap in some regions, this leads to the possibility of a PBP emitting a photon, only to be
absorbed by a second PBP. The emission spectra of the PBPs are also of interest. Taking PE545
as an example, the major emission peak is at 590 nm, there is a minor peak centered around 630
nm. The absorption maximum of ChlC is at 630 nm.
0
0.2
0.4
0.6
0.8
1
1.2
1.4
400 450 500 550 600 650 700 750 800
No
rmal
ized
Inte
nsi
ty
Wavelength (nm)
Overlap of PE545 annd 705 Absorption Spectrum
PE545 EmissionSpectrum
705 AbsorptionSpectrum
Figure 16.) Showing the overlap between PE545 and the absorption spectrum of 705, we can see that despite
the high fluorescence yield of PE545, only a small portion of it is of the appropriate wavelength to transfer
energy to the CAC complex or the photosystems.
26
The CAC complex (Kereïche, et al., 2008) as its name suggests is composed of ChlA and
ChlC, with a larger amount of the latter (Larkum, 2010). ChlA is red shifted compared to ChlC
so in following the energy gradient towards the RC, it will encounter ChlC first. There is very
little fluorescence emission from ChlC and so the transfer from ChlC to ChlA is considered
lossless. The CAC is also thought to be the major site of NPQ in the Cryptophyte (Kaňa,
Kotabová, Sobotka, & Prášil, 2012). It is thought to be pH dependent and likely involves some
participation from carotenoids within the CAC complex. While the exact process is not known, it
is known that it does not involve cycling of carotenoids as in higher plants and other
photosynthetic algae, indicating a novel NPQ scheme. ChlA has an emission maximum around
680 which is overlaps strongly with PSII, there is also a broad shoulder extending out to about
740 nm which overlaps with PSI. The only fluorescence seen on excitation of chlorophyll is at
685 and 740 nm, PSII and PSI respectively, indicating a very efficient transfer of an excitation
from the CAC complex to the photosystems.
Once in the photosystem reaction center, the excitation will either undergo charge
separation and photochemistry will occur, or the excitation will be emitted as fluorescence. The
excitation may also be thermally dissipated.
This chapter will deal with the attempts at shutting down the pathways that provide
alternate fates for an absorbed photon in order to maximize the fluorescence emission from the
photosystems. By doing this we can begin to address the failings of our simple transfer model by
allowing for other dissipative pathways and begin to quantify their effect. Firstly, an attempt will
be made to minimize the effects of NPQ, secondly, an attempt will be made to shut down
primary photochemistry at PSII and PSI.

27
3.1 Non Photochemical Quenching
Non Photochemical Quenching occurs as a response to high light conditions as a
protective mechanism to dissipate excess excitations that might other damage the organism.
There are several timescales that NPQ works on depending on the organism. In general there is a
rapid quenching that activates within minutes. There is also a long term response that operates on
the timescale of hours. There may also exist a number of intermediate time scale NPQ effects
(Muller, Li, & Niyogi, 2001).
In order to determine the effect of NPQ, the algae were exposed to either high, low,
regular or no light for two hours prior to measurement at the beginning of their day. Two hours
was deemed sufficient time for any NPQ effects to manifest, the measurements were performed
at the beginning of the day in order to minimize normal physiological changes that occur over
the course of the day.
D corresponds to no light, R corresponds to regular light (10 μmol m−2 s−1) and serves as
the control. L and H are low (2 μmol m−2 s−1) and high light (30 μmol m−2 s−1), corresponding to
about a one order of magnitude decrease and increase in ambient light intensity. There is some
additional complication in determining the transfer efficiency in H. Pacifica and C.
Mesostigmatica (not shown) due to the high overlap of their phycobiliproteins and the CAC
complex. More sophisticated methods will be required to determine the absolute transfer
efficiency in the PC containing species.
Figure 17.) Transfer efficiency from the PBP antenna to PSII and PSI.
1
1.5
2
0 10 20 30
Tran
sfer
Eff
icie
ny
Day
P. Sulcata PSI Transfer Efficiency
PSI-D PSI-L PSI-R PSI-H
1
1.5
2
2.5
0 10 20 30
Tran
sfer
Eff
icie
ny
Day
P. Sulcata PSII Transfer Efficiency
PSII-D PSII-L PSII-R PSII-H
28
The dark adapted sample generally showed a slightly higher transfer efficiency to both
photosystems over the course of the experiment. The low light sample also appeared to be
slightly more efficient for the first two weeks at which point it was similar to the regular and
high light samples. The regular and high light samples were more or less equal over the course of
the four weeks. It is likely that the high light conditions were not intense enough elicit the full
NPQ response that was sought after. Kaňa et al. Suggest that full recruitment of the NPQ
mechanisms (Kaňa, Kotabová, Sobotka, & Prášil, 2012) occurs around 600 μmol m−2 s−1 whereas
our high light sample was around 30 μmol m−2 s−1. If NPQ had been fully recruited by the algae,
we would expect to measure decreased fluorescence from the PBP peak in the photosystem
excitation spectra since photons that would have otherwise made it to the reaction center are
dissipated as heat and thus, a decreased transfer efficiency.
Despite not being able achieve a high enough photon flux with our setup to estimate the
contributions of NPQ it is still worthwhile to comment on the capability of these organisms to
buffer large changes in ambient light intensity with little loss in their ability to transfer energy
absorbed by their light harvesting antenna to their reaction centers.
3.2 Photochemical Quenching
Chlorophyll fluorescence has been widely used as a tool to study photosynthesis and
plant health via the Kautsky transient for a number of decades. By measuring the minimal and
maximal fluorescence from PSII in a dark adapted plant, as well as the time it takes to reach this
maximum and the fluorescence intensity at a few key points, dozens of parameters can be
calculated that report on many aspects of the workings of the photosystems. Use of certain
pesticides in these type of measurements is also common in order to shut down specific parts of
the ETC in order to gain information about the pathways that compete with photosynthesis.
Use of the Chlorophyll Fluorescence Transient (CFT) was developed for the study of
higher plants and relies on a number of assumptions in the calculation of its parameters that
make it unreliable in analyzing anything other than higher plants. One of these assumptions is
that the organism does not contain PBPs (Stirbet & Govindjee, 2011). This immediately
disqualifies the Cryptophytes from dependable analysis with this method. Even though the LHC
and antenna system show great variability across all photosynthetic organisms, the photosystems
29
are largely identical. Thus we can use the same pesticides used in the analysis of the CFT to
roughly the same effect in this study since we are probing fluorescence from the photosystems.
Photochemical quenching is the dissipation of an absorbed photon by charge separation at
both photosystems and its subsequent transfer to the ETC. Any excitation that follows this path
will not be measureable by our instruments and thus will make the transfer efficiency appear
greater than it actually is. In PSII, directly after charge separation, the electron is transferred via
pheophytin to quinone pool. Once a quinone has accumulated two electrons, it is oxidized by
plastoquinone thereby regenerating the quinone.
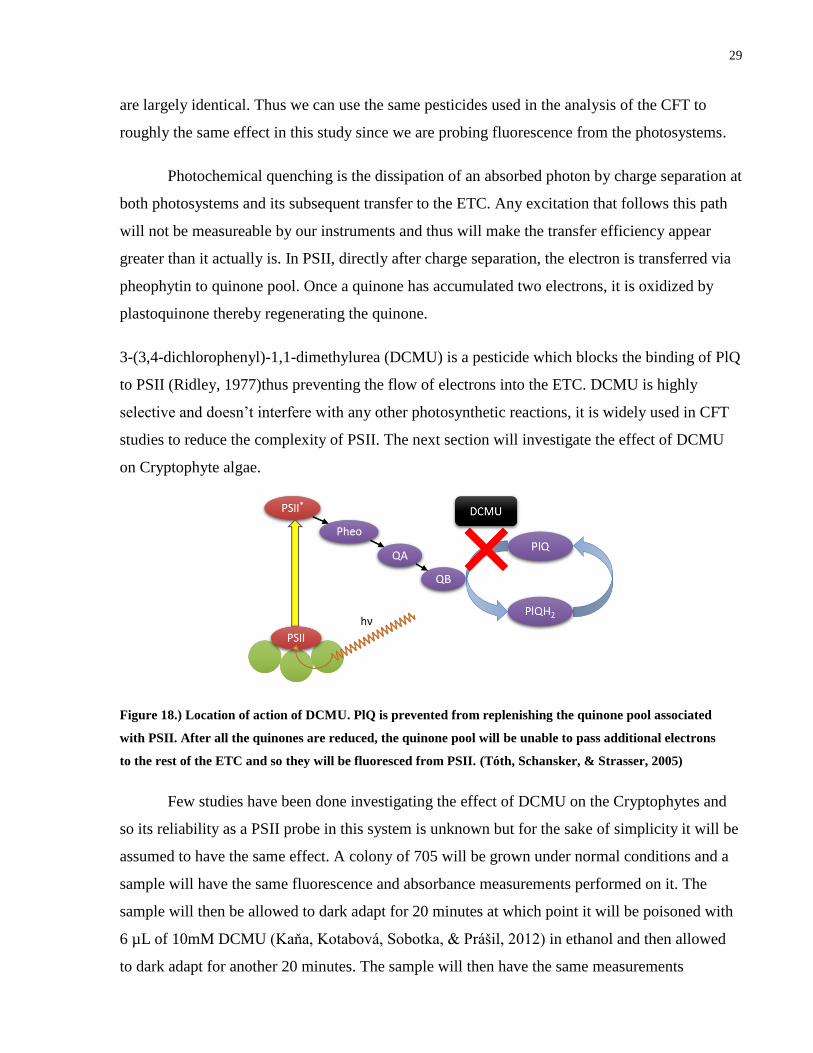
3-(3,4-dichlorophenyl)-1,1-dimethylurea (DCMU) is a pesticide which blocks the binding of PlQ
to PSII (Ridley, 1977)thus preventing the flow of electrons into the ETC. DCMU is highly
selective and doesn’t interfere with any other photosynthetic reactions, it is widely used in CFT
studies to reduce the complexity of PSII. The next section will investigate the effect of DCMU
on Cryptophyte algae.
Few studies have been done investigating the effect of DCMU on the Cryptophytes and
so its reliability as a PSII probe in this system is unknown but for the sake of simplicity it will be
assumed to have the same effect. A colony of 705 will be grown under normal conditions and a
sample will have the same fluorescence and absorbance measurements performed on it. The
sample will then be allowed to dark adapt for 20 minutes at which point it will be poisoned with
6 µL of 10mM DCMU (Kaňa, Kotabová, Sobotka, & Prášil, 2012) in ethanol and then allowed
to dark adapt for another 20 minutes. The sample will then have the same measurements
Figure 18.) Location of action of DCMU. PlQ is prevented from replenishing the quinone pool associated
with PSII. After all the quinones are reduced, the quinone pool will be unable to pass additional electrons
to the rest of the ETC and so they will be fluoresced from PSII. (Tóth, Schansker, & Strasser, 2005)
30
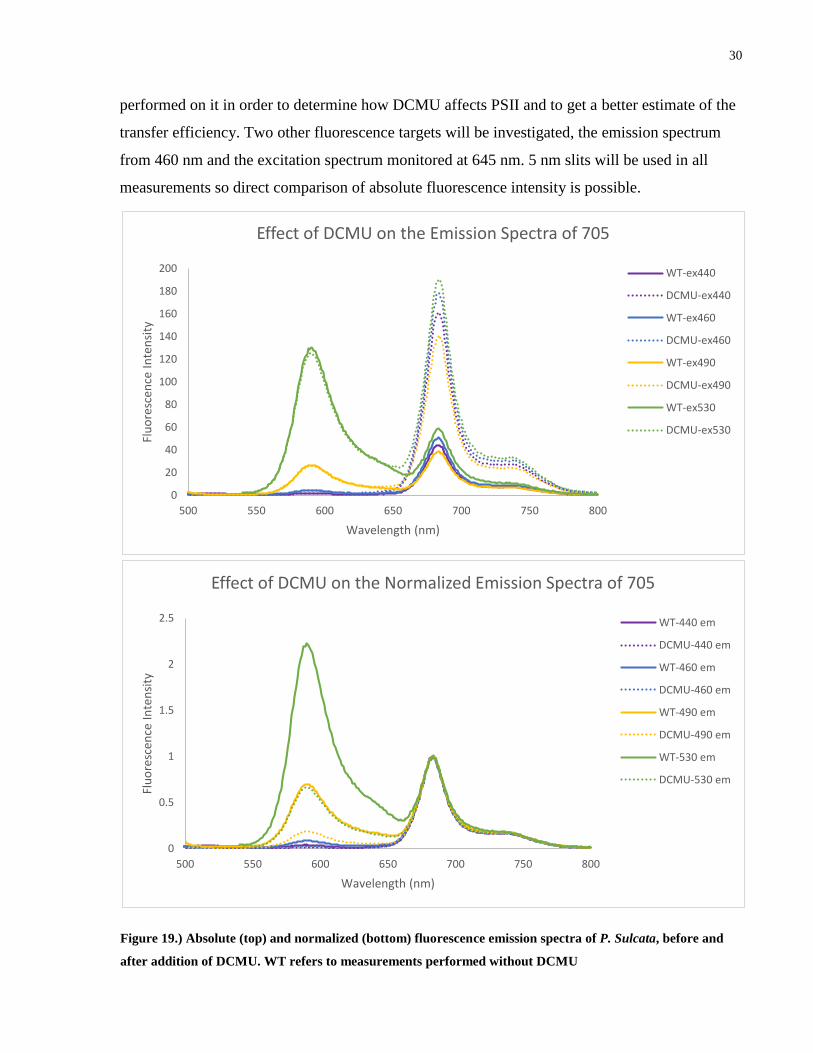
performed on it in order to determine how DCMU affects PSII and to get a better estimate of the
transfer efficiency. Two other fluorescence targets will be investigated, the emission spectrum
from 460 nm and the excitation spectrum monitored at 645 nm. 5 nm slits will be used in all
measurements so direct comparison of absolute fluorescence intensity is possible.
0
20
40
60
80
100
120
140
160
180
200
500 550 600 650 700 750 800
Flu
ore
scen
ce I
nte
nsi
ty
Wavelength (nm)
Effect of DCMU on the Emission Spectra of 705
WT-ex440
DCMU-ex440
WT-ex460
DCMU-ex460
WT-ex490
DCMU-ex490
WT-ex530
DCMU-ex530
0
0.5
1
1.5
2
2.5
500 550 600 650 700 750 800
Flu
ore
scen
ce I
nte
nsi
ty
Wavelength (nm)
Effect of DCMU on the Normalized Emission Spectra of 705
WT-440 em
DCMU-440 em
WT-460 em
DCMU-460 em
WT-490 em
DCMU-490 em
WT-530 em
DCMU-530 em
Figure 19.) Absolute (top) and normalized (bottom) fluorescence emission spectra of P. Sulcata, before and
after addition of DCMU. WT refers to measurements performed without DCMU
31
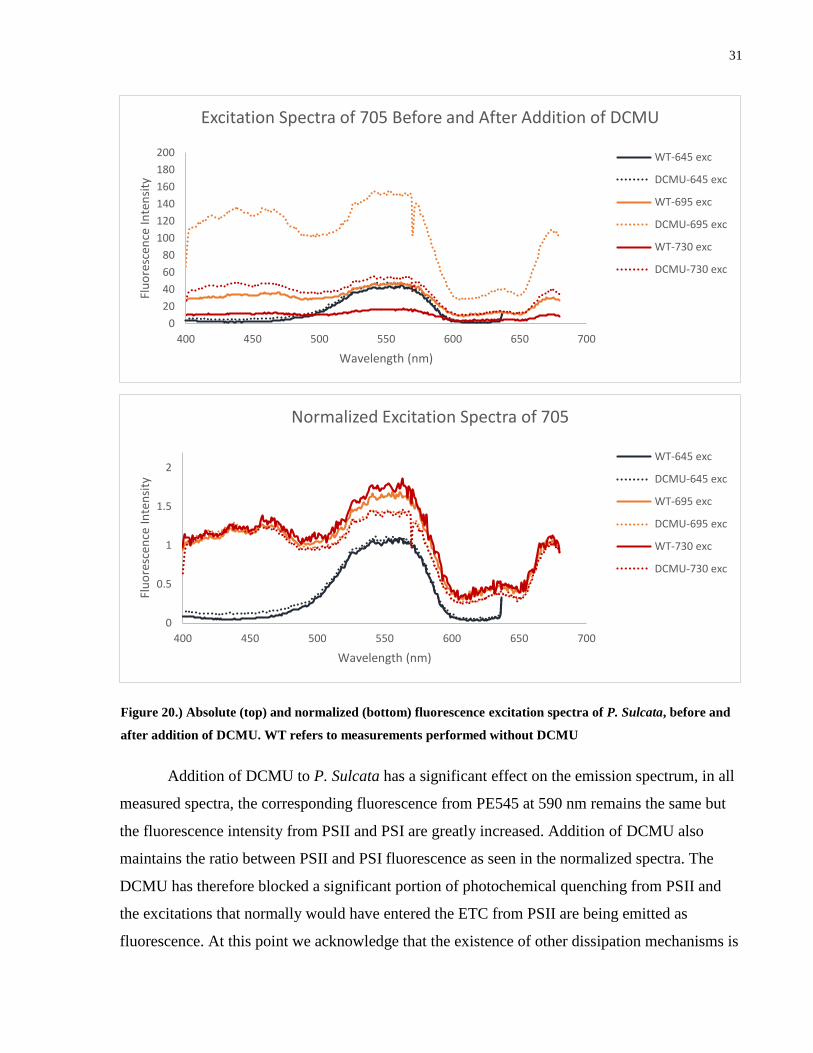
Addition of DCMU to P. Sulcata has a significant effect on the emission spectrum, in all
measured spectra, the corresponding fluorescence from PE545 at 590 nm remains the same but
the fluorescence intensity from PSII and PSI are greatly increased. Addition of DCMU also
maintains the ratio between PSII and PSI fluorescence as seen in the normalized spectra. The
DCMU has therefore blocked a significant portion of photochemical quenching from PSII and
the excitations that normally would have entered the ETC from PSII are being emitted as
fluorescence. At this point we acknowledge that the existence of other dissipation mechanisms is
0
20
40
60
80
100
120
140
160
180
200
400 450 500 550 600 650 700
Flu
ore
scen
ce I
nte
nsi
ty
Wavelength (nm)
Excitation Spectra of 705 Before and After Addition of DCMU
WT-645 exc
DCMU-645 exc
WT-695 exc
DCMU-695 exc
WT-730 exc
DCMU-730 exc
0
0.5
1
1.5
2
400 450 500 550 600 650 700
Flu
ore
scen
ce I
nte
nsi
ty
Wavelength (nm)
Normalized Excitation Spectra of 705
WT-645 exc
DCMU-645 exc
WT-695 exc
DCMU-695 exc
WT-730 exc
DCMU-730 exc
Figure 20.) Absolute (top) and normalized (bottom) fluorescence excitation spectra of P. Sulcata, before and
after addition of DCMU. WT refers to measurements performed without DCMU
32
are likely. The adjacent CAC complexes may provide a route for the excitation to dissipate to
where it would then undergo NPQ.
Looking first at the excitation spectra at 645 nm, corresponding to the CAC complex, we
see that the signal arises from PE545 with little contribution elsewhere. In both the absolute and
normalized spectra, there is no change in the fluorescence intensity or relative shape of the
spectra. This assures us that the DCMU has had no noticeable effect on the energy transfer from
the thylakoid lumen to the CAC complex. Both PSII and PSI show a greatly increased signal in
the absolute fluorescence spectrum with PSII showing the greatest change as expected. The
normalized spectrum reveals that the shape of the excitation spectrum has changed slightly, with
less contribution coming from the PE545 region. We can immediately note that this will lower
the apparent energy transfer efficiency when compared to the absorption spectrum
𝜀 =𝐽685+𝑃𝑄+𝑞𝐻2
𝐽590+𝐽685+𝑞𝐻1+𝑞𝐻2+𝑃𝑄
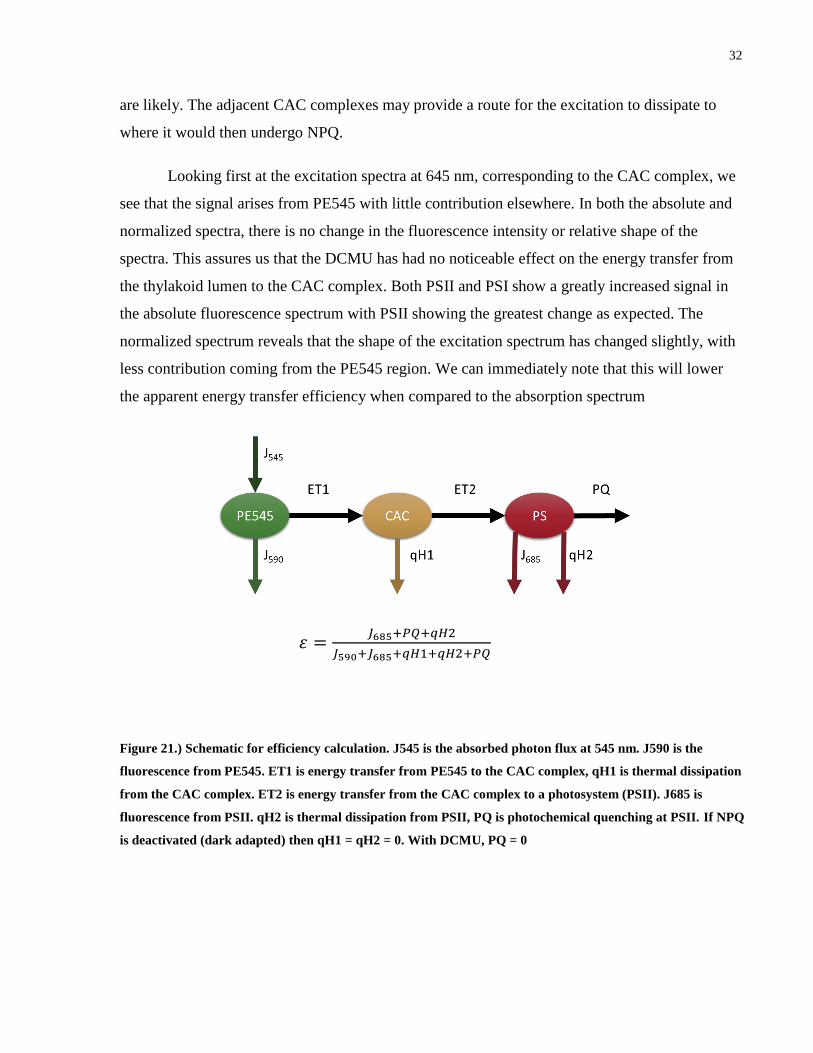
Figure 21.) Schematic for efficiency calculation. J545 is the absorbed photon flux at 545 nm. J590 is the
fluorescence from PE545. ET1 is energy transfer from PE545 to the CAC complex, qH1 is thermal dissipation
from the CAC complex. ET2 is energy transfer from the CAC complex to a photosystem (PSII). J685 is
fluorescence from PSII. qH2 is thermal dissipation from PSII, PQ is photochemical quenching at PSII. If NPQ
is deactivated (dark adapted) then qH1 = qH2 = 0. With DCMU, PQ = 0
33
0
20
40
60
80
100
120
450 550 650 750
Flu
ore
scen
ce I
nte
nsi
ty
Wavelength (nm)
440 nm Emission Spectrum
D7
D9
D11
D14
D16
D18
D21
D23
0
100
200
300
400
450 550 650 750
Axi
s Ti
tle
Wavelength (nm)
440 nm Emission Spectrum with DCMU
D7
D9
D11
D14
D16
D18
D21
D23
D25
0
100
200
300
400
470 570 670 770
Axi
s Ti
tle
Wavelength (nm)
460 nm Emissions Spectrum with DCMU
D7D9D11
D14
D16D18
D21D23D25
0
20
40
60
80
100
120
140
470 570 670 770Flu
ore
scen
ce I
nte
nsi
ty
Wavelength (nm)
460 nm Emission Spectrum
D7
D9
D11
D14
D16
D18
D21
D23
D25
0
100
200
300
500 600 700 800
Axi
s Ti
tle
Wavelength (nm)
490 nm Emissions Spectra with DCMU
D7
D9D11
D14D16
D18D21
D23D25
0
20
40
60
80
100
120
500 600 700 800
Axi
s Ti
tle
Wavelength (nm)
490 nm Emission Spectra
D7
D9
D11
D14
D16
D18
D21
D23
D25
Figure 22.) ChlA (top), ChlC (middle) s2 band, and carotenoid (bottom) absolute emission spectra before and
after addition of DCMU
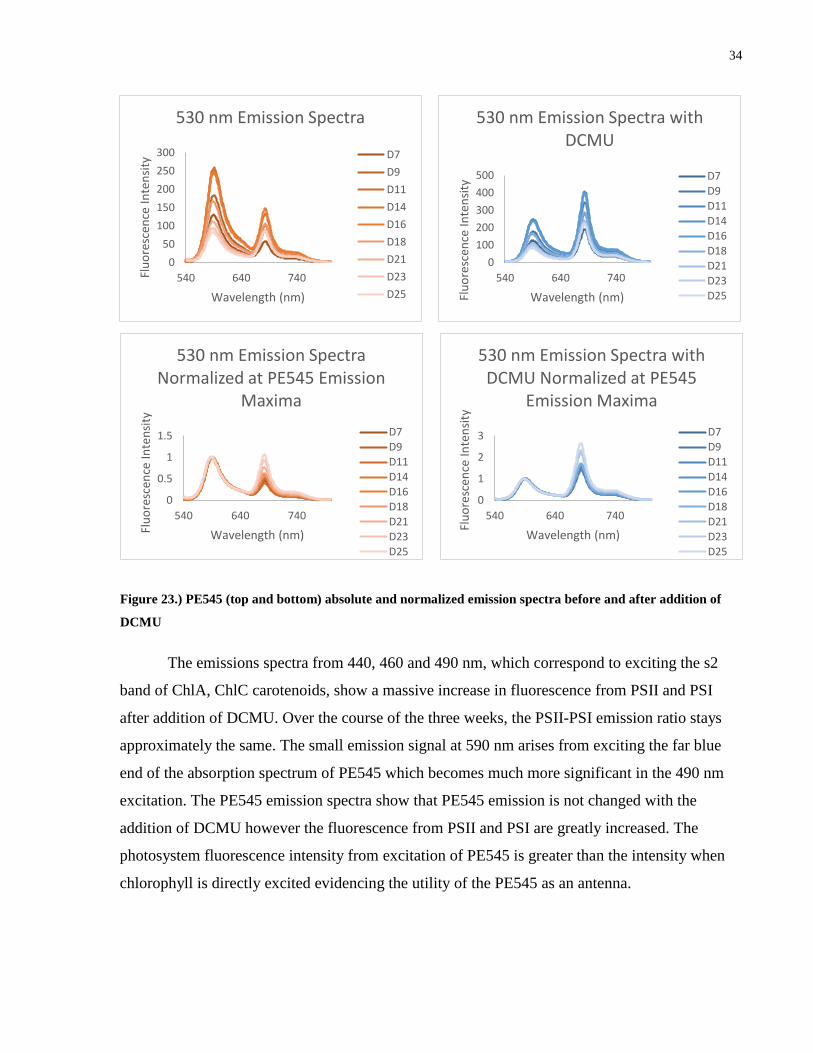
34
The emissions spectra from 440, 460 and 490 nm, which correspond to exciting the s2
band of ChlA, ChlC carotenoids, show a massive increase in fluorescence from PSII and PSI
after addition of DCMU. Over the course of the three weeks, the PSII-PSI emission ratio stays
approximately the same. The small emission signal at 590 nm arises from exciting the far blue
end of the absorption spectrum of PE545 which becomes much more significant in the 490 nm
excitation. The PE545 emission spectra show that PE545 emission is not changed with the
addition of DCMU however the fluorescence from PSII and PSI are greatly increased. The
photosystem fluorescence intensity from excitation of PE545 is greater than the intensity when
chlorophyll is directly excited evidencing the utility of the PE545 as an antenna.
0
50
100
150
200
250
300
540 640 740Flu
ore
scen
ce I
nte
nsi
ty
Wavelength (nm)
530 nm Emission Spectra
D7
D9
D11
D14
D16
D18
D21
D23
D25
0
100
200
300
400
500
540 640 740
Flu
ore
scen
ce I
nte
nsi
ty
Wavelength (nm)
530 nm Emission Spectra with DCMU
D7
D9D11D14
D16
D18D21
D23D25
0
1
2
3
540 640 740
Flu
ore
scen
ce I
nte
nsi
ty
Wavelength (nm)
530 nm Emission Spectra with DCMU Normalized at PE545
Emission Maxima
D7
D9
D11D14
D16D18
D21D23
D25
0
0.5
1
1.5
540 640 740
Flu
ore
scen
ce I
nte
nsi
ty
Wavelength (nm)
530 nm Emission Spectra Normalized at PE545 Emission
Maxima
D7
D9
D11D14
D16D18
D21D23
D25
Figure 23.) PE545 (top and bottom) absolute and normalized emission spectra before and after addition of
DCMU
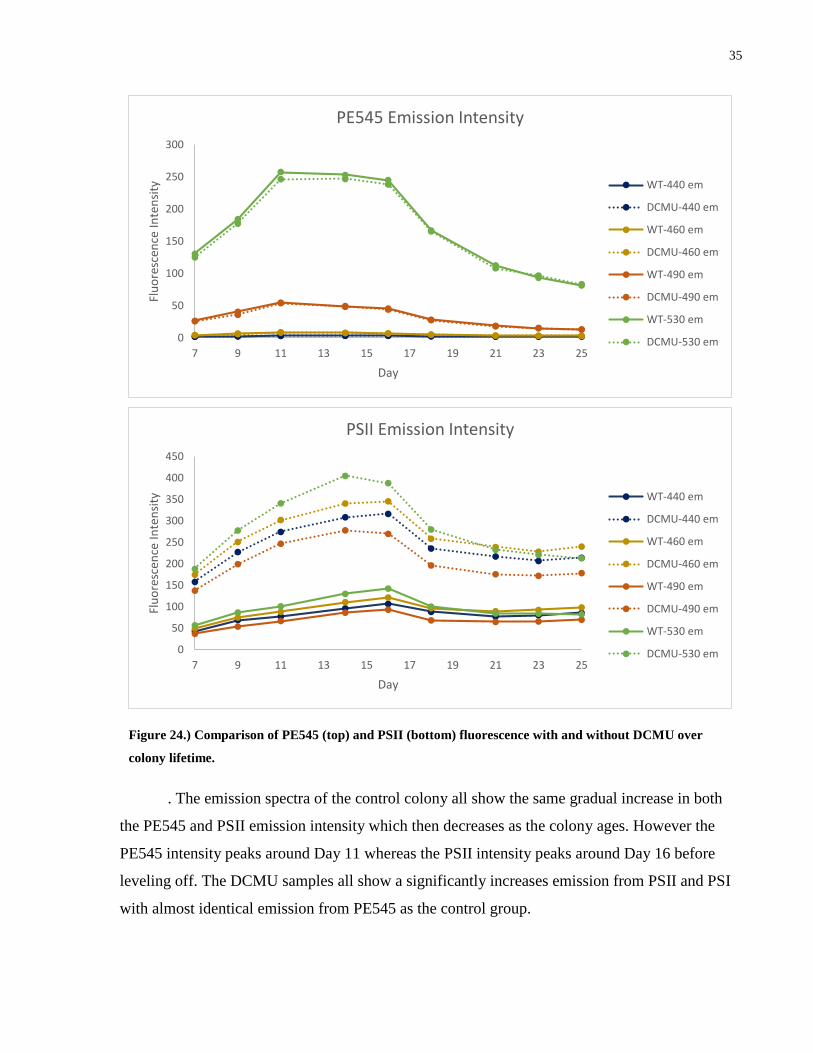
35
. The emission spectra of the control colony all show the same gradual increase in both
the PE545 and PSII emission intensity which then decreases as the colony ages. However the
PE545 intensity peaks around Day 11 whereas the PSII intensity peaks around Day 16 before
leveling off. The DCMU samples all show a significantly increases emission from PSII and PSI
with almost identical emission from PE545 as the control group.
0
50
100
150
200
250
300
350
400
450
7 9 11 13 15 17 19 21 23 25
Flu
ore
scen
ce I
nte
nsi
ty
Day
PSII Emission Intensity
WT-440 em
DCMU-440 em
WT-460 em
DCMU-460 em
WT-490 em
DCMU-490 em
WT-530 em
DCMU-530 em
0
50
100
150
200
250
300
7 9 11 13 15 17 19 21 23 25
Flu
ore
scen
ce I
nte
nsi
ty
Day
PE545 Emission Intensity
WT-440 em
DCMU-440 em
WT-460 em
DCMU-460 em
WT-490 em
DCMU-490 em
WT-530 em
DCMU-530 em
Figure 24.) Comparison of PE545 (top) and PSII (bottom) fluorescence with and without DCMU over
colony lifetime.
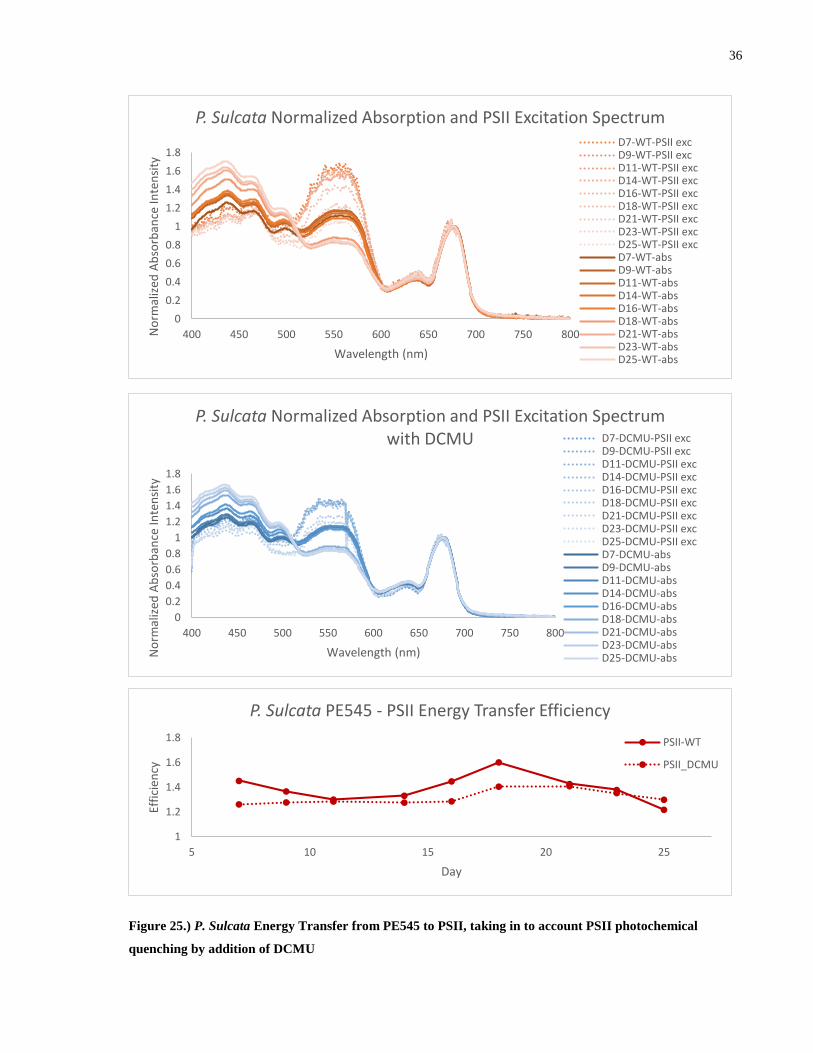
36
0
0.2
0.4
0.6
0.8
1
1.2
1.4
1.6
1.8
400 450 500 550 600 650 700 750 800No
rmal
ized
Ab
sorb
ance
Inte
nsi
ty
Wavelength (nm)
P. Sulcata Normalized Absorption and PSII Excitation SpectrumD7-WT-PSII excD9-WT-PSII excD11-WT-PSII excD14-WT-PSII excD16-WT-PSII excD18-WT-PSII excD21-WT-PSII excD23-WT-PSII excD25-WT-PSII excD7-WT-absD9-WT-absD11-WT-absD14-WT-absD16-WT-absD18-WT-absD21-WT-absD23-WT-absD25-WT-abs
0
0.2
0.4
0.6
0.8
1
1.2
1.4
1.6
1.8
400 450 500 550 600 650 700 750 800
No
rmal
ized
Ab
sorb
ance
Inte
nsi
ty
Wavelength (nm)
P. Sulcata Normalized Absorption and PSII Excitation Spectrum with DCMU D7-DCMU-PSII exc
D9-DCMU-PSII excD11-DCMU-PSII excD14-DCMU-PSII excD16-DCMU-PSII excD18-DCMU-PSII excD21-DCMU-PSII excD23-DCMU-PSII excD25-DCMU-PSII excD7-DCMU-absD9-DCMU-absD11-DCMU-absD14-DCMU-absD16-DCMU-absD18-DCMU-absD21-DCMU-absD23-DCMU-absD25-DCMU-abs
1
1.2
1.4
1.6
1.8
5 10 15 20 25
Effi
cien
cy
Day
P. Sulcata PE545 - PSII Energy Transfer Efficiency
PSII-WT
PSII_DCMU
Figure 25.) P. Sulcata Energy Transfer from PE545 to PSII, taking in to account PSII photochemical
quenching by addition of DCMU
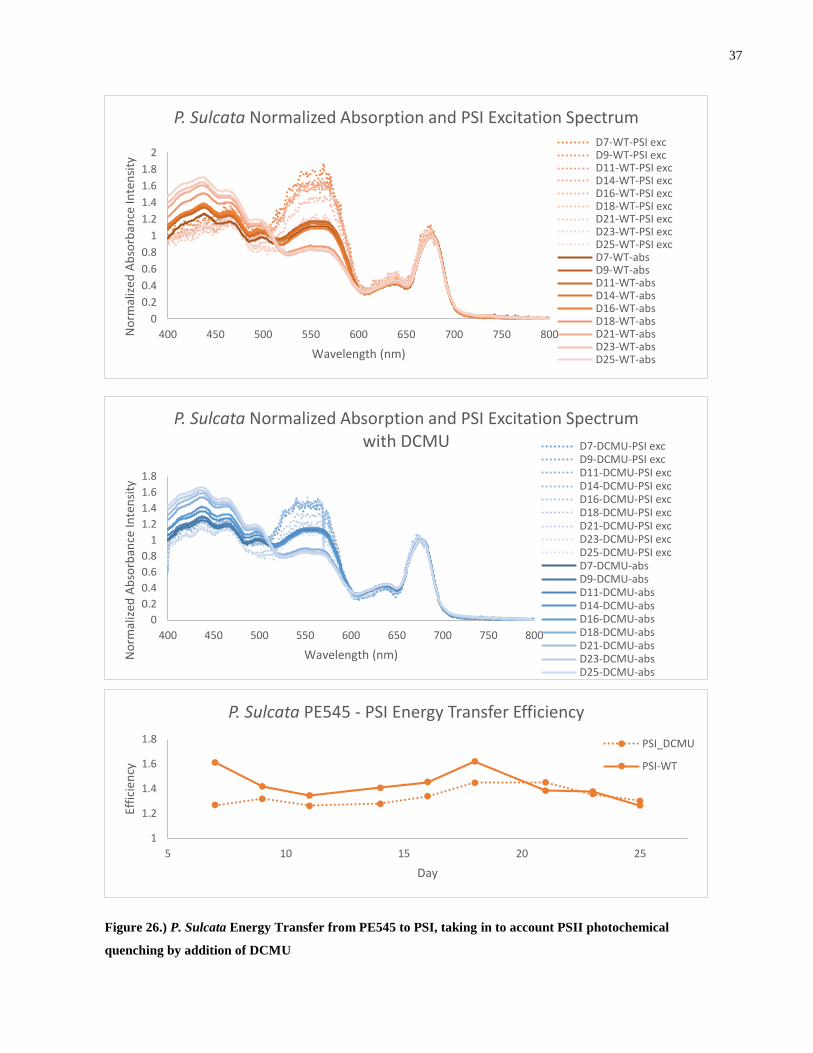
37
0
0.2
0.4
0.6
0.8
1
1.2
1.4
1.6
1.8
2
400 450 500 550 600 650 700 750 800No
rmal
ized
Ab
sorb
ance
Inte
nsi
ty
Wavelength (nm)
P. Sulcata Normalized Absorption and PSI Excitation SpectrumD7-WT-PSI excD9-WT-PSI excD11-WT-PSI excD14-WT-PSI excD16-WT-PSI excD18-WT-PSI excD21-WT-PSI excD23-WT-PSI excD25-WT-PSI excD7-WT-absD9-WT-absD11-WT-absD14-WT-absD16-WT-absD18-WT-absD21-WT-absD23-WT-absD25-WT-abs
0
0.2
0.4
0.6
0.8
1
1.2
1.4
1.6
1.8
400 450 500 550 600 650 700 750 800
No
rmal
ized
Ab
sorb
ance
Inte
nsi
ty
Wavelength (nm)
P. Sulcata Normalized Absorption and PSI Excitation Spectrumwith DCMU D7-DCMU-PSI exc
D9-DCMU-PSI excD11-DCMU-PSI excD14-DCMU-PSI excD16-DCMU-PSI excD18-DCMU-PSI excD21-DCMU-PSI excD23-DCMU-PSI excD25-DCMU-PSI excD7-DCMU-absD9-DCMU-absD11-DCMU-absD14-DCMU-absD16-DCMU-absD18-DCMU-absD21-DCMU-absD23-DCMU-absD25-DCMU-abs
1
1.2
1.4
1.6
1.8
5 10 15 20 25
Effi
cien
cy
Day
P. Sulcata PE545 - PSI Energy Transfer Efficiency
PSI_DCMU
PSI-WT
Figure 26.) P. Sulcata Energy Transfer from PE545 to PSI, taking in to account PSII photochemical
quenching by addition of DCMU
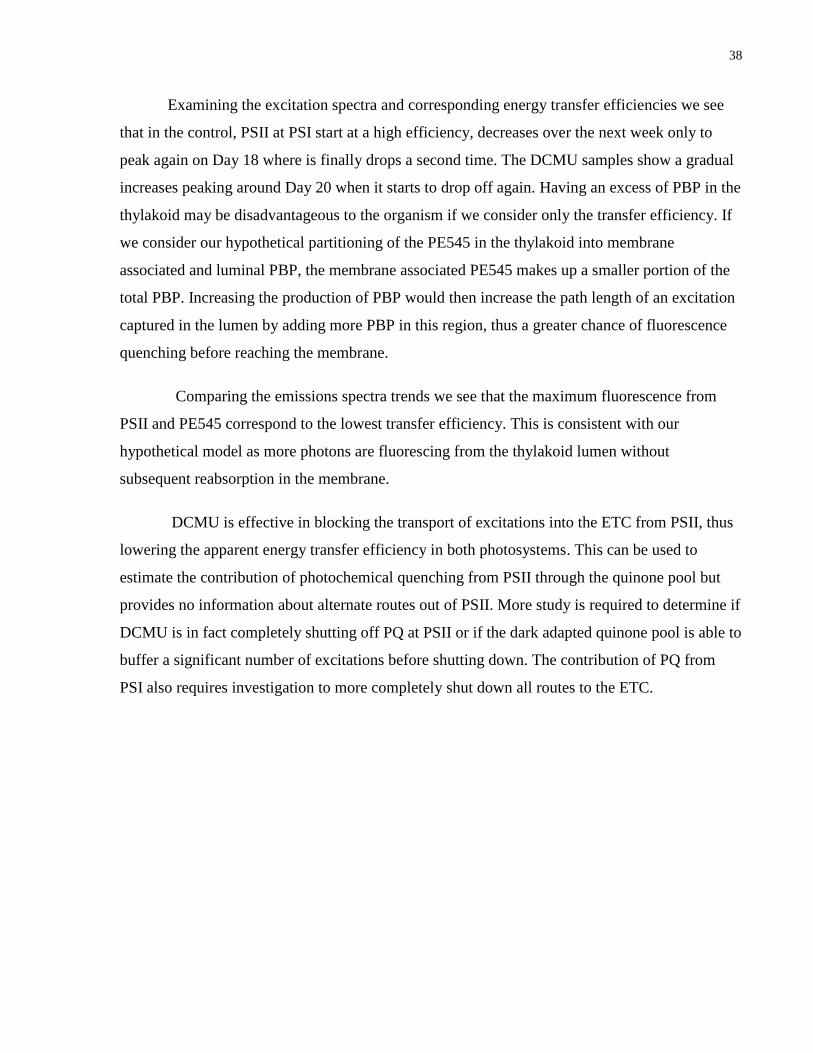
38
Examining the excitation spectra and corresponding energy transfer efficiencies we see
that in the control, PSII at PSI start at a high efficiency, decreases over the next week only to
peak again on Day 18 where is finally drops a second time. The DCMU samples show a gradual
increases peaking around Day 20 when it starts to drop off again. Having an excess of PBP in the
thylakoid may be disadvantageous to the organism if we consider only the transfer efficiency. If
we consider our hypothetical partitioning of the PE545 in the thylakoid into membrane
associated and luminal PBP, the membrane associated PE545 makes up a smaller portion of the
total PBP. Increasing the production of PBP would then increase the path length of an excitation
captured in the lumen by adding more PBP in this region, thus a greater chance of fluorescence
quenching before reaching the membrane.
Comparing the emissions spectra trends we see that the maximum fluorescence from
PSII and PE545 correspond to the lowest transfer efficiency. This is consistent with our
hypothetical model as more photons are fluorescing from the thylakoid lumen without
subsequent reabsorption in the membrane.
DCMU is effective in blocking the transport of excitations into the ETC from PSII, thus
lowering the apparent energy transfer efficiency in both photosystems. This can be used to
estimate the contribution of photochemical quenching from PSII through the quinone pool but
provides no information about alternate routes out of PSII. More study is required to determine if
DCMU is in fact completely shutting off PQ at PSII or if the dark adapted quinone pool is able to
buffer a significant number of excitations before shutting down. The contribution of PQ from
PSI also requires investigation to more completely shut down all routes to the ETC.
39
Chapter 4
Conclusions
This thesis studied the light harvesting complex of the Cryptophyte algae and the
efficiency and robustness of its light harvesting complex. The Cryptophytes are unique in their
photosynthetic architecture, consisting of free floating phycobiliproteins in the thylakoid lumen,
membrane bound CAC complexes, and PSI and PSII. Four species of algae were investigated in
this study, Proteomonas Sulcata (PE545), Rhodomonas Minutae (PE545), Hemiselmis Pacifica
(PC577), and Chroomonas Mesostigmatica (PC645). Basic spectroscopic techniques such as
linear absorption, and fluorescence emission and excitation were used to calculate the energy
transfer efficiency from the phycobiliproteins in the luminal space to the photosystems.
Techniques from chlorophyll fluorescence transient studies were later used to gain further insight
in to the many different fates a photon may succumb to once inside the light harvesting complex.
Chapter 1 introduced photosynthesis and the variety of different ways in which nature has
devised a means to harness solar light energy and how the rules that guide biological
development differ significantly from how we might engineer a device in the lab. An overview
of spectroscopic techniques and how they would be used to determine energy transfer efficiency
was also introduced.
Chapter 2 investigated the normal growth conditions of P. Sulcata and R. Minutae to
determine a reference point to compare efficiencies under nonstandard conditions and to
determine the best method for measuring the necessary spectroscopic parameters. Simple
consideration of donor-acceptor energy transfer within the Cryptophyte leads to transfer
efficiencies greater than 100%. Since this is not physical, we are forced to consider a more
complex model that includes alternate pathways for an excitation between the thylakoid lumen
and photosystems.
Chapter 3 sought to determine the degree that non-photochemical and photochemical
quenching played in energy transfer and whether or not it was a significant contributor the
apparent greater than 100% energy transfer. H. Pacafica and C. Mesostigmata were studied here
40
as well to compare phycocyanin containing species to phycoerythrin containing species. The two
containing phycocyanin have an additional complication in determining energy transfer
efficiency as there is significant spectral overlap between the phycocyanin and CAC complex.
High light exposed samples only showed a marginal decrease in fluorescence intensity compared
to the dark, low and regular light samples in all four species. It is likely that the high light
samples would not have shown significant effects due to non-photochemical quenching until a
photon flux of 600 μmol m−2 s−1. When exposed to DCMU, P. Sulcata showed a significant
change in its fluorescence emission and excitation spectrum. PSII and PSI both showed increased
emission intensity while emission from PE545 remained the same. The excitation spectra from
PSII and PSI also show a decreased signal from the PE545 region which corresponds to a
significantly decreased energy transfer efficiency. However this was still not enough to extract a
physically realistic number for the energy transfer efficiency.
41
References
Åkerlund, H.-E., Jansson, C., & Andersson, B. (1982). Reconstitution of photosynthetic water
splitting in inside-out thylakoid vesicles and identification of a participating polypeptide.
Biochimica et Biophysica Acta - Bioenergetics, 681(1), 1-10.
Allen, J. F. (2002). Photosynthesis of ATP—Electrons, Proton Pumps, Rotors, and Poise. Cell,
273-276.
Antoine, D., André, J.-M., & Morel, A. (1996). Oceanic primary production: 2. Estimation at
global scale from satellite (Coastal Zone Color Scanner) chlorophyll. Global
Biogeocheical Cycles, 57-69.
Apt, K. E., Collier, J. L., & Grossman, A. R. (1995). Evolution of the Phycobiliproteins. Journal
of Molecular Biology, 79-86.
Arnon, D. I. (1971). The Light Reactions of Photosynthesis. PNAS, 68(11), 2883-2892.
Bilger, W., & Björkman, O. (1990). Role of the xanthophyll cycle in photoprotection elucidated
by measurements of light-induced absorbance changes, fluorescence and photosynthesis
in leaves of Hedera canariensis. Photosynthesis Research, 173-185.
Blankenship, R. E. (2002). Molecular Mechanisms of Photosynthesis. Oxford: Blackwell Science
Ltd.
Bryant, D. A., & Frigaard, N.-U. (2006). Prokaryotic photosynthesis and phototrophy
illuminated. Trends in Microbiology, 14(11), 488-496.
Burki, F., Okamoto, N., Pombert, J.-F., & Keeling, P. J. (2012). The evolutionary history of
haptophytes and cryptophytes: phylogenomic evidence for separate origins. Proceedings
of the Royal Society B, 279, 2246-2254.
Cooper, G. (2000). The Cell: A Molecular Approach. 2nd edition. Sunderland: Sinauer
Associates.
42
Curutchet, C., Novoderezhkin, V. I., Kongsted, J., Munoz-Losa, A., van Grondelle, R., Scholes,
G. D., & Menucci, B. (2013). Energy Flow in the Cryptophyte PE545 Antenna Is
Directed by Bilin Pigment Conformation. Journal of Physical Chemistry B, 4263-4273.
Dismukes, G. C., Klimov, V. V., Baranov, S. V., Kozlov, Y. N., DasGupta, J., & Tyryshkin, A.
(2001). The origin of atmospheric oxygen on Earth: The innovation of oxygenic
photosynthesis. PNAS, 2170-2175.
Doust, A. B., Marai, C. N., Harrop, S. J., Wilk, K. E., Curmi, P. M., & Scholes, G. D. (2004).
Developing a Structure–Function Model for the Cryptophyte Phycoerythrin 545 Using
Ultrahigh Resolution Crystallography and Ultrafast Laser Spectroscopy. Journal of
Molecular Biology, 135-153.
Drews, G. (2011). Bioenergetic Processes of Cyanobacteria. In G. A. Peschek, C. Obinger, & G.
Renger, Bioenergetic Processes of Cyanobacteria (pp. 265-284). Dordrecht: Springer.
Falkowski, P. G., & Owens, T. G. (1980). Light-Shade Adaptation: Two Strategies in Marine
Phytoplankton. Plant Physiology, 66, 592-595.
Fawley, M. W. (1989). A New Form of Chlorophyll c Involved in Light-Harvesting. Plant
Physiology, 727-732.
French, C. S., Brown, J. S., & Lawrence, M. C. (1972). Four Universal Forms of Chlorophyll a.
Plant Physiology, 107-119.
Govindjee. (1995). Sixty-three Years Since Kautsky: Chlorophyll a Fluorescence. Aust. J. Plant.
Physiol., 131-160.
Grossman, A. R., Schaefer, M. R., Chiang, G. G., & Collier, J. L. (1993). The phycobilisome, a
light-harvesting complex responsive to environmental conditions. Microbiology and
Molecular Biology Reviews, 725-749.
Hohmann-Marriott, M. F., & Blankenship, R. E. (2011). Evolution of Photosynthesis. Annual
Reviews of Plant Biology(62), 515-548.
43
Horton, P., & Ruban, A. (2005). Molecular design of the photosystem II light-harvesting
antenna: photosynthesis and photoprotection. Journal of Experimental Botany, 365-373.
Hsia, C. C., Schmitz, A., Lambertz, M., Perry, S. F., & Maina, J. N. (2013). Evolution of Air
Breathing: Oxygen Homeostasis and the Transitions from Water to Land and Sky.
Comprehensive Physiology, 3, 849-915.
Ingram, K., & Hiller, R. G. (1983). ISOLATION AND CHARACTERIZATION OF A MAJOR
CHLOROPHYLL a/c 2 LIGHT-HARVESTING PROTEIN FROM A CHROOMONAS
SPECIES (CRYPTOPHYCEAE). Biochimica et Biophysica Acta, 722, 310-319.
Javornický, P., & Hindák, F. (1970). Cryptomonas frigoris spec. nova (Cryptophyceae), the new
cyst-forming flagellate from the snow of the High Tatras. Biologia Serbica A, 25, 241-
250.
Jensen, A., Aasmundred, O., & Eimhjellen, K. E. (1964). Chlorophylls of photosynthetic
bacteria. Biochimica et Biophysica Acta, 466-479.
Kana, R., Prásil, O., & Mullineaux, C. (2009). Immobility of phycobilins in the thylakoid lumen
of a cryptophyte suggests that protein diffusion in the lumen is very restricted. FEBS
Letters, 583, 670-674.
Kaňa, R., Kotabová, E., Sobotka, R., & Prášil, O. (2012). Non-Photochemical Quenching in
Cryptophyte Alga Rhodomonas salina Is Located in Chlorophyll a/c Antennae. PLoS
ONE, 7(1), 1-12.
Kereïche, S., Kouřil, R., Oostergetel, G. T., Fusetti, F., Boekema, E. J., Doust, A. B., . . . Dekker,
J. P. (2008). Association of chlorophyll a/c2 complexes to photosystem I and
photosystem II in the cryptophyte Rhodomonas CS24. Biochimica et Biophysica Acta
(BBA) - Bioenergetics, 1122-1128.
Kiihlbrandt, W., Wang, D., & Fujiyoshi, Y. (1994). Atomic model of plant light-harvesting
complex by electron crystallography. Nature, 614-621.
44
Koziol, A. G., Borza, T., Ishida, K.-I., Keeling, P., Lee, R. W., & Durnford, D. G. (2007).
Tracing the Evolution of the Light-Harvesting Antennae in Chlorophyll a/b-Containing
Organisms. Plant Physiology, 143(4), 1802-1816.
Krause, G. H. (1991). Chlorophyll Fluorescence and Photosynthesis: The Basics. Annu. Rev.
Plant Physiol. Plant Mol. Bioi. , 313-349.
Kursar, T. A., & Alberte, R. S. (1983). Photosynthetic Unit Organization in a Red Alga. Plant
Physiology, 72, 409-414.
Larkum, A. (2010). Limitations and prospects of natural photosynthesis for bioenergy
production. Current Opinion in Biotechnology, 271-276.
McDermott, G., Prince, S. M., Freer, A. A., Hawthornthwaite-Lawless, A. M., Papiz, M. Z.,
Cogdell, R. J., & Isaacs, N. W. (1995). Crystal Structure of an Integral Membrane Light-
Harvesting Complex from Photosynthetic Bacteria. Nature, 517-521.
McFadden, G. I. (2001). Transitions from Water to Land and Sky. Journal of Phycology, 37(6),
951-959.
Muller, P., Li, X.-P., & Niyogi, K. K. (2001). Non-Photochemical Quenching. A Response to
Excess Light Energy. Plant Physiology, 1558-1566.
Nielsen, N. C., Smillie, R. M., Hennigsen, K. W., & von Wettstein, D. (1979). Composition and
Function of Thylakoid Membranes from Grana-rich and Grana-deficient Chloroplast
Mutants of Barley. Plant Physiology, 174-182.
Petersem, J., Teich, R., Brinkmann, H., & Cerff, R. (2006). A “Green” Phosphoribulokinase in
Complex Algae with Red Plastids: Evidence for a Single Secondary Endosymbiosis
Leading to Haptophytes, Cryptophytes, Heterokonts, and Dinoflagellates. Journal of
Molecular Evolution, 143-157.
Pisciotta, J. M., Zou, Y., & Baskakov, I. V. (2010). Light-Dependent Electrogenic Activity of
Cyanobacteria. PLoS, e10821.
45
Ridley, S. M. (1977). Interaction of Chloroplasts with Inhibitors. Plant Physiology, 59(4), 724-
732.
Rochaix, J.-D. (2010). Reprint of: Regulation of photosynthetic electron transport. Biochimica et
Biophysica Acta, 878-886.
Ruban, A. V. (2014). Evolution under the sun: optimizing light harvesting in Photosynthesis.
Journal of Experimental Botany, 1-17.
Scholes, G. D., Fleming, G. R., Olaya-Castro, A., & van Grondelle, R. (2011). Lessons from
nature about solar light harvesting. Nature Chemistry, 3, 763-774.
Scholes, G. D., Mirkovic, T., Turner, D. B., Fassioli, F., & Buchleitner, A. (2012). Solar light
harvesting by energy transfer: from ecology to coherence. Energy & Environmental
Science, 5, 9374-9393.
Spear-Bernstein, L., & Miller, K. R. (1985). Are the Photosynthetic Membranes of Cryptophyte
Algae Inside Out? Protoplasma, 129, 1-9.
Stirbet, A., & Govindjee. (2011). On the relation between the Kautsky effect (chlorophyll a
fluorescence induction) and Photosystem II: Basics and applications of the OJIP
fluorescence transient. Journal of Photochemistry and Photobiology B, 236-257.
Strasser, R. J., Tsimilli-Michael, M., & Srivastava, A. (2004). Analysis of the Chlorophyll a
Fluorescence Transient. In G. C. Papageorgiou, & Govindjee, Chlorophyll Fluorescence:
A Signature of Photosynthesis (pp. 321-362). Dordrecht: Springer.
Tóth, S. Z., Schansker, G., & Strasser, R. J. (2005). In intact leaves, the maximum fluorescence
level (FM) is independent of the redox state of the plastoquinone pool: A DCMU-
inhibition study. Biochimica et Biophysica Acta (BBA) - Bioenergetics, 275–282.
van der Weij-De Wit, C. D., Doust, A. B., van Stokkum, I. H., Dekker, J. P., Wilk, K. E., Curmi,
P. M., . . . van Grondelle, R. (2006). How Energy Funnels from the Phycoerythrin
Antenna Complex to Photosystem I and Photosystem II in Cryptophyte Rhodomonas
CS24 Cells. J. Phys. Chem. B, 110, 25066-25073.
46
van der Weij-De Wit, C. D., Doust, A. B., van Stokkum, I. H., Dekker, J. P., Wilk, K. E., Curmi,
P. M., . . . van Grondelle, R. (2006). How Energy Funnels from the Phycoerythrin
Antenna Complex to Photosystem I and Photosystem II in Cryptophyte Rhodomonas
CS24 Cells. J. Phys. Chem. B, 25066-25073.
Xiong, J., & Bauer, C. E. (2002). Complex Evolution of Photosynthesis. Annual Reviews of
Plant Biology(53), 503-521.
Yoon, H., Hackett, J. D., Ciniglia, C., Pinto, G., & Bhattacharya, D. (2004). A Molecular
Timeline for the Origin of Photosynthetic Eukaryotes. Molecular Biology and Evolution,
809-818.
Related Documents