Light Harvesting and Blue-Green Light Induced Non-Photochemical Quenching in Two Different C‑Phycocyanin Mutants of Synechocystis PCC 6803 Lijin Tian, † Ivo H. M. van Stokkum, ‡ Rob B. M. Koehorst, †,§ and Herbert van Amerongen* ,†,§ † Laboratory of Biophysics, Wageningen University, P.O. Box 8128, 6700 ET, Wageningen, The Netherlands ‡ Biophysics Group, Department of Physics and Astronomy, Faculty of Sciences, VU University, DeBoelelaan1081, 1081 HV Amsterdam, The Netherlands § MicroSpectroscopy Centre, Wageningen University, P.O. Box 8128, 6700 ET, Wageningen, The Netherlands * S Supporting Information ABSTRACT: Cyanobacteria are oxygen-evolving photosynthetic organisms that harvest sunlight and convert excitation energy into chemical energy. Most of the light is absorbed by large light harvesting complexes called phycobilisomes (PBs). In high-light conditions, cyanobacteria switch on a photoprotective mechanism called non-photochemical quenching (NPQ): During this process, absorption of blue-green light transforms the inactive orange form of the orange carotenoid protein OCP (OCP o ) into the red active form OCP r that subsequently binds to the PB, resulting in a substantial loss of excitation energy and corresponding decrease of the fluorescence. In wild-type cells, the quenching site is a bilin chomophore that fluoresces at 660 nm and which is called APC Q 660 . In the present work, we studied NPQ in two different types of mutant cells (CB and CK) that possess significantly truncated PBs, using spectrally resolved picosecond fluorescence spectroscopy. The results are in very good agreement with earlier in vitro experiments on quenched and unquenched PBs, although the fraction of quenched PBs is far lower in vivo. It is also lower than the fraction of PBs that is quenched in wild-type cells, but the site, rate, and location of quenching appear to be very similar. 1. INTRODUCTION Cyanobacteria (also known as blue-green algae) are supposedly the earliest and one of the most successful species on earth to perform oxygenic photosynthesis. They play a key role in global carbon cycling and atmospheric oxygen accumulation. Due to their fast growth rate and facile genetic modi fication, cyanobacteria are thought to possess great potential for hydrogen and biofuel production in the future. Similar to algae and plants, cyanobacteria contain two large photo- synthetic complexes in their thylakoid membranes, named photosystem I (PSI) and photosystem II (PSII), and here the light-dependent reactions of photosynthesis are taking place. 1−4 Besides PSI and PSII, cyanobacteria contain giant light harvesting or antenna systems, the so-called phycobilisomes (PBs). They are located on the stromal side of the thylakoid membrane, and they dramatically increase the cross section for light absorption. PBs have a complicated structure which also depends on species. 5 PBs of wild-type Synechocystis PCC 6803 (hereafter called Synechocystis) are composed of six C- phycocyanin (C-PC) rods and three allophycocyanin (APC) core cylinders; one C-PC rod contains three hexametric disks, each containing 18 bilin pigments, and in addition a few linker proteins; one core cylinder contains four trimeric APC disks, each containing 6 pigments. One core cylinder is not directly in contact with the thylakoid membrane with the photosystems, and it contains only APC trimers emitting at 660 nm, while both basal cylinders each contain three chromophores that emit around 680 nm and serve as a terminal energy acceptor of the PB. 6,7 The whole PB is anchored by the core-membrane linker Lcm to the thylakoid membrane. Detailed PB structures are described by Arteni et al., 8,9 whereas further information about the pigments and their spectroscopic properties can be found in refs 5, 10, and 11. It is important to realize that the core contains 66 pigments that fluoresce around 660 nm, whereas only 6 pigments fluoresce around 680 nm. The presence of antenna systems on the one hand increases the capability of the photosystems to absorb sunlight, which is important in low-intensity sunlight, but on the other hand, this also increases the probability that photodamage occurs in the presence of strong light. To overcome this problem, different kinds of self-protection mechanisms were developed during the long evolutionary history of the photosynthetic organisms, including cyanobacteria. One important protection mechanism, called blue-green light induced NPQ, was found in all cyanobacteria that contain the so-called orange carotenoid protein (OCP), and the phenomenon has been studied Special Issue: Rienk van Grondelle Festschrift Received: September 26, 2012 Revised: December 11, 2012 Published: December 14, 2012 Article pubs.acs.org/JPCB © 2012 American Chemical Society 11000 dx.doi.org/10.1021/jp309570u | J. Phys. Chem. B 2013, 117, 11000−11006

Welcome message from author
This document is posted to help you gain knowledge. Please leave a comment to let me know what you think about it! Share it to your friends and learn new things together.
Transcript
Light Harvesting and Blue-Green Light Induced Non-PhotochemicalQuenching in Two Different C‑Phycocyanin Mutants of SynechocystisPCC 6803Lijin Tian,† Ivo H. M. van Stokkum,‡ Rob B. M. Koehorst,†,§ and Herbert van Amerongen*,†,§
†Laboratory of Biophysics, Wageningen University, P.O. Box 8128, 6700 ET, Wageningen, The Netherlands‡Biophysics Group, Department of Physics and Astronomy, Faculty of Sciences, VU University, DeBoelelaan1081, 1081 HVAmsterdam, The Netherlands§MicroSpectroscopy Centre, Wageningen University, P.O. Box 8128, 6700 ET, Wageningen, The Netherlands
*S Supporting Information
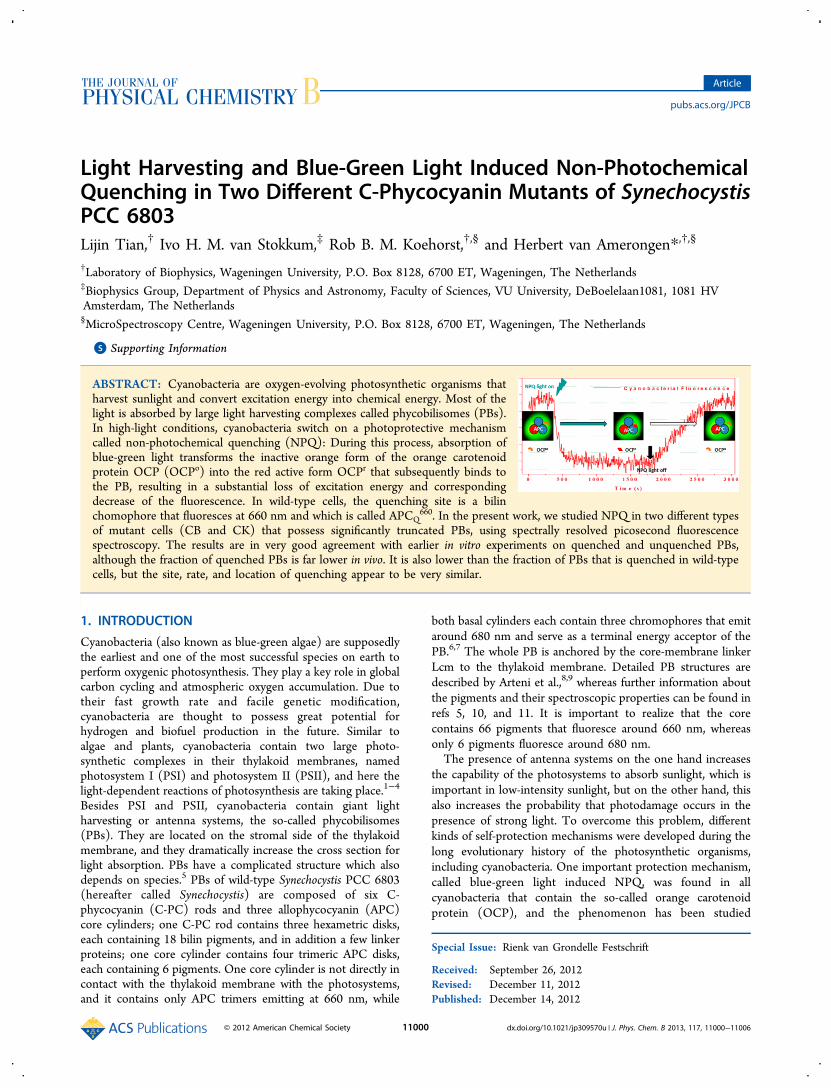
ABSTRACT: Cyanobacteria are oxygen-evolving photosynthetic organisms thatharvest sunlight and convert excitation energy into chemical energy. Most of thelight is absorbed by large light harvesting complexes called phycobilisomes (PBs).In high-light conditions, cyanobacteria switch on a photoprotective mechanismcalled non-photochemical quenching (NPQ): During this process, absorption ofblue-green light transforms the inactive orange form of the orange carotenoidprotein OCP (OCPo) into the red active form OCPr that subsequently binds tothe PB, resulting in a substantial loss of excitation energy and correspondingdecrease of the fluorescence. In wild-type cells, the quenching site is a bilinchomophore that fluoresces at 660 nm and which is called APCQ
660. In the present work, we studied NPQ in two different typesof mutant cells (CB and CK) that possess significantly truncated PBs, using spectrally resolved picosecond fluorescencespectroscopy. The results are in very good agreement with earlier in vitro experiments on quenched and unquenched PBs,although the fraction of quenched PBs is far lower in vivo. It is also lower than the fraction of PBs that is quenched in wild-typecells, but the site, rate, and location of quenching appear to be very similar.
1. INTRODUCTION
Cyanobacteria (also known as blue-green algae) are supposedlythe earliest and one of the most successful species on earth toperform oxygenic photosynthesis. They play a key role in globalcarbon cycling and atmospheric oxygen accumulation. Due totheir fast growth rate and facile genetic modification,cyanobacteria are thought to possess great potential forhydrogen and biofuel production in the future. Similar toalgae and plants, cyanobacteria contain two large photo-synthetic complexes in their thylakoid membranes, namedphotosystem I (PSI) and photosystem II (PSII), and here thelight-dependent reactions of photosynthesis are taking place.1−4
Besides PSI and PSII, cyanobacteria contain giant lightharvesting or antenna systems, the so-called phycobilisomes(PBs). They are located on the stromal side of the thylakoidmembrane, and they dramatically increase the cross section forlight absorption. PBs have a complicated structure which alsodepends on species.5 PBs of wild-type Synechocystis PCC 6803(hereafter called Synechocystis) are composed of six C-phycocyanin (C-PC) rods and three allophycocyanin (APC)core cylinders; one C-PC rod contains three hexametric disks,each containing 18 bilin pigments, and in addition a few linkerproteins; one core cylinder contains four trimeric APC disks,each containing 6 pigments. One core cylinder is not directly incontact with the thylakoid membrane with the photosystems,and it contains only APC trimers emitting at 660 nm, while
both basal cylinders each contain three chromophores that emitaround 680 nm and serve as a terminal energy acceptor of thePB.6,7 The whole PB is anchored by the core-membrane linkerLcm to the thylakoid membrane. Detailed PB structures aredescribed by Arteni et al.,8,9 whereas further information aboutthe pigments and their spectroscopic properties can be found inrefs 5, 10, and 11. It is important to realize that the corecontains 66 pigments that fluoresce around 660 nm, whereasonly 6 pigments fluoresce around 680 nm.The presence of antenna systems on the one hand increases
the capability of the photosystems to absorb sunlight, which isimportant in low-intensity sunlight, but on the other hand, thisalso increases the probability that photodamage occurs in thepresence of strong light. To overcome this problem, differentkinds of self-protection mechanisms were developed during thelong evolutionary history of the photosynthetic organisms,including cyanobacteria. One important protection mechanism,called blue-green light induced NPQ, was found in allcyanobacteria that contain the so-called orange carotenoidprotein (OCP), and the phenomenon has been studied
Special Issue: Rienk van Grondelle Festschrift
Received: September 26, 2012Revised: December 11, 2012Published: December 14, 2012
Article
pubs.acs.org/JPCB
© 2012 American Chemical Society 11000 dx.doi.org/10.1021/jp309570u | J. Phys. Chem. B 2013, 117, 11000−11006
extensively during the past 10 years.11−29 This protection isrealized in vivo by interactions between at least three differentproteins, including OCP, the fluorescence recovery protein(FRP), and one of the core proteins of the PBs.24,30 In strongblue-green light, OCP changes from its inactive orange form(OCPo) into its red active (OCPr) form, binds to APC, andquenches to a large extent the electronic excitations in the PBsby dissipating the excitation energy as heat. In this way, most ofthe excitations are prevented from reaching the photosystems,thereby protecting them against photodamage. When theintensity of the blue-green light is significantly decreased again,the binding between OCPr and APC is released with the help ofFRP, and the quenching process is stopped and thus theexcitation energy can reach the reaction centers (RCs) again ina “normal” way.24
In a recent study, we have performed time-resolvedfluorescence measurements on isolated PBs from wild-typecells and from two different mutants. We found the samequenching site and a similar quenching rate in vitro as wasreported before for wild-type cells in vivo.11 The in vitromeasurements were performed in the presence of a large excessof OCP as compared to PBs (approximate ratio of 40:1), whichled to 85% of quenching for the CK phycobilisomes and evenhigher values for the CB and wild-type PBs. Earlier measure-ments on CK cells also showed the presence of NPQ, but thelevel of quenching was below 10%. This is probably partly dueto the occurrence of competing excitation energy transfer(EET) to the photosystems but possibly also due to thepresence of FRP and to relatively low concentrations of OCP.In order to investigate whether the rates of EET and the ratesand locations of quenching as observed for isolated PBs are alsothe same for the two types of mutant cells in vivo, the presentstudy was undertaken. Another reason to study these antennasize-truncated mutants is the increasing interest in the questionto which extent the antenna size influences the production ofbiomass.31,32 Although this is not the main issue of the presentwork, a kinetic model including light harvesting and photo-protection as will be proposed here can potentially be useful.One of the two studied mutants, called CK, contains PSI andPSII as well as the APC core, but it completely lacks the C_PCrods.33,34 The other one (CB) is lacking both the intermediaryand the core-distal C_PC hexamers and only contains core-proximal C_PC besides the other photosynthetic complexes,PSI, PSII, and APC core.35 Picosecond time-resolvedfluorescence measurements were performed using a synchro-scan streak-camera system. The obtained data sets wereanalyzed by using both global analysis and compartmental-based target analysis in a similar way, as was done before forwild-type cells.26 It turns out that the blue-green lightquenching takes place on APC660 pigments in both mutantswith a slightly smaller quenched fraction than in wild-type cellsunder similar conditions. The quenching rates cannot bedetermined very accurately due to the small fraction ofquenched PBs for both mutants, but the quenching ratesappear to be rather similar in vivo and in vitro.
2. MATERIALS AND METHODS2.1. Growing Conditions of Synechocystis Cells and
Construction of Mutants. For the construction of the CKand CB mutants, we refer to refs 33−37. Two mutants weregrown photoautotrophically in a modified BG11 medium,38
with twice the concentration of sodium nitrate and with 10 mMNaHCO3 added. Cells were grown in 250 mL flasks with 60
mL growing volume in a rotary shaker (45 rpm) at 30 °C andilluminated by white light, giving a total intensity of 40μmol·m−2·s−1. All the cells were kept in the logarithmic growthphase by refreshing the medium every 2 or 3 days dependingon growth rate.
2.2. Steady-State Absorption. Absorption spectra wererecorded on a Cary 5E spectrophotometer, equipped with anintegrating diffuse reflectance sphere (DRA-CA-50, Labsphere)to minimize distortion of the absorption spectra by lightscattering. The optical path length of the cell was 1 cm. Allmeasurements were performed at room temperature.
2.3. Time-Resolved Fluorescence. Time-resolved fluo-rescence measurements were performed on a picosecondstreak-camera system.36,39 Images were corrected for back-ground signals and detector sensitivity, averaged, and sliced upinto traces of 4 nm wide. The time window was 800 ps for allmeasurements. A laser power of 30 μW was used. Theexcitation spot size was typically ∼100 μm in diameter, and thelaser repetition rate was 250 kHz. The instrument responsefunction (IRF) was described with a double Gaussian,consisting of a dominating narrow Gaussian of ∼8.0 ps fwhmon top of a minor broad Gaussian of ∼40−50 ps in the case of590 nm excitation. For the 400 nm excitation experiments, oneGaussian of ∼9.2 ps fwhm was sufficient to describe/fit thedata. The sample was stirred with a magnetic stirring bar(stirring rate ∼10 Hz). All measurements were performed at 21°C, and one measurement took 20 min. Cells wereconcentrated 3−5 times by low-speed centrifugation and darkadapted for 5 min before the time-resolved fluorescencemeasurements were started.Conditions for measuring time-resolved fluorescence of cells
during quenching have been described previously;26 the sameactinic blue-green light was used.
2.4. Data Analysis. Data obtained with the streak-camerasetup were analyzed with the TIMP package for the “R projectfor Statistical Computing (R Development Core Team 2008)”and its graphical user interface (GUI) Glotaran; for details, seerefs 40 and 41.With global analysis, the data were fitted globally as a sum of
exponential decay functions convolved with an IRF and theamplitudes of each decay component as a function ofwavelength constitute the so-called decay-associated spectra(DAS). Apart from providing an objective mathematicaldescription of the data sets, this analysis provides global insightinto the underlying excitation energy transfer and chargeseparation processes.42
For a more detailed analysis of the data, use is made of targetanalysis where the data sets are fitted with differentcompartmental schemes (also called target models). Thespectrum of each compartment and the energy transfer ratesbetween them are estimated together with various decay rates,for instance, corresponding to charge separation or non-photochemical quenching. The methodology of global andtarget analysis is described in detail in ref 43.
3. RESULTS3.1. Absorption Spectra. The absorption spectra of WT
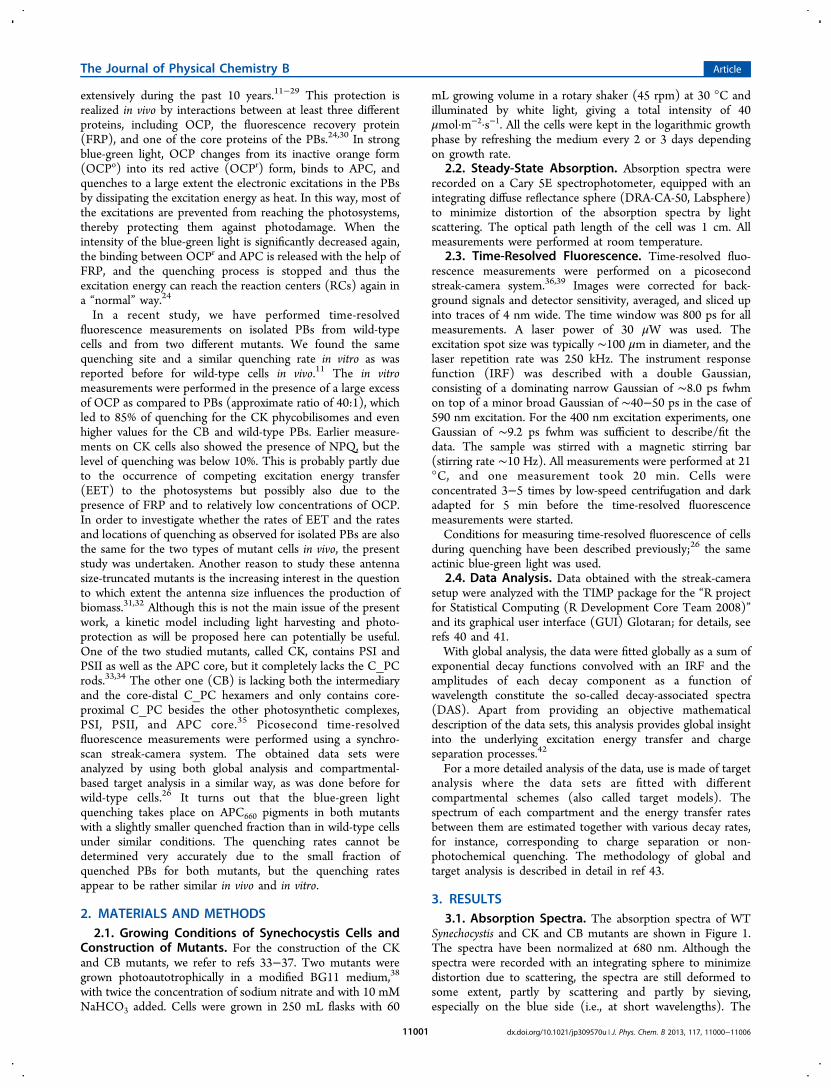
Synechocystis and CK and CB mutants are shown in Figure 1.The spectra have been normalized at 680 nm. Although thespectra were recorded with an integrating sphere to minimizedistortion due to scattering, the spectra are still deformed tosome extent, partly by scattering and partly by sieving,especially on the blue side (i.e., at short wavelengths). The
The Journal of Physical Chemistry B Article
dx.doi.org/10.1021/jp309570u | J. Phys. Chem. B 2013, 117, 11000−1100611001
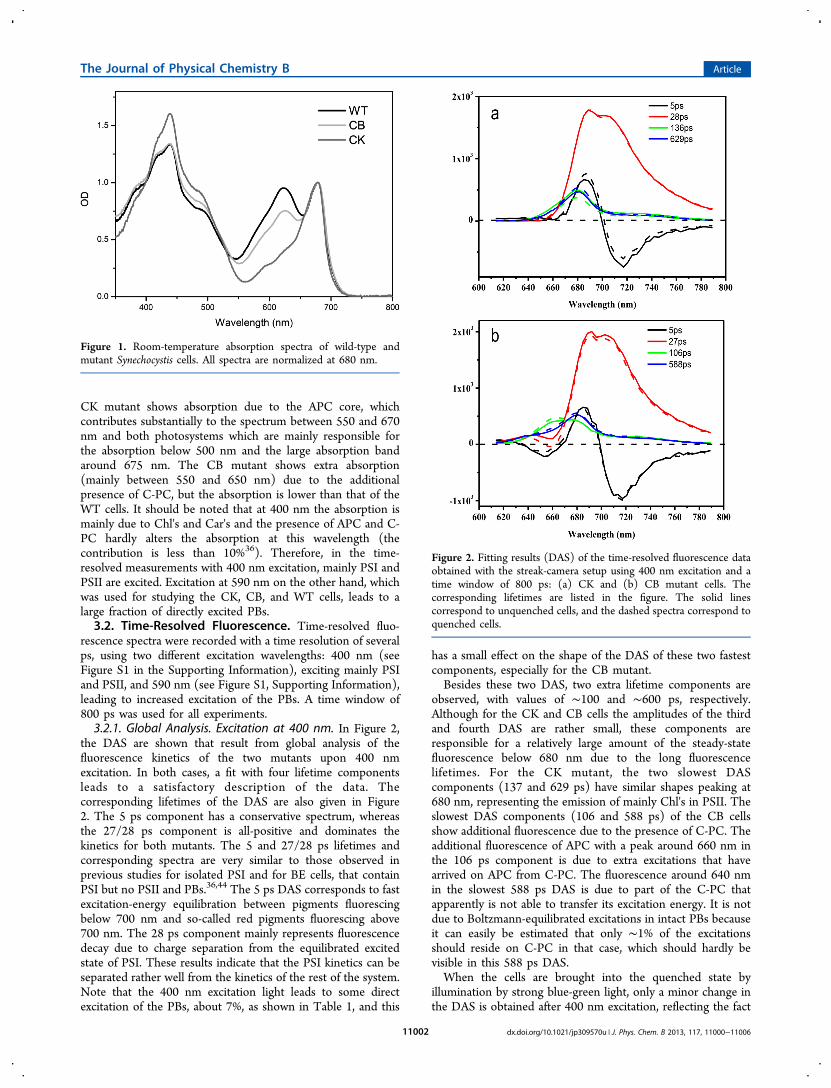
CK mutant shows absorption due to the APC core, whichcontributes substantially to the spectrum between 550 and 670nm and both photosystems which are mainly responsible forthe absorption below 500 nm and the large absorption bandaround 675 nm. The CB mutant shows extra absorption(mainly between 550 and 650 nm) due to the additionalpresence of C-PC, but the absorption is lower than that of theWT cells. It should be noted that at 400 nm the absorption ismainly due to Chl's and Car's and the presence of APC and C-PC hardly alters the absorption at this wavelength (thecontribution is less than 10%36). Therefore, in the time-resolved measurements with 400 nm excitation, mainly PSI andPSII are excited. Excitation at 590 nm on the other hand, whichwas used for studying the CK, CB, and WT cells, leads to alarge fraction of directly excited PBs.3.2. Time-Resolved Fluorescence. Time-resolved fluo-
rescence spectra were recorded with a time resolution of severalps, using two different excitation wavelengths: 400 nm (seeFigure S1 in the Supporting Information), exciting mainly PSIand PSII, and 590 nm (see Figure S1, Supporting Information),leading to increased excitation of the PBs. A time window of800 ps was used for all experiments.3.2.1. Global Analysis. Excitation at 400 nm. In Figure 2,
the DAS are shown that result from global analysis of thefluorescence kinetics of the two mutants upon 400 nmexcitation. In both cases, a fit with four lifetime componentsleads to a satisfactory description of the data. Thecorresponding lifetimes of the DAS are also given in Figure2. The 5 ps component has a conservative spectrum, whereasthe 27/28 ps component is all-positive and dominates thekinetics for both mutants. The 5 and 27/28 ps lifetimes andcorresponding spectra are very similar to those observed inprevious studies for isolated PSI and for BE cells, that containPSI but no PSII and PBs.36,44 The 5 ps DAS corresponds to fastexcitation-energy equilibration between pigments fluorescingbelow 700 nm and so-called red pigments fluorescing above700 nm. The 28 ps component mainly represents fluorescencedecay due to charge separation from the equilibrated excitedstate of PSI. These results indicate that the PSI kinetics can beseparated rather well from the kinetics of the rest of the system.Note that the 400 nm excitation light leads to some directexcitation of the PBs, about 7%, as shown in Table 1, and this
has a small effect on the shape of the DAS of these two fastestcomponents, especially for the CB mutant.Besides these two DAS, two extra lifetime components are
observed, with values of ∼100 and ∼600 ps, respectively.Although for the CK and CB cells the amplitudes of the thirdand fourth DAS are rather small, these components areresponsible for a relatively large amount of the steady-statefluorescence below 680 nm due to the long fluorescencelifetimes. For the CK mutant, the two slowest DAScomponents (137 and 629 ps) have similar shapes peaking at680 nm, representing the emission of mainly Chl's in PSII. Theslowest DAS components (106 and 588 ps) of the CB cellsshow additional fluorescence due to the presence of C-PC. Theadditional fluorescence of APC with a peak around 660 nm inthe 106 ps component is due to extra excitations that havearrived on APC from C-PC. The fluorescence around 640 nmin the slowest 588 ps DAS is due to part of the C-PC thatapparently is not able to transfer its excitation energy. It is notdue to Boltzmann-equilibrated excitations in intact PBs becauseit can easily be estimated that only ∼1% of the excitationsshould reside on C-PC in that case, which should hardly bevisible in this 588 ps DAS.When the cells are brought into the quenched state by
illumination by strong blue-green light, only a minor change inthe DAS is obtained after 400 nm excitation, reflecting the fact
Figure 1. Room-temperature absorption spectra of wild-type andmutant Synechocystis cells. All spectra are normalized at 680 nm.
Figure 2. Fitting results (DAS) of the time-resolved fluorescence dataobtained with the streak-camera setup using 400 nm excitation and atime window of 800 ps: (a) CK and (b) CB mutant cells. Thecorresponding lifetimes are listed in the figure. The solid linescorrespond to unquenched cells, and the dashed spectra correspond toquenched cells.
The Journal of Physical Chemistry B Article
dx.doi.org/10.1021/jp309570u | J. Phys. Chem. B 2013, 117, 11000−1100611002
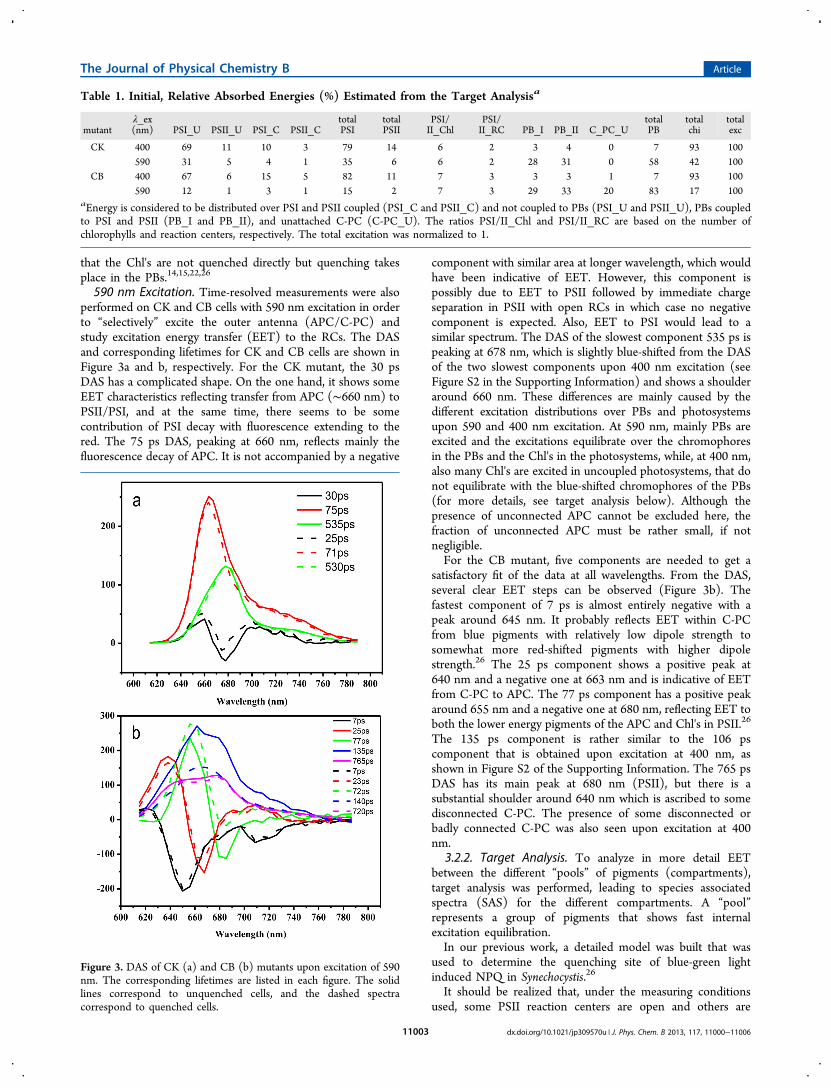
that the Chl's are not quenched directly but quenching takesplace in the PBs.14,15,22,26
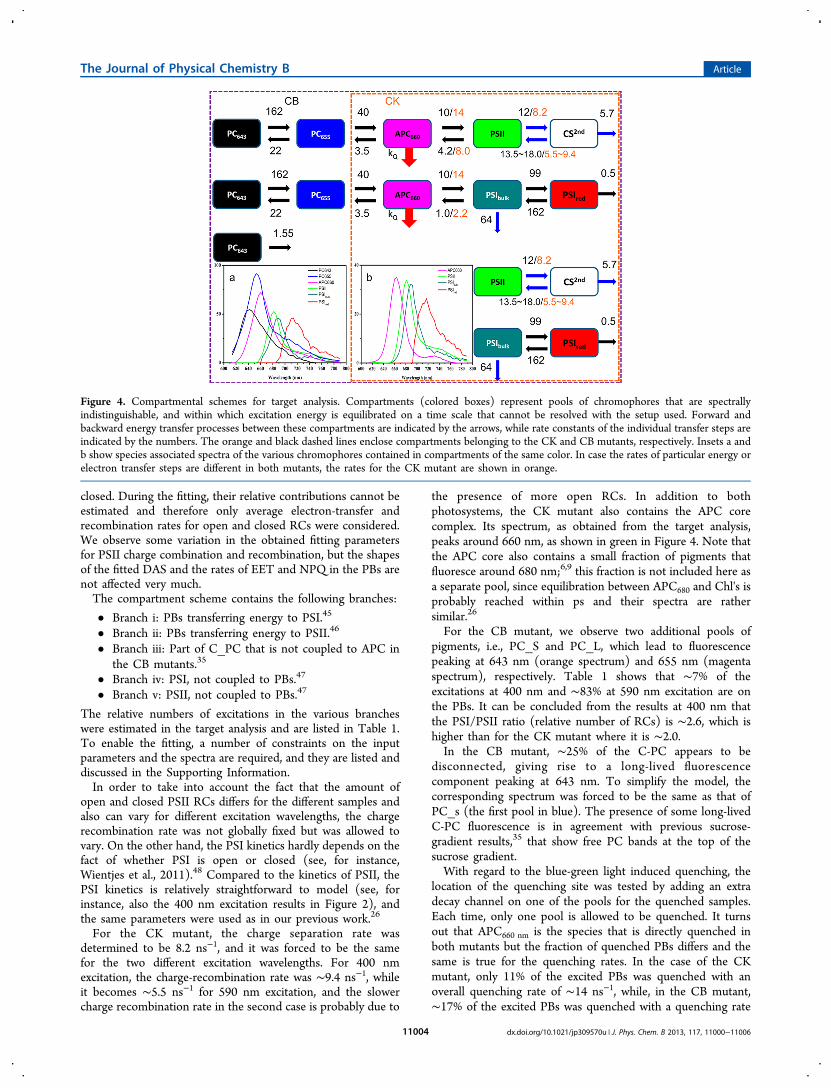
590 nm Excitation. Time-resolved measurements were alsoperformed on CK and CB cells with 590 nm excitation in orderto “selectively” excite the outer antenna (APC/C-PC) andstudy excitation energy transfer (EET) to the RCs. The DASand corresponding lifetimes for CK and CB cells are shown inFigure 3a and b, respectively. For the CK mutant, the 30 psDAS has a complicated shape. On the one hand, it shows someEET characteristics reflecting transfer from APC (∼660 nm) toPSII/PSI, and at the same time, there seems to be somecontribution of PSI decay with fluorescence extending to thered. The 75 ps DAS, peaking at 660 nm, reflects mainly thefluorescence decay of APC. It is not accompanied by a negative
component with similar area at longer wavelength, which wouldhave been indicative of EET. However, this component ispossibly due to EET to PSII followed by immediate chargeseparation in PSII with open RCs in which case no negativecomponent is expected. Also, EET to PSI would lead to asimilar spectrum. The DAS of the slowest component 535 ps ispeaking at 678 nm, which is slightly blue-shifted from the DASof the two slowest components upon 400 nm excitation (seeFigure S2 in the Supporting Information) and shows a shoulderaround 660 nm. These differences are mainly caused by thedifferent excitation distributions over PBs and photosystemsupon 590 and 400 nm excitation. At 590 nm, mainly PBs areexcited and the excitations equilibrate over the chromophoresin the PBs and the Chl's in the photosystems, while, at 400 nm,also many Chl's are excited in uncoupled photosystems, that donot equilibrate with the blue-shifted chromophores of the PBs(for more details, see target analysis below). Although thepresence of unconnected APC cannot be excluded here, thefraction of unconnected APC must be rather small, if notnegligible.For the CB mutant, five components are needed to get a
satisfactory fit of the data at all wavelengths. From the DAS,several clear EET steps can be observed (Figure 3b). Thefastest component of 7 ps is almost entirely negative with apeak around 645 nm. It probably reflects EET within C-PCfrom blue pigments with relatively low dipole strength tosomewhat more red-shifted pigments with higher dipolestrength.26 The 25 ps component shows a positive peak at640 nm and a negative one at 663 nm and is indicative of EETfrom C-PC to APC. The 77 ps component has a positive peakaround 655 nm and a negative one at 680 nm, reflecting EET toboth the lower energy pigments of the APC and Chl's in PSII.26
The 135 ps component is rather similar to the 106 pscomponent that is obtained upon excitation at 400 nm, asshown in Figure S2 of the Supporting Information. The 765 psDAS has its main peak at 680 nm (PSII), but there is asubstantial shoulder around 640 nm which is ascribed to somedisconnected C-PC. The presence of some disconnected orbadly connected C-PC was also seen upon excitation at 400nm.
3.2.2. Target Analysis. To analyze in more detail EETbetween the different “pools” of pigments (compartments),target analysis was performed, leading to species associatedspectra (SAS) for the different compartments. A “pool”represents a group of pigments that shows fast internalexcitation equilibration.In our previous work, a detailed model was built that was
used to determine the quenching site of blue-green lightinduced NPQ in Synechocystis.26
It should be realized that, under the measuring conditionsused, some PSII reaction centers are open and others are
Table 1. Initial, Relative Absorbed Energies (%) Estimated from the Target Analysisa
mutantλ_ex(nm) PSI_U PSII_U PSI_C PSII_C
totalPSI
totalPSII
PSI/II_Chl
PSI/II_RC PB_I PB_II C_PC_U
totalPB
totalchi
totalexc
CK 400 69 11 10 3 79 14 6 2 3 4 0 7 93 100590 31 5 4 1 35 6 6 2 28 31 0 58 42 100
CB 400 67 6 15 5 82 11 7 3 3 3 1 7 93 100590 12 1 3 1 15 2 7 3 29 33 20 83 17 100
aEnergy is considered to be distributed over PSI and PSII coupled (PSI_C and PSII_C) and not coupled to PBs (PSI_U and PSII_U), PBs coupledto PSI and PSII (PB_I and PB_II), and unattached C-PC (C-PC_U). The ratios PSI/II_Chl and PSI/II_RC are based on the number ofchlorophylls and reaction centers, respectively. The total excitation was normalized to 1.
Figure 3. DAS of CK (a) and CB (b) mutants upon excitation of 590nm. The corresponding lifetimes are listed in each figure. The solidlines correspond to unquenched cells, and the dashed spectracorrespond to quenched cells.
The Journal of Physical Chemistry B Article
dx.doi.org/10.1021/jp309570u | J. Phys. Chem. B 2013, 117, 11000−1100611003
closed. During the fitting, their relative contributions cannot beestimated and therefore only average electron-transfer andrecombination rates for open and closed RCs were considered.We observe some variation in the obtained fitting parametersfor PSII charge combination and recombination, but the shapesof the fitted DAS and the rates of EET and NPQ in the PBs arenot affected very much.The compartment scheme contains the following branches:
• Branch i: PBs transferring energy to PSI.45
• Branch ii: PBs transferring energy to PSII.46
• Branch iii: Part of C_PC that is not coupled to APC inthe CB mutants.35
• Branch iv: PSI, not coupled to PBs.47
• Branch v: PSII, not coupled to PBs.47
The relative numbers of excitations in the various brancheswere estimated in the target analysis and are listed in Table 1.To enable the fitting, a number of constraints on the inputparameters and the spectra are required, and they are listed anddiscussed in the Supporting Information.In order to take into account the fact that the amount of
open and closed PSII RCs differs for the different samples andalso can vary for different excitation wavelengths, the chargerecombination rate was not globally fixed but was allowed tovary. On the other hand, the PSI kinetics hardly depends on thefact of whether PSI is open or closed (see, for instance,Wientjes et al., 2011).48 Compared to the kinetics of PSII, thePSI kinetics is relatively straightforward to model (see, forinstance, also the 400 nm excitation results in Figure 2), andthe same parameters were used as in our previous work.26
For the CK mutant, the charge separation rate wasdetermined to be 8.2 ns−1, and it was forced to be the samefor the two different excitation wavelengths. For 400 nmexcitation, the charge-recombination rate was ∼9.4 ns−1, whileit becomes ∼5.5 ns−1 for 590 nm excitation, and the slowercharge recombination rate in the second case is probably due to
the presence of more open RCs. In addition to bothphotosystems, the CK mutant also contains the APC corecomplex. Its spectrum, as obtained from the target analysis,peaks around 660 nm, as shown in green in Figure 4. Note thatthe APC core also contains a small fraction of pigments thatfluoresce around 680 nm;6,9 this fraction is not included here asa separate pool, since equilibration between APC680 and Chl's isprobably reached within ps and their spectra are rathersimilar.26
For the CB mutant, we observe two additional pools ofpigments, i.e., PC_S and PC_L, which lead to fluorescencepeaking at 643 nm (orange spectrum) and 655 nm (magentaspectrum), respectively. Table 1 shows that ∼7% of theexcitations at 400 nm and ∼83% at 590 nm excitation are onthe PBs. It can be concluded from the results at 400 nm thatthe PSI/PSII ratio (relative number of RCs) is ∼2.6, which ishigher than for the CK mutant where it is ∼2.0.In the CB mutant, ∼25% of the C-PC appears to be
disconnected, giving rise to a long-lived fluorescencecomponent peaking at 643 nm. To simplify the model, thecorresponding spectrum was forced to be the same as that ofPC_s (the first pool in blue). The presence of some long-livedC-PC fluorescence is in agreement with previous sucrose-gradient results,35 that show free PC bands at the top of thesucrose gradient.With regard to the blue-green light induced quenching, the
location of the quenching site was tested by adding an extradecay channel on one of the pools for the quenched samples.Each time, only one pool is allowed to be quenched. It turnsout that APC660 nm is the species that is directly quenched inboth mutants but the fraction of quenched PBs differs and thesame is true for the quenching rates. In the case of the CKmutant, only 11% of the excited PBs was quenched with anoverall quenching rate of ∼14 ns−1, while, in the CB mutant,∼17% of the excited PBs was quenched with a quenching rate
Figure 4. Compartmental schemes for target analysis. Compartments (colored boxes) represent pools of chromophores that are spectrallyindistinguishable, and within which excitation energy is equilibrated on a time scale that cannot be resolved with the setup used. Forward andbackward energy transfer processes between these compartments are indicated by the arrows, while rate constants of the individual transfer steps areindicated by the numbers. The orange and black dashed lines enclose compartments belonging to the CK and CB mutants, respectively. Insets a andb show species associated spectra of the various chromophores contained in compartments of the same color. In case the rates of particular energy orelectron transfer steps are different in both mutants, the rates for the CK mutant are shown in orange.
The Journal of Physical Chemistry B Article
dx.doi.org/10.1021/jp309570u | J. Phys. Chem. B 2013, 117, 11000−1100611004
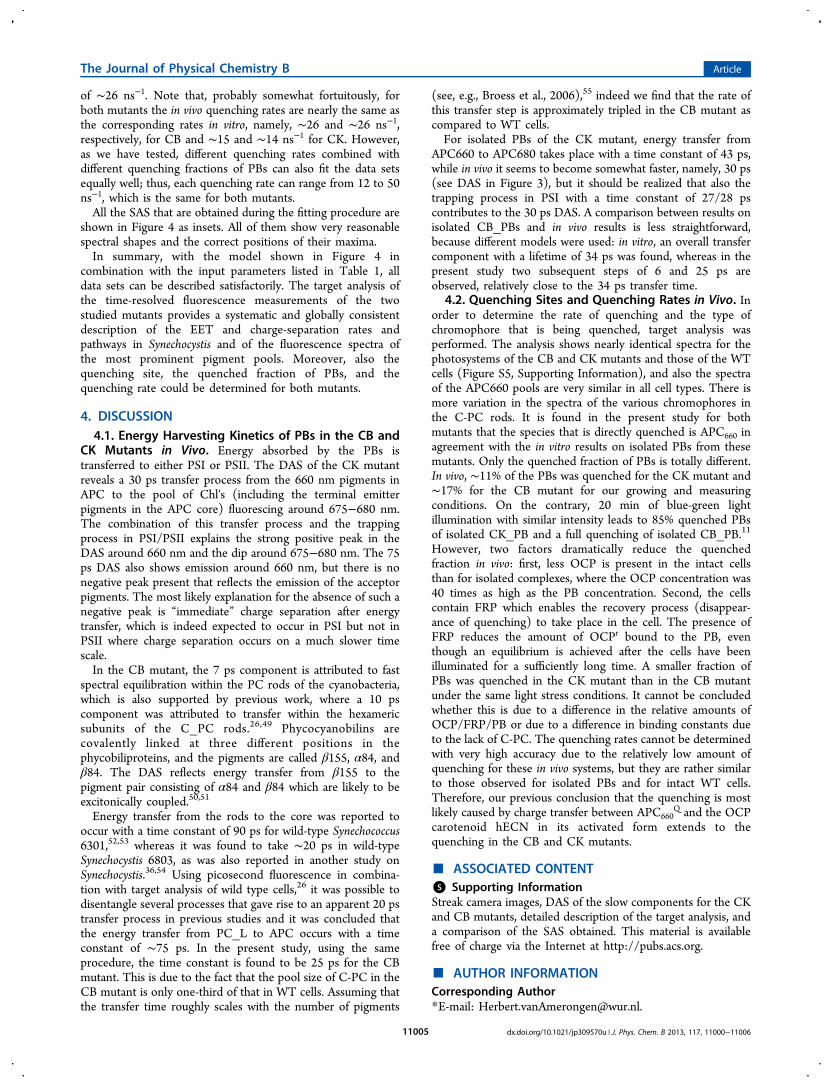
of ∼26 ns−1. Note that, probably somewhat fortuitously, forboth mutants the in vivo quenching rates are nearly the same asthe corresponding rates in vitro, namely, ∼26 and ∼26 ns−1,respectively, for CB and ∼15 and ∼14 ns−1 for CK. However,as we have tested, different quenching rates combined withdifferent quenching fractions of PBs can also fit the data setsequally well; thus, each quenching rate can range from 12 to 50ns−1, which is the same for both mutants.All the SAS that are obtained during the fitting procedure are
shown in Figure 4 as insets. All of them show very reasonablespectral shapes and the correct positions of their maxima.In summary, with the model shown in Figure 4 in
combination with the input parameters listed in Table 1, alldata sets can be described satisfactorily. The target analysis ofthe time-resolved fluorescence measurements of the twostudied mutants provides a systematic and globally consistentdescription of the EET and charge-separation rates andpathways in Synechocystis and of the fluorescence spectra ofthe most prominent pigment pools. Moreover, also thequenching site, the quenched fraction of PBs, and thequenching rate could be determined for both mutants.
4. DISCUSSION4.1. Energy Harvesting Kinetics of PBs in the CB and
CK Mutants in Vivo. Energy absorbed by the PBs istransferred to either PSI or PSII. The DAS of the CK mutantreveals a 30 ps transfer process from the 660 nm pigments inAPC to the pool of Chl's (including the terminal emitterpigments in the APC core) fluorescing around 675−680 nm.The combination of this transfer process and the trappingprocess in PSI/PSII explains the strong positive peak in theDAS around 660 nm and the dip around 675−680 nm. The 75ps DAS also shows emission around 660 nm, but there is nonegative peak present that reflects the emission of the acceptorpigments. The most likely explanation for the absence of such anegative peak is “immediate” charge separation after energytransfer, which is indeed expected to occur in PSI but not inPSII where charge separation occurs on a much slower timescale.In the CB mutant, the 7 ps component is attributed to fast
spectral equilibration within the PC rods of the cyanobacteria,which is also supported by previous work, where a 10 pscomponent was attributed to transfer within the hexamericsubunits of the C_PC rods.26,49 Phycocyanobilins arecovalently linked at three different positions in thephycobiliproteins, and the pigments are called β155, α84, andβ84. The DAS reflects energy transfer from β155 to thepigment pair consisting of α84 and β84 which are likely to beexcitonically coupled.50,51
Energy transfer from the rods to the core was reported tooccur with a time constant of 90 ps for wild-type Synechococcus6301,52,53 whereas it was found to take ∼20 ps in wild-typeSynechocystis 6803, as was also reported in another study onSynechocystis.36,54 Using picosecond fluorescence in combina-tion with target analysis of wild type cells,26 it was possible todisentangle several processes that gave rise to an apparent 20 pstransfer process in previous studies and it was concluded thatthe energy transfer from PC_L to APC occurs with a timeconstant of ∼75 ps. In the present study, using the sameprocedure, the time constant is found to be 25 ps for the CBmutant. This is due to the fact that the pool size of C-PC in theCB mutant is only one-third of that in WT cells. Assuming thatthe transfer time roughly scales with the number of pigments
(see, e.g., Broess et al., 2006),55 indeed we find that the rate ofthis transfer step is approximately tripled in the CB mutant ascompared to WT cells.For isolated PBs of the CK mutant, energy transfer from
APC660 to APC680 takes place with a time constant of 43 ps,while in vivo it seems to become somewhat faster, namely, 30 ps(see DAS in Figure 3), but it should be realized that also thetrapping process in PSI with a time constant of 27/28 pscontributes to the 30 ps DAS. A comparison between results onisolated CB_PBs and in vivo results is less straightforward,because different models were used: in vitro, an overall transfercomponent with a lifetime of 34 ps was found, whereas in thepresent study two subsequent steps of 6 and 25 ps areobserved, relatively close to the 34 ps transfer time.
4.2. Quenching Sites and Quenching Rates in Vivo. Inorder to determine the rate of quenching and the type ofchromophore that is being quenched, target analysis wasperformed. The analysis shows nearly identical spectra for thephotosystems of the CB and CK mutants and those of the WTcells (Figure S5, Supporting Information), and also the spectraof the APC660 pools are very similar in all cell types. There ismore variation in the spectra of the various chromophores inthe C-PC rods. It is found in the present study for bothmutants that the species that is directly quenched is APC660 inagreement with the in vitro results on isolated PBs from thesemutants. Only the quenched fraction of PBs is totally different.In vivo, ∼11% of the PBs was quenched for the CK mutant and∼17% for the CB mutant for our growing and measuringconditions. On the contrary, 20 min of blue-green lightillumination with similar intensity leads to 85% quenched PBsof isolated CK_PB and a full quenching of isolated CB_PB.11
However, two factors dramatically reduce the quenchedfraction in vivo: first, less OCP is present in the intact cellsthan for isolated complexes, where the OCP concentration was40 times as high as the PB concentration. Second, the cellscontain FRP which enables the recovery process (disappear-ance of quenching) to take place in the cell. The presence ofFRP reduces the amount of OCPr bound to the PB, eventhough an equilibrium is achieved after the cells have beenilluminated for a sufficiently long time. A smaller fraction ofPBs was quenched in the CK mutant than in the CB mutantunder the same light stress conditions. It cannot be concludedwhether this is due to a difference in the relative amounts ofOCP/FRP/PB or due to a difference in binding constants dueto the lack of C-PC. The quenching rates cannot be determinedwith very high accuracy due to the relatively low amount ofquenching for these in vivo systems, but they are rather similarto those observed for isolated PBs and for intact WT cells.Therefore, our previous conclusion that the quenching is mostlikely caused by charge transfer between APC660
Q and the OCPcarotenoid hECN in its activated form extends to thequenching in the CB and CK mutants.
■ ASSOCIATED CONTENT*S Supporting InformationStreak camera images, DAS of the slow components for the CKand CB mutants, detailed description of the target analysis, anda comparison of the SAS obtained. This material is availablefree of charge via the Internet at http://pubs.acs.org.
■ AUTHOR INFORMATIONCorresponding Author*E-mail: [email protected].
The Journal of Physical Chemistry B Article
dx.doi.org/10.1021/jp309570u | J. Phys. Chem. B 2013, 117, 11000−1100611005
NotesThe authors declare no competing financial interest.
■ ACKNOWLEDGMENTS
We thank Dr. Ghada Ajlani for providing the mutant strains.We thank S. Laptenok (Ecole Polytechnique, 91128 Palaiseau,France) and J. Snellenburg (VU Amsterdam University) forhelp with the use of the TIMP package and the software ofGlotaran.
■ REFERENCES(1) Nelson, N.; Ben-Shem, A. Nat. Rev. Mol. Cell Biol. 2004, 5, 971−982.(2) Duysens, L. N.; Kamp, B. M.; Amesz, J. Nature 1961, 190, 510−511.(3) van Amerongen, H.; Valkunas, L.; van Grondelle, R. ExcitonDynamics in Different Antenna Complexes. Coherence andIncoherence. In Photosynthetic excitons; World Scientific PublishingCo. Pte. Ltd.: Singapore, 2000.(4) Croce, R.; van Amerongen, H. J. Photochem. Photobiol., B 2011,104, 142−153.(5) MacColl, R. J. Struct. Biol. 1998, 124, 311−334.(6) Glazer, A. N. Biochim. Biophys. Acta 1984, 768, 29−51.(7) Adir, N. Photosynth. Res. 2005, 85, 15−32.(8) Arteni, A. A.; Ajlani, G.; Boekema, E. J. Biochim. Biophys. Acta,Bioenerg. 2009, 1787, 272−279.(9) Jallet, D.; Gwizdala, M.; Kirilovsky, D. Biochim. Biophys. Acta,Bioenerg. 2011, 1817, 1418−1427.(10) Adir, N. Photosynth. Res. 2005, 85, 15−32.(11) Tian, L.; Gwizdala, M.; van Stokkum, Ivo H. M.; Koehorst, RobB. M.; Kirilovsky, D.; van Amerongen, H. Biophys. J. 2012, 102, 1692−1700.(12) El Bissati, K.; Delphin, E.; Murata, N.; Etienne, A. L.; Kirilovsky,D. Biochim. Biophys. Acta, Bioenerg. 2000, 1457, 229−242.(13) Rakhimberdieva, M. G.; Stadnichuk, I. N.; Elanskaya, T. V.;Karapetyan, N. V. FEBS Lett. 2004, 574, 85−88.(14) Scott, M.; McCollum, C.; Vasil’ev, S.; Crozier, C.; Espie, G. S.;Krol, M.; Huner, N. P. A.; Bruce, D. Biochemistry 2006, 45, 8952−8958.(15) Wilson, A.; Ajlani, G.; Verbavatz, J. M.; Vass, I.; Kerfeld, C. A.;Kirilovsky, D. Plant Cell 2006, 18, 992−1007.(16) Rakhimberdieva, M. G.; Bolychevtseva, Y. V.; Elanskaya, I. V.;Karapetyan, N. V. FEBS Lett. 2007, 581, 2429−2433.(17) Rakhimberdieva, M. G.; Vavilin, D. V.; Vermaas, W. F. J.;Elanskaya, I. V.; Karapetyan, N. V. Biochim. Biophys. Acta, Bioenerg.2007, 1767, 757−765.(18) Wilson, A.; Boulay, C.; Wilde, A.; Kerfeld, C. A.; Kirilovsky, D.Plant Cell 2007, 19, 656−672.(19) Bailey, S.; Grossman, A. Photochem. Photobiol. 2008, 84, 1410−1420.(20) Kirilovsky, D.; Boulay, C.; Abasova, L.; Six, C.; Vass, I. Biochim.Biophys. Acta, Bioenerg. 2008, 1777, 1344−1354.(21) Wilson, A.; Punginelli, C.; Gall, A.; Bonetti, C.; Alexandre, M.;Routaboul, J. M.; Kerfeld, C. A.; van Grondelle, R.; Robert, B.; Kennis,J. T. M.; Kirilovsky, D. Proc. Natl. Acad. Sci. U.S.A. 2008, 105, 12075−12080.(22) Rakhimberdieva, M. G.; Elanskaya, I. V.; Vermaas, W. F. J.;Karapetyan, N. V. Biochim. Biophys. Acta, Bioenerg. 2010, 1797, 241−249.(23) Wilson, A.; Kinney, J. N.; Zwart, P. H.; Punginelli, C.; D’Haene,S.; Perreau, F.; Klein, M. G.; Kirilovsky, D.; Kerfeld, C. A. J. Biol. Chem.2010, 285, 18364−18375.(24) Gwizdala, M.; Wilson, A.; Kirilovsky, D. Plant Cell 2011, 23,2631−2643.(25) Rakhimberdieva, M. G.; Kuzminov, F. I.; Elanskaya, I. V.;Karapetyan, N. V. FEBS Lett. 2011, 585, 585−589.
(26) Tian, L. J.; van Stokkum, I. H. M.; Koehorst, R. B. M.; Jongerius,A.; Kirilovsky, D.; van Amerongen, H. J. Am. Chem. Soc. 2011, 133,18304−18311.(27) Gorbunov, M. Y.; Kuzminov, F. I.; Fadeev, V. V.; Kim, J. D.;Falkowski, P. G. Biochim. Biophys. Acta, Bioenerg. 2011, 1807, 1591−1599.(28) Stadnichuk, I. N.; Yanyushin, M. F.; Maksimov, E. G.; Lukashev,E. P.; Zharmukhamedov, S. K.; Elanskaya, I. V.; Paschenko, V. Z.Biochim. Biophys. Acta, Bioenerg. 2012, 1817, 1436−1445.(29) Kuzminov, F. I.; Karapetyan, N. V.; Rakhimberdieva, M. G.;Elanskaya, I. V.; Gorbunov, M. Y.; Fadeev, V. V. Biochim. Biophys. Acta,Bioenerg. 2012, 1817, 1012−1021.(30) Boulay, C.; Wilson, A.; D’Haene, S.; Kirilovsky, D. Proc. Natl.Acad. Sci. U.S.A. 2010, 107, 11620−11625.(31) Melis, A. Plant Sci. 2009, 177, 272−280.(32) Page, L. E.; Liberton, M.; Pakrasi, H. B. Appl. Environ. Microbiol.2012, 78, 6349−6351.(33) Elmorjani, K.; Thomas, J. C.; Sebban, P. Arch. Microbiol. 1986,146, 186−191.(34) Ajlani, G.; Vernotte, C.; Dimagno, L.; Haselkorn, R. Biochim.Biophys. Acta, Bioenerg. 1995, 1231, 189−196.(35) Ughy, B.; Ajlani, G. Microbiology 2004, 150, 4147−4156.(36) Krumova, S. B.; Laptenok, S. P.; Borst, J. W.; Ughy, B.; Gombos,Z.; Ajlani, G.; van Amerongen, H. Biophys. J. 2010, 99, 2006−2015.(37) Ajlani, G.; Vernotte, C. Plant Mol. Biol. 1998, 37, 577−580.(38) Herdman, M.; Delaney, S. F.; Carr, N. G. J. Gen. Microbiol.1973, 79, 233−237.(39) van Oort, B.; Murali, S.; Wientjes, E.; Koehorst, R. B. M.;Spruijt, R. B.; van Hoek, A.; Croce, R.; van Amerongen, H. Chem. Phys.2009, 357, 113−119.(40) Mullen, K. M.; van Stokkum, I. H. M. J. Stat. Software 2007, 18,1−46.(41) Snellenburg, J. J.; Laptenok, S. P.; Seger, R.; Mullen, K. M.; VanStokkum, I. H. M. J. Stat. Software 2012, 49 (3), 1−22.(42) van Oort, B.; Amunts, A.; Borst, J. W.; van Hoek, A.; Nelson, N.;van Amerongen, H.; Croce, R. Biophys. J. 2008, 95, 5851−5861.(43) van Stokkum, I. H. M.; Larsen, D. S.; van Grondelle, R. Biochim.Biophys. Acta, Bioenerg. 2004, 1657, 82−104.(44) Gobets, B.; van Grondelle, R. Biochim. Biophys. Acta, Bioenerg.2001, 1507, 80−99.(45) Ashby, M. K.; Mullineaux, C. W. Photosynth. Res. 1999, 61, 169−179.(46) Mullineaux, C. W. Biochim. Biophys. Acta 1992, 1100, 285−292.(47) Ohki, K.; Okabe, Y.; Murakami, A.; Fujita, Y. Plant Cell Physiol.1987, 28, 1219−1226.(48) Wientjes, E.; Croce, R. Photosynth. Res. 2012, 111, 185−191.(49) Suter, G. W.; Holzwarth, A. R. Biophys. J. 1987, 52, 673−683.(50) van Amerongen, H.; Struve, W. S. J. Lumin. 992, 51, 29−38.(51) Demidov, A. A.; Borisov, A. Y. Biophys. J. 1993, 64, 1375−1384.(52) Gillbro, T.; Sandstrom, A.; Sundstrom, V.; Holzwarth, A. R.FEBS Lett. 1983, 162, 64−68.(53) Holzwarth, A. R. Physiol. Plant. 1991, 83, 518−528.(54) Bittersmann, E.; Vermaas, W. Biochim. Biophys. Acta 1991, 1098,105−116.(55) Broess, K.; Trinkunas, G.; van der Weij-de Wit, C. D.; Dekker, J.P.; van Hoek, A.; van Amerongen, H. Biophys. J. 2006, 91, 3776−3786.
■ NOTE ADDED AFTER ASAP PUBLICATIONThis article was published ASAP on December 28, 2012.Reference 41 has been modified. The correct version waspublished on January 4, 2013.
The Journal of Physical Chemistry B Article
dx.doi.org/10.1021/jp309570u | J. Phys. Chem. B 2013, 117, 11000−1100611006
Related Documents