Coordination Chemistry Reviews 249 (2005) 97–129 Review Ligand K-edge X-ray absorption spectroscopy: covalency of ligand–metal bonds Edward I. Solomon a,∗ , Britt Hedman b,1 , Keith O. Hodgson a,b , Abhishek Dey a , Robert K. Szilagyi c a Department of Chemistry, Stanford University, Stanford, CA 94305, USA b Stanford Synchrotron Radiation Laboratory, Stanford, CA 94309, USA c Department of Chemistry and Biochemistry, Montana State University, MT 59717, USA Received 1 October 2003; accepted 12 March 2004 Available online 23 July 2004 Contents Abstract ................................................................................................................................. 98 1. Introduction ........................................................................................................................... 98 2. The experiment ........................................................................................................................ 99 2.1. Experimental setup ................................................................................................................ 99 2.2. Data reduction ................................................................................................................... 100 3. Methodology ........................................................................................................................ 102 3.1. Theoretical background ........................................................................................................... 102 3.2. Effect of geometry and bridging mode on pre-edge features ........................................................................... 104 3.2.1. Change in geometry from square planar (D 4h ) to tetrahedral (D 2d ) ................................................................ 104 3.2.2. Change in binding mode from terminal to bridging .............................................................................. 104 3.3. Extension of the methodology to d 10−n (n ≥ 1) systems: Cl K-edge XAS of transition metal chlorides .................................... 105 3.3.1. Covalency from the pre-edge intensity .......................................................................................... 105 3.4. DFT calculation methods ......................................................................................................... 107 4. Cu–S protein sites .................................................................................................................... 109 4.1. Blue Cu site ..................................................................................................................... 110 4.2. Cu A site ......................................................................................................................... 111 4.3. Functional relevance of the Cu(II)–S(Cys) covalent bond ............................................................................. 112 5. Ligand K-edge XAS of iron–sulfur active sites and their model complexes ................................................................. 113 5.1. Mononuclear iron–sulfur models of rubredoxins ..................................................................................... 113 5.1.1. S K-edge XAS of [M(SR) 4 ] n− [M = Fe(II), Co(II), Ni(II) and Fe(III)] ............................................................. 113 5.1.2. Rubredoxin model complexes ................................................................................................. 114 5.2. Binuclear Fe 2 S 2 models of plant ferredoxins ........................................................................................ 115 5.3. Fe 4 S 4 models of bacterial ferredoxins and high potential iron–sulfur proteins (HiPIPs) .................................................. 117 5.3.1. Bonding in model complexes .................................................................................................. 117 5.3.2. Oxidized and reduced [Fe 4 S 4 ] clusters ......................................................................................... 118 5.4. Fe 3 S 4 models of ferredoxin II proteins ............................................................................................. 119 5.4.1. Bonding in the Fe 3 S 4 cluster .................................................................................................. 119 5.4.2. Redox changes in [Fe 3 S 4 ] clusters ............................................................................................. 119 5.5. Protein effects in iron–sulfur clusters: effect of H-bonding on Fe-S covalency .......................................................... 119 5.5.1. Rubredoxins ................................................................................................................. 120 5.5.2. Fe 2 S 2 clusters in ferredoxins and Rieske proteins ................................................................................ 120 5.5.3. Fe 4 S 4 clusters in bacterial ferredoxins and HiPIPs ............................................................................... 121 5.6. Electronic delocalization in Fe 4 S 4 clusters .......................................................................................... 122 6. Ni dithiolene complexes ............................................................................................................... 123 6.1. Transition dipole integral for dithiolene-S ........................................................................................... 124 For Thematic Issue of Coordination Chemistry Review entitled Synchrotron Radiation in Inorganic and Bioinorganic Chemistry. ∗ Corresponding author. Tel.: +1-650-723-4694; fax: +1-650-703-0553. E-mail addresses: [email protected] (E.I. Solomon), [email protected] (B. Hedman). 1 Co-corresponding author. Tel.: +1-650-926-3052; fax: +1-650-925-4100. 0010-8545/$ – see front matter © 2004 Elsevier B.V. All rights reserved. doi:10.1016/j.ccr.2004.03.020

Welcome message from author
This document is posted to help you gain knowledge. Please leave a comment to let me know what you think about it! Share it to your friends and learn new things together.
Transcript
Coordination Chemistry Reviews 249 (2005) 97–129
Review
Ligand K-edge X-ray absorption spectroscopy:covalency of ligand–metal bonds�
Edward I. Solomona,∗, Britt Hedmanb,1, Keith O. Hodgsona,b,Abhishek Deya, Robert K. Szilagyic
a Department of Chemistry, Stanford University, Stanford, CA 94305, USAb Stanford Synchrotron Radiation Laboratory, Stanford, CA 94309, USA
c Department of Chemistry and Biochemistry, Montana State University, MT 59717, USA
Received 1 October 2003; accepted 12 March 2004Available online 23 July 2004
Contents
Abstract. . . . . . . . . . . . . . . . . . . . . . . . . . . . . . . . . . . . . . . . . . . . . . . . . . . . . . . . . . . . . . . . . . . . . . . . . . . . . . . . . . . . . . . . . . . . . . . . . . . . . . . . . . . . . . . . . . . . . . . . . . . . . . . . . 981. Introduction. . . . . . . . . . . . . . . . . . . . . . . . . . . . . . . . . . . . . . . . . . . . . . . . . . . . . . . . . . . . . . . . . . . . . . . . . . . . . . . . . . . . . . . . . . . . . . . . . . . . . . . . . . . . . . . . . . . . . . . . . . . 982. The experiment. . . . . . . . . . . . . . . . . . . . . . . . . . . . . . . . . . . . . . . . . . . . . . . . . . . . . . . . . . . . . . . . . . . . . . . . . . . . . . . . . . . . . . . . . . . . . . . . . . . . . . . . . . . . . . . . . . . . . . . . 99
2.1. Experimental setup. . . . . . . . . . . . . . . . . . . . . . . . . . . . . . . . . . . . . . . . . . . . . . . . . . . . . . . . . . . . . . . . . . . . . . . . . . . . . . . . . . . . . . . . . . . . . . . . . . . . . . . . . . . . . . . . 992.2. Data reduction. . . . . . . . . . . . . . . . . . . . . . . . . . . . . . . . . . . . . . . . . . . . . . . . . . . . . . . . . . . . . . . . . . . . . . . . . . . . . . . . . . . . . . . . . . . . . . . . . . . . . . . . . . . . . . . . . . . 100
3. Methodology. . . . . . . . . . . . . . . . . . . . . . . . . . . . . . . . . . . . . . . . . . . . . . . . . . . . . . . . . . . . . . . . . . . . . . . . . . . . . . . . . . . . . . . . . . . . . . . . . . . . . . . . . . . . . . . . . . . . . . . . 1023.1. Theoretical background. . . . . . . . . . . . . . . . . . . . . . . . . . . . . . . . . . . . . . . . . . . . . . . . . . . . . . . . . . . . . . . . . . . . . . . . . . . . . . . . . . . . . . . . . . . . . . . . . . . . . . . . . . . 1023.2. Effect of geometry and bridging mode on pre-edge features. . . . . . . . . . . . . . . . . . . . . . . . . . . . . . . . . . . . . . . . . . . . . . . . . . . . . . . . . . . . . . . . . . . . . . . . . . . 104
3.2.1. Change in geometry from square planar (D4h) to tetrahedral (D2d ) . . . . . . . . . . . . . . . . . . . . . . . . . . . . . . . . . . . . . . . . . . . . . . . . . . . . . . . . . . . . . . . . 1043.2.2. Change in binding mode from terminal to bridging. . . . . . . . . . . . . . . . . . . . . . . . . . . . . . . . . . . . . . . . . . . . . . . . . . . . . . . . . . . . . . . . . . . . . . . . . . . . . . 104
3.3. Extension of the methodology to d10−n (n ≥ 1) systems: Cl K-edge XAS of transition metal chlorides. . . . . . . . . . . . . . . . . . . . . . . . . . . . . . . . . . . . 1053.3.1. Covalency from the pre-edge intensity. . . . . . . . . . . . . . . . . . . . . . . . . . . . . . . . . . . . . . . . . . . . . . . . . . . . . . . . . . . . . . . . . . . . . . . . . . . . . . . . . . . . . . . . . . 105
3.4. DFT calculation methods. . . . . . . . . . . . . . . . . . . . . . . . . . . . . . . . . . . . . . . . . . . . . . . . . . . . . . . . . . . . . . . . . . . . . . . . . . . . . . . . . . . . . . . . . . . . . . . . . . . . . . . . . 1074. Cu–S protein sites. . . . . . . . . . . . . . . . . . . . . . . . . . . . . . . . . . . . . . . . . . . . . . . . . . . . . . . . . . . . . . . . . . . . . . . . . . . . . . . . . . . . . . . . . . . . . . . . . . . . . . . . . . . . . . . . . . . . 109
4.1. Blue Cu site. . . . . . . . . . . . . . . . . . . . . . . . . . . . . . . . . . . . . . . . . . . . . . . . . . . . . . . . . . . . . . . . . . . . . . . . . . . . . . . . . . . . . . . . . . . . . . . . . . . . . . . . . . . . . . . . . . . . . 1104.2. CuA site. . . . . . . . . . . . . . . . . . . . . . . . . . . . . . . . . . . . . . . . . . . . . . . . . . . . . . . . . . . . . . . . . . . . . . . . . . . . . . . . . . . . . . . . . . . . . . . . . . . . . . . . . . . . . . . . . . . . . . . . . 1114.3. Functional relevance of the Cu(II)–S(Cys) covalent bond. . . . . . . . . . . . . . . . . . . . . . . . . . . . . . . . . . . . . . . . . . . . . . . . . . . . . . . . . . . . . . . . . . . . . . . . . . . . . 112
5. Ligand K-edge XAS of iron–sulfur active sites and their model complexes. . . . . . . . . . . . . . . . . . . . . . . . . . . . . . . . . . . . . . . . . . . . . . . . . . . . . . . . . . . . . . . . . 1135.1. Mononuclear iron–sulfur models of rubredoxins. . . . . . . . . . . . . . . . . . . . . . . . . . . . . . . . . . . . . . . . . . . . . . . . . . . . . . . . . . . . . . . . . . . . . . . . . . . . . . . . . . . . . 113
5.1.1. S K-edge XAS of [M(SR)4]n− [M = Fe(II), Co(II), Ni(II) and Fe(III)]. . . . . . . . . . . . . . . . . . . . . . . . . . . . . . . . . . . . . . . . . . . . . . . . . . . . . . . . . . . . . 1135.1.2. Rubredoxin model complexes. . . . . . . . . . . . . . . . . . . . . . . . . . . . . . . . . . . . . . . . . . . . . . . . . . . . . . . . . . . . . . . . . . . . . . . . . . . . . . . . . . . . . . . . . . . . . . . . . 114
5.2. Binuclear Fe2S2 models of plant ferredoxins. . . . . . . . . . . . . . . . . . . . . . . . . . . . . . . . . . . . . . . . . . . . . . . . . . . . . . . . . . . . . . . . . . . . . . . . . . . . . . . . . . . . . . . . 1155.3. Fe4S4 models of bacterial ferredoxins and high potential iron–sulfur proteins (HiPIPs). . . . . . . . . . . . . . . . . . . . . . . . . . . . . . . . . . . . . . . . . . . . . . . . . . 117
5.3.1. Bonding in model complexes. . . . . . . . . . . . . . . . . . . . . . . . . . . . . . . . . . . . . . . . . . . . . . . . . . . . . . . . . . . . . . . . . . . . . . . . . . . . . . . . . . . . . . . . . . . . . . . . . . 1175.3.2. Oxidized and reduced [Fe4S4] clusters. . . . . . . . . . . . . . . . . . . . . . . . . . . . . . . . . . . . . . . . . . . . . . . . . . . . . . . . . . . . . . . . . . . . . . . . . . . . . . . . . . . . . . . . . 118
5.4. Fe3S4 models of ferredoxin II proteins. . . . . . . . . . . . . . . . . . . . . . . . . . . . . . . . . . . . . . . . . . . . . . . . . . . . . . . . . . . . . . . . . . . . . . . . . . . . . . . . . . . . . . . . . . . . . 1195.4.1. Bonding in the Fe3S4 cluster. . . . . . . . . . . . . . . . . . . . . . . . . . . . . . . . . . . . . . . . . . . . . . . . . . . . . . . . . . . . . . . . . . . . . . . . . . . . . . . . . . . . . . . . . . . . . . . . . . 1195.4.2. Redox changes in [Fe3S4] clusters. . . . . . . . . . . . . . . . . . . . . . . . . . . . . . . . . . . . . . . . . . . . . . . . . . . . . . . . . . . . . . . . . . . . . . . . . . . . . . . . . . . . . . . . . . . . . 119
5.5. Protein effects in iron–sulfur clusters: effect of H-bonding on Fe-S covalency. . . . . . . . . . . . . . . . . . . . . . . . . . . . . . . . . . . . . . . . . . . . . . . . . . . . . . . . . . 1195.5.1. Rubredoxins. . . . . . . . . . . . . . . . . . . . . . . . . . . . . . . . . . . . . . . . . . . . . . . . . . . . . . . . . . . . . . . . . . . . . . . . . . . . . . . . . . . . . . . . . . . . . . . . . . . . . . . . . . . . . . . . . 1205.5.2. Fe2S2 clusters in ferredoxins and Rieske proteins. . . . . . . . . . . . . . . . . . . . . . . . . . . . . . . . . . . . . . . . . . . . . . . . . . . . . . . . . . . . . . . . . . . . . . . . . . . . . . . . 1205.5.3. Fe4S4 clusters in bacterial ferredoxins and HiPIPs. . . . . . . . . . . . . . . . . . . . . . . . . . . . . . . . . . . . . . . . . . . . . . . . . . . . . . . . . . . . . . . . . . . . . . . . . . . . . . . 121
5.6. Electronic delocalization in Fe4S4 clusters. . . . . . . . . . . . . . . . . . . . . . . . . . . . . . . . . . . . . . . . . . . . . . . . . . . . . . . . . . . . . . . . . . . . . . . . . . . . . . . . . . . . . . . . . . 1226. Ni dithiolene complexes. . . . . . . . . . . . . . . . . . . . . . . . . . . . . . . . . . . . . . . . . . . . . . . . . . . . . . . . . . . . . . . . . . . . . . . . . . . . . . . . . . . . . . . . . . . . . . . . . . . . . . . . . . . . . . . 123
6.1. Transition dipole integral for dithiolene-S. . . . . . . . . . . . . . . . . . . . . . . . . . . . . . . . . . . . . . . . . . . . . . . . . . . . . . . . . . . . . . . . . . . . . . . . . . . . . . . . . . . . . . . . . . . 124
� For Thematic Issue of Coordination Chemistry Review entitled Synchrotron Radiation in Inorganic and Bioinorganic Chemistry.∗ Corresponding author. Tel.:+1-650-723-4694; fax:+1-650-703-0553.E-mail addresses:[email protected] (E.I. Solomon), [email protected] (B. Hedman).1 Co-corresponding author. Tel.:+1-650-926-3052; fax:+1-650-925-4100.
0010-8545/$ – see front matter © 2004 Elsevier B.V. All rights reserved.doi:10.1016/j.ccr.2004.03.020
98 E.I. Solomon et al. / Coordination Chemistry Reviews 249 (2005) 97–129
6.2. Bonding in [Ni(S2C2Me2)2]Z, Z = 2−,1− and 0 complexes. . . . . . . . . . . . . . . . . . . . . . . . . . . . . . . . . . . . . . . . . . . . . . . . . . . . . . . . . . . . . . . . . . . . . . . . . 1246.3. Reactivity of the [Ni(S2C2Me2)2] complex with olefins. . . . . . . . . . . . . . . . . . . . . . . . . . . . . . . . . . . . . . . . . . . . . . . . . . . . . . . . . . . . . . . . . . . . . . . . . . . . . . 126
7. Concluding comments. . . . . . . . . . . . . . . . . . . . . . . . . . . . . . . . . . . . . . . . . . . . . . . . . . . . . . . . . . . . . . . . . . . . . . . . . . . . . . . . . . . . . . . . . . . . . . . . . . . . . . . . . . . . . . . . 127Acknowledgements. . . . . . . . . . . . . . . . . . . . . . . . . . . . . . . . . . . . . . . . . . . . . . . . . . . . . . . . . . . . . . . . . . . . . . . . . . . . . . . . . . . . . . . . . . . . . . . . . . . . . . . . . . . . . . . . . . . . . . 127References. . . . . . . . . . . . . . . . . . . . . . . . . . . . . . . . . . . . . . . . . . . . . . . . . . . . . . . . . . . . . . . . . . . . . . . . . . . . . . . . . . . . . . . . . . . . . . . . . . . . . . . . . . . . . . . . . . . . . . . . . . . . . 127
Abstract
The ligand K-edge probes the ligand 1s→ valence np transitions. These transitions acquire intensity when the ligand is bound to an openshell metal ion. This intensity quantifies the amount of ligand character in the metal d orbitals, hence the covalency of the ligand–metal bond.In this review the methodology is developed and applied to copper proteins, iron–sulfur sites and nickel dithiolene complexes, as examples.These illustrate the power and impact of this method in evaluating covalency contributions to electron transfer pathways, reduction potentials,H-bond interactions, electron delocalization in mixed-valent systems and small molecule reactivity.© 2004 Elsevier B.V. All rights reserved.
Keywords:Ligand K-edge XAS; CuA; Blue copper; Iron–sulfur cluster; Nickel dithiolene; DFT
1. Introduction
Quantifying covalency, defined here as the coefficients ofligand character in the valence metal d derived molecularorbitals, has been the long term goal of physical–inorganicchemists. Covalency is responsible for many of the physicalproperties of transition metal systems and for reactivity. Ininorganic materials, the covalency of the metal–ligand bondleads to the exchange coupling between metal ions respon-sible for their magnetic properties and to dispersion of theHOMO and LUMO into bands leading to conductivity. Ininorganic and bioinorganic chemistry, the covalency of themetal–ligand bonds can lead to small molecule reactivity,enhance specific superexchange pathways for electron trans-fer, and activate metal sites for catalysis.
There are many traditional methods to experimentallyquantify the covalency of the valence orbitals of transitionmetal complexes[1]. These usually involve ground statestudies. In EPR spectroscopy, the quantitative deviation ofthe g values from 2.0023 derives from the combination ofspin-orbit coupling with excited states and the covalent re-duction of this coupling[2]. Theg values, however, do notallow a direct experimental estimate of covalency as a num-ber of different bonding interactions contribute to eachgivalue; these are best used to evaluate electronic structurecalculations[3]. Metal hyperfine coupling is another impor-tant experimental probe of covalency as delocalization of theelectron spin density onto the ligands reduces its hyperfinecoupling to the metal center[2]. However, there are threecontributions to metal hyperfine, Fermi contact, spin dipolar,and orbital dipolar coupling, all of similar magnitude and dif-ferent signs; each is affected differently by covalent delocal-ization onto the ligands. The most direct ground state probeof covalency is ligand superhyperfine coupling[4] which isoften small and best measured by double resonance (elec-tron nuclear double resonance, ENDOR) or pulsed (electronspin echo envelope modulation, ESEEM) EPR methods[5].
The amplitude and anisotropy of the ligand superhyperfinecoupling directly probes the delocalization of the electronspin density into s and p orbitals of the ligand, thus quanti-fying covalency and hybridization. This, however, requiresan EPR active site and only probes molecular orbitals con-taining unpaired electrons.
For bound excited states, charge transfer transition en-ergies and intensities can be used within the context of avalence bond configuration interaction (VBCI) model toapproximately estimate covalent delocalization over theligands [6]. This has been particularly useful in bridgedmagnetic dimers where the charge transfer mixing intothe ground state provides the superexchange pathway formagnetic coupling. Finally, in ionized final states, i.e. pho-toelectron spectroscopy (PES), the intensity dependence ofthe valence band peaks with input photon energy, and theintensity of shake up satellites in valence and core regions,analyzed in the context of a VBCI model, also quantify co-valent mixing[7]. However, these are complicated by largefinal state effects associated with the change in electronrepulsion on ionization (see PES reviews in this volume).
Given the complications and restrictions of existing ex-perimental methods in estimating covalency, we have devel-oped a new method based on X-ray absorption spectroscopy(XAS) at the ligand K-edge[8]. As described in other chap-ters in this volume, traditional XAS studies involve metalK-edges. These focus on the 1s→ 3d transitions which areweak (quadrupole allowed)[9] and gain intensity due tolow symmetry mixing of metal p character[10]. Thus metalK-edges probe an important mixing, but have low sensitiv-ity to the amount of metal character in the valence orbitals.Metal L-edges are at much lower energy (for 3d transitionmetal complexes in the UHV 400–1000 eV region) andtherefore can be studied at higher resolution (∼0.3 eV ver-sus >1.2 eV for metal K-edges)[11]. As they involve the2p→ 3d transitions, the transition intensity directly reflectsthe amount of metal d character in a valence molecular or-

E.I. Solomon et al. / Coordination Chemistry Reviews 249 (2005) 97–129 99
bital [12]. However, this intensity reflects the net effect ofthe entire ligand environment and does not probe specificligand–metal bonds.
The ligand K-edge involves the ligand 1s→ np transition.Since the 1s orbital is localized on the ligand and the s→ ptransition is electric dipole allowed, the intensity of this tran-sition quantifies the amount of ligand p character in the va-lence molecular orbital. This probes all singly-occupied andunoccupied acceptor orbitals of the transition metal complexthat have a ligand np contribution and therefore provides adirect probe of the covalency of the ligand–metal bond.
In this review we first describe the experimental detailsof ligand K-edge XAS (Section 2) and then develop themethodology (Section 3), first for the d9 configuration con-taining one hole, then for general dn metal complexes. Wealso consider how molecular orbital derived results of co-valency compare with those of ligand K-edge XAS ap-proaches. The following sections describe the applicationof this methodology to a range of important problems inbioinorganic and inorganic chemistry. Here we focus on sul-fur and chlorine K-edges where the methodology has beendeveloped. Similar approaches can be applied in principleto any ligand K-edge, however there can be complicationsbased on energy region of the ligand edge, effective nuclearcharge on the metal and in some cases (i.e. N and O) thesecan only be accessible for model complexes. InSection 4weconsider blue copper and CuA centers, which play key rolesin biological electron transfer. These centers have sulfur-Cubonds for which the covalency (determined by ligand K-edgeXAS) activates specific protein pathways for long-rangeelectron transfer[13]. In Section 5we consider iron–sulfurproteins, which are also involved in electron transfer. Theseconsist of centers containing one to four Fe atoms, and acombination of thiolate,�2 and�3 sulfide ligation, display-ing interesting mixed-valence properties that affect mag-netic interactions over the cluster sites, and protein effects
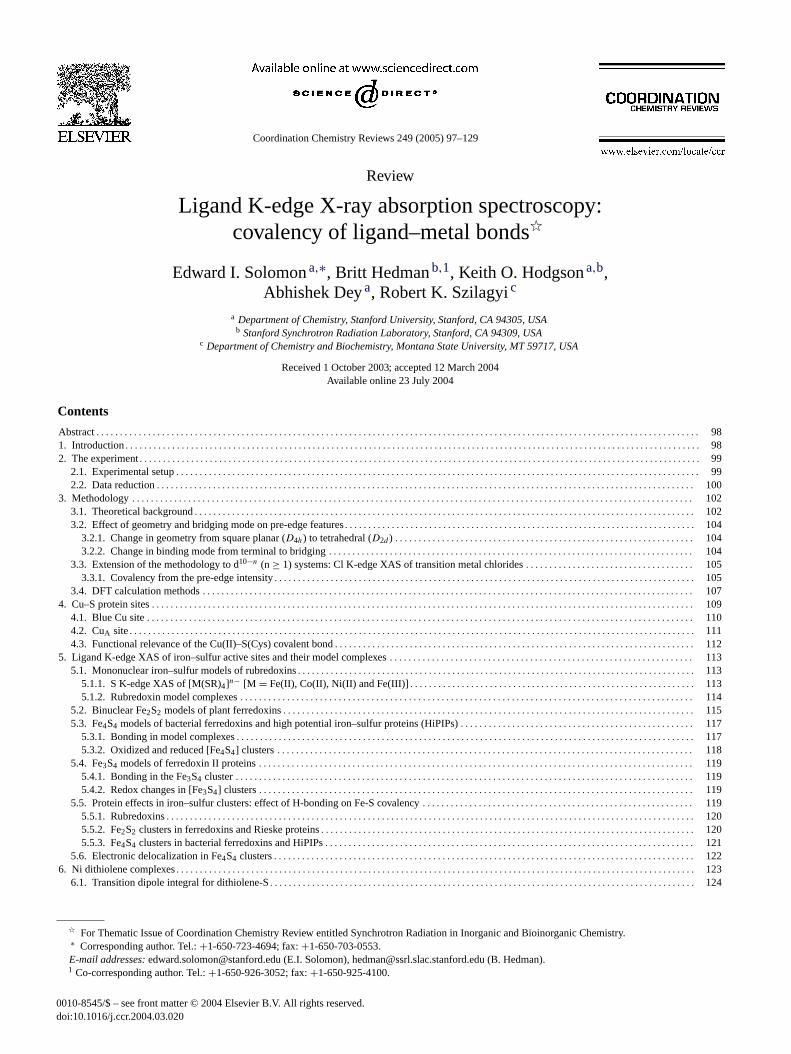
Fig. 1. Schematic representation of the experimental setup at SSRL BL6-2 (ppw: polypropylene window, Alw: aluminized Mylar window, Bew: berylliumwindow, EY: electron-yield, FF: fluorescence).
on the sulfur-iron bonds, which tune these centers for elec-tron transfer. Finally, inSection 6we consider nickel dithio-lene bonding. The dithiolene ligand is generally important inbioinorganic chemistry, particularly in the oxo-molybdenumtransferase enzymes. Also the nickel dithiolene series hasplayed an important historical role in inorganic chemistry. Itsnon-innocent nature has been the focus of a number of stud-ies on electron delocalization over the dithiolene ligand, andhas recently been used to define a new reactivity with olefins.Ligand K-edge XAS is clearly a powerful new method in thearsenal of the physical–inorganic chemist to experimentallydefine the covalency of the ligand–metal bond.
2. The experiment
All ligand K-edge data presented in this review weremeasured at the Stanford Synchrotron Radiation Labora-tory under ring conditions of 3 GeV and 60–100 mA. Theexperiments were performed on the 54-pole wiggler beamline 6-2 operating in high field (10 kG) mode with a fullytuned Si(1 1 1) double crystal monochromator followed bya Ni-coated harmonic rejection mirror.
2.1. Experimental setup
Beam line 6-2 is optimized for low-energy studies, withall optical elements under a differentially-pumping main-tained vacuum, and with a single, in-hutch 127�m beryl-lium window separating the experiment from ring vacuum.This Be window is protected from oxidation by a∼4 in. Hegas path terminated with a 6.35�m polypropylene window.The beam thereafter passes in a He gas atmosphere throughaperturing slits, an ionization chamber forI0 measurements,and a 6.35�m polypropylene window into the sample com-partment (Fig. 1).

100 E.I. Solomon et al. / Coordination Chemistry Reviews 249 (2005) 97–129
Fig. 2. Sodium thiosulfate (A) and cesium copper tetrachloride (B) cali-bration scans with marked calibration points.
The sample compartment is equipped with a rotating lidinset, which is set to 45◦ or 90◦ relative to the incident beamfor fluorescence and electron-yield detection modes, respec-tively. For fluorescence excitation spectra measurements,a N2-filled Lytle detector[14,15] is used without filter orSoller slits. For electron-yield measurements a detector isused, manufactured by The EXAFS Company[16]. This isequipped with a Ni grid for collecting Auger- and photoelec-trons in a windowless setup between the grid and the sam-ple. Due to the high absorption at low energies (2–4 keV),external energy calibration using a well-characterized stan-dard is required. This is performed at regular intervals,often before and after each sample. For S and Cl K-edgeexperiments, the standards used are Na2S2O3·5H2O andCs2CuCl4, and the sharp maximum of their first pre-edgefeature is assigned at 2472.02 eV (Fig. 2A) and 2820.20 eV(Fig. 2B), respectively. The monochromator step size overthe edge region is typically 0.08 eV, the energy resolutionis ∼0.5 eV, and the reproducibility in energy determinationis ∼0.1 eV, as determined from repeated calibration andsample measurements during separate experimental runs.
Solid samples are ground to an extremely fine powder,which is dusted thinly on Mylar tape (containing an acrylic
adhesive determined to be free of sulfur and chlorine con-taminants), and mounted across the window of an Al plate.The thin sample coverage on the tape is required to mini-mize the possibility of fluorescence self-absorption effects.For electron-yield experiments this is less of a concern,however, the tape needs to be conductively attached to thedetector to eliminate any build up of charge on the samplesurface, which can result in significant noise in the data. Forair-sensitive compounds, all preparations are performed in aN2-filled inert-atmosphere glovebox. In fluorescence detec-tion, the front of the sample is sealed with an absorber-free6.35�m polypropylene window and the sample holder isexposed to air for less than 5 s, while being transferred froma sealed jar into the He atmosphere of the sample compart-ment at the beam line. Since the electron-yield experimentsuse a windowless setup the sample is mounted onto theback panel of the detector in the glovebox.
Protein samples are pre-equilibrated for∼0.5–1 h with ade-ionized water-saturated He gas in a cold room at+4◦C,this minimizes bubble formation in the sample cell of He gaspenetrating the thin sample compartment window. There-after an aliquot of∼160�L is transferred into a Pt-coatedAl block sample cell, sealed with a polypropylene windowon the front and with septum-sealed loading and gas-releaseholes on the top. For solutions, including dilute biologicalsamples, the sample cell block is cooled by passing N2 gas,which has passed through copper coils immersed in liquidN2, through channels in the Al block body. The sample tem-perature is typically maintained at∼+4◦C, measured at thesample block with a thermocouple. Solution samples with alower melting point (organic solvents or biological sampleswith a glassing agent) are cooled down to∼(−50)◦C us-ing a shroud around the sample cell, which is continuouslypurged with pre-cooled He gas.
The fluorescence detection technique has an∼50–200 Åpenetration depth[17] into the sample and provides gooddata for solids distributed thinly enough or dilute solu-tions in the range of 1–10 mM concentration. Although,electron-yield detection (collecting electrons emitted uponexcited-state relaxation) with a sufficiently large collectorvoltage (∼200 V for the S and∼300 V for the Cl K-edge,respectively) can also give reasonable data without therisk of self-absorption. However this detection technique ishighly surface sensitive due to its limited penetration depth(at most 50 Å[18]).
2.2. Data reduction
The raw data are inspected graphically at the beam line toeliminate scans with beam, beam line or sample induced ab-normalities. In particular, effects due to sample photoreduc-tion, if present, are monitored and a determination is madeas to whether enough scans are available to produce a reli-able scan average at the initial oxidation state. If not, andif a suitable oxidant is available, the sample is recovered,re-oxidized, and re-measured. Provided that the first scan of
E.I. Solomon et al. / Coordination Chemistry Reviews 249 (2005) 97–129 101
the re-oxidized sample superimposes on the previous unaf-fected scans, the experiment is continued until the desiredsignal-to-noise has been obtained. Depending on the behav-ior of the sample in the beam, the extrapolated curve, ob-tained by a logarithmic projection of the critical data pointsat certain energy positions (such as an edge transition max-imum) to zero time, can be used in further analysis.
Pre- and post-data calibration scans (seeFig. 2) are com-pared and the energy scale of the data is adjusted accord-
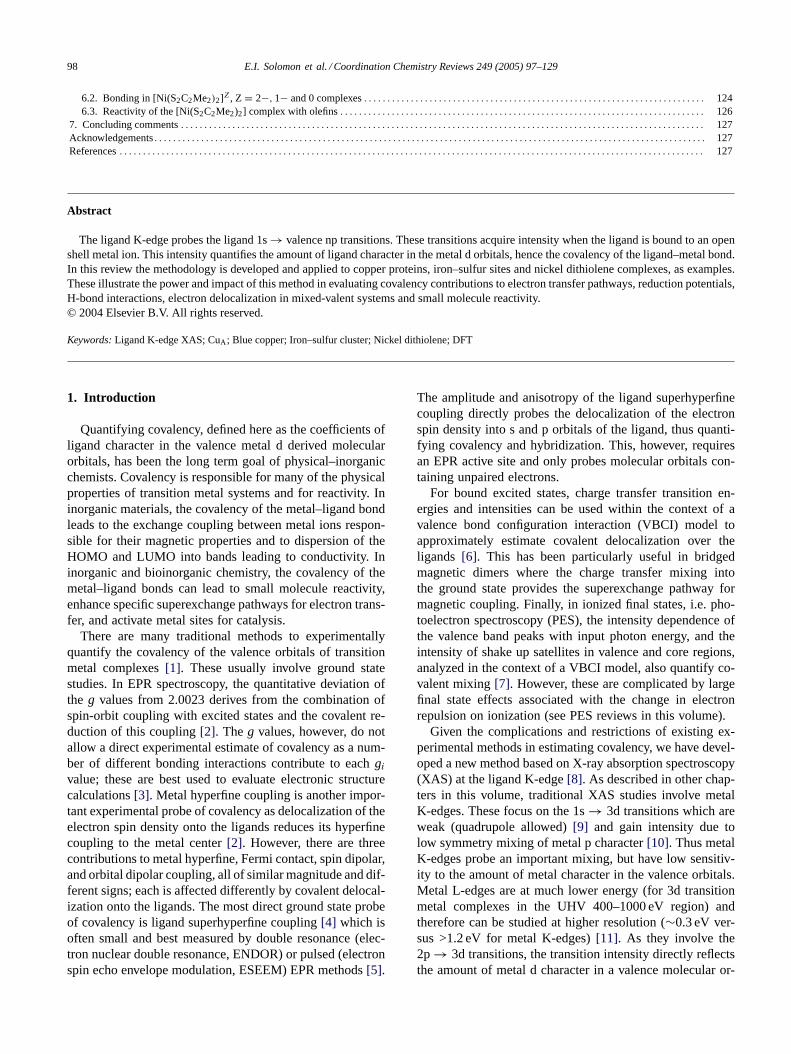
Fig. 3. Data reduction steps of the calibrated and averaged S K-edge spectrum of (Et4N)2[Ni(S-2Ph-C6H4)4] complex [K.R. Williams, B. Hedman, K.O.Hodgson, E.I. Solomon Inorg. Chim. Acta 263 (1997) 315]. (A) Raw data with pre-edge background correction. (B) Spline function and normalization.(C) Smoothed first derivative of the normalized data in the rising-edge energy region. (D) Smoothed second derivative of the normalized data in therising-edge energy region. (E) Subtraction of the ligand salt spectrum. (F) Fitting of the pre-edge feature.
ingly. The acceptable data scans are then averaged, and asmooth second-order polynomial background is fit to thepre-edge region and subtracted from the entire spectrum(Fig. 3A). Normalization of the data is accomplished by fit-ting a flattened second-order polynomial or straight line tothe post-edge region and normalizing to an edge jump of 1.0at 2490 and 2840 eV for the S and Cl K-edges, respectively(Fig. 3B). In protein samples with free Cys or Met residuesor samples with absorbers not contributing to the pre-edge
102 E.I. Solomon et al. / Coordination Chemistry Reviews 249 (2005) 97–129
feature, the spectrum needs to be renormalized by the ratioof the total and the contributing absorbers for the covalencydeterminations described in this review. Obviously buffers,reactants or any contamination containing the absorber atommust be exchanged or removed before data collection. Oth-erwise the normalization and thus the quantitation of spec-tral features cannot be carried out.
Energy positions of features in the normalized spectrumare generally obtained from the minima in the second deriva-tive of the data (Fig. 3D). The rising edge positions for sim-ilar ligands are determined from the energies of the maximaof the first derivative (i.e. inflection points) in the rising-edgeregion (Fig. 3C). Comparison of rising-edge positions in dif-ferent ligands can be obscured by high energy bound statetransitions, such as absorber 1s to� or �-type antibondingligand-based molecular orbitals or by the splitting to over-lapping orbitals giving rise of various spectral features.
If the spectrum of the uncoordinated ligand or ligand saltis available and the nature of the unoccupied ligand orbitalsis not significantly perturbed in the complex, the spectrum ofthe free ligand can be used to subtract the rising-edge jumpand related features from the data giving a clean plot of thepre-edge region (Fig. 3E). The pre-edge features are fittedby pseudo-Voigt lines with a fixed 1:1 ratio of Lorentzianto Gaussian contributions using the program EDGFIT [19],which utilizes the double precision version of the MINPAKfitting library [20]. The use of pseudo-Voigt line shape isjustified, since the pre-edge features are expected to be aconvolution of the Lorentzian transition envelope[21] andthe Gaussian line shape imposed by the beam line optics[14,22,23]. The fitting ranges are typically 2465–2475 eV(Fig. 3F) and 2818–2826 eV for S and Cl K pre-edges, re-spectively. The linewidths are generally found to be about0.5–0.6 eV for S based pre-edge features and about 0.1 eVwider for Cl. In all fits, the minimum number of requiredfunctions is utilized. The final intensity values, calculated asthe product of peak heights and linewidths, are based on theaverage of several good fits. In addition to the error resultingfrom the background correction and fitting procedure (ca.2%), normalization procedures can introduce ca. 3% errorin the total pre-edge peak areas.
3. Methodology
3.1. Theoretical background
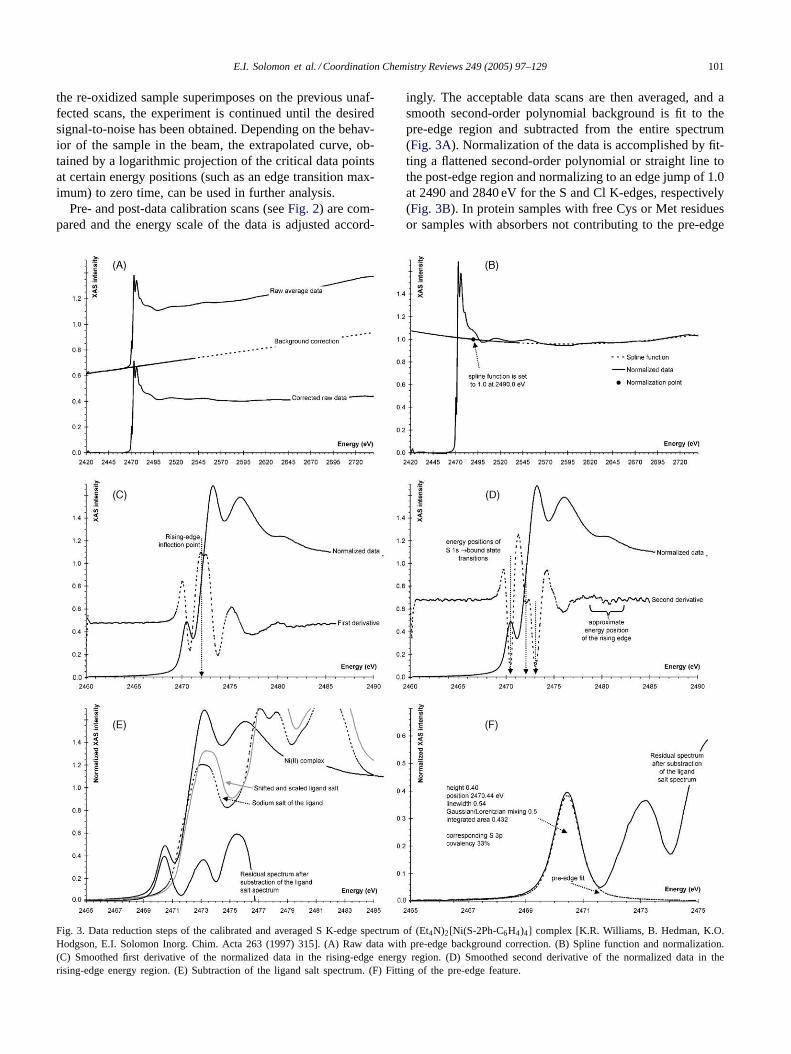
The ligand K-edge XAS of a chloride bound to Cu2+in square planar [Cu(II)Cl4]2− (d9) shows a well definedpre-edge feature which is not present in the corresponding[Zn(II)Cl4]2− (d10) spectrum (Fig. 4) [8a]. This feature, at2820 eV, must then be related to the singly occupied molec-ular orbital (SOMO) of the Cu(II) complex.
Fig. 4. Chlorine K-edge XAS spectra of [CuCl4]2− (dotted) and [ZnCl4]2−(solid) showing the distinct pre-edge feature of [CuCl4]2−.
The SOMO of [Cu(II)Cl4]2− is expressed as the antibond-ing combination of metal orbitals |M> with ligand valenceorbitals |L〉 as inEq. (1)
ΨSOMO =√(1 − α2)|M > −α|L〉 (1)
This givesα2 as the total ligand character (covalency) in theSOMO. The ligand part ofEq. (1)can be expressed as
|L >=∑q
∑j
Cq,jSOMO|Lq,j〉 (2)
whereq sums over all ligands andj sums over individualligand valence orbitals (s, p and d) contributing to the wave-function andCq,jSOMO are the coefficients of the contribut-ing valence orbitals to the symmetry-adapted linear com-binations (SALC). In the case of ligands such as chloride,thiolate, and sulfide, the contributions of 3s and 3d orbitalsare far less significant (limited to a few percent) than the3p contribution. This is primarily due to the larger energyseparations of 3s and 3p orbitals and reduced hybridizationof third row ligand atoms compared to second row ligandatoms.
The donor MO�k is a linear combination of ligand 1sorbitals
|Ψk〉 =∑r
br,k|1sr+〉 (3)
whereb is the coefficient of the 1s contribution from thedifferent ligands andr sums over all ligands.
The intensity of the transition from the ligand 1s to theSOMO is given by the following expression using the dipolelength approximation and Fermi’s golden rule[24,25]
I ∝ |〈Fk|∑A
ZA�RA −
∑i
�ri|I〉|2 ≈ |〈ΨSOMO|r|Ψk〉|2 (4)
whereA sums over all the nuclei (atRA) andi sums over allthe electrons (atri). FK is the many electron final state andI is the initial state. Using the expressions obtained for |Ψk〉and |ΨSOMO〉 from Eqs. (1)–(3), respectively, the intensityexpression in 4 becomes:
Iα
√
(1 − α)2∑r
br,k〈M|r|1sr〉 − α∑r
∑j
∑q
Cq,jSOMObrk〈Lq,j|r|1sr〉
2
(5)
E.I. Solomon et al. / Coordination Chemistry Reviews 249 (2005) 97–129 103
The first integral, an overlap integral between metal centeredand ligand centered orbitals, is very small (on the orderof 10−4) [26] and hence can be neglected with respect tothe second integral, which is a two-centered electric dipoleintegral. The overlap integrals between orbitals on differentligands (q �= r) in the second integral are neglected, asthey will have negligible contribution compared to transitionmoment integrals between orbitals on same atom (q = r).On applying the electric-dipole selection rule (i.e.j = p
orbital allowed, giving strong transitions, whilej = s isforbidden andj = d is quadrupole allowed, giving weaktransitions) the second integral becomes
|〈Lq,p|r|1sq〉| =√(1 − kSOMO)2
3〈r〉npq1sq�epq (6)
where〈r〉npq1sq = 〈Radnpq |r|Rad1sq〉 (where Rad is the ra-dial part of the wavefunction),�epq is the unit vector along theligand p-orbital axis which contributes to the SOMO, andkSOMO is the relative contribution of theψns orbital to thetotal ligand valence hybrid orbital contributing to the SOMOwavefunction. Hence(1 − kSOMO)
2 is the ligandψnp char-acter in the SOMO. UsingEq. (6), the final expression forthe matrix elements for transition dipole operator inEq. (4)becomes
|〈ΨSOMO|r|Ψk〉|
= −α∑q
Cq,pSOMObk
√(1 − kSOMO)2
3〈r〉npq1sq�epq (7)
where theC’s are the coefficients of the SALC’s of the ligandnp orbitals in the ligand part of the SOMO. The simplest caseis when there is one ligand atom of specific chemical interest(i.e. C2
q,p = 1) contributing to the SOMO. The expressionfor the intensity inEq. (7) then becomes
Iα|〈ΨSOMO|r|Ψk〉|2 = −13α
2(1 − kSOMO)2〈r〉2
np,1s (8)
Eq. (8) has a straight forward physical significance. Theintensity of the 1s→ SOMO transition increases asα2,the total ligand character in the SOMO and as the p char-acter of this ligand contribution to the SOMO increases(1−kSOMO)2. In absolute terms, for a particular ligand atom,the factor 1/3〈r〉2
npq1sqis the intrinsic intensity of an 1s→ np
transition.The intensity of the pre-edge transition depends on the
radial functions of the ligand 1s and 3p orbitals (the over-lap integral〈r〉npq1sq in Eq. (8)). Hartree–Fock calculationswere performed on free Cl and S atoms[26] to evaluate theeffect of a change of the charge of a ligand on the transitionintegral. The overlap integral decreases with increase in neg-ative charge on the contributing atom on the ligand. This isbecause the 3p orbitals expand more than the 1s, asZeff ofthe ligand decreases, decreasing the overlap between theseorbitals. However, the charge dependence of this integral,when translated into percentage ligand character, is linear
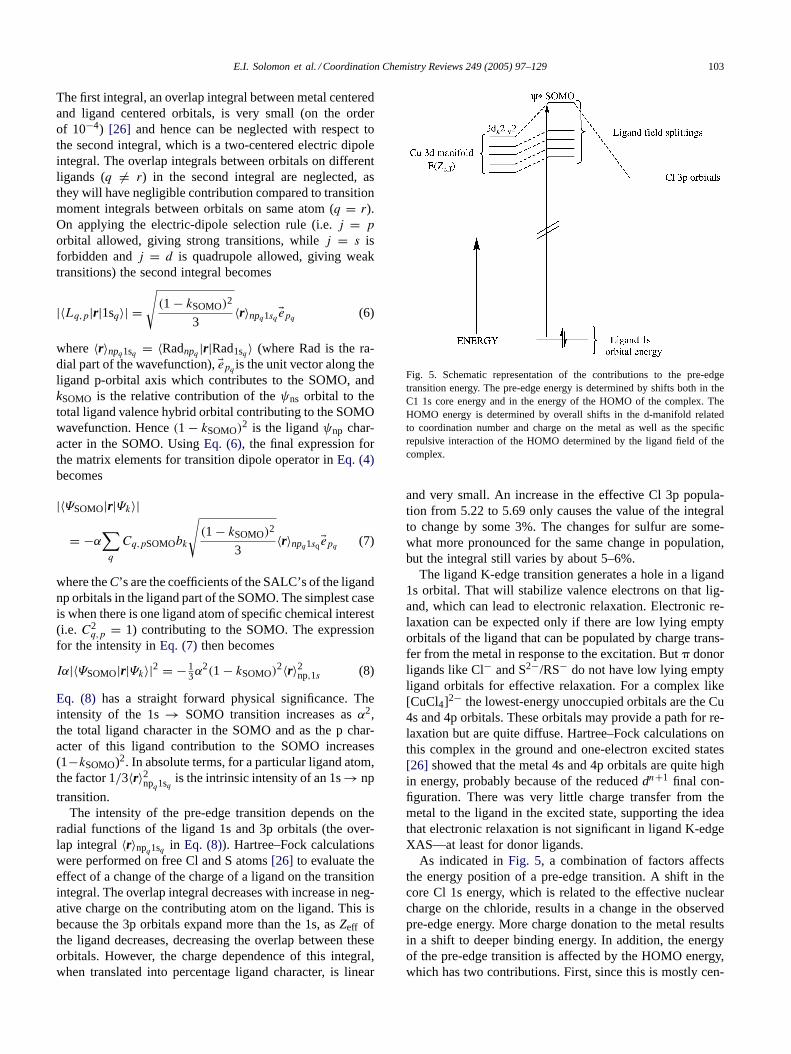
Fig. 5. Schematic representation of the contributions to the pre-edgetransition energy. The pre-edge energy is determined by shifts both in theC1 1s core energy and in the energy of the HOMO of the complex. TheHOMO energy is determined by overall shifts in the d-manifold relatedto coordination number and charge on the metal as well as the specificrepulsive interaction of the HOMO determined by the ligand field of thecomplex.
and very small. An increase in the effective Cl 3p popula-tion from 5.22 to 5.69 only causes the value of the integralto change by some 3%. The changes for sulfur are some-what more pronounced for the same change in population,but the integral still varies by about 5–6%.
The ligand K-edge transition generates a hole in a ligand1s orbital. That will stabilize valence electrons on that lig-and, which can lead to electronic relaxation. Electronic re-laxation can be expected only if there are low lying emptyorbitals of the ligand that can be populated by charge trans-fer from the metal in response to the excitation. But� donorligands like Cl− and S2−/RS− do not have low lying emptyligand orbitals for effective relaxation. For a complex like[CuCl4]2− the lowest-energy unoccupied orbitals are the Cu4s and 4p orbitals. These orbitals may provide a path for re-laxation but are quite diffuse. Hartree–Fock calculations onthis complex in the ground and one-electron excited states[26] showed that the metal 4s and 4p orbitals are quite highin energy, probably because of the reduceddn+1 final con-figuration. There was very little charge transfer from themetal to the ligand in the excited state, supporting the ideathat electronic relaxation is not significant in ligand K-edgeXAS—at least for donor ligands.
As indicated inFig. 5, a combination of factors affectsthe energy position of a pre-edge transition. A shift in thecore Cl 1s energy, which is related to the effective nuclearcharge on the chloride, results in a change in the observedpre-edge energy. More charge donation to the metal resultsin a shift to deeper binding energy. In addition, the energyof the pre-edge transition is affected by the HOMO energy,which has two contributions. First, since this is mostly cen-
104 E.I. Solomon et al. / Coordination Chemistry Reviews 249 (2005) 97–129
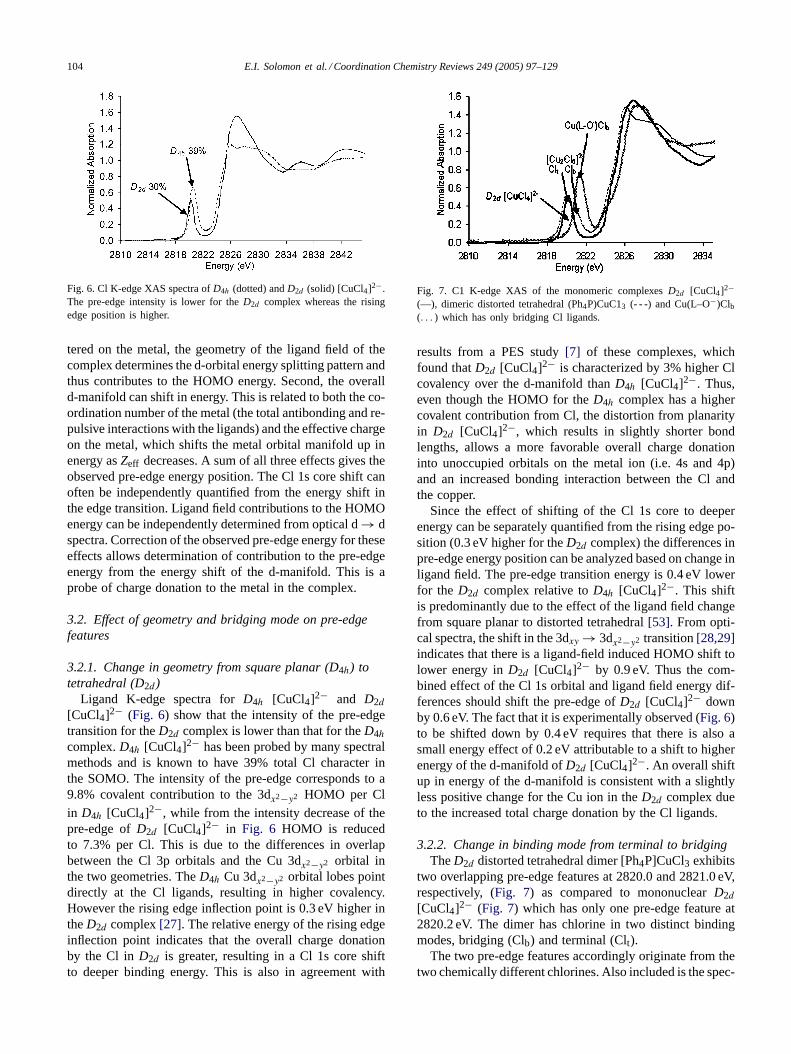
Fig. 6. Cl K-edge XAS spectra ofD4h (dotted) andD2d (solid) [CuCl4]2−.The pre-edge intensity is lower for theD2d complex whereas the risingedge position is higher.
tered on the metal, the geometry of the ligand field of thecomplex determines the d-orbital energy splitting pattern andthus contributes to the HOMO energy. Second, the overalld-manifold can shift in energy. This is related to both the co-ordination number of the metal (the total antibonding and re-pulsive interactions with the ligands) and the effective chargeon the metal, which shifts the metal orbital manifold up inenergy asZeff decreases. A sum of all three effects gives theobserved pre-edge energy position. The Cl 1s core shift canoften be independently quantified from the energy shift inthe edge transition. Ligand field contributions to the HOMOenergy can be independently determined from optical d→ dspectra. Correction of the observed pre-edge energy for theseeffects allows determination of contribution to the pre-edgeenergy from the energy shift of the d-manifold. This is aprobe of charge donation to the metal in the complex.
3.2. Effect of geometry and bridging mode on pre-edgefeatures
3.2.1. Change in geometry from square planar (D4h) totetrahedral (D2d)
Ligand K-edge spectra forD4h [CuCl4]2− and D2d[CuCl4]2− (Fig. 6) show that the intensity of the pre-edgetransition for theD2d complex is lower than that for theD4hcomplex.D4h [CuCl4]2− has been probed by many spectralmethods and is known to have 39% total Cl character inthe SOMO. The intensity of the pre-edge corresponds to a9.8% covalent contribution to the 3dx2−y2 HOMO per Clin D4h [CuCl4]2−, while from the intensity decrease of thepre-edge ofD2d [CuCl4]2− in Fig. 6 HOMO is reducedto 7.3% per Cl. This is due to the differences in overlapbetween the Cl 3p orbitals and the Cu 3dx2−y2 orbital inthe two geometries. TheD4h Cu 3dx2−y2 orbital lobes pointdirectly at the Cl ligands, resulting in higher covalency.However the rising edge inflection point is 0.3 eV higher intheD2d complex[27]. The relative energy of the rising edgeinflection point indicates that the overall charge donationby the Cl in D2d is greater, resulting in a Cl 1s core shiftto deeper binding energy. This is also in agreement with
Fig. 7. C1 K-edge XAS of the monomeric complexesD2d [CuCl4]2−(—), dimeric distorted tetrahedral (Ph4P)CuC13 (- - -) and Cu(L–O−)Clb(. . . ) which has only bridging Cl ligands.
results from a PES study[7] of these complexes, whichfound thatD2d [CuCl4]2− is characterized by 3% higher Clcovalency over the d-manifold thanD4h [CuCl4]2−. Thus,even though the HOMO for theD4h complex has a highercovalent contribution from Cl, the distortion from planarityin D2d [CuCl4]2−, which results in slightly shorter bondlengths, allows a more favorable overall charge donationinto unoccupied orbitals on the metal ion (i.e. 4s and 4p)and an increased bonding interaction between the Cl andthe copper.
Since the effect of shifting of the Cl 1s core to deeperenergy can be separately quantified from the rising edge po-sition (0.3 eV higher for theD2d complex) the differences inpre-edge energy position can be analyzed based on change inligand field. The pre-edge transition energy is 0.4 eV lowerfor the D2d complex relative toD4h [CuCl4]2−. This shiftis predominantly due to the effect of the ligand field changefrom square planar to distorted tetrahedral[53]. From opti-cal spectra, the shift in the 3dxy → 3dx2−y2 transition[28,29]indicates that there is a ligand-field induced HOMO shift tolower energy inD2d [CuCl4]2− by 0.9 eV. Thus the com-bined effect of the Cl 1s orbital and ligand field energy dif-ferences should shift the pre-edge ofD2d [CuCl4]2− downby 0.6 eV. The fact that it is experimentally observed (Fig. 6)to be shifted down by 0.4 eV requires that there is also asmall energy effect of 0.2 eV attributable to a shift to higherenergy of the d-manifold ofD2d [CuCl4]2−. An overall shiftup in energy of the d-manifold is consistent with a slightlyless positive change for the Cu ion in theD2d complex dueto the increased total charge donation by the Cl ligands.
3.2.2. Change in binding mode from terminal to bridgingTheD2d distorted tetrahedral dimer [Ph4P]CuCl3 exhibits
two overlapping pre-edge features at 2820.0 and 2821.0 eV,respectively, (Fig. 7) as compared to mononuclearD2d[CuCl4]2− (Fig. 7) which has only one pre-edge feature at2820.2 eV. The dimer has chlorine in two distinct bindingmodes, bridging (Clb) and terminal (Clt).
The two pre-edge features accordingly originate from thetwo chemically different chlorines. Also included is the spec-
E.I. Solomon et al. / Coordination Chemistry Reviews 249 (2005) 97–129 105
trum of the binuclear Cu(L–O−)Clb complex (L–O− is aligand that provides two pyridyl nitrogens and a bridgingphenolate to the two coppers) which has only Cl bridg-ing ligands. Thus the lower energy peak in the spectrumof [Ph4P]CuCl3 is associated with the terminal Cl ligandwhile the higher energy peak is from the bridging Cl lig-and. The splitting is a clear indication that each Clb, boundto two coppers, donates more negative charge than each Clt,bound to only one copper. This increases theZeff of theligand and shifts the Clb 1s core orbital to deeper bind-ing energy resulting in a pre-edge transition at higher en-ergy. The lower-energy transition is hence assigned to Cltand the higher energy to Clb [27]. The renormalized inten-sity of Clb is somewhat larger than that for Clt (there are2Clb/4Clt), corresponding to a covalency per Cl of 12.7 %for Clt and 13.5% for Clb. This reflects the fact that bothchlorides in the dimer are slightly more covalent with re-spect to the HOMO than that observed inD4h [CuCl4]2−.The Clt and Clb pre-edge transition energies are separatedby ∼1 eV [27]. Because these two transitions involve thesame 3dx2−y2 HOMO, this energy splitting provides adirectmeasure of the effect ofZeff on the Cl 1s core energy dueto bridging.
3.3. Extension of the methodology to d10−n (n ≥ 1)systems: Cl K-edge XAS of transition metal chlorides
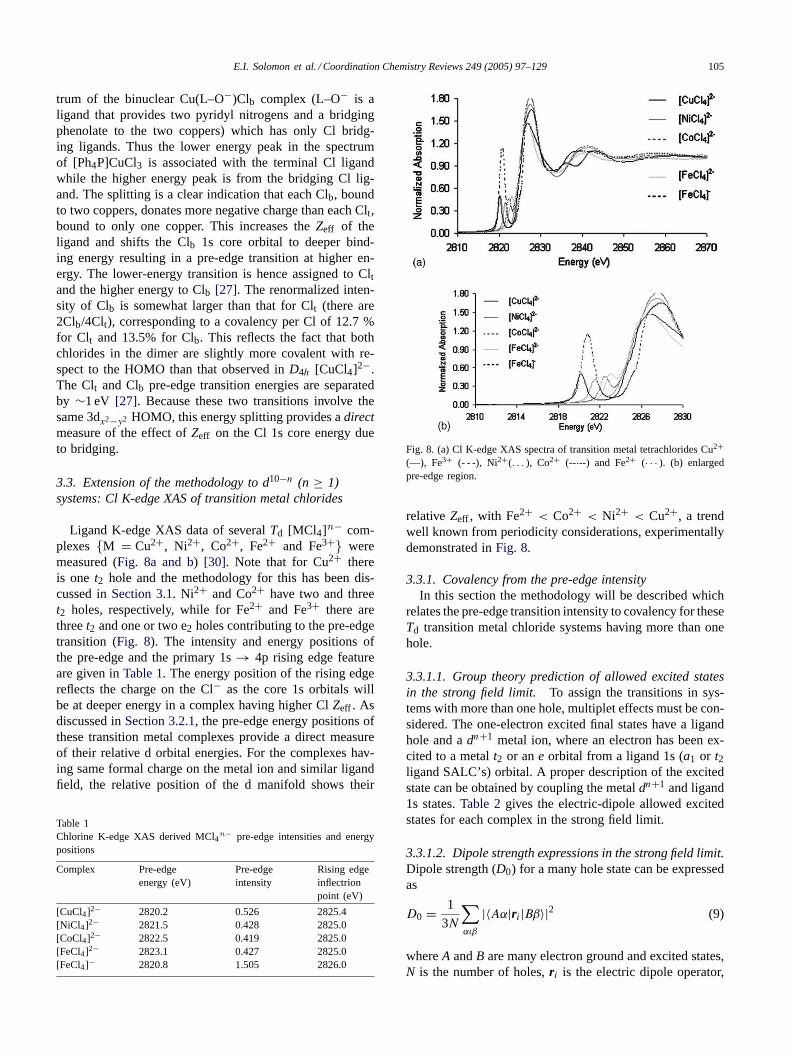
Ligand K-edge XAS data of severalTd [MCl4]n− com-plexes {M = Cu2+, Ni2+, Co2+, Fe2+ and Fe3+} weremeasured (Fig. 8a and b) [30]. Note that for Cu2+ thereis one t2 hole and the methodology for this has been dis-cussed inSection 3.1. Ni2+ and Co2+ have two and threet2 holes, respectively, while for Fe2+ and Fe3+ there arethreet2 and one or two e2 holes contributing to the pre-edgetransition (Fig. 8). The intensity and energy positions ofthe pre-edge and the primary 1s→ 4p rising edge featureare given inTable 1. The energy position of the rising edgereflects the charge on the Cl− as the core 1s orbitals willbe at deeper energy in a complex having higher ClZeff . Asdiscussed inSection 3.2.1, the pre-edge energy positions ofthese transition metal complexes provide a direct measureof their relative d orbital energies. For the complexes hav-ing same formal charge on the metal ion and similar ligandfield, the relative position of the d manifold shows their
Table 1Chlorine K-edge XAS derived MCl4
n− pre-edge intensities and energypositions
Complex Pre-edgeenergy (eV)
Pre-edgeintensity
Rising edgeinflectrionpoint (eV)
[CuCl4]2− 2820.2 0.526 2825.4[NiCl4]2− 2821.5 0.428 2825.0[CoCl4]2− 2822.5 0.419 2825.0[FeCl4]2− 2823.1 0.427 2825.0[FeCl4]− 2820.8 1.505 2826.0
Fig. 8. (a) Cl K-edge XAS spectra of transition metal tetrachlorides Cu2+(—), Fe3+ (- - -), Ni2+(. . . ), Co2+ (--·--) and Fe2+ (· · · ). (b) enlargedpre-edge region.
relativeZeff , with Fe2+ < Co2+ < Ni2+ < Cu2+, a trendwell known from periodicity considerations, experimentallydemonstrated inFig. 8.
3.3.1. Covalency from the pre-edge intensityIn this section the methodology will be described which
relates the pre-edge transition intensity to covalency for theseTd transition metal chloride systems having more than onehole.
3.3.1.1. Group theory prediction of allowed excited statesin the strong field limit. To assign the transitions in sys-tems with more than one hole, multiplet effects must be con-sidered. The one-electron excited final states have a ligandhole and adn+1 metal ion, where an electron has been ex-cited to a metalt2 or ane orbital from a ligand 1s (a1 or t2ligand SALC’s) orbital. A proper description of the excitedstate can be obtained by coupling the metaldn+1 and ligand1s states.Table 2gives the electric-dipole allowed excitedstates for each complex in the strong field limit.
3.3.1.2. Dipole strength expressions in the strong field limit.Dipole strength (D0) for a many hole state can be expressedas
D0 = 1
3N
∑αιβ
|〈Aα|ri|Bβ〉|2 (9)
whereA andB are many electron ground and excited states,N is the number of holes,ri is the electric dipole operator,

106 E.I. Solomon et al. / Coordination Chemistry Reviews 249 (2005) 97–129
Table 2Ground states and group theoretically-allowed excited states for [MCl4]n− pre-edge transitions
Complex Ground dn Ground configuration(holes)
Groundstate
Excited configuration(holes)
Parent dn+1
excited stateAllowed excited state(from ligand a1 + t2)
[CuCl4]2− d9 t2 2T2 t021A1
2A1 + 2T2
[NiCl4]2− d8 t223T1 t12
2T23T2 + 3E + 3T1 + 3T2
[CoCl4]2− d7 t324A2 t22
3T14T1 + 4T1
[FeCl4]2− d6 et325E t32 + et22
4A25T1
4T25T2 + 5T1 + 5T2
4T15T1 + 5T1 + 5T2
[FeCl4]− d5 e2t326A1 et32 + e2t22
5E 6T25T2
6T2 + 6T2
Table 3Symmetry-adapted one-electron wavefunctions for aTd molecule
Ligand 1s orbital SALC’s
a1 1/2(s1 + s2 + s3 + s4)t2(x) 1/2(s1 − s2 + s3 − s4)t2(y) 1/2(s1 + s2 − s3 − s4)t2(z) 1/2(s1 − s2 − s3 + s4)
Metal d type orbitals SALC’s Ligand component
e(θ)√(1 − c2
3)dz2 +c3[1/2(px ′1 − px ′2 − px ′3 + px ′4)]
e(ε)√(1 − c2
3)dx2−y2 +c3[1/2(py ′1 − py ′2 − py ′3 + py ′4)]
t2(x)√
[1 − (c21 + c2
2)]dyz +c1[1/2(pz ′1 − pz ′2 + pz ′3 − pz ′4] + c2[1/4(px ′1 + px ′2 − px ′3 − px ′4]+ √
3(−py ′1 − py ′2 + py ′3 + py ′4)
t2(y)√
[1 − (c21 + c2
2)]dxz +c1[1/2(pz ′1 +pz ′2 − pz ′3 − pz ′4)] + c2[1/4(px ′1 − px ′2+px ′3 − px ′4)]+ √
3(py ′1 − py ′2 + py ′3 − py ′4)
t2(z)√
[1 − (c21 + c2
2)]dxy +c1[1/2(pz ′1 − pz ′2 − pz ′3 +pz ′4] − +c2[1/2(px ′1 + px ′2 + px ′3 + px ′4]
From C.J. Ballhausen, H.B. Gray, Molecular Orbital Theory, Benjamin Press, New York, 1964, pp. 108–109.
α, i, β are components of ground state, dipole operator andexcited state, respectively. The evaluation of this sum overall relevant many-electron ground and excited state wave-functions is simplified by applying the irreducible tensormethod, which uses the Wigner-Eckart theorem[31], to takeadvantage of the symmetry.
Each pre-edge transition integral can be expanded withrespect to the components of the ground state, excited stateand electric dipole operator. Some of those will be zero fromgroup theory. The rest can be reduced to one of the follow-ing three one-electron matrix elements〈a1||t2||t2〉, 〈t2||t2||t2〉and〈t2||t2||e〉 [30]. Each of these one-electron reduced ma-trix elements can be related to a one-electron orbital integral,〈Γ 0Ψ0|r|Γ 1Ψ1〉, where |Γ 0Ψ0〉 and |Γ 1Ψ1〉 are one-electronorbitalsΨ0 andΨ1 havingΓ 0 andΓ 1 symmetry, respec-tively. These integrals are as discussed inSection 3.1, usingSALC’s of ligand valence orbitals and metal orbitals in theTd molecular framework (Table 3; the coefficientsc1 andc2are theσ and� ligand orbital coefficients in thet2 molecu-lar orbitals whilec3 is the coefficient ofσ bonding in theeset of molecular orbitals).
The summation of the square of these one-electron inte-grals gives the dipole strength (D0). The excited states thatare related to the samedn+1 excited configuration, only vary-ing in their ligand core orbital origin (a1 or t2), should be
degenerate and their contribution to the pre-edge intensityshould be additive (this assumes that the repulsion betweenthe localized ligand core 1s electron and valence d-manifoldelectron is minimal). The final expressions of the dipolestrengths in terms of the coefficients of the SALC’s of theligand bonding orbitals are given inTable 4. The Cu2+,Ni2+ and the Co2+ complexes have only one, one-electronexciteddn+1 parent final state (Table 2column 6) and theirdipole strength is proportional to the total 3p-� and 3p-�
Table 4Strong field dipole strength expressions for MCl4
2− pre-edge transitonintensities
Complex Parentdn+1
excited stateDipole strength for transitionto parent excited state
[CuCl4]2− 1A1 (1/3)(c21 + c2
2)R2〈s|r|p〉2
[NiCl4]2− 2T2 (2/3)(c21 + c2
2)R2〈s|r|p〉2
[CoCl4]2− 3T1 (c21 + c2
2)R2〈s|r|p〉2
[FeCl4]2− 4A2 (1/3)c23R2〈s|r|p〉2
4T2 (1/2)(c21 + c2
2)R2〈s|r|p〉2
4T1 (1/2)(c21 + c2
2)R2〈s|r|p〉2
[FeCl4]− 5E (2/3)c23R2〈s|r|p〉2
5T2 (c21 + c2
2)R2〈s|r|p〉2
E.I. Solomon et al. / Coordination Chemistry Reviews 249 (2005) 97–129 107
Table 5Distribution of energies and intensities for final states of MCl4
2− pre-edge transitions
Td metal ion Parentdn+1
excited stateHigher state of approximatesymmetry for mixing
Relative energyvalue (eV)
Coefficient ofmixing
Theoretical intensityratios
CoII 3T1 0.0 0.84 13T1 1.66 0.16 0.19
FeII 4A2 −0.31 0.424T2 0.0 14T1 0.23 0.29 0.29
4T1 1.42 0.71 0.71
FeIII 5E 0.0 0.585T2 0.49 1
character in theirt2 orbital (c21 + c2
2) times the number ofholes in the t2 orbital in the ground state in each case. Fe2+and Fe3+ have more than one possibledn+1 parent excitedstate (Table 2column 6), and the total intensity which nowincludes transition to one or twoe holes (c2
3) is distributedover these multiplets.
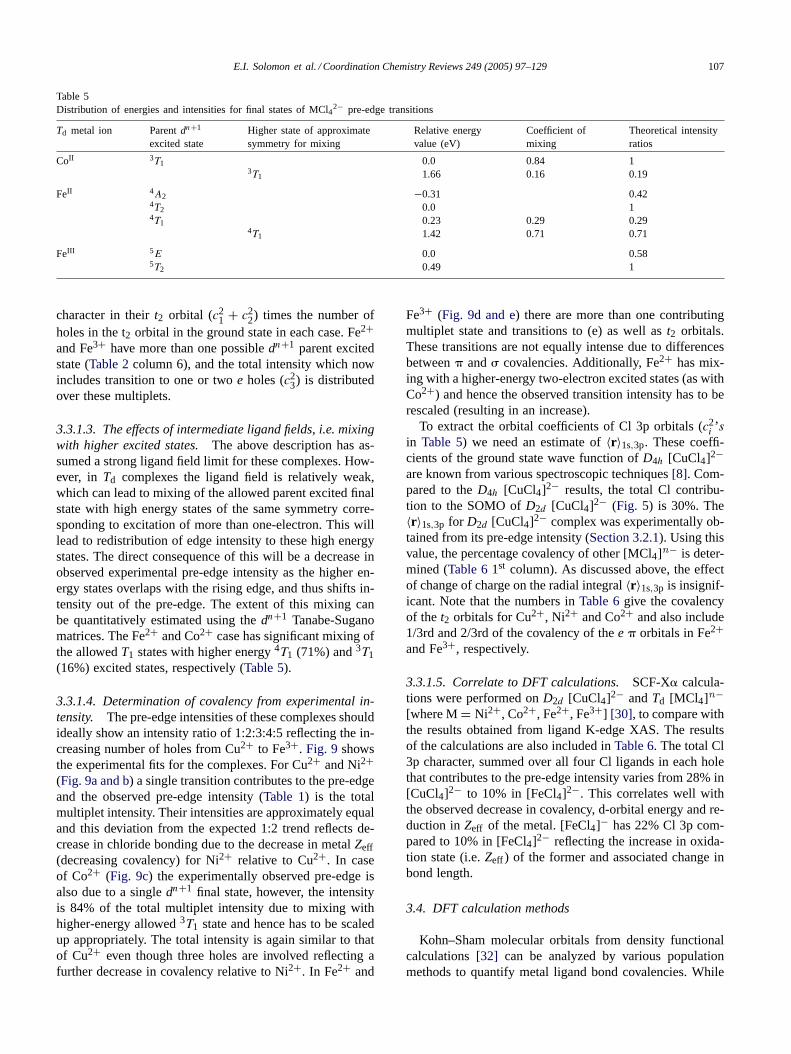
3.3.1.3. The effects of intermediate ligand fields, i.e. mixingwith higher excited states.The above description has as-sumed a strong ligand field limit for these complexes. How-ever, in Td complexes the ligand field is relatively weak,which can lead to mixing of the allowed parent excited finalstate with high energy states of the same symmetry corre-sponding to excitation of more than one-electron. This willlead to redistribution of edge intensity to these high energystates. The direct consequence of this will be a decrease inobserved experimental pre-edge intensity as the higher en-ergy states overlaps with the rising edge, and thus shifts in-tensity out of the pre-edge. The extent of this mixing canbe quantitatively estimated using thedn+1 Tanabe-Suganomatrices. The Fe2+ and Co2+ case has significant mixing ofthe allowedT1 states with higher energy4T1 (71%) and3T1(16%) excited states, respectively (Table 5).
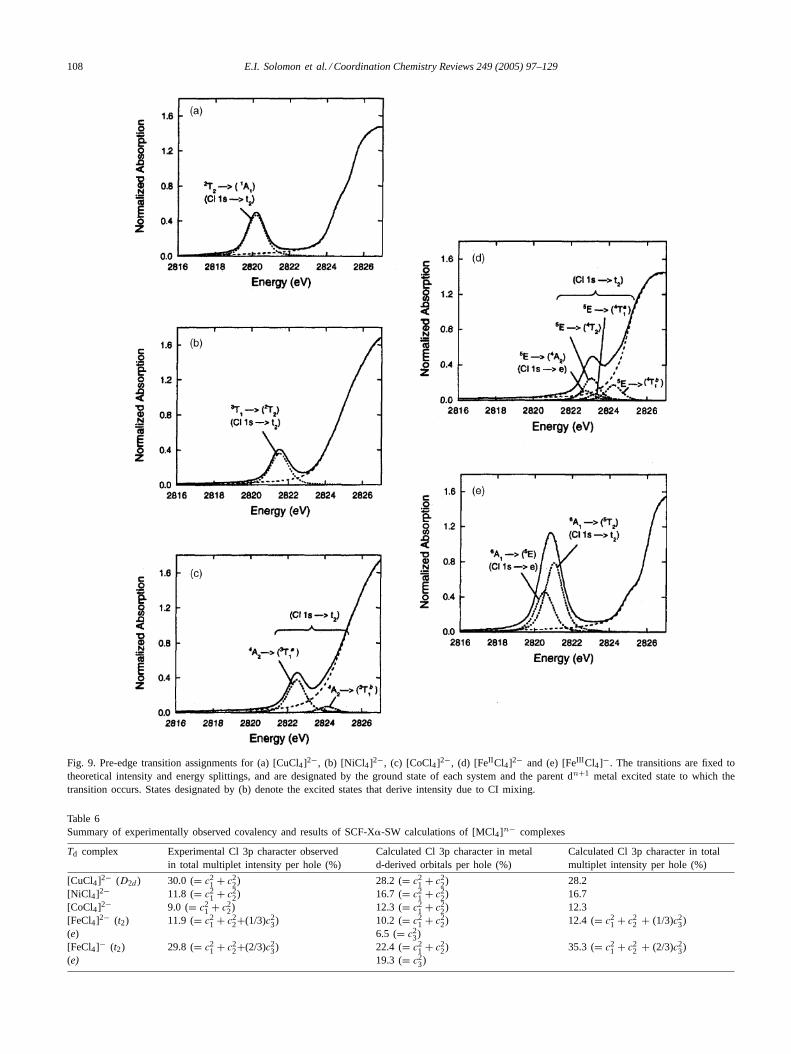
3.3.1.4. Determination of covalency from experimental in-tensity. The pre-edge intensities of these complexes shouldideally show an intensity ratio of 1:2:3:4:5 reflecting the in-creasing number of holes from Cu2+ to Fe3+. Fig. 9 showsthe experimental fits for the complexes. For Cu2+ and Ni2+(Fig. 9a and b) a single transition contributes to the pre-edgeand the observed pre-edge intensity (Table 1) is the totalmultiplet intensity. Their intensities are approximately equaland this deviation from the expected 1:2 trend reflects de-crease in chloride bonding due to the decrease in metalZeff(decreasing covalency) for Ni2+ relative to Cu2+. In caseof Co2+ (Fig. 9c) the experimentally observed pre-edge isalso due to a singledn+1 final state, however, the intensityis 84% of the total multiplet intensity due to mixing withhigher-energy allowed3T1 state and hence has to be scaledup appropriately. The total intensity is again similar to thatof Cu2+ even though three holes are involved reflecting afurther decrease in covalency relative to Ni2+. In Fe2+ and
Fe3+ (Fig. 9d and e) there are more than one contributingmultiplet state and transitions to (e) as well ast2 orbitals.These transitions are not equally intense due to differencesbetween� and� covalencies. Additionally, Fe2+ has mix-ing with a higher-energy two-electron excited states (as withCo2+) and hence the observed transition intensity has to berescaled (resulting in an increase).
To extract the orbital coefficients of Cl 3p orbitals (c2i ’s
in Table 5) we need an estimate of〈r〉1s,3p. These coeffi-cients of the ground state wave function ofD4h [CuCl4]2−are known from various spectroscopic techniques[8]. Com-pared to theD4h [CuCl4]2− results, the total Cl contribu-tion to the SOMO ofD2d [CuCl4]2− (Fig. 5) is 30%. The〈r〉1s,3p for D2d [CuCl4]2− complex was experimentally ob-tained from its pre-edge intensity (Section 3.2.1). Using thisvalue, the percentage covalency of other [MCl4]n− is deter-mined (Table 61st column). As discussed above, the effectof change of charge on the radial integral〈r〉1s,3p is insignif-icant. Note that the numbers inTable 6give the covalencyof the t2 orbitals for Cu2+, Ni2+ and Co2+ and also include1/3rd and 2/3rd of the covalency of thee � orbitals in Fe2+and Fe3+, respectively.
3.3.1.5. Correlate to DFT calculations.SCF-X� calcula-tions were performed onD2d [CuCl4]2− andTd [MCl4]n−[where M= Ni2+, Co2+, Fe2+, Fe3+] [30], to compare withthe results obtained from ligand K-edge XAS. The resultsof the calculations are also included inTable 6. The total Cl3p character, summed over all four Cl ligands in each holethat contributes to the pre-edge intensity varies from 28% in[CuCl4]2− to 10% in [FeCl4]2−. This correlates well withthe observed decrease in covalency, d-orbital energy and re-duction inZeff of the metal. [FeCl4]− has 22% Cl 3p com-pared to 10% in [FeCl4]2− reflecting the increase in oxida-tion state (i.e.Zeff ) of the former and associated change inbond length.
3.4. DFT calculation methods
Kohn–Sham molecular orbitals from density functionalcalculations[32] can be analyzed by various populationmethods to quantify metal ligand bond covalencies. While
108 E.I. Solomon et al. / Coordination Chemistry Reviews 249 (2005) 97–129
Fig. 9. Pre-edge transition assignments for (a) [CuCl4]2−, (b) [NiCl4]2−, (c) [CoCl4]2−, (d) [FeII Cl4]2− and (e) [FeIII Cl4]−. The transitions are fixed totheoretical intensity and energy splittings, and are designated by the ground state of each system and the parent dn+1 metal excited state to which thetransition occurs. States designated by (b) denote the excited states that derive intensity due to CI mixing.
Table 6Summary of experimentally observed covalency and results of SCF-X�-SW calculations of [MCl4]n− complexes
Td complex Experimental Cl 3p character observedin total multiplet intensity per hole (%)
Calculated Cl 3p character in metald-derived orbitals per hole (%)
Calculated Cl 3p character in totalmultiplet intensity per hole (%)
[CuCl4]2− (D2d ) 30.0 (= c21 + c2
2) 28.2 (= c21 + c2
2) 28.2[NiCl4]2− 11.8 (= c2
1 + c22) 16.7 (= c2
1 + c22) 16.7
[CoCl4]2− 9.0 (= c21 + c2
2) 12.3 (= c21 + c2
2) 12.3[FeCl4]2− (t2) 11.9 (= c2
1 + c22+(1/3)c2
3) 10.2 (= c21 + c2
2) 12.4 (= c21 + c2
2 + (1/3)c23)
(e) 6.5 (= c23)
[FeCl4]− (t2) 29.8 (= c21 + c2
2+(2/3)c23) 22.4 (= c2
1 + c22) 35.3 (= c2
1 + c22 + (2/3)c2
3)(e) 19.3 (= c2
3)

E.I. Solomon et al. / Coordination Chemistry Reviews 249 (2005) 97–129 109
these methods can differ significantly in determining the to-tal atomic charges, they show limited method dependence inatomic spin densities or electron hole covalencies when em-ploying a theoretically converged basis set. The electron holecovalency, as the reflection of the nature of the uncompen-sated electron density of the bonding orbital combinations,hence the ground state bonding description and the spin den-sity, were found to be similar to each other with at most 7%difference for Cu2+ complexes[33]. These wave functionproperties can be directly correlated with EPR, ENDOR,ESEEM (electron spin density) and XAS edge (SOMO holecovalency) spectroscopies.
The major difference between the computational meth-ods is the way the electron density is distributed amongthe nuclear centers. The Mulliken population analysis[34]equally distributes the electron density, while the Bader’satoms-in-molecules (AIM) method[35] uses the topology ofthe electron density and divides it up along the zero-flux sur-faces. Weinhold’s natural population analysis[36] uses a setof core, valence and Rydberg natural orbitals to fit the elec-tron density. It is worth noting that inclusion of the transitionmetal 4p orbitals into the valence set can significantly influ-ence the results of the population analysis[37]. The lattertwo methods are available for electronic structure calcula-tions with Gaussian-type basis sets. Alternative methods areavailable for analyzing results obtained with Slater-type ba-sis sets. The Voronoi method[38] is somewhat similar to theAIM method and partitions the space into non-overlappingatomic areas, called the Voronoi cell, which is the region inspace closer to a given nucleus than to any other nuclei. TheHirschfeld [39] population analysis employs well-definedfragments to describe the electron density, which is sharedby several atoms in proportion to their free-atom densitiesand the integration of the bonded minus free-atom densitiesdefines the net atomic or orbital charges.
In general, all population analysis methods can give rea-sonable agreement with experimentally determined orbitalcovalencies as the method dependence of the spin densitiesand hole populations (4 and 2%, respectively for Cu2+ com-plexes) is negligibly small employing a theoretically con-verged basis set. In general, the natural population analysismethod tends to give more accurate results than the Mul-liken method, while the application of atoms-in-moleculemethod, which is considered as one of the most accurate ap-proaches for dividing electron density between atoms, canbe limited by the highly complex nature of the electron den-sity of larger complexes. Methods utilizing the results ofcalculations of Slater-type basis sets are equally reliable andgive comparably good results as the AIM.
4. Cu–S protein sites
The copper sites in biological systems involved in elec-tron transfer all have thiolate ligands (i.e. Cu–S(cysteine)bonds), which play a critical role in the unique physical prop-
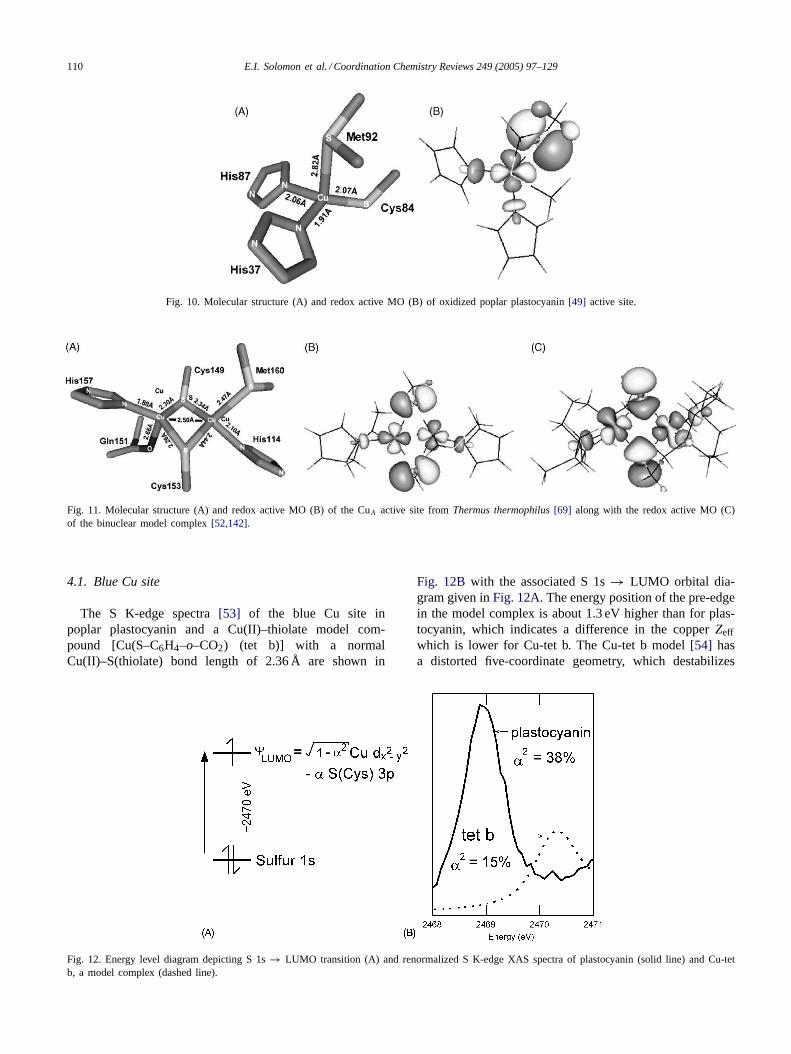
erties of these sites and their function[40]. Those contain-ing mononuclear sites are the blue copper proteins (azurin,plastocyanin, etc.). These all have a distorted tetrahedralstructure with a short Cu–S(thiolate) bond (∼2.1 Å), longaxial Cu–S(thioether) bond (∼2.9 Å) and two fairly normalCu–N(histidine) bonds (Fig. 10A) [41]. Within the blue cop-per series, there are a number of proteins were the axial lig-and is varied (nitrite reductase with a short Cu–S(thioether)bond at∼ 2.6 Å [42], stellacyanin with a Cu–O(carbonyl)bond at∼2.1 Å [43], and fungal laccase[44] with no ax-ial ligand). An interesting question has been the role ofthe axial ligand in the properties and reactivities of theblue copper site. Generally, the blue copper sites have in-tense absorption bands in the visible spectral region[45],which are assigned as thiolate to Cu(II) charge transferbands, and a very small copper hyperfine coupling in theirEPR spectra. The low energy and high intensity of thecharge transfer transitions and the small hyperfine couplingare associated with the highly covalent Cu–S(Cys) bond,which has been extremely important to understand as thisis the redox active molecular orbital (RAMO) involved inthe long-range electron transfer function of these proteins.DFT calculations as early as 1985[3] showed the RAMO(Fig. 10B), as defined by the spin unrestricted�-LUMOof the Cu(II) form, to be perpendicular to the long axialCu–S(thioether) bond (also found experimentally from sin-gle crystal EPR[46]) and highly covalent with the dominantcovalency involving the S 3p� orbital of the thiolate. Thiscovalency was extremely important to evaluate experimen-tally, as was the effect of the axial ligand variation on thisbond.
The binuclear copper electron transfer center, CuA, isfound in nitrous oxide reductase and cytochromec oxidase[47–50,62]. This site has two coppers bridged by two thi-olate ligands forming a [2Cu–2S] diamond core. In addi-tion to the bridging thiolates, each copper has an approxi-mately equatorial His nitrogen and axial Met sulfur or back-bone carbonyl oxygen ligands (Fig. 11) [51]. During redox,these sites change from [Cu(I)Cu(I)] to [Cu(II)Cu(I)], wherethe latter is a completely delocalized, class III mixed-valentsystem. It is important to note that Tolman and co-workershave synthesized[52] a binuclear copper model system thatis also a class III mixed-valent (MV) model, but with theCu–Cu distance increasing from 2.5 Å in CuA to 2.9 Å inthe model. From calculations, CuA has a� type LUMO(Fig. 11B) while the MV model complex has a� type LUMO(Fig. 11C). For the CuA center, it has been important to de-fine the covalency of the copper bonds with the bridgingthiolate sulfurs, its contribution to electron delocalizationbetween the coppers and how the electron delocalization af-fects the redox properties of CuA, including its covalent cou-pling through the thiolates into the protein superexchangepathways.
The natures of the ground state wave functions of boththe blue copper and CuA centers have been elucidated bysulfur K-edge XAS.
110 E.I. Solomon et al. / Coordination Chemistry Reviews 249 (2005) 97–129
Fig. 10. Molecular structure (A) and redox active MO (B) of oxidized poplar plastocyanin[49] active site.
Fig. 11. Molecular structure (A) and redox active MO (B) of the CuA active site fromThermus thermophilus[69] along with the redox active MO (C)of the binuclear model complex[52,142].
4.1. Blue Cu site
The S K-edge spectra[53] of the blue Cu site inpoplar plastocyanin and a Cu(II)–thiolate model com-pound [Cu(S–C6H4–o–CO2) (tet b)] with a normalCu(II)–S(thiolate) bond length of 2.36 Å are shown in
Fig. 12. Energy level diagram depicting S 1s→ LUMO transition (A) and renormalized S K-edge XAS spectra of plastocyanin (solid line) and Cu-tetb, a model complex (dashed line).
Fig. 12B with the associated S 1s→ LUMO orbital dia-gram given inFig. 12A. The energy position of the pre-edgein the model complex is about 1.3 eV higher than for plas-tocyanin, which indicates a difference in the copperZeffwhich is lower for Cu-tet b. The Cu-tet b model[54] hasa distorted five-coordinate geometry, which destabilizes

E.I. Solomon et al. / Coordination Chemistry Reviews 249 (2005) 97–129 111
the Cu 3d-manifold relative to the plastocyanin active site,which has a four-coordinate Cu(II) with a weakly boundaxial thioether. This energy difference also appears in theirabsorption spectra[46,54,55] as the charge transfer bandshifts to higher energy by 1.4 eV going from a four- tofive-coordinate site. In addition, the pre-edge intensity forplastocyanin is nearly three times higher than that of theCu-tet b model complex, after renormalization of the pro-tein spectrum (Fig. 12B). The quantitative analysis of thepre-edge intensities gives 15% S 3p character in the LUMOof the model complex and consequently 38% S 3p characterfor plastocyanin. This large ligand character of the LUMOdirectly reflects the high covalency of the Cu(II)–S(Cys)bond in the blue copper site.
GGA and hybrid DFT calculations give a ground statebonding description in qualitative agreement with experi-ment. The bonding between the Cu(II) and S(Cys) is pure�-type and the LUMO is based on Cu 3dx2−y2 and S(Cys)3p orbitals. The axial S(Met) does not contribute to theground state wavefunction. However, the covalency of theCu(II)–S(Cys) bond shows a strong functional dependence(Table 7). The pure DFT or GGA calculation employingthe BP86 functional and a theoretically converged basis set(BS5[56]) overestimates the S 3p character of the LUMO by10%, as calculated by Weinhold’s Natural Population Anal-ysis [37,57,58]. The hybrid B3LYP functional[59–61]with20% Hartree–Fock exchange only slightly improves the co-valency value. The spectroscopically adjusted hybrid func-tional B(38HF)P86 developed for the [CuCl4]2− complex[56] gives reasonable agreement with the experimental S 3pcharacter, as well as with Cu L-edge results[12]. The totalground state wavefunction of the blue Cu site can be de-fined by 46% S(Cys), 42% Cu, 9% His, and 3%�-methyleneH contributions (Table 7) showing highly anisotropic cova-lency along the Cu(II)–S(Cys) bond.
A recent study[63] of axial ligand variants in a fixedprotein environment has clearly shown the effect of the ax-ial ligand on the ground state wave function of the blueCu site.Fig. 13A shows the S K-edge spectra of wild-type,Q99M and Q99L variants of cucumber stellacyanin, wherethe axial ligands are O from a glutamate, S from a me-
Fig. 13. Comparison of S K-edge spectra of wild-type (—) cucumber stellacyanin and its Q99M (· · · ), Q99L (- - -) variants (A) and the coupled distortionmodel (B).
Table 7Atomic spin densities and orbital populations by means of Naturalpopulation analyses for the plastocyanin computational model complex[Cu(SMet)(imidazole)2(SMet2)]1+
Cu S(Cys) C(Cys) H(Cys) N(His)
Spin densityBP86/BS5 28 58 −1 3 11B3LYP/BS5 32 57 −1 3 10B(38HF)P86/BS5 41 50 −1 3 10Experimental 2a 8b
LUMOBP86/BS5 30 55 1 3 10B3LYP/BS5 34 54 0 2 8B(38HF)P86/BS5 41 49 0 2 7Experimental 41c 45d
a Paramagnetic NMR[138] + 1% contribution from C(Cys).b 14N ENDOR [139] + 1% from other ring atoms.c Cu 3d character by Cu L-edge XAS for plastocyanin[30] + 1% Cu
4s/4p contribution.d S 3p character by S K-edge XAS for azurin[21] + 1% S 3s
contribution.
thionine and none from a leucine residue, respectively. Inthe same order, the pre-edge intensity increases (from 41to 47% and to 54% S 3p for WT, Q99M and Q99L vari-ants, respectively) indicating an increasingly more cova-lent Cu(II)–S(thiolate) interaction. These results parallel EX-AFS and resonance Raman data[63], which show short-ening of the Cu(II)–S(thiolate) bond and increase in theCu(II)–S(thiolate) stretching frequencies as the axial inter-action weakens (Fig. 13B).
4.2. CuA site
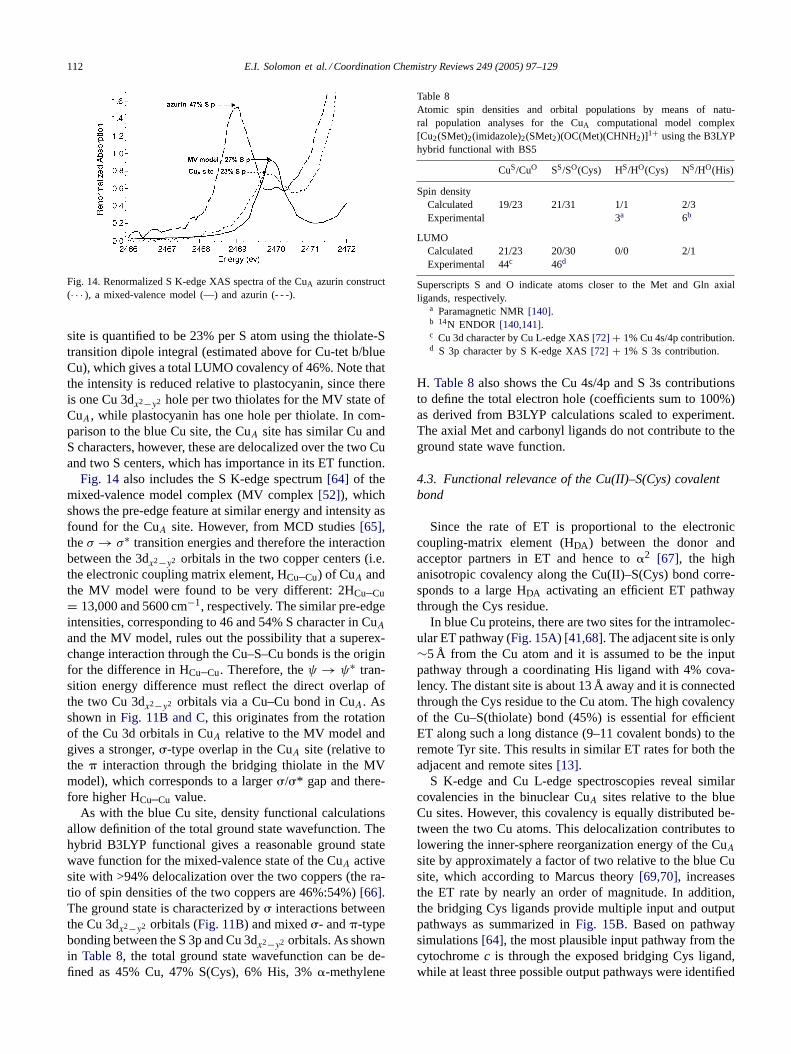
The renormalized S K-edge spectrum[64] of the engi-neered CuA site in Pseudomonas aeruginosaazurin[51] isshown inFig. 14. The pre-edge energy of the CuA site isabout 0.9 eV higher than that for plastocyanin. This can berationalized by a higher Zeff on a bridging thiolate-S in CuArelative to a terminal thiolate-S in plastocyanin and an ad-ditional contribution from the Cu–Cu bonding (see below),which destabilizes the Cu 3d-manifold giving a pre-edgefeature at higher energy. The pre-edge intensity of the CuA
112 E.I. Solomon et al. / Coordination Chemistry Reviews 249 (2005) 97–129
Fig. 14. Renormalized S K-edge XAS spectra of the CuA azurin construct(· · · ), a mixed-valence model (—) and azurin (- - -).
site is quantified to be 23% per S atom using the thiolate-Stransition dipole integral (estimated above for Cu-tet b/blueCu), which gives a total LUMO covalency of 46%. Note thatthe intensity is reduced relative to plastocyanin, since thereis one Cu 3dx2−y2 hole per two thiolates for the MV state ofCuA, while plastocyanin has one hole per thiolate. In com-parison to the blue Cu site, the CuA site has similar Cu andS characters, however, these are delocalized over the two Cuand two S centers, which has importance in its ET function.
Fig. 14 also includes the S K-edge spectrum[64] of themixed-valence model complex (MV complex[52]), whichshows the pre-edge feature at similar energy and intensity asfound for the CuA site. However, from MCD studies[65],theσ → σ∗ transition energies and therefore the interactionbetween the 3dx2−y2 orbitals in the two copper centers (i.e.the electronic coupling matrix element, HCu–Cu) of CuA andthe MV model were found to be very different: 2HCu–Cu= 13,000 and 5600 cm−1, respectively. The similar pre-edgeintensities, corresponding to 46 and 54% S character in CuA
and the MV model, rules out the possibility that a superex-change interaction through the Cu–S–Cu bonds is the originfor the difference in HCu–Cu. Therefore, theψ → ψ∗ tran-sition energy difference must reflect the direct overlap ofthe two Cu 3dx2−y2 orbitals via a Cu–Cu bond in CuA. Asshown inFig. 11B and C, this originates from the rotationof the Cu 3d orbitals in CuA relative to the MV model andgives a stronger,�-type overlap in the CuA site (relative tothe � interaction through the bridging thiolate in the MVmodel), which corresponds to a larger�/�* gap and there-fore higher HCu–Cu value.
As with the blue Cu site, density functional calculationsallow definition of the total ground state wavefunction. Thehybrid B3LYP functional gives a reasonable ground statewave function for the mixed-valence state of the CuA activesite with >94% delocalization over the two coppers (the ra-tio of spin densities of the two coppers are 46%:54%)[66].The ground state is characterized by� interactions betweenthe Cu 3dx2−y2 orbitals (Fig. 11B) and mixed�- and�-typebonding between the S 3p and Cu 3dx2−y2 orbitals. As shownin Table 8, the total ground state wavefunction can be de-fined as 45% Cu, 47% S(Cys), 6% His, 3%�-methylene
Table 8Atomic spin densities and orbital populations by means of natu-ral population analyses for the CuA computational model complex[Cu2(SMet)2(imidazole)2(SMet2)(OC(Met)(CHNH2)]1+ using the B3LYPhybrid functional with BS5
CuS/CuO SS/SO(Cys) HS/HO(Cys) NS/HO(His)
Spin densityCalculated 19/23 21/31 1/1 2/3Experimental 3a 6b
LUMOCalculated 21/23 20/30 0/0 2/1Experimental 44c 46d
Superscripts S and O indicate atoms closer to the Met and Gln axialligands, respectively.
a Paramagnetic NMR[140].b 14N ENDOR [140,141].c Cu 3d character by Cu L-edge XAS[72] + 1% Cu 4s/4p contribution.d S 3p character by S K-edge XAS[72] + 1% S 3s contribution.
H. Table 8also shows the Cu 4s/4p and S 3s contributionsto define the total electron hole (coefficients sum to 100%)as derived from B3LYP calculations scaled to experiment.The axial Met and carbonyl ligands do not contribute to theground state wave function.
4.3. Functional relevance of the Cu(II)–S(Cys) covalentbond
Since the rate of ET is proportional to the electroniccoupling-matrix element (HDA) between the donor andacceptor partners in ET and hence to�2 [67], the highanisotropic covalency along the Cu(II)–S(Cys) bond corre-sponds to a large HDA activating an efficient ET pathwaythrough the Cys residue.
In blue Cu proteins, there are two sites for the intramolec-ular ET pathway (Fig. 15A) [41,68]. The adjacent site is only∼5 Å from the Cu atom and it is assumed to be the inputpathway through a coordinating His ligand with 4% cova-lency. The distant site is about 13 Å away and it is connectedthrough the Cys residue to the Cu atom. The high covalencyof the Cu–S(thiolate) bond (45%) is essential for efficientET along such a long distance (9–11 covalent bonds) to theremote Tyr site. This results in similar ET rates for both theadjacent and remote sites[13].
S K-edge and Cu L-edge spectroscopies reveal similarcovalencies in the binuclear CuA sites relative to the blueCu sites. However, this covalency is equally distributed be-tween the two Cu atoms. This delocalization contributes tolowering the inner-sphere reorganization energy of the CuA
site by approximately a factor of two relative to the blue Cusite, which according to Marcus theory[69,70], increasesthe ET rate by nearly an order of magnitude. In addition,the bridging Cys ligands provide multiple input and outputpathways as summarized inFig. 15B. Based on pathwaysimulations[64], the most plausible input pathway from thecytochromec is through the exposed bridging Cys ligand,while at least three possible output pathways were identified
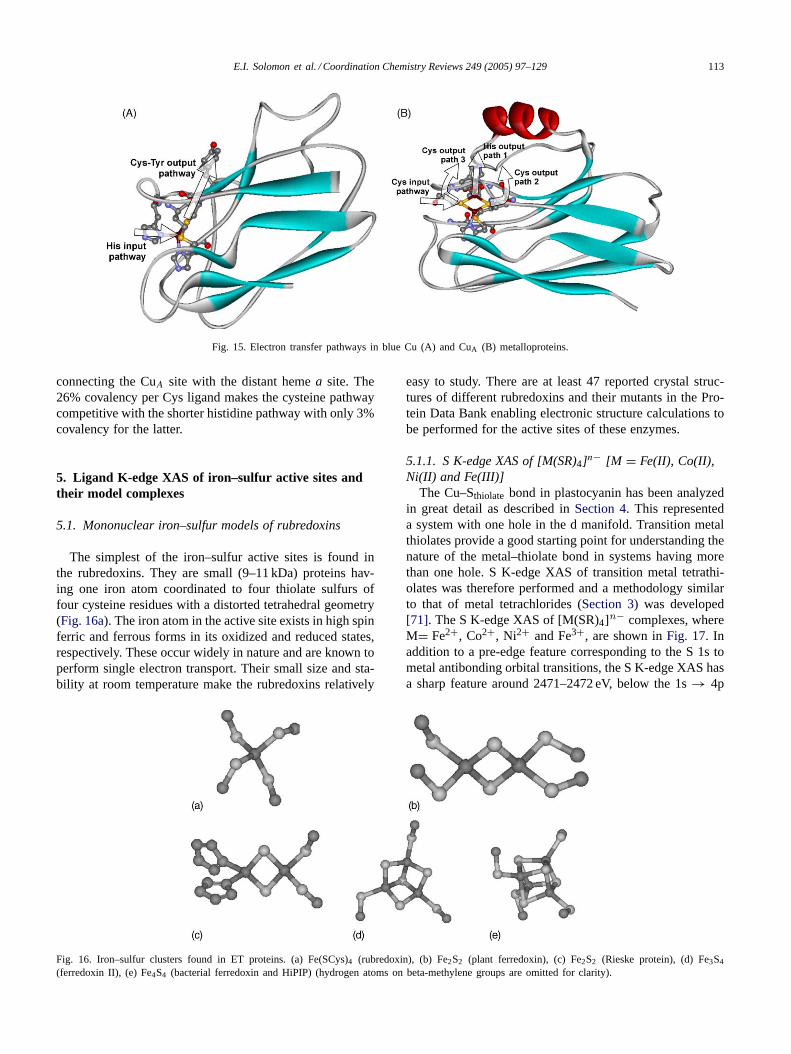
E.I. Solomon et al. / Coordination Chemistry Reviews 249 (2005) 97–129 113
Fig. 15. Electron transfer pathways in blue Cu (A) and CuA (B) metalloproteins.
connecting the CuA site with the distant hemea site. The26% covalency per Cys ligand makes the cysteine pathwaycompetitive with the shorter histidine pathway with only 3%covalency for the latter.
5. Ligand K-edge XAS of iron–sulfur active sites andtheir model complexes
5.1. Mononuclear iron–sulfur models of rubredoxins
The simplest of the iron–sulfur active sites is found inthe rubredoxins. They are small (9–11 kDa) proteins hav-ing one iron atom coordinated to four thiolate sulfurs offour cysteine residues with a distorted tetrahedral geometry(Fig. 16a). The iron atom in the active site exists in high spinferric and ferrous forms in its oxidized and reduced states,respectively. These occur widely in nature and are known toperform single electron transport. Their small size and sta-bility at room temperature make the rubredoxins relatively
Fig. 16. Iron–sulfur clusters found in ET proteins. (a) Fe(SCys)4 (rubredoxin), (b) Fe2S2 (plant ferredoxin), (c) Fe2S2 (Rieske protein), (d) Fe3S4
(ferredoxin II), (e) Fe4S4 (bacterial ferredoxin and HiPIP) (hydrogen atoms on beta-methylene groups are omitted for clarity).
easy to study. There are at least 47 reported crystal struc-tures of different rubredoxins and their mutants in the Pro-tein Data Bank enabling electronic structure calculations tobe performed for the active sites of these enzymes.
5.1.1. S K-edge XAS of [M(SR)4]n− [M = Fe(II), Co(II),Ni(II) and Fe(III)]
The Cu–Sthiolate bond in plastocyanin has been analyzedin great detail as described inSection 4. This representeda system with one hole in the d manifold. Transition metalthiolates provide a good starting point for understanding thenature of the metal–thiolate bond in systems having morethan one hole. S K-edge XAS of transition metal tetrathi-olates was therefore performed and a methodology similarto that of metal tetrachlorides (Section 3) was developed[71]. The S K-edge XAS of [M(SR)4]n− complexes, whereM= Fe2+, Co2+, Ni2+ and Fe3+, are shown inFig. 17. Inaddition to a pre-edge feature corresponding to the S 1s tometal antibonding orbital transitions, the S K-edge XAS hasa sharp feature around 2471–2472 eV, below the 1s→ 4p

114 E.I. Solomon et al. / Coordination Chemistry Reviews 249 (2005) 97–129
Fig. 17. (a) The S K-edge XAS spectra of M(SR)42− complexes where M= Ni2+ (· · · –· · · ), Co2+ (.–..–.), Mn2+(- - -) and Fe2+ (· · · ). The plastocyanin
pre-edge (scaled) representing Cu2+ (—) is shown for reference. (b) Pre-edge in expanded scale.
transition at around 2475 eV. This was assigned as the S 1s→ ligand C–S�∗ transition[71]. The energy of the pre-edgeposition reflects the effect of the metal Zeff on its d-orbitalenergies. In the case of Fe2+ and Mn2+, the Zeff is relativelylow and thus the pre-edge transition is at a higher energyand not resolved as it overlaps the C–S�∗ transition feature.
As discussed for the tetrachlorides inSection 3, the par-ent excited states were calculated in each case assumingS4 site symmetry to evaluate the multiplet contribution tothe pre-edge intensity. The Cu–S bond in plastocyanin has38% sulfur character (Section 4). Hence the pre-edge in-tensity of plastocyanin serves as a reference to calculatethe transition dipole integral for thiolate. The value ob-tained is 8.05 (note that this corresponds to 0.027 normalizedpre-edge intensity units per 1% thiolate-metal bond cova-lency inEq. (8)), which is used to quantify covalency of othertransition metal–thiolate bonds. The results for Ni(II)(SR)4indicate that, compared to 38% covalency of the Cu–S bond
Fig. 18. S K-edge XAS spectra of rubredoxin model complexes [FeIII /II (S2-o-xyl)2]−/2− (black/dashed black) and [FeIII /II (SPh)4]−/2− (gray/dashed gray)The inset shows the pre-edge region of the [FeIII (S2-o-xyl)2]− S K-edge spectrum and includes a representative four-peak fit performed based on thed-orbital splitting diagram of Gebhard et. al.[73] with a 20% reduction in the splitting based on the effects of a core hole in the d-manifold in XAS. Ininset the labelled peaks represent� contributions and the� contributions. Each of the four peaks in the fit is labeled as the dn+1 parent state. The fitfrom the four peaks in the inset is given by the dashed line, while the data are represented by the solid line.
in plastocyanin, it has 17% sulfur character per Ni–S bondsummed over two holes. The Ni–S bond is more covalentthan the corresponding metal-chloride bond (5%) in spite ofhaving one less� donor orbital (i.e. one S 3p orbital is in-volved in the S–C bond). The increase is due to increased� covalency of thiolates along with better� overlap of themore extended sulfur orbitals.
5.1.2. Rubredoxin model complexesThe S K-edge XAS of two model complexes [FeIII (SPh)4]−
and [FeIII (S2-o-xyl)2]− were reported[72] (Fig. 18). TheXAS of the oxidized models have a well resolved pre-edge;the pre-edge of the reduced model is partially overlappedby the rising edge. Using an effective S4 site symmetry for[FeIII (S2-o-xyl)2]−, its pre-edge was fit using four peaks toresolve the transitions to5A, 5B, 5B and 5E dn+1 excitedstates corresponding to transitions to the half occupiedmetal d orbitals (Fig. 18 inset). These peaks correspond to
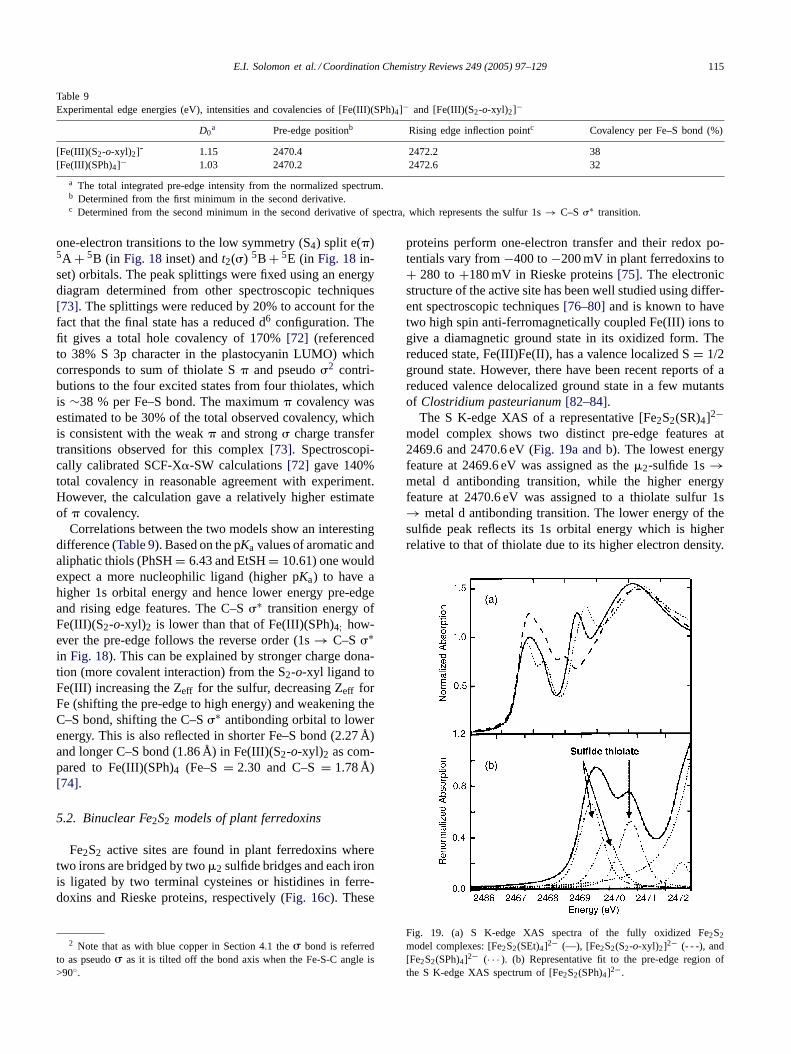
E.I. Solomon et al. / Coordination Chemistry Reviews 249 (2005) 97–129 115
Table 9Experimental edge energies (eV), intensities and covalencies of [Fe(III)(SPh)4]− and [Fe(III)(S2-o-xyl)2]−
D0a Pre-edge positionb Rising edge inflection pointc Covalency per Fe–S bond (%)
[Fe(III)(S2-o-xyl)2]- 1.15 2470.4 2472.2 38[Fe(III)(SPh)4]− 1.03 2470.2 2472.6 32
a The total integrated pre-edge intensity from the normalized spectrum.b Determined from the first minimum in the second derivative.c Determined from the second minimum in the second derivative of spectra, which represents the sulfur 1s→ C–S �∗ transition.
one-electron transitions to the low symmetry (S4) split e(�)5A + 5B (in Fig. 18inset) andt2(�) 5B + 5E (in Fig. 18in-set) orbitals. The peak splittings were fixed using an energydiagram determined from other spectroscopic techniques[73]. The splittings were reduced by 20% to account for thefact that the final state has a reduced d6 configuration. Thefit gives a total hole covalency of 170%[72] (referencedto 38% S 3p character in the plastocyanin LUMO) whichcorresponds to sum of thiolate S� and pseudo�2 contri-butions to the four excited states from four thiolates, whichis ∼38 % per Fe–S bond. The maximum� covalency wasestimated to be 30% of the total observed covalency, whichis consistent with the weak� and strong� charge transfertransitions observed for this complex[73]. Spectroscopi-cally calibrated SCF-X�-SW calculations[72] gave 140%total covalency in reasonable agreement with experiment.However, the calculation gave a relatively higher estimateof � covalency.
Correlations between the two models show an interestingdifference (Table 9). Based on the pKa values of aromatic andaliphatic thiols (PhSH= 6.43 and EtSH= 10.61) one wouldexpect a more nucleophilic ligand (higher pKa) to have ahigher 1s orbital energy and hence lower energy pre-edgeand rising edge features. The C–S�∗ transition energy ofFe(III)(S2-o-xyl)2 is lower than that of Fe(III)(SPh)4; how-ever the pre-edge follows the reverse order (1s→ C–S�∗in Fig. 18). This can be explained by stronger charge dona-tion (more covalent interaction) from the S2-o-xyl ligand toFe(III) increasing the Zeff for the sulfur, decreasing Zeff forFe (shifting the pre-edge to high energy) and weakening theC–S bond, shifting the C–S�∗ antibonding orbital to lowerenergy. This is also reflected in shorter Fe–S bond (2.27 Å)and longer C–S bond (1.86 Å) in Fe(III)(S2-o-xyl)2 as com-pared to Fe(III)(SPh)4 (Fe–S= 2.30 and C–S= 1.78 Å)[74].
5.2. Binuclear Fe2S2 models of plant ferredoxins
Fe2S2 active sites are found in plant ferredoxins wheretwo irons are bridged by two�2 sulfide bridges and each ironis ligated by two terminal cysteines or histidines in ferre-doxins and Rieske proteins, respectively (Fig. 16c). These
2 Note that as with blue copper in Section 4.1 the� bond is referredto as pseudo� as it is tilted off the bond axis when the Fe-S-C angle is>90◦.
proteins perform one-electron transfer and their redox po-tentials vary from−400 to−200 mV in plant ferredoxins to+ 280 to+180 mV in Rieske proteins[75]. The electronicstructure of the active site has been well studied using differ-ent spectroscopic techniques[76–80]and is known to havetwo high spin anti-ferromagnetically coupled Fe(III) ions togive a diamagnetic ground state in its oxidized form. Thereduced state, Fe(III)Fe(II), has a valence localized S= 1/2ground state. However, there have been recent reports of areduced valence delocalized ground state in a few mutantsof Clostridium pasteurianum[82–84].
The S K-edge XAS of a representative [Fe2S2(SR)4]2−model complex shows two distinct pre-edge features at2469.6 and 2470.6 eV (Fig. 19a and b). The lowest energyfeature at 2469.6 eV was assigned as the�2-sulfide 1s→metal d antibonding transition, while the higher energyfeature at 2470.6 eV was assigned to a thiolate sulfur 1s→ metal d antibonding transition. The lower energy of thesulfide peak reflects its 1s orbital energy which is higherrelative to that of thiolate due to its higher electron density.
Fig. 19. (a) S K-edge XAS spectra of the fully oxidized Fe2S2
model complexes: [Fe2S2(SEt)4]2− (—), [Fe2S2(S2-o-xyl)2]2− (- - -), and[Fe2S2(SPh)4]2− (· · · ). (b) Representative fit to the pre-edge region ofthe S K-edge XAS spectrum of [Fe2S2(SPh)4]2−.
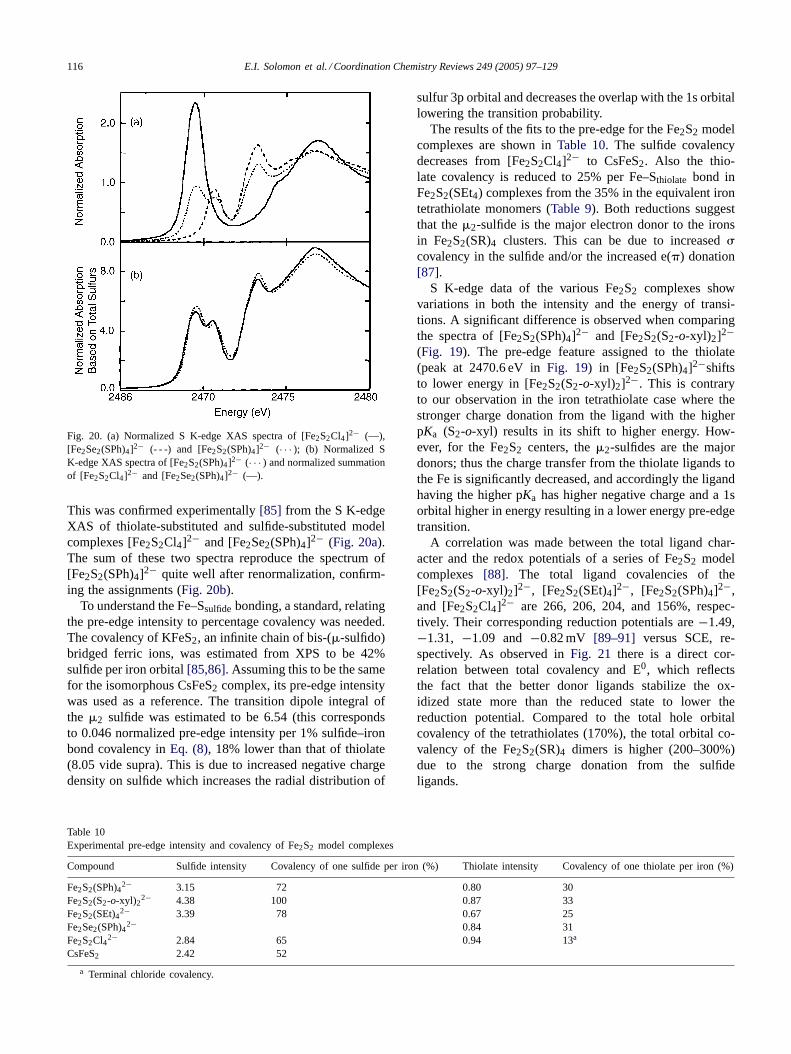
116 E.I. Solomon et al. / Coordination Chemistry Reviews 249 (2005) 97–129
Fig. 20. (a) Normalized S K-edge XAS spectra of [Fe2S2Cl4]2− (—),[Fe2Se2(SPh)4]2− (- - -) and [Fe2S2(SPh)4]2− (· · · ); (b) Normalized SK-edge XAS spectra of [Fe2S2(SPh)4]2− (· · · ) and normalized summationof [Fe2S2Cl4]2− and [Fe2Se2(SPh)4]2− (—).
This was confirmed experimentally[85] from the S K-edgeXAS of thiolate-substituted and sulfide-substituted modelcomplexes [Fe2S2Cl4]2− and [Fe2Se2(SPh)4]2− (Fig. 20a).The sum of these two spectra reproduce the spectrum of[Fe2S2(SPh)4]2− quite well after renormalization, confirm-ing the assignments (Fig. 20b).
To understand the Fe–Ssulfidebonding, a standard, relatingthe pre-edge intensity to percentage covalency was needed.The covalency of KFeS2, an infinite chain of bis-(�-sulfido)bridged ferric ions, was estimated from XPS to be 42%sulfide per iron orbital[85,86]. Assuming this to be the samefor the isomorphous CsFeS2 complex, its pre-edge intensitywas used as a reference. The transition dipole integral ofthe �2 sulfide was estimated to be 6.54 (this correspondsto 0.046 normalized pre-edge intensity per 1% sulfide–ironbond covalency inEq. (8), 18% lower than that of thiolate(8.05 vide supra). This is due to increased negative chargedensity on sulfide which increases the radial distribution of
Table 10Experimental pre-edge intensity and covalency of Fe2S2 model complexes
Compound Sulfide intensity Covalency of one sulfide per iron (%) Thiolate intensity Covalency of one thiolate per iron (%)
Fe2S2(SPh)42− 3.15 72 0.80 30Fe2S2(S2-o-xyl)2
2− 4.38 100 0.87 33Fe2S2(SEt)42− 3.39 78 0.67 25Fe2Se2(SPh)42− 0.84 31Fe2S2Cl42− 2.84 65 0.94 13a
CsFeS2 2.42 52
a Terminal chloride covalency.
sulfur 3p orbital and decreases the overlap with the 1s orbitallowering the transition probability.
The results of the fits to the pre-edge for the Fe2S2 modelcomplexes are shown inTable 10. The sulfide covalencydecreases from [Fe2S2Cl4]2− to CsFeS2. Also the thio-late covalency is reduced to 25% per Fe–Sthiolate bond inFe2S2(SEt4) complexes from the 35% in the equivalent irontetrathiolate monomers (Table 9). Both reductions suggestthat the�2-sulfide is the major electron donor to the ironsin Fe2S2(SR)4 clusters. This can be due to increased�covalency in the sulfide and/or the increased e(�) donation[87].
S K-edge data of the various Fe2S2 complexes showvariations in both the intensity and the energy of transi-tions. A significant difference is observed when comparingthe spectra of [Fe2S2(SPh)4]2− and [Fe2S2(S2-o-xyl)2]2−(Fig. 19). The pre-edge feature assigned to the thiolate(peak at 2470.6 eV inFig. 19) in [Fe2S2(SPh)4]2−shiftsto lower energy in [Fe2S2(S2-o-xyl)2]2−. This is contraryto our observation in the iron tetrathiolate case where thestronger charge donation from the ligand with the higherpKa (S2-o-xyl) results in its shift to higher energy. How-ever, for the Fe2S2 centers, the�2-sulfides are the majordonors; thus the charge transfer from the thiolate ligands tothe Fe is significantly decreased, and accordingly the ligandhaving the higher pKa has higher negative charge and a 1sorbital higher in energy resulting in a lower energy pre-edgetransition.
A correlation was made between the total ligand char-acter and the redox potentials of a series of Fe2S2 modelcomplexes [88]. The total ligand covalencies of the[Fe2S2(S2-o-xyl)2]2−, [Fe2S2(SEt)4]2−, [Fe2S2(SPh)4]2−,and [Fe2S2Cl4]2− are 266, 206, 204, and 156%, respec-tively. Their corresponding reduction potentials are−1.49,−1.31, −1.09 and −0.82 mV [89–91] versus SCE, re-spectively. As observed inFig. 21 there is a direct cor-relation between total covalency and E0, which reflectsthe fact that the better donor ligands stabilize the ox-idized state more than the reduced state to lower thereduction potential. Compared to the total hole orbitalcovalency of the tetrathiolates (170%), the total orbital co-valency of the Fe2S2(SR)4 dimers is higher (200–300%)due to the strong charge donation from the sulfideligands.
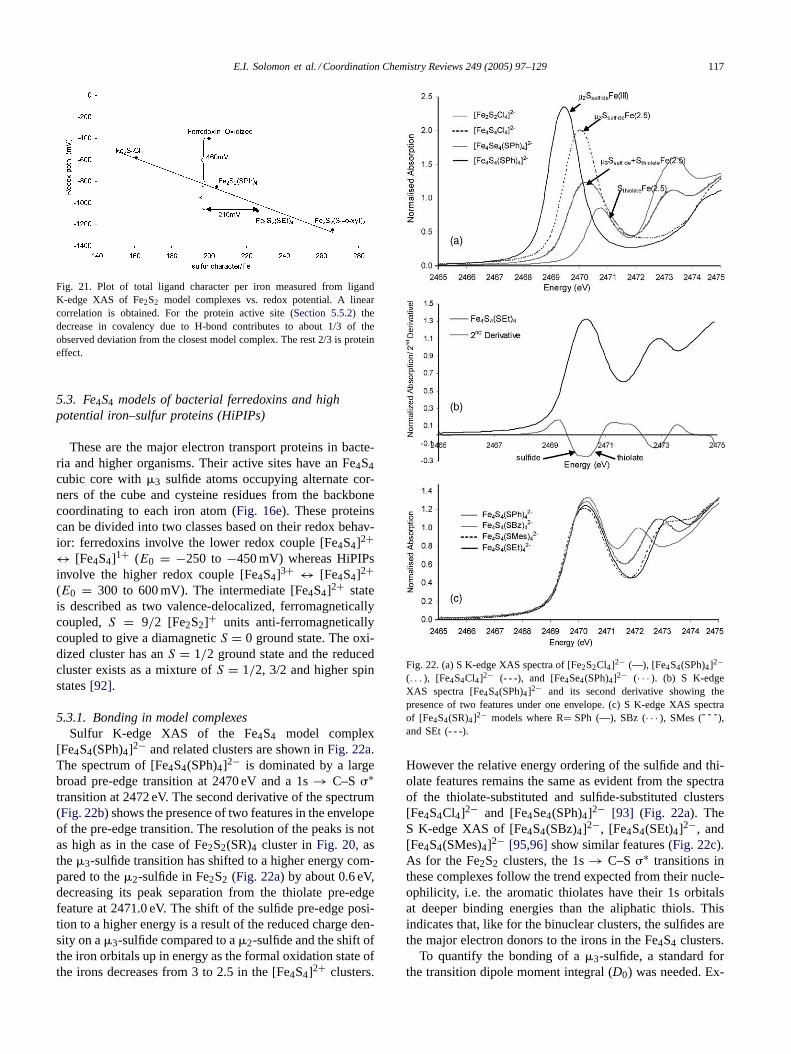
E.I. Solomon et al. / Coordination Chemistry Reviews 249 (2005) 97–129 117
Fig. 21. Plot of total ligand character per iron measured from ligandK-edge XAS of Fe2S2 model complexes vs. redox potential. A linearcorrelation is obtained. For the protein active site (Section 5.5.2) thedecrease in covalency due to H-bond contributes to about 1/3 of theobserved deviation from the closest model complex. The rest 2/3 is proteineffect.
5.3. Fe4S4 models of bacterial ferredoxins and highpotential iron–sulfur proteins (HiPIPs)
These are the major electron transport proteins in bacte-ria and higher organisms. Their active sites have an Fe4S4cubic core with�3 sulfide atoms occupying alternate cor-ners of the cube and cysteine residues from the backbonecoordinating to each iron atom (Fig. 16e). These proteinscan be divided into two classes based on their redox behav-ior: ferredoxins involve the lower redox couple [Fe4S4]2+↔ [Fe4S4]1+ (E0 = −250 to −450 mV) whereas HiPIPsinvolve the higher redox couple [Fe4S4]3+ ↔ [Fe4S4]2+(E0 = 300 to 600 mV). The intermediate [Fe4S4]2+ stateis described as two valence-delocalized, ferromagneticallycoupled,S = 9/2 [Fe2S2]+ units anti-ferromagneticallycoupled to give a diamagneticS = 0 ground state. The oxi-dized cluster has anS = 1/2 ground state and the reducedcluster exists as a mixture ofS = 1/2, 3/2 and higher spinstates[92].
5.3.1. Bonding in model complexesSulfur K-edge XAS of the Fe4S4 model complex
[Fe4S4(SPh)4]2− and related clusters are shown inFig. 22a.The spectrum of [Fe4S4(SPh)4]2− is dominated by a largebroad pre-edge transition at 2470 eV and a 1s→ C–S �∗transition at 2472 eV. The second derivative of the spectrum(Fig. 22b) shows the presence of two features in the envelopeof the pre-edge transition. The resolution of the peaks is notas high as in the case of Fe2S2(SR)4 cluster inFig. 20, asthe�3-sulfide transition has shifted to a higher energy com-pared to the�2-sulfide in Fe2S2 (Fig. 22a) by about 0.6 eV,decreasing its peak separation from the thiolate pre-edgefeature at 2471.0 eV. The shift of the sulfide pre-edge posi-tion to a higher energy is a result of the reduced charge den-sity on a�3-sulfide compared to a�2-sulfide and the shift ofthe iron orbitals up in energy as the formal oxidation state ofthe irons decreases from 3 to 2.5 in the [Fe4S4]2+ clusters.
Fig. 22. (a) S K-edge XAS spectra of [Fe2S2Cl4]2− (—), [Fe4S4(SPh)4]2−(. . . ), [Fe4S4Cl4]2− (- - -), and [Fe4Se4(SPh)4]2− (· · · ). (b) S K-edgeXAS spectra [Fe4S4(SPh)4]2− and its second derivative showing thepresence of two features under one envelope. (c) S K-edge XAS spectraof [Fe4S4(SR)4]2− models where R= SPh (—), SBz (· · · ), SMes (- - -),and SEt (- - -).
However the relative energy ordering of the sulfide and thi-olate features remains the same as evident from the spectraof the thiolate-substituted and sulfide-substituted clusters[Fe4S4Cl4]2− and [Fe4Se4(SPh)4]2− [93] (Fig. 22a). TheS K-edge XAS of [Fe4S4(SBz)4]2−, [Fe4S4(SEt)4]2−, and[Fe4S4(SMes)4]2− [95,96]show similar features (Fig. 22c).As for the Fe2S2 clusters, the 1s→ C–S�∗ transitions inthese complexes follow the trend expected from their nucle-ophilicity, i.e. the aromatic thiolates have their 1s orbitalsat deeper binding energies than the aliphatic thiols. Thisindicates that, like for the binuclear clusters, the sulfides arethe major electron donors to the irons in the Fe4S4 clusters.
To quantify the bonding of a�3-sulfide, a standard forthe transition dipole moment integral (D0) was needed. Ex-
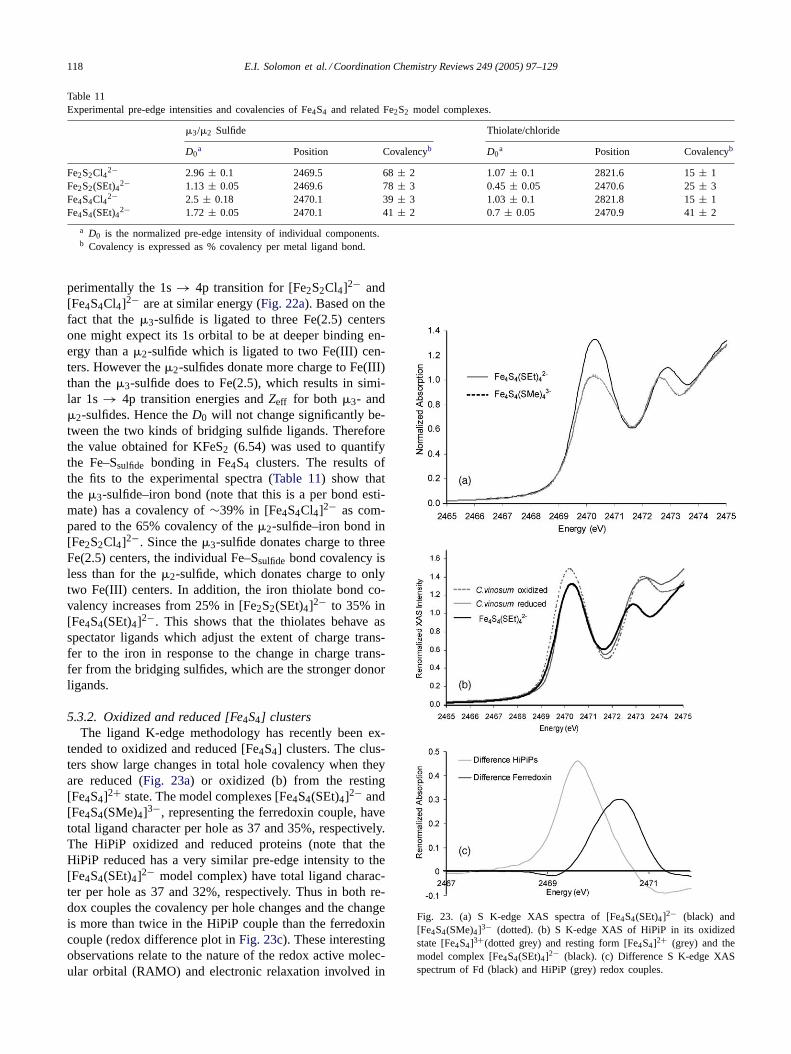
118 E.I. Solomon et al. / Coordination Chemistry Reviews 249 (2005) 97–129
Table 11Experimental pre-edge intensities and covalencies of Fe4S4 and related Fe2S2 model complexes.
�3/�2 Sulfide Thiolate/chloride
D0a Position Covalencyb D0
a Position Covalencyb
Fe2S2Cl42− 2.96 ± 0.1 2469.5 68± 2 1.07± 0.1 2821.6 15± 1Fe2S2(SEt)42− 1.13 ± 0.05 2469.6 78± 3 0.45± 0.05 2470.6 25± 3Fe4S4Cl42− 2.5 ± 0.18 2470.1 39± 3 1.03± 0.1 2821.8 15± 1Fe4S4(SEt)42− 1.72 ± 0.05 2470.1 41± 2 0.7 ± 0.05 2470.9 41± 2
a D0 is the normalized pre-edge intensity of individual components.b Covalency is expressed as % covalency per metal ligand bond.
perimentally the 1s→ 4p transition for [Fe2S2Cl4]2− and[Fe4S4Cl4]2− are at similar energy (Fig. 22a). Based on thefact that the�3-sulfide is ligated to three Fe(2.5) centersone might expect its 1s orbital to be at deeper binding en-ergy than a�2-sulfide which is ligated to two Fe(III) cen-ters. However the�2-sulfides donate more charge to Fe(III)than the�3-sulfide does to Fe(2.5), which results in simi-lar 1s→ 4p transition energies andZeff for both �3- and�2-sulfides. Hence theD0 will not change significantly be-tween the two kinds of bridging sulfide ligands. Thereforethe value obtained for KFeS2 (6.54) was used to quantifythe Fe–Ssulfide bonding in Fe4S4 clusters. The results ofthe fits to the experimental spectra (Table 11) show thatthe �3-sulfide–iron bond (note that this is a per bond esti-mate) has a covalency of∼39% in [Fe4S4Cl4]2− as com-pared to the 65% covalency of the�2-sulfide–iron bond in[Fe2S2Cl4]2−. Since the�3-sulfide donates charge to threeFe(2.5) centers, the individual Fe–Ssulfide bond covalency isless than for the�2-sulfide, which donates charge to onlytwo Fe(III) centers. In addition, the iron thiolate bond co-valency increases from 25% in [Fe2S2(SEt)4]2− to 35% in[Fe4S4(SEt)4]2−. This shows that the thiolates behave asspectator ligands which adjust the extent of charge trans-fer to the iron in response to the change in charge trans-fer from the bridging sulfides, which are the stronger donorligands.
5.3.2. Oxidized and reduced [Fe4S4] clustersThe ligand K-edge methodology has recently been ex-
tended to oxidized and reduced [Fe4S4] clusters. The clus-ters show large changes in total hole covalency when theyare reduced (Fig. 23a) or oxidized (b) from the resting[Fe4S4]2+ state. The model complexes [Fe4S4(SEt)4]2− and[Fe4S4(SMe)4]3−, representing the ferredoxin couple, havetotal ligand character per hole as 37 and 35%, respectively.The HiPiP oxidized and reduced proteins (note that theHiPiP reduced has a very similar pre-edge intensity to the[Fe4S4(SEt)4]2− model complex) have total ligand charac-ter per hole as 37 and 32%, respectively. Thus in both re-dox couples the covalency per hole changes and the changeis more than twice in the HiPiP couple than the ferredoxincouple (redox difference plot inFig. 23c). These interestingobservations relate to the nature of the redox active molec-ular orbital (RAMO) and electronic relaxation involved in
Fig. 23. (a) S K-edge XAS spectra of [Fe4S4(SEt)4]2− (black) and[Fe4S4(SMe)4]3− (dotted). (b) S K-edge XAS of HiPiP in its oxidizedstate [Fe4S4]3+(dotted grey) and resting form [Fe4S4]2+ (grey) and themodel complex [Fe4S4(SEt)4]2− (black). (c) Difference S K-edge XASspectrum of Fd (black) and HiPiP (grey) redox couples.
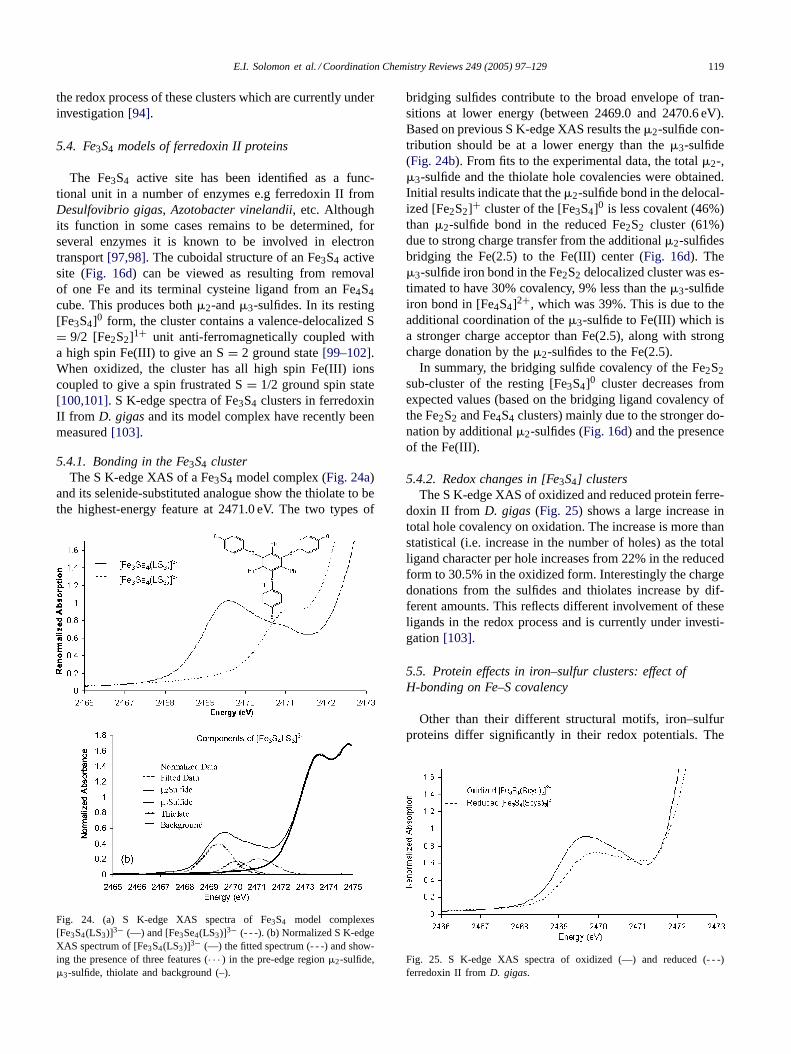
E.I. Solomon et al. / Coordination Chemistry Reviews 249 (2005) 97–129 119
the redox process of these clusters which are currently underinvestigation[94].
5.4. Fe3S4 models of ferredoxin II proteins
The Fe3S4 active site has been identified as a func-tional unit in a number of enzymes e.g ferredoxin II fromDesulfovibrio gigas, Azotobacter vinelandii, etc. Althoughits function in some cases remains to be determined, forseveral enzymes it is known to be involved in electrontransport[97,98]. The cuboidal structure of an Fe3S4 activesite (Fig. 16d) can be viewed as resulting from removalof one Fe and its terminal cysteine ligand from an Fe4S4cube. This produces both�2-and�3-sulfides. In its resting[Fe3S4]0 form, the cluster contains a valence-delocalized S= 9/2 [Fe2S2]1+ unit anti-ferromagnetically coupled witha high spin Fe(III) to give an S= 2 ground state[99–102].When oxidized, the cluster has all high spin Fe(III) ionscoupled to give a spin frustrated S= 1/2 ground spin state[100,101]. S K-edge spectra of Fe3S4 clusters in ferredoxinII from D. gigasand its model complex have recently beenmeasured[103].
5.4.1. Bonding in the Fe3S4 clusterThe S K-edge XAS of a Fe3S4 model complex (Fig. 24a)
and its selenide-substituted analogue show the thiolate to bethe highest-energy feature at 2471.0 eV. The two types of
Fig. 24. (a) S K-edge XAS spectra of Fe3S4 model complexes[Fe3S4(LS3)]3− (—) and [Fe3Se4(LS3)]3− (- - -). (b) Normalized S K-edgeXAS spectrum of [Fe3S4(LS3)]3− (—) the fitted spectrum (- - -) and show-ing the presence of three features (· · · ) in the pre-edge region�2-sulfide,�3-sulfide, thiolate and background (–).
bridging sulfides contribute to the broad envelope of tran-sitions at lower energy (between 2469.0 and 2470.6 eV).Based on previous S K-edge XAS results the�2-sulfide con-tribution should be at a lower energy than the�3-sulfide(Fig. 24b). From fits to the experimental data, the total�2-,�3-sulfide and the thiolate hole covalencies were obtained.Initial results indicate that the�2-sulfide bond in the delocal-ized [Fe2S2]+ cluster of the [Fe3S4]0 is less covalent (46%)than �2-sulfide bond in the reduced Fe2S2 cluster (61%)due to strong charge transfer from the additional�2-sulfidesbridging the Fe(2.5) to the Fe(III) center (Fig. 16d). The�3-sulfide iron bond in the Fe2S2 delocalized cluster was es-timated to have 30% covalency, 9% less than the�3-sulfideiron bond in [Fe4S4]2+, which was 39%. This is due to theadditional coordination of the�3-sulfide to Fe(III) which isa stronger charge acceptor than Fe(2.5), along with strongcharge donation by the�2-sulfides to the Fe(2.5).
In summary, the bridging sulfide covalency of the Fe2S2sub-cluster of the resting [Fe3S4]0 cluster decreases fromexpected values (based on the bridging ligand covalency ofthe Fe2S2 and Fe4S4 clusters) mainly due to the stronger do-nation by additional�2-sulfides (Fig. 16d) and the presenceof the Fe(III).
5.4.2. Redox changes in [Fe3S4] clustersThe S K-edge XAS of oxidized and reduced protein ferre-
doxin II from D. gigas(Fig. 25) shows a large increase intotal hole covalency on oxidation. The increase is more thanstatistical (i.e. increase in the number of holes) as the totalligand character per hole increases from 22% in the reducedform to 30.5% in the oxidized form. Interestingly the chargedonations from the sulfides and thiolates increase by dif-ferent amounts. This reflects different involvement of theseligands in the redox process and is currently under investi-gation[103].
5.5. Protein effects in iron–sulfur clusters: effect ofH-bonding on Fe–S covalency
Other than their different structural motifs, iron–sulfurproteins differ significantly in their redox potentials. The
Fig. 25. S K-edge XAS spectra of oxidized (—) and reduced (- - -)ferredoxin II from D. gigas.

120 E.I. Solomon et al. / Coordination Chemistry Reviews 249 (2005) 97–129
Fig. 26. S K-edge XAS spectra of Oxidized Rubredoxin proteins Cp (· · · ),Pf (- - -), Cp/Pf (-.-.-), and the model [FeIII (S2-o-xyl)2]− (—).
difference in the redox potential between proteins from dif-ferent organisms having the same active site structure can beas much as 1 V[104]. In contrast, model complexes having asimilar structure have quite similar redox potentials. Henceit is important to understand the effects that contribute to theredox potential of a protein active site. In addition to pro-tein dielectric effects, solvent accessibility, H-bonds and sur-rounding peptide dipoles can make significant contributionsto the redox potentials based on experimental[105–109]andcomputational results[110,111]. S K-edge XAS has provedto be a powerful probe of H-bonding to sulfur ligands as thismethod directly probes the covalency of the Fe–S bond.
The amount of charge transfer from the ligands to themetal, i.e. covalency of the M–L bond, makes a very sig-nificant contribution to the redox potentials particularly incovalent systems like the iron–sulfur proteins. Increased co-valency stabilizes the higher oxidation state reducing the re-duction potential of the system. In the presence of H-bondsto the sulfur, the charge transfer of the ligand to the metalshould decrease and the redox potential should become morepositive.
5.5.1. RubredoxinsThe S K-edge XAS spectra of rubredoxins from three dif-
ferent organisms,C. pasteurianum(Cp), Pyrococcus furio-sus(Pf) and a mutant having half the sequence from each ofthe above two proteins (Cp/Pf), are shown inFig. 26along
Table 12Results of the pre-edge fits for rubredoxin proteins and models
Sample Normalized pre-edge intensity Renormalized pre-edge intensitya Rescaled total S covalencyb (%)
[Et4N][Fe(o-C6H4(CH2S)2)2] 1.15 1.15 171± 3CfRd 0.96 0.96 125± 6PfRd 0.83 1.03 135± 8Cp15|PfRd 0.79 0.98 129± 7
a The observed intensity has to be scaled up to account for the extra methionine and cysteine sulfurs in the protein that contributes to the edge-jumpbut does not contribute to the pre-edge.
b The covalency reported here is total % thiolate character after renormalization.
Fig. 27. S K-edge XAS spectra of Rieske protein (· · · ), spinach ferredoxin(- - -) and a model complex Fe2S2(SEt)42− (—).
with data of the model complex [Fe(S2-o-xyl)2]− [72]. Theproteins display an intense pre-edge feature at approximatelythe same energy as for the model complex.
The intensity of the transition is lower than that ofthe model complex; however, and this reduction variesin magnitude for the different proteins. This reduction inpre-edge intensity implies a reduction in Fe–Sthiolate bondcovalency, which was quantified by fits to the experimentalspectra (Table 12). The total hole covalency for the fourthiolate-Fe(III) bonds is 125–130% in the proteins com-pared to 170% in the model. The protein active sites have 6backbone N–H–S(Cys) H-bonds reducing the covalency ofthese sites. The redox potentials of these proteins are∼1 Vhigher than for for the model complex. This is partly dueto the H-bonds to the site and partly due to other proteineffects. These effects could be separately estimated for theFe2S2 clusters as discussed below.
5.5.2. Fe2S2 clusters in ferredoxins and Rieske proteinsS K-edge XAS of spinach ferredoxin and a Rieske protein
are shown inFig. 27together with the S K-edge XAS datafor the model system [Fe2S2(SEt)4]2− [85,88]. The proteinshave similarly broad pre-edge features but are much less in-tense than the pre-edge feature of the model complex. Sincethere are two contributions to the pre-edge, from sulfide andthiolate, fits were performed to quantify the decrease in co-valency for each type of ligand (Table 13). The intensities,renormalized to total number of sulfur absorbers contribut-ing to the pre-edge, show that the covalency of the thiolates
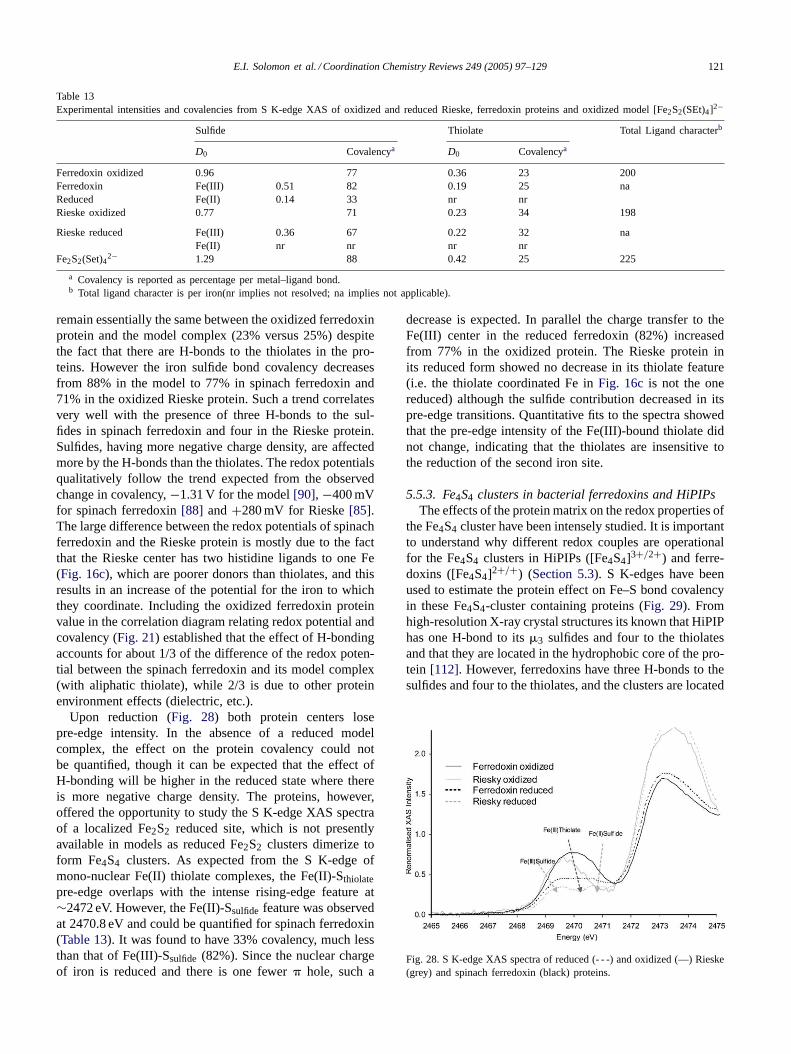
E.I. Solomon et al. / Coordination Chemistry Reviews 249 (2005) 97–129 121
Table 13Experimental intensities and covalencies from S K-edge XAS of oxidized and reduced Rieske, ferredoxin proteins and oxidized model [Fe2S2(SEt)4]2−
Sulfide Thiolate Total Ligand characterb
D0 Covalencya D0 Covalencya
Ferredoxin oxidized 0.96 77 0.36 23 200Ferredoxin Fe(III) 0.51 82 0.19 25 naReduced Fe(II) 0.14 33 nr nrRieske oxidized 0.77 71 0.23 34 198
Rieske reduced Fe(III) 0.36 67 0.22 32 naFe(II) nr nr nr nr
Fe2S2(Set)42− 1.29 88 0.42 25 225
a Covalency is reported as percentage per metal–ligand bond.b Total ligand character is per iron(nr implies not resolved; na implies not applicable).
remain essentially the same between the oxidized ferredoxinprotein and the model complex (23% versus 25%) despitethe fact that there are H-bonds to the thiolates in the pro-teins. However the iron sulfide bond covalency decreasesfrom 88% in the model to 77% in spinach ferredoxin and71% in the oxidized Rieske protein. Such a trend correlatesvery well with the presence of three H-bonds to the sul-fides in spinach ferredoxin and four in the Rieske protein.Sulfides, having more negative charge density, are affectedmore by the H-bonds than the thiolates. The redox potentialsqualitatively follow the trend expected from the observedchange in covalency,−1.31 V for the model[90], −400 mVfor spinach ferredoxin[88] and+280 mV for Rieske[85].The large difference between the redox potentials of spinachferredoxin and the Rieske protein is mostly due to the factthat the Rieske center has two histidine ligands to one Fe(Fig. 16c), which are poorer donors than thiolates, and thisresults in an increase of the potential for the iron to whichthey coordinate. Including the oxidized ferredoxin proteinvalue in the correlation diagram relating redox potential andcovalency (Fig. 21) established that the effect of H-bondingaccounts for about 1/3 of the difference of the redox poten-tial between the spinach ferredoxin and its model complex(with aliphatic thiolate), while 2/3 is due to other proteinenvironment effects (dielectric, etc.).
Upon reduction (Fig. 28) both protein centers losepre-edge intensity. In the absence of a reduced modelcomplex, the effect on the protein covalency could notbe quantified, though it can be expected that the effect ofH-bonding will be higher in the reduced state where thereis more negative charge density. The proteins, however,offered the opportunity to study the S K-edge XAS spectraof a localized Fe2S2 reduced site, which is not presentlyavailable in models as reduced Fe2S2 clusters dimerize toform Fe4S4 clusters. As expected from the S K-edge ofmono-nuclear Fe(II) thiolate complexes, the Fe(II)-Sthiolatepre-edge overlaps with the intense rising-edge feature at∼2472 eV. However, the Fe(II)-Ssulfide feature was observedat 2470.8 eV and could be quantified for spinach ferredoxin(Table 13). It was found to have 33% covalency, much lessthan that of Fe(III)-Ssulfide (82%). Since the nuclear chargeof iron is reduced and there is one fewer� hole, such a
decrease is expected. In parallel the charge transfer to theFe(III) center in the reduced ferredoxin (82%) increasedfrom 77% in the oxidized protein. The Rieske protein inits reduced form showed no decrease in its thiolate feature(i.e. the thiolate coordinated Fe inFig. 16c is not the onereduced) although the sulfide contribution decreased in itspre-edge transitions. Quantitative fits to the spectra showedthat the pre-edge intensity of the Fe(III)-bound thiolate didnot change, indicating that the thiolates are insensitive tothe reduction of the second iron site.
5.5.3. Fe4S4 clusters in bacterial ferredoxins and HiPIPsThe effects of the protein matrix on the redox properties of
the Fe4S4 cluster have been intensely studied. It is importantto understand why different redox couples are operationalfor the Fe4S4 clusters in HiPIPs ([Fe4S4]3+/2+) and ferre-doxins ([Fe4S4]2+/+) (Section 5.3). S K-edges have beenused to estimate the protein effect on Fe–S bond covalencyin these Fe4S4-cluster containing proteins (Fig. 29). Fromhigh-resolution X-ray crystal structures its known that HiPIPhas one H-bond to its�3 sulfides and four to the thiolatesand that they are located in the hydrophobic core of the pro-tein [112]. However, ferredoxins have three H-bonds to thesulfides and four to the thiolates, and the clusters are located
Fig. 28. S K-edge XAS spectra of reduced (- - -) and oxidized (—) Rieske(grey) and spinach ferredoxin (black) proteins.
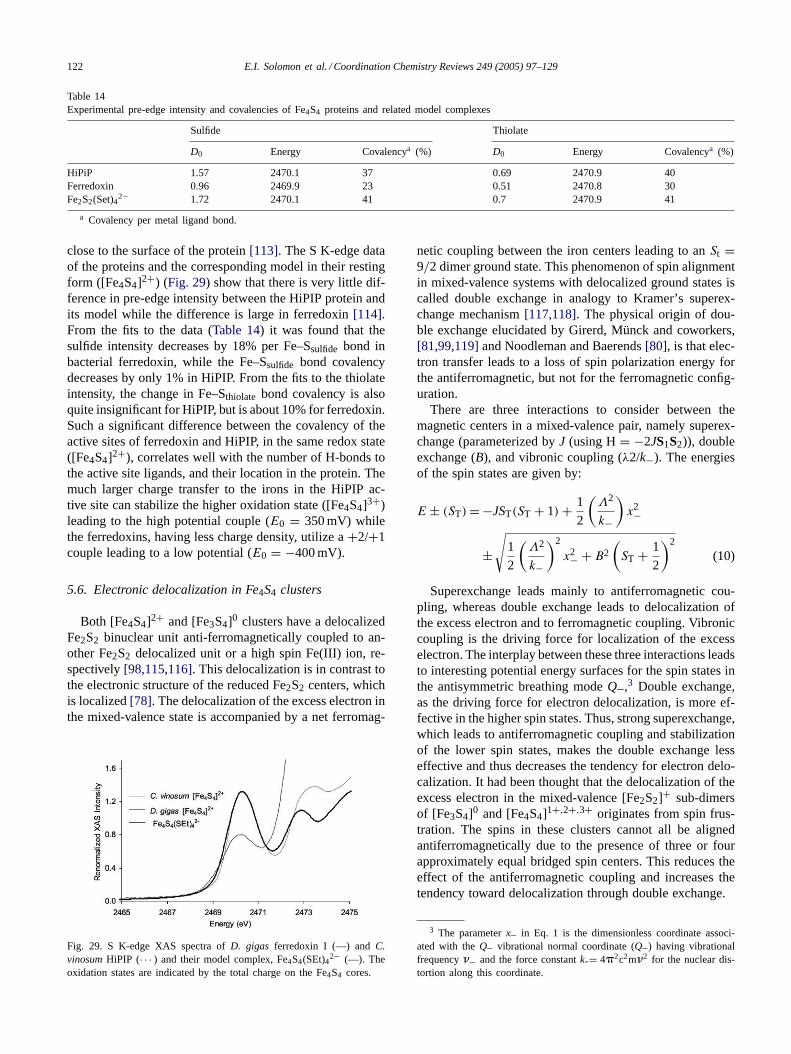
122 E.I. Solomon et al. / Coordination Chemistry Reviews 249 (2005) 97–129
Table 14Experimental pre-edge intensity and covalencies of Fe4S4 proteins and related model complexes
Sulfide Thiolate
D0 Energy Covalencya (%) D0 Energy Covalencya (%)
HiPiP 1.57 2470.1 37 0.69 2470.9 40Ferredoxin 0.96 2469.9 23 0.51 2470.8 30Fe2S2(Set)42− 1.72 2470.1 41 0.7 2470.9 41
a Covalency per metal ligand bond.
close to the surface of the protein[113]. The S K-edge dataof the proteins and the corresponding model in their restingform ([Fe4S4]2+) (Fig. 29) show that there is very little dif-ference in pre-edge intensity between the HiPIP protein andits model while the difference is large in ferredoxin[114].From the fits to the data (Table 14) it was found that thesulfide intensity decreases by 18% per Fe–Ssulfide bond inbacterial ferredoxin, while the Fe–Ssulfide bond covalencydecreases by only 1% in HiPIP. From the fits to the thiolateintensity, the change in Fe–Sthiolate bond covalency is alsoquite insignificant for HiPIP, but is about 10% for ferredoxin.Such a significant difference between the covalency of theactive sites of ferredoxin and HiPIP, in the same redox state([Fe4S4]2+), correlates well with the number of H-bonds tothe active site ligands, and their location in the protein. Themuch larger charge transfer to the irons in the HiPIP ac-tive site can stabilize the higher oxidation state ([Fe4S4]3+)leading to the high potential couple (E0 = 350 mV) whilethe ferredoxins, having less charge density, utilize a+2/+1couple leading to a low potential (E0 = −400 mV).
5.6. Electronic delocalization in Fe4S4 clusters
Both [Fe4S4]2+ and [Fe3S4]0 clusters have a delocalizedFe2S2 binuclear unit anti-ferromagnetically coupled to an-other Fe2S2 delocalized unit or a high spin Fe(III) ion, re-spectively[98,115,116]. This delocalization is in contrast tothe electronic structure of the reduced Fe2S2 centers, whichis localized[78]. The delocalization of the excess electron inthe mixed-valence state is accompanied by a net ferromag-
Fig. 29. S K-edge XAS spectra ofD. gigas ferredoxin I (—) andC.vinosumHiPIP (· · · ) and their model complex, Fe4S4(SEt)42− (—). Theoxidation states are indicated by the total charge on the Fe4S4 cores.
netic coupling between the iron centers leading to anSt =9/2 dimer ground state. This phenomenon of spin alignmentin mixed-valence systems with delocalized ground states iscalled double exchange in analogy to Kramer’s superex-change mechanism[117,118]. The physical origin of dou-ble exchange elucidated by Girerd, Münck and coworkers,[81,99,119]and Noodleman and Baerends[80], is that elec-tron transfer leads to a loss of spin polarization energy forthe antiferromagnetic, but not for the ferromagnetic config-uration.
There are three interactions to consider between themagnetic centers in a mixed-valence pair, namely superex-change (parameterized byJ (using H= −2JS1S2)), doubleexchange (B), and vibronic coupling (λ2/k−). The energiesof the spin states are given by:
E ± (ST)= −JST(ST + 1) + 1
2
(Λ2
k−
)x2−
±√
1
2
(Λ2
k−
)2
x2− + B2
(ST + 1
2
)2
(10)
Superexchange leads mainly to antiferromagnetic cou-pling, whereas double exchange leads to delocalization ofthe excess electron and to ferromagnetic coupling. Vibroniccoupling is the driving force for localization of the excesselectron. The interplay between these three interactions leadsto interesting potential energy surfaces for the spin states inthe antisymmetric breathing modeQ–,3 Double exchange,as the driving force for electron delocalization, is more ef-fective in the higher spin states. Thus, strong superexchange,which leads to antiferromagnetic coupling and stabilizationof the lower spin states, makes the double exchange lesseffective and thus decreases the tendency for electron delo-calization. It had been thought that the delocalization of theexcess electron in the mixed-valence [Fe2S2]+ sub-dimersof [Fe3S4]0 and [Fe4S4]1+,2+,3+ originates from spin frus-tration. The spins in these clusters cannot all be alignedantiferromagnetically due to the presence of three or fourapproximately equal bridged spin centers. This reduces theeffect of the antiferromagnetic coupling and increases thetendency toward delocalization through double exchange.
3 The parameterx– in Eq. 1 is the dimensionless coordinate associ-ated with theQ– vibrational normal coordinate (Q–) having vibrationalfrequency�− and the force constantk-= 4�2c2m�2 for the nuclear dis-tortion along this coordinate.
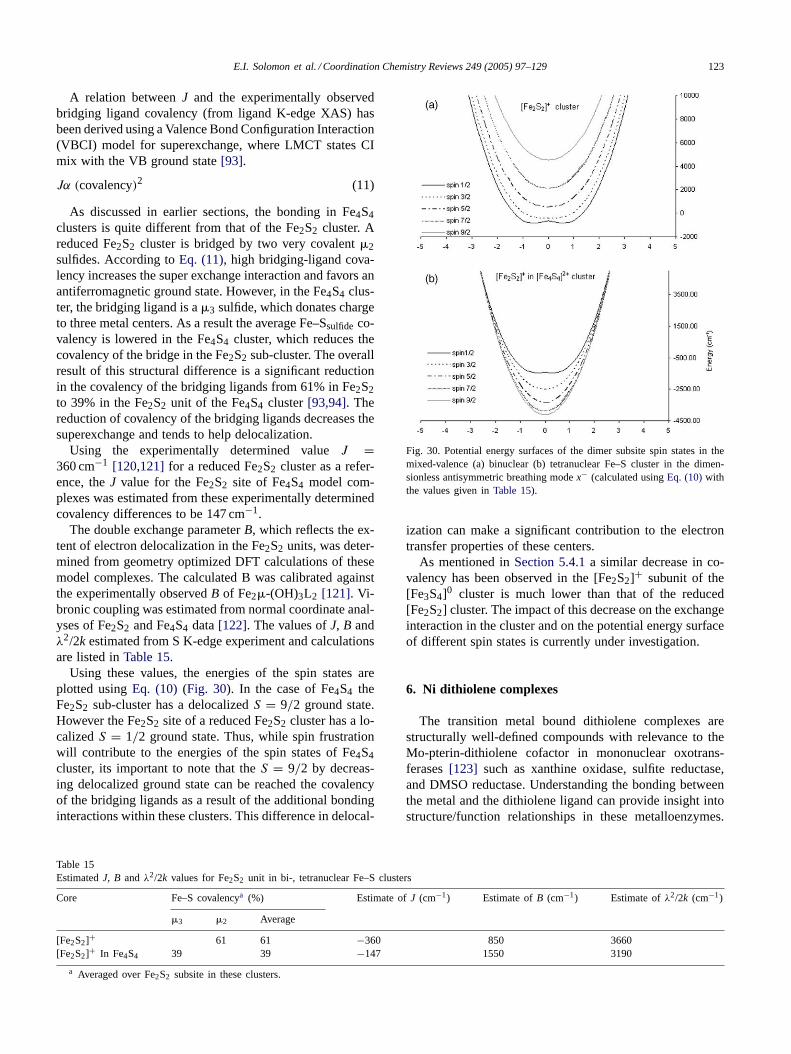
E.I. Solomon et al. / Coordination Chemistry Reviews 249 (2005) 97–129 123
A relation betweenJ and the experimentally observedbridging ligand covalency (from ligand K-edge XAS) hasbeen derived using a Valence Bond Configuration Interaction(VBCI) model for superexchange, where LMCT states CImix with the VB ground state[93].
Jα (covalency)2 (11)
As discussed in earlier sections, the bonding in Fe4S4clusters is quite different from that of the Fe2S2 cluster. Areduced Fe2S2 cluster is bridged by two very covalent�2sulfides. According toEq. (11), high bridging-ligand cova-lency increases the super exchange interaction and favors anantiferromagnetic ground state. However, in the Fe4S4 clus-ter, the bridging ligand is a�3 sulfide, which donates chargeto three metal centers. As a result the average Fe–Ssulfide co-valency is lowered in the Fe4S4 cluster, which reduces thecovalency of the bridge in the Fe2S2 sub-cluster. The overallresult of this structural difference is a significant reductionin the covalency of the bridging ligands from 61% in Fe2S2to 39% in the Fe2S2 unit of the Fe4S4 cluster[93,94]. Thereduction of covalency of the bridging ligands decreases thesuperexchange and tends to help delocalization.
Using the experimentally determined valueJ =360 cm−1 [120,121]for a reduced Fe2S2 cluster as a refer-ence, theJ value for the Fe2S2 site of Fe4S4 model com-plexes was estimated from these experimentally determinedcovalency differences to be 147 cm−1.
The double exchange parameterB, which reflects the ex-tent of electron delocalization in the Fe2S2 units, was deter-mined from geometry optimized DFT calculations of thesemodel complexes. The calculated B was calibrated againstthe experimentally observedB of Fe2�-(OH)3L2 [121]. Vi-bronic coupling was estimated from normal coordinate anal-yses of Fe2S2 and Fe4S4 data[122]. The values ofJ, B andλ2/2k estimated from S K-edge experiment and calculationsare listed inTable 15.
Using these values, the energies of the spin states areplotted usingEq. (10) (Fig. 30). In the case of Fe4S4 theFe2S2 sub-cluster has a delocalizedS = 9/2 ground state.However the Fe2S2 site of a reduced Fe2S2 cluster has a lo-calizedS = 1/2 ground state. Thus, while spin frustrationwill contribute to the energies of the spin states of Fe4S4cluster, its important to note that theS = 9/2 by decreas-ing delocalized ground state can be reached the covalencyof the bridging ligands as a result of the additional bondinginteractions within these clusters. This difference in delocal-
Table 15EstimatedJ, B andλ2/2k values for Fe2S2 unit in bi-, tetranuclear Fe–S clusters
Core Fe–S covalencya (%) Estimate ofJ (cm−1) Estimate ofB (cm−1) Estimate ofλ2/2k (cm−1)
�3 �2 Average
[Fe2S2]+ 61 61 −360 850 3660[Fe2S2]+ In Fe4S4 39 39 −147 1550 3190
a Averaged over Fe2S2 subsite in these clusters.
Fig. 30. Potential energy surfaces of the dimer subsite spin states in themixed-valence (a) binuclear (b) tetranuclear Fe–S cluster in the dimen-sionless antisymmetric breathing modex− (calculated usingEq. (10)withthe values given inTable 15).
ization can make a significant contribution to the electrontransfer properties of these centers.
As mentioned inSection 5.4.1a similar decrease in co-valency has been observed in the [Fe2S2]+ subunit of the[Fe3S4]0 cluster is much lower than that of the reduced[Fe2S2] cluster. The impact of this decrease on the exchangeinteraction in the cluster and on the potential energy surfaceof different spin states is currently under investigation.
6. Ni dithiolene complexes
The transition metal bound dithiolene complexes arestructurally well-defined compounds with relevance to theMo-pterin-dithiolene cofactor in mononuclear oxotrans-ferases[123] such as xanthine oxidase, sulfite reductase,and DMSO reductase. Understanding the bonding betweenthe metal and the dithiolene ligand can provide insight intostructure/function relationships in these metalloenzymes.
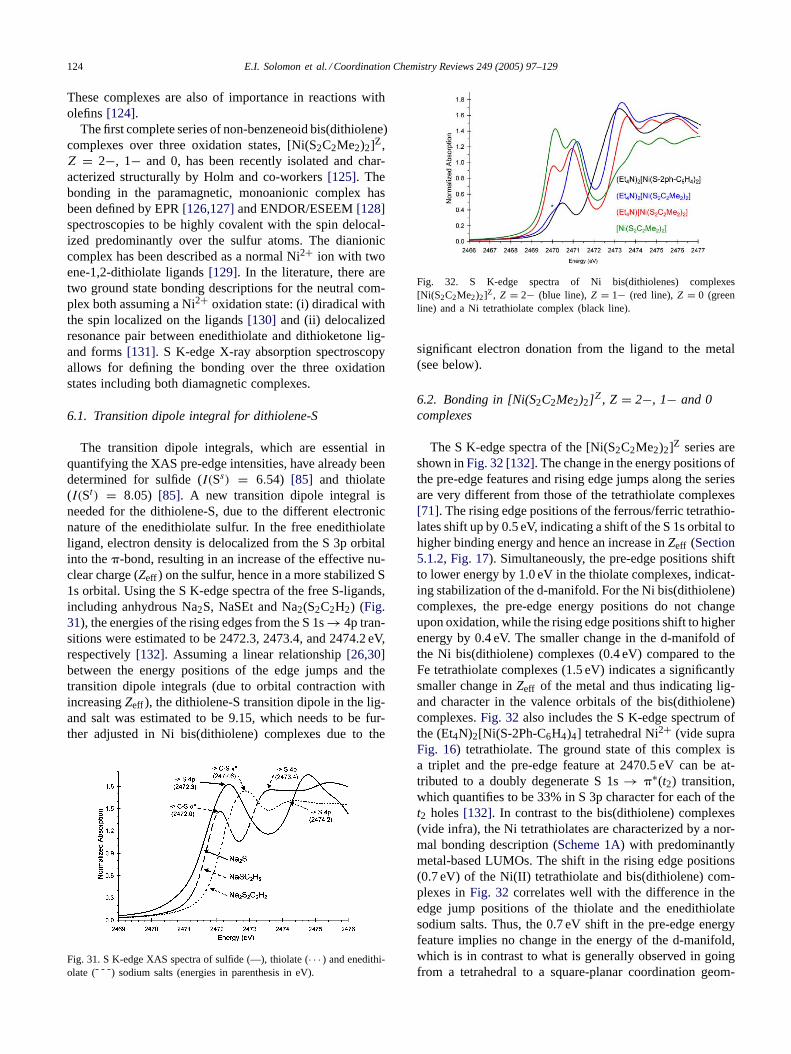
124 E.I. Solomon et al. / Coordination Chemistry Reviews 249 (2005) 97–129
These complexes are also of importance in reactions witholefins[124].
The first complete series of non-benzeneoid bis(dithiolene)complexes over three oxidation states, [Ni(S2C2Me2)2]Z,Z = 2−, 1− and 0, has been recently isolated and char-acterized structurally by Holm and co-workers[125]. Thebonding in the paramagnetic, monoanionic complex hasbeen defined by EPR[126,127]and ENDOR/ESEEM[128]spectroscopies to be highly covalent with the spin delocal-ized predominantly over the sulfur atoms. The dianioniccomplex has been described as a normal Ni2+ ion with twoene-1,2-dithiolate ligands[129]. In the literature, there aretwo ground state bonding descriptions for the neutral com-plex both assuming a Ni2+ oxidation state: (i) diradical withthe spin localized on the ligands[130] and (ii) delocalizedresonance pair between enedithiolate and dithioketone lig-and forms[131]. S K-edge X-ray absorption spectroscopyallows for defining the bonding over the three oxidationstates including both diamagnetic complexes.
6.1. Transition dipole integral for dithiolene-S
The transition dipole integrals, which are essential inquantifying the XAS pre-edge intensities, have already beendetermined for sulfide (I(Ss) = 6.54) [85] and thiolate(I(St) = 8.05) [85]. A new transition dipole integral isneeded for the dithiolene-S, due to the different electronicnature of the enedithiolate sulfur. In the free enedithiolateligand, electron density is delocalized from the S 3p orbitalinto the�-bond, resulting in an increase of the effective nu-clear charge (Zeff ) on the sulfur, hence in a more stabilized S1s orbital. Using the S K-edge spectra of the free S-ligands,including anhydrous Na2S, NaSEt and Na2(S2C2H2) (Fig.31), the energies of the rising edges from the S 1s→ 4p tran-sitions were estimated to be 2472.3, 2473.4, and 2474.2 eV,respectively[132]. Assuming a linear relationship[26,30]between the energy positions of the edge jumps and thetransition dipole integrals (due to orbital contraction withincreasingZeff ), the dithiolene-S transition dipole in the lig-and salt was estimated to be 9.15, which needs to be fur-ther adjusted in Ni bis(dithiolene) complexes due to the
Fig. 31. S K-edge XAS spectra of sulfide (—), thiolate (· · · ) and enedithi-olate (- - -) sodium salts (energies in parenthesis in eV).
Fig. 32. S K-edge spectra of Ni bis(dithiolenes) complexes[Ni(S2C2Me2)2]Z, Z = 2− (blue line),Z = 1− (red line),Z = 0 (greenline) and a Ni tetrathiolate complex (black line).
significant electron donation from the ligand to the metal(see below).
6.2. Bonding in [Ni(S2C2Me2)2]Z, Z = 2−, 1− and 0complexes
The S K-edge spectra of the [Ni(S2C2Me2)2]Z series areshown inFig. 32 [132]. The change in the energy positions ofthe pre-edge features and rising edge jumps along the seriesare very different from those of the tetrathiolate complexes[71]. The rising edge positions of the ferrous/ferric tetrathio-lates shift up by 0.5 eV, indicating a shift of the S 1s orbital tohigher binding energy and hence an increase inZeff (Section5.1.2, Fig. 17). Simultaneously, the pre-edge positions shiftto lower energy by 1.0 eV in the thiolate complexes, indicat-ing stabilization of the d-manifold. For the Ni bis(dithiolene)complexes, the pre-edge energy positions do not changeupon oxidation, while the rising edge positions shift to higherenergy by 0.4 eV. The smaller change in the d-manifold ofthe Ni bis(dithiolene) complexes (0.4 eV) compared to theFe tetrathiolate complexes (1.5 eV) indicates a significantlysmaller change inZeff of the metal and thus indicating lig-and character in the valence orbitals of the bis(dithiolene)complexes.Fig. 32also includes the S K-edge spectrum ofthe (Et4N)2[Ni(S-2Ph-C6H4)4] tetrahedral Ni2+ (vide supraFig. 16) tetrathiolate. The ground state of this complex isa triplet and the pre-edge feature at 2470.5 eV can be at-tributed to a doubly degenerate S 1s→ �∗(t2) transition,which quantifies to be 33% in S 3p character for each of thet2 holes[132]. In contrast to the bis(dithiolene) complexes(vide infra), the Ni tetrathiolates are characterized by a nor-mal bonding description (Scheme 1A) with predominantlymetal-based LUMOs. The shift in the rising edge positions(0.7 eV) of the Ni(II) tetrathiolate and bis(dithiolene) com-plexes inFig. 32 correlates well with the difference in theedge jump positions of the thiolate and the enedithiolatesodium salts. Thus, the 0.7 eV shift in the pre-edge energyfeature implies no change in the energy of the d-manifold,which is in contrast to what is generally observed in goingfrom a tetrahedral to a square-planar coordination geom-
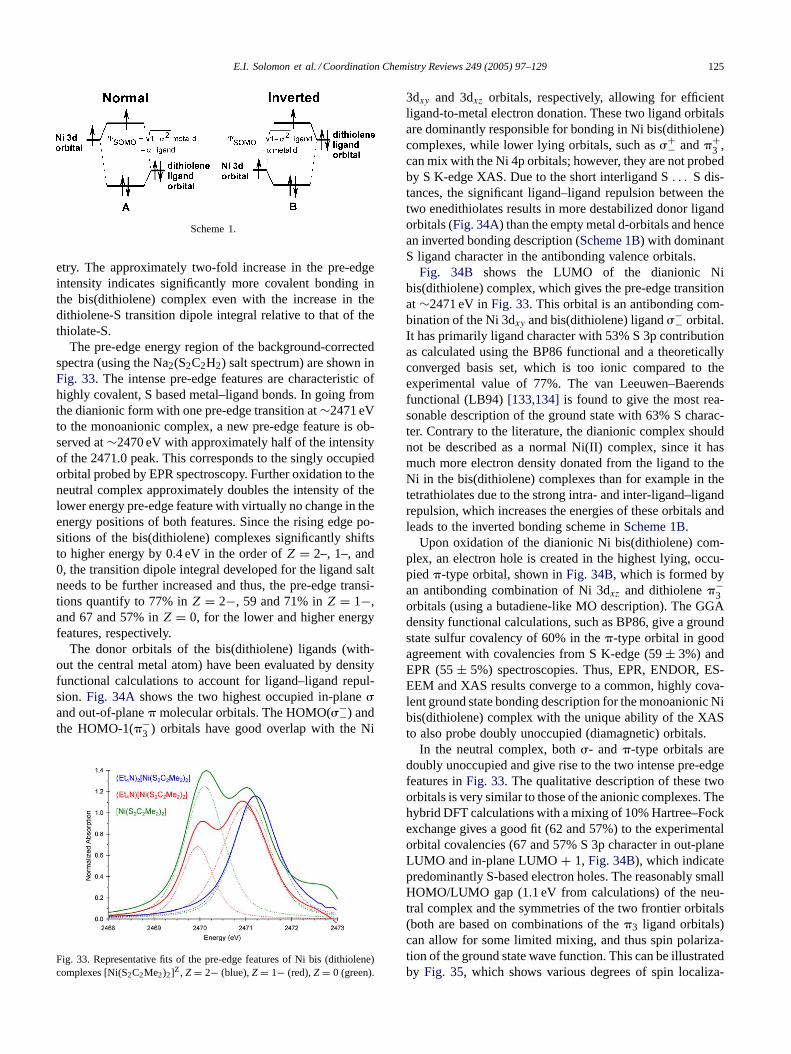
E.I. Solomon et al. / Coordination Chemistry Reviews 249 (2005) 97–129 125
Scheme 1.
etry. The approximately two-fold increase in the pre-edgeintensity indicates significantly more covalent bonding inthe bis(dithiolene) complex even with the increase in thedithiolene-S transition dipole integral relative to that of thethiolate-S.
The pre-edge energy region of the background-correctedspectra (using the Na2(S2C2H2) salt spectrum) are shown inFig. 33. The intense pre-edge features are characteristic ofhighly covalent, S based metal–ligand bonds. In going fromthe dianionic form with one pre-edge transition at∼2471 eVto the monoanionic complex, a new pre-edge feature is ob-served at∼2470 eV with approximately half of the intensityof the 2471.0 peak. This corresponds to the singly occupiedorbital probed by EPR spectroscopy. Further oxidation to theneutral complex approximately doubles the intensity of thelower energy pre-edge feature with virtually no change in theenergy positions of both features. Since the rising edge po-sitions of the bis(dithiolene) complexes significantly shiftsto higher energy by 0.4 eV in the order ofZ = 2–, 1–, and0, the transition dipole integral developed for the ligand saltneeds to be further increased and thus, the pre-edge transi-tions quantify to 77% inZ = 2−, 59 and 71% inZ = 1−,and 67 and 57% inZ = 0, for the lower and higher energyfeatures, respectively.
The donor orbitals of the bis(dithiolene) ligands (with-out the central metal atom) have been evaluated by densityfunctional calculations to account for ligand–ligand repul-sion. Fig. 34A shows the two highest occupied in-plane�and out-of-plane� molecular orbitals. The HOMO(�−
−) andthe HOMO-1(�−
3 ) orbitals have good overlap with the Ni
Fig. 33. Representative fits of the pre-edge features of Ni bis (dithiolene)complexes [Ni(S2C2Me2)2]Z, Z = 2− (blue),Z = 1− (red),Z = 0 (green).
3dxy and 3dxz orbitals, respectively, allowing for efficientligand-to-metal electron donation. These two ligand orbitalsare dominantly responsible for bonding in Ni bis(dithiolene)complexes, while lower lying orbitals, such as�+
− and�+3 ,
can mix with the Ni 4p orbitals; however, they are not probedby S K-edge XAS. Due to the short interligand S. . . S dis-tances, the significant ligand–ligand repulsion between thetwo enedithiolates results in more destabilized donor ligandorbitals (Fig. 34A) than the empty metal d-orbitals and hencean inverted bonding description (Scheme 1B) with dominantS ligand character in the antibonding valence orbitals.
Fig. 34B shows the LUMO of the dianionic Nibis(dithiolene) complex, which gives the pre-edge transitionat ∼2471 eV inFig. 33. This orbital is an antibonding com-bination of the Ni 3dxy and bis(dithiolene) ligand�−
− orbital.It has primarily ligand character with 53% S 3p contributionas calculated using the BP86 functional and a theoreticallyconverged basis set, which is too ionic compared to theexperimental value of 77%. The van Leeuwen–Baerendsfunctional (LB94)[133,134]is found to give the most rea-sonable description of the ground state with 63% S charac-ter. Contrary to the literature, the dianionic complex shouldnot be described as a normal Ni(II) complex, since it hasmuch more electron density donated from the ligand to theNi in the bis(dithiolene) complexes than for example in thetetrathiolates due to the strong intra- and inter-ligand–ligandrepulsion, which increases the energies of these orbitals andleads to the inverted bonding scheme inScheme 1B.
Upon oxidation of the dianionic Ni bis(dithiolene) com-plex, an electron hole is created in the highest lying, occu-pied�-type orbital, shown inFig. 34B, which is formed byan antibonding combination of Ni 3dxz and dithiolene�−
3orbitals (using a butadiene-like MO description). The GGAdensity functional calculations, such as BP86, give a groundstate sulfur covalency of 60% in the�-type orbital in goodagreement with covalencies from S K-edge (59± 3%) andEPR (55± 5%) spectroscopies. Thus, EPR, ENDOR, ES-EEM and XAS results converge to a common, highly cova-lent ground state bonding description for the monoanionic Nibis(dithiolene) complex with the unique ability of the XASto also probe doubly unoccupied (diamagnetic) orbitals.
In the neutral complex, both�- and �-type orbitals aredoubly unoccupied and give rise to the two intense pre-edgefeatures inFig. 33. The qualitative description of these twoorbitals is very similar to those of the anionic complexes. Thehybrid DFT calculations with a mixing of 10% Hartree–Fockexchange gives a good fit (62 and 57%) to the experimentalorbital covalencies (67 and 57% S 3p character in out-planeLUMO and in-plane LUMO+ 1, Fig. 34B), which indicatepredominantly S-based electron holes. The reasonably smallHOMO/LUMO gap (1.1 eV from calculations) of the neu-tral complex and the symmetries of the two frontier orbitals(both are based on combinations of the�3 ligand orbitals)can allow for some limited mixing, and thus spin polariza-tion of the ground state wave function. This can be illustratedby Fig. 35, which shows various degrees of spin localiza-

126 E.I. Solomon et al. / Coordination Chemistry Reviews 249 (2005) 97–129
Fig. 34. Orbital energy levels for the frontier orbitals of the bis(dithiolene) ligand system (A) and for the Ni bis(dithiolene) complexes (B).
tions (0.2 and 0.9 spin on each ligands with opposite signin Fig. 35A and B, respectively) depending on the amountof Hartree–Fock exchange in the hybrid density functionalcalculation. In agreement with others[135], these spectro-scopically calibrated DFT calculations show only limitedspin localization (at most 0.4 electron on each ligand) inthe neutral complex reflecting the highly covalent, delo-calized ground state description experimentally determinedfrom ligand K-edge XAS.
6.3. Reactivity of the [Ni(S2C2Me2)2] complex with olefins
Wang and Stiefel recently[124] and Schrauzer and May-weg earlier[136] have shown the non-classical reactivity ofthe neutral Ni bis(dithiolene) complexes, which can now beexplained by the inverted ground state bonding (Scheme 1B).The neutral complex reacts with olefins in electrophilic ad-dition to form an adduct, where the C atoms of the olefinare bound to the S atoms of the bis(dithiolene) complex, in-stead of forming a classical�-complex with the central Niatom. Due to the large electron donation from the ligandto the metal, the S atoms become more electrophilic thanthe Ni, favoring the reaction of the S atoms with olefins.The ligand-based acceptor LUMOs, which are probed by SK-edge XAS, are set up for the interaction with the donorolefin HOMO (Scheme 2).
In Scheme 2, two different olefin coordinations areshown to give interligand (Scheme 2A) and intraligand(Scheme 2B) olefin adducts. In the former case, the LUMO
Fig. 35. Spin density contour plots of the spin polarized wave functionfor [Ni(S2C2Me2)2] at (A) B(22HF)P86/BS5 and (B) B(50HF)P86/BS5levels of theory.
of the bis(dithiolene) complex does not give a net bondinginteraction with the HOMO of the olefin. A recent DFTstudy[137] has shown that this orbital forbiddeness can beovercome by an out-of-plane distortion of the bis(dithiolene)complex into a flattenedD2d structure, where the olefinHOMO can overlap with the opposite sides of the S cen-tered lobes of the bis(dithiolene) LUMO. This additiongives atransproduct, which can isomerize to thecis interli-gand adduct. TheD2d distortion and olefin coordination hasbeen calculated as the rate-limiting step with 113 kJ mol−1
activation barrier, which is approximately 20 kJ mol−1
higher than the experimental value. Alternatively, for theintra-ligand interaction inScheme 2B, the LUMO of theneutral Ni bis(dithiolene) complex can interact with theHOMO of the olefin to give a net bonding interactionleading to an intraligand adduct with a lower activation bar-rier, since the bis(dithiolene) complex does not need to besignificantly distorted. Spectroscopically calibrated hybriddensity functional studies indicate that rate-limiting activa-tion barriers of inter- and intraligand olefin coordinationsare comparable with a slight preference of 12 kJ mol−1 forthe latter in agreement with the FMO analysis above. Inaddition, the singlet/triplet gap for the bis(dithiolene) com-plex (about 45 kJ mol−1) is comparable to the activationbarrier of the olefin coordination to the singlet complex andthe singly unoccupied orbitals can also provide bondinginteractions with the olefin HOMO, which could allow foradditional reaction pathways on the triplet potential energysurface.
Scheme 2.
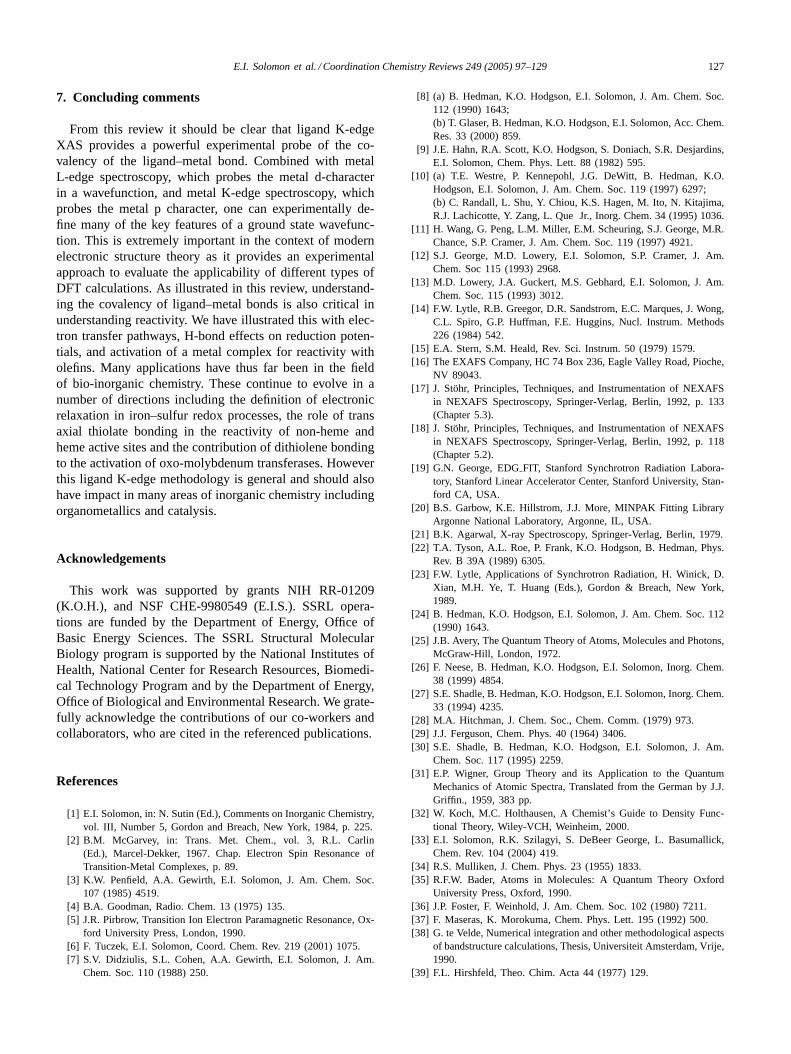
E.I. Solomon et al. / Coordination Chemistry Reviews 249 (2005) 97–129 127
7. Concluding comments
From this review it should be clear that ligand K-edgeXAS provides a powerful experimental probe of the co-valency of the ligand–metal bond. Combined with metalL-edge spectroscopy, which probes the metal d-characterin a wavefunction, and metal K-edge spectroscopy, whichprobes the metal p character, one can experimentally de-fine many of the key features of a ground state wavefunc-tion. This is extremely important in the context of modernelectronic structure theory as it provides an experimentalapproach to evaluate the applicability of different types ofDFT calculations. As illustrated in this review, understand-ing the covalency of ligand–metal bonds is also critical inunderstanding reactivity. We have illustrated this with elec-tron transfer pathways, H-bond effects on reduction poten-tials, and activation of a metal complex for reactivity witholefins. Many applications have thus far been in the fieldof bio-inorganic chemistry. These continue to evolve in anumber of directions including the definition of electronicrelaxation in iron–sulfur redox processes, the role of transaxial thiolate bonding in the reactivity of non-heme andheme active sites and the contribution of dithiolene bondingto the activation of oxo-molybdenum transferases. Howeverthis ligand K-edge methodology is general and should alsohave impact in many areas of inorganic chemistry includingorganometallics and catalysis.
Acknowledgements
This work was supported by grants NIH RR-01209(K.O.H.), and NSF CHE-9980549 (E.I.S.). SSRL opera-tions are funded by the Department of Energy, Office ofBasic Energy Sciences. The SSRL Structural MolecularBiology program is supported by the National Institutes ofHealth, National Center for Research Resources, Biomedi-cal Technology Program and by the Department of Energy,Office of Biological and Environmental Research. We grate-fully acknowledge the contributions of our co-workers andcollaborators, who are cited in the referenced publications.
References
[1] E.I. Solomon, in: N. Sutin (Ed.), Comments on Inorganic Chemistry,vol. III, Number 5, Gordon and Breach, New York, 1984, p. 225.
[2] B.M. McGarvey, in: Trans. Met. Chem., vol. 3, R.L. Carlin(Ed.), Marcel-Dekker, 1967. Chap. Electron Spin Resonance ofTransition-Metal Complexes, p. 89.
[3] K.W. Penfield, A.A. Gewirth, E.I. Solomon, J. Am. Chem. Soc.107 (1985) 4519.
[4] B.A. Goodman, Radio. Chem. 13 (1975) 135.[5] J.R. Pirbrow, Transition Ion Electron Paramagnetic Resonance, Ox-
ford University Press, London, 1990.[6] F. Tuczek, E.I. Solomon, Coord. Chem. Rev. 219 (2001) 1075.[7] S.V. Didziulis, S.L. Cohen, A.A. Gewirth, E.I. Solomon, J. Am.
Chem. Soc. 110 (1988) 250.
[8] (a) B. Hedman, K.O. Hodgson, E.I. Solomon, J. Am. Chem. Soc.112 (1990) 1643;(b) T. Glaser, B. Hedman, K.O. Hodgson, E.I. Solomon, Acc. Chem.Res. 33 (2000) 859.
[9] J.E. Hahn, R.A. Scott, K.O. Hodgson, S. Doniach, S.R. Desjardins,E.I. Solomon, Chem. Phys. Lett. 88 (1982) 595.
[10] (a) T.E. Westre, P. Kennepohl, J.G. DeWitt, B. Hedman, K.O.Hodgson, E.I. Solomon, J. Am. Chem. Soc. 119 (1997) 6297;(b) C. Randall, L. Shu, Y. Chiou, K.S. Hagen, M. Ito, N. Kitajima,R.J. Lachicotte, Y. Zang, L. Que Jr., Inorg. Chem. 34 (1995) 1036.
[11] H. Wang, G. Peng, L.M. Miller, E.M. Scheuring, S.J. George, M.R.Chance, S.P. Cramer, J. Am. Chem. Soc. 119 (1997) 4921.
[12] S.J. George, M.D. Lowery, E.I. Solomon, S.P. Cramer, J. Am.Chem. Soc 115 (1993) 2968.
[13] M.D. Lowery, J.A. Guckert, M.S. Gebhard, E.I. Solomon, J. Am.Chem. Soc. 115 (1993) 3012.
[14] F.W. Lytle, R.B. Greegor, D.R. Sandstrom, E.C. Marques, J. Wong,C.L. Spiro, G.P. Huffman, F.E. Huggins, Nucl. Instrum. Methods226 (1984) 542.
[15] E.A. Stern, S.M. Heald, Rev. Sci. Instrum. 50 (1979) 1579.[16] The EXAFS Company, HC 74 Box 236, Eagle Valley Road, Pioche,
NV 89043.[17] J. Stöhr, Principles, Techniques, and Instrumentation of NEXAFS
in NEXAFS Spectroscopy, Springer-Verlag, Berlin, 1992, p. 133(Chapter 5.3).
[18] J. Stöhr, Principles, Techniques, and Instrumentation of NEXAFSin NEXAFS Spectroscopy, Springer-Verlag, Berlin, 1992, p. 118(Chapter 5.2).
[19] G.N. George, EDGFIT, Stanford Synchrotron Radiation Labora-tory, Stanford Linear Accelerator Center, Stanford University, Stan-ford CA, USA.
[20] B.S. Garbow, K.E. Hillstrom, J.J. More, MINPAK Fitting LibraryArgonne National Laboratory, Argonne, IL, USA.
[21] B.K. Agarwal, X-ray Spectroscopy, Springer-Verlag, Berlin, 1979.[22] T.A. Tyson, A.L. Roe, P. Frank, K.O. Hodgson, B. Hedman, Phys.
Rev. B 39A (1989) 6305.[23] F.W. Lytle, Applications of Synchrotron Radiation, H. Winick, D.
Xian, M.H. Ye, T. Huang (Eds.), Gordon & Breach, New York,1989.
[24] B. Hedman, K.O. Hodgson, E.I. Solomon, J. Am. Chem. Soc. 112(1990) 1643.
[25] J.B. Avery, The Quantum Theory of Atoms, Molecules and Photons,McGraw-Hill, London, 1972.
[26] F. Neese, B. Hedman, K.O. Hodgson, E.I. Solomon, Inorg. Chem.38 (1999) 4854.
[27] S.E. Shadle, B. Hedman, K.O. Hodgson, E.I. Solomon, Inorg. Chem.33 (1994) 4235.
[28] M.A. Hitchman, J. Chem. Soc., Chem. Comm. (1979) 973.[29] J.J. Ferguson, Chem. Phys. 40 (1964) 3406.[30] S.E. Shadle, B. Hedman, K.O. Hodgson, E.I. Solomon, J. Am.
Chem. Soc. 117 (1995) 2259.[31] E.P. Wigner, Group Theory and its Application to the Quantum
Mechanics of Atomic Spectra, Translated from the German by J.J.Griffin., 1959, 383 pp.
[32] W. Koch, M.C. Holthausen, A Chemist’s Guide to Density Func-tional Theory, Wiley-VCH, Weinheim, 2000.
[33] E.I. Solomon, R.K. Szilagyi, S. DeBeer George, L. Basumallick,Chem. Rev. 104 (2004) 419.
[34] R.S. Mulliken, J. Chem. Phys. 23 (1955) 1833.[35] R.F.W. Bader, Atoms in Molecules: A Quantum Theory Oxford
University Press, Oxford, 1990.[36] J.P. Foster, F. Weinhold, J. Am. Chem. Soc. 102 (1980) 7211.[37] F. Maseras, K. Morokuma, Chem. Phys. Lett. 195 (1992) 500.[38] G. te Velde, Numerical integration and other methodological aspects
of bandstructure calculations, Thesis, Universiteit Amsterdam, Vrije,1990.
[39] F.L. Hirshfeld, Theo. Chim. Acta 44 (1977) 129.

128 E.I. Solomon et al. / Coordination Chemistry Reviews 249 (2005) 97–129
[40] R.H. Holm, P. Kennepohl, E.I. Solomon, Chem. Rev. 96 (1996)2239.
[41] J.M. Guss, H.C. Freeman, J. Mol. Biol. 169 (1983) 521.[42] E.T. Adman, J.W. Godden, S. Turley, J. Biol. Chem. 270 (1995)
27458.[43] P.J. Hart, A.M. Nesissian, R.G. Herrmann, R.M. Nalbandyan, J.S.
Valentine, D. Eisenberg, Prot. Sci. 5 (1996) 2175.[44] V. Ducros, A.M. Brzozowski, K.S. Wilson, S.H. Brown, P. Oster-
gaard, P. Schneider, D.S. Yaver, A.H. Pedersen, G.J. Davies, Nat.Struct. Biol. 5 (1998) 310.
[45] E.I. Solomon, K.W. Penfield, A.A. Gewirth, M.D. Lowery, S.E.Shadle, J.A. Guckert, L.B. LaCroix, Inorg. Chim. Acta 243 (1996)67.
[46] K.W. Penfield, R.R. Gay, R.S. Himmelwright, N.C. Eickman, H.C.Freeman, E.I. Solomon, J. Am. Chem. Soc. 103 (1981) 4382.
[47] H. Beinert, Eur. J. Biochem. 245 (1997) 521.[48] T. Haltia, K. Brown, M. Tegoni, C. Cambillau, M. Saraste, K.
Mattila, K. Djinovic-Carugo, Biochem. J. 369 (2003) 77.[49] S. Ferguson-Miller, G.T. Babcock, Heme/Copper Terminal Oxidases
96 (1996) 2889.[50] B.E. Ramirez, B.G. Malmström, J.R. Winkler, H.B. Gray, Proc.
Natl. Acad. Sci. USA 92 (1995) 11949.[51] H. Robinson, M.C. Ang, Y.-G. Gao, M.T. Hay, Y. Lu, A.H.-J. Wang,
Biochemistry 38 (1999) 5676.[52] R.P. Houser, V.G. Young Jr., W.B. Tolman, J. Am. Chem. Soc.
118 (1996) 2101.[53] S.E. Shadle, J.E. Penner-Hahn, H.J. Schugar, B. Hedman, K.O.
Hodgson, E.I. Solomon, J. Am. Chem. Soc. 115 (1993) 767.[54] J.L. Hughley, T.G. Fawcett, S.M. Rudich, R.A. Lalancette, J.A.
Potenza, H.J. Schugar, J. Am. Chem. Soc. 101 (1979) 2617.[55] A.A. Gewirth, S.L. Cohen, H.J. Schugar, E.I. Solomon, Inorg. Chem.
261 (1987) 1133.[56] R.K. Szilagyi, M. Metz, E.I. Solomon, J. Chem. Phys. A 106 (2002)
2994.[57] A.E. Reed, L.A. Curtiss, F. Weinhold, Chem. Rev. 88 (1988) 899.[58] J.E. Carpenter, F.J. Weinhold, Mol. Struct. (THEOCHEM) 169
(1988) 41.[59] A.D. Becke, Phys. Rev. A Gen. Phys. 38 (1988) 3098.[60] A.D. Becke, J. Chem. Phys. 98 (1993) 5648.[61] C. Lee, W. Yang, R.G. Parr, Phys. Rev. B Condens. Matter 37
(1988) 785.[62] K. Brown, M. Tegoni, M. Prudencio, A.S. Pereira, S. Besson, J.J.
Moura, I. Moura, C. Cambillau, Nat. Struct. Biol. 7 (2000) 191.[63] S. DeBeer George, L. Basumallick, R.K. Szilagyi, D.W. Randall,
M.G. Hill, A.M. Nersissian, J.S. Valentine, B. Hedman, K.O. Hodg-son and E.I. Solomon, J. Am. Chem. Soc. 125 (2003) 11314.
[64] S. DeBeer George, M. Metz, R.K. Szilagyi, H. Wang, S.P. Cramer,Y. Lu, W.B. Tolman, B. Hedman, K.O. Hodgson, E.I. Solomon, J.Am. Chem. Soc. 123 (2001) 5757.
[65] D.R. Gamelin, D.W. Randall, M.T. Hay, R.P. Houser, T.C. Mulder,G.W. Canters, S. de Vries, W.B. Tolman, Y. Lu, E.I. Solomon, J.Am. Chem. Soc. 120 (1998) 5246.
[66] R.K. Szilagyi, E.I. Solomon, Curr. Opin. Chem. Biol. 6 (2002) 250.[67] M.D. Newton, Chem. Rev. 91 (1991) 767.[68] J.M. Guss, E.A. Merritt, R.P. Phizackerley, H.C. Freeman, J. Mol.
Biol. 259 (1996) 686.[69] P. Siders, R.A. Marcus, J. Am. Chem. Soc. 103 (1981) 741.[70] R.A. Marcus, N. Sutin, Biochim. Biophys. Acta 811 (1985) 265.[71] K. Rose Williams, B. Hedman, K.O. Hodgson, E.I. Solomon, Inorg.
Chim. Acta 263 (1997) 315.[72] K. Rose Williams, S.E. Shadle, M.K. Eidsness, D.M. Kurtz Jr.,
R.A. Scott, B. Hedman, K.O. Hodgson, E.I. Solomon, J. Am. Chem.Soc. 120 (1998) 10743.
[73] M.S. Gebhard, J.C. Deaton, S.A. Koch, M. Millar, E.I. Solomon,J. Am. Chem. Soc. 112 (1990) 2217.
[74] Crystal structures obtained from Cambridge CrystallographicDatabase Ver. 1.5.;
F.H. Allen, O. Kennard, Chemical Design Automation News 8(1993) 1 and 31.
[75] I. Bertini, A. Sigel, H. Sigel (Eds.), Handbook of Metalloproteins,Marcel Dekker, New York, 2001.
[76] W.R. Dunham, A.J. Bearden, I.T. Salmeen, G. Palmer, R.H. Sands,W.H. Orme-Johnson, H. Beinert, Biochim. Biophys. Acta 253(1971) 134.
[77] P.J. Hay, J.C. Thibeault, R.J. Hoffman, J. Am. Chem. Soc. 97 (1975)4884.
[78] L. Peterson, R. Cammack, K.K. Rao, Biochim. Biophys. Acta 622(1980) 18.
[79] P. Bertrand, J.-P. Gadaya, Biochim. Biophys. Acta 680 (1982) 331.[80] L. Noodleman, E.J. Baereands, J. Am. Chem. Soc. 106 (1984) 2316.[81] G. Blondin, J.-J. Girerd, Chem. Rev. 90 (1990) 1359.[82] M.K. Johnson, Curr. Opin. Chem. Biol. 2 (1998) 173.[83] B.R. Crouse, J. Meyer, M.K. Johnson, J. Am. Chem. Soc. 117
(1995) 9612.[84] J. Fujinaga, J. Gaillard, J. Meyer, Biochem. Biophys. Res. Commun.
194 (1993) 104.[85] K. Rose, S.E. Shadle, T. Glaser, S. de Vries, A. Cherepanov, G.W.
Canters, B. Hedman, K.O. Hodgson, E.I. Solomon, J. Am. Chem.Soc. 121 (1999) 2353.
[86] K.D. Butcher, M.S. Gebhard, E.I. Solomon, Inorg. Chem. 29 (1990)2067.
[87] J. Li, M.R. Nelson, C.Y. Peng, D. Bashford, L. Noodleman, J. Phys.Chem. A 102 (1998) 6311.
[88] E. Anxolabéhère-Mallart, T. Glaser, P. Frank, A. Aliverti, G. Zanetti,B. Hedman, K.O. Hodgson, E.I. Solomon, J. Am. Chem. Soc. 123(2001) 5444.
[89] P.K. Mascharak, G.C. Papaefthymiou, R.B. Frankel, R.H. Holm, J.Am. Chem. Soc. 103 (1981) 6110.
[90] J.J. Mayerle, S.E. Denmark, B.V. DePamphilis, J.A. Ibers, R.H.Holm, J. Am. Chem. Soc. 97 (1975) 1032.
[91] K.S. Hagen, A.D. Watson, R.H. Holm, J. Am. Chem. Soc. 105(1983) 3905.
[92] H.A. Heering, Y.B.M. Bulsink, W.R. Hagen, T.E. Meyer, Biochem-istry 34 (1995) 14675.
[93] T. Glaser, K. Rose, S.E. Shadle, B. Hedman, K.O. Hodgson, E.I.Solomon, J. Am. Chem. Soc. 123 (2001) 442.
[94] A. Dey, B. Hedman, K.O. Hodgson, E.I. Solomon, J. Am. Chem.Soc. (accepted for publication).
[95] K.S. Hagen, A.D. Watson, R.H. Holm, J. Am. Chem. Soc. 105(1983) 3905.
[96] B.A. Averill, T. Herskovitz, R.H. Holm, J.A. Ibers, J. Am. Chem.Soc. 95 (1973) 3523.
[97] M.K. Johnson, R.E. Duderstadt, E.C. Duin, Adv. Inorg. Chem. 47(1999) 1.
[98] H. Beinert, A.J. Thomson, Arch. Biochem. Biophys. 333 (1983)222.
[99] V. Papaefthymiou, J.-J. Girerd, I. Moura, J.J.G. Moura, E. Münck,J. Am. Chem. Soc. 109 (1987) 4703.
[100] S.A. Borshch, E.L. Bominaar, G. Blondin, J.-J. Girerd, J. Am.Chem. Soc. 115 (1993) 5155.
[101] L. Noodleman, D.A. Case, A. Aizmanf, J. Am. Chem. Soc. 110(1988) 1001.
[102] J. Zhou, Z. Hu, E. Münck, R.H. Holm, J. Am. Chem. Soc. 118(1996) 1966.
[103] A. Dey, B. Hedman, K.O. Hodgson, E.I. Solomon, unpublishedresults.
[104] T.G. Spiro (Ed.), Iron Sulfur Proteins, Wiley, New York, 1982.[105] D.W. Low, M.G. Hill, J. Am. Chem. Soc. 122 (2000) 11039.[106] E. Babini, M. Borsari, F. Capozzi, L.D. Eltis, C. Luchinat, J. Biol.
Inorg. Chem. 4 (1999) 692.[107] N. Ueyama, Y. Yamada, T. Okamura, S. Kimura, A. Nakamura,
Inorg. Chem. 35 (1996) 6473.[108] E. Denke, T. Merbitz-Zahradnik, O.M. Hatzfeld, C.H. Snyder, T.A.
Link, B.L. Trumpower, J. Biol. Chem. 273 (1998) 9085.
E.I. Solomon et al. / Coordination Chemistry Reviews 249 (2005) 97–129 129
[109] K. Bose, J. Huang, B.S. Haggerty, A.L. Rheingold, R.J. Salm, M.A.Walters, Inorg. Chem. 36 (1997) 4596.
[110] J. Li, M.R. Nelson, C.Y. Peng, D. Bashford, L. Noodleman, J. Phys.Chem. A 102 (1998) 6311.
[111] G.M. Jensen, A. Warshel, P.J. Stephens, Biochemistry 33 (1996)10911.
[112] E. Parisini, F. Capozzi, P. Lubini, V. Lamzin, C. Luchinat, G.M.Sheldrick, Acta Crystallogr. D55 (1999) 1773.
[113] Z. Dauter, K.S. Wilson, L.C. Sieker, J. Meyer, J.-M. Moulis, Bio-chemistry 36 (1997) 16065.
[114] T. Glaser, I. Bertini, J.J.G. Moura, B. Hedman, K.O. Hodgson, E.I.Solomon, J. Am. Chem. Soc. 123 (2001) 4859.
[115] B.J. Goodfellow, A.L.M. Rodrigues, I. Moura, V. Wray, J.J.G.Moura, J. Biol. Inorg. Chem. 4 (1999) 421.
[116] E.L. Bominaar, Z.G. Hu, E. Münck, J.-J. Girerd, S.A. Borshch, J.Am. Chem. Soc. 117 (1995) 6976.
[117] C. Zener, Phys. Rev. 82 (1951) 403.[118] A. Kramer, Physica 1 (1934) 191.[119] J.-J. Girerd, J. Chem. Phys. 79 (1983) 1766.[120] D.R. Gamelin, E.L. Bominaar, C. Mathonière, M.L. Kirk, K.
Wieghardt, J.-J. Girerd, E.I. Solomon, Inorg. Chem. 35 (1996)4323.
[121] D.R. Gamelin, E.L. Bominaar, M.L. Kirk, K. Wieghardt, E.I.Solomon, J. Am. Chem. Soc. 118 (1996) 8085.
[122] R.S. Czernuszewicz, K.A. Macor, M.K. Johnson, A. Gewirth, T.G.Spiro, J. Am. Chem. Soc. 109 (1987) 7178.
[123] R. Hille, Chem. Rev. 96 (1996) 2757.[124] K. Wang, E.I. Stiefel, Science 291 (2001) 106.[125] B.S. Lim, V. Fomitchev, R.H. Holm, Inorg. Chem. 40 (2001) 4357.
[126] A.H. Maki, N. Edelstein, A. Davison, R.H. Holm, J. Am. Chem.Soc. 86 (1964) 4580.
[127] R.D. Schmitt, A.H. Maki, J. Am. Chem. Soc. 90 (1968) 2288.[128] J.E. Huyett, S.B. Choudhury, D.M. Eichhorn, P.A. Bryngelson, M.J.
Maroney, B.M. Hoffman, Inorg. Chem. 37 (1998) 1361.[129] R.H. Holm, M.J. O’Connor, Prog. Inorg. Chem. 14 (1971) 241.[130] E.I. Stiefel, J.H. Waters, E. Billig, H.B. Gray, J. Am. Chem. Soc.
87 (1965) 3016.[131] A.L. Balch, R.H. Holm, J. Am. Chem. Soc. 88 (1966) 5201.[132] R.K. Szilagyi, B.S. Lim, T. Glaser, R.H. Holm, B. Hedman, K.O.
Hodgson, E.I. Solomon, J. Am. Chem. Soc. 125 (2003) 9158.[133] R. van Leeuwen, E.J. Baerends, Phys. Rev. A 49 (1994) 2421.[134] M. Grüning, O.V. Gritsenko, S.J.A. van Gisbergen, E.J. Baerends,
J. Chem. Phys. 114 (2001) 652.[135] V. Bachler, G. Olbrich, F. Neese, K. Wieghardt, Inorg. Chem. 41
(2002) 4179.[136] G.N. Schrauzer, V.P. Mayweg, J. Am. Chem. Soc. 87 (1965) 1483.[137] Y. Fan, M.B. Hall, J. Am. Chem. Soc. 124 (2002) 12076.[138] I. Bertini, S. Ciurli, A. Dikiy, R. Gasanov, C. Luchinat, G. Martini,
N.J. Safarov, J. Am. Chem. Soc. 121 (1999) 2037.[139] M.M. Werst, C.E. Davoust, B. Hoffman, J. Am. Chem. Soc. 113
(1991) 1533.[140] F. Neese, R. Kappl, W.G. Zumft, J. Hüttermann, P.M.H. Kroneck,
J. Biol. Inorg. Chem. 3 (1998) 53.[141] R.J. Gurbiel, Y.C. Fann, K.K. Surerus, M.M. Werst, S.M. Musser,
P.E. Doan, S.I. Chan, J.A. Fee, B.M. Hoffman, J. Am. Chem. Soc.115 (1993) 10888.
[142] R.P. Houser, J.A. Halfen, V.G. Young, N.J. Blackburn, W.B. Tolman,J. Am. Chem. Soc. 117 (1995) 10745.
Related Documents