1 Lift Measurement from Pressure Wall Distribution Aashish Lamba, Abhishek Khandelwal, Abhishek Singh, Adarsh Chandra Thakur, Aditya Duhan, Akhil Srivas Indian Institute of Space Science and Technology, Thiruvananthapuram. The experiment was done in blower type wind tunnel in aerodynamics lab in IIST to determine the lift over an airfoil by measuring the pressure distribution on the top and bottom wall of the test section. Variation of Lift and C l with Re (keeping A O A constant) and A O A (keeping Re constant) were studied. It was found that the C l decrease with Reynolds number at a given A O A whereas lift and C l increase with angle of attack at a given Re. Nomenclature RPM = revolutions per minute R e = R eynolds’s number v = free stream velocity of the fluid C l = Lift Coefficient Cp = Coefficient of Pressure AoA = Angle of Attack I. Introduction n airfoil is part of body or surface, such as a wing, propeller blade, or rudder, whose shape and orientation control stability, direction, lift and drag. The geometry of the airfoil is described with a variety of terms. As a wing moves through air, the air is split and passes above and below the wing. The wing’s upper surface is shaped so the air rushing over the top speeds up and stretches out. This decreases the air pressure above the wing. The air flowing below the wing moves in a straighter line, so its speed and air pressure remains the same. Since high air pressure always moves toward low air pressure, the air below the wing pushes upward toward the air above the win g. The wing is in the middle, and the whole wing is “lifted.” The faster an airplane moves, the more lift there is. And when the force of lift is greater than the force of gravity, the airplane is able to fly. An airfoil-shaped body moved through a fluid produces an aerodynamic force. It seems complex but the forces generated are due to mainly two sources which are pressure and shear stress distribution over the body surface. The contribution due to shear is small as compared to pressure forces. As a wing moves through air, the air is split and passes above and below the wing. The wing’s upper surface is shaped so the air rushing over the top speeds up and stretches out. This decreases the air pressure above the wing. The air flowing below the wing moves in much straighter line, so its speed and air pressure remains the same. Thus the pressure difference between upper and lower surface is developed. When this pressure distribution is integrated over the surface of the airfoil we get resultant forces in two direction one parallel to the flow called Drag and other perpendicular to the flow called Lift. The resultant force can be slip in axial which is along the chord and normal which is perpendicular to chord. A Figure 1. Forces on the ai rfoil

Welcome message from author
This document is posted to help you gain knowledge. Please leave a comment to let me know what you think about it! Share it to your friends and learn new things together.
Transcript
8/10/2019 Lift From Pressure Distribution
http://slidepdf.com/reader/full/lift-from-pressure-distribution 1/7
1
Lift Measurement from Pressure Wall Distribution
Aashish Lamba, Abhishek Khandelwal, Abhishek Singh, Adarsh Chandra Thakur, Aditya Duhan, Akhil Srivas
Indian Institute of Space Science and Technology, Thiruvananthapuram.
The experiment was done in blower type wind tunnel in aerodynamics lab in IIST to
determine the lift over an airfoil by measuring the pressure distribution on the top and
bottom wall of the test section. Variation of Lift and Cl with Re (keeping AOA constant) and
AOA (keeping Re constant) were studied. It was found that the C l decrease with Reynolds
number at a given AOA whereas lift and Cl increase with angle of attack at a given Re.
Nomenclature
RPM = revolutions per minute
Re = R eynolds’s number
v = free stream velocity of the fluidCl = Lift Coefficient
Cp = Coefficient of Pressure
AoA = Angle of Attack
I.
Introduction n airfoil is part of body or surface, such as a wing, propeller blade, or rudder, whose shape and orientation
control stability, direction, lift and drag. The geometry of the airfoil is described with a variety of terms.
As a wing moves through air, the air is split and passes above and below the wing. The wing’s upper surface is
shaped so the air rushing over the top speeds up and stretches out. This decreases the air pressure above the wing.
The air flowing below the wing moves in a straighter line, so its speed and air pressure remains the same.
Since high air pressure always moves toward low air pressure, the air below the wing pushes upward
toward the air above the wing. The wing is in the middle, and the whole wing is “lifted.” The faster an airplane
moves, the more lift there is. And when the force of lift is greater than the force of gravity, the airplane is able to fly.
An airfoil-shaped body moved through a fluid produces an
aerodynamic force. It seems complex but the forces generated are due to
mainly two sources which are pressure and shear stress distribution over
the body surface. The contribution due to shear is small as compared to
pressure forces. As a wing moves through air, the air is split and passes
above and below the wing. The wing’s upper surface is shaped so the air
rushing over the top speeds up and stretches out. This decreases the air
pressure above the wing. The air flowing below the wing moves in much
straighter line, so its speed and air pressure remains the same. Thus the
pressure difference between upper and lower surface is developed. When
this pressure distribution is integrated over the surface of the airfoil we get
resultant forces in two direction one parallel to the flow called Drag and
other perpendicular to the flow called Lift. The resultant force can be slip
in axial which is along the chord and normal which is perpendicular to
chord.
A
Figure 1. Forces on the airfoil

8/10/2019 Lift From Pressure Distribution
http://slidepdf.com/reader/full/lift-from-pressure-distribution 2/7
2
II.
Theory
The pressures on the top and bottom walls are denoted
by Pu(x) and Pl(x) respectively. The walls are assumed to be
close enough to the model so that the pressure on the wall is not
necessarily P∞. Also assume that the surfaces ai and bh are far
enough upstream and downstream such that P=P∞, and that thechange in orientation of the airfoil, i.e. changing the angle of
attack does not change the pressure distribution on the ai and bh.
Now using the Reynolds Transport Theorem on the control
volume shown by control surface ‘abcdefghi’ we can show that:
Where,
L’ = Lift on the airfoilPl(x) = pressure distribution on the lower wall with respect to x
Pu(x) = pressure distribution on the upper wall with respect to x
III.
Experimental Setup
A blower type wind tunnel on a modular flow apparatus is used to conduct the
experiment which is having control setup and maximum speed of 1200rpm.The end
of the wind tunnel was placed with the test section consisting of a symmetric airfoil
with possible angle adjustments.
Measurement at various points of the test section is done using a multi tubemanometer which is connected to pressure sensor nodes, the nodes are further
connected to top and bottom surfaces of the test section.
IV. Procedure
The whole experimental setup is based on the theory of force equilibrium of a control volume that is the force
due to pressure difference between the upper and lower pressures in the test section has to be equal to the lift on the
airfoil present in the test section. In the above control volume equilibrium, assumption is the test section is
sufficiently larger than the airfoil.
The airfoil is placed in the test section and at the horizontal that is at 0° angle of attack. The wind tunnel is
maintained at 500rpm.Intially angle of attack is 0° and noted the value of pressure of all the nodes at upper and
lower surface. Again repeat with 3° ,6°,9° ,12°,13° and 15°.Then repeat this experiment with rpm varying from 600
to 1000.
Figure 3. Multitube manometer
Figure 2. Control volume taken
8/10/2019 Lift From Pressure Distribution
http://slidepdf.com/reader/full/lift-from-pressure-distribution 3/7
3
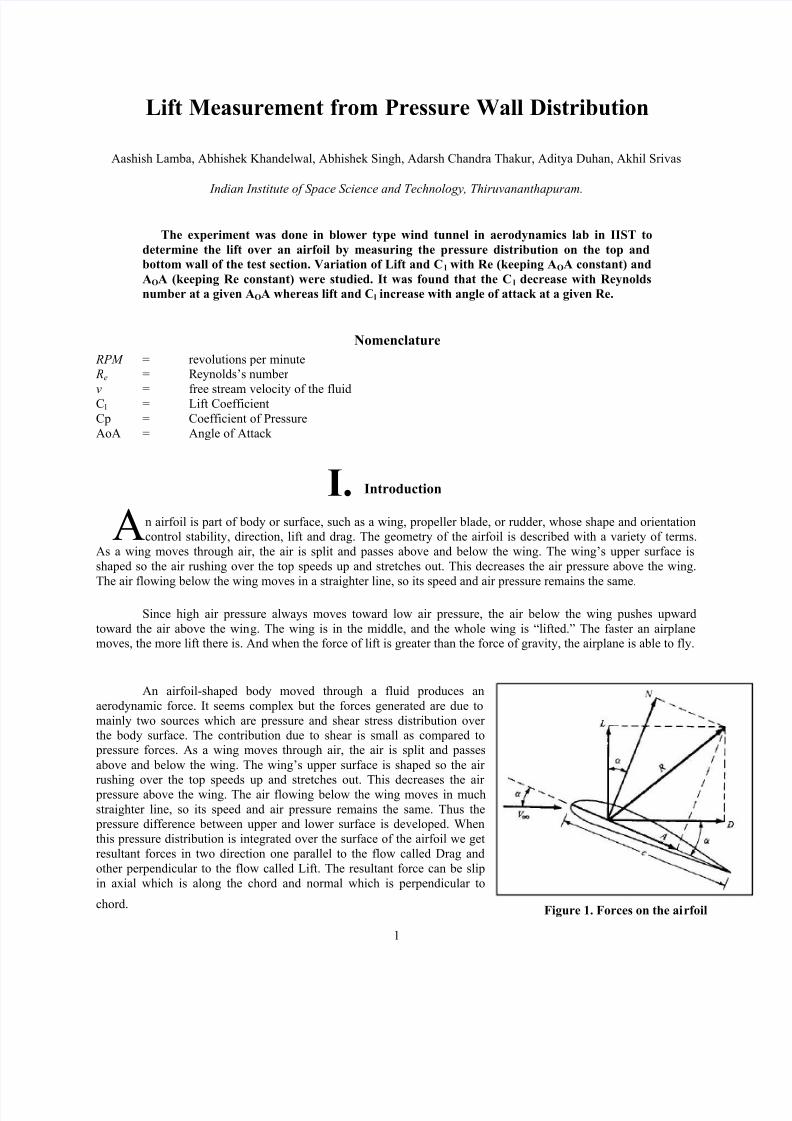
V.
Results
From the observed values of manometer readings lift was calculated using the methodology given in the Theory
section. The Cl values were plotted against the angle of attack of the airfoil in Figure 4. Also the theoretical as well
as the Cl values obtained using XFoil simulation are also plotted in the same graph (Figure 4).
In Figure 5, Cl values for varying Reynold’s number of the flow are plotted, along with XFoil simulation results.
Figure 4. Variation of Cl with respect to angle of attack
Figure 5. Variation of Cl with free stream velocity
-0.5
0
0.5
1
1.5
2
0 2 4 6 8 10 12 14 16
C l
Angle of attack (in degrees)
Experimental Theoritical Xfoil Results Linear (Experimental )
0.2
0.3
0.4
0.5
0.6
0.7
0.8
9 10 11 12 13 14 15 16 17 18
C l
Reynolds number per length ( x 105 m-1 )
Experimental Results
Xfoil Resuts
8/10/2019 Lift From Pressure Distribution
http://slidepdf.com/reader/full/lift-from-pressure-distribution 4/7
4
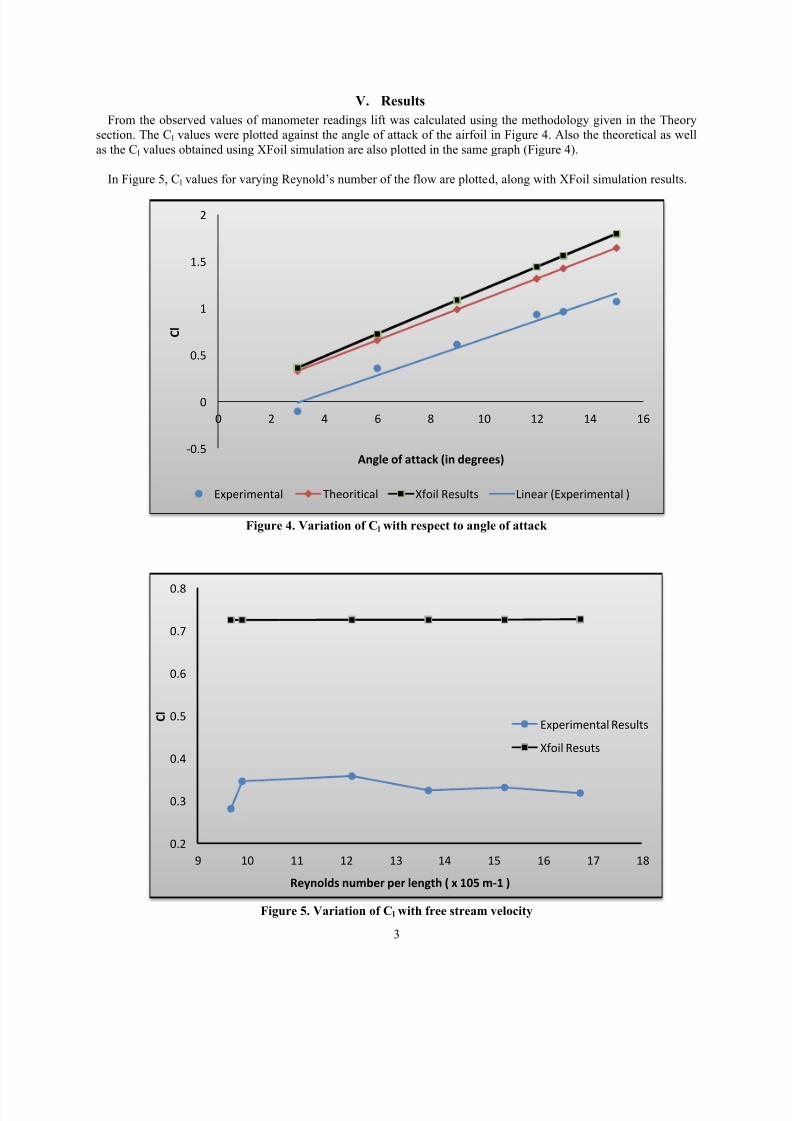
From the manometer readings, the free stream velocities as well as the local velocities are calculated. Cp
values are thereby calculated and the variation of it along the test section is plotted in Figure 6.
The XFoil results for Cp variation along the airfoil for angle of attack of 9 degrees and 0.04 Mach number
are plotted in Figure 7.
Figure 6. Variation of Cp along the test section
(for Reynold’s number 1212874 and AoA of 9 degrees)
Figure 7. Variation of Cp along the airfoil NACA 0012 from XFoil
(for Reynold’s number 1212874 and AoA of 9 degrees)
-0.9
-0.8
-0.7
-0.6
-0.5
-0.4
-0.3
-0.2
-0.1
00 50 100 150 200 250 300
C p
Distance from the start of test section (mm)
Top Surface Bottom Surface
8/10/2019 Lift From Pressure Distribution
http://slidepdf.com/reader/full/lift-from-pressure-distribution 5/7
5
VI.
Conclusion
From the Figure 4 between coefficient of lift and angle of attack we observe that the coefficient of lift
varies almost linearly with angle of attack. The theoretical as well as the XFoil plots in the same graph shows that
slope of graph obtained from the experiment is in good agreement with the theoretical value. From Figure 5 between
coefficient of lift and Reynold’s number of the free stream flow, a decrement of coefficient of lift is observed as
increase in Reynold’s number.
In Figure 6 of C p variation along the test section for varying angle of attack, upper surface shows lower
value of C p and lower surface gives larger values, which is responsible for the lift obtained. As mentioned in the
theory, when the control volume is taken, the magnitude of force acting on the control volume by the airfoil will be
equal to the force on the control volume due to the pressure distribution. Hence the lift acting on the airfoil is equal
to the force due to pressure distribution.
Appendix
Observations
Table 1. Observed values of manometer readings (in cms) for constant motor rpm = 700AoA h1 h2 h3 h4 h5 h6 h7 h8 h9 h10 h11 h12 h13 h14 h15
3 9.3 9.4 9.4 9.5 9.5 9.5 9.6 9.6 9.6 9.7 9.6 9.7 9.7 9.3 9.4
6 9.4 9.5 9.5 9.7 9.7 9.8 9.9 9.8 9.9 9.9 9.8 9.7 9.8 9.3 9.4
9 9.4 9.5 9.5 9.8 9.8 9.9 10 10 10 10 9.8 9.8 9.8 9.2 9.3
12 9.3 9.5 9.6 9.9 9.9 10.1 10.2 10.1 10.1 10.1 9.9 9.8 9.8 9.2 9.3
13 9.3 9.5 9.6 9.9 9.9 10.1 10.2 10.2 10.2 10.1 9.9 9.8 9.8 9.1 9.2
15 9.2 9.4 9.5 9.8 9.9 10.1 10.2 10.2 10.2 10.2 10 9.9 9.8 9 9.1
Table 2. Observed values of manometer readings (in cms) for constant motor rpm = 700
AoA h16 h17 h18 h19 h20 h21 h22 h23 h24 h25 h26 h27 h28 h29 h30
3 9.5 9.6 9.7 9.8 9.8 9.7 9.8 9.7 9.7 9.6 9.6 9.3 6 9.5 9.6
6 9.4 9.4 9.5 9.5 9.5 9.5 9.6 9.6 9.6 9.6 9.6 9.3 6 9.4 9.4
9 9.3 9.3 9.4 9.4 9.4 9.4 9.5 9.5 9.5 9.6 9.6 9.2 6 9.3 9.3
12 9.2 9.2 9.2 9.2 9.2 9.2 9.3 9.4 9.5 9.5 9.6 9.1 6 9.2 9.2
13 9.2 9.1 9.2 9.2 9.2 9.2 9.3 9.4 9.5 9.5 9.6 9.1 5.9 9.2 9.1
15 9.1 9 9.1 9.1 9.2 9.2 9.3 9.4 9.5 9.5 9.6 9 5.9 9.1 9
Table 3. Observed values of manometer readings (in cms) for constant angle of attack = 60
RPM h1 h2 h3 h4 h5 h6 h7 h8 h9 h10 h11 h12 h13 h14 h15
500 9.4 9.5 9.4 9.5 9.5 9.6 9.7 9.7 9.7 9.7 9.6 9.6 9.6 9.3 9.4
600 9.4 9.5 9.4 9.6 9.6 9.7 9.7 9.7 9.7 9.7 9.6 9.6 9.7 9.3 9.4
700 9.4 9.5 9.5 9.7 9.7 9.8 9.9 9.8 9.9 9.9 9.8 9.7 9.8 9.3 9.4
800 9.3 9.5 9.5 9.8 9.7 9.9 10 9.9 10 10 9.9 9.8 9.8 9.2 9.4
900 9.3 9.5 9.5 9.9 9.8 10 10.1 10 10.1 10.1 10 9.9 9.9 9.2 9.3
1000 9.2 9.5 9.5 10 9.9 10.1 10.2 10.1 10.2 10.2 10.1 10 10 9.1 9.3
8/10/2019 Lift From Pressure Distribution
http://slidepdf.com/reader/full/lift-from-pressure-distribution 6/7
6
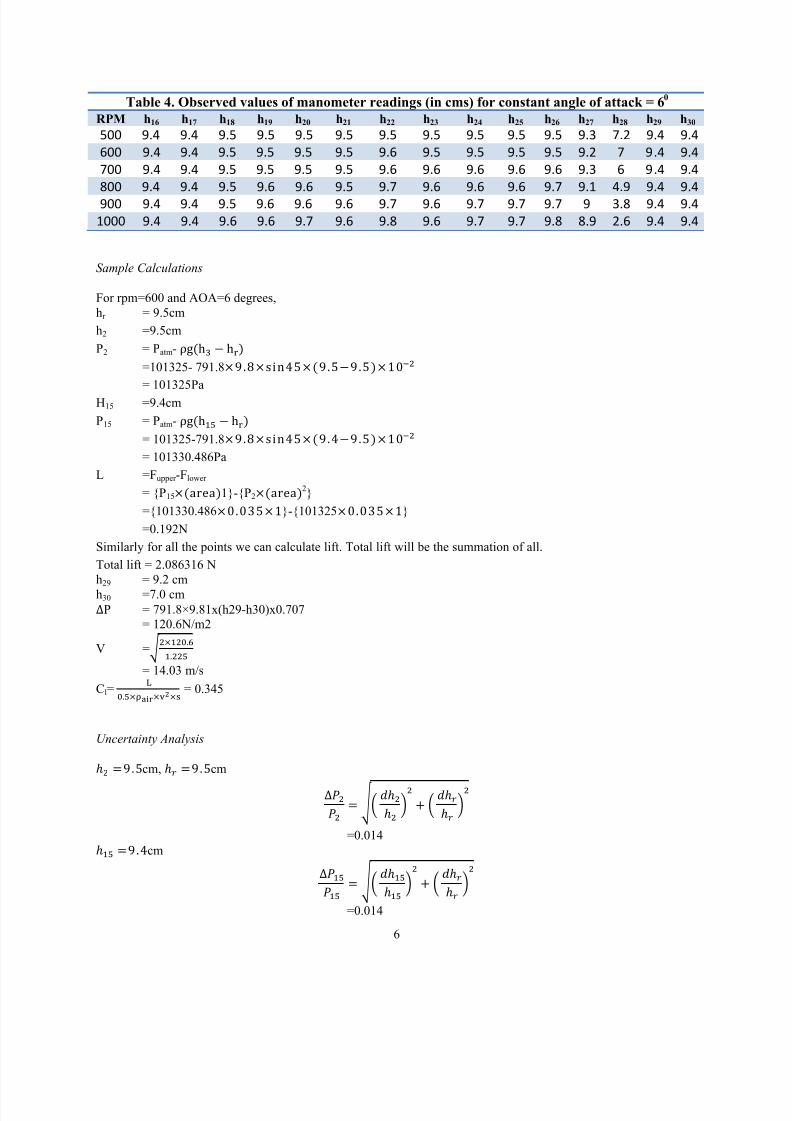
Table 4. Observed values of manometer readings (in cms) for constant angle of attack = 60
RPM h16 h17 h18 h19 h20 h21 h22 h23 h24 h25 h26 h27 h28 h29 h30
500 9.4 9.4 9.5 9.5 9.5 9.5 9.5 9.5 9.5 9.5 9.5 9.3 7.2 9.4 9.4
600 9.4 9.4 9.5 9.5 9.5 9.5 9.6 9.5 9.5 9.5 9.5 9.2 7 9.4 9.4
700 9.4 9.4 9.5 9.5 9.5 9.5 9.6 9.6 9.6 9.6 9.6 9.3 6 9.4 9.4
800 9.4 9.4 9.5 9.6 9.6 9.5 9.7 9.6 9.6 9.6 9.7 9.1 4.9 9.4 9.4
900 9.4 9.4 9.5 9.6 9.6 9.6 9.7 9.6 9.7 9.7 9.7 9 3.8 9.4 9.4
1000 9.4 9.4 9.6 9.6 9.7 9.6 9.8 9.6 9.7 9.7 9.8 8.9 2.6 9.4 9.4
Sample Calculations
For rpm=600 and AOA=6 degrees,
hr = 9.5cm
h2 =9.5cm
P2 = Patm-
=101325- 791.8
= 101325Pa
H15 =9.4cm
P15 = Patm-
= 101325-791.8
= 101330.486Pa
L =Fupper -Flower
= {P151}-{P22}
={101330.486}-{101325}
=0.192N
Similarly for all the points we can calculate lift. Total lift will be the summation of all.
Total lift = 2.086316 N
h29 = 9.2 cm
h30 =7.0 cmP = 791.8×9.81x(h29-h30)x0.707
= 120.6N/m2
V =
= 14.03 m/s
Cl= = 0.345
Uncertainty Analysis
cm,
cm
=0.014 cm
=0.014

8/10/2019 Lift From Pressure Distribution
http://slidepdf.com/reader/full/lift-from-pressure-distribution 7/7
7
=0.02 cm
cm
=0.017
=0.0085
=0.0265
Acknowledgments
We are highly indebted to Dr. Vinoth B.R (Assistant professor, Aerospace Engineering, Indian Institute of Space
Science and Technology) for his guidance and constant supervision as well as for providing necessary information
regarding the project & also for their support in completing the project. We would like to express our gratitude
towards the lab assistant and Mr. Rithwik for his kind co-operation and encouragement which help me in completion
of this project.
References
Books[1] Fundamentals of Aerodynamics, Fifth edition by John D Anderson Jr.
[2] Fundamentals of Gas Dynamics, by R. Zucker and O. Biblarz
Private Communications and Web Sites[1] http://www.grc.nasa.gov/WWW/k-12/airplane/tunpart.html
[2] https://en.wikipedia.org/Wind_tunnel
Related Documents


