1549 Journals of Gerontology: MEDICAL SCIENCES Cite journal as: J Gerontol A Biol Sci Med Sci. 2013 December;68(12):1549–1558 doi:10.1093/gerona/glt064 Advance Access publication May 28, 2013 © The Author 2013. Published by Oxford University Press on behalf of The Gerontological Society of America. All rights reserved. For permissions, please e-mail: [email protected]. Lifestyle Interventions and Independence for Elders Study: Recruitment and Baseline Characteristics Anthony P. Marsh, 1 Laura C. Lovato, 2 Nancy W. Glynn, 3 Kimberly Kennedy, 4 Cynthia Castro, 5 Kathryn Domanchuk, 6 Erica McDavitt, 7 Ruben Rodate, 8 Michael Marsiske, 9 Joanne McGloin, 10 Erik J. Groessl, 11 Marco Pahor, 9 and Jack M. Guralnik; 12 for the LIFE Study Research Group 1 Department of Health and Exercise Science, Wake Forest University, Winston-Salem, North Carolina. 2 Division of Public Health Sciences, Department of Biostatistical Sciences, Wake Forest School of Medicine, Winston-Salem, North Carolina. 3 Department of Epidemiology and Medicine, University of Pittsburgh Graduate School of Public Health, Pittsburgh, Pennsylvania. 4 Section on Gerontology and Geriatric Medicine, Department of Medicine, Sticht Center on Aging, Wake Forest University School of Medicine, Winston-Salem, North Carolina. 5 Stanford Prevention Research Center, Department of Medicine, Stanford University School of Medicine, California. 6 Department of Medicine, Feinberg School of Medicine, Northwestern University, Chicago, Illinois. 7 Nutrition, Exercise, Physiology, and Sarcopenia Laboratory, Jean Mayer USDA Human Nutrition Research Center on Aging at Tufts University, Boston, Massachusetts. 8 Pennington Biomedical Research Center, Louisiana State University System, Baton Rouge. 9 Department of Aging and Geriatric Research, Institute on Aging, College of Medicine, University of Florida, Gainesville. 10 Department of Medicine, Yale School of Medicine, New Haven, Connecticut. 11 Department of Family and Preventive Medicine, University of California at San Diego. 12 Department of Epidemiology and Public Health, Division of Gerontology, University of Maryland School of Medicine, Baltimore. Clinicaltrials.gov identifier: NCT01072500 Address correspondence to Anthony P. Marsh, PhD, Department of Health and Exercise Science, Wake Forest University, Winston-Salem, NC 27109-7868. Email: [email protected] Background. Recruitment of older adults into long-term clinical trials involving behavioral interventions is a sig- nificant challenge. The Lifestyle Interventions and Independence for Elders (LIFE) Study is a Phase 3 multicenter rand- omized controlled multisite trial, designed to compare the effects of a moderate-intensity physical activity program with a successful aging health education program on the incidence of major mobility disability (the inability to walk 400 m) in sedentary adults aged 70–89 years, who were at high risk for mobility disability (scoring ≤9 on the Short Physical Performance Battery) at baseline. Methods. Recruitment methods, yields, efficiency, and costs are described together with a summary of participant baseline characteristics. Yields were examined across levels of sex, race and ethnicity, and Short Physical Performance Battery, as well as by site. Results. The 21-month recruiting period resulted in 14,812 telephone screens; 1,635 participants were randomized (67.2% women, 21.0% minorities, 44.7% with Short Physical Performance Battery scores ≤7). Of the telephone-screened participants, 37.6% were excluded primarily because of regular participation in physical activity, health exclusions, or self-reported mobility disability. Direct mailing was the most productive recruitment strategy (59.5% of randomized participants). Recruitment costs were $840 per randomized participant. Yields differed by sex and Short Physical Performance Battery. We accrued 11% more participant follow-up time than expected during the recruitment period as a result of the accelerated recruitment rate. Conclusions. The LIFE Study achieved all recruitment benchmarks. Bulk mailing is an efficient method for recruit- ing high-risk community-dwelling older persons (including minorities), from diverse geographic areas for this long-term behavioral trial. Key Words: Mobile disability—Older adults—Physical activity—Minority recruitment—Randomized controlled trial. Received March 21, 2013; Accepted March 26, 2013 Decision Editor: Dr. James Goodwin T HE growth in the population aged 65 years and older has focused attention on the importance of prevention of age-associated physical function decline and disabilities (1,2). Older adults who lose the ability to move without assistance are less likely to remain in the community; have higher rates of morbidity, mortality, health care utilization, at Wake Forest Univ School of Medicine on November 9, 2013 http://biomedgerontology.oxfordjournals.org/ Downloaded from

Welcome message from author
This document is posted to help you gain knowledge. Please leave a comment to let me know what you think about it! Share it to your friends and learn new things together.
Transcript

1549
Journals of Gerontology: MEDICAL SCIENCESCite journal as: J Gerontol A Biol Sci Med Sci. 2013 December;68(12):1549–1558doi:10.1093/gerona/glt064 Advance Access publication May 28, 2013
© The Author 2013. Published by Oxford University Press on behalf of The Gerontological Society of America. All rights reserved. For permissions, please e-mail: [email protected].
Lifestyle Interventions and Independence for Elders Study: Recruitment and Baseline Characteristics
Anthony P. Marsh,1 Laura C. Lovato,2 Nancy W. Glynn,3 Kimberly Kennedy,4 Cynthia Castro,5 Kathryn Domanchuk,6 Erica McDavitt,7 Ruben Rodate,8 Michael Marsiske,9 Joanne McGloin,10
Erik J. Groessl,11 Marco Pahor,9 and Jack M. Guralnik;12 for the LIFE Study Research Group
1Department of Health and Exercise Science, Wake Forest University, Winston-Salem, North Carolina.2Division of Public Health Sciences, Department of Biostatistical Sciences, Wake Forest School of Medicine,
Winston-Salem, North Carolina.3Department of Epidemiology and Medicine, University of Pittsburgh Graduate School of Public Health, Pittsburgh, Pennsylvania.
4Section on Gerontology and Geriatric Medicine, Department of Medicine, Sticht Center on Aging, Wake Forest University School of Medicine, Winston-Salem, North Carolina.
5Stanford Prevention Research Center, Department of Medicine, Stanford University School of Medicine, California.6Department of Medicine, Feinberg School of Medicine, Northwestern University, Chicago, Illinois.
7Nutrition, Exercise, Physiology, and Sarcopenia Laboratory, Jean Mayer USDA Human Nutrition Research Center on Aging at Tufts University, Boston, Massachusetts.
8Pennington Biomedical Research Center, Louisiana State University System, Baton Rouge.9Department of Aging and Geriatric Research, Institute on Aging, College of Medicine, University of Florida, Gainesville.
10Department of Medicine, Yale School of Medicine, New Haven, Connecticut.11Department of Family and Preventive Medicine, University of California at San Diego.
12Department of Epidemiology and Public Health, Division of Gerontology, University of Maryland School of Medicine, Baltimore.
Clinicaltrials.gov identifier: NCT01072500
Address correspondence to Anthony P. Marsh, PhD, Department of Health and Exercise Science, Wake Forest University, Winston-Salem, NC 27109-7868. Email: [email protected]
Background. Recruitment of older adults into long-term clinical trials involving behavioral interventions is a sig-nificant challenge. The Lifestyle Interventions and Independence for Elders (LIFE) Study is a Phase 3 multicenter rand-omized controlled multisite trial, designed to compare the effects of a moderate-intensity physical activity program with a successful aging health education program on the incidence of major mobility disability (the inability to walk 400 m) in sedentary adults aged 70–89 years, who were at high risk for mobility disability (scoring ≤9 on the Short Physical Performance Battery) at baseline.
Methods. Recruitment methods, yields, efficiency, and costs are described together with a summary of participant baseline characteristics. Yields were examined across levels of sex, race and ethnicity, and Short Physical Performance Battery, as well as by site.
Results. The 21-month recruiting period resulted in 14,812 telephone screens; 1,635 participants were randomized (67.2% women, 21.0% minorities, 44.7% with Short Physical Performance Battery scores ≤7). Of the telephone-screened participants, 37.6% were excluded primarily because of regular participation in physical activity, health exclusions, or self-reported mobility disability. Direct mailing was the most productive recruitment strategy (59.5% of randomized participants). Recruitment costs were $840 per randomized participant. Yields differed by sex and Short Physical Performance Battery. We accrued 11% more participant follow-up time than expected during the recruitment period as a result of the accelerated recruitment rate.
Conclusions. The LIFE Study achieved all recruitment benchmarks. Bulk mailing is an efficient method for recruit-ing high-risk community-dwelling older persons (including minorities), from diverse geographic areas for this long-term behavioral trial.
Key Words: Mobile disability—Older adults—Physical activity—Minority recruitment—Randomized controlled trial.
Received March 21, 2013; Accepted March 26, 2013
Decision Editor: Dr. James Goodwin
THE growth in the population aged 65 years and older has focused attention on the importance of prevention
of age-associated physical function decline and disabilities
(1,2). Older adults who lose the ability to move without assistance are less likely to remain in the community; have higher rates of morbidity, mortality, health care utilization,
at Wake Forest U
niv School of Medicine on N
ovember 9, 2013
http://biomedgerontology.oxfordjournals.org/
Dow
nloaded from
1550 MARSH ET AL.
and cost; and experience a poorer quality of life (3–5). To address this critical public health issue, the LIFE Study, a phase 3 multicenter randomized controlled trial, was designed to compare a long-term physical activity (PA) program with a successful aging (SA) health education program on the incidence of major mobility disability (the inability to walk 400 m) in sedentary older persons (6).
A significant challenge in the conduct of all clinical tri-als of older persons, particularly long-term trials involving behavioral interventions like PA, is the identification and recruitment of participants who reflect the sex, race, and functional capacities of the target population and who might stand the most to gain from interventions designed specifi-cally to enhance physical and cognitive function (7–14).
In this report, we describe the successes and lessons learned from the LIFE recruitment effort and report recruit-ment yields overall and by sex, race, and baseline lower extremity functional status. We also describe the baseline characteristics of the participants. These data will provide helpful information for investigators seeking to recruit older adults on the brink of losing their independence into clinical trials aimed at improving physical function with behavioral and/or pharmacological interventions.
Methods
Study DesignThe LIFE Study is being conducted at eight field
centers: University of Florida, Gainesville, Florida; Northwestern University, Chicago, Illinois; Pennington Biomedical Research Center, Baton Rouge, Louisiana; University of Pittsburgh, Pittsburgh, Pennsylvania; Stanford University, Stanford, California; Tufts University, Boston, Massachusetts; Wake Forest University, Winston-Salem, North Carolina; and Yale University, New Haven, Connecticut. The Administrative Coordinating Center (ACC) is at the University of Florida and the Data Management, Analysis and Quality Control Center is located at Wake Forest School of Medicine. The LIFE Study was approved by the Institutional Review Boards of all participating centers.
The rationale, design, and methods of the LIFE Study have been presented in detail (6). In terms of sample size and duration, the LIFE Study is the largest and longest randomized controlled trial of PA conducted to date as evi-denced by reviewing randomized controlled trials of PA in older adults with functional assessments as the primary out-comes (Supplementary Figure 1). Participants will be in the LIFE study from 1.9 to 3.7 years, depending on the time of randomization during the 21-month recruitment period. Sedentary older adults at high risk for mobility disability were randomized to either a PA intervention that encom-passed both structured exercise and PA focused on walk-ing, which also included strength, flexibility, and balance
training, or a successful aging (SA) health information and education program. The details of these interventions can be found in the study by Fielding and colleagues (6).The primary outcome of major mobility disability was evalu-ated every 6 months and at study closeout. Secondary and tertiary endpoints were evaluated every 6, 12, or 24 months during the trial.
Study Recruitment GoalsThe recruitment goals over the 21-month recruitment
phase of the LIFE Study were to randomize 1,600 sed-entary older adults (200/site), aged 70–89 years, without major mobility disability but at high risk for developing it (Short Physical Performance Battery [SPPB] score ≤9), with at least 45% of the sample having a SPPB score less than or equal to 7, and with minorities comprising more than or equal to 22.5% of the sample. In the LIFE Pilot (LIFE-P) study (8), 7.4 participants were screened for each person randomized. We used more stringent criteria for PA screening in LIFE, and therefore predicted that 20% more individuals would be excluded than in LIFE-P, leading to an anticipated need to screen 9.3 individuals for every ran-domized participant.
The Data Management, Analysis and Quality Control Center monitored recruitment activities and provided the study Recruitment Committee and each field center with a range of on-line real-time reports to track recruitment pro-gress on critical study benchmarks. Sites also generated local tracking reports to monitor site-specific features of recruitment. Reports included graphs and tables summariz-ing recruitment yields and progress toward the recruitment goal of 11–13 randomized participants per month for each site and the desired subgroup distributions according to SPPB score, sex, and race and ethnicity.
Eligibility CriteriaThe LIFE Study eligibility criteria were designed to iden-
tify older persons who are (a) sedentary, defined as less than 20 min/wk of regular PA in the past month and reporting less than or equal to 125 min/wk of moderate/vigorous PA based on 18 items from the Community Healthy Activities Model Program for Seniors (CHAMPS) physical activity questionnaire (15); (b) at high risk for mobility disability based on objectively assessed lower extremity functional limitations assessed by the SPPB (score ≤9) (3); (c) able to walk 400 m in less than or equal to 15 minute without sit-ting, leaning against the wall, the assistance of another per-son, or a walking aid other than a straight cane; and (d) are able to safely participate in the intervention (see Table 1 in ref. [6]). This represents a large segment of the older popu-lation in which successful prevention of mobility disability through a lifestyle intervention would have a major public health impact (16).
at Wake Forest U
niv School of Medicine on N
ovember 9, 2013
http://biomedgerontology.oxfordjournals.org/
Dow
nloaded from

LIFE STUDY RECRUITMENT AND BASELINE DATA 1551
Recruitment StrategiesAs in the LIFE-P Study (8,17,18), the Recruitment
Committee had representation from all sites, coordinated all recruiting activities, and developed materials for study-wide use, all facilitated by monthly conference calls. In consul-tation with the Recruitment Committee, field centers were encouraged to implement recruiting plans to best suit local needs. The recruitment strategies used in LIFE-P proved very successful, so the LIFE Study sites used updated ver-sions of the LIFE-P advertising materials, brochure, and press release, tailored to suit their local mailing and media market (see Supplementary Material for an example of a study letter and trifold bulk mail brochure). In addition, several sites (University of Florida, Wake Forest University, Pennington, Tufts, Northwestern University) made use of their existing participant research registries. To kick off the recruitment phase, the Administrative Coordinating Center issued a national press release (in conjunction with National Institute on Aging), and each site issued a site-specific press release describing the study and providing contact numbers for enrollment information. Centers employed a variety of recruitment strategies (Table 1).
Advertising materials targeted older adults with preexist-ing lower extremity functional limitations focused on the theme, “Do you have trouble getting in and out of the car; walking outside your home; climbing stairs?” We made sig-nificant efforts to recruit racial and/or ethnic minorities, and each site produced culturally appropriate recruitment mate-rials. Transportation and/or monetary incentives were used to offset the burden of travel to assessment visits.
Screening and RandomizationRespondents were screened by telephone or, rarely, face
to face. The screening instrument was scripted and designed to identify eligible participants efficiently by focusing on major criteria that could be self-reported (age, functional limitations, amount of PA, and medical history). Individuals who participated in LIFE-P were not eligible because of concerns about contamination and dropout if they were unsatisfied with their group allocation. Demographic infor-mation and the recruitment source were also collected. Participants provided verbal informed consent for the tel-ephone screening.
Those who remained eligible were invited to attend a prescreening visit where an overview of the study was pro-vided in a group or one-on-one format. Following a ques-tion and answer session, attendees were invited to review and sign a prescreening consent form for the SPPB and CHAMPS. This was implemented to avoid administration of the much longer full-study consent form only to deter-mine that a person was ineligible on SPPB, which we knew from LIFE-P would excluded a large number of individu-als (8). Those still eligible after administration of the SPPB and the CHAMPS-18 were invited to attend a first screening
Tabl
e 1.
LIF
E S
tudy
Rec
ruitm
ent S
ourc
e O
vera
ll an
d by
Site
Clin
ical
Site
Ran
dB
roch
ure
Eve
ntFl
yer
FU C
all
Let
ter
Ref
erra
l
Med
iaM
ultip
le S
ourc
es
Oth
erD
o N
ot
Kno
wR
efus
edM
issi
ngM
agaz
ine
New
spap
er
Ad
Rad
io
Ad
Tele
visi
on
Ad
Bro
chur
e an
d L
ette
r
Bro
chur
e an
d N
ews
Ad
Let
ter
and
New
s A
dO
ther
C
ombi
natio
ns
All
clin
ics,
all
tele
phon
e sc
reen
s14
,812
3,98
114
916
721
4,27
444
133
2,07
847
752
138
552
4817
81,
710
283
311
All
clin
ics,
ran
dom
izat
ions
1,63
551
213
227
397
593
240
4950
4110
831
175
170
1N
orth
wes
tern
Uni
vers
ity20
311
01
00
70
6432
00
00
084
30
1Pe
nnin
gton
Bio
med
ical
R
esea
rch
Cen
ter
208
262
10
362
080
023
11
07
281
00
Stan
ford
Uni
vers
ity20
052
71
050
50
309
025
23
76
30
0T
ufts
Uni
vers
ity20
213
10
63
1016
27
72
21
00
114
00
Uni
vers
ity o
f Fl
orid
a20
114
51
00
132
111
00
90
02
152
00
Uni
vers
ity o
f Pi
ttsbu
rgh
216
180
60
171
80
20
11
00
15
30
0W
ake
Fore
st U
nive
rsity
205
108
01
40
190
240
240
50
128
00
0Y
ale
Uni
vers
ity20
021
36
011
70
022
10
31
52
181
00
at Wake Forest U
niv School of Medicine on N
ovember 9, 2013
http://biomedgerontology.oxfordjournals.org/
Dow
nloaded from
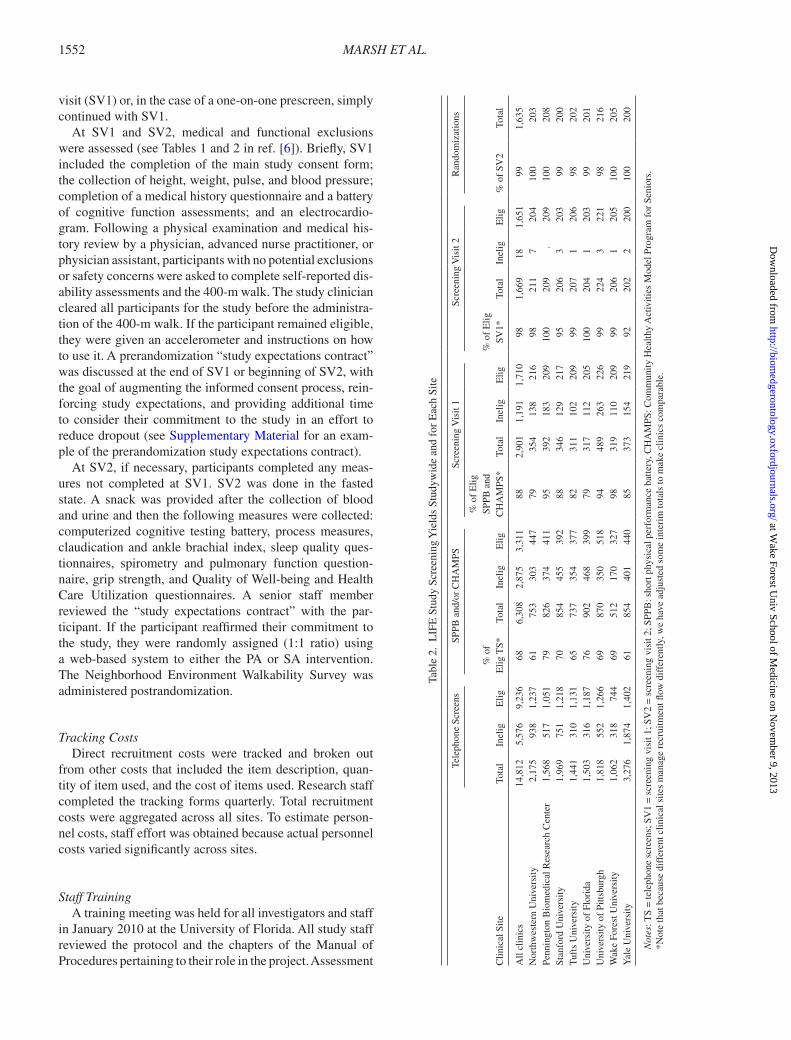
1552 MARSH ET AL.
visit (SV1) or, in the case of a one-on-one prescreen, simply continued with SV1.
At SV1 and SV2, medical and functional exclusions were assessed (see Tables 1 and 2 in ref. [6]). Briefly, SV1 included the completion of the main study consent form; the collection of height, weight, pulse, and blood pressure; completion of a medical history questionnaire and a battery of cognitive function assessments; and an electrocardio-gram. Following a physical examination and medical his-tory review by a physician, advanced nurse practitioner, or physician assistant, participants with no potential exclusions or safety concerns were asked to complete self-reported dis-ability assessments and the 400-m walk. The study clinician cleared all participants for the study before the administra-tion of the 400-m walk. If the participant remained eligible, they were given an accelerometer and instructions on how to use it. A prerandomization “study expectations contract” was discussed at the end of SV1 or beginning of SV2, with the goal of augmenting the informed consent process, rein-forcing study expectations, and providing additional time to consider their commitment to the study in an effort to reduce dropout (see Supplementary Material for an exam-ple of the prerandomization study expectations contract).
At SV2, if necessary, participants completed any meas-ures not completed at SV1. SV2 was done in the fasted state. A snack was provided after the collection of blood and urine and then the following measures were collected: computerized cognitive testing battery, process measures, claudication and ankle brachial index, sleep quality ques-tionnaires, spirometry and pulmonary function question-naire, grip strength, and Quality of Well-being and Health Care Utilization questionnaires. A senior staff member reviewed the “study expectations contract” with the par-ticipant. If the participant reaffirmed their commitment to the study, they were randomly assigned (1:1 ratio) using a web-based system to either the PA or SA intervention. The Neighborhood Environment Walkability Survey was administered postrandomization.
Tracking CostsDirect recruitment costs were tracked and broken out
from other costs that included the item description, quan-tity of item used, and the cost of items used. Research staff completed the tracking forms quarterly. Total recruitment costs were aggregated across all sites. To estimate person-nel costs, staff effort was obtained because actual personnel costs varied significantly across sites.
Staff TrainingA training meeting was held for all investigators and staff
in January 2010 at the University of Florida. All study staff reviewed the protocol and the chapters of the Manual of Procedures pertaining to their role in the project. Assessment
Tabl
e 2.
LIF
E S
tudy
Scr
eeni
ng Y
ield
s St
udyw
ide
and
for
Eac
h Si
te
Clin
ical
Site
Tele
phon
e Sc
reen
sSP
PB a
nd/o
r C
HA
MPS
Scre
enin
g V
isit
1Sc
reen
ing
Vis
it 2
Ran
dom
izat
ions
Tota
lIn
elig
Elig
% o
f E
lig T
S*To
tal
Inel
igE
lig
% o
f E
lig
SPPB
and
C
HA
MPS
*To
tal
Inel
igE
lig%
of
Elig
SV
1*To
tal
Inel
igE
lig%
of
SV2
Tota
l
All
clin
ics
14,8
125,
576
9,23
668
6,30
82,
875
3,31
188
2,90
11,
191
1,71
098
1,66
918
1,65
199
1,63
5N
orth
wes
tern
Uni
vers
ity2,
175
938
1,23
761
753
303
447
7935
413
821
698
211
720
410
020
3Pe
nnin
gton
Bio
med
ical
Res
earc
h C
ente
r1,
568
517
1,05
179
826
374
411
9539
218
320
910
020
9.
209
100
208
Stan
ford
Uni
vers
ity1,
969
751
1,21
870
854
455
392
8834
612
921
795
206
320
399
200
Tuf
ts U
nive
rsity
1,44
131
01,
131
6573
735
437
782
311
102
209
9920
71
206
9820
2U
nive
rsity
of
Flor
ida
1,50
331
61,
187
7690
246
839
979
317
112
205
100
204
120
399
201
Uni
vers
ity o
f Pi
ttsbu
rgh
1,81
855
21,
266
6987
035
051
894
489
263
226
9922
43
221
9821
6W
ake
Fore
st U
nive
rsity
1,06
231
874
469
512
170
327
9831
911
020
999
206
120
510
020
5Y
ale
Uni
vers
ity3,
276
1,87
41,
402
6185
440
144
085
373
154
219
9220
22
200
100
200
Not
es: T
S =
tele
phon
e sc
reen
s; S
V1
= s
cree
ning
vis
it 1;
SV
2 =
scr
eeni
ng v
isit
2; S
PPB
: sho
rt p
hysi
cal p
erfo
rman
ce b
atte
ry, C
HA
MPS
: Com
mun
ity H
ealth
y A
ctiv
ities
Mod
el P
rogr
am f
or S
enio
rs.
*Not
e th
at b
ecau
se d
iffe
rent
clin
ical
site
s m
anag
e re
crui
tmen
t flow
dif
fere
ntly
, we
have
adj
uste
d so
me
inte
rim
tota
ls to
mak
e cl
inic
s co
mpa
rabl
e.
at Wake Forest U
niv School of Medicine on N
ovember 9, 2013
http://biomedgerontology.oxfordjournals.org/
Dow
nloaded from

LIFE STUDY RECRUITMENT AND BASELINE DATA 1553
staff also reviewed web-based tutorials and/or CD training modules for several study outcomes. The lead assessors and interventionists received certification related to their role in the study. We used a “train-the-trainer” model to train and certify additional staff at each field center. Recertification is required annually (quarterly for the SPPB), prompted via emails from the Administrative Coordinating Center, in order to minimize assessment drift and enhance standardi-zation across all field centers. Webinars are conducted as needed for continuing education of assessment staff.
Statistical AnalysesDescriptive statistics were used to provide mean char-
acteristics of study participants and randomization rates among those completing a baseline visit. Chi square tests were used to compare randomization rates across recruit-ment sources, sex, race and ethnicity, level of baseline func-tion assessed by SPPB, and site where we compared sites based in the large metropolitan areas (Chicago, Boston, Pittsburgh) to the other sites. For the baseline characteris-tics, between-group differences were examined using inde-pendent-samples t tests for the continuous variables and chi square tests for the categorical variables.
The recruitment efficiency factor (R-factor), the ratio of the number of person-years actually accrued divided by the number of person-years expected during the planned recruitment period, was used to assess the efficiency of the recruitment process (19,20). The LIFE Study power estimates assume a constant rate of recruitment over the recruitment period that is consistent with most clinical trials. Calculating the area under the curve of the recruit-ment line identifies the proportion of expected person-years during recruitment (21). An R-factor of 1 indicates 100% efficiency.
ResultsIn total, 1,635 participants were randomized over the
21-month recruitment period, with the target of 1,600 reached in late November 2011 (Supplementary Figure 2a). The first randomization occurred on March 12, 2010, and the final randomization on December 27, 2011. Sites with participants in the recruitment pipeline completed screen-ing and testing visits and randomized these individuals; hence, the total number of participants randomized (N = 1,635) exceeded the target of 1,600.
The R-factor for the study was 1.11, indicating that we accrued 11% more person follow-up than planned during the recruitment period. The recruitment rates for partici-pants with SPPB less than or equal to 7 (Supplementary Figure 2b) and racial minority (Supplementary Figure 2c) also tracked on or above the recruitment goals. The recruit-ment of Hispanic participants lagged initially but acceler-ated when a second intervention location was opened in San
Jose by the Stanford site in Summer 2010 (Supplementary Figure 2d). There were site variations in recruiting particu-lar cells, and sites dynamically changed recruitment empha-sis to stay on track with study goals. The consistency of the flow of randomized participants into the trial during the recruitment phase both studywide and at each field center was remarkable (Supplementary Figures 2a and 3).
The recruitment flow from telephone screening to rand-omization is depicted in Figure 1. In total, 14,812 telephone screening interviews were completed, and 1,635 partici-pants (11.0%) were ultimately randomized to PA (n = 818) or SA (n = 817). We screened 9.06 individuals for every randomized participant. A common reason for declining further screening was the realization by the participant of the commitment required for participation in the study. The SPPB excluded a much higher percentage of participants compared with the CHAMPS because it was typically com-pleted first at the prescreening visit. The 75 participants who successfully completed all screening steps but were not ran-domized were not willing to sign the expectations contract or were unwilling to accept randomization to either group.
Recruitment Strategy, Yield, and CostsThe number of screened and randomized participants
according to recruitment strategy were comparable across sites (Table 1). Directly mailing a study brochure or per-sonalized letter to households with age-eligible residents (obtained from commercial databases and voter registration lists) was the most commonly employed strategy, leading to 59.4% of study contacts and 59.5% of randomizations. Newspaper advertisements were the next most commonly employed strategy, accounting for 14.0% of contacts and 14.7% of randomizations. Although the field centers employed similar strategies, the emphasis across sites dif-fered. For example, Pittsburgh and Yale focused on per-sonalized letters, whereas Tufts, University of Florida, and Wake Forest University expended more resources on the study brochure and Northwestern University focused on newspaper and radio advertisements.
A higher percentage of initial telephone screens was generated from both newspaper advertisements and direct mail among non-whites compared with whites (16.0% vs 12.5% and 62.3% vs 56.7%, respectively; p < .0001 for both). A lower percentage of initial telephone screens was generated from promotional events (0.58% vs 2.75%; p < .0001) among non-whites vs whites. Interestingly, a higher percentage of initial telephone screens was gener-ated from newspaper advertisements for persons with SPPB less than or equal to 7 compared with those with SPPB of 8–9 (16.4% vs 13.6%; p = .0043). A lower percentage of initial telephone screens was generated from direct mail for persons with SPPB less than or equal to 7 vs SPPB of 8–9 (59.9% vs 64.7%; p < .0001). There was no difference in percentage of contacts generated from promotional events
at Wake Forest U
niv School of Medicine on N
ovember 9, 2013
http://biomedgerontology.oxfordjournals.org/
Dow
nloaded from

1554 MARSH ET AL.
when comparing respondents with lower vs higher levels of lower extremity function.
Recruitment yield (randomizations/telephone screens) averaged 11.0%, and ranged from 6.1% at Yale University to 19.3% at Wake Forest University. The screening yields across visits (Table 2) and percentage of participants rand-omized for the key subgroups of sex and baseline function
(Table 3) showed remarkable consistency across the field centers. The yields for race and ethnicity closely reflected the site-specific goals. Of the 8,853 women initiating a tel-ephone screen, 12.4% were randomized, compared with 9.2% of 5,838 male telephone screenees (p < .0001), who tended to be more active and less functionally compro-mised. There was no difference in yield between white and
Telephone Screens Completed
(N=14812; 100%)
Telephone Screen Eligible
(N=9236; 62.4%)
CHAMPS and/or Short Physical
Performance Battery Complete
(N=6308; 42.6%)
CHAMPS and/or Short Physical
Performance Battery Eligible
(N=3311; 22.4%)
400m Walk / Medical
Screening Eligible
(N=1710; 11.5%)
400m Walk / Medical
Screening Complete
(N=2459; 16.6%)
1635 Randomized
(11.0%)
Physical ActivityIntervention
(N = 818)
Successful AgingIntervention
(N = 817)
37.6% Excluded*Too Much Exercise – 18.1%
Age/Location/Moving/LIFE-P – 17.3%Walker/Small Room/ ¼ Mile – 8.3%
Health Exclusion – 9.4%Other (mostly Temp Ineligible) – 3.6%
45.6% SPPB and/or CHAMPSExcluded*
SPPB – 41.3%CHAMPS – 4.4%
31.7% of Phone Eligibles Declined Further Screening
30.5% Excluded*3MS < 80 – 8.7%
Failed 400m Walk – 8.1% Clinician Exam – 15.5%
25.7% Declined Further Screening
Screening Funnel Exclusions
* Categories not mutually exclusive
Figure 1. LIFE Study screening funnel. SPPB = short physical performance battery; CHAMPS: Community Healthy Activities Model Program for Seniors; 3MS: Modified Mini Mental State Exam.
at Wake Forest U
niv School of Medicine on N
ovember 9, 2013
http://biomedgerontology.oxfordjournals.org/
Dow
nloaded from

LIFE STUDY RECRUITMENT AND BASELINE DATA 1555
minority screenees. Screenees who had higher function-ing, as assessed by the SPPB, were more likely to be rand-omized than lower functioning individuals (48.2% among SPPB 8–9 vs 40.8% among SPPB < 8; p < .0001). There was no difference in yield at sites based in the large metro-politan areas compared with the other sites.
Table 4 displays the percentage of participants recruited using each recruitment method and the associated recruit-ment costs. Overall, total direct recruitment cost was $1,374,214, which does not include indirect or personnel costs. This equates to $840 per randomized participant. Mass mailings resulted in 57.9% of the total randomized partici-pants and cost $695 per randomized participant, and news-paper advertisements resulted in 14.9% at a cost of $1,128. Television and radio advertisements and recruitment events were relatively inefficient recruitment strategies, costing $3,199 and $3,981 per randomized participant, respectively.
Recruitment Goals and Baseline CharacteristicsThe descriptive statistics for the randomized study sam-
ple are presented in Table 5. The mean age of the total sample was nearly 79 years, and 63.8% reported education beyond high school. Two thirds were female participants, and approximately one quarter reported a race or ethnicity other than white. On average, the sample was classed as obese with a mean body mass index of 30.2 kg/m2. High
blood pressure/hypertension was the most prevalent comor-bidity (70.4%), followed by diabetes (25.3%) and cancer (22.6%). The mean SPPB score was 7.4 ± 1.6, with 44.7% of participants having a score less than 8.
As expected, the randomization scheme produced base-line characteristics that were balanced across treatment groups. In particular, the two groups were qualitatively similar in lower extremity physical function and disease burden, two important potential moderators of the key out-comes in the study.
Staff EffortIn general, the mean staff effort budgeted for the
21-month recruiting effort was approximately 1.0 full-time equivalents (FTEs) although the sites varied in the manner in which staff effort was allocated within the site infrastructure. For example, the Pittsburgh site employed a recruitment coordinator at 0.1 FTEs for 1 year and two staff recruiters at 0.5 FTEs for 1 year for a total of 1.1 FTEs. Similarly, the recruitment coordinator at the Pittsburgh site averaged 0.6 FTEs over the course of the recruitment period but was supplemented by two telephone screeners at 0.7 FTEs. Pennington Biomedical funded a recruitment coor-dinator at 1.0 FTE and telephone screener at 0.5 FTE from an existing recruiting core during the recruitment period. In contrast, the recruitment coordinators at the Tufts, Wake Forest, and Stanford sites were recruited exclusively for LIFE but served other duties in addition to recruitment (eg, assessment). Additionally, the Stanford site employed Spanish-speaking staff to recruit Hispanic participants.
DiscussionIn the LIFE Study, eight field centers recruited 1,635
older adults, aged 70–89 years, at high risk for mobil-ity disability for a PA intervention trial to prevent mobil-ity disability over a 21-month period. The study met its recruitment goals for minority enrollment (22.5%) and SPPB scores (45% ≤7). The recruitment yield was 11.0% of the total screened volunteers, and approximately $840 was spent per randomized participant in direct recruiting
Table 3. LIFE Study Subgroup Recruitment Goals and Performance
Clinical SiteNumber
Randomized
% Racial Minority % Ethnic Minority
SPPB Score
SPPB Score <= 7 SPPB Score 8 or 9
Goal Actual Goal Actual Actual % (Goal 45%) Actual % (Goal 55%)
All clinics 1,635 22.5 21.0 4.4 3.7 45 55Northwestern University 203 28.0 33.5 8.0 2.5 55 45Pennington Biomedical Research Center 208 21.6 17.8 3.6 0 45 55Stanford University 200 7.6 10.5 18.0 18.0 45 55Tufts University 202 22.8 22.3 2.4 3.0 39 61University of Florida 201 26.4 10.0 0 1.0 44 56University of Pittsburgh 216 26.0 27.8 0 0.9 43 57Wake Forest University 205 26.0 24.9 0 0.5 45 55Yale University 200 21.6 20.5 3.2 4.5 43 58
Table 4. LIFE Study Recruitment Costs by Recruitment Method
Cost ($)
Number of Participants Randomized
Cost Per Randomized Participant
Brochures/letters 658,850 947 695Community events/outreach 47,780 12 3,981Print advertisement
(newspaper/magazines)275,335 244 1,128
TV and radio 355,113 111 3,199Other (flyers, newsletters,
Internet)37,136 245 151
Referral — 60 0Don’t know/refused — 16 0Total $1,374,214 1635 $840.00
at Wake Forest U
niv School of Medicine on N
ovember 9, 2013
http://biomedgerontology.oxfordjournals.org/
Dow
nloaded from

1556 MARSH ET AL.
costs. Importantly, we accrued 11% more follow-up time as a result of the accelerated recruitment rate throughout the recruitment phase. The primary reasons for exclusion were being too healthy or too active; as such we recruited a sample who were on the cusp of losing independent mobil-ity and who reflected the characteristics of a large number of older adults living in the community.
The success of the recruitment effort in LIFE can be greatly attributed to the lessons learned in the LIFE-P Study (8) and to the high prevalence of the target population in the community. The yields observed in LIFE are similar to those in LIFE-P, which are remarkable when considering the additional
complexity of the recruitment effort due to the additional field centers and their diverse environments. The pilot study prompted several changes to the screening and recruitment strategies used in LIFE. First, in an effort to enhance interven-tion group differences in PA and prevent dropout or crosso-ver, we modified the CHAMPS physical activity screening criteria to assess 18 items of moderate to vigorous intensity during the screening visits to exclude participants who were regularly active in moderate/vigorous activities. Second, we omitted the behavioral run-in in favor of very direct and repeated explanations of the requirements of the trial. Third, we added and emphasized a “participant expectations
Table 5. LIFE Study Baseline Characteristics by Randomized Group
Successful Aging (N = 817) Physical Activity (N = 818) Overall (N = 1,635)
Age 79.1 ± 5.2 78.7 ± 5.2 78.9 ± 5.2Gender Female 551 (67.4%) 547 (66.9%) 1,098 (67.2%) Male 266 (32.6%) 271 (33.1%) 537 (32.8%)Race/ethnicity Caucasian/white 635 (77.7%) 604 (73.8%) 1,239 (75.8%) African American/black 125 (15.3%) 163 (19.9%) 288 (17.6%) Latino, Hispanic or Spanish 30 ( 3.7%) 31 ( 3.8%) 61 ( 3.7%) Asian 8 ( 1.0%) 7 ( 0.9%) 15 ( 0.9%) Other/mixed 17 ( 2.1%) 10 ( 1.2%) 27 ( 1.6%) Refused/missing 2 ( 0.2%) 3 ( 0.4%) 5 ( 0.3%)Education No formal education (00) 6 ( 0.7%) 7 ( 0.9%) 13 ( 0.8%) Elementary school (K-08) 17 ( 2.1%) 15 ( 1.8%) 32 ( 2.0%) High school/equivalent (09–12) 236 (28.9%) 248 (30.3%) 484 (29.6%) College (13–17) 320 (39.2%) 321 (39.2%) 641 (39.2%) Post Graduate 208 (25.5%) 194 (23.7%) 402 (24.6%) Other 26 ( 3.2%) 32 ( 3.9%) 58 ( 3.5%) Unknown 4 ( 0.5%) 1 ( 0.1%) 5 ( 0.3%)Total SPPB Score 7.3 ± 1.6 7.4 ± 1.6 7.4 ± 1.63MS score 91.6 ± 5.5 91.5 ± 5.6 91.5 ± 5.5Digital Symbol Substitution Test Score 46.8 ± 12.5 45.8 ± 12.9 46.3 ± 12.7CHAMPS 18 total score 18.2 ± 33.8 15.9 ± 32.1 17.0 ± 33.0HDL cholesterol (mg/dL) 61.1 ± 17.6 61.1 ± 18.0 61.1 ± 17.8LDL cholesterol (mg/dL) 93.1 ± 33.1 93.6 ± 32.2 93.4 ± 32.6Triglycerides (mg/dL) 121.8 ± 58.6 123.0 ± 56.6 122.4 ± 57.6Total cholesterol (mg/dL) 178.5 ± 39.9 179.3 ± 39.6 178.9 ± 39.8Systolic BP (mean of two measures) 127.0 ± 17.8 127.9 ± 18.1 127.4 ± 18.0Diastolic BP (mean of two measures) 67.7 ± 10.1 68.7 ± 10.3 68.2 ± 10.2Weight (kg) 82.0 ± 19.3 81.9 ± 18.4 81.9 ± 18.8BMI 30.3 ± 6.2 30.1 ± 5.9 30.2 ± 6.1High blood pressure/hypertension 578 (70.7%) 573 (70.0%) 1,151 (70.4%)Heart attack/coronary/MI 69 (8.4%) 60 (7.3%) 129 (7.9%)Heart failure/congestive heart failure 45 (5.5%) 26 (3.2%) 71 (4.3%)Pacemaker 33 (4.0%) 33 (4.0%) 66 (4.0%)Stroke/brain hemorrhage 52 (6.4%) 57 (7.0%) 109 (6.7%)Cancer/malignant tumor 192 (23.5%) 178 (21.8%) 370 (22.6%)Diabetes/high blood sugar 216 (26.4%) 198 (24.2%) 414 (25.3%)Pain and/or stiffness in the knees 116 (14.2%) 113 (13.8%) 229 (14.0%)Pain and/or stiffness in the hips 72 (8.8%) 71 (8.7%) 143 (8.7%)Pain and/or stiffness in the back/spine 102 (12.5%) 110 (13.4%) 212 (13.0%)Chronic lung disease 123 (15.1%) 130 (15.9%) 253 (15.5%)Emotional/nervous/psychiatric problems 129 (15.8%) 162 (19.8%) 291 (17.8%)
Notes: Data are means and standard deviations or n (%). SPPB = short physical performance battery; 3MS = Modified Mini Mental State Exam; CHAMPS = Community Healthy Activities Model Program for Seniors; HDL = high-density lipoprotein; LDL = low-density lipoprotein; BP = blood pressure; BMI = body mass index.
at Wake Forest U
niv School of Medicine on N
ovember 9, 2013
http://biomedgerontology.oxfordjournals.org/
Dow
nloaded from

LIFE STUDY RECRUITMENT AND BASELINE DATA 1557
contract” to underscore the significant commitment required of participants in the trial. Given the similarities in yields in LIFE-P and LIFE, and the comparable efficiency of recruit-ment, it seems unlikely that these modifications played more than a minor role in the success of the recruitment effort. It is important to note that all field centers had considerable expe-rience recruiting older adults and used strategies previously identified as important for successful recruitment of at-risk older adults (22). The ability to connect with potential par-ticipants at the individual level and establish a rapport based on trust was emphasized at all sites, and strategies to enhance this were topics of discussion on Recruitment Committee monthly calls. The ability to operate on a flexible schedule for baseline assessments, the provision of transportation or monetary incentives to offset the burden of travel to assess-ment visits (which was not done in a systematic way across sites in LIFE-P), and the prompt and efficient follow-up calls were cited by the recruitment coordinators at all sites as criti-cal to the success of the recruitment effort once a respondent had contacted study staff. The experiences from LIFE-P also allowed the investigators to refine the flow of participants, albeit minimally, through the screening visits to minimize travel and testing burden. This was critical given the number and variety of assessments collected in this trial.
The recruitment methods, yields, and costs in LIFE were comparable with other trials of behavioral interventions (23). Ory and colleagues reported an average yield of 12.7% for eight very diverse trials and costs ranging from $103 to $939/randomized participant. Gill and colleagues (24) reported costs of $764–868/randomized participant in a clinical trial of physically frail, community-living persons, aged 75 and older. Costs when targeting unique and challenging patient populations can be much higher ($2000+) (10), especially compared with trials using office visits for low burden inter-ventions (25). The LIFE Study costs of $840/randomized participant falls in the mid-range, perhaps reflecting the fact that although a large number of older adults would meet our inclusion criteria, they represent a challenging population to attract to intensive behavioral interventions. We employed multiple mailings to the same areas in an effort to attract older adults who may not have been ready to engage with the study when they received the first mailing. We were also cognizant of the fact that maximizing the number of follow-up years by completing recruitment within the 21-month recruitment period would increase the anticipated number of 400-m walk failures and increase the statistical power of the study. All field center recruitment staff identified the robust recruitment budget, which included resources for transporta-tion to assessment visits and incentives, as a critical factor in the success of the LIFE Study recruitment effort. Without these funds, it would have been difficult to accommodate a diverse sample of individuals, particularly those at the lower end of the functional spectrum.
Mass mailing of brochures and letters was an efficient and cost-effective recruitment method by a wide margin.
A critical feature of contemporary mass mailing techniques is the relatively sophisticated targeting of age, sex, race, and zip code that can be achieved. Generally, a nontargeted list generates a 1% response, whereas a targeted list can gener-ate a 2%–6% response (26). All sites had a nonprofit bulk rate permit and a business reply account, obtained at the US Postal Service. The study brochure included a study telephone number and a tear-off postage paid mail-back card. Several sites also used their participant registries that allowed a very efficient use of resources since the registries contain the names and basic demographic information of older adults interested in participating in research. Events and television and radio advertisements were expensive methods that did not ultimately result in a large number of randomized participants. In contrast to LIFE-P, where only 6.8% of randomized participants came from the “Other” source, in the LIFE Study, this was 15% and it was, by far, the cheapest recruitment source.
The Hispanic population represents the second largest ethnic group in the United States (16.7%) but constitutes a relatively small proportion of older adults (4%). We set a goal of recruiting 4.4% ethnic minorities into the LIFE Study. This effort was mainly carried out at the Stanford field center where 18% of randomized participants were Hispanic. Stanford employed Latino bilingual staff, pro-duced culturally appropriate recruitment materials, and pro-vided all study-related forms in Spanish. A critical aspect to the success was the development of a satellite site in a loca-tion convenient to the Latino community. With the exception of Northwestern University, other field centers did not have a sufficiently high proportion of Hispanic older adults within their catchment area. Although Stanford’s county of Santa Clara and Chicago’s Cook County have similar Hispanic populations (27.2% and 24.4%, respectively), Northwestern University was not able to achieve its goal of 8% Hispanic enrollment. A potential reason for this was the absence of resources at Northwestern University to employ a bilingual staff to accommodate the Hispanic population. This high-lights the importance of utilizing additional resources for recruitment of ethnic minorities into clinical trials.
The baseline characteristics of our sample are indica-tive of a group of older adults at very high risk for physical decline. By design, all the participants have existing lower extremity functional limitations (SPPB ≤9) although all were able to walk 400 m. However, they are living with significant comorbidity that reflects the situation of a large percentage of the older adult population aged 70 years and older. For example, the prevalence of diabetes in the LIFE Study is very similar to the Centers for Disease Control esti-mates for the population aged 65 years and older (~27%). Also, virtually all participants are overweight or obese, reflecting the increase in overweight and obesity that has occurred in the older adult population. Therefore, we are dealing with a population at high risk of health outcomes, which is relevant for the trial outcomes.
at Wake Forest U
niv School of Medicine on N
ovember 9, 2013
http://biomedgerontology.oxfordjournals.org/
Dow
nloaded from

1558 MARSH ET AL.
In conclusion, these data from the LIFE Study dem-onstrate the feasibility of recruiting a geographically and ethnically diverse population of older community-dwelling adults at high risk for mobility disability for a long-term PA intervention trial. Key strategies for future trials to consider for successful recruitment of at-risk older persons include adequate budget, focus on low-cost direct mailing and targeted newspaper advertisements, staff training and lan-guage ability, and resources to provide transportation and incentives for screening visits.
Supplementary Material
Supplementary material can be found at: http://biomedgerontology.oxfordjournals.org/
Funding
A.P.M. is supported by the WFU Claude D. Pepper Center National Institutes for Aging (P30 AG021332). J.M. is supported by the Yale Claude D. Pepper Older Americans Independence Center (P30AG021342). The Lifestyle Interventions and Independence for Elders Study is funded by a National Institutes of Health/National Institute on Aging Cooperative Agreement (UO1 AG22376) and a supplement from the National Heart, Lung and Blood Institute (3U01AG022376-05A2S), in part supported by the University of Florida Claude D. Pepper Older Americans Independence Center (P30AG028740) and sponsored in part by the Intramural Research Program, National Institute on Aging, National Institutes of Health.
References 1. Guralnik JM, Fried LP, Salive ME. Disability as a public health out-
come in the aging population. Annu Rev Public Health. 1996;17:25–46. 2. Ferrucci L, Guralnik JM, Studenski S, Fried LP, Cutler GB Jr, Walston
JD. Designing randomized, controlled trials aimed at preventing or delaying functional decline and disability in frail, older persons: a consensus report. J Am Geriatr Soc. 2004;52:625–634.
3. Guralnik JM, Simonsick EM, Ferrucci L, et al. A short physical per-formance battery assessing lower extremity function: association with self-reported disability and prediction of mortality and nursing home admission. J Gerontol. 1994;49:M85–M94.
4. Guralnik JM, Ferrucci L, Simonsick EM, Salive ME, Wallace RB. Lower-extremity function in persons over the age of 70 years as a predictor of subsequent disability. N Engl J Med. 1995;332: 556–561.
5. Hardy SE, Kang Y, Studenski SA, Degenholtz HB. Ability to walk ¼ mile predicts subsequent disability, mortality, and health care costs. J Gen Intern Med. 2011;26:130–135.
6. Fielding RA, Rejeski WJ, Blair S, et al. The Lifestyle Interventions and Independence for Elders Study: design and methods. J Gerontol A Biol Sci Med Sci. 2011;66:1226–1237.
7. Lovato LC, Hill K, Hertert S, Hunninghake DB, Probstfield JL. Recruitment for controlled clinical trials: literature summary and annotated bibliography. Control Clin Trials. 1997;18:328–352.
8. Katula JA, Kritchevsky SB, Guralnik JM, et al. Lifestyle Interventions and Independence for Elders pilot study: recruitment and baseline characteristics. J Am Geriatr Soc. 2007;55:674–683.
9. Harris TJ, Carey IM, Victor CR, Adams R, Cook DG. Optimising recruitment into a study of physical activity in older people: a ran-domised controlled trial of different approaches. Age Ageing. 2008;37:659–665.
10. McDermott MM, Domanchuk K, Dyer A, Ades P, Kibbe M, Criqui MH. Recruiting participants with peripheral arterial disease for clinical trials: experience from the Study to Improve Leg Circulation (SILC). J Vasc Surg. 2009;49:653–659.
11. Forster SE, Jones L, Saxton JM, et al. Recruiting older people to a randomised controlled dietary intervention trial–how hard can it be? BMC Med Res Methodol. 2010;10:17.
12. Ridda I, MacIntyre CR, Lindley RI, Tan TC. Difficulties in recruiting older people in clinical trials: an examination of barriers and solutions. Vaccine. 2010;28:901–906.
13. Carroll CB, Zajicek JP. Designing clinical trials in older people. Maturitas. 2011;68:337–341.
14. Santoyo-Olsson J, Cabrera J, Freyre R, et al. An innovative mul-tiphased strategy to recruit underserved adults into a randomized trial of a community-based diabetes risk reduction program. Gerontologist. 2011;51(suppl 1):S82–S93.
15. Stewart AL, Mills KM, King AC, Haskell WL, Gillis D, Ritter PL. CHAMPS physical activity questionnaire for older adults: outcomes for interventions. Med Sci Sports Exerc. 2001;33:1126–1141.
16. Ferrucci L, Penninx BW, Leveille SG, et al. Characteristics of non-disabled older persons who perform poorly in objective tests of lower extremity function. J Am Geriatr Soc. 2000;48:1102–1110.
17. Rejeski WJ, Fielding RA, Blair SN, et al. The Lifestyle Interventions and Independence for Elders (LIFE) Pilot Study: design and methods. Contemp Clin Trials. 2005;26:141–154.
18. The LIFE Study Investigators. Effects of a physical activity inter-vention on measures of physical performance: results of the lifestyle interventions and independence for Elders Pilot (LIFE-P) Study. J Gerontol A Biol Sci Med Sci. 2006;61:1157–1165.
19. Probstfield JL, Wittes JT, Hunninghake DB. Recruitment in NHLBI population-based studies and randomized clinical trials: data analysis and survey results. Control Clin Trials. 1987;8(suppl 4):141S–149S.
20. Kingry C, Bastien A, Booth G, et al. Recruitment strategies in the Action to Control Cardiovascular Risk in Diabetes (ACCORD) trial. Am J Cardiol. 2007;99:68i–79i.
21. Carew BD, Ahn SA, Boichot HD, et al. Recruitment strategies in the studies of left ventricular dysfunction (SOLVD): strategies for screen-ing and enrollment in two concurrent but separate trials. The SOLVD Investigators. Control Clin Trials. 1992;13:325–338.
22. Mody L, Miller DK, McGloin JM, et al. Recruitment and retention of older adults in aging research. J Am Geriatr Soc. 2008;56:2340–2348.
23. Ory MG, Lipman PD, Karlen PL, et al. Recruitment of older partici-pants in frailty/injury prevention studies. Prev Sci. 2002;3:1–22.
24. Gill TM, McGloin JM, Gahbauer EA, Shepard DM, Bianco LM. Two recruitment strategies for a clinical trial of physically frail commu-nity-living older persons. J Am Geriatr Soc. 2001;49:1039–1045.
25. Silagy CA, Campion K, McNeil JJ, Worsam B, Donnan GA, Tonkin AM. Comparison of recruitment strategies for a large-scale clinical trial in the elderly. J Clin Epidemiol. 1991;44:1105–1114.
26. Bonk J. A road map for the recruitment and retention of older adult participants for longitudinal studies. J Am Geriatr Soc. 2010;58(suppl 2):S303–S307. doi:10.1111/j.1532-5415.2010.02937.x.:S303–S307.
at Wake Forest U
niv School of Medicine on N
ovember 9, 2013
http://biomedgerontology.oxfordjournals.org/
Dow
nloaded from
Related Documents