LETTER Life-history traits predict species responses to habitat area and isolation: a cross-continental synthesis Erik O ¨ ckinger, 1 * Oliver Schweiger, 2 Thomas O. Crist, 3 Diane M. Debinski, 4 Jochen Krauss, 5 Mikko Kuussaari, 6 Jessica D. Petersen, 7 Juha Po ¨ yry, 6 Josef Settele, 2 Keith S. Summerville 8 and Riccardo Bommarco 1 Abstract There is a lack of quantitative syntheses of fragmentation effects across species and biogeographic regions, especially with respect to species life-history traits. We used data from 24 independent studies of butterflies and moths from a wide range of habitats and landscapes in Europe and North America to test whether traits associated with dispersal capacity, niche breadth and reproductive rate modify the effect of habitat fragmentation on species richness. Overall, species richness increased with habitat patch area and connectivity. Life-history traits improved the explanatory power of the statistical models considerably and modified the butterfly species–area relationship. Species with low mobility, a narrow feeding niche and low reproduction were most strongly affected by habitat loss. This demonstrates the importance of considering life-history traits in fragmentation studies and implies that both species richness and composition change in a predictable manner with habitat loss and fragmentation. Keywords Connectivity, fragmentation, Lepidoptera, meta-analysis, quantitative synthesis, species richness, species–area relationship. Ecology Letters (2010) 13: 969–979 INTRODUCTION Local species richness is predicted to decrease with decreasing area of habitat patches and increasing isolation from conspecific populations (MacArthur & Wilson 1967; Hanski 1999; Fahrig 2003). Not all species, however, respond equally to habitat loss and fragmentation, and it has been suggested that the variability in speciesÕ responses to habitat area and fragmentation can be explained by life- history traits (Henle et al. 2004; Ewers & Didham 2006; Prugh et al. 2008). When combinations of traits make species more susceptible to habitat loss and fragmentation, communities in small and isolated habitat patches will not only contain fewer species than large and well-connected ones, but will also differ in species composition. In highly fragmented landscapes, communities are generally pre- dicted to become increasingly similar in composition, and dominated by few generalist species with similar traits (McKinney & Lockwood 1999; Ekroos et al. 2010). How- ever, predicting such responses may not be quite so simple. For example, a recent study indicated non-univocal responses of different species groups, indicating potential interactions between niche breadth and dispersal capacity (Dormann et al. 2007). 1 Department of Ecology, Swedish University of Agricultural Sciences, P.O. Box 7044, 75007 Uppsala, Sweden 2 UFZ, Helmholtz Centre for Environmental Research, Depart- ment of Community Ecology, Theodor-Lieser-Strasse 4, 06120 Halle, Germany 3 Department of Zoology, Miami University, Oxford, OH, USA 4 Department of Ecology, Evolution, and Organismal Biology, Iowa State University, Ames, IA 50011, USA 5 Population Ecology Group, Department of Animal Ecology I, University of Bayreuth, Universita ¨ tsstrasse 30, D-95447 Bayreuth, Germany 6 Finnish Environment Institute, Research Programme for Bio- diversity, P.O. Box 140, FI-00251 Helsinki, Finland 7 Department of Entomology, Iowa State University, 424 Science II, Ames, IA 50011, USA 8 Department of Environmental Science and Policy, Drake Uni- versity, Olin Hall, Des Moines, IA 50311-4505, USA *Correspondence: E-mail: [email protected] Ecology Letters, (2010) 13: 969–979 doi: 10.1111/j.1461-0248.2010.01487.x Ó 2010 Blackwell Publishing Ltd/CNRS

Welcome message from author
This document is posted to help you gain knowledge. Please leave a comment to let me know what you think about it! Share it to your friends and learn new things together.
Transcript
L E T T E RLife-history traits predict species responses to habitat
area and isolation: a cross-continental synthesis
Erik Ockinger,1* Oliver
Schweiger,2 Thomas O. Crist,3
Diane M. Debinski,4 Jochen
Krauss,5 Mikko Kuussaari,6
Jessica D. Petersen,7 Juha Poyry,6
Josef Settele,2 Keith S.
Summerville8 and Riccardo
Bommarco1
Abstract
There is a lack of quantitative syntheses of fragmentation effects across species and
biogeographic regions, especially with respect to species life-history traits. We used data
from 24 independent studies of butterflies and moths from a wide range of habitats and
landscapes in Europe and North America to test whether traits associated with dispersal
capacity, niche breadth and reproductive rate modify the effect of habitat fragmentation
on species richness. Overall, species richness increased with habitat patch area and
connectivity. Life-history traits improved the explanatory power of the statistical models
considerably and modified the butterfly species–area relationship. Species with low
mobility, a narrow feeding niche and low reproduction were most strongly affected by
habitat loss. This demonstrates the importance of considering life-history traits in
fragmentation studies and implies that both species richness and composition change in
a predictable manner with habitat loss and fragmentation.
Keywords
Connectivity, fragmentation, Lepidoptera, meta-analysis, quantitative synthesis, species
richness, species–area relationship.
Ecology Letters (2010) 13: 969–979
I N T R O D U C T I O N
Local species richness is predicted to decrease with
decreasing area of habitat patches and increasing isolation
from conspecific populations (MacArthur & Wilson 1967;
Hanski 1999; Fahrig 2003). Not all species, however,
respond equally to habitat loss and fragmentation, and it
has been suggested that the variability in species� responses
to habitat area and fragmentation can be explained by life-
history traits (Henle et al. 2004; Ewers & Didham 2006;
Prugh et al. 2008). When combinations of traits make
species more susceptible to habitat loss and fragmentation,
communities in small and isolated habitat patches will not
only contain fewer species than large and well-connected
ones, but will also differ in species composition. In highly
fragmented landscapes, communities are generally pre-
dicted to become increasingly similar in composition, and
dominated by few generalist species with similar traits
(McKinney & Lockwood 1999; Ekroos et al. 2010). How-
ever, predicting such responses may not be quite so simple.
For example, a recent study indicated non-univocal
responses of different species groups, indicating potential
interactions between niche breadth and dispersal capacity
(Dormann et al. 2007).
1Department of Ecology, Swedish University of Agricultural
Sciences, P.O. Box 7044, 75007 Uppsala, Sweden2UFZ, Helmholtz Centre for Environmental Research, Depart-
ment of Community Ecology, Theodor-Lieser-Strasse 4, 06120
Halle, Germany3Department of Zoology, Miami University, Oxford, OH, USA4Department of Ecology, Evolution, and Organismal Biology,
Iowa State University, Ames, IA 50011, USA5Population Ecology Group, Department of Animal Ecology I,
University of Bayreuth, Universitatsstrasse 30, D-95447
Bayreuth, Germany
6Finnish Environment Institute, Research Programme for Bio-
diversity, P.O. Box 140, FI-00251 Helsinki, Finland7Department of Entomology, Iowa State University, 424 Science
II, Ames, IA 50011, USA8Department of Environmental Science and Policy, Drake Uni-
versity, Olin Hall, Des Moines, IA 50311-4505, USA
*Correspondence: E-mail: [email protected]
Ecology Letters, (2010) 13: 969–979 doi: 10.1111/j.1461-0248.2010.01487.x
� 2010 Blackwell Publishing Ltd/CNRS
Because species persistence in fragmented habitats
depends on local extinction and colonization processes,
life-history traits associated with these processes are likely to
determine species responses to habitat loss and fragmenta-
tion. Dispersal capacity, niche breadth and reproductive
potential are three traits hypothesized to be key determi-
nants of species persistence in fragmented landscapes
(Kotiaho et al. 2005; Ewers & Didham 2006), each leading
to clearly defined expectations.
The importance of immigration from nearby populations
for population persistence (Brown & Kodric-Brown 1977)
and re-colonization following local extinction events (Han-
ski 1999) is likely to increase with decreasing patch and
population sizes. Hence, species with poor dispersal capacity
are predicted to be more strongly affected by reduction in
habitat area and connectivity compared to more mobile
species (Lomolino 1984; Ockinger et al. 2009). Conversely,
species with high dispersal capacity can move between
habitat patches and more efficiently utilize a fragmented
resource, making them less sensitive to increasing geo-
graphical isolation (Hanski & Ovaskainen 2000).
Species with narrow feeding niches are able to fulfil their
resource requirements in only the largest and most well-
connected habitat patches, where the probability of co-
occurrence of essential resources is largest. Resource
specialists are also less likely to utilize resources in the
�matrix� outside the primary habitat patches (Brotons et al.
2003). As a consequence, specialists will experience their
habitat as more fragmented compared to generalists, which
increases the sensitivity of specialists to habitat loss and
fragmentation (With & Crist 1995; Ewers & Didham 2006).
In fragmented habitats, species with high reproductive
potential may suffer less because a large number of
offspring implies a large number of potential emigrants,
increasing the chance of colonization of empty habitat
patches. It also results in more rapid population growth
which enhances the chances of colonization, successful
population establishment, and population recovery follow-
ing environmental change (Henle et al. 2004).
Despite the fairly well established predictions, there are
few empirical studies explicitly addressing whether species
with contrasting life-history traits are differentially affected
by habitat fragmentation (Henle et al. 2004). Life-history
traits tend to be highly correlated, and studying only the
effects of a single trait may impede the detection of trait-
mediated responses (Mattila et al. 2006). Therefore, there is a
need to analyse how species with certain combinations of
traits are affected by habitat loss and fragmentation.
Here, we focus on Lepidoptera because butterflies and,
to a lesser extent, moths provide several advantages.
Especially, butterfly species have been proven to be good
indicators of environmental change and overall biodiversity
(Thomas 2005). Further, they are charismatic and highly
attractive and thus well studied. Therefore, there is
comparably good knowledge about species traits and their
substantial variation available and there are many studies
dealing with questions of habitat loss and fragmentation
(Koh et al. 2004; Thomas & Hanski 2004; Dover & Settele
2009). Some, but not all, of the case studies have
supported predictions of positive relationships between
species richness and connectivity (Hanski & Poyry 2007).
Given the large number of case studies, it is surprising that
no quantitative syntheses have been conducted on the
effects of habitat loss and fragmentation on the diversity
of Lepidoptera in general and on trait-mediated responses
in particular.
In this study, we synthesize data on the responses of
Lepidoptera (butterflies and moths) to habitat loss and
fragmentation to test two more general predictions: (1)
species richness increases with patch area and connectivity,
and (2) species characterized by low dispersal ability
(indicated by small wing span), narrow larval feeding niche
and low reproductive potential have the strongest responses
to decreasing patch area and connectivity. We tested these
predictions with analyses that combined information on life-
history traits with patterns of species occurrence in habitat
patches from 24 independent data sets, covering a wide
range of landscapes and biotopes in Europe and North
America. We demonstrated that species richness responses
to decreasing habitat area and connectivity strongly
depend on species� dispersal capacity, niche breadth and
reproduction.
M E T H O D S
Data sets
We used literature searches and personal contacts to collect
data sets relating species richness of Lepidoptera to habitat
loss and fragmentation. We restricted our search to
community-level studies, where species richness was
observed at the patch level and where at least seven
well-defined habitat patches were systematically sampled
for butterflies, moths or both using standardized sampling
methods (transect counts, observation plots or standard-
ized traps). We excluded small-scale studies with experi-
mentally created arrays of patches where individuals freely
moved among patches (e.g., Summerville & Crist 2001),
and focused on broad-scale studies with larger isolated
patches where spatially structured dynamics occur due to
local extinction and dispersal limitation. We also excluded
studies where information on species incidence was
compiled rather than systematically sampled (Dennis &
Shreeve 1997). We restricted our search for data sets to
Europe and North America, due to uncertainties in
taxonomy and limited availability of data on life-history
970 E. Ockinger et al. Letter
� 2010 Blackwell Publishing Ltd/CNRS
traits for other regions. In most cases, some or all of the
data needed for analysis were unpublished and we
contacted authors for more detailed data. Of the 24 data
sets (20 published and 4 unpublished) fulfilling our criteria,
there were 19 (15 from Europe and 4 from North
America) on butterflies (in some cases these also included
diurnal moths) from transect walks or plot counts and 5
(two from Europe and three from North America) on
nocturnal moths from light traps. A summary of the data
sources is provided in Appendix S1. For further informa-
tion on these studies, we refer the reader to the original
publications. From each data set, we used the observed
identities and richness of species.
Measures of area and connectivity
We used patch areas and connectivity metrics given in the
publications or provided by the authors. Connectivity
metrics differed among data sets, but two types of metrics
dominated: a connectivity index that weights the distances
and sizes of habitat patches in the surroundings of the focal
study patch (Hanski 1999) (N = 11), and the proportion of
similar habitat within a certain radius around the focal
habitat patch, here referred to as buffer-index (N = 8). For
three of these studies (data set numbers 4, 8 and 9 in
Appendix S1), we had access to both metrics.
Even though it may be more biologically relevant to
weight neighbouring patches by their distance to the patch
of interest than to measure the proportion of habitat within
a certain radius relative to the patch of interest, these two
types of indices are often strongly correlated (Moilanen &
Nieminen 2002; Winfree et al. 2005). In the three data sets
where we had access to both indices, they were significantly
correlated (r = 0.52, N = 193, P < 0.001). Assuming that
the two indices are largely interchangeable, we included
either one or the other in analyses as approximate measures
of connectivity. For data sets that provided both indices, we
used the distance-weighted measure. Any systematic differ-
ences in measures of connectivity (e.g., type of matrix or
spatial scale) between studies were accounted for in the
generalized linear mixed-effects models, where we allowed
the effects of connectivity to vary randomly among datasets.
Studies using other isolation indices (N = 4, see Appen-
dix S1) as well as one study lacking connectivity measures
(see Appendix S1) were excluded. Hence, analyses of the
effect of connectivity included 19 of the 24 data sets. In all
analyses, we used log-transformed values of both area and
connectivity to improve linearity.
Life-history traits
Average wing span of female Lepidoptera was obtained
from field guides (see Appendix S2) and used as a proxy
for dispersal capacity. There is good evidence that
morphometrics such as body size can be used as a proxy
for dispersal capacity (Greeleaf et al. 2007). Field studies
have found strong correlations between wing span and
migration rates in Lepidoptera (Nieminen 1996). For the
butterfly species covered in the book by Bink (1992) (all
species found in northwest Europe) and included in our
analyses, there was a significant correlation between
mobility (nine classes) as assessed by expert opinions and
wing span (r = 0.30, P < 0.001, N = 123). Because we
used the number of species sharing a certain trait as the
dependent variable in our analyses, we could not insert
wing span as a continuous variable in the model. Instead,
we classified species as having large or small wing span
based on whether the value was larger or smaller than the
median (32 mm) wing span for all species included in the
analysis.
As a measure of larval feeding niche breadth, we used the
range of plants on which the Lepidoptera species feed as
larvae. Species whose larval feeding niche consists of a
single plant genus were classified as food specialists whereas
species feeding on more than one plant genus were classified
as generalists. Information on larval diet for all butterfly and
moth species included in any of the data sets were extracted
from published sources (see Appendix S2).
For a subset of the butterfly species, we also had data on
maximum egg production (Bink 1992). This included all
butterfly species from studies in northern and western
Europe (Finland, Sweden, Germany, a total of 10 data sets),
and > 90% of species recorded in the studies from
Switzerland and Czech Republic (data sets 5, 6 and 15 in
Appendix S1). Butterflies for which data on egg production
were available were classified as having high reproduction if
the maximum number of eggs produced exceeded 160
(which was the median value for all species included in our
analysis), and as having low reproduction if the maximum
number of eggs produced was 160 or less. There was a
moderately strong correlation between wing span and
reproduction (r = 0.39, P < 0.001, N = 123), but no
difference in wing span (t-test: t1338 = 0.11, P = 0.91) or
egg production (t121 = 0.61, P = 0.54) between specialist
and generalist species.
Statistical analyses
We analysed data from the two sampling methods, transect
walk (including plot counts; sampling butterflies and diurnal
moths) and light traps (sampling nocturnal moths) sepa-
rately. Species detection probabilities differ between the two
methods, and moths are much more diverse than butterflies
in temperate environments (total number of observed moth
species ranged from 214 to 493 across studies compared
with 17–83 observed butterfly species; see Appendix S1).
Letter Habitat fragmentation and life-history traits 971
� 2010 Blackwell Publishing Ltd/CNRS
Therefore, the analyses can be considered as two indepen-
dent tests of the same hypotheses.
The observed species richness was used as the dependent
variable in generalized linear mixed-effects models with
Poisson error distribution and log link function in the
lme4 package (Bates & Mechler 2008) of R software
(R Development Core Team 2008). We built random-effects
models, where slopes and intercepts were allowed to vary
among data sets (Gelman & Hill 2006; Bolker et al. 2009) as
each study differed in range of habitat areas, levels of patch
connectivity, and the species richness of life-history catego-
ries. The random-effects models also account for any
differences in spatial scale or sampling effort among studies
due to sampling frequency or numbers of sampling units
(transects or traps). First, we analysed overall continuous
effects of habitat area and connectivity on species richness
irrespective of traits, and tested if these differed between
continents and major habitat types. We then performed
separate analyses using either habitat area or connectivity as
continuous variables and life-history traits as categorical
predictor variables. All main effects of area, connectivity,
traits, and their interactions were screened both as fixed
effects and random effects of data set. Treatment contrasts
were used for testing differences among the trait states.
Hierarchical model selection was used to select the best-
fitting model by sequentially removing higher-order ran-
dom-effects interactions followed by random main effects.
Model selection was based on the minimum Akaike�sInformation Criterion (AIC). After selecting the combina-
tion of random effects that resulted in the minimum AIC,
hierarchical model selection of fixed effects was conducted
to determine the combination of fixed and random effects
with the minimum AIC (Bolker et al. 2009). We checked for
overdispersion in Poisson regression models using the
dispersion scale factor, which was < 1.5 in all the models
examined; hence, it was unnecessary to use quasipoisson
errors and quasi-AIC (QAIC) to correct for overdispersion
(Bolker et al. 2009). The statistical significance of each fixed
and random effect in the best-fitting model was determined
by likelihood ratio tests on models with and without each
effect (Pinhero & Bates 2000; Bolker et al. 2009).
To test our main hypothesis – life-history traits influence
the relationship between species richness and habitat area
and connectivity – we used likelihood ratio tests to explicitly
compare the explanatory power of our best-fitting models
with those that did not include any interactions between
area or connectivity and life-history traits (Pinhero & Bates
2000; Bolker et al. 2009). The first set of analyses assessed
the effect of patch area on species richness and included
four combinations of classes of wing span and niche
specialization, i.e. (1) generalist species with small wing span,
(2) generalist species with large wing span, (3) specialist
species with small wing span, and (4) specialist species with
large wing span, as explanatory variables. Because connec-
tivity measures were not available for all data sets, we ran a
second set of analyses with the same species trait variables,
but this time included both the effect of patch area and
connectivity on species richness. Finally, we examined the
effect of patch area on species richness with four
combinations of classes of niche specialization and repro-
ductive potential, i.e. (1) generalist species with low
reproduction, (2) generalist species with high reproduction,
(3) specialist species with low reproduction, and (4)
specialist species with high reproduction, as explanatory
variables. This analysis only included European butterfly
species for which we had data on reproduction. Appen-
dix S1 indicates which data sets were included in each
analysis.
R E S U L T S
General patterns
In total, the 24 data sets contained 1485 species and 815
habitat patches. Across all data sets, there was a positive
effect of patch area on species richness (mean slope of the
species–area relationship on a log–log scale = 0.120,
SE = ± 0.028; likelihood ratio test, v2 = 106.3, d.f. = 3,
P < 0.001) and connectivity (mean slope on a log–log
scale = 0.028, SE = ± 0.018, v2 = 30.7, d.f. = 3, P <
0.001) when variables were treated as random effects across
data sets. This pattern differed slightly when butterflies and
moths were analysed separately. For butterflies, the mean
slope (on a log–log scale) of the species–area relationship
was estimated to be 0.124 (SE = ± 0.033, v2 = 85.5,
d.f. = 3, P < 0.001), and the species–connectivity relation-
ship to be 0.045 (SE = ± 0.017, v2 = 14.3, d.f. = 3,
P = 0.026). For moths, area had a mean slope of 0.108
(SE = ± 0.035, v2 = 30.7, d.f. = 3, P < 0.001) and con-
nectivity had an overall slightly negative effect of )0.058
(SE = ± 0.038, v2 = 11.7, d.f. = 3, P < 0.01) on species
richness.
The slope of the relationships between species richness
and area (F1,18 = 2.07, P = 0.15) and connectivity (F1,18 =
0.58, P = 0.45) did not differ between continents, or
between grassland, forest and urban habitats (area: F2,16 =
0.62, P = 0.54; connectivity: F2,16 = 1.25, P = 0.29).
Effects of life-history traits
Life-history traits significantly modified the response of
species richness to habitat patch area and connectivity. For
butterflies, the models including interactions between traits
and patch area had higher explanatory power than compet-
ing models without those interactions (Table 1a–c). For
moths the model which included an interaction between
972 E. Ockinger et al. Letter
� 2010 Blackwell Publishing Ltd/CNRS
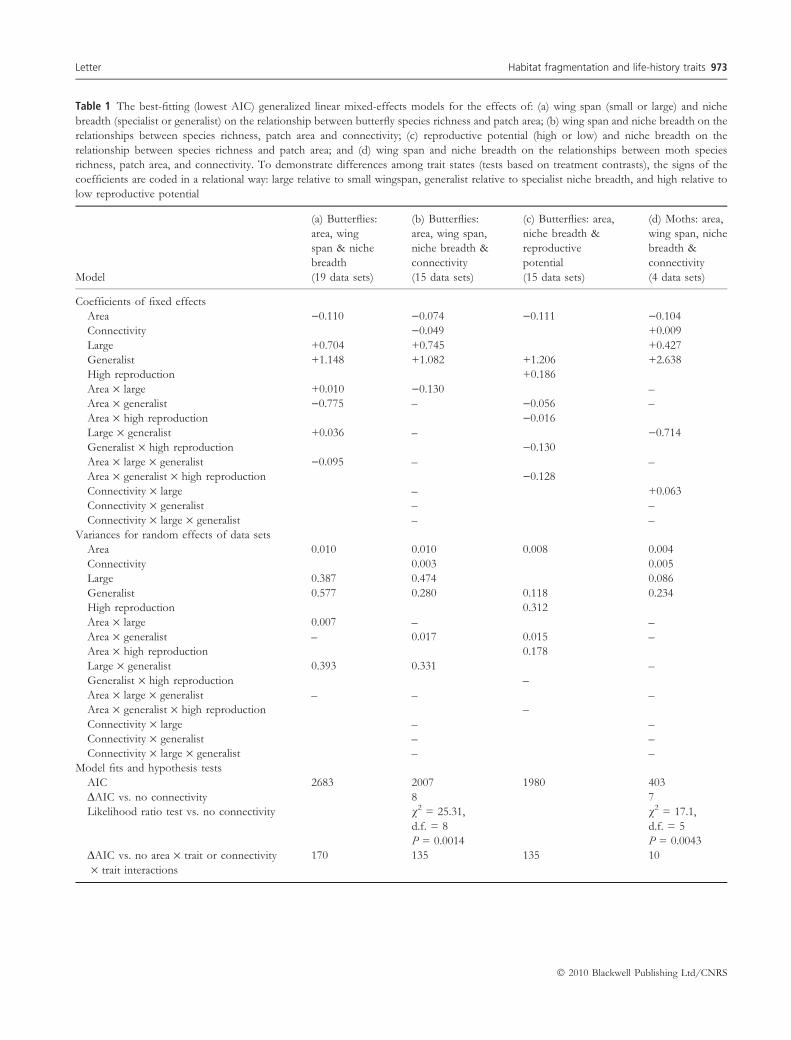
Table 1 The best-fitting (lowest AIC) generalized linear mixed-effects models for the effects of: (a) wing span (small or large) and niche
breadth (specialist or generalist) on the relationship between butterfly species richness and patch area; (b) wing span and niche breadth on the
relationships between species richness, patch area and connectivity; (c) reproductive potential (high or low) and niche breadth on the
relationship between species richness and patch area; and (d) wing span and niche breadth on the relationships between moth species
richness, patch area, and connectivity. To demonstrate differences among trait states (tests based on treatment contrasts), the signs of the
coefficients are coded in a relational way: large relative to small wingspan, generalist relative to specialist niche breadth, and high relative to
low reproductive potential
Model
(a) Butterflies:
area, wing
span & niche
breadth
(19 data sets)
(b) Butterflies:
area, wing span,
niche breadth &
connectivity
(15 data sets)
(c) Butterflies: area,
niche breadth &
reproductive
potential
(15 data sets)
(d) Moths: area,
wing span, niche
breadth &
connectivity
(4 data sets)
Coefficients of fixed effects
Area )0.110 )0.074 )0.111 )0.104
Connectivity )0.049 +0.009
Large +0.704 +0.745 +0.427
Generalist +1.148 +1.082 +1.206 +2.638
High reproduction +0.186
Area · large +0.010 )0.130 –
Area · generalist )0.775 – )0.056 –
Area · high reproduction )0.016
Large · generalist +0.036 – )0.714
Generalist · high reproduction )0.130
Area · large · generalist )0.095 – –
Area · generalist · high reproduction )0.128
Connectivity · large – +0.063
Connectivity · generalist – –
Connectivity · large · generalist – –
Variances for random effects of data sets
Area 0.010 0.010 0.008 0.004
Connectivity 0.003 0.005
Large 0.387 0.474 0.086
Generalist 0.577 0.280 0.118 0.234
High reproduction 0.312
Area · large 0.007 – –
Area · generalist – 0.017 0.015 –
Area · high reproduction 0.178
Large · generalist 0.393 0.331 –
Generalist · high reproduction –
Area · large · generalist – – –
Area · generalist · high reproduction –
Connectivity · large – –
Connectivity · generalist – –
Connectivity · large · generalist – –
Model fits and hypothesis tests
AIC 2683 2007 1980 403
DAIC vs. no connectivity 8 7
Likelihood ratio test vs. no connectivity v2 = 25.31,
d.f. = 8
P = 0.0014
v2 = 17.1,
d.f. = 5
P = 0.0043
DAIC vs. no area · trait or connectivity
· trait interactions
170 135 135 10
Letter Habitat fragmentation and life-history traits 973
� 2010 Blackwell Publishing Ltd/CNRS
connectivity and wing span explained the data better than
the competing model without that interaction term
(Table 1d). Competing models with DAIC £ 10 compared
to the best model (c.f. Burnham & Anderson 2002) are
presented in Table S1.
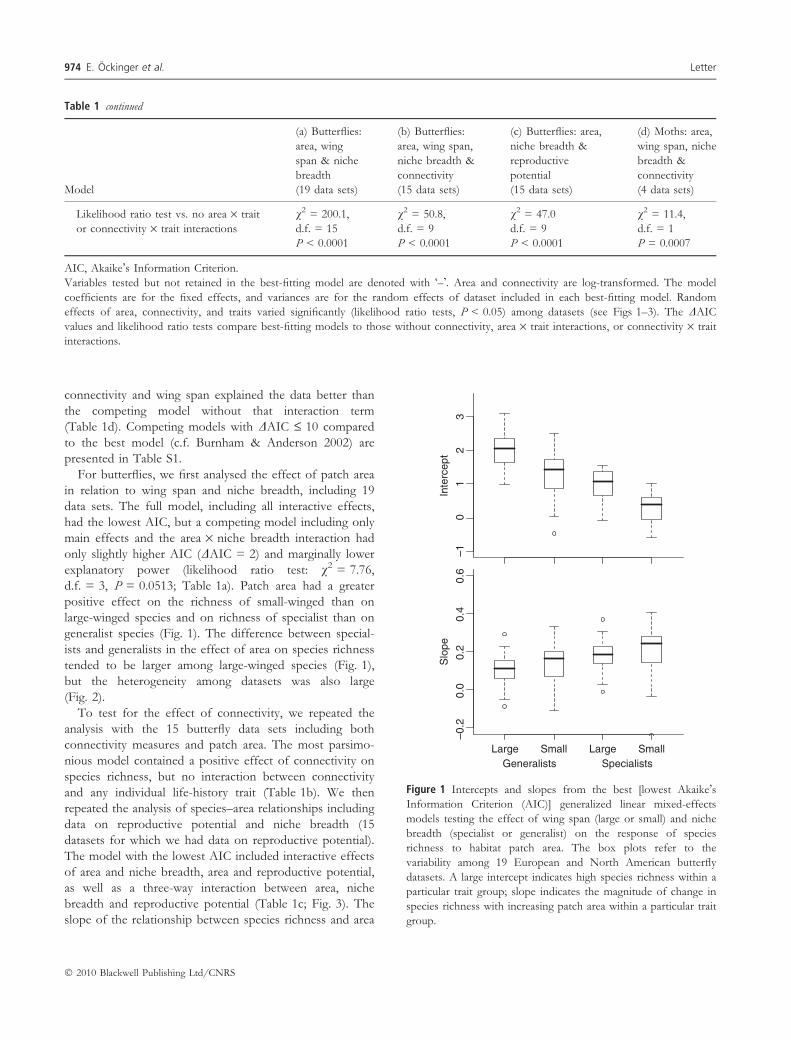
For butterflies, we first analysed the effect of patch area
in relation to wing span and niche breadth, including 19
data sets. The full model, including all interactive effects,
had the lowest AIC, but a competing model including only
main effects and the area · niche breadth interaction had
only slightly higher AIC (DAIC = 2) and marginally lower
explanatory power (likelihood ratio test: v2 = 7.76,
d.f. = 3, P = 0.0513; Table 1a). Patch area had a greater
positive effect on the richness of small-winged than on
large-winged species and on richness of specialist than on
generalist species (Fig. 1). The difference between special-
ists and generalists in the effect of area on species richness
tended to be larger among large-winged species (Fig. 1),
but the heterogeneity among datasets was also large
(Fig. 2).
To test for the effect of connectivity, we repeated the
analysis with the 15 butterfly data sets including both
connectivity measures and patch area. The most parsimo-
nious model contained a positive effect of connectivity on
species richness, but no interaction between connectivity
and any individual life-history trait (Table 1b). We then
repeated the analysis of species–area relationships including
data on reproductive potential and niche breadth (15
datasets for which we had data on reproductive potential).
The model with the lowest AIC included interactive effects
of area and niche breadth, area and reproductive potential,
as well as a three-way interaction between area, niche
breadth and reproductive potential (Table 1c; Fig. 3). The
slope of the relationship between species richness and area
Table 1 continued
Model
(a) Butterflies:
area, wing
span & niche
breadth
(19 data sets)
(b) Butterflies:
area, wing span,
niche breadth &
connectivity
(15 data sets)
(c) Butterflies: area,
niche breadth &
reproductive
potential
(15 data sets)
(d) Moths: area,
wing span, niche
breadth &
connectivity
(4 data sets)
Likelihood ratio test vs. no area · trait
or connectivity · trait interactions
v2 = 200.1,
d.f. = 15
P < 0.0001
v2 = 50.8,
d.f. = 9
P < 0.0001
v2 = 47.0
d.f. = 9
P < 0.0001
v2 = 11.4,
d.f. = 1
P = 0.0007
AIC, Akaike�s Information Criterion.
Variables tested but not retained in the best-fitting model are denoted with �–�. Area and connectivity are log-transformed. The model
coefficients are for the fixed effects, and variances are for the random effects of dataset included in each best-fitting model. Random
effects of area, connectivity, and traits varied significantly (likelihood ratio tests, P < 0.05) among datasets (see Figs 1–3). The DAIC
values and likelihood ratio tests compare best-fitting models to those without connectivity, area · trait interactions, or connectivity · trait
interactions.
Inte
rcep
t
–10
12
3
Large Small Large Small
–0.2
0.0
0.2
0.4
0.6
Slo
pe
Generalists Specialists
Figure 1 Intercepts and slopes from the best [lowest Akaike�sInformation Criterion (AIC)] generalized linear mixed-effects
models testing the effect of wing span (large or small) and niche
breadth (specialist or generalist) on the response of species
richness to habitat patch area. The box plots refer to the
variability among 19 European and North American butterfly
datasets. A large intercept indicates high species richness within a
particular trait group; slope indicates the magnitude of change in
species richness with increasing patch area within a particular trait
group.
974 E. Ockinger et al. Letter
� 2010 Blackwell Publishing Ltd/CNRS
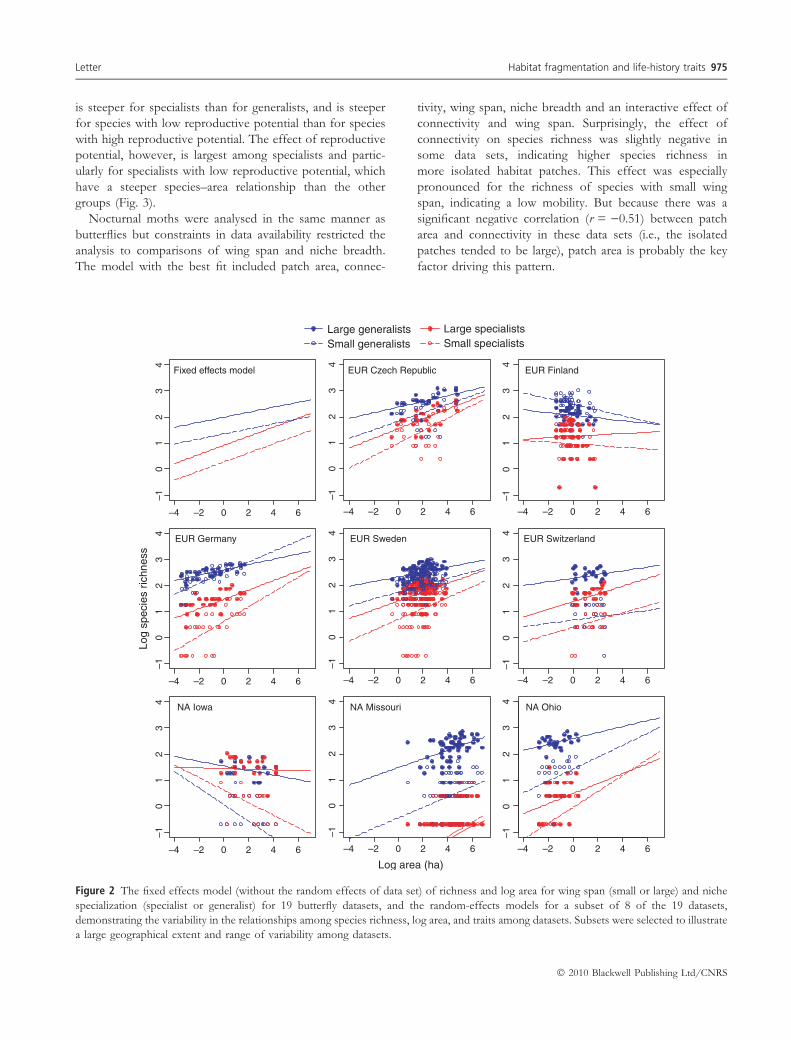
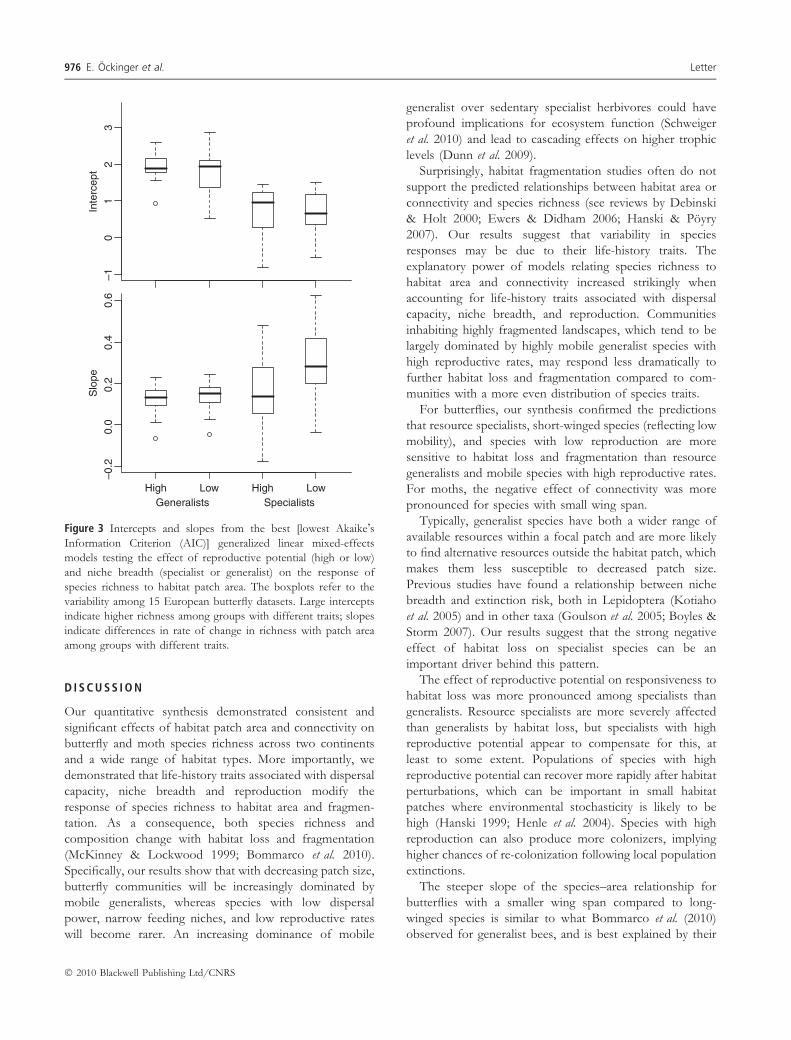
is steeper for specialists than for generalists, and is steeper
for species with low reproductive potential than for species
with high reproductive potential. The effect of reproductive
potential, however, is largest among specialists and partic-
ularly for specialists with low reproductive potential, which
have a steeper species–area relationship than the other
groups (Fig. 3).
Nocturnal moths were analysed in the same manner as
butterflies but constraints in data availability restricted the
analysis to comparisons of wing span and niche breadth.
The model with the best fit included patch area, connec-
tivity, wing span, niche breadth and an interactive effect of
connectivity and wing span. Surprisingly, the effect of
connectivity on species richness was slightly negative in
some data sets, indicating higher species richness in
more isolated habitat patches. This effect was especially
pronounced for the richness of species with small wing
span, indicating a low mobility. But because there was a
significant negative correlation (r = )0.51) between patch
area and connectivity in these data sets (i.e., the isolated
patches tended to be large), patch area is probably the key
factor driving this pattern.
Fixed effects model EUR Czech Republic EUR Finland
EUR Germany EUR Sweden EUR Switzerland
NA Iowa NA Missouri
–4 –2 0 2 4 6
–10
12
34
–4 –2 0 2 4 6
–10
12
34
–4 –2 0 2 4 6–1
01
23
4
–4 –2 0 2 4 6
–10
12
34
–4 –2 0 2 4 6
–10
12
34
–4 –2 0 2 4 6
–10
12
34
–4 –2 0 2 4 6
–10
12
34
–4 –2 0 2 4 6
–10
12
34
–4 –2 0 2 4 6
–10
12
34
NA Ohio
Log area (ha)
Log
spec
ies
richn
ess
Large generalists Small generalists
Large specialistsSmall specialists
Figure 2 The fixed effects model (without the random effects of data set) of richness and log area for wing span (small or large) and niche
specialization (specialist or generalist) for 19 butterfly datasets, and the random-effects models for a subset of 8 of the 19 datasets,
demonstrating the variability in the relationships among species richness, log area, and traits among datasets. Subsets were selected to illustrate
a large geographical extent and range of variability among datasets.
Letter Habitat fragmentation and life-history traits 975
� 2010 Blackwell Publishing Ltd/CNRS
D I S C U S S I O N
Our quantitative synthesis demonstrated consistent and
significant effects of habitat patch area and connectivity on
butterfly and moth species richness across two continents
and a wide range of habitat types. More importantly, we
demonstrated that life-history traits associated with dispersal
capacity, niche breadth and reproduction modify the
response of species richness to habitat area and fragmen-
tation. As a consequence, both species richness and
composition change with habitat loss and fragmentation
(McKinney & Lockwood 1999; Bommarco et al. 2010).
Specifically, our results show that with decreasing patch size,
butterfly communities will be increasingly dominated by
mobile generalists, whereas species with low dispersal
power, narrow feeding niches, and low reproductive rates
will become rarer. An increasing dominance of mobile
generalist over sedentary specialist herbivores could have
profound implications for ecosystem function (Schweiger
et al. 2010) and lead to cascading effects on higher trophic
levels (Dunn et al. 2009).
Surprisingly, habitat fragmentation studies often do not
support the predicted relationships between habitat area or
connectivity and species richness (see reviews by Debinski
& Holt 2000; Ewers & Didham 2006; Hanski & Poyry
2007). Our results suggest that variability in species
responses may be due to their life-history traits. The
explanatory power of models relating species richness to
habitat area and connectivity increased strikingly when
accounting for life-history traits associated with dispersal
capacity, niche breadth, and reproduction. Communities
inhabiting highly fragmented landscapes, which tend to be
largely dominated by highly mobile generalist species with
high reproductive rates, may respond less dramatically to
further habitat loss and fragmentation compared to com-
munities with a more even distribution of species traits.
For butterflies, our synthesis confirmed the predictions
that resource specialists, short-winged species (reflecting low
mobility), and species with low reproduction are more
sensitive to habitat loss and fragmentation than resource
generalists and mobile species with high reproductive rates.
For moths, the negative effect of connectivity was more
pronounced for species with small wing span.
Typically, generalist species have both a wider range of
available resources within a focal patch and are more likely
to find alternative resources outside the habitat patch, which
makes them less susceptible to decreased patch size.
Previous studies have found a relationship between niche
breadth and extinction risk, both in Lepidoptera (Kotiaho
et al. 2005) and in other taxa (Goulson et al. 2005; Boyles &
Storm 2007). Our results suggest that the strong negative
effect of habitat loss on specialist species can be an
important driver behind this pattern.
The effect of reproductive potential on responsiveness to
habitat loss was more pronounced among specialists than
generalists. Resource specialists are more severely affected
than generalists by habitat loss, but specialists with high
reproductive potential appear to compensate for this, at
least to some extent. Populations of species with high
reproductive potential can recover more rapidly after habitat
perturbations, which can be important in small habitat
patches where environmental stochasticity is likely to be
high (Hanski 1999; Henle et al. 2004). Species with high
reproduction can also produce more colonizers, implying
higher chances of re-colonization following local population
extinctions.
The steeper slope of the species–area relationship for
butterflies with a smaller wing span compared to long-
winged species is similar to what Bommarco et al. (2010)
observed for generalist bees, and is best explained by their
Inte
rcep
t–1
01
23
High Low High Low
–0.2
0.0
0.2
0.4
0.6
Slo
pe
Generalists Specialists
Figure 3 Intercepts and slopes from the best [lowest Akaike�sInformation Criterion (AIC)] generalized linear mixed-effects
models testing the effect of reproductive potential (high or low)
and niche breadth (specialist or generalist) on the response of
species richness to habitat patch area. The boxplots refer to the
variability among 15 European butterfly datasets. Large intercepts
indicate higher richness among groups with different traits; slopes
indicate differences in rate of change in richness with patch area
among groups with different traits.
976 E. Ockinger et al. Letter
� 2010 Blackwell Publishing Ltd/CNRS
lower mobility (Nieminen 1996). Poor dispersal capacity
(Lomolino 1984), leading to stronger effective isolation, is
generally predicted to increase the slope of the species–area
relationship (Connor & McCoy 1979). Small habitat patches
can typically harbour only small populations, which are
prone to local extinction. Populations of mobile species,
however, can persist due to immigration from other
populations (Brown & Kodric-Brown 1977) and also have
a higher chance to re-colonize habitat patches following
local extinction (Hanski 1999).
The large variability in both the direction and the strength
of the effect of wing span among data sets could partly be
explained by a nonlinear effect of dispersal capacity on
population persistence (Thomas 2000) and complex trade-
offs with other traits not included in our analysis. Further,
wing span does not only reflect dispersal capacity, but is also
correlated with other life-history traits associated with body
size. Large-bodied species with high energetic needs
generally have lower population densities and thereby are
more sensitive to habitat loss compared to small-bodied
species (Prugh et al. 2008).
Surprisingly, life-history traits modified the response of
species richness to habitat area but not to connectivity.
Several individual studies have found life-history traits, such
as life span (Lindborg 2007), mobility (Ockinger et al. 2009)
and dispersal mode (Tremlova & Munzbergova 2007), to
influence species� response to connectivity. In contrast, the
meta-analysis by Prugh et al. (2008) did not show interactive
effects of life-history traits and connectivity across species.
The potential effects of species traits can be masked, if there
are high levels of heterogeneity in the effects of connectivity
among data sets due to the landscape matrix (Brotons et al.
2003) or fragmentation history (Kuussaari et al. 2009). The
negative response of nocturnal moths to increasing con-
nectivity can, to a large extent, be explained by the negative
correlation between area and connectivity in the moth data
sets. In the studies we examined, isolated habitat patches
had more species because these patches were large. Over-
sampling of species from matrix habitats by light traps in
highly fragmented landscapes (Summerville & Crist 2004),
or a negative correlation between habitat quality and
connectivity, are other potential mechanisms that could
contribute to this unexpected pattern.
The observed differences between butterflies and moths
could represent differences in the life histories between the
two groups. The most obvious difference is that moths are
nocturnal and mainly rely on olfactory cues to navigate
through the landscape, whereas butterflies are assumed to
use visual cues to a much larger extent (c.f. Hamback et al.
2007). But because butterflies were mainly sampled in
grassland habitats and moths mainly in forest habitats, and
by means of different methods (transect and plot counts vs.
traps) in the studies included in our analysis, we cannot
separate the effect of habitat type from that between diurnal
and nocturnal Lepidoptera or between sampling methods.
Species with different traits could differ in detectability. This
could be a potential problem in some studies, but only if the
species characteristics that influence detectability depend on
habitat area or connectivity. And even if such a bias exists
for some of our studies, our main conclusions would only
be affected when this bias was similar across all studies. We
find this quite unlikely and the large variance among the
intercepts and slopes of the trait-habitat relations (Fig. 2),
even having different signs, indicates that there is no such
systematic bias.
The variability in the impact of species traits on their
response to fragmentation (Fig. 2) highlights the importance
of meta-analyses and quantitative syntheses to understand
the consequences of global change. By including primary
data from multiple studies from different geographical
regions and habitat types on two continents, we can make
general predictions about species distributions in changing
landscapes. In our synthesis, we demonstrate that even
though there are some general patterns in species� responses
to habitat loss and fragmentation, these are largely contin-
gent upon life-history traits associated with dispersal, niche
breadth and reproduction. As a result, the remnant
communities in highly fragmented landscapes will be
dominated by a few mobile, generalist species. Because
mobile generalists are also more likely to be able to cope
with the ongoing climate change (Schweiger et al. 2010),
the combined pressures of habitat fragmentation and
climate change (Travis 2003) are likely to lead to increa-
sing global biotic homogenization (McKinney & Lockwood
1999) on one hand, and will have serious consequences
for the function and resilience of ecosystems (Potts et al.
2010).
A C K N O W L E D G E M E N T S
We thank K.-O. Bergman, M. Franzen, T. Kadlec &
M. Konvicka, M. Nieminen, J. Roland, B. Schmid &
A. Swengel for kindly giving us access to unpublished data.
We also thank Lyubomir Penev for organizing the work-
shop that formed the basis of this work. This study was
funded by the 6th framework EU-project �COCONUT –
Understanding effects of land use changes on ecosystems to
halt loss of biodiversity� (SSPI-CT-2006-044346).
R E F E R E N C E S
Bates, D. & Mechler, M. (2008). Linear Mixed Effects Models
Using S4 Classes, Ver 0.999375-27. University of Wisconsin,
Madison. Available at: http://lme4.r-forge.r-project.org.
Bink, F.A. (1992). Ecologische Atlas van de Dagvlinders van Noordwest-
Europa. Schuyt & Co Uitgevers en Importeurs, Haarlem.
Letter Habitat fragmentation and life-history traits 977
� 2010 Blackwell Publishing Ltd/CNRS
Bolker, B.M., Brooks, M.E., Clark, C.J., Geange, S.W., Poulsen,
J.R., Stevens, M.H.H. et al. (2009). Generalized linear mixed
models: a practical guide for ecology and evolution. Trends Ecol.
Evol., 24, 127–135.
Bommarco, R., Biesmeijer, J.J., Meyer, B., Potts, S.G., Poyry, J.,
Roberts, S.P.M. et al. (2010). Dispersal capacity and diet breadth
modify the response of wild bees to habitat loss. Proc. R. Soc. B,
in press.
Boyles, J.G. & Storm, J.J. (2007). The perils of picky eating: dietary
breadth is related to extinction risk in insectivorous bats. PLoS
ONE, 2, e672.
Brotons, L., Monkkonen, M. & Martin, J.L. (2003). Are fragments
islands? Landscape context and density-area relationships in
boreal forest birds Am. Nat., 162, 343–357.
Brown, J.H. & Kodric-Brown, A. (1977). Turnover rates in insular
biogeography: effect of immigration on extinction. Ecology, 58,
445–449.
Burnham, K.P. & Anderson, D.R. 2002. Model Selection and Multi-
Model Inference. Springer Verlag, Berlin.
Connor, E.F. & McCoy, E.D. (1979). The statistics and biology of
the species-area relationship. Am. Nat., 133, 791–833.
Debinski, D.M. & Holt, R.D. (2000). A survey and overview of
habitat fragmentation experiments. Conserv. Biol., 14, 342–355.
Dennis, R.L.H. & Shreeve, T.G. (1997). Diversity of butterflies on
British islands: ecological influences underlying the roles of area,
isolation and the size of the faunal source. Biol. J. Linn. Soc., 60,
257–275.
Dormann, C.F., Schweiger, O., Augenstein, I., Bailey, D., Billeter,
R., de Blust, G. et al. (2007). Effects of landscape structure and
land-use intensity on similarity of plant and animal communities.
Global Ecol. Biogeogr., 16, 774–787.
Dover, J. & Settele, J. (2009). The influences of landscape structure
on butterfly distribution and movement: a review. J. Insect Con-
serv., 13, 3–27.
Dunn, R.R., Nyeema, C.H., Colwell, R.K., Koh, L.P. & Sodhi, N.S.
(2009). The sixth mass coextinction: are most endangered
species parasites and mutualists? Proc. R. Soc. B., 276, 3037–
3045.
Ekroos, J., Heliola, J. & Kuussaari, M. (2010). Homogenization of
lepidopteran communities in intensively cultivated agricultural
landscapes. J. Appl. Ecol., 47, 459–467.
Ewers, R.M. & Didham, R.K. (2006). Confounding factors in the
detection of species responses to habitat fragmentation. Biol.
Rev., 81, 117–142.
Fahrig, L. (2003). Effects of habitat fragmentation on biodiversity.
Annu. Rev. Ecol. Evol. Syst., 34, 487–515.
Gelman, A. & Hill, J. (2006). Data Analysis Using Regression and
Multilevel ⁄ Hierarchical Models. Cambridge University Press,
Cambridge.
Goulson, D., Hanley, M.E., Darvill, B., Ellis, J.S. & Knight,
M.E. (2005). Causes of rarity in bumblebees. Biol. Conserv., 122,
1–8.
Greeleaf, S.S., Williams, N.M., Winfree, R. & Kremen, C. (2007).
Bee foraging ranges and their relationship to body size. Oecologia,
153, 589–596.
Hamback, P.A., Summerville, K.S., Steffan-Dewenter, I., Krauss, J.,
Englund, G. & Crist, T.O. (2007). Habitat specialization, body
size, and family identity explain Lepidopteran density–area
relationships in a cross-continental comparison. Proc. Natl. Acad.
Sci. USA, 104, 8368–8373.
Hanski, I. (1999). Metapopulation Ecology. Oxford University Press,
Oxford.
Hanski, I. & Ovaskainen, O. (2000). The metapopulation capacity
of a fragmented landscape. Nature, 404, 755–758.
Hanski, I. & Poyry, J. (2007). Insect populations in fragmented
habitats. In: Insect Conservation Biology (eds Stewart, A.J.A., New,
T.R. & Lewis, O.T.). CABI, Wallingford, pp. 175–202.
Henle, K., Davies, K.F., Kleyer, M., Margules, C. & Settele, J.
(2004). Predictors of species sensitivity to fragmentation. Bio-
divers. Conserv., 13, 207–251.
Koh, L.-P., Sodhi, N.S. & Brook, B.W. (2004). Ecological corre-
lates of extinction proneness in tropical butterflies. Conserv. Biol.,
18, 1571–1578.
Kotiaho, J.S., Kaitala, V., Komonen, A. & Paivinen, J. (2005).
Predicting the risk of extinction from shared ecological charac-
teristics. Proc. Natl. Acad. Sci. USA, 102, 1963–1967.
Kuussaari, M, Bommarco, R., Heikkinen, R.K., Helm, A., Krauss,
J., Lindborg, R. et al. (2009). Extinction debt: a challenge for
biodiversity conservation. Trends Ecol. Evol., 24, 564–571.
Lindborg, R. (2007). Evaluating the distribution of plant life-
history traits in relation to current and historical landscape
configurations. J. Ecol., 95, 555–564.
Lomolino, M.V. (1984). Mammalian island biogeography: effects of
area, isolation and vagility. Oecologia, 61, 376–382.
MacArthur, R.H. & Wilson, E.O. (1967). The Theory of Island Bio-
geography. Princeton University Press, Princeton.
Mattila, N., Kaitala, V., Komonen, A., Kotiaho, J.S. & Paivinen, J.
(2006). Ecological determinants of distribution decline and risk
of extinction in moths. Conserv. Biol., 20, 1161–1168.
McKinney, M.L. & Lockwood, J.L. (1999). Biotic homogenization:
a few winners replacing many losers in the next mass extinction.
Trends Ecol. Evol., 14, 450–453.
Moilanen, A. & Nieminen, M. (2002). Simple connectivity mea-
sures in spatial ecology. Ecology, 83, 1131–1145.
Nieminen, M. (1996). Migration of moth species in a network of
small islands. Oecologia, 108, 643–651.
Ockinger, E., Franzen, M., Rundlof, M. & Smith, H.G. (2009).
Mobility-dependent effects on species richness in fragmented
landscapes. Basic Appl. Ecol., 10, 573–578.
Pinhero, J. & Bates, D.M. (2000). Mixed-Effects Models in S and
S-PLUS. Springer Verlag, New York.
Potts, S.G., Biesmeijer, J.C., Kremen, C., Neumann, P., Schweiger,
O. & Kunin, W.E. (2010). Global pollinator declines: drivers and
impacts. Trends Ecol. Evol., in press, DOI: 10.1016/j.tree.
2010.01.007.
Prugh, L.R., Hodges, K.E., Sinclair, A.R.E. & Brashares, J.S.
(2008). Effect of habitat area and isolation on fragmented
animal populations. Proc. Natl. Acad. Sci. USA, 105, 20770–
20775.
R Development Core Team (2008). The R foundation for Statistical
Computing, ver 2.8. Vienna University of Technology, Vienna.
Available at: http://www.r-project.org/.
Schweiger, O., Biesmeijer, J.C., Bommarco, R., Hickler, T., Hulme,
P.E., Klotz, S. et al. (2010). Multiple stressors on biotic inter-
actions: how climate change and alien species interact to affect
pollination. Biol. Rev., in press. DOI:10.1111/j.1469-185X.2010.
00125.x.
Summerville, K.S. & Crist, T.O. (2001). Effects of experimental
habitat fragmentation on patch use by butterflies and skippers
(Lepidoptera). Ecology, 82, 1360–1370.
978 E. Ockinger et al. Letter
� 2010 Blackwell Publishing Ltd/CNRS
Summerville, K.S. & Crist, T.O. (2004). Contrasting effects of
habitat quantity and quality on moth communities in fragmented
landscapes. Ecography, 27, 3–12.
Thomas, C.D. (2000). Dispersal and extinction in fragmented
landscapes. Proc. R. Soc. Lond. B, 267, 139–145.
Thomas, J.A. (2005). Monitoring change in the abundance and
distribution of insects using butterflies and other indicator
groups. Phil. Trans. R. Soc. B., 360, 339–357.
Thomas, C.D. & Hanski, I. (2004). Metapopulation dynamics in
changing environments: butterfly responses to habitat and cli-
mate change. In: Ecology, Genetics and Evolution of Metapopulations
(eds Hanski, I. & Gaggiotti, O.E.). Elsevier Academic Press,
Amsterdam, pp. 489–514.
Travis, J.M.J. (2003). Climate change and habitat destruction: a
deadly anthropogenic cocktail. Proc. R. Soc. Lond. B, 270, 467–
473.
Tremlova, K. & Munzbergova, Z. (2007). Importance of species
traits for species distributions in fragmented landscapes. Ecology,
88, 965–977.
Winfree, R., Dushoff, J., Crone, E.E., Schultz, C.B., Budny, R.V.,
Williams, N.M. et al. (2005). Testing simple indices of habitat
proximity. Am. Nat., 165, 707–717.
With, K.A. & Crist, T.O. (1995). Critical thresholds in species�responses to landscape structure. Ecology, 76, 2446–2459.
S U P P O R T I N G I N F O R M A T I O N
Additional Supporting Information may be found in the
online version of this article:
Table S1 Best-fitting and alternative generalized linear
mixed-effects models.
Appendix S1 Studies included in the analyses.
Appendix S2 References to sources of information on life-
history traits.
As a service to our authors and readers, this journal provides
supporting information supplied by the authors. Such
materials are peer-reviewed and may be re-organized for
online delivery, but are not copy-edited or typeset. Technical
support issues arising from supporting information (other
than missing files) should be addressed to the authors.
Editor, Fangliang He
Manuscript received 5 January 2010
First decision made 12 February 2010
Manuscript accepted 29 March 2010
Letter Habitat fragmentation and life-history traits 979
� 2010 Blackwell Publishing Ltd/CNRS
Related Documents