Life Satisfaction Shows Terminal Decline in Old Age: Longitudinal Evidence From the German Socio-Economic Panel Study (SOEP) Denis Gerstorf and Nilam Ram Pennsylvania State University and Max Planck Institute for Human Development Ryne Estabrook University of Virginia Ju ¨rgen Schupp DIW Berlin (German Institute for Economic Research) and Free University of Berlin Gert G. Wagner DIW Berlin (German Institute for Economic Research) and Berlin University of Technology Ulman Lindenberger Max Planck Institute for Human Development Longitudinal data spanning 22 years, obtained from deceased participants of the German Socio- Economic Panel Study (SOEP; N 1,637; 70- to 100-year-olds), were used to examine if and how life satisfaction exhibits terminal decline at the end of life. Changes in life satisfaction were more strongly associated with distance to death than with distance from birth (chronological age). Multiphase growth models were used to identify a transition point about 4 years prior to death where the prototypical rate of decline in life satisfaction tripled from 0.64 to 1.94 T-score units per year. Further individual-level analyses suggest that individuals dying at older ages spend more years in the terminal periods of life satisfaction decline than individuals dying at earlier ages. Overall, the evidence suggests that late-life changes in aspects of well-being are driven by mortality-related mechanisms and characterized by terminal decline. Keywords: selective mortality, successful aging, multiphase growth models, psychosocial factors, well- being Lifespan psychological and gerontological researchers have long been interested in phenomena of terminal decline (Birren & Cunningham, 1985; Busse, 1969; Kleemeier, 1962; Palmore & Cleveland, 1976; Riegel & Riegel, 1972; Siegler, 1975). The general notion is that at some point shortly before death, individ- uals’ functioning declines quite rapidly. In various cognitive do- mains, evidence is building that late-life changes in function are marked by pronounced deteriorations proximate to death (for review, see Ba ¨ckman & MacDonald, 2006). Only recently, how- ever, have researchers begun to examine how notions of terminal decline may apply to other aspects of psychological function such as well-being (Gerstorf, Ram, Ro ¨cke, Lindenberger, & Smith, 2008; Mroczek & Spiro, 2005). The present study uses 22-year longitudinal data from the nationally representative German Socio- Economic Panel Study to examine questions about terminal de- cline in old age in life satisfaction, a key component of well-being. Specifically, we (a) examine whether changes in life satisfaction that occur in old age are better characterized as age-related or mortality-related processes, (b) use multiphase growth models to articulate and test notions of terminal decline, and (c) explore whether the onset of terminal decline may differ with age at death, sex, and education. An accumulating body of empirical evidence suggests that low levels of functioning and pronounced decline on a number of psychosocial factors, including cognitive functioning and well- being, are predictive of subsequent mortality (e.g., Bosworth & Schaie, 1999; Danner, Snowdon, & Friesen, 2001; Ghisletta, McArdle, & Lindenberger, 2006; Levy, Slade, Kunkel, & Kasl, Denis Gerstorf and Nilam Ram, Department of Human Development and Family Studies, Pennsylvania State University, and Max Planck Insti- tute for Human Development, Berlin, Germany; Ryne Estabrook, Depart- ment of Psychology, University of Virginia; Ju ¨rgen Schupp, German Socio-Economic Panel Study, DIW Berlin (German Institute for Economic Research), Berlin, Germany, and Free University of Berlin, Berlin, Ger- many; Gert G. Wagner, German Socio-Economic Panel Study, DIW Berlin (German Institute for Economic Research) and Berlin University of Tech- nology, Berlin, Germany; Ulman Lindenberger, Max Planck Institute for Human Development. Parts of this article were prepared while Denis Gerstorf was at the Department of Psychology, University of Virginia, on a research fellow- ship awarded by the German Research Foundation. This research was supported in part by National Institute on Aging T32 Grant AG20500-01 to Ryne Estabrook and Bundesministerium fu ¨r Bildung und Forschung (Ger- many) Grant DIW001 to Ju ¨rgen Schupp and Gert G. Wagner. The German Socio-Economic Panel Study is financed by the Wissenschaftsgemein- schaft Gottfried Wilhelm Leibniz. Correspondence concerning this article should be addressed to Denis Gerstorf, Department of Human Development and Family Studies, Penn- sylvania State University, 118 Henderson Building, University Park, PA 16802. E-mail: [email protected] Developmental Psychology Copyright 2008 by the American Psychological Association 2008, Vol. 44, No. 4, 1148 –1159 0012-1649/08/$12.00 DOI: 10.1037/0012-1649.44.4.1148 1148

Welcome message from author
This document is posted to help you gain knowledge. Please leave a comment to let me know what you think about it! Share it to your friends and learn new things together.
Transcript
Life Satisfaction Shows Terminal Decline in Old Age: LongitudinalEvidence From the German Socio-Economic Panel Study (SOEP)
Denis Gerstorf and Nilam RamPennsylvania State University and Max Planck Institute for
Human Development
Ryne EstabrookUniversity of Virginia
Jurgen SchuppDIW Berlin (German Institute for Economic Research) and Free
University of Berlin
Gert G. WagnerDIW Berlin (German Institute for Economic Research) and
Berlin University of Technology
Ulman LindenbergerMax Planck Institute for Human Development
Longitudinal data spanning 22 years, obtained from deceased participants of the German Socio-Economic Panel Study (SOEP; N � 1,637; 70- to 100-year-olds), were used to examine if and how lifesatisfaction exhibits terminal decline at the end of life. Changes in life satisfaction were more stronglyassociated with distance to death than with distance from birth (chronological age). Multiphase growthmodels were used to identify a transition point about 4 years prior to death where the prototypical rateof decline in life satisfaction tripled from �0.64 to �1.94 T-score units per year. Further individual-levelanalyses suggest that individuals dying at older ages spend more years in the terminal periods of lifesatisfaction decline than individuals dying at earlier ages. Overall, the evidence suggests that late-lifechanges in aspects of well-being are driven by mortality-related mechanisms and characterized byterminal decline.
Keywords: selective mortality, successful aging, multiphase growth models, psychosocial factors, well-being
Lifespan psychological and gerontological researchers havelong been interested in phenomena of terminal decline (Birren &Cunningham, 1985; Busse, 1969; Kleemeier, 1962; Palmore &
Cleveland, 1976; Riegel & Riegel, 1972; Siegler, 1975). Thegeneral notion is that at some point shortly before death, individ-uals’ functioning declines quite rapidly. In various cognitive do-mains, evidence is building that late-life changes in function aremarked by pronounced deteriorations proximate to death (forreview, see Backman & MacDonald, 2006). Only recently, how-ever, have researchers begun to examine how notions of terminaldecline may apply to other aspects of psychological function suchas well-being (Gerstorf, Ram, Rocke, Lindenberger, & Smith,2008; Mroczek & Spiro, 2005). The present study uses 22-yearlongitudinal data from the nationally representative German Socio-Economic Panel Study to examine questions about terminal de-cline in old age in life satisfaction, a key component of well-being.Specifically, we (a) examine whether changes in life satisfactionthat occur in old age are better characterized as age-related ormortality-related processes, (b) use multiphase growth models toarticulate and test notions of terminal decline, and (c) explorewhether the onset of terminal decline may differ with age at death,sex, and education.
An accumulating body of empirical evidence suggests that lowlevels of functioning and pronounced decline on a number ofpsychosocial factors, including cognitive functioning and well-being, are predictive of subsequent mortality (e.g., Bosworth &Schaie, 1999; Danner, Snowdon, & Friesen, 2001; Ghisletta,McArdle, & Lindenberger, 2006; Levy, Slade, Kunkel, & Kasl,
Denis Gerstorf and Nilam Ram, Department of Human Developmentand Family Studies, Pennsylvania State University, and Max Planck Insti-tute for Human Development, Berlin, Germany; Ryne Estabrook, Depart-ment of Psychology, University of Virginia; Jurgen Schupp, GermanSocio-Economic Panel Study, DIW Berlin (German Institute for EconomicResearch), Berlin, Germany, and Free University of Berlin, Berlin, Ger-many; Gert G. Wagner, German Socio-Economic Panel Study, DIW Berlin(German Institute for Economic Research) and Berlin University of Tech-nology, Berlin, Germany; Ulman Lindenberger, Max Planck Institute forHuman Development.
Parts of this article were prepared while Denis Gerstorf was at theDepartment of Psychology, University of Virginia, on a research fellow-ship awarded by the German Research Foundation. This research wassupported in part by National Institute on Aging T32 Grant AG20500-01 toRyne Estabrook and Bundesministerium fur Bildung und Forschung (Ger-many) Grant DIW001 to Jurgen Schupp and Gert G. Wagner. The GermanSocio-Economic Panel Study is financed by the Wissenschaftsgemein-schaft Gottfried Wilhelm Leibniz.
Correspondence concerning this article should be addressed to DenisGerstorf, Department of Human Development and Family Studies, Penn-sylvania State University, 118 Henderson Building, University Park, PA16802. E-mail: [email protected]
Developmental Psychology Copyright 2008 by the American Psychological Association2008, Vol. 44, No. 4, 1148–1159 0012-1649/08/$12.00 DOI: 10.1037/0012-1649.44.4.1148
1148
2002; Maier & Smith, 1999; White & Cunningham, 1988). Whenviewed next to evidence that well-being remains relatively stablethroughout adulthood and old age (Diener, Lucas, & Scollon,2006; Kunzmann, Little, & Smith, 2000; Mroczek & Kolarz,1998), unique associations between well-being and mortality seemparadoxical. One interpretation is that late-life changes in well-being may primarily be driven by mortality-related processesrather than normative age-related processes. The underlying idea isthat individuals typically have enough resources to maintain asense of well-being even as they face increased risks for losses inthe social and health domains. As death approaches, however,individuals are faced with additional mortality-related burdens thatmake it increasingly difficult to maintain well-being—and thesystem collapses. If this speculation is true, intraindividualchanges in well-being that occur in the last years of life would bemore closely associated to distance to death rather than distancefrom birth (i.e., chronological age).
Notions of terminal decline, as most often presented in thecognitive domain (for review, see Backman & MacDonald, 2006),predict a multiphase sequence of change. Individuals transitionfrom a preterminal phase of normative gradual decline in func-tionality to a terminal phase of pronounced decline when theburdens of an approaching death begin to overwhelm a limitedpool of resources (Kleemeier, 1962; Sliwinski et al., 2006; Thor-valddon, Hofer, & Johansson, 2006). Recently, empirical investi-gations of terminal decline phenomena have taken advantage ofmethodological innovations that allow fitting of growth curvemodels that articulate with specificity if and how intraindividualchanges are characterized by multiple phases of change (for dis-cussion of multiphase growth models, see Cudeck & Harring,2007; Cudeck & Klebe, 2002; Hall, Lipton, Sliwinski, & Stewart,2000; Ram & Grimm, 2007). In the cognitive domain, for exam-ple, multiphase growth models have been used to identify multiplephases of mortality-related decline in perceptual speed and mem-ory (Sliwinski et al., 2006; Wilson, Beck, Bienias, & Bennett,2007; Wilson, Beckett, Bienias, Evans, & Bennett, 2003). Extend-ing the approach to aspects of well-being, Gerstorf et al. (2008)provided initial evidence that late-life intraindividual changes inlife satisfaction are also characterized by terminal decline trajec-tories. More specifically, terminal-decline representations ofchange, characterized by a multiphase model with a discrete shiftto a twofold increase in steepness of decline at about 4 (� 2.5)years prior to death, were found to provide for more efficientdescriptions of the data than did linear representations over bothchronological age and distance to death. In the absence of otherstudies on terminal decline of life satisfaction, the purpose of thepresent study is to further describe the phenomena and to replicateand extend those initial findings.
The terminal decline hypothesis makes specific predictions thatintraindividual changes can be structured along a transition from apreterminal phase of normative gradual decline into a terminalphase of pronounced decline shortly before death. However, thetheory on terminal decline, in our reading, has remained vagueabout when the transition to terminal decline should typicallyoccur (e.g., Kleemeier, 1962; Palmore & Cleveland, 1976; Riegel& Riegel, 1972; Siegler, 1975). The limited evidence from studiesof terminal decline in cognition and life satisfaction has locatedtransition points in a window ranging from 2 to 6 years (Gerstorfet al., 2008; Wilson et al., 2003, 2007) or even 8 years (Sliwinski
et al., 2006) prior to death. The present study contributes to thisexploration. Using a nationally representative sample and mul-tiphase growth models where the point of transition is estimateddirectly from the data, we examined when in relation to death aterminal phase of decline in life satisfaction may begin.
It is largely an open question whether men and women orindividuals who die at earlier ages versus later ages experience thelast years of life differently. Consistent with the view that self-protective processes become increasingly vulnerable as individualsget older (Baltes & Smith, 2003), there is some evidence to suggeststeeper mortality-related declines with greater age of death (Back-man & MacDonald, 2006; Gerstorf et al., 2008). It also appearsthat individual difference characteristics such as high educationalattainment, low comorbidities, and preserved cognitive function-ing may provide protective resources against late-life functionaldecline. However, Gerstorf et al. (2008) reported that all of thesewell-established mortality predictors accounted for only a verysmall portion of interindividual differences in terminal change inlife satisfaction. The present study reexamines such relationshipsin the context of participants drawn from a nationally representa-tive study. Specifically, we note if and how age at death, sex, andeducation are associated with individual differences in mortality-related life satisfaction changes. Although we do not have specifichypotheses as to potential sex and education differences, we expectthat impending mortality has more detrimental effects on function-ality at older ages.
To summarize, the present study attempts to replicate and ex-tend recent findings on mortality-related changes in life satisfac-tion in old age. We (a) determine whether mortality-related (dis-tance to death) models of late-life changes in life satisfactionprovide better representations of the observed changes in old agethan do age-related models; (b) use multiphase growth models toarticulate terminal decline hypotheses and derive an empiricallybased location for the transition into terminal decline of lifesatisfaction; and (c) examine if and how the changes in lifesatisfaction that occur at the end of life differ with age at death,sex, and education.
Method
Growth curve models were fitted to 22 waves of yearly (1984–2005) longitudinal data from now-deceased, 70- to 100-year-oldparticipants (N � 1,637) in the German Socio-Economic PanelStudy (SOEP) to examine intraindividual change in life satisfac-tion as a function of age or distance to death. Descriptions of thelarger SOEP study and its design, participants, variables, andassessment procedures can be found in Haisken-De New and Frick(2006) and Wagner, Frick, and Schupp (2007). Select detailsrelevant to the present study are given below.
Sample and Participant Selection
The SOEP is a nationally representative longitudinal annualpanel study of private households and individuals. In total, theSOEP data currently span 22 years, 1984–2005, and have a par-ticipant base of roughly 22,000 persons, including residents offormer West and East Germany, immigrants, and resident foreign-ers. When recruited in 1984, 1990, 1995, 1998, 2000, or 2002,participants were drawn at random from a set of randomly selected
1149TERMINAL DECLINE IN LIFE SATISFACTION IN OLD AGE
locations within Germany. Response rates were sufficiently high(between 60% and 70%) that the demographic characteristics ofthe total sample are representative of the wider population living inprivate households of Germany (Haisken-De New & Frick, 2006).Longitudinal attrition has been relatively low (4%–14% yearlyattrition across various subsamples), in part due to small rewardsfor continued participation (e.g., information about results) andefforts to maintain regular contact with participants, includingthose who had missed one or more of the yearly assessments. Forexample, for those who started in 1984 the overall retention rateover 22 years was still at about 43% (for details, see Kroh &Spie�, 2006). Data were collected via face-to-face interviews or,for about 10% of respondents who had already participated mul-tiple times, via self-administered questionnaires.
For the purposes of the present gerontologically oriented study,we used data collected from 1,637 participants (727 men, 910women) who (a) were age 70 or older at one or more assessmentsand (b) have since died. Specifically, of the total �22,000 SOEPparticipants, 3,519 individuals (�16%) provided data points afterage 70. Of these, we selected for our analyses participants whosedeath prior to 2005 had been verified. These 1,637 select partici-pants (decedents) were born between 1888 and 1935 and died, onaverage, 81.82 years later (SD � 6.54; range: 71–101 years). Theyparticipated in an average of 7.61 (SD � 5.68) annual surveys withn � 980 or 60% contributing five or more data points. On average,deaths occurred 9.34 years (SD � 5.63; range: 1–22 years) after theirinitial assessment and 1.73 years (SD � 2.13; range: 0–15 years) afterthe last assessment in which they took part. Participants contributed atotal of 10,162 observation points that simultaneously span the 70- to100-year-old age range (M � 78.20, SD � 5.88) and the correspond-ing 22–0 years (M � 5.58, SD � 3.99) prior to death.
Measures
Life satisfaction. As part of the yearly and primarily economicsurvey, individuals responded to the question, “Wie zufrieden sindSie gegenwartig, alles in allem, mit ihrem Leben?” (“How satisfiedare you with your life, all things considered?”) on a 0 (totallyunsatisfied) to 10 (totally satisfied) scale. As a reflection about lifeas a whole, answers are taken as an indication of life satisfaction(cf. Fujita & Diener, 2005) and considered an assessment ofcognitive– evaluative (rather than emotional) aspects of well-being.1 Life satisfaction scores were, on average, 6.66 (SD � 2.31;range � 0–10), indicating that on the vast majority of occasions(8,669 of 10,162; 85%) the older and now deceased participants inthe present study reported their life satisfaction to be at or aboveneutral. We standardized life satisfaction scores to a T metric (M� 50, SD � 10) using the entire SOEP longitudinal sample as thereference frame (M � 7.02, SD � 1.55; see Lucas, Clark, Georgel-lis, & Diener, 2003). For comparison, a neutral response on theoriginal 11-point Likert-type scale would equal 37 on our T-unitscale. Further details of the life satisfaction item as used in theSOEP and its measurement properties can be found in Fujita andDiener (2005), Kroh (2006), Schimmack, Schupp, and Wagner (inpress), and Schilling (2006).
Time metrics of age and distance to death. Age at each assess-ment wave was taken as the number of years since an individual’sbirth (centered at 85 years). Mortality status and year of death fordeceased participants was obtained either (a) by interviewers at the
yearly assessments (i.e., from household members or, in the caseof one-person households, neighbors) or (b) from city registriesand other authorities (comprehensive database information wasobtained most recently in 2001; see Infratest Sozialforschung,2002). Comparisons of death rates and ages of death in the SOEPwith those obtained from official life tables suggest that the sampleis representative of German adult mortality. Similarly and in linewith other reports (Rendtel, 1995; Schrapler, 2004), substitutinginterviewers over time or other field-related circumstances werefound to be by far the more important predictors of nonresponse ordropout compared with age-related selectivity. The longitudinalsample can thus be considered unbiased with respect to age andserves as a widely accepted basis for mortality analyses in Ger-many (e. g., Brockmann & Klein, 2004; Burkhauser, Giles, Lillard,& Schwarze, 2005). For data protection reasons, the timing ofindividual deaths was recorded by year (rather than by day andmonth). Distance to death (DtD) was calculated post hoc as thedifference between the date of the assessment and the participant’sdeath year. Additional demographic variables include age at death,sex, and years of formal education.
Data Analysis and Structure
To address our research questions, we evaluated and comparedrelative fits of single and multiphase growth models of changes inlife satisfaction across age and distance-to-death time dimensions.In follow-up analyses, we explored interindividual differences interminal decline with respect to individual difference characteris-tics including age at death, sex, and education.
Age-related versus mortality-related and linear versus mul-tiphase representations of change. The main analytic task was todetermine which time dimension, age or distance-to-death, pro-vided for a better representation of the observed longitudinalchanges in life satisfaction. Two sets of growth curve (i.e., multi-level) models were used to model interindividual differences inchange over time (McArdle & Nesselroade, 2003; Singer & Wil-lett, 2003). In the first set of models, age was used as the timemetric, effectively modeling interindividual differences in howeach individual’s life satisfaction changed from age 70 to age 100.In the second set of models, distance-to-death was used as the timemetric, modeling how life satisfaction changed in relation to im-pending mortality (i.e., over the 22 years approaching death).Within each model set, linear and multiphase representations ofintraindividual change were fitted, the former being used to rep-resent continuous trajectories and the latter to represent discreteshifts in the rate of change that occur at a specific age or distance todeath. Comparing the relative fit of these models, we determined thetime metric and type of trajectory that best described the data.
The linear model was specified as
lsit � b0i � b1i(timeit) � eit, (1)
1 Note that studies of age-related changes in well-being have eitherfocused on emotional aspects of well-being (e.g., positive and negativeaffect; Charles et al., 2001; Mroczek & Kolarz, 1998), cognitive-evaluativeaspects (e.g., Gerstorf, Lovden, Rocke, Smith, & Lindenberger, 2007), orboth emotional and cognitive aspects (e.g., Lucas & Gohm, 2000). Due toconstraints of the data, we examined only cognitive-evaluative aspects. Itwould be instructive to examine whether more emotion-based measures ofwell-being would yield similar results to those reported in this study.
1150 GERSTORF ET AL.
where person i’s reported life satisfaction at time t, lsit, is afunction of an individual-specific intercept parameter, b0i, anindividual-specific slope parameter, b1i, that captures the rate ofchange over the selected time dimension (age or distance to death),and residual error, eit. Following standard multilevel or latentgrowth modeling procedures (see Ram & Grimm, 2007; Rauden-bush & Bryk, 2002; Singer & Willett, 2003), individual-specificintercepts, b0i, and linear slopes, b1i (from the Level 1 model givenin Equation 1), were modeled as
b0i � a00 � u0i, and
b1i � a01 � u1i, (1a)
(i.e., Level 2 model) where a00 and a01 are sample means and u0i
and u1i are individual deviations from those means. These inter-individual differences are assumed to be normally distributed,correlated with each other, and uncorrelated with the residualerrors, eit.
The multiphase model extended the linear model to include asecond slope parameter, b2i, and a point of transition or changepoint, k (see also Cudeck & Harring, 2007; Cudeck & Klebe, 2002;Singer & Willett, 2003). The model was specified as
lsit � b0i � b1i(timeit– k) � eit, when timeit � k, and
lsit � b0i � b2i(timeit– k) � eit, when timeit � k, (2)
where individual-specific rates of change before the transition orchange point k (e.g., preterminal phase) are captured by b1i, andindividual-specific rates of change falling after the change point(e.g., terminal phase) are captured by b2i. The point of transitionfrom one phase to the other, k, is a free (fixed-effect) parameterestimated from the data, with b0i capturing the estimated level oflife satisfaction at this point in time. As in the linear model,interindividual differences were modeled using Level 2 equationswhere u0i, u1i, and u2i are assumed to be normally distributed,correlated with each other, and uncorrelated with the residualerrors, eit. Models were fit to the data using SAS (Proc Mixed andProc NLMixed; Littell, Miliken, Stoup, & Wolfinger, 1996). Ofinterest was (a) whether age or distance-to-death models providedfor a better representation of the data; and (b) whether there wasevidence for multiple phases of decline (i.e., better overall fit to thedata for the multiphase models relative to the linear models) and atwhat age or distance to death the transition between phases (i.e.,the change point, k) might occur.
Interindividual differences. One constraint of the multiphasemodel given above is that the change-point, k, is fixed (assumed)to be the same for all individuals. Theoretically, however, individ-uals may transition into the terminal-decline phase at differenttimes, some individuals 2 years before death, some 4 years beforedeath, etc. (cf. Baltes & Smith, 2003). As an initial exploration intowhether such interindividual differences in the onset of terminaldecline can be identified, an expanded model was fit to a subset ofthe data (i.e., the n � 400 participants providing the most longi-tudinal data, �12� observations). Specifically, k was reconcep-tualized as a random effect, ki, in the within-person Level 1 model,
lsit � b0i � b1i(timeit– ki) � eit, when timeit � ki, and
lsit � b0i � b2i(timeit– ki) � eit, when timeit � ki, (3)
with interindividual differences in the change point, ki, beingmodeled, along with b0i, b1i, and b2i, at Level 2. Of interest was theextent of individual differences in the point of transition to termi-nal decline (i.e., variance of ki). Statistical estimation was con-ducted via Gibbs sampling in WinBugs (Spiegelhalter, Thomas,Best, & Lunn, 2007; see also Wang & McArdle, 2008; Zhang,Hamagami, Wang, Grimm, & Nesselroade, 2007).
Interindividual differences in the location of the change point(ki) were then modeled as a function of individuals’ demographicvariables. Of interest was whether and how the modeled interin-dividual differences in the location of the change point wererelated to interindividual differences in age at death, sex, educa-tion, and their interactions, e.g.,
ki � a03 � a13(age at deathi) � a23(sexi) � a33(educationi)
� a43(age at deathi � educationi)
� a53(age at deathi � sexi) � a63(sexi � educationi)
� a73(age at deathi � sexi � educationi) � u3i. (4)
Data structure. Descriptive statistics for life satisfaction areprovided in Table 1, both over age (Columns 1–4) and distance todeath (Columns 5–8). It appears that average levels of life satis-faction decrease with both age and proximity to death (e.g., M �50.23 at 20 years prior to death, M � 41.14 at the year prior todeath). It may also be noted from Table 1 that the large majorityof observations were obtained when participants were age 70 to 89or in the 10- to 0-year period prior to death. To illustrate, 92% (n �1,514) of our participants provided one or more data points in thelast 4 years of life. We also note the primarily longitudinal natureof the data, with 88% (n � 1,447) of the participants contributinginformation about intraindividual change by providing two ormore data points (M observation period � 6.13 years, SD � 5.16;range: 0–21 years). Following the accelerated longitudinal design,aligning all of these segments and treating them as a single sampleallowed for estimation, under missing-at-random assumptions (Lit-tle & Rubin, 1987), of an age gradient spanning 30 years (70–100)and a distance-to-death gradient of up to 22 years. During estima-tion, change effects (i.e., parameters associated with age or DtD)are derived from all the longitudinal segments, with more weightbeing implicitly given to information obtained from those individ-uals who provided the most change (i.e., most occasions) infor-mation. Finally, the correlation between age and distance to deathwas of moderate size (r � .27, p � .001), suggesting that olderindividuals were somewhat likely to be closer to death (i.e., higherdistance-to-death scores as “less negative,” or closer to zero beingassociated with higher ages). In sum, the data structure suggestsonly partial overlap between the two time dimensions, and modelinferences are most relevant for the 70 to 90 age span and/or thedecade prior to death.
Results
Comparing Age-Related and Mortality-Related Changesin Life Satisfaction
Before examining intraindividual changes in life satisfaction, wechecked the relative amount of between-person and within-personvariance in the data. The intraclass correlation was .48 (as com-
1151TERMINAL DECLINE IN LIFE SATISFACTION IN OLD AGE
puted using a random intercept-only model). In other words, 48%of the total variation in life satisfaction was between-person vari-ance, with the remainder (52%) being within-person variation. Thedata thus appeared to contain both substantial amounts of between-person differences and within-person variation over time. Notingthat there was indeed intraindividual variation to model, fourgrowth models, 2 types of change (linear and multiphase) � 2 timemetrics (age and distance-to-death) were used to describe andevaluate how the noted changes in life satisfaction were structuredover time.
Linear models. Parameter estimates and fit statistics for thelinear models, with either age or distance to death as the timemetric, are presented in Table 2. The distance-to-death modelprovided a better fit to the data, as evaluated by relative overallmodel fit criteria (Akaike information criterion [AIC] � 80,008 forthe age model; AIC � 79,645 for the distance-to-death model;lower AIC indicates better relative model fit). Relative fit was alsoevaluated with regard to the additional amount of explained vari-ance, formally conceptualized as the proportional reduction of
prediction error (i.e., change in pseudo-R2), when either age ordistance to death was added to the within-person (Level 1) portionof the model (Snijders & Bosker, 1999).2 The change in pseudo-R2
was .145 for the distance-to-death metric as compared to .125 forthe age metric. Taken together, the assessments of relative overallmodel fit and proportion of explained variance both suggest thatdistance to death provides a better fitting and more efficientdescription of longitudinal changes in life satisfaction aspects ofthe data than does chronological age. We also note that, onaverage, the age model shows significant age-associated decline(–0.63 T-score units per year), whereas the distance-to-deathmodel shows a relatively more pronounced mortality-associateddecline (–1.02 T-score units per year).
Multiphase models. Subsequently, models incorporating mul-tiple phases of change (i.e., Equation 2) over both age and distanceto death were examined. Our intent was to empirically evaluatewhether multiphase models of change were better than single-phase models of change. Parameter estimates and model fit indices
2 Following the general framework outlined by Snijders and Bosker(1999, pp. 99–105), we calculated the explained proportion of within-person variance as
pseudo-R2 � 1 – (e(c)2 / e(u)
2 ), (5)
where e(u)2 is the residual within-person variance obtained from an uncon-
ditional or intercept-only model (for our data � 122.81) and e(c)2 is the
parallel term from the conditional model that includes the time variable,age or distance to death (for our data � 107.51 and 104.95, respectively).It was also noted that the inclusion of both time metrics only marginallyincreased the explained variance further (pseudo-R2 � .147).
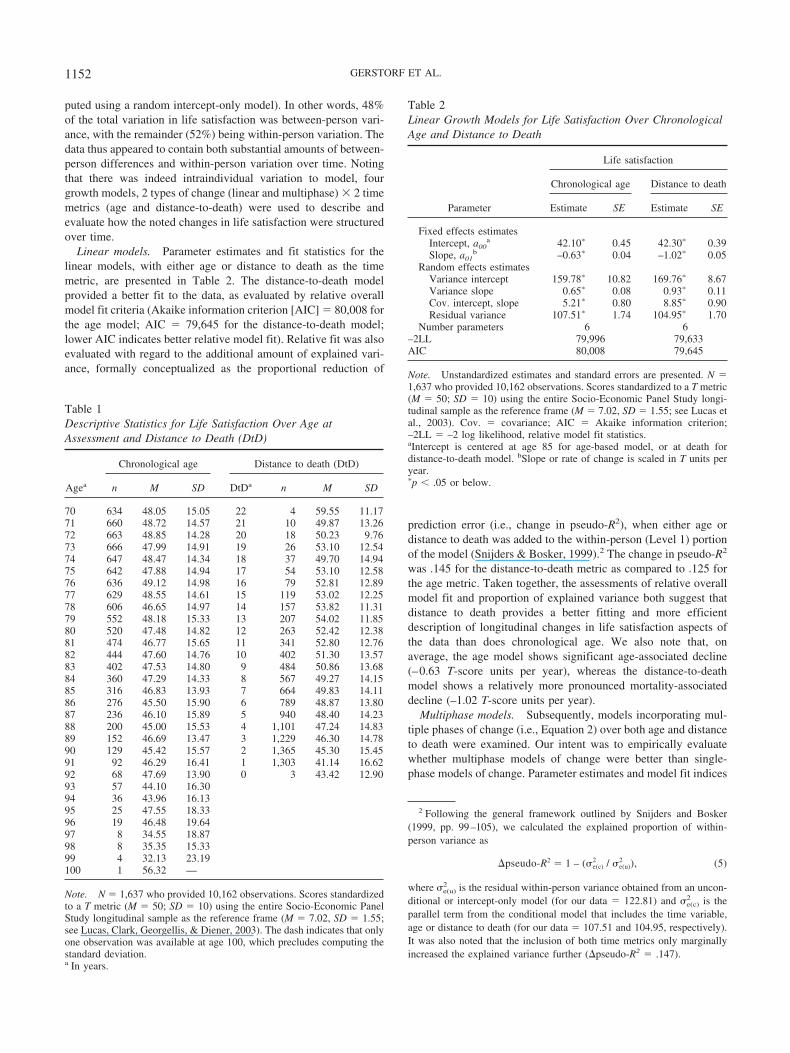
Table 1Descriptive Statistics for Life Satisfaction Over Age atAssessment and Distance to Death (DtD)
Agea
Chronological age Distance to death (DtD)
n M SD DtDa n M SD
70 634 48.05 15.05 22 4 59.55 11.1771 660 48.72 14.57 21 10 49.87 13.2672 663 48.85 14.28 20 18 50.23 9.7673 666 47.99 14.91 19 26 53.10 12.5474 647 48.47 14.34 18 37 49.70 14.9475 642 47.88 14.94 17 54 53.10 12.5876 636 49.12 14.98 16 79 52.81 12.8977 629 48.55 14.61 15 119 53.02 12.2578 606 46.65 14.97 14 157 53.82 11.3179 552 48.18 15.33 13 207 54.02 11.8580 520 47.48 14.82 12 263 52.42 12.3881 474 46.77 15.65 11 341 52.80 12.7682 444 47.60 14.76 10 402 51.30 13.5783 402 47.53 14.80 9 484 50.86 13.6884 360 47.29 14.33 8 567 49.27 14.1585 316 46.83 13.93 7 664 49.83 14.1186 276 45.50 15.90 6 789 48.87 13.8087 236 46.10 15.89 5 940 48.40 14.2388 200 45.00 15.53 4 1,101 47.24 14.8389 152 46.69 13.47 3 1,229 46.30 14.7890 129 45.42 15.57 2 1,365 45.30 15.4591 92 46.29 16.41 1 1,303 41.14 16.6292 68 47.69 13.90 0 3 43.42 12.9093 57 44.10 16.3094 36 43.96 16.1395 25 47.55 18.3396 19 46.48 19.6497 8 34.55 18.8798 8 35.35 15.3399 4 32.13 23.19100 1 56.32 —
Note. N � 1,637 who provided 10,162 observations. Scores standardizedto a T metric (M � 50; SD � 10) using the entire Socio-Economic PanelStudy longitudinal sample as the reference frame (M � 7.02, SD � 1.55;see Lucas, Clark, Georgellis, & Diener, 2003). The dash indicates that onlyone observation was available at age 100, which precludes computing thestandard deviation.a In years.
Table 2Linear Growth Models for Life Satisfaction Over ChronologicalAge and Distance to Death
Parameter
Life satisfaction
Chronological age Distance to death
Estimate SE Estimate SE
Fixed effects estimatesIntercept, a00
a 42.10� 0.45 42.30� 0.39Slope, a01
b –0.63� 0.04 –1.02� 0.05Random effects estimates
Variance intercept 159.78� 10.82 169.76� 8.67Variance slope 0.65� 0.08 0.93� 0.11Cov. intercept, slope 5.21� 0.80 8.85� 0.90Residual variance 107.51� 1.74 104.95� 1.70
Number parameters 6 6–2LL 79,996 79,633AIC 80,008 79,645
Note. Unstandardized estimates and standard errors are presented. N �1,637 who provided 10,162 observations. Scores standardized to a T metric(M � 50; SD � 10) using the entire Socio-Economic Panel Study longi-tudinal sample as the reference frame (M � 7.02, SD � 1.55; see Lucas etal., 2003). Cov. � covariance; AIC � Akaike information criterion;–2LL � –2 log likelihood, relative model fit statistics.aIntercept is centered at age 85 for age-based model, or at death fordistance-to-death model. bSlope or rate of change is scaled in T units peryear.�p � .05 or below.
1152 GERSTORF ET AL.
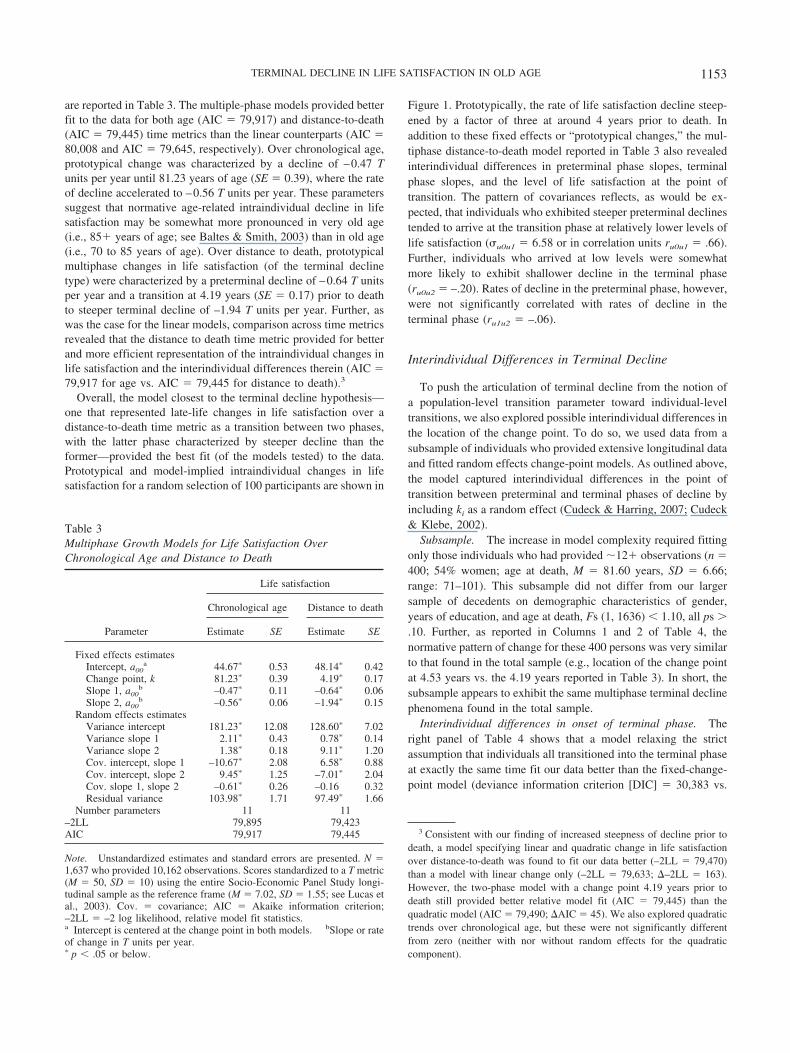
are reported in Table 3. The multiple-phase models provided betterfit to the data for both age (AIC � 79,917) and distance-to-death(AIC � 79,445) time metrics than the linear counterparts (AIC �80,008 and AIC � 79,645, respectively). Over chronological age,prototypical change was characterized by a decline of –0.47 Tunits per year until 81.23 years of age (SE � 0.39), where the rateof decline accelerated to –0.56 T units per year. These parameterssuggest that normative age-related intraindividual decline in lifesatisfaction may be somewhat more pronounced in very old age(i.e., 85� years of age; see Baltes & Smith, 2003) than in old age(i.e., 70 to 85 years of age). Over distance to death, prototypicalmultiphase changes in life satisfaction (of the terminal declinetype) were characterized by a preterminal decline of –0.64 T unitsper year and a transition at 4.19 years (SE � 0.17) prior to deathto steeper terminal decline of –1.94 T units per year. Further, aswas the case for the linear models, comparison across time metricsrevealed that the distance to death time metric provided for betterand more efficient representation of the intraindividual changes inlife satisfaction and the interindividual differences therein (AIC �79,917 for age vs. AIC � 79,445 for distance to death).3
Overall, the model closest to the terminal decline hypothesis—one that represented late-life changes in life satisfaction over adistance-to-death time metric as a transition between two phases,with the latter phase characterized by steeper decline than theformer—provided the best fit (of the models tested) to the data.Prototypical and model-implied intraindividual changes in lifesatisfaction for a random selection of 100 participants are shown in
Figure 1. Prototypically, the rate of life satisfaction decline steep-ened by a factor of three at around 4 years prior to death. Inaddition to these fixed effects or “prototypical changes,” the mul-tiphase distance-to-death model reported in Table 3 also revealedinterindividual differences in preterminal phase slopes, terminalphase slopes, and the level of life satisfaction at the point oftransition. The pattern of covariances reflects, as would be ex-pected, that individuals who exhibited steeper preterminal declinestended to arrive at the transition phase at relatively lower levels oflife satisfaction (u0u1 � 6.58 or in correlation units ru0u1 � .66).Further, individuals who arrived at low levels were somewhatmore likely to exhibit shallower decline in the terminal phase(ru0u2 � –.20). Rates of decline in the preterminal phase, however,were not significantly correlated with rates of decline in theterminal phase (ru1u2 � –.06).
Interindividual Differences in Terminal Decline
To push the articulation of terminal decline from the notion ofa population-level transition parameter toward individual-leveltransitions, we also explored possible interindividual differences inthe location of the change point. To do so, we used data from asubsample of individuals who provided extensive longitudinal dataand fitted random effects change-point models. As outlined above,the model captured interindividual differences in the point oftransition between preterminal and terminal phases of decline byincluding ki as a random effect (Cudeck & Harring, 2007; Cudeck& Klebe, 2002).
Subsample. The increase in model complexity required fittingonly those individuals who had provided �12� observations (n �400; 54% women; age at death, M � 81.60 years, SD � 6.66;range: 71–101). This subsample did not differ from our largersample of decedents on demographic characteristics of gender,years of education, and age at death, Fs (1, 1636) � 1.10, all ps �.10. Further, as reported in Columns 1 and 2 of Table 4, thenormative pattern of change for these 400 persons was very similarto that found in the total sample (e.g., location of the change pointat 4.53 years vs. the 4.19 years reported in Table 3). In short, thesubsample appears to exhibit the same multiphase terminal declinephenomena found in the total sample.
Interindividual differences in onset of terminal phase. Theright panel of Table 4 shows that a model relaxing the strictassumption that individuals all transitioned into the terminal phaseat exactly the same time fit our data better than the fixed-change-point model (deviance information criterion [DIC] � 30,383 vs.
3 Consistent with our finding of increased steepness of decline prior todeath, a model specifying linear and quadratic change in life satisfactionover distance-to-death was found to fit our data better (–2LL � 79,470)than a model with linear change only (–2LL � 79,633; –2LL � 163).However, the two-phase model with a change point 4.19 years prior todeath still provided better relative model fit (AIC � 79,445) than thequadratic model (AIC � 79,490; AIC � 45). We also explored quadratictrends over chronological age, but these were not significantly differentfrom zero (neither with nor without random effects for the quadraticcomponent).
Table 3Multiphase Growth Models for Life Satisfaction OverChronological Age and Distance to Death
Parameter
Life satisfaction
Chronological age Distance to death
Estimate SE Estimate SE
Fixed effects estimatesIntercept, a00
a 44.67� 0.53 48.14� 0.42Change point, k 81.23� 0.39 4.19� 0.17Slope 1, a00
b –0.47� 0.11 –0.64� 0.06Slope 2, a00
b –0.56� 0.06 –1.94� 0.15Random effects estimates
Variance intercept 181.23� 12.08 128.60� 7.02Variance slope 1 2.11� 0.43 0.78� 0.14Variance slope 2 1.38� 0.18 9.11� 1.20Cov. intercept, slope 1 –10.67� 2.08 6.58� 0.88Cov. intercept, slope 2 9.45� 1.25 –7.01� 2.04Cov. slope 1, slope 2 –0.61� 0.26 –0.16 0.32Residual variance 103.98� 1.71 97.49� 1.66
Number parameters 11 11–2LL 79,895 79,423AIC 79,917 79,445
Note. Unstandardized estimates and standard errors are presented. N �1,637 who provided 10,162 observations. Scores standardized to a T metric(M � 50, SD � 10) using the entire Socio-Economic Panel Study longi-tudinal sample as the reference frame (M � 7.02, SD � 1.55; see Lucas etal., 2003). Cov. � covariance; AIC � Akaike information criterion;–2LL � –2 log likelihood, relative model fit statistics.a Intercept is centered at the change point in both models. bSlope or rateof change in T units per year.� p � .05 or below.
1153TERMINAL DECLINE IN LIFE SATISFACTION IN OLD AGE
DIC � 30,453).4 Table 4 also reveals that the normative pattern ofchange, with relatively shallow preterminal decline, a transition ataround 4 years prior to death, and relatively steep terminal decline,follows the same general form as before. Most importantly, wefound notable interindividual differences in the location of thechange point (k
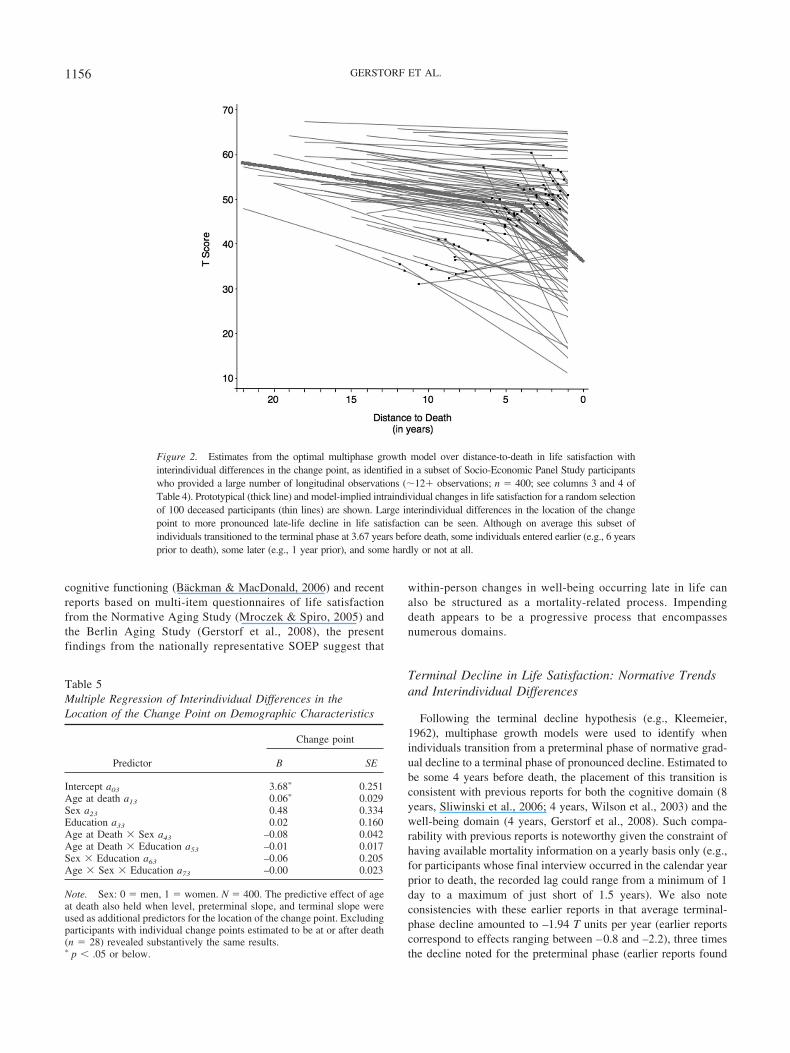
2 � 12.08), indicating that individuals transitionfrom one phase to another at different times. Illustrating thisfinding, Figure 2 shows prototypical and model-implied intraindi-vidual changes in life satisfaction for a random selection of 100participants from the subsample. Although on average this subsetof individuals transitioned to the terminal phase at 3.67 yearsbefore death, some individuals entered earlier (e.g., 6 years prior todeath), some later (e.g., 1 year prior), and some not at all (i.e., ata point projected to be after their actual death). More specifically,the estimated parameters transition points spanning the range from13 years prior to death to 1 year after death. Although this mayseem somewhat strange, consider that, theoretically, some individ-uals die before they enter terminal decline (e.g., dying from anacute disease or event like an accident). In the n � 400 subsampleused here, individual change points were estimated to be at or afterdeath for 28 individuals. Follow-up examinations of these individ-uals indicated that their data series were each better characterizedby single-phase linear declines rather than multiphases—a furtherindication that they did not ever enter a terminal-decline phase.Finally, as would be expected, the pattern of covariances suggeststhat individuals who exhibited steeper preterminal decline transi-tioned to the terminal phase of decline somewhat earlier (ru1u3 �.55).
Predictors of individual onset. In a final step, we exploredhow differences in the timing of transition to the terminal-declinephase might relate to interindividual difference characteristics. Todo so, the location of the change point, ki, was regressed on age atdeath, sex, and education, and their two-way and three-way inter-actions.5 In these analyses, presented in Table 5, only 2% of thevariance in the location of the change point was accounted for. Wedid not find evidence of statistically significant differences acrosssex or levels of education, although nominally there was an indi-cation that being a woman, as opposed to a man, was associatedwith a longer terminal phase and steeper terminal decline. Therewas, however, a significant relationship between age at death andthe location of the change point (a13 � 0.06), with older age atdeath associated with having spent more time in the terminaldecline phase. This effect amounted to some 22 more days in theterminal phase per additional year lived (0.06 � 365 days).
4 DIC � Deviance information criteria, a measure of relative model fit,intended as a generalization of the AIC. Having used Gibbs samplingestimation to conduct the analysis, we report the DIC generalization in lieuof the AIC. Interpretation is the same, with lower values indicating a betterrelative model fit.
5 We also used age at death, sex, and education as well as their inter-action terms as predictors of level, preterminal slope, and terminal slope.None of the covariates, however, were significantly related to these modelparameters.
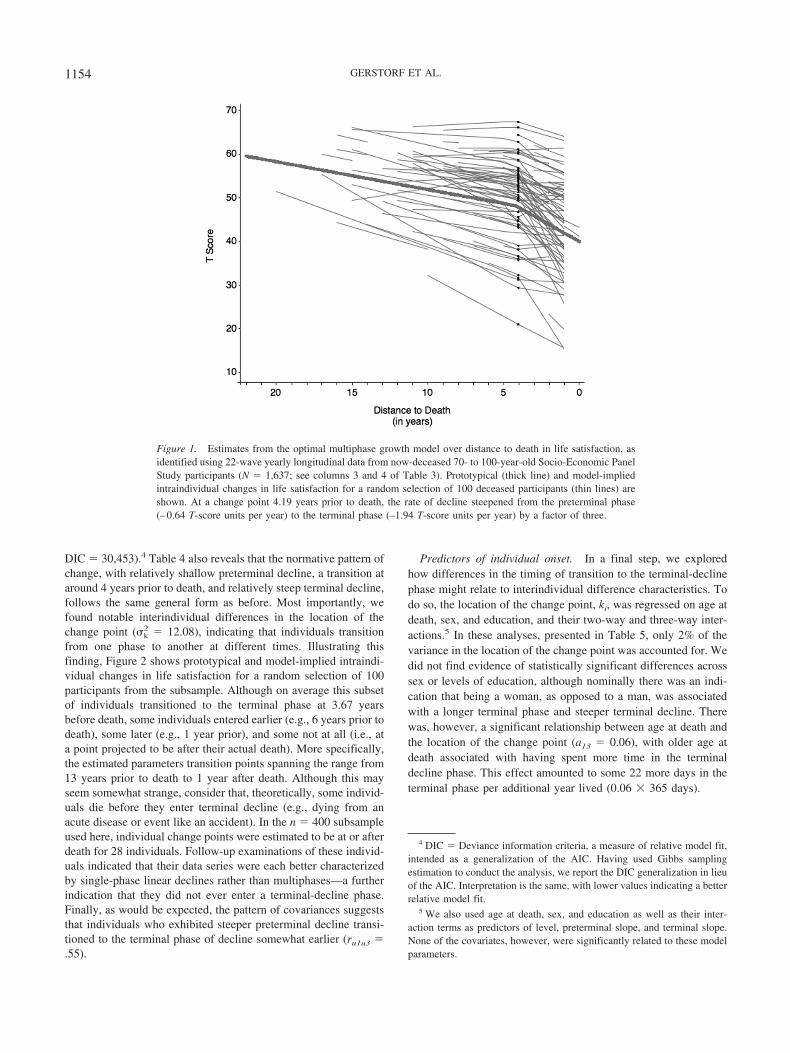
Figure 1. Estimates from the optimal multiphase growth model over distance to death in life satisfaction, asidentified using 22-wave yearly longitudinal data from now-deceased 70- to 100-year-old Socio-Economic PanelStudy participants (N � 1,637; see columns 3 and 4 of Table 3). Prototypical (thick line) and model-impliedintraindividual changes in life satisfaction for a random selection of 100 deceased participants (thin lines) areshown. At a change point 4.19 years prior to death, the rate of decline steepened from the preterminal phase(–0.64 T-score units per year) to the terminal phase (–1.94 T-score units per year) by a factor of three.
1154 GERSTORF ET AL.
Discussion
The objective of this study was to identify and describeterminal decline in life satisfaction in old age. Using 22-wavelongitudinal data from now deceased 70- to 100-year-oldparticipants in the SOEP study, we found that individualdifferences in late-life intraindividual changes in life satisfac-tion were better described using a distance-to-death ratherthan a distance-from-birth time metric. Of the four growthcurve models tested, a model that articulated notions of termi-nal decline by incorporating two phases of change over dis-tance to death provided the best fit to the data. This modelrevealed a transition point about 4 years prior to death at whichthe prototypical rate of decline steepened by a factor of threefrom the preterminal phase to the terminal phase. Follow-upanalyses indicated that men and women and individuals ofdiffering educational levels experienced, on average, compara-ble late-life declines in life satisfaction, but individuals whodied at later ages tended to spend more time in terminal periodsof decline.
Age-Related and Mortality-Related Changes in LifeSatisfaction
Although data vary somewhat across cultures and subgroups,individuals for the most part report being happy or satisfied withtheir lives (Diener & Diener, 1996). For example, Lucas et al.(2003) found that the vast majority (88%) of the �22,000 partic-ipants in the larger SOEP sample reported life satisfaction scoresabove neutral (i.e., � 5 on the 0 to 10 scale). Similarly, within theolder and now deceased segment of the same sample used here,85% of reports (8,669 of 10,162 observations) were at or aboveneutral. When these 70- to 100-year-olds were broken down by ageand distance to death, however, we found systematic declines inlife satisfaction such that average levels were below the neutralpoint at ages 97 to 99 (see Table 1) and at death for individualswho died older than age 85 (i.e., intercept � 4.97 in follow-upanalyses applying the multiphase model to data in the originalscale units). Thus, in this nationally representative sample from ahighly developed country a number of individuals in very old ageand/or the last few years of life report being fairly unsatisfied.Without delving into the moral and ethical issues of whethersociety should knowingly tolerate decline below neutral levels ofsatisfaction (see Baltes, 2006), we simply observe, in the contextof aging and longevity, that there appears to be a “soon to die”segment of the population that is not satisfied. Whether or not suchfeelings can be alleviated should be examined further.
When examining how late-life longitudinal changes in life sat-isfaction were structured, we found, somewhat in contrast withother reports, indications of sizeable age-related decline (e.g.,Charles, Reynolds, & Gatz, 2001; Mroczek & Kolarz, 1998). Theextent of decline in the present study (e.g., –0.63 T-score units peryear in the linear age-based model) was somewhat steeper thanthat found (or implied by cross-sectional age differences) in sev-eral previous studies (e.g., no age differences across the lifespan inLucas & Gohm, 2000). This may have been because we onlyselected older participants (older than in most other studies) who,in addition, were known to have died. To explore this possibility,we did follow-up analyses on all SOEP participants who provideddata after age 70, independent of their mortality status (N �3,519), which revealed a somewhat shallower age gradient (–0.54T units per year). In other words, there is some evidence that themortality-based selection criterion employed in this study contrib-uted to the steepness of age-related decline in life satisfactionfound here, as compared to that found in other studies.6
Our finding that distance-to-death models fit the data relativelybetter than age-based models speaks to the utility of examiningmortality selection processes explicitly. Organizing the changegradients according to the selection criterion (i.e., death) revealedthat progressive processes leading toward death may also be thosethat drive changes in life satisfaction occurring in old age. In otherwords, mortality-related processes may be a major underlyinginfluence when late-life changes in well-being are indeed ob-served. Parallel to evidence accumulating for various measures of
6 When we further included only participants who had not died by theyear 2005, we found an even shallower age gradient of –0.43 (SE � 0.03),p � .001.
Table 4Multiphase Growth Models of Life Satisfaction Over Distance toDeath With Change Points as Fixed or Random
Parameter
Life satisfaction
Fixed-changepoint
Random-changepoint
Estimate SE Estimate SE
Fixed effects estimatesIntercept, a00
a 47.52� 0.75 48.65� 0.78Change point, k or a03 4.53� 0.38 3.67� 0.69Slope 1, a00
b –0.56� 0.08 –0.28� 0.10Slope 2, a00
b –2.17� 0.27 –3.51� 0.83Random effects estimates
Variance intercept 128.90� 11.95 84.85� 10.70Variance change point n.e. 12.08� 2.95Variance slope 1 0.60� 0.13 0.26� 0.12Variance slope 2 6.40� 1.75 5.28� 1.74Cov. intercept, change
pointn.e. 18.66� 4.06
Cov. intercept, slope 1 6.13� 1.11 3.13� 0.87Cov. intercept, slope 2 –5.47 2.87 –18.54� 4.06Cov. Change point,
slope 1n.e. 0.98� 0.41
Cov. Change point,slope 2
n.e. –2.45 2.12
Cov. slope 1, slope 2 0.03 0.32 –0.70� 0.22Residual variance 87.96� 2.27 87.86� 2.66
Number parameters 11 15DIC 30,453 30,383
Note. Unstandardized estimates and standard errors are presented. N �400. Scores standardized to a T metric (M � 50; SD � 10) using the entireSocio-Economic Panel Study longitudinal sample as the reference frame(M � 7.02, SD � 1.55; see Lucas et al., 2003). Cov. � covariance; n.e. �not estimated (i.e., assumed to be 0.0); DIC � deviance informationcriterion, relative model fit statistic.a Intercept is centered at the change point in both models. b Slope or rateof change in T units per year.� p � .05 or below.
1155TERMINAL DECLINE IN LIFE SATISFACTION IN OLD AGE
cognitive functioning (Backman & MacDonald, 2006) and recentreports based on multi-item questionnaires of life satisfactionfrom the Normative Aging Study (Mroczek & Spiro, 2005) andthe Berlin Aging Study (Gerstorf et al., 2008), the presentfindings from the nationally representative SOEP suggest that
within-person changes in well-being occurring late in life canalso be structured as a mortality-related process. Impendingdeath appears to be a progressive process that encompassesnumerous domains.
Terminal Decline in Life Satisfaction: Normative Trendsand Interindividual Differences
Following the terminal decline hypothesis (e.g., Kleemeier,1962), multiphase growth models were used to identify whenindividuals transition from a preterminal phase of normative grad-ual decline to a terminal phase of pronounced decline. Estimated tobe some 4 years before death, the placement of this transition isconsistent with previous reports for both the cognitive domain (8years, Sliwinski et al., 2006; 4 years, Wilson et al., 2003) and thewell-being domain (4 years, Gerstorf et al., 2008). Such compa-rability with previous reports is noteworthy given the constraint ofhaving available mortality information on a yearly basis only (e.g.,for participants whose final interview occurred in the calendar yearprior to death, the recorded lag could range from a minimum of 1day to a maximum of just short of 1.5 years). We also noteconsistencies with these earlier reports in that average terminal-phase decline amounted to –1.94 T units per year (earlier reportscorrespond to effects ranging between –0.8 and –2.2), three timesthe decline noted for the preterminal phase (earlier reports found
Figure 2. Estimates from the optimal multiphase growth model over distance-to-death in life satisfaction withinterindividual differences in the change point, as identified in a subset of Socio-Economic Panel Study participantswho provided a large number of longitudinal observations (�12� observations; n � 400; see columns 3 and 4 ofTable 4). Prototypical (thick line) and model-implied intraindividual changes in life satisfaction for a random selectionof 100 deceased participants (thin lines) are shown. Large interindividual differences in the location of the changepoint to more pronounced late-life decline in life satisfaction can be seen. Although on average this subset ofindividuals transitioned to the terminal phase at 3.67 years before death, some individuals entered earlier (e.g., 6 yearsprior to death), some later (e.g., 1 year prior), and some hardly or not at all.
Table 5Multiple Regression of Interindividual Differences in theLocation of the Change Point on Demographic Characteristics
Predictor
Change point
B SE
Intercept a03 3.68� 0.251Age at death a13 0.06� 0.029Sex a23 0.48 0.334Education a33 0.02 0.160Age at Death � Sex a43 –0.08 0.042Age at Death � Education a53 –0.01 0.017Sex � Education a63 –0.06 0.205Age � Sex � Education a73 –0.00 0.023
Note. Sex: 0 � men, 1 � women. N � 400. The predictive effect of ageat death also held when level, preterminal slope, and terminal slope wereused as additional predictors for the location of the change point. Excludingparticipants with individual change points estimated to be at or after death(n � 28) revealed substantively the same results.� p � .05 or below.
1156 GERSTORF ET AL.
terminal-phase decline to be between 2 to 12 times as steep).7
Together, the transition point and rate of terminal decline suggestthat the prototypical individual’s life satisfaction declines nearly afull standard deviation over the last 4 years of life (from 48 to 40on our T-unit scale or from 7 to 5.5 on the raw-unit scale). Wehighlight, however, that all these reports (including our own)depict average population level estimates and make an assumptionthat the location of the transition point is invariant across individ-uals.
To address this concern, we initiated an exploration into how thetiming of the onset of terminal decline may differ across individ-uals using a random change-point multiphase growth model wherethe restrictive assumption noted above was relaxed. Our initialevidence suggests that people do appear to enter the terminal-decline phase at different times, ranging from 13 years prior todeath to just prior to death or even not at all. We find this modelto be consistent with the idea that although terminal decline isnormative, some individuals will not experience such transitionsbecause they die, presumably of some other cause (e.g., accident),before they entered terminal decline. Persons following such atrajectory do appear in the data, treating time (e.g., distance todeath) as a continuous variable and assuming a normal distributionof interindividual differences in the onset allowed for this theoret-ically consistent possibility.
In a subsequent step, we explored how the noted differences inonset of terminal decline related to differences in age at death, sex,and education. Onset was not related to sex and education in astatistically significant manner. However, differences in onsetwere related to age of death, in that individuals dying at later agesappear to have spent more time in the terminal-decline phase(about 7 months per additional decade lived). Before interpretingthese findings, we note explicitly that the absence or presence ofsignificant effects from this post hoc regression of estimatedparameters on a small set of interindividual difference variablessuffers from limitations in the data (e.g., yearly assessments,missing data). Articulate and precise tests of interindividual dif-ference hypotheses would, at the very least, require an increaseddensity of observations. Strong conclusions from this primarilyexploratory post hoc analysis are not warranted.
With that duly noted, our cautious interpretation, perhaps still aspeculation, is that it is not age per se that matters (for lifesatisfaction) but rather a combination of closeness to death and theage at which this closeness appears. Individual-based notions ofdistinguishing multiple phases in old age, for example, highlightthat transitions from the “Third Age” to the “Fourth Age” areprimarily linked to the lifespan of a given individual and can thusoccur at very different ages (e.g., around age 60 for some or aroundage 90 for others; see Figure 1 in Baltes & Labouvie, 1973,reprinted in Hertzog & Nesselroade, 2003; Baltes & Smith, 2003).Our finding that the years prior to death may be more dysfunc-tional in older ages (e.g., drawn-out decline; see also Crimmins,2001) is consistent with the idea that terminal decline in well-beingmay, in part, be a consequence of age-related overburden. It maybe that individuals who survive into very old age are at the limitsof their adaptive capacity (Smith & Gerstorf, 2004). As othersystems begin to break down, an already compromised well-beingregulation system becomes overwhelmed and exhibits precipitousdecline. So, whereas individuals in the “Third Age” (e.g., 70–84years) may still have the resources to ward off the detrimental
effects of impending mortality, those in the “Fourth Age” (85�years) may not. An alternative, perhaps more contentious possi-bility is that declines in well-being are an indication that thewell-being regulation mechanism falls apart (e.g., the mechanics ofself-regulation become more and more compromised in processingrewards) and that this increasing dysfunction itself contributes tothe dying process. Speculating from evidence regarding the agesensitivity of corticostriatal connections and dopamine-dependentprocesses implicated in reward processing (e.g., Gerhardt, Cass,Yi, Zhang, & Gash, 2002), it may be that as individuals are nolonger able to process rewards, life is no longer rewarding and thedesire to live decreases.
This initial analysis of interindividual differences in terminaldecline was in some ways a theoretically informed exploratoryanalysis, driven in large part by the limitations of the data (e.g.,relatively small number of variables, lack of information aboutcognitive functioning or cause of death), and is unable to addressthe above speculations. Although limited, we hope that it doesprovide an initial look at and generate some discussion about howtheoretical propositions regarding interindividual differences interminal decline may be articulated, modeled, and examined.
Limitations and Outlook
Ideally, the statistical methods used in an analysis should beprecise articulations of the theoretical models one seeks to test. Inthis article, we have sought to apply and extend models thatcorrespond to theoretical notions of how terminal decline maymanifest in late-life changes in life satisfaction. In an attempt to doso, we began by modeling linear changes over an age time metric,replaced the time metric with distance-to-death as a more directproxy of the mortality-related processes implicated in terminaldecline and allowed for explicit transition between preterminal andterminal phases of decline. Finally, we articulated a more individ-ualized version of terminal decline using a multiphase randomchange-point model wherein individuals differ in timing of onsetof terminal decline. Proceeding in this manner, we ended up at amodel that represents (and requires) some of the latest innovationsin statistical estimation and remains at the edge of what is possiblewith currently available software (see Cudeck & Harring, 2007;Wang & McArdle, 2008). Although we are sure that such devel-opments allow for more precise articulation of the theory (e.g.,individual differences in onset of terminal decline), we still inter-pret the results with some caution. The initial descriptions pro-vided here, though, suggest that further examinations with moreadvanced tools and intensive predeath repeated measures shouldbe pursued. At the same time, these initial results obtained with theadvanced modeling tools suggest that the theory can be articulatedand (with sufficient data) tested in detail. In turn, this may requiresome further refinement of the theory itself. Specific hypotheses tobe generated include specification of when the onset of terminal
7 Comparing standardized units across studies is, of course, open todebate given that standardizations depend upon sample characteristics.However, we opted for this approach in a first attempt to compare rates ofterminal decline across studies and domains. In addition to the otherstudies, Sliwinski et al. (2006) reported their results for episodic memoryin raw data units (range: 0–72; preterminal decline: 0.77 raw-score unitsper year; terminal decline: 1.42 raw-score units per year).
1157TERMINAL DECLINE IN LIFE SATISFACTION IN OLD AGE
decline should begin, what form the transition takes (gradual vs.abrupt), and what might explain interindividual differences in thetiming of the transition. In general, the innovations made on themodeling side now require further precision in the theory ofterminal decline.
Although the methodological articulations of terminal declineare at the limits of what is currently possible with the data at hand,it must be noted that the present examination remains descriptiveand does not allow for causal inferences. The modeling approachused mortality as an independent variable and examined, in a posthoc manner, changes that occurred prior to known deaths. Modelsoperationalizing predictive theories, however, would require thedeath date to be unknown—using observed accelerations in de-cline to predict subsequent transition into the death state (for onepossible avenue, see Ghisletta et al., 2006). Independent of mod-eling considerations, it remains an open conceptual question as towhether psychosocial factors convey mortality risks on their ownor whether they reflect the effects of pathologic processes. Re-garding well-being, for example, one position argues that self-evaluations of one’s life and aging do have physiological effectson cardiovascular and immune functioning (Danner et al., 2001;Pressman & Cohen, 2005) that may have long-term effects onfunctioning and survival. Another position argues that well-beingratings might represent evaluations that reflect quite accurate sum-mary perceptions of an individual’s level and change in function-ing in a variety of other domains that are more directly linked tomortality (cf. Maier & Smith, 1999). Reports from the BerlinAging Study, however, suggest that interindividual differences inthe extent of terminal change in life satisfaction may not beaccounted for by comorbidities or correspondent terminal declinein various aspects of cognitive functioning (Gerstorf et al., 2008).Unfortunately, we were unable to examine such questions with thedata at hand (i.e., the SOEP is primarily an economic study).Examining these and other etiological questions, however, wouldshed some initial light on potentially underlying mechanisms. Forexample, it is conceivable that various causes of death (e.g.,cerebrovascular, cardiac, and cancer) and the conditions associatedwith the process of dying (e.g., institutionalization, frailty) mayaccount for differential portions of individual differences in ter-minal decline of well-being. In sum, there is much further work tobe done, some of which will require more causally oriented de-signs and methods.
To conclude, evidence has been building that events such asmarriage and unemployment systematically drive lasting changesin individuals’ life satisfaction (e.g., Lucas et al., 2003). Thepresent study adds to these notions, suggesting that impendingdeath may represent another factor that contributes to a set ofsystematic changes in life satisfaction, albeit ones that lead up tothe event rather than away from it. We found evidence of struc-tured terminal decline and along with other recent studies providefurther evidence that proximity to death is associated with sub-stantial losses not only in “age-sensitive domains,” such as intel-lectual and sensory functioning, but also in relatively “age-insensitive” domains, such as well-being, that are usually wellpreserved into old and advanced old age (see also Gerstorf et al.,2008; Mroczek & Spiro, 2005). As more and more data on the lastyears of life become available across multiple domains of func-tioning, and the analytical techniques become more refined, thereis no doubt that more will be learned about how and why
mortality-related processes contribute to the experiences of latelife—steps along the way to the greater goal of doing what we canto make the terminal years ones filled with the satisfaction ofliving a good life.
References
Backman, L., & MacDonald, S. W. S. (2006). Death and cognition:Synthesis and outlook. European Psychologist, 11, 224–235.
Baltes, P. B. (2006). Facing our limits: Human dignity in the very old.Daedalus, 135, 33–39.
Baltes, P. B., & Labouvie, G. V. (1973). Adult development of intellectualperformance: Description, explanation, modification. In C. Eisdorfer &M. P. Lawton (Eds.), The psychology of adult development and aging(pp. 157–219). Washington, DC: American Psychological Association.
Baltes, P. B., & Smith, J. (2003). New frontiers in the future of aging: Fromsuccessful aging of the young old to the dilemmas of the fourth age.Gerontology, 49, 123–135.
Birren, J. E., & Cunningham, W. R. (1985). Research on the psychology ofaging: Principles, concepts and theory. In J. E. Birren & K. W. Schaie(Eds.), Handbook of the psychology of aging (2nd ed., pp. 3–34). NewYork: Van Nostrand Reinhold.
Bosworth, H. B., & Schaie, K. W. (1999). Survival effects in cognitivefunction, cognitive style, and sociodemographic variables in the SeattleLongitudinal Study. Experimental Aging Research, 25, 121–139.
Brockmann, H., & Klein, T. (2004). Love and death in Germany: Themarital biography and its effect on mortality. Journal of Marriage andFamily, 66, 567–581.
Burkhauser, R. V., Giles, P., Lillard, D. R., & Schwarze, J. (2005). Untildeath do us part: An analysis of the economic well-being of widows infour countries. Journals of Gerontology, Series B: Psychological Sci-ences and Social Sciences, 60, S238–S246.
Busse, E. W. (1969). Theories of aging. In E. W. Busse & E. Pfeiffer(Eds.), Behavior and adaptation in late life (pp. 11–32). Boston: Little &Brown.
Charles, S. T., Reynolds, C. A., & Gatz, M. (2001). Age-related differencesand change in positive and negative affect over 23 years. Journal ofPersonality and Social Psychology, 80, 136–151.
Crimmins, E. M. (2001). Mortality and health in human life spans. Exper-imental Gerontology, 36, 885–897.
Cudeck, R., & Harring, J. R. (2007). Analysis of nonlinear patterns ofchange with random coefficient models. Annual Review of Psychology,58, 615–637.
Cudeck, R., & Klebe, K. J. (2002). Multiphase mixed-effects model forrepeated measure data. Psychological Methods, 7, 41–63.
Danner, D. D., Snowdon, D. A., & Friesen, W. V. (2001). Positiveemotions in early life and longevity: Findings from the Nun Study.Journal of Personality and Social Psychology, 80, 804–813.
Diener, E., & Diener, C. (1996). Most people are happy. PsychologicalScience, 7, 181–185.
Diener, E., Lucas, R. E., & Scollon, C. N. (2006). Beyond the hedonictreadmill: Revising the adaptation theory of well-being. American Psy-chologist, 61, 305–314.
Fujita, F., & Diener, E. (2005). Life satisfaction set point: Stability andchange. Journal of Personality and Social Psychology, 88, 158–164.
Gerhardt, G. A., Cass, W. A., Yi, A., Zhang, Z., & Gash, D. M. (2002).Changes in somatodendritic but not terminal dopamine regulation inaged rhesus monkeys. Journal of Neurochemistry, 80, 168–177.
Gerstorf, D., Lovden, M., Rocke, C., Smith, J., & Lindenberger, U. (2007).Well-being affects changes in perceptual speed in advanced old age:Longitudinal evidence for a dynamic link. Developmental Psychology,43, 705–718.
Gerstorf, D., Ram, N., Rocke, C., Lindenberger, U., & Smith, J. (2008).Decline in life satisfaction in old age: Longitudinal evidence for links todistance-to-death. Psychology and Aging, 23, 154–168.
1158 GERSTORF ET AL.
Ghisletta, P., McArdle, J. J., & Lindenberger, U. (2006). Longitudinalcognition-survival relations in old and very old age: 13-year data fromthe Berlin Aging Study. European Psychologist, 11, 204–223.
Haisken-De New, J. P., & Frick, R. (2006). Desktop companion to theGerman Socio-Economic Panel Study (SOEP). Berlin, Germany: Ger-man Institute for Economic Research.
Hall, C. B., Lipton, R. B., Sliwinski, M. J., & Stewart, W. F. (2000). Achange point model for estimating the onset of cognitive decline inpreclinical Alzheimer’s disease. Statistics in Medicine, 19, 1555–1566.
Hertzog, C., & Nesselroade, J. R. (2003). Assessing psychological changein adulthood: An overview of methodological issues. Psychology andAging, 18, 639–657.
Infratest Sozialforschung. (2002). Verbesserung der Datengrundlagen furMortalitats- und Mobilitatsanalysen: Verbleibstudie bei Panelausfallenim SOEP [Improving the database for analyses of mortality and mobil-ity: Examining panel attrition in the SOEP study]. Munich, Germany:http://www.diw.de/deutsch/sop/service/doku/docs/verbleibstudie.pdf
Kleemeier, R. W. (1962). Intellectual changes in the senium. Proceedingsof the Social Statistics Section of the American Statistical Association, 1,290–295.
Kroh, M. (2006). An experimental evaluation of popular well-being mea-sures (Discussion Paper No. 546). Berlin, Germany: German Institutefor Economic Research.
Kroh, M., & Spie�, M. (2006). Documentation of sample sizes and panelattrition in the Socio-Economic Panel (SOEP), 1984–2005 (DIW DataDocumentation No. 15). Berlin, Germany: German Institute for Eco-nomic Research.
Kunzmann, U., Little, T. D., & Smith, J. (2000). Is age-related stability ofsubjective well-being a paradox? Cross-sectional and longitudinal evi-dence from the Berlin Aging Study. Psychology and Aging, 15, 511–526.
Levy, B. R., Slade, M. D., Kunkel, S. R., & Kasl, S. V. (2002). Longevityincreased by positive self-perceptions of aging. Journal of Personalityand Social Psychology, 83, 261–270.
Littell, R. C., Miliken, G. A., Stoup, W. W., & Wolfinger, R. D. (1996).SAS system for mixed models. Cary, NC: SAS Institute.
Little, R. J. A., & Rubin, D. B. (1987). Statistical analysis with missingdata. New York: Wiley.
Lucas, R. E., Clark, A. E., Georgellis, Y., & Diener, E. (2003). Reexam-ining adaptation and the set point model of happiness: Reactions tochanges in marital status. Journal of Personality and Social Psychology,84, 527–539.
Lucas, R. E., & Gohm, C. (2000). Age and sex differences in subjectivewell-being across cultures. In E. Diener & E. M. Suh (Eds.), Culture andsubjective well-being (pp. 291–317). Cambridge, MA: MIT Press.
Maier, H., & Smith, J. (1999). Psychological predictors of mortality in oldage. Journals of Gerontology, Series B: Psychological Sciences andSocial Sciences, 54B, P44–P54.
McArdle, J. J., & Nesselroade, J. R. (2003). Growth curve analysis incontemporary psychological research. In J. Shinka & W. Velicer (Eds.),Comprehensive handbook of psychology: Vol. 2. Research methods inpsychology (pp. 447–480). New York: Wiley.
Mroczek, D. K., & Kolarz, C. M. (1998). The effect of age on positive andnegative affect: A developmental perspective on happiness. Journal ofPersonality and Social Psychology, 75, 1333–1349.
Mroczek, D. K., & Spiro, A., III. (2005). Change in life satisfaction duringadulthood: Findings from the Veterans Affairs Normative Aging Study.Journal of Personality and Social Psychology, 88, 189–202.
Palmore, E., & Cleveland, W. (1976). Aging, terminal decline, and termi-nal drop. Journal of Gerontology, 31, 76–81.
Pressman, S. D., & Cohen, S. (2005). Does positive affect influence health?Psychological Bulletin, 131, 925–971.
Ram, N., & Grimm, K. J. (2007). Using simple and complex growthmodels to articulate developmental change: Matching method to theory.International Journal of Behavioral Development, 31, 303–316.
Raudenbush, S. W., & Bryk, A. S. (2002). Hierarchical linear models:Applications and data analysis methods (2nd ed.). Thousand Oaks, CA:Sage.
Rendtel, U. (1995): Lebenslagen im Wandel: Panelausfalle und Panelre-prasentativitat [Changing lives: Panel drop-out and panel representa-tiveness]. New York: Campus.
Riegel, K. F., & Riegel, R. M. (1972). Development, drop, and death.Developmental Psychology, 6, 306–419.
Schilling, O. (2006). Development of life satisfaction in old age: Anotherview on the paradox. Social Indicator Research, 75, 241–271.
Schimmack, U., Schupp, J., & Wagner, G. G. (in press). The influence ofenvironment and personality on the affective and cognitive componentof subjective well-being. Social Indicator Research.
Schrapler, J.-P. (2004). Respondent behavior in panel studies. SociologicalMethods and Research, 33, 118–156.
Siegler, I. C. (1975). The terminal drop hypothesis: Fact or artifact?Experimental Aging Research, 1, 169–185.
Singer, J. D., & Willett, J. B. (2003). Applied longitudinal data analysis:Modeling change and event occurrence. New York: Oxford UniversityPress.
Sliwinski, M. J., Stawski, R. S., Hall, R. B., Katz, M., Verghese, J., &Lipton, R. B. (2006). On the importance of distinguishing pre-terminaland terminal cognitive decline. European Psychologist, 11, 172–181.
Smith, J., & Gerstorf, D. (2004). Aging differently: Potentials and limits.In S. O. Daatland & S. Biggs (Eds.), Ageing and diversity: Multiplepathways and cultural migrations (pp. 13–28). Bristol, United Kingdom:Policy Press.
Snijders, T. A. B., & Bosker, R. J. (1999). Multilevel analysis: An intro-duction to basic and advanced multilevel modeling. London, UnitedKingdom: Sage.
Spiegelhalter, D. J., Thomas, A., Best, N. G., & Lunn, D. (2007). Win-BUGS Version 1.4.1 user manual [Computer software and manual].Cambridge, United Kingdom: Medical Research Council BiostatisticsUnit. Available from http://www.mrc-bsu.cam.ac.uk/bugs
Thorvaldsson, V., Hofer, S. M., & Johansson, B. (2006). Aging andlate-life terminal decline in perceptual speed. European Psychologist,11, 196–203.
Wagner, G. G., Frick, J. R., & Schupp, J. (2007). Enhancing the power ofhousehold panel studies: The case of the German Socio-Economic PanelStudy (SOEP). Schmollers Jahrbuch, 127, 139–169.
Wang, L., & McArdle, J. J. (2008). A simulation study comparison ofBayesian estimation with conventional methods for estimating unknownchange points. Structural Equation Modeling, 15, 52–74.
White, N., & Cunningham, W. R. (1988). Is terminal drop pervasive orspecific? Journals of Gerontology, Series B: Psychological Sciences andSocial Sciences, 43, P141–P144.
Wilson, R. S., Beck, T. L., Bienias, J. L., & Bennett, D. A. (2007).Terminal cognitive decline: Accelerated loss of cognition in the lastyears of life. Psychosomatic Medicine, 69, 131–137.
Wilson, R. S., Beckett, L. A., Bienias, J. L., Evans, D. A., & Bennett, D. A.(2003). Terminal decline in cognitive function. Neurology, 60, 1782–1787.
Zhang, Z., Hamagami, F., Wang, L., Grimm, K. J., & Nesselroade, J. R.(2007). Bayesian analysis of longitudinal data using growth curve mod-els. International Journal of Behavioral Development, 31, 374–383.
Received June 28, 2007Revision received April 1, 2008
Accepted April 8, 2008 �
1159TERMINAL DECLINE IN LIFE SATISFACTION IN OLD AGE
Related Documents


![SOEP-Monitor Person 1984-2011 - DIW · 2021. 2. 12. · SOEP GROUP SOEP 2011 – SOEPMONITOR PERSON 1984‐2011 (SOEP V28) Berlin, 2013 DOI: 10.5684/soep.v28 h ] o î ì í ð Editors:](https://static.cupdf.com/doc/110x72/6117f8678f8ea7140b3725a9/soep-monitor-person-1984-2011-diw-2021-2-12-soep-group-soep-2011-a-soepmonitor.jpg)