Report Reference: 64010-18-BISR-1Rev0_190212 Life of Mine Water Management Strategy Vegetation Risk Assessment February 2019 Prepared for Roy Hill Iron Ore Pty Ltd

Welcome message from author
This document is posted to help you gain knowledge. Please leave a comment to let me know what you think about it! Share it to your friends and learn new things together.
Transcript

Report Reference: 64010-18-BISR-1Rev0_190212
Life of Mine Water Management Strategy Vegetation Risk Assessment February 2019
Prepared for Roy Hill Iron Ore Pty Ltd

This page has been left blank intentionally.

Roy Hill Iron Ore Pty Ltd Life of Mine Water Management Strategy Vegetation Risk Assessment , February 2019
Page | ii
Life of Mine Water Management Strategy Vegetation Risk Assessment
Prepared for Roy Hill Iron Ore Pty Ltd
Job Number: 64010-18
Reference: 64010-18-BISR-1Rev0_190212
Revision Status
Rev Date Description Author(s) Reviewer
A 21/12/2018 Draft Issued for Client Review P. Drake
T. Bleby R. Archibald
B 23/01/2019 Revised Draft Issued for Client Review
P. Drake R. Archibald
C 08/02/2019 Revised Draft Issued for Client Review
P. Drake T. Bleby
0 12/02/2019 Final Issue for Information P. Drake R. Archibald
Approval
Rev Date Issued to Authorised by
Name Signature
A 21/12/2018 B. Kraft S. Pearse
B 23/01/2019 S. Blake B. Lucas
C 08/02/2019 S. Blake B. Lucas
0 12/02/2019 S. Blake B. Lucas

Roy Hill Iron Ore Pty Ltd Life of Mine Water Management Strategy Vegetation Risk Assessment , February 2019
Page | iii
Abbreviations
Abbreviation Definition
°C Degrees celsius
cm d-1
Centimetres per day
DBCA Department of Biodiversity Conservation and Attractions
DPIRD Department of Primary Industries and Regional Development
dS m-1
Deciseimens per metre
EC Electrical conductivity
ECe Electrical conductivity of soil saturated paste extract
GDV Groundwater dependent vegetation
ha Hectare
km Kilometre
LoM Life of mine
m Metre
mm Millimetre
MAR Managed aquifer recharge
mg L-1
Milligrams per litre
MS Ministerial Statements
PEC Priority Ecological Community
RHIO Roy Hill Iron Ore
SFDV Surface flow dependent vegetation
ShFDV Sheet flow dependent vegetation
The project Life of Mine Water Management Strategy
TDS Total dissolved salts

Roy Hill Iron Ore Pty Ltd Life of Mine Water Management Strategy Vegetation Risk Assessment , February 2019
Page | iv
Executive Summary
Roy Hill Iron Ore (RHIO) have completed numerical modelling of the Life of Mine Water Management Strategy. The Life of Mine Water Management Strategy (the project) includes mine pit dewatering, mine-site water usage and surplus water management. These activities have the potential to impact vegetation condition by altering the level and quality of groundwater. This report provides a Literature Review and vegetation risk assessment of the project based on established sensitivities of specific vegetation types. The risk assessment considers both likelihood and consequence. These components of the assessment were considered separately and then combined to form a spatial analysis of risk of impact to vegetation units and Priority flora owing to the proposed activities. Likelihood was informed by the hydrological modelling, with specific matrices derived for each identified ecohydrological type and risk scenario. The risk scenarios considered were:
groundwater drawdown (decoupling of roots from a reliable water source)
groundwater mounding (waterlogging)
unbalanced growth (canopy growth which is not matched by root growth)
groundwater mounding and salinisation (osmotic or toxic stress due to saline groundwater).
Unbalanced growth refers to additional canopy development owing to, in this case, groundwater mounding, which is not matched by proportional root development. With groundwater recession, following the peak period of groundwater mounding, this unbalanced system may be at risk of water stress, resulting in decline or mortality.
The risk assessment assigned 12.5 hectares of vegetation (less than 0.1% of the project area) as being at high risk of decline or mortality, and this area was within the RHIO mining tenure. Risk for this area was associated with decline or mortality due to groundwater mounding and salinisation. The areas at high or medium risk of decline or mortality were focussed within the northern third of the project area, in the vicinity of the current mining area, the proposed clearing footprint and reinjection fields. Risk levels were low or negligible in the area south of the Remote Managed Aquifer Recharge Injection Fields.
Outside of the RHIO mining tenure, a total of 4,527 hectares of vegetation, 1.5% of the project area, was assigned a medium or low level of risk of decline or mortality, with the remaining area classified as at negligible risk. Several populations on the fringe of the Fortescue Marsh and part of the Narbung Land System Priority Ecological Community were assigned a medium risk rating due to mounding and salinisation, amounting to less than 1.5% of the project area. Aside from this, there was a low or negligible risk of impact of decline or mortality due to any scenario in the Fortescue Marsh Priority Ecological Community, the Vegetation of sand dunes of the Hamersley Range/Fortescue Valley Priority Ecological Community and the Narbung Land System Priority Ecological Community. The medium risk category associated with the fringe of the Fortescue Marsh and part of the Narbung Land System Priority Ecological Community was primarily driven by an elevated consequence level for decline or mortality of vegetation in this community. Likelihood, derived from hydrological modelling, was low in these areas due to small or negligible changes in groundwater depth.
The spatial extent of high risk of decline or mortality in vegetation units and Priority flora due to groundwater mounding or salinisation was modest, with much of the area of risk confined to a zone north of the Fortescue Marsh and in the vicinity of the Remote Managed Aquifer Injection Fields. Only two point records of priority flora were assigned a medium risk of decline or mortality due to groundwater salinisation. The relatively small spatial extent of risk was mainly driven by the

Roy Hill Iron Ore Pty Ltd Life of Mine Water Management Strategy Vegetation Risk Assessment , February 2019
Page | v
projected change in groundwater levels, owing to the Life of Mine Water Management Strategy, remaining at depths greater than five metres from the ground surface.
Preparation of a management plan that incorporates a suitable monitoring program is recommended to reduce the high and moderate risks identified in this assessment.

Roy Hill Iron Ore Pty Ltd Life of Mine Water Management Strategy Vegetation Risk Assessment , February 2019
Page | vi
Table of Contents
1 Introduction ..................................................................................................................................... 1
1.1 Background ................................................................................................................. 1
1.2 Climate ........................................................................................................................ 1
1.3 Geology and Landforms .............................................................................................. 1
1.4 Significant Vegetation and Flora ................................................................................. 4
1.4.1 Priority Ecological Communities ................................................................................. 4
1.4.2 Hydrology of the Fortescue Marsh ............................................................................. 5
1.4.3 Priority Flora ................................................................................................................ 5
2 Literature Review ............................................................................................................................ 7
2.1 Ecohydrological Units .................................................................................................. 7
2.2 Groundwater Drawdown .......................................................................................... 11
2.2.1 Magnitude and Rate of Groundwater Drawdown, and Antecedent Conditions ...... 11
2.3 Groundwater Mounding ........................................................................................... 11
2.3.1 Magnitude and Rate of Groundwater Mounding ..................................................... 12
2.4 Ecohydrological Types ............................................................................................... 12
2.4.1 Xerophyte .................................................................................................................. 13
2.4.2 Surface Flow Dependent Vegetation ........................................................................ 13
2.4.3 Sheet Flow Dependent Vegetation ........................................................................... 13
2.4.4 Halophyte .................................................................................................................. 13
2.4.5 Phreatophyte ............................................................................................................ 14
2.5 Key Vegetation Types in the Study Area ................................................................... 14
2.5.1 Mulga ........................................................................................................................ 14
2.5.2 Samphire ................................................................................................................... 14
2.5.3 Eucalyptus victrix, Eucalyptus camaldulensis and Other Potential Phreatophytes .. 15
2.5.4 Grassland ................................................................................................................... 15
2.5.5 Priority Flora .............................................................................................................. 15
2.6 Summary ................................................................................................................... 16
3 Methods ........................................................................................................................................ 17
3.1 Risk Assessment ........................................................................................................ 17
3.1.1 Hydrological Criteria ................................................................................................. 17
Roy Hill Iron Ore Pty Ltd Life of Mine Water Management Strategy Vegetation Risk Assessment , February 2019
Page | vii
3.1.2 Likelihood .................................................................................................................. 20
3.1.3 Consequence ............................................................................................................. 24
3.1.4 Risk ............................................................................................................................ 25
3.2 Limitations ................................................................................................................. 25
4 Results and Discussion ................................................................................................................... 27
4.1 Outcome of the Risk Assessment .............................................................................. 27
4.2 Groundwater Drawdown .......................................................................................... 27
4.3 Groundwater Mounding ........................................................................................... 28
4.4 Unbalanced Growth .................................................................................................. 28
4.5 Salinisation ................................................................................................................ 28
4.6 Priority Vegetation and Flora .................................................................................... 29
5 Conclusions and Recommendations.............................................................................................. 34
6 References ..................................................................................................................................... 35
List of Figures
Figure 1: Location of the project area ...................................................................................................... 2
Figure 2: Long-term climate data for Newman Airport (Bureau of Meteorology 2018). ........................ 3
Figure 3: Hypothetical plots of water level change depicting groundwater drawdown (drawdown) and
groundwater mounding (mounding). ............................................................................................ 18
Figure 4: Vegetation units and Priority flora mapped across the project area. .................................... 23
Figure 5: Risk of decline or mortality due to groundwater drawdown. ................................................ 30
Figure 6: Risk of decline or mortality due to groundwater mounding (but not mounding and
salinisation). ................................................................................................................................... 31
Figure 7: Risk of decline or mortality due to unbalanced growth. ........................................................ 32
Figure 8: Risk of decline or mortality due to mounding and salinisation. ............................................. 33
Roy Hill Iron Ore Pty Ltd Life of Mine Water Management Strategy Vegetation Risk Assessment , February 2019
Page | viii
List of Tables
Table 1: Land systems present in the project area (Tille 2006). .............................................................. 3
Table 2: Priority flora in the study area. .................................................................................................. 6
Table 3: Conceptualised Ecohydrological units in the Fortescue Marsh region (MWH Australia 2015).
Risk of impact owing to the Life of Mine (LoM) Water Management Strategy is indicated. .......... 8
Table 4: Vegetation types and associated ecohydrological classifications. ........................................... 16
Table 5: Risk rating matrix based on Department of Environment Regulation (2017). ........................ 17
Table 6: Risk treatment table from Department of Environment Regulation (2017). .......................... 17
Table 7: Area of each ecohydrological type and non-vegetated unit within the project area and within
or outside Roy Hill Iron Ore (RHIO) tenure. ................................................................................... 21
Table 8: Example of likelihood levels for risk of impact owing to groundwater drawdown in facultative
phreatophytes. A rate of drawdown of 1 to 2 m year-1 was applied. ............................................ 22
Table 9: Consequence levels for specific ecohydrological types that occur in the study area. ............. 24
Table 10: Consequence levels for point records of Priority flora based on their Priority status. ......... 25
Table 11: Spatial extent of risk levels for each scenario. ....................................................................... 27
Table 12: Spatial extent of risk levels owing to salinisation within the Fortescue Marsh priority
ecological community (PEC) and Narbung Land System PEC. ....................................................... 29
List of Appendices
Appendix A: Vegetation Mapping Sources
Appendix B: GHD Ecohydrological Mapping
Appendix C: Likelihood Matrices
Appendix D: System Flow Diagrams of the Risk Assessment

Roy Hill Iron Ore Pty Ltd Life of Mine Water Management Strategy Vegetation Risk Assessment , February 2019
Page | ix
This page has been left blank intentionally.

Roy Hill Iron Ore Pty Ltd Life of Mine Water Management Strategy Vegetation Risk Assessment , February 2019
Page | 1
1 Introduction
1.1 Background
Roy Hill Iron Ore (RHIO) have completed numerical modelling of the Life of Mine (LoM) Water Management Strategy. The LoM Water Management Strategy (the project) includes mine pit dewatering, mine-site water usage and surplus water management. These activities have the potential to impact vegetation condition by altering the level and quality of groundwater.
The potential area of impact extends across all of the RHIO tenements in the area (the project area) and their surrounds (Figure 1). Specific hydrological changes that may arise from the project are groundwater drawdown, groundwater rise (mounding) and incursions of saline groundwater into the shallow soil layers which are occupied by plant roots (the root zone). This report identifies and maps the sensitivity of vegetation to hydrological change and then couples this sensitivity to the LoM Water Management Strategy numerical modelling in order to derive a risk assessment.
The report provides a literature review and vegetation risk assessment of the project based on established sensitives of specific vegetation types. The risk assessment considers both likelihood and consequence. These components of the assessment are considered separately and then combined to form a spatial analysis of risk of impact to vegetation owing to the proposed activities.
The LoM Water Management Strategy includes Managed Aquifer Recharge (MAR) as a surplus water disposal solution. The MAR project will inject surplus water into Proterozoic formations within the mining area; specifically, the Southwest Injection Borefield and the MAR Stage 1 Mine Pit Injection field. A requirement for additional surplus water disposal to accommodate an increase in dewatering rates prompted a proposed expansion of the MAR project into two further locations south of the Fortescue River, referred to as Remote MAR North and Remote MAR South. This Impact Assessment considers the operation of all four injection fields as it pertains to vegetation condition and persistence.
The purpose of this report is to conduct a risk assessment, thereby identifying and mapping the sensitivities of vegetation to hydrological change arising from the LoM Water Management Strategy.
1.2 Climate
The climate of the Pilbara region of Western Australia is classified as arid tropical with two distinct seasons: a hot, wet summer (October to April) and a mild, dry winter (May to September) (Bureau of Meteorology 2018). Mean annual rainfall for the period 1971 to 2018 at Newman Airport (Bureau of Meteorology Station 007176), approximately 40 km south of the project area, is 333 mm (Figure 2). Mean maximum air temperature for the same station between 1996 and 2018 ranges from 39.1°C in December to 23.0°C in July and exceeds 30°C for much of the year (Figure 2).
1.3 Geology and Landforms
The project falls within the Fortescue Valley, Chichester Ranges and Warrawagine Hills soil-landscape zones of the Fortescue Province. The dominant landform features within these zones are hills and dissected plateaux (with some stony plains and hardpan wash plains) on sedimentary and volcanic rocks of the Hamersley Basin with stony soils, red shallow loams red/brown cracking and non-cracking clays, red loamy earths, mesas, red shallow and deep sands and calcareous shallow loams (Tille 2006). Based on the Department of Agriculture biophysical resource surveys (van Vreeswyk et al. 2004) 23 land systems were identified in the project area (Table 1).

MarbleBar Rd
Marble Bar RdYan d i Haul R d (P)
Ethel C
reekAc
cess
Munjina - Roy Hill Rd
Jigalong RdMt Di vide Rd
Clou dbreak Access Rd
Roy Hill - No reena D
owns R
d
Yandi Mine Access
Kulkin
bahCre
ek
Caram
ulla Cr
eek
Christmas Creek
Davis River
Kulbee Creek
Kondy Creek
Jigalong Creek
Fortescue River
Mindy Mindy Creek
Jimblebar Creek
Coondiner Creek
FortescueMarsh
740000 760000 780000 800000 820000 840000746
0000
74800
00750
0000
75200
00
Author: P. Drake Date: 12-02-2019Drawn: T. Pedersen Figure Ref: 64010-18-BIDR-1Rev0_190212_Fig010 5 10 15 20
kmCoordinate System: GDA 1994 MGA Zone 50
Figure 1: Location of the project areaRoy Hill Iron Ore Pty LtdLife of Mine Water Management Strategy Vegetation Risk Assessment, February 2019
LegendProject areaRoy Hill TenurePits subject to dewateringMAR Stage 1 footprintRemote MAR footprintSouthern MAR footprintSouth West Injection Borefield (SWIB)Road (MRWA)RailWatercourseArea subject to inundationNEWMAN
DAMPIER KARRATHA
TOM PRICE
ROEBOURNE
PARABURDOO
MARBLE BAR
PANNAWONICA
PORT HEDLAND
WITTENOOM GORGE
MapExtent
WESTERNAUSTRALIA

Roy Hill Iron Ore Pty Ltd Life of Mine Water Management Strategy Vegetation Risk Assessment , February 2019
Page | 3
Figure 2: Long-term climate data for Newman Airport (Bureau of Meteorology 2018).
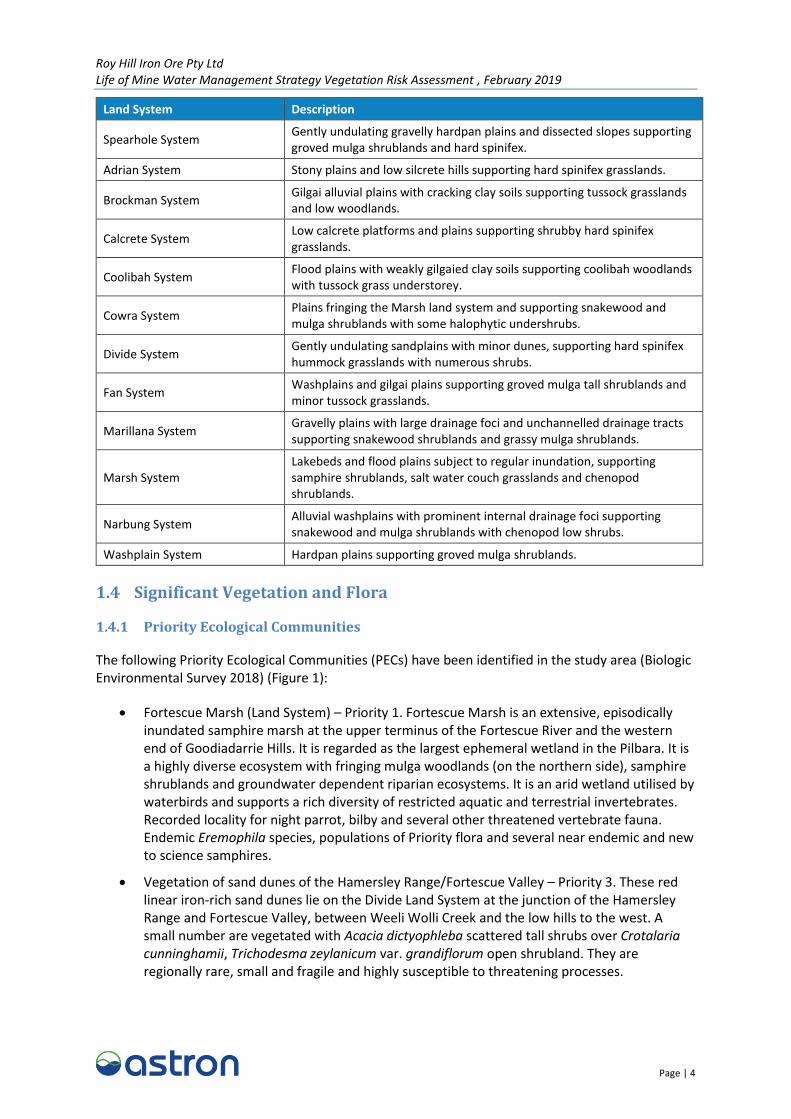
Table 1: Land systems present in the project area (Tille 2006).
Land System Description
McKay System Hills, ridges, plateaux remnants and breakaways of meta sedimentary and sedimentary rocks supporting hard spinifex grasslands with acacias and occasional eucalypts.
Newman System Rugged jaspilite plateaux, ridges and mountains supporting hard spinifex grasslands.
Boolgeeda System Stony lower slopes and plains below hill systems supporting hard and soft spinifex grasslands or mulga shrublands.
Jamindie System Stony hardpan plains and rises supporting groved mulga shrublands, occasionally with spinifex understorey.
River System Narrow, seasonally active flood plains and major river channels supporting moderately close, tall shrublands or woodlands of acacias and fringing communities of eucalypts sometimes with tussock grasses or spinifex.
Turee System Stony alluvial plains with gilgaied and non-gilgaied surfaces supporting tussock grasslands and grassy shrublands of mulga and snakewood.
Warri System Low calcrete platforms and plains supporting mulga and cassia shrublands and minor chenopod low shrublands.
Billygoat System Dissected plains and gravelly slopes supporting hard spinifex grasslands.
Elimunna System Stony plains on basalt supporting sparse acacia and cassia shrublands and patchy tussock grasslands.
Laterite System Low lateritic plateaux, mesas, buttes and gravelly rises and plains supporting sparse mulga shrublands.
Rocklea System Basalt hills, plateaux, lower slopes and minor stony plains supporting hard spinifex and occasionally soft spinifex grasslands with scattered shrubs.
Roy Hill Iron Ore Pty Ltd Life of Mine Water Management Strategy Vegetation Risk Assessment , February 2019
Page | 4
Land System Description
Spearhole System Gently undulating gravelly hardpan plains and dissected slopes supporting groved mulga shrublands and hard spinifex.
Adrian System Stony plains and low silcrete hills supporting hard spinifex grasslands.
Brockman System Gilgai alluvial plains with cracking clay soils supporting tussock grasslands and low woodlands.
Calcrete System Low calcrete platforms and plains supporting shrubby hard spinifex grasslands.
Coolibah System Flood plains with weakly gilgaied clay soils supporting coolibah woodlands with tussock grass understorey.
Cowra System Plains fringing the Marsh land system and supporting snakewood and mulga shrublands with some halophytic undershrubs.
Divide System Gently undulating sandplains with minor dunes, supporting hard spinifex hummock grasslands with numerous shrubs.
Fan System Washplains and gilgai plains supporting groved mulga tall shrublands and minor tussock grasslands.
Marillana System Gravelly plains with large drainage foci and unchannelled drainage tracts supporting snakewood shrublands and grassy mulga shrublands.
Marsh System Lakebeds and flood plains subject to regular inundation, supporting samphire shrublands, salt water couch grasslands and chenopod shrublands.
Narbung System Alluvial washplains with prominent internal drainage foci supporting snakewood and mulga shrublands with chenopod low shrubs.
Washplain System Hardpan plains supporting groved mulga shrublands.
1.4 Significant Vegetation and Flora
1.4.1 Priority Ecological Communities
The following Priority Ecological Communities (PECs) have been identified in the study area (Biologic Environmental Survey 2018) (Figure 1):
Fortescue Marsh (Land System) – Priority 1. Fortescue Marsh is an extensive, episodically inundated samphire marsh at the upper terminus of the Fortescue River and the western end of Goodiadarrie Hills. It is regarded as the largest ephemeral wetland in the Pilbara. It is a highly diverse ecosystem with fringing mulga woodlands (on the northern side), samphire shrublands and groundwater dependent riparian ecosystems. It is an arid wetland utilised by waterbirds and supports a rich diversity of restricted aquatic and terrestrial invertebrates. Recorded locality for night parrot, bilby and several other threatened vertebrate fauna. Endemic Eremophila species, populations of Priority flora and several near endemic and new to science samphires.
Vegetation of sand dunes of the Hamersley Range/Fortescue Valley – Priority 3. These red linear iron-rich sand dunes lie on the Divide Land System at the junction of the Hamersley Range and Fortescue Valley, between Weeli Wolli Creek and the low hills to the west. A small number are vegetated with Acacia dictyophleba scattered tall shrubs over Crotalaria cunninghamii, Trichodesma zeylanicum var. grandiflorum open shrubland. They are regionally rare, small and fragile and highly susceptible to threatening processes.

Roy Hill Iron Ore Pty Ltd Life of Mine Water Management Strategy Vegetation Risk Assessment , February 2019
Page | 5
Narbung Land System – Priority 3. Alluvial washplains with prominent internal drainage foci supporting snakewood and mulga shrublands with halophytic low shrubs.
For the purpose of the Impact Assessment, the PECs were mapped across the project area using the following sources:
Fortescue Marsh (Land System) – Priority 1. Polygon boundaries were derived from the Department of Primary Industries and Regional Development (DPIRD) dataset "Soil-landscape Systems of Western Australia".
Vegetation of sand dunes of the Hamersley Range/Fortescue Valley – Priority 3. Polygon boundaries were derived from the Department of Biodiversity, Conservations and Attractions (DBCA) dataset "Threatened Ecological Communities (DBCA-038)".
Narbung Land System – Priority 3. Polygon boundaries were derived from the DPIRD dataset "Soil-landscape Systems of Western Australia".
It is noted that the Narbung Land System PEC is absent from the current version of the Threatened Ecological Communities (DBCA-038) dataset (Department of Biodiversity, Conservation, and Attractions 2018) except for a small area approximately 1 km in diameter which occurs within the Narbung Land System polygon. However, given that the Narbung Land System is listed as a PEC in Department of Parks and Wildlife (2017), it is classified as a Priority 3 PEC in subsequent sections of this report.
1.4.2 Hydrology of the Fortescue Marsh
The Fortescue Marsh, a Priority 1 PEC, is an extensive wetland system, approximately 100 km long and 10 km wide, which is periodically inundated by flood water during large rainfall events (McKenzie, May, and McKenna 2002). Inflows are derived from the upper catchment of the Fortescue River. The Lower Fortescue River is separated from the Fortescue Marsh and Upper Fortescue River by the Goodiardarrie Hills. Outflow occurs only after very large cyclonic events, which may only occur a few times every 100 years. While surface water flows may be relatively rapid, groundwater flow rates are very slow (Rio Tinto Iron Ore 2013). Groundwater recharge rates in the broader Fortescue Valley are estimated at between 1% and 3% of total annual rainfall (MWH Australia 2015), but this is likely to be much lower within the Fortescue Marsh. Groundwater discharge principally occurs via soil evaporation (where the water table is shallow), evaporation from surface water (when present), and evapotranspiration from the fringes where vegetation occurs. With evaporation far in excess of rainfall, the net result is that the Fortescue Marsh acts as a groundwater sink (Managed Recharge 2018). Due to internal drainage coupled to high evaporation rates, the groundwater underlying the Fortescue Marsh is hypersaline (MWH Australia 2015). There is, however, potential for the development of freshwater lenses at the upper surface of these hypersaline water bodies, especially around the fringe of the marsh.
1.4.3 Priority Flora
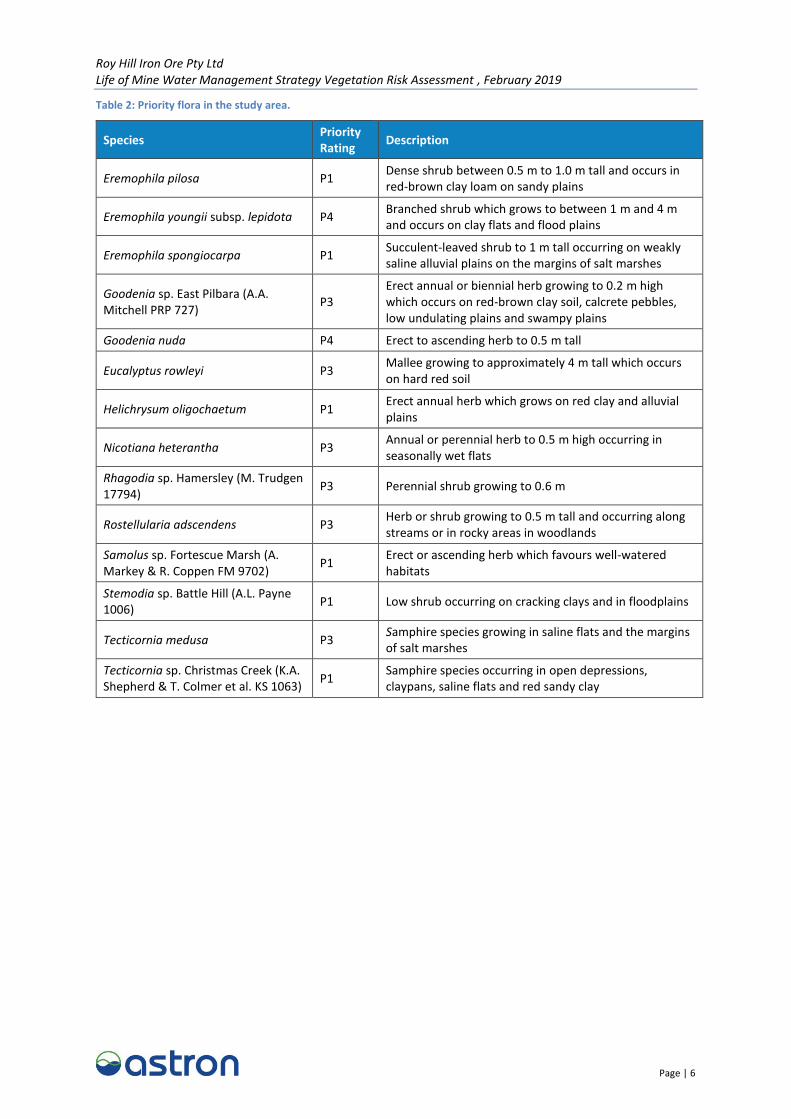
Based on existing vegetation mapping (Appendix A, Table A.1), 14 Priority-listed flora have been identified in the study area (Table 2).
Roy Hill Iron Ore Pty Ltd Life of Mine Water Management Strategy Vegetation Risk Assessment , February 2019
Page | 6
Table 2: Priority flora in the study area.
Species Priority Rating
Description
Eremophila pilosa P1 Dense shrub between 0.5 m to 1.0 m tall and occurs in red-brown clay loam on sandy plains
Eremophila youngii subsp. lepidota P4 Branched shrub which grows to between 1 m and 4 m and occurs on clay flats and flood plains
Eremophila spongiocarpa P1 Succulent-leaved shrub to 1 m tall occurring on weakly saline alluvial plains on the margins of salt marshes
Goodenia sp. East Pilbara (A.A. Mitchell PRP 727)
P3 Erect annual or biennial herb growing to 0.2 m high which occurs on red-brown clay soil, calcrete pebbles, low undulating plains and swampy plains
Goodenia nuda P4 Erect to ascending herb to 0.5 m tall
Eucalyptus rowleyi P3 Mallee growing to approximately 4 m tall which occurs on hard red soil
Helichrysum oligochaetum P1 Erect annual herb which grows on red clay and alluvial plains
Nicotiana heterantha P3 Annual or perennial herb to 0.5 m high occurring in seasonally wet flats
Rhagodia sp. Hamersley (M. Trudgen 17794)
P3 Perennial shrub growing to 0.6 m
Rostellularia adscendens P3 Herb or shrub growing to 0.5 m tall and occurring along streams or in rocky areas in woodlands
Samolus sp. Fortescue Marsh (A. Markey & R. Coppen FM 9702)
P1 Erect or ascending herb which favours well-watered habitats
Stemodia sp. Battle Hill (A.L. Payne 1006)
P1 Low shrub occurring on cracking clays and in floodplains
Tecticornia medusa P3 Samphire species growing in saline flats and the margins of salt marshes
Tecticornia sp. Christmas Creek (K.A. Shepherd & T. Colmer et al. KS 1063)
P1 Samphire species occurring in open depressions, claypans, saline flats and red sandy clay

Roy Hill Iron Ore Pty Ltd Life of Mine Water Management Strategy Vegetation Risk Assessment , February 2019
Page | 7
2 Literature Review
2.1 Ecohydrological Units
MWH Australia (2015) spatially delineated the landscape in the Fortescue Marsh region using an ecohydrological conceptualisation approach. This approach integrated information on land systems (Table 1), surface drainage networks, groundwater systems and inferred vegetation water use based on vegetation mapping and Landsat imagery (MWH Australia 2015). The result was the classification of the landscape into nine broad ecohydrological units (Table 3; Appendix B). A provisional level of risk is assigned to these units on the basis of their proximity to the modelled changes in groundwater depth and quality (GHD 2018) and the probability of interactions with groundwater. Refinement, both conceptually and spatially, of these risk levels is developed in section 2.4 and section 3.1.

Roy Hill Iron Ore Pty Ltd Life of Mine Water Management Strategy Vegetation Risk Assessment , February 2019
Page | 8
Table 3: Conceptualised Ecohydrological units in the Fortescue Marsh region (MWH Australia 2015). Risk of impact owing to the Life of Mine (LoM) Water Management Strategy is indicated.
Ecohydrological unit
Landscape position, land surface and soils
Level of connectivity to groundwater systems
Major vegetation types Risk due to LoM Water Management Strategy (GHD 2018)
1 Upland source areas - hills, mountains, plateaux.
Land surface is steep and rocky. Shallow or skeletal soils with frequent bedrock exposures.
Local and regional groundwater systems are deep and not accessible to vegetation.
Preferential recharge can occur as dictated by local scale geology/regolith.
Hummock grasslands.
Vegetation water demand met by direct rainfall and localised surface redistribution.
Negligible risk of impact.
2 Upland source areas – dissected slopes and plains, down-gradient from ecohydrological unit (EHU) 1.
Land surface is sloping with shallow to moderately deep colluvial soils.
Local and regional groundwater systems are deep and not accessible to vegetation
Preferential recharge can occur as dictated by local scale geology/regolith.
Hummock grasslands.
Vegetation water demand met by direct rainfall and localised surface redistribution.
Negligible risk of impact.
3 Upland transitional areas – drainage floors within EHUs 1 and 2 which accumulate surface flows from up-gradient.
Soils of variable depth derived from alluvium. Greater storage relative to soils in EHU 1 and 2.
Local and regional groundwater systems are deep and not accessible to vegetation.
Smaller drainage floors support hummock grasslands; larger drainage floors support Eucalyptus and Acacia shrublands and woodlands.
Vegetation water demand met by direct rainfall and stored soil water replenished by infrequent flood events.
Negligible risk of impact.
4 Upland channel zones - channel systems of higher order streams (generally ≥5th order) which dissect EHU 1 and EHU 2.
Channels are high energy flow environments, subject to bed load movement and reworking.
Soils of variable depth derived from alluvium including zones of deep soils. Generally high infiltration rates.
Regional groundwater systems are deep and not accessible to vegetation.
Transient or less commonly persistent shallow groundwater systems may develop beneath channels in places, as dictated by local scale geology/regolith. In rare cases these may be connected with pools.
In rare cases vegetation may access perched groundwater for periods of time.
Channels are typically lined with narrow woodlands of E. victrix, A. citrinoviridis and/or other Eucalyptus and Acacia species. These are sustained by soil water replenishment from flow events
Negligible risk of impact.

Roy Hill Iron Ore Pty Ltd Life of Mine Water Management Strategy Vegetation Risk Assessment , February 2019
Page | 9
Ecohydrological unit
Landscape position, land surface and soils
Level of connectivity to groundwater systems
Major vegetation types Risk due to LoM Water Management Strategy (GHD 2018)
5 Lowland sandplains - landform characterised level or gently undulating plains up to 10 km in extent.
Deep sandy soils of aeolian origin.
Uncommonly features linear dunes up to about 15 m in height.
Groundwater systems are generally deep and not accessed by vegetation.
May include important zones of recharge, with associated groundwater mounding. Possibility of transient or more persistent perched groundwater at localised scales, depending on regolith characteristics.
Hummock grasslands, with Acacia sp. and other shrubs, occasional mallee Eucalypts. Distinctive grassland communities relative to other EHUs.
Tracts receiving run-on include Acacia and Eremophila shrublands.
Some risk of impact owing to groundwater mounding at the northern extent of the unit associated with the interface of unit 6.
6 Lowland alluvial plains – broad depositional plains of low relief.
Soils typically loams, earths and shallow duplex types. Subsurface calcareous hardpans are frequently encountered.
Groundwater systems are generally moderately deep (>10 m) to deep (>20 m) and not accessed by vegetation.
Acacia shrublands; less commonly Hummock grasslands, Tussock grasslands or low shrublands of Bluebush/Saltbush.
Risk of impact owing to groundwater mounding, particularly in areas within the area of injection.
Low risk of impact owing to groundwater drawdown in the vicinity of dewatering.
7 Lowland calcrete plains –plains of low relief generally bordering major drainage tracts and termini.
Shallow soils underlain by calcrete of variable thickness, which occasionally outcrops.
Depth to groundwater may vary from shallow (<5 m) to deep (>20 m).
Preferred pathways may facilitate rapid recharge at local scale.
Groundwater systems are generally not accessed by vegetation. Groundwater systems in calcrete can provide important stygofauna habitat.
Hummock grasslands and Acacia scrublands with occasional Eucalypts.
Distinctive vegetation communities relative to other EHUs.
Some risk of impact due to groundwater mounding.

Roy Hill Iron Ore Pty Ltd Life of Mine Water Management Strategy Vegetation Risk Assessment , February 2019
Page | 10
Ecohydrological unit
Landscape position, land surface and soils
Level of connectivity to groundwater systems
Major vegetation types Risk due to LoM Water Management Strategy (GHD 2018)
8 Lowland major channel systems and associated floodplains - supporting large flow volumes in flood events.
Channels are high energy flow environments, subject to bed load movement and reworking. They may be physically altered by cyclonic floods.
Depth to groundwater may vary from shallow (<5 m) to deep (>20 m).
Channels are significant recharge zones.
Transient, persistent or permanent shallow groundwater systems may develop beneath channels in places, as dictated by local scale geology/regolith. These may be connected with pools in some situations. Groundwater is generally fresh.
Groundwater systems can be accessible to vegetation in some situations.
Evaporative discharge of shallow groundwater may occur.
Inflows from up-gradient sources sustain Eucalyptus and Acacia forest and woodland vegetation communities or Tussock grasslands.
Supports most of the recognised groundwater dependent vegetation communities in the central Pilbara (with the key indicator species being Eucalyptus camaldulensis, E. victrix and Melaleuca argentea).
Some risk of impact due to groundwater mounding, particularly if associated with salinisation.
9 Lowland receiving areas - drainage termini in the form of ephemeral lakes, claypans and flats.
Deep silty and clay textured soils. Variable surface salinity (resulting from evaporites). Soils may be underlain by calcrete/ silcrete hardpans of variable depth.
Depth to groundwater may vary from shallow (<5 m) to deep (>20 m).
Groundwater may be fresh, brackish or saline.
Groundwater systems can be accessible to vegetation in some situations.
Evaporative discharge of shallow groundwater may occur.
Fringed or occupied by distinctive vegetation communities such as Samphire. Regularly inundated areas may be largely devoid of vegetation.
Vegetation adapted to waterlogging, flooding and salinity stressors.
Potential to support groundwater dependent ecosystems, depending on the level of surface and groundwater connectivity. However this is likely to be uncommon.
Low risk of impact owing to groundwater drawdown.
Some risk of impact due to groundwater mounding, particularly if associated with salinisation.

Roy Hill Iron Ore Pty Ltd Life of Mine Water Management Strategy Vegetation Risk Assessment , February 2019
Page | 11
2.2 Groundwater Drawdown
Groundwater drawdown will potentially reduce the water available to phreatophytic (groundwater dependent) vegetation. The effect may be incremental, and will depend on the proximity of groundwater from the ground surface and whether species have developed a reliance on groundwater. Loss of contact with groundwater may encourage plants to develop deeper roots to track the position of the water table. If the rate of root growth does not match the rate of groundwater drawdown, plants will become dependent on soil moisture stored in the unsaturated zone. If the store of water in the unsaturated zone is insufficient to meet the demands of plants formerly in contact with groundwater, decline and mortality are likely to result.
2.2.1 Magnitude and Rate of Groundwater Drawdown, and Antecedent Conditions
Generally, the impact on groundwater dependent vegetation (GDV) will be directly related to the magnitude of groundwater drawdown. The likelihood of impact is clearly very high in situations when drawdown is of sufficient magnitude to lower the water table below the rooting depth of GDV. However, this influence decreases with increasing depth to groundwater pre-drawdown (the antecedent condition), due to a lesser pre-existing dependence on groundwater of GDV. Dependence is greatly reduced in areas where the water table exceeds a threshold depth, likely to lie between 7 m and 12 m (Benyon, Theiveyanathan, and Doody 2006; Department of Water 2009; Zolfaghar et al. 2014), with 10 m suggested as a general threshold (Eamus et al. 2006).
The rate at which vegetation is impacted by drawdown is directly proportional to the rate of groundwater drawdown. Gradual drawdown results in a slower progression of reduced water availability and a greater opportunity for plants to adapt to the altered groundwater regime, whereas rapid drawdown results in the rapid acceleration of negative impacts (Froend et al. 2004). In theory, plant roots can maintain a functional connection with groundwater as long as the rate of water table decline does not exceed potential maximum rate of root growth (Naumburg et al. 2005). Specific information on critical drawdown rates for Pilbara vegetation are largely unavailable, but for phreatophytic species in south-western Australia, drawdown rates exceeding 1 cm d-1 would likely result in a loss of root contact with groundwater (Froend et al. 2004).
2.3 Groundwater Mounding
Negative impacts to vegetation can occur as a result of groundwater rise (mounding). These impacts usually arise in situations where the water table envelops a large proportion of the root system. Soil aeration is physiologically important to plants. Oxygen is required for normal plant metabolism. Unless there is a rapid exchange of gas between the soil and the air, the oxygen supply soon becomes limiting for plant growth. The rate of exchange between soil and aboveground air decreases with decreasing soil porosity and increasing water content. Flooding of the capillary pore spaces in soil is highly likely to result in roots suffering severe oxygen deficiency due to the fact that soil air is displaced by water. Flooding also forces roots to obtain most of their oxygen from the shoot by diffusion through the complex, a tortuous, highly inefficient pathway.
Most woody plants are not adapted to complete immersion in hypoxic, waterlogged soil conditions for extended periods of time. In general, plants that develop adventitious roots can usually survive flooding better than those that do not. It is well known that trees and other plants growing in poorly drained soil often develop shallow root systems concentrated in the better aerated soil surface (Kramer and Boyer 1995).
Further, and potentially more severe, impacts from mounding will arise if the groundwater entering the root zone is saline. Salt induces a loss of physiological function through osmotic or toxic effects.

Roy Hill Iron Ore Pty Ltd Life of Mine Water Management Strategy Vegetation Risk Assessment , February 2019
Page | 12
Some species may tolerate prolonged salt exposure by excluding ions prior to water entering the transpiration stream or by compartmentalising salt within the plant in leaf vacuoles (Munns 2002). Most species, however, are highly sensitive to salt exposure. Groundwater may be naturally saline, resulting in a root zone which is constrained to the water table depth and (part of) the capillary fringe. The upper layer of groundwater in these systems may, however, be relatively fresh due to stratification. These thin lenses of fresh groundwater may be important water resources for phreatophytic vegetation.
Salinisation of soils may also occur through capillary rise if the underlying groundwater is highly saline or by mobilisation of salt already held in soil by rising groundwater. Specific soil salinity tolerance for plant species native to the Pilbara is largely unknown. In general, however, soils with an electrical conductivity of soil saturated paste extract (ECe) above 2 dS m-1 to 4 dS m-1 are considered salt affected (Moore 2001) and only highly salt tolerant species such as saltbush and samphires occur in areas where the soil ECe exceeds 16 dS m-1. Electrical conductivities (ECs) of groundwater exceeding 8.5 dS m-1 have been detected in the project area (MWH Australia 2015), which would be sufficient to induce stress in most vegetation types if it entered the root zone.
2.3.1 Magnitude and Rate of Groundwater Mounding
Like groundwater drawdown, the impact of groundwater mounding on vegetation will depend on the magnitude. Where the depth to groundwater is large, and root contact is unlikely, mounding may have little to no impact on vegetation. However, if the groundwater is near the surface or if the magnitude of mounding is sufficient to elevate groundwater into the root zone, impacts are likely. Even if groundwater mounding does not result in waterlogging, it may encourage an increase in productivity (increase in leaf area) which can result in negative impacts if the water table falls following recharge activities. This occurs because the increase in leaf area, or more specifically leaf area index, may not be matched by an investment in root growth, since water is easily accessible to the existing root system. The sudden lowering of groundwater after a prolonged period of mounding could amount to a significant risk of mortality owing to unbalanced growth: specifically, the inability of the root system to meet the demands of a canopy with a high leaf area index.
The impacts of mounding will, to some extent, depend on the rate of groundwater rise (and its subsequent decline in the case of unbalanced growth). If mounding occurs gradually there may be opportunities for roots to develop above the zone of saturation, thereby compensating for roots that have had functional extent pruned to the level of the water table. If mounding occurs rapidly, this adjustment may not be possible and any pruning will represent a net loss of functional root area which will reduce the ability of the plant to obtain resources. If mounding of saline water occurs, the impact to vegetation will be even more severe: in addition to root pruning, the saline groundwater at the capillary fringe will either not be used by vegetation, or if used, be toxic.
2.4 Ecohydrological Types
In assessing the risk of impact to vegetation from altered hydrology arising from the project, ecohydrological types were assigned to vegetation units. The ecohydrological types considered were:
xerophyte
surface flow dependent
sheet flow dependent
halophyte
groundwater dependent (Phreatophyte).

Roy Hill Iron Ore Pty Ltd Life of Mine Water Management Strategy Vegetation Risk Assessment , February 2019
Page | 13
2.4.1 Xerophyte
Xerophytic vegetation is defined as terrestrial vegetation that is dependent on water stored in the soil profile to meet some or all of their water requirements. Soil water is recharged by various means, most commonly via the direct infiltration of rainfall. When xerophytes co-occur with phreatophytes it is possible that passive hydraulic redistribution via phreatophytic roots enables xerophytes to access groundwater (Richards and Caldwell 1987).
2.4.2 Surface Flow Dependent Vegetation
Surface flow dependent vegetation (SFDV) is effectively a subset of xerophytic vegetation that requires additional water derived from surface water flows. SFDV can, in some instances, also use groundwater. SFDV can occur in a variety of areas in the landscape where soil water is partially recharged by surface water flows. For larger water courses, this includes both the hyporheic zone (the region beneath and alongside a stream bed where there is a mixing of surface water and shallow groundwater) and the flanking transition zone between the active channel and the surrounding uplands, often referred to as the riparian zone (Hayashi and Rosenberry 2002). SFDV can also occur within and along smaller drainage lines in which surface water flows infiltrate into the soil.
2.4.3 Sheet Flow Dependent Vegetation
Sheet flow dependent vegetation (ShFDV) is functionally similar to SFDV except that this vegetation type typically occurs outside of drainage lines on shallow sloping areas (slopes < 2 degrees) (Mabutt and Fanning 1987; Ludwig et al. 1997). This vegetation type often forms bands, with the long axis of these bands oriented along the contours of the slopes on which they form. In the project area, the banded vegetation is likely to be dominated by mulga, members of the Acacia aneura complex (Miller, Andrew, and Maslin 2002), giving rise to the colloquial term ‘banded mulga’. Water is able to flow fairly uniformly across broad areas (termed sheet flow) on these shallow slopes before infiltrating into the soil. The film of water characteristically has low volume, low velocity and low energy and therefore seldom causes soil erosion in natural, undisturbed areas (Ludwig et al. 1997). Banded mulga is of significance to both hydrological and nutrient cycling because faster infiltration of water into vegetated ground, as opposed to base soil, leads to a net accumulation of resources within this vegetation type (Puigdefábregas 2005). This in turn has the potential to increase primary productivity and provide ecologically important habitat.
2.4.4 Halophyte
Halophytes are extraordinary plants that endure salt concentrations that cause mortality in most other species. Being adapted to grow and survive under these hostile conditions, halophytes usually occupy areas where hydrological processes lead to the concentration of salts in the surface soil layers. Halophytes may derive water from incident rainfall or episodic flood waters. Some species may therefore develop tolerance to waterlogging. Furthermore, the intervening period between recharge by rainfall or flood is often characterised as in drought (Marchesini et al. 2014). In saline soils, drought inevitably leads to an increase in salinity, as the concentration of ions in the soil solution increases proportionally with the loss of water. Some, but not all, of the physiological mechanisms that provide drought tolerance and salinity tolerance are similar (Munns 2002). Halophytes, therefore, are often considered to be tolerant to both drought and salinity and are given the term hygrohalophytic. However, for clarity, this report uses the term halophyte even though many of these species may also tolerate periods of drought.

Roy Hill Iron Ore Pty Ltd Life of Mine Water Management Strategy Vegetation Risk Assessment , February 2019
Page | 14
2.4.5 Phreatophyte
Phreatophytic vegetation is defined as terrestrial vegetation that is dependent on the presence of groundwater to meet some or all of their water requirements such that vegetation community structure and function is maintained (Orellana et al. 2012). In this context, the terms facultative phreatophyte and obligate phreatophyte have been used to describe vegetation that is partly or entirely reliant on groundwater, respectively.
Phreatophytic vegetation is commonly associated with the riparian zones and floodplains of ephemeral creeks and rivers in arid and semi-arid areas of Australia including the Pilbara, and they may form part of the vegetation complex considered in this report. Vegetation in these areas is often broadly categorised as ‘riparian vegetation’, of which phreatophytic species are an important subset. However, phreatophytic species sometimes occur in other areas of the landscape, as dominant or minor elements of communities, depending on soil type, groundwater depth and species rooting depth.
Eucalyptus victrix and E. camaldulensis are present within the project area, both of which are classed as facultative phreatophytes. This definition implies that these species might occasionally or opportunistically use groundwater, but they most likely rely on stored soil water to meet the majority of their water requirement. However, given the preferred presence of these species along water courses, it is reasonable to suggest that recharge of soil water by rainfall alone is insufficient to fulfil their water requirements, and that regular recharge by surface water flows is necessary for these species to thrive.
2.5 Key Vegetation Types in the Study Area
2.5.1 Mulga
Mulga species are generally shallow-rooted and well adapted to sourcing water stored in shallow soil layers derived from rainfall and infiltration of surface flows including sheet flow. Their root system is also well adapted for 'harvesting' rainfall intercepted by the canopy and directing it to the surface soils around the base of the trunk (Page and Grierson 2012). A previous project conducted by Astron on the root system architecture of Acacia. aneura in the vicinity of the Fortescue Marsh showed that A. aneura lacks a substantial taproot or sinker roots but has an extensive system of shallow lateral roots mostly within the top 1 m of the profile (Astron, unpublished data). It is likely that mulga root systems in the study area are predominantly shallow and almost fully contained within the top 3 m of the profile. Although the maximum rooting depth of many mulga species is unknown, root biomass beyond 3 m depth is likely to be very small. The increased productivity of mulga growing the riparian zone suggests that this vegetation type is supplemented by surface water flows, and in these locations may be classified as SFDV. Similarly, the higher productivity of banded mulga formations that occur outside of the riparian zone may be classified as ShFDV. Any activities that reduce (or alter the quality of) the surface or sheet flows to these vegetation types could have negative consequences.
2.5.2 Samphire
Samphire vegetation, defined here as Tecticornia species (Shepherd and Wilson 2007), are halophytic plants of the subfamily Salicorniodeae (Chenopodiaceae). These species are highly salt tolerant, and inhabit coastal and inland salt marshes where most other species cannot survive (Saintilan 2009). Although many adaptations enable samphires to inhabit salt marshes, the key to their salinity tolerance is an ability of roots to select for specific monovalent ions, namely potassium, despite competition for uptake from sodium (Flowers and Colmer 2008).
Roy Hill Iron Ore Pty Ltd Life of Mine Water Management Strategy Vegetation Risk Assessment , February 2019
Page | 15
While the salinity of most salt marshes in Australia is driven by discharging groundwater, in some large wetlands, including the Fortescue Marsh, salinity develops from progressive evaporation of episodic floodwaters that eventually seeps and mixes with the underlying groundwater (Skryzpek, Dogramaci, and Grierson 2013). The process of flood water deposition, recession and evaporation results in specific zonation in key environmental variables. Central parts of salt marshes are often highly saline and may be subject to long periods of inundation but the fringes may be relatively fresh and usually remain free of surface water during flood events. The characteristic distribution of samphire vegetation across salt marshes (Coleman 2001; Datson 2002) is believed to reflect the specific adaptions of species to this environmental zonation (English and Colmer 2013). The keystone samphire species considered in this literature review that occur within the Fortescue Marsh exhibit this zonal distribution.
An understanding of the sensitivity of samphire species to altered hydrology centres on the inherent zonation of species on the margins of salt marshes. Species on the outer fringe of salt marshes will likely be more sensitive to salinity than species growing toward the centre of salt marshes. A reasonable assertion would be that drought tolerance follows these patterns but a recent study on samphire species found that drought tolerance was similar in species that occupied different positions in a salinity gradient (Marchesini et al. 2014). Although samphires in the project area are likely to rely on soil water or, periodically, surface water, there is some indication that shallow groundwater is also used as a water source (MWH Australia 2015).
2.5.3 Eucalyptus victrix, Eucalyptus camaldulensis and Other Potential Phreatophytes
From previous vegetation surveys and health monitoring reports (Ecologia Environment 2009; Astron Environmental Services 2015), two key species with potential groundwater dependence are known to be present in the study area: Eucalyptus victrix and E. camaldulensis. Of note, the project area is known to support a range of other large woody species that commonly co-occur with E. victrix and E. camaldulensis in the riparian zones (for example, Corymbia candida, Acacia coriacea, Atalaya hemiglauca, Ehretia saligna var. saligna and Melaleuca glomerata). Very little is known about the water use, water sources or rooting depths of these species. None are known to be obligate phreatophytes but the possibility cannot be discounted that some of the larger individuals of these species (> 5 m in height) may be facultatively dependent on groundwater to some degree based on the depth to groundwater across most of the study area.
2.5.4 Grassland
Hummock and Tussock grasslands are relatively common in the study area. Hummock grasslands are dominated by Triodia species. These evergreen perennials occur as mounds up to 1 m in height on sandy or skeletal soils with flat, undulating or hilly terrain. Tussock grasslands are typified by perennial grasses with a tufted habit. A wide variety of genera comprise these systems. Common examples in the Pilbara are Aristida and Themeda species. Both Hummock and Tussock grasslands represent vegetation types dominated by xerophytes. There is however, the potential for these shallow rooted species to access groundwater where water is redistributed from deep to shallow layers via the roots of co-occurring phreatophytic trees, a process known as hydraulic lift (Dawson and Pate 1996).
2.5.5 Priority Flora
Most of the priority flora that occur in the project area are shrubs or herbs that fall into the xerophyte ecohydrological classification. Exceptions to this are E. spongiocarpa P1, T. medusa P3 and Tecticornia sp. Christmas Creek P1, which are classified as halophytes because of their occurrence within or on the fringes of salt marshes. A further exception is applied to Samolus sp. Fortescue Marsh P1, an erect ascending herb which occurs in damp areas on the margins of pools or river
Roy Hill Iron Ore Pty Ltd Life of Mine Water Management Strategy Vegetation Risk Assessment , February 2019
Page | 16
banks. This species is classified as surface flow dependent given the probability that its rooting depth is relatively restricted and therefore unlikely to contact groundwater.
2.6 Summary
Several important vegetation types and flora species were identified from the Literature Review. Vegetation comprised of mulga or phreatophytes (E. victrix and E. camaldulensis) was regarded as important based on the fact that regulatory conditions are often attached to approvals where impacts to such vegetation may occur; the RHIO iron ore mine has conditions under Ministerial Statements (MS) 824 and 829 for the management of groundwater dependent vegetation, and MS 979 and 980 for the management of surface flows and mulga. Furthermore, mulga, E. victrix and E. camaldulensis are regarded as vegetation types that offer considerable conservation values. In addition, three PECs occur in the study area. Principal among these is the Fortescue Marsh, a highly diverse Priority 1 PEC which supports a mixture of vegetation types including samphires and groundwater dependent ecosystems.
Groundwater drawdown and groundwater mounding can be conceptualised as hydrological processes that may lead to stress in specific vegetation types. For groundwater drawdown this will involve decoupling of roots from a reliable water source. Conversely, groundwater mounding has the potential to envelop roots in water for long periods, thereby increasing the probability of stress due to waterlogging. If the water entering the root zone due to groundwater mounding is saline, this stress will be exacerbated by osmotic or toxic effects. In the specific case where groundwater mounding is followed by groundwater recession, stress may arise due to unbalanced growth; that is, canopy growth during groundwater mounding is not matched by root growth which results in drought stress when the water table recedes.
The risks associated with groundwater drawdown and groundwater mounding are dependent on the spatial and temporal dynamics of specific activities and, in the context of mounding, the quality of water and the depth of injection. Species may profit, tolerate or die due to shifts in the hydrological regime (Lytle and LeRoy Poff 2004). The risk of mortality owing to groundwater drawdown and mounding will therefore depend on the adaptations of specific species or plant populations and the rate and magnitude of the changes in groundwater levels.
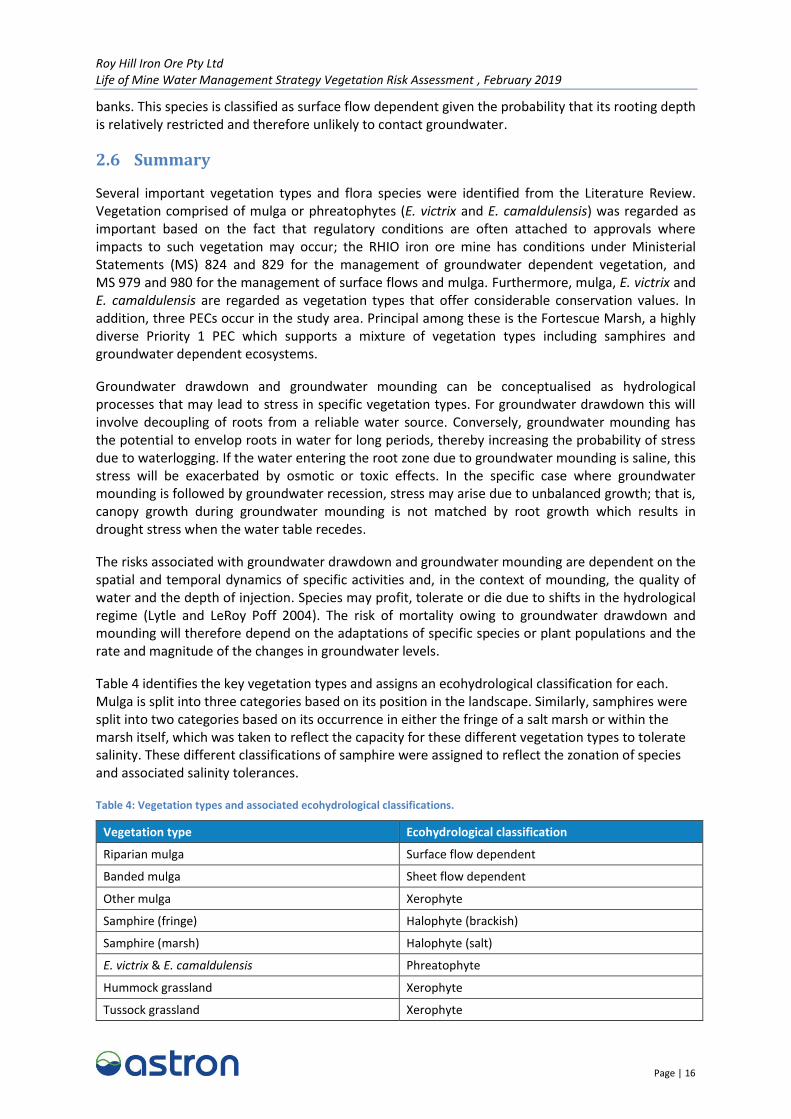
Table 4 identifies the key vegetation types and assigns an ecohydrological classification for each. Mulga is split into three categories based on its position in the landscape. Similarly, samphires were split into two categories based on its occurrence in either the fringe of a salt marsh or within the marsh itself, which was taken to reflect the capacity for these different vegetation types to tolerate salinity. These different classifications of samphire were assigned to reflect the zonation of species and associated salinity tolerances.
Table 4: Vegetation types and associated ecohydrological classifications.
Vegetation type Ecohydrological classification
Riparian mulga Surface flow dependent
Banded mulga Sheet flow dependent
Other mulga Xerophyte
Samphire (fringe) Halophyte (brackish)
Samphire (marsh) Halophyte (salt)
E. victrix & E. camaldulensis Phreatophyte
Hummock grassland Xerophyte
Tussock grassland Xerophyte

Roy Hill Iron Ore Pty Ltd Life of Mine Water Management Strategy Vegetation Risk Assessment , February 2019
Page | 17
3 Methods
3.1 Risk Assessment
A risk assessment framework was developed in accordance with a likelihood-consequence model (Table 5), with risk calculated as the product of likelihood and consequence (Department of Environmental Regulation 2017). The risk under consideration is a negative impact (biologically significant decline in condition or death) on populations in response to the following scenarios:
groundwater drawdown
groundwater mounding
unbalanced growth
groundwater mounding and salinisation (subsequently termed salinisation for simplicity).
Likelihood was conceptualised as the probability of a negative impact occurring, while consequence was conceptualised as the magnitude of the impact. Scores were assigned to each category of consequence and likelihood (shown in parentheses in Table 5). The terminology associated with Table 5 follows that outlined by Department of Environment Regulation (2017) (Table 6). Subsequent consideration of consequence and likelihood is aligned with this framework and terminology. By its very nature, the derivation of risk based on this framework is semi-quantitative and requires a degree of complexity.
Table 5: Risk rating matrix based on Department of Environment Regulation (2017). Scores assigned to each likelihood and consequence level are shown in parentheses.
Likelihood Consequence
Descriptor Slight (1) Minor (2) Moderate (3) Major (4) Severe (5)
Almost Certain (5) Medium High High Extreme Extreme
Likely (4) Medium Medium High High Extreme
Possible (3) Low Medium Medium High High
Unlikely (2) Low Medium Medium Medium High
Rare (1) Low Low Low Medium Medium
Table 6: Risk treatment table from Department of Environment Regulation (2017).
Risk rating Acceptability Treatment
Extreme Unacceptable. Risk event will not be tolerated.
High May be acceptable. Subject to multiple regulatory controls.
Risk event will be tolerated and may be subject to multiple regulatory controls.
Medium Acceptable, generally subject to regulatory controls.
Risk event is tolerable and is likely to be subject to some regulatory controls.
Low Acceptable, generally not controlled. Risk event is acceptable and will generally not be subject to regulatory controls.
3.1.1 Hydrological Criteria
Groundwater drawdown, for the purpose of this risk assessment, was defined as a reduction in the position of the water table from a reference point (the antecedent water level). Similarly, groundwater mounding was defined as an increase in the position of the water table from a

Roy Hill Iron Ore Pty Ltd Life of Mine Water Management Strategy Vegetation Risk Assessment , February 2019
Page | 18
reference point. In both cases the reference point was taken as the water levels derived for 2018. The hydrological modelling underpinning the RHIO LoM Water Management Strategy covers the period 2018 to 2031. The hydrological modelling considers six dewatering and injection scenarios, with injection occurring in the Southwest Injection Borefield and the MAR Stage 1 Mine Pit Injection field, or a combination of these areas and further injection in the Remote MAR North borefield and Remote MAR South borefield (either individually or in combination). This risk assessment considers scenario 2B, in which all four injection fields are used at the same time (GHD 2018). This scenario was selected because it represents the largest spatial extent of groundwater mounding, which is considered to pose the greatest threat to vegetation. Temporally, the model output for 2026 was selected to represent a period of high risk of decline or mortality because it represents a phase of the LoM Water Management Strategy when groundwater drawdown approaches the maximum depth and groundwater mounding has occurred over a sustained period. The risk of decline or mortality due to unbalanced growth would likely occur sometime after this phase as a consequence of groundwater recession. Figure 3 illustrates hypothetical water level changes in an area subject to groundwater drawdown and an area subject to groundwater mounding. Distinct elements of these hypothetical hydrographs depict the rate and magnitude of groundwater drawdown and groundwater mounding, and the rate of groundwater recession following the peak mounding period and rate of groundwater level recovery following the peak dewatering period. The specific case of salinisation is associated with groundwater mounding where the underlying shallow groundwater body is saline. These distinct elements of hydrological change arising from the LoM Water Management Strategy are incorporated into the risk assessment as described below.
Figure 3: Hypothetical plots of water level change depicting groundwater drawdown (drawdown) and groundwater mounding (mounding). Plots are based on hydrological modelling and the extreme water levels associated with scenario 2B (GHD 2018). Distinct elements of hydrological change used in the risk assessment are noted. Actual hydrological model runs do not indicate a return to the reference point in 2031.
Roy Hill Iron Ore Pty Ltd Life of Mine Water Management Strategy Vegetation Risk Assessment , February 2019
Page | 19
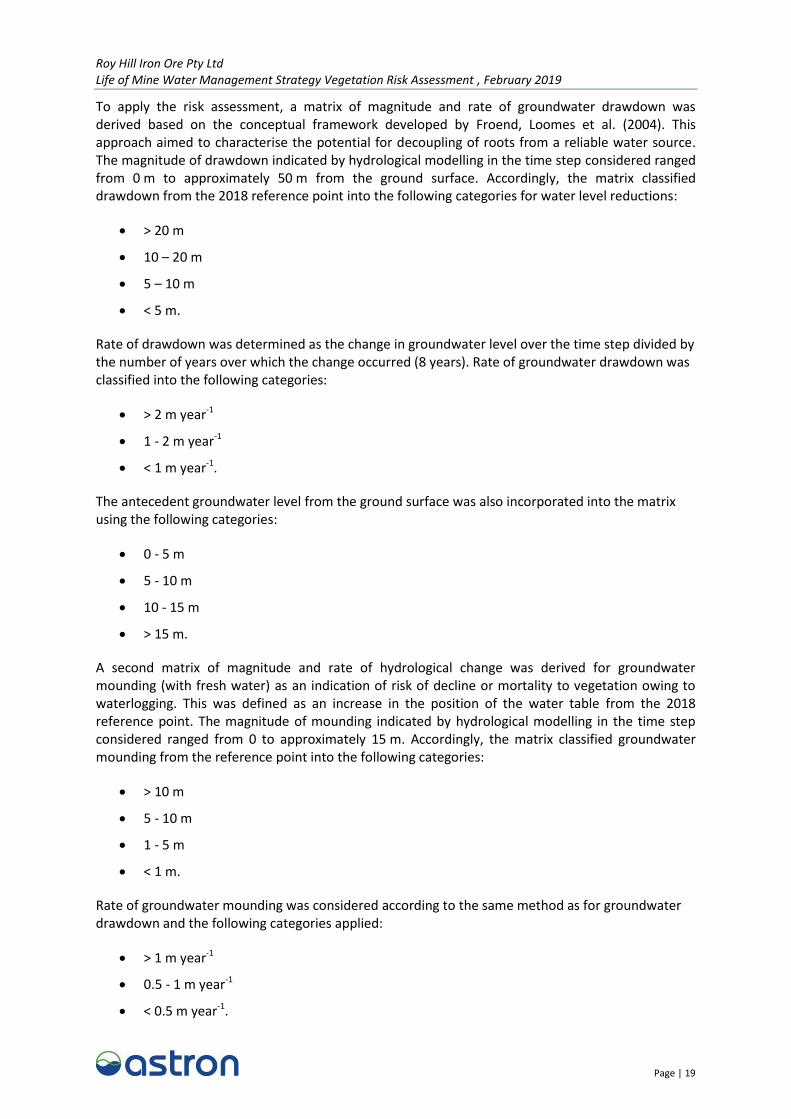
To apply the risk assessment, a matrix of magnitude and rate of groundwater drawdown was derived based on the conceptual framework developed by Froend, Loomes et al. (2004). This approach aimed to characterise the potential for decoupling of roots from a reliable water source. The magnitude of drawdown indicated by hydrological modelling in the time step considered ranged from 0 m to approximately 50 m from the ground surface. Accordingly, the matrix classified drawdown from the 2018 reference point into the following categories for water level reductions:
> 20 m
10 – 20 m
5 – 10 m
< 5 m.
Rate of drawdown was determined as the change in groundwater level over the time step divided by the number of years over which the change occurred (8 years). Rate of groundwater drawdown was classified into the following categories:
> 2 m year-1
1 - 2 m year-1
< 1 m year-1.
The antecedent groundwater level from the ground surface was also incorporated into the matrix using the following categories:
0 - 5 m
5 - 10 m
10 - 15 m
> 15 m.
A second matrix of magnitude and rate of hydrological change was derived for groundwater mounding (with fresh water) as an indication of risk of decline or mortality to vegetation owing to waterlogging. This was defined as an increase in the position of the water table from the 2018 reference point. The magnitude of mounding indicated by hydrological modelling in the time step considered ranged from 0 to approximately 15 m. Accordingly, the matrix classified groundwater mounding from the reference point into the following categories:
> 10 m
5 - 10 m
1 - 5 m
< 1 m.
Rate of groundwater mounding was considered according to the same method as for groundwater drawdown and the following categories applied:
> 1 m year-1
0.5 - 1 m year-1
< 0.5 m year-1.

Roy Hill Iron Ore Pty Ltd Life of Mine Water Management Strategy Vegetation Risk Assessment , February 2019
Page | 20
The same antecedent water levels that were applied to the condition of groundwater drawdown were also applied to groundwater mounding. A parallel matrix using the hydrological parameters for mounding was applied to the specific case of unbalanced growth (see section 2.3.1 for a definition) but with different likelihood levels (see section 3.1.2.). Decline or mortality owing to unbalanced growth is likely to occur upon groundwater recession, after the peak of groundwater mounding, with a greatest rate of recession associated with a higher likelihood of unbalanced growth. To capture this effect, the rate of groundwater recession between 2026 and 2031, as opposed to rate of groundwater mounding between 2018 and 2026, was incorporated into the matrix according to the following categories:
> 1 m year-1
0.5 - 1 m year-1
< 0.5 m year-1.
In areas where the shallow groundwater salinity is likely to exceed a total dissolved salts (TDS) of 6,000 mg L-1 (equivalent to an EC of approximately 8.5 dS m-1), which was derived from MWH Australia (2015), the combined effects of mounding and salinisation were considered using the same categories for mounding but with modified likelihood levels to reflect the elevated probability of decline or mortality due to incursions of this highly saline groundwater into the root zone (see section 3.1.2.). This approach was adopted because the LoM Water Management Strategy proposes to inject surplus water into the deeper confined aquifers (Managed Recharge 2018). This will potentially elevate the position of the water table (via pressure) without necessarily raising the salinity concentration of shallow groundwater (GHD 2018). The greatest risk of salinisation due to mounding will therefore be confined to areas where the underlying shallow groundwater is already saline.
3.1.2 Likelihood
Likelihood was based on known literature and expert opinion of the authors and reviewers in relation to the impacts to vegetation (decline or mortality) from the hydrological changes under the scenarios outlined above in section 3.1.1. Spatially, the criteria for likelihood were derived using mapping of vegetation types which was translated into ecohydrological types (Table 4) and then likelihood categories. In addition to the likelihood categories outlined in Table 4, a further category referred to as 'negligible' was introduced. This category defined conditions where the likelihood of impact was extremely unlikely, and was given a score of 0.
On-ground vegetation mapping for the study area is incomplete (Figure 1). To infill the large gaps in available vegetation mapping, Worldview and Sentinel satellite imagery was combined with a training dataset (obtained from available vegetation mapping, Appendix A, Table A.1) to characterise the major vegetation units (Table 4). Briefly, in areas where vegetation mapping was not available, vegetation types where characterised using interpretation of aerial imagery supplemented by a series of satellite-derived classification protocols which were informed by the available vegetation mapping.
Worldview satellite imagery and subsequent interpretation was used to classify the occurrence of E. victrix or E. camaldulensis in a subset of the project area (Astron Environmental Services 2016) (Figure 4), leading to the identification of GDV, i.e. phreatophytes. The classification restricted the identification of GDV to a probability greater than 60%. The use of Worldview imagery for identifying GDV (individual canopies and tree clumps) was constrained to areas that had been classified as riparian mulga based on other methods, effectively refining the classification of riparian vegetation into surface flow dependent or groundwater dependent ecohydrological types. The different
Roy Hill Iron Ore Pty Ltd Life of Mine Water Management Strategy Vegetation Risk Assessment , February 2019
Page | 21
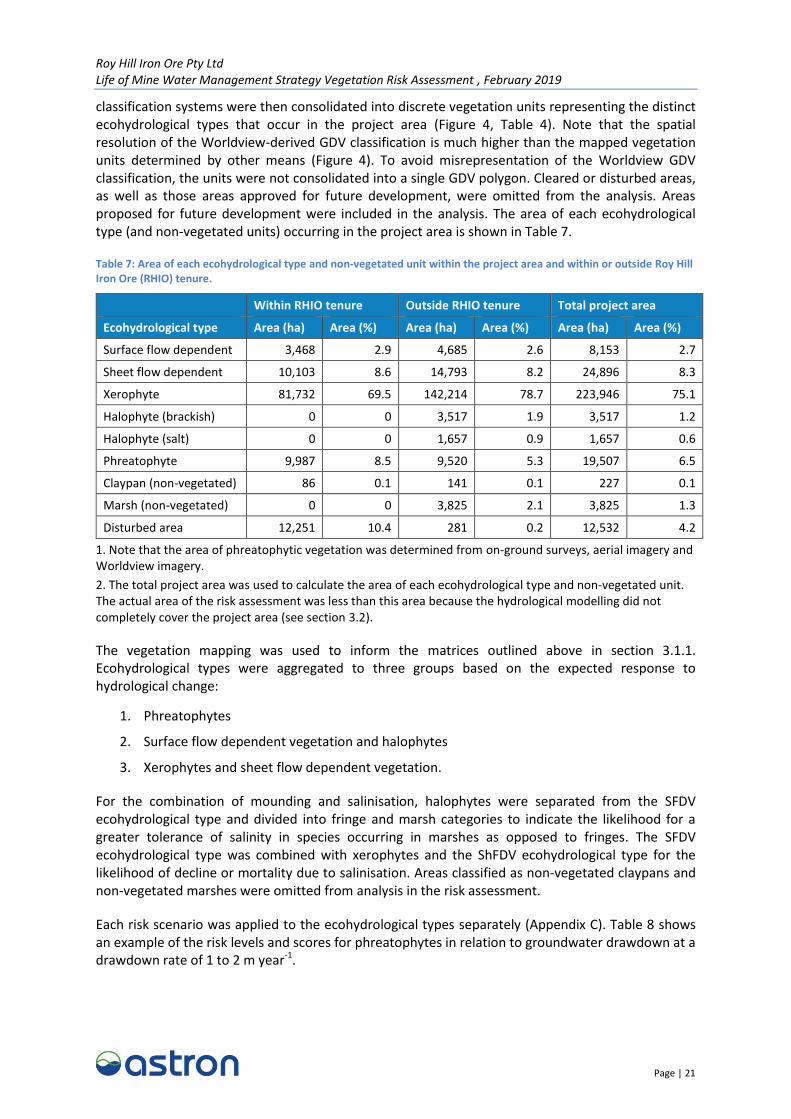
classification systems were then consolidated into discrete vegetation units representing the distinct ecohydrological types that occur in the project area (Figure 4, Table 4). Note that the spatial resolution of the Worldview-derived GDV classification is much higher than the mapped vegetation units determined by other means (Figure 4). To avoid misrepresentation of the Worldview GDV classification, the units were not consolidated into a single GDV polygon. Cleared or disturbed areas, as well as those areas approved for future development, were omitted from the analysis. Areas proposed for future development were included in the analysis. The area of each ecohydrological type (and non-vegetated units) occurring in the project area is shown in Table 7.
Table 7: Area of each ecohydrological type and non-vegetated unit within the project area and within or outside Roy Hill Iron Ore (RHIO) tenure.
Within RHIO tenure Outside RHIO tenure Total project area
Ecohydrological type Area (ha) Area (%) Area (ha) Area (%) Area (ha) Area (%)
Surface flow dependent 3,468 2.9 4,685 2.6 8,153 2.7
Sheet flow dependent 10,103 8.6 14,793 8.2 24,896 8.3
Xerophyte 81,732 69.5 142,214 78.7 223,946 75.1
Halophyte (brackish) 0 0 3,517 1.9 3,517 1.2
Halophyte (salt) 0 0 1,657 0.9 1,657 0.6
Phreatophyte 9,987 8.5 9,520 5.3 19,507 6.5
Claypan (non-vegetated) 86 0.1 141 0.1 227 0.1
Marsh (non-vegetated) 0 0 3,825 2.1 3,825 1.3
Disturbed area 12,251 10.4 281 0.2 12,532 4.2
1. Note that the area of phreatophytic vegetation was determined from on-ground surveys, aerial imagery and Worldview imagery.
2. The total project area was used to calculate the area of each ecohydrological type and non-vegetated unit. The actual area of the risk assessment was less than this area because the hydrological modelling did not completely cover the project area (see section 3.2).
The vegetation mapping was used to inform the matrices outlined above in section 3.1.1. Ecohydrological types were aggregated to three groups based on the expected response to hydrological change:
1. Phreatophytes
2. Surface flow dependent vegetation and halophytes
3. Xerophytes and sheet flow dependent vegetation.
For the combination of mounding and salinisation, halophytes were separated from the SFDV ecohydrological type and divided into fringe and marsh categories to indicate the likelihood for a greater tolerance of salinity in species occurring in marshes as opposed to fringes. The SFDV ecohydrological type was combined with xerophytes and the ShFDV ecohydrological type for the likelihood of decline or mortality due to salinisation. Areas classified as non-vegetated claypans and non-vegetated marshes were omitted from analysis in the risk assessment.
Each risk scenario was applied to the ecohydrological types separately (Appendix C). Table 8 shows an example of the risk levels and scores for phreatophytes in relation to groundwater drawdown at a drawdown rate of 1 to 2 m year-1.

Roy Hill Iron Ore Pty Ltd Life of Mine Water Management Strategy Vegetation Risk Assessment , February 2019
Page | 22
Table 8: Example of likelihood levels for risk of impact owing to groundwater drawdown in facultative phreatophytes. A rate of drawdown of 1 to 2 m year
-1 was applied. Likelihood scores are shown in parentheses.
Magnitude of drawdown (m) Antecedent groundwater depth from the ground surface (m)
< 5 5 - 10 10 - 15 > 15
>20 Likely (4)1 Possible (3) Unlikely (2) Rare (1)
10 - 20 Possible (3) Unlikely (2) Rare (1) Negligible (0)
5 - 10 Unlikely (2) Rare (1) Negligible (0) Negligible (0)
< 5 Rare (1) Negligible (0) Negligible (0) Negligible (0)
1. In this example, impacts owing to groundwater drawdown in excess of 20 m where the antecedent groundwater level was less than 5 m from the ground surface result in a likely likelihood which is assigned a score of 4. The risk levels for each scenario and vegetation type are provided in Appendix C.

780000 800000 820000
74600
00748
0000
75000
00752
0000
0 5 10 15 20km
Figure 4: Vegetation units and Priority flora mapped across the project areaAuthor: P. Drake Date: 12-02-2019 Coordinate System: GDA 1994 MGA Zone 50Drawn: T. Pedersen Figure Ref: 64010-18-BIDR-1Rev0_190212_Fig04
Roy Hill Iron Ore Pty LtdLife of Mine Water Management Strategy Vegetation Risk Assessment, February 2019
LegendPriority flora records
Eremophila pilosa (P1)Eremophila spongiocarpa(P1)Eremophila youngii subsp.lepidota (P4)Eucalyptus rowleyi (P3)Goodenia nuda (P4)Goodenia sp. East Pilbara(A.A. Mitchell PRP 727) (P3)Helichrysum oligochaetum(P1)Nicotiana heterantha (P3)Rhagodia sp. Hamersley(M. Trudgen 17794) (P3)Samolus sp. FortescueMarsh (A. Markey & R.Coppen FM 9702) (P1)Stemodia sp. Battle Hill(A.L. Payne 1006) (P1)Tecticornia medusa (P3)Tecticornia sp. ChristmasCreek (K.A. Shepherd & T.Colmer et al. KS 1063) (P1)Project areaRoy Hill Tenure
Vegetation mappingClaypanEucalyptus victrix/ E.camaldulensisGrassland/BareMarshMulgaMulga BandedMulga RiparianSamphire FringeSamphire MarshDisturbed Areas

Roy Hill Iron Ore Pty Ltd Life of Mine Water Management Strategy Vegetation Risk Assessment , February 2019
Page | 24
For Priority flora, the hydrological criteria were applied based on the specific ecohydrological classification of each species, which was independent of the surrounding vegetation mapping (refer to section 2.5.5 for the ecohydrological classifications).
The approach described here can be conceptualised according to the stress that is likely to arise under specific scenarios. Where antecedent (fresh) water levels indicate that groundwater is in close proximity of the ground surface, for example, there is a greater likelihood of groundwater dependency. From the perspective of groundwater drawdown, this represents a higher likelihood of decline or mortality due to decoupling of roots from a reliable water source. A close proximity of groundwater from the ground surface is also relevant to the likelihood of stress due to groundwater mounding. Where groundwater is near the surface, waterlogging due to groundwater mounding will be more likely. Groundwater mounding with fresh water may also induce unbalanced growth, shoot growth that is not matched by root growth, which could lead to decline or mortality when groundwater levels recede at the end of injection activities.
Delineation of ecohydrological types when deriving likelihood levels provides a mechanism to consider specific adaptions as they pertain to these general concepts. Halophytes, for example, are considered to have a lower likelihood of decline or mortality owing to salinisation compared to xerophytes. All matrices used in the risk assessment are tabulated as likelihood scores for each scenario in Appendix C.
3.1.3 Consequence
The spatial delineation of consequence is considered here to relate to specific vegetation types and the presence of priority communities or flora. Vegetation types considered to offer considerable conservation values were those in which mulga, samphire, E. victrix or E. camaldulensis were detected. The vegetation types comprising these key species were assigned an elevated consequence level in the risk matrix (Table 9). Of significance is the elevated consequence level of banded mulga over other forms of this group of species. A higher consequence was applied because of the importance of banded mulga in nutrient and water cycling in semi-arid regions, processes which are likely to concentrate biological activity in otherwise resource-poor areas. Vegetation types primarily comprised of hummock grassland and tussock grassland were also considered in the risk assessment but these were considered to be of lower ecological significance (Table 9).
Where a vegetation unit intersected with a PEC its consequence was elevated by one level (score).
Table 9: Consequence levels for specific ecohydrological types that occur in the study area. Consequence scores are shown in parentheses.
Vegetation type Ecohydrological classification Consequence level (score)
Riparian mulga Surface flow dependent Minor (2)
Banded mulga Sheet flow dependent Moderate (3)
Other mulga Xerophyte Minor (2)
Samphire (fringe) Halophyte (brackish) Moderate (3)
Samphire (marsh) Halophyte (salt) Moderate (3)
E. victrix & E. camaldulensis Phreatophyte Moderate (3)
Hummock grassland Xerophyte Slight (1)
Tussock grassland Xerophyte Slight (1)
1. Note that where a vegetation unit intersected a PEC its consequence score was elevated by 1.
For Priority flora, the risk assessment was applied at a point scale. Consequence scores were defined on the basis of Priority status (Table 10). In the specific case of a point record of Priority flora

Roy Hill Iron Ore Pty Ltd Life of Mine Water Management Strategy Vegetation Risk Assessment , February 2019
Page | 25
occurring within a PEC, the consequence of P3 and P4 flora was elevated by one level (score). In the case of P1 flora intersecting with a PEC, consequence remained at a major level. For example, if a Tecticornia medusa P3 record occurred within the Fortescue Marsh PEC P1, the consequence level would be elevated from moderate to major. In contrast, if a Tecticornia sp. Christmas Creek P1 record occurred within the Fortescue Marsh PEC P1, the consequence level would remain as major.
Table 10: Consequence levels for point records of Priority flora based on their Priority status. Consequence scores are shown in parentheses.
Priority Consequence level (score)
Priority 1 Major (4)
Priority 3 Moderate (3)
Priority 4 Minor (2)
1. Note that no Priority 2 flora were detected in the project area.
3.1.4 Risk
Risk was quantified as the product of likelihood and consequence scores for each scenario and vegetation type (or priority, in the case of Priority flora) with risk allocated to the following categories based on these scores:
Extreme: ≥ 20
High: ≥ 10 < 20
Medium: ≥ 4 < 10
Low: ≥ 1 < 4.
Risk was mapped across the project area hierarchically. That is, the risk level associated with Priority flora took precedence over the risk level associated with the mapped vegetation units.
Taking the likelihood example presented in Table 8, a unit of vegetation classified as phreatophytic growing where the antecedent groundwater level was less than 5 m from the ground surface which was subject to a drawdown of more than 20 m at a rate of 1 to 2 m year-1 would receive a Likely likelihood level, equivalent to a score of 4. Coupled to this is a Moderate Consequence level for E. victrix/E. camaldulensis, equivalent to a score of 3. The product of likelihood and consequence in this instance is 12, equating to a high risk rating (Table 5). This approach was applied to each vegetation unit and Priority point flora record to spatially delineate the risk of decline or mortality owing to groundwater drawdown, groundwater mounding, unbalanced growth and salinisation. System flow diagrams for the risk assessment as it pertains to both vegetation units and Priority flora are shown in Appendix D.
3.2 Limitations
The risk model developed here is theoretical in nature, providing a general indication of risk due to the LoM Water Management Strategy. Although based on the best available knowledge of vegetation type and ecohydrological performance, the risk model includes qualitative elements and incorporates several assumptions. Principal among these is a level of uncertainty in the spatial mapping of vegetation types across the project area. This is especially significant in the southern half of the project area where fewer surveys have been undertaken and Worldview coverage is currently unavailable. This uncertainty is, however, somewhat offset by the concentration of forecast hydrological impacts into the northern third of the project area (refer to section 4.1 below).

Roy Hill Iron Ore Pty Ltd Life of Mine Water Management Strategy Vegetation Risk Assessment , February 2019
Page | 26
Although based on current knowledge of ecohydrological performance, the risk model is limited to general responses rather than species-specific behaviours. Two areas in the north-east and one area in the east of the project area, amounting to 4,441 ha (1.5% of the project area), were not incorporated into the risk assessment because they were not covered by the supplied hydrological modelling. Subsequent assessment of risk as a percentage of the total project area accounts for this omission. It is also noted that the risk model does not explicitly consider uncertainty in the supplied hydrological modelling; nor does it incorporate adaptive management of the MAR injection regime.

Roy Hill Iron Ore Pty Ltd Life of Mine Water Management Strategy Vegetation Risk Assessment , February 2019
Page | 27
4 Results and Discussion
4.1 Outcome of the Risk Assessment
The likelihood by consequence framework described above was used to quantify risk across the project area. Risk, as defined in Table 5, was mapped across the project area and the spatial extent of each risk category quantified (Table 11). Overall, high risk was confined to small areas of the project area in the vicinity of the current mining area, the proposed clearing footprint and injection fields, i.e. within the RHIO tenure (Figure 5 to Figure 8). The total area at high risk of decline or mortality was 12.5 ha, which was due to salinisation (Table 11). In general, risk was minimised by RHIO during the hydrological model development by selecting MAR injection points and injection regimes such that groundwater mounding did not elevate groundwater to within 5 m of the ground surface.
Table 11: Spatial extent of risk levels for each scenario. Risk levels as a percentage of the modelling area for each scenario are shown in parentheses.
Risk category
Spatial extent of risk (ha)
Groundwater drawdown
Groundwater mounding
Unbalanced growth Salinisation
Inside tenure
Outside tenure
Inside tenure
Outside tenure
Inside tenure
Outside tenure
Inside tenure
Outside tenure
Extreme 0 (0) 0 (0) 0 (0) 0 (0) 0 (0) 0 (0) 0 (0) 0 (0)
High 0 (0) 0 (0) 0 (0) 0 (0) 0 (0) 0 (0) 12.5 (0.04) 0 (0)
Medium 0.2
(<0.01) 0 (0) 182 (0.3) 0 (0) 0 (0) 0 (0) 5,573 (16.5)
3,504 (3.6)
Low 4.5 (0.02) 0 (0) 206 (0.3) 0 (0) 3.5 (0.05) 0 (0) 697 (2.1) 1,023 (1.0)
Negligible 22,030 (99.98)
23,167 (100)
61,360 (99.4)
54,626 (100)
7,394 (99.95)
807 (100)
27,561 (81.4)
93,876 (95.4)
Model extent
1
22,035 23,167 61,748 54,626 7398 807 33,844 98,403
1. Note that each scenario was constrained by the area subject to a specific hydrological change. The area subject to groundwater drawdown, for example, was smaller than the area subject to groundwater mounding.
4.2 Groundwater Drawdown
Areas at medium or low risk of decline or mortality due to groundwater drawdown were confined to small areas within the northern third of the project area, on the periphery of the RHIO tenure and associated clearing footprint (Figure 5). These areas (equating to 4.7 ha) include linear drainage features (Kulkinbah Creek and tributaries of the Fortescue River) that comprised of E. camaldulensis and/or E. victrix. This is a similar spatial extent as identified previously (Astron Environmental Services 2016) which is within existing drawdown approval limits. While not identified as at risk from the model, a linear feature in the north-east of the project area associated with Christmas Creek may be subject to decline or mortality owing to groundwater drawdown. This risk may be compounded by drawdown activities being conducted within adjacent mining tenures held by the Fortescue Metals Group (Fortescue). Based on the Worldview GDV classification, this feature is dominated by E. victrix or E. camaldulensis (subsequently confirmed as primarily E. victrix by on-ground reconnaissance in December 2018) and will be subject to significant drawdown at a relatively high rate. In combination, drawdown from the LoM Water Management Strategy and Fortescue activity may pose a risk to vegetation in the riparian zone that extends roots into the underlying
Roy Hill Iron Ore Pty Ltd Life of Mine Water Management Strategy Vegetation Risk Assessment , February 2019
Page | 28
groundwater. It may be that the broad-scale modelling does not account for local hydrological complexities, such as perched groundwater layers or zones that retain elevated soil moisture during dry periods, that could sustain this population of potential GDV.
4.3 Groundwater Mounding
The risk of impact to vegetation owing to groundwater mounding was confined to 388 ha (comprised of medium and low risk areas in Table 11), with this area restricted to an area north of the Fortescue Marsh (Figure 6). This area is dominated by mulga and riparian mulga, the latter associated with drainage lines, including Kulbee Creek, which join the Fortescue River or terminate directly at the boundary of the Fortescue Marsh. While not identified as at risk, parts of the Fortescue Marsh which were classified as samphire fringe were adjacent to the area of low risk of decline or mortality owing to groundwater mounding. A second area at low risk of mounding lies east of the Fortescue Marsh, at the junction of the Kulkinbah Creek and the Fortescue River (Figure 6). This area includes phreatophytes (E. camaldulensis and/or E. victrix).
A third area at low risk of mounding was identified in the central part of the project area, south of the Fortescue Marsh, where the remote MAR borefield is located. This area was characterised as being dominated by mulga, tussock grassland or hummock grassland.
4.4 Unbalanced Growth
A low risk of unbalanced growth was restricted to a small area (3.5 ha) associated with Kulkinbah Creek (Figure 7). This outcome was driven by the potential for groundwater mounding (with fresh water) to encourage additional growth of the canopy which is not matched by a proportional increase in root growth, which could lead to water stress when the water table recedes. The recession rate was particularly high in the vicinity of Kulkinbah Creek, heightening the risk of decline or mortality due to unbalanced growth in a small area. Species classified as phreatophytes were deemed most likely to be subject to decline or mortality due to unbalanced growth. Accordingly, the risk level for unbalanced growth in this specific ecohydrological type was elevated where groundwater mounding was followed by recession.
4.5 Salinisation
The risk of impact due to salinisation is effectively constrained to areas of mounding where groundwater salinities exceed 6,000 mg L-1 TDS and current groundwater levels will be elevated into the root zone. The model predicted a medium and low risk of impact owing to salinisation in a 4,527 ha area outside of the RHIO tenure associated with the Fortescue Marsh, the Fortescue River (and the junction of Kulkinbah Creek) and in the vicinity of the Remote MAR borefield, including part of the Narbung Land System PEC (Figure 8). A further 6,283 ha was found to be at high, medium or low risk of decline due to salinisation within the RHIO tenure, with 12.5 ha falling into the high risk category (Table 11 and Figure 8).
Due to the occurrence of naturally saline shallow groundwater (i.e. within 10 m of the surface), any elevation of the water table into the root zone in these areas was regarded as exposing vegetation to highly saline water, with negative consequences a high probability. Of particular significance is the medium level of risk associated with several samphire populations on the fringe of the Fortescue Marsh (amounting to 1,818 ha, Table 12). While mounding in this area is likely to be modest, small hydrological shifts could impact on the fringing halophytic communities which were assigned a higher susceptibility to salinisation than halophytes growing on the marsh itself due to their likely lower salt tolerance. The specific outcome of a medium level of risk within the boundary of the Fortescue Marsh PEC derives from an elevated consequence for decline or mortality of vegetation in
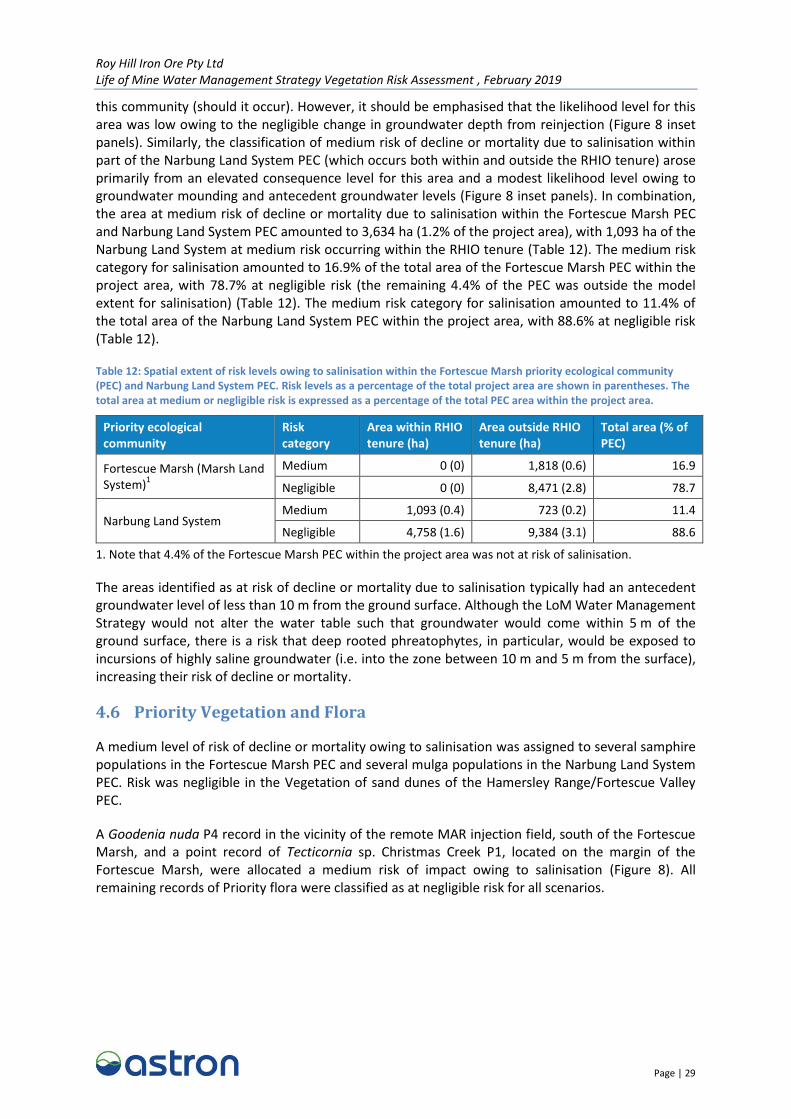
Roy Hill Iron Ore Pty Ltd Life of Mine Water Management Strategy Vegetation Risk Assessment , February 2019
Page | 29
this community (should it occur). However, it should be emphasised that the likelihood level for this area was low owing to the negligible change in groundwater depth from reinjection (Figure 8 inset panels). Similarly, the classification of medium risk of decline or mortality due to salinisation within part of the Narbung Land System PEC (which occurs both within and outside the RHIO tenure) arose primarily from an elevated consequence level for this area and a modest likelihood level owing to groundwater mounding and antecedent groundwater levels (Figure 8 inset panels). In combination, the area at medium risk of decline or mortality due to salinisation within the Fortescue Marsh PEC and Narbung Land System PEC amounted to 3,634 ha (1.2% of the project area), with 1,093 ha of the Narbung Land System at medium risk occurring within the RHIO tenure (Table 12). The medium risk category for salinisation amounted to 16.9% of the total area of the Fortescue Marsh PEC within the project area, with 78.7% at negligible risk (the remaining 4.4% of the PEC was outside the model extent for salinisation) (Table 12). The medium risk category for salinisation amounted to 11.4% of the total area of the Narbung Land System PEC within the project area, with 88.6% at negligible risk (Table 12).
Table 12: Spatial extent of risk levels owing to salinisation within the Fortescue Marsh priority ecological community (PEC) and Narbung Land System PEC. Risk levels as a percentage of the total project area are shown in parentheses. The total area at medium or negligible risk is expressed as a percentage of the total PEC area within the project area.
Priority ecological community
Risk category
Area within RHIO tenure (ha)
Area outside RHIO tenure (ha)
Total area (% of PEC)
Fortescue Marsh (Marsh Land System)
1
Medium 0 (0) 1,818 (0.6) 16.9
Negligible 0 (0) 8,471 (2.8) 78.7
Narbung Land System Medium 1,093 (0.4) 723 (0.2) 11.4
Negligible 4,758 (1.6) 9,384 (3.1) 88.6
1. Note that 4.4% of the Fortescue Marsh PEC within the project area was not at risk of salinisation.
The areas identified as at risk of decline or mortality due to salinisation typically had an antecedent groundwater level of less than 10 m from the ground surface. Although the LoM Water Management Strategy would not alter the water table such that groundwater would come within 5 m of the ground surface, there is a risk that deep rooted phreatophytes, in particular, would be exposed to incursions of highly saline groundwater (i.e. into the zone between 10 m and 5 m from the surface), increasing their risk of decline or mortality.
4.6 Priority Vegetation and Flora
A medium level of risk of decline or mortality owing to salinisation was assigned to several samphire populations in the Fortescue Marsh PEC and several mulga populations in the Narbung Land System PEC. Risk was negligible in the Vegetation of sand dunes of the Hamersley Range/Fortescue Valley PEC.
A Goodenia nuda P4 record in the vicinity of the remote MAR injection field, south of the Fortescue Marsh, and a point record of Tecticornia sp. Christmas Creek P1, located on the margin of the Fortescue Marsh, were allocated a medium risk of impact owing to salinisation (Figure 8). All remaining records of Priority flora were classified as at negligible risk for all scenarios.
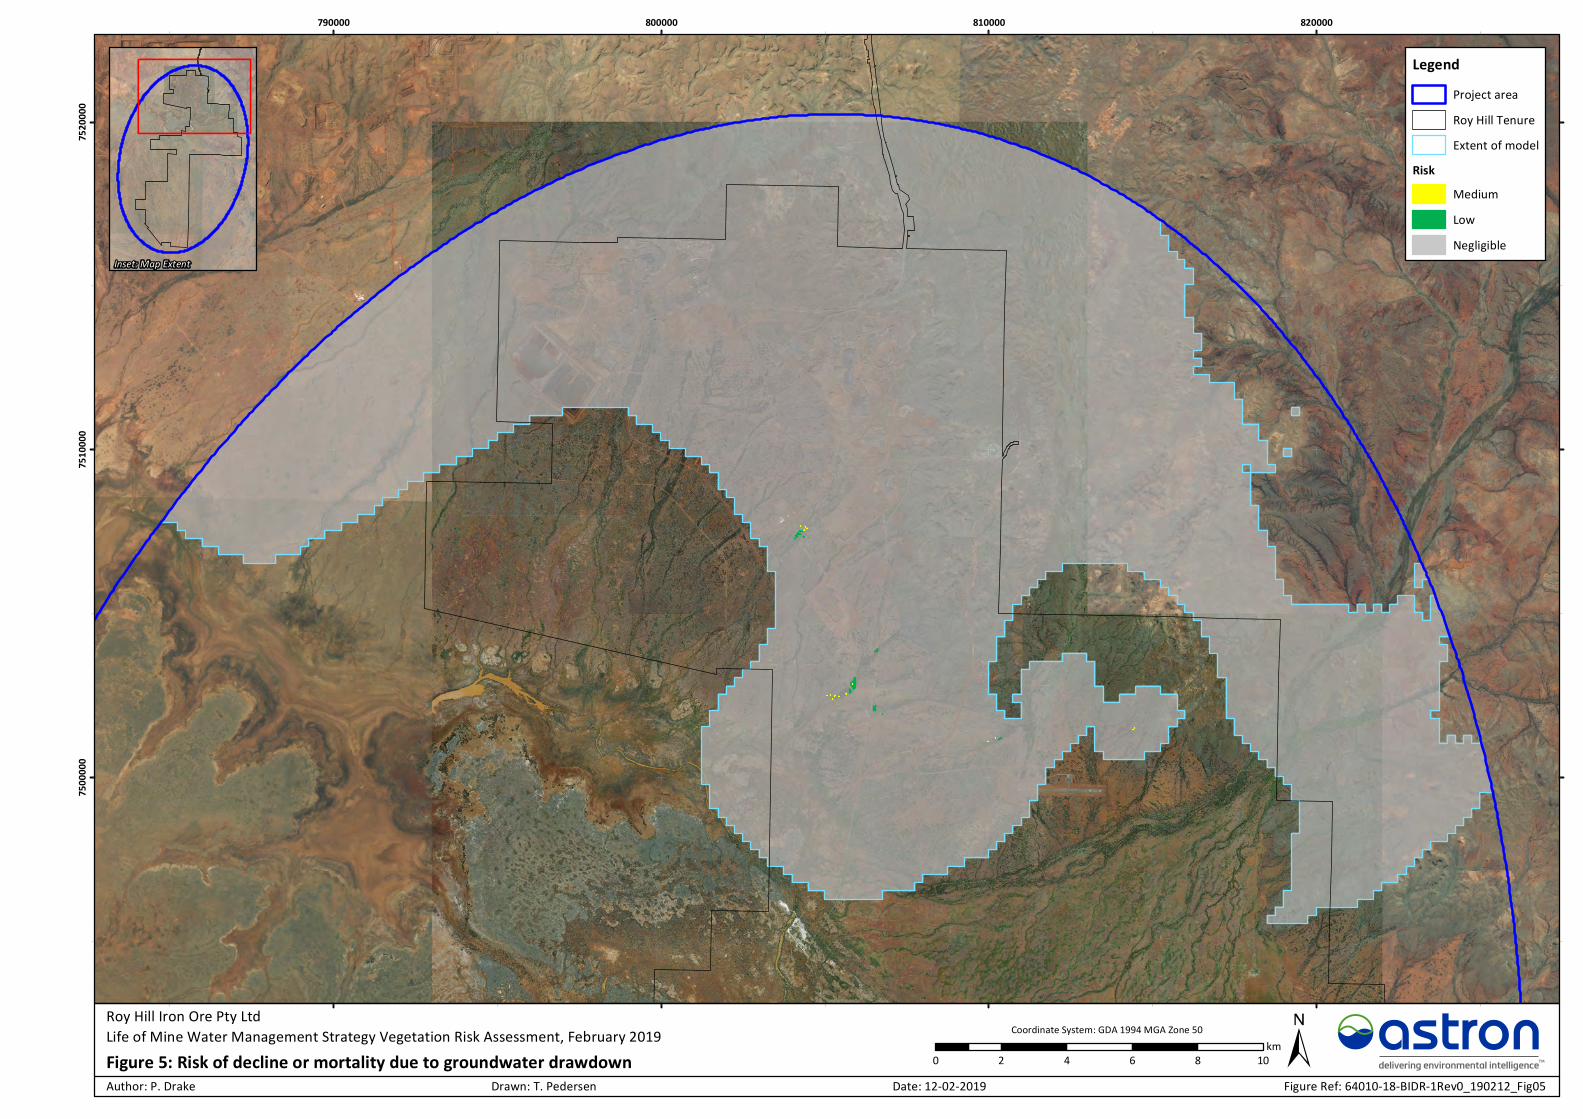
790000 800000 810000 820000
75000
00751
0000
75200
00
0 2 4 6 8 10kmFigure 5: Risk of decline or mortality due to groundwater drawdown
Author: P. Drake Date: 12-02-2019
Coordinate System: GDA 1994 MGA Zone 50
Drawn: T. Pedersen Figure Ref: 64010-18-BIDR-1Rev0_190212_Fig05
Roy Hill Iron Ore Pty LtdLife of Mine Water Management Strategy Vegetation Risk Assessment, February 2019
LegendProject areaRoy Hill TenureExtent of model
RiskMediumLowNegligible
Inset: Map Extent
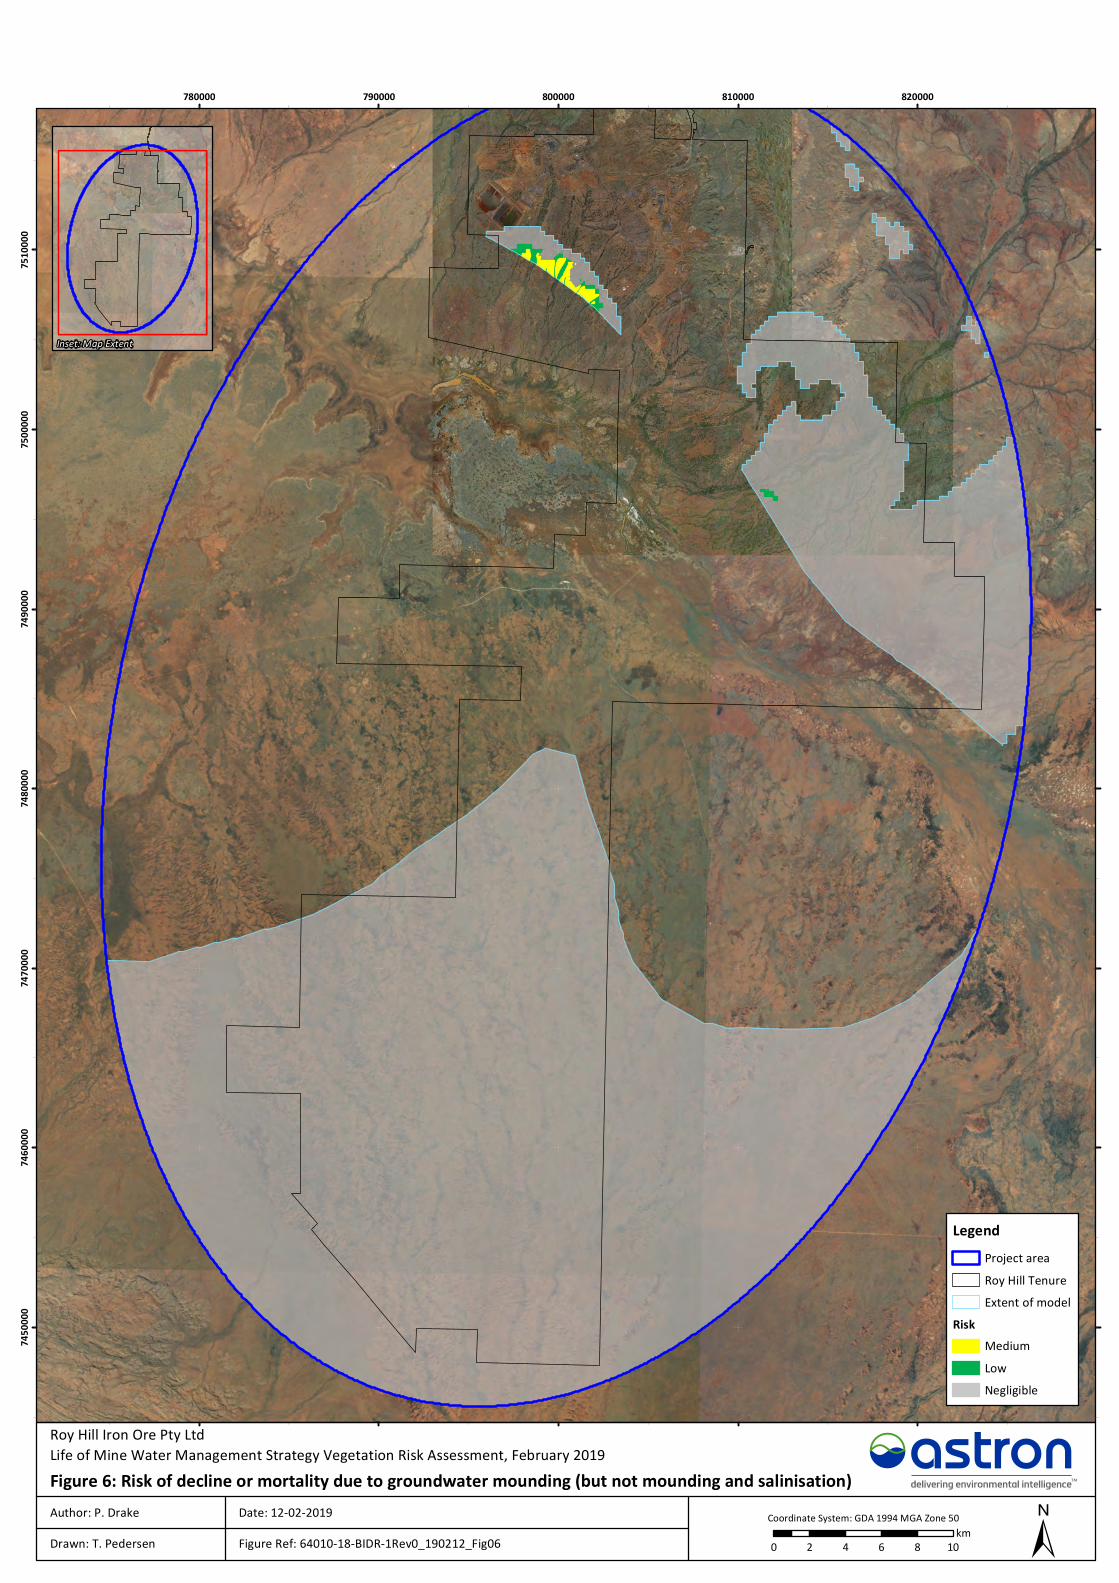
780000 790000 800000 810000 820000
74500
00746
0000
74700
00748
0000
74900
00750
0000
75100
00
0 2 4 6 8 10km
Figure 6: Risk of decline or mortality due to groundwater mounding (but not mounding and salinisation)Author: P. Drake Date: 12-02-2019 Coordinate System: GDA 1994 MGA Zone 50Drawn: T. Pedersen Figure Ref: 64010-18-BIDR-1Rev0_190212_Fig06
Roy Hill Iron Ore Pty LtdLife of Mine Water Management Strategy Vegetation Risk Assessment, February 2019
LegendProject areaRoy Hill TenureExtent of model
RiskMediumLowNegligible
Inset: Map Extent

780000 790000 800000 810000 820000
74900
00750
0000
75100
00
0 2 4 6 8 10kmFigure 7: Risk of decline or mortality due to unbalanced growth
Author: P. Drake Date: 12-02-2019
Coordinate System: GDA 1994 MGA Zone 50
Drawn: T. Pedersen Figure Ref: 64010-18-BIDR-1Rev0_190212_Fig07
Roy Hill Iron Ore Pty LtdLife of Mine Water Management Strategy Vegetation Risk Assessment, February 2019
LegendProject areaRoy Hill TenureExtent of model
RiskLowNegligible
Inset: Map Extent

770000 780000 790000 800000 810000 820000 830000 840000 850000
74700
00748
0000
74900
00750
0000
75100
00752
0000
0 2 4 6 8 10kmFigure 8: Risk of decline or mortality due to mounding and salinisation
Author: P. Drake Date: 12-02-2019
Coordinate System: GDA 1994 MGA Zone 50
Drawn: T. Pedersen Figure Ref: 64010-18-BIDR-1Rev0_190212_Fig08
Roy Hill Iron Ore Pty LtdLife of Mine Water Management Strategy Vegetation Risk Assessment, February 2019
Inset: Main Map Extent
Antecedent water level0 - 5 m5 - 10 m10 - 15 m> 15 m
Magnitude of mounding> 10 m5 - 10 m1 - 5 m< 1 m
Inset: Antecedent water levels in the vicinityof Fortescue Marsh (Marsh Land System)
Inset: Magnitude of mounding in the vicinityof Fortescue Marsh (Marsh Land System)
LegendPriority Flora at Medium Risk
Risk
Goodenia nuda (P4)Tecticornia sp. Christmas Creek (K.A.Shepherd & T. Colmer et al. KS 1063) (P1)Project areaRoy Hill TenureExtent of modelFortescue Marsh (Marsh Land System)
HighMediumLowNegligible
Narbung Land System

Roy Hill Iron Ore Pty Ltd Life of Mine Water Management Strategy Vegetation Risk Assessment , February 2019
Page | 34
5 Conclusions and Recommendations
High and medium risk of decline or mortality in vegetation was confined to areas north of the Fortescue Marsh in the vicinity of the mining area and associated disturbance footprint, with the majority of these areas falling within the RHIO tenure. Specific areas at risk of decline or mortality due to groundwater drawdown were associated with vegetation units dominated by E. victrix and/or E. camaldulensis and these areas fall within the RHIO tenure. The risk of decline or mortality due to mounding was constrained to an area north of the Fortescue Marsh in the vicinity of the Southwest Injection Borefield and an area in close proximity of the Fortescue River, at the junction of Kulkinbah Creek. These locations were dominated by mulga, riparian mulga and E. victrix/E. camaldulensis. Risk of decline or mortality owing to unbalanced growth was restricted to a small area associated with Kulkinbah Creek. Vegetation at risk of decline or mortality due to salinisation was associated with the fringe of the Fortescue Marsh and an area north of this feature as well as parts of the Fortescue River and in the vicinity of the remote MAR injection field. The medium level of risk evident on the fringe of the Fortescue Marsh and in part of the Narbung Land System was associated with an elevated consequence of decline or mortality in these communities. However, the likelihood of decline or mortality in this area was low due to a negligible change in groundwater depth from mounding predicted.
Outside of the RHIO tenure, no areas of high risk of decline or mortality were detected, with areas at medium or low risk of decline or mortality amounting to 4,527 ha, 1.5% of the total project area. Within the RHIO tenure, the areas at high risk of decline or mortality totalled 12.5 ha, less than 0.1% of the total project area, with medium and low risk categories amounting to 6,666 ha, 2.2% of the total project area.
The formulation of a management plan that outlines a monitoring program is recommended to reduce the risk of impact from the project. The plan would draw on elements outlined in the current RHIO Vegetation Condition Environmental Management Plan (OP-REP-00363) (the plan) (Roy Hill Iron Ore 2017). The monitoring program as outlined in this plan and in Roy Hill Iron Ore (2018) should be expanded to cover the areas at risk that have been identified in this report. The plan will outline trigger and threshold criteria. Where criteria are not met, responses will follow within a tiered framework and range from investigation to various levels of management. Potential management options will include the following:
reduce rates of dewatering or borefield abstraction (drawdown impacts)
targeted irrigation to maintain patches of mature phreatophytic trees (drawdown, unbalanced growth impacts from mounding and salinisation)
assist regeneration of affected species through fencing and weed control (all impacts)
redistribute volumes across re-injection sites (waterlogging and unbalanced growth impacts from mounding, and salinisation)
assist regeneration of affected species through fencing and weed control (all impacts).
Where impacts are detected and management actions are implemented, the monitoring program should be adapted to measure the effectiveness of these management actions.
Roy Hill Iron Ore Pty Ltd Life of Mine Water Management Strategy Vegetation Risk Assessment , February 2019
Page | 35
6 References
Astron Environmental Services 2015, Vegetation Health Monitoring 2014 Annual Report, unpublished report to Roy Hill Iron Ore Pty Ltd.
Astron Environmental Services 2016, Roy Hill Iron Ore Mine Vegetation Risk Assessments and Monitoring Plan Review – Risk Assessment for Groundwater Dependent Vegetation, unpublished report to Roy Hill Iron Ore Pty Ltd.
Benyon, RG, Theiveyanathan, S & Doody, TM 2006, 'Impacts of tree plantations on groundwater in south-eastern Australia', Australian Journal of Botany, vol. 54, no. 2, pp. 181-92.
Biologic Environmental Survey 2018, Roy Hill Iron Ore Remote MAR Borefield Reconnaissance Flora and Vegetation Survey, unpublished report to Roy Hill Iron Ore.
Bureau of Meteorology 2018, Climate Data Online, <http://www.bom.gov.au/climate/data/index.shtml>.
Coleman, M 2001, ‘Modelling the environmental processes in large saline wetlands in the goldfields’, Proceedings of the Salt Lake Workshop, University of Western Australia, Perth, Western Australia.
Datson, B 2002, Samphires in Western Australia, Department of Conservation and Land Management, Perth.
Dawson, TE & Pate, JS 1996, 'Seasonal water uptake and movement in root systems of Australian phraeatophytic plants of dimorphic root morphology: a stable isotope investigation', Oecologia, vol. 107, no. 1, pp. 13-20.
Department of Biodiversity, Conservation & Attractions 2018, 'Threatened and Priority Ecological Communities Database', Dept. of Biodiversity, Conservation & Attractions, Perth WA.
Department of Environmental Regulation 2017, Guidance Statement: Risk Assessments. Part V, Division 3, Environment Protection Act 1986, Perth WA.
Department of Parks and Wildlife 2017, Priority Ecological Communities for Western Australia, Version 27, Species and Communities Branch, Department of Biodiversity, Conservation and Attractions.
Department of Water 2009, Environmental considerations for groundwater management in the Northern Perth Basin, Environmental Water Report Series Report No. 8.
Eamus, D, Froend, R, Loomes, R, Hose, G & Murray, B 2006, 'A functional methodology for determining the groundwater regime needed to maintain the health of groundwater-dependent vegetation', Australian Journal of Botany, vol. 54, pp. 97-114.
Ecologia Environment 2009, Roy Hill 1 Project Flora and Vegetation Assessment, unpublished report to Hancock Prospecting Pty Ltd.
English, JP & Colmer, TD 2013, 'Tolerance of extreme salinity in two stem-succulent halophytes (Tecticornia species)', Functional Plant Biology, no. 40, pp. 897-912.
Flowers, TJ & Colmer, TD 2008, 'Salinity tolerance in halophytes', New Phytologist, no. 179, pp. 945-63
Froend, R, Loomes, R, Horwitz, P, Bertuch, M, Storey, A & Bamford, M 2004, Study of Ecological Water Requirements on the Gnangara and Jandakot Mounds Under Section 46 of the Environmental Protection Act, Task 2: Determination of Ecological Water Requirements, report to The Waters and Rivers Commission.
Roy Hill Iron Ore Pty Ltd Life of Mine Water Management Strategy Vegetation Risk Assessment , February 2019
Page | 36
GHD 2018, Roy Hill Life of Mine Water Management Strategy - Groundwater Impact Assessment, Draft report prepared for Roy Hill Holdings Pty Ltd.
Hayashi, M & Rosenberry, DO 2002, 'Effects of ground water exchange on the hydrology and ecology of surface water', Groundwater, vol. 40, pp. 309-16.
Kramer, PJ & Boyer, JS 1995, Water Relations of Plants and Soils, Academic Press, San Diego.
Ludwig, J, Tongway, D, Freudenberger, D, Noble, J & Hodgkinson, K 1997, Landscape Ecology Function and Management: Principles from Australia's Rangelands, CSIRO, Melbourne.
Lytle, DA & LeRoy Poff, N 2004, 'Adaptation to natural flow regimes', Trends in Ecology & Evolution, vol. 19, no. 2, pp. 94-100.
Mabutt, JA & Fanning, PC 1987, 'Vegetation banding in arid Western Australia', Journal of Arid Environments, vol. 12, pp. 41-59.
Managed Recharge 2018, Roy Hill Remote MAR Project-Phase 1, unpublished report to Roy Hill Iron Ore.
Marchesini, VA, Chuanhua, Y, Colmer, TD & Veneklaas, EJ 2014, 'Drought tolerances of three stem-succulent halophyte species of an inland semiarid salt lake system', Functional Plant Biology, vol. 41, pp. 1230-8.
McKenzie, NL, May, JL & McKenna, S 2002, Bioregional Summary of the 2002 Biodiversity Audit Western Australia, Government of Western Australia, Department of Conservation and Land Management.
Miller, JT, Andrew, RA & Maslin, BR 2002, 'Towards an understanding of the variation in the mulga complex (Acacia aneura and relatives)', Conservation Science WA, vol. 4, pp. 19-35.
Moore, G 2001, Soilguide. A handbook for understanding and managing agricultural soils, Bulletin No. 4343, Agriculture Western Australia, Perth.
Munns, R 2002, 'Comparative physiology of salt and water stress', Plant, Cell & Environment, vol. 25, pp. 239-50.
MWH Australia 2015, Ecohydrological Conceptulisation of the Fortescue Marsh Region, unpublished report to BHP Billiton Iron Ore.
Naumburg, E, Mata-gonzalez, R, Hunter, RG, McLendon, T & Martin, DW 2005, 'Phreatophytic vegetation and groundwater fluctuations: A review of current research and application of ecosystem response modeling with an emphasis on Great Basin vegetation', Environmental Management, vol. 35, no. 6, pp. 726-40.
Orellana, F, Verma, P, Loheide II, SP & Daly, E 2012, 'Monitoring and modelling water-vegetation interactions in groundwater-dependent ecosystems', Reviews of Geophysics, vol. 50, pp. RG3003, doi:10.1029/2011RG000383.
Page, GFM & Grierson, PF 2012, ‘Designing new monitoring programs for Mulga woodlands - lessons learned from the Pilbara’, Proceedings of the 17th Australian Rangeland Society Biennial Conference, Australia.
Puigdefábregas, J 2005, 'The role of vegetation patterns in structuring runoff and sediment fluxes in drylands', Earth Surface Processes and Landforms, vol. 30, no. 2, pp. 133-47.
Richards, JH & Caldwell, MM 1987, 'Hydraulic lift: Substantial nocturnal water transport between soil layers by Artemisia tridentata', Oecologia, vol. 73, pp. 486-9.
Rio Tinto Iron Ore 2013, Koodaideri Iron Ore Mine and Infrastructure Project, Public Environmental Review, July 2013, Assessment No. 1933, Rio Tinto Iron Ore, Perth.

Roy Hill Iron Ore Pty Ltd Life of Mine Water Management Strategy Vegetation Risk Assessment , February 2019
Page | 37
Roy Hill Iron Ore 2017, Roy Hill Iron Ore Vegetation Condition Environmental Management Plan, RHIO Document No. OP-REP-00363.
Roy Hill Iron Ore 2018, Section 45C Application – MS 824/829 – Mine Dewatering – Managed Aquifer Recharge. Environment OP-APP-00040, unpublished report prepared by Roy Hill Iron Ore Pty Ltd.
Saintilan, N 2009, 'Australian Saltmarsh Ecology', CSIRO Publishing, Collingwood.
Shepherd, KA & Wilson, PG 2007, 'Incorporation of the Australian genera Halosarcia, Pachycornia, Sclerostegia and Tegicornia into Tecticornia (Salicornioideae, Chenopodiaceae)', Australian Systematic Botany, vol. 20, no. 4, pp. 319-31.
Skryzpek, G, Dogramaci, S & Grierson, PF 2013, 'Geochemical and hydrological processes controlling groundwater salinity of a large inland wetland of northwest Australia', Chemical Geology, no. 357, pp. 164-77.
Tille, P 2006, Soil-landscapes of Western Australia's rangelands and arid interior, Department of Agriculture and Food, Perth.
van Vreeswyk, AME, Payne, AL, Leighton, KA & Hennig, P 2004, An inventory and condition survey of the Pilbara region, Western Australia. Technical Bulletin No. 92, Department of Agriculture and Food, Perth.
Zolfaghar, S, Villalobos-Vega, R, Cleverly, J, Zeppel, M, Rumman, R & Eamus, D 2014, 'The influence of depth-to-groundwater on structure and productivity of Eucalyptus woodlands', Australian Journal of Botany, vol. 62, pp. 428-37.

Roy Hill Iron Ore Pty Ltd Life of Mine Water Management Strategy Vegetation Risk Assessment , February 2019
Page | 38
This page has been left blank intentionally.

Roy Hill Iron Ore Pty Ltd Life of Mine Water Management Strategy Vegetation Risk Assessment, January 2019
Appendix A: Vegetation Mapping Sources

Roy Hill Iron Ore Pty Ltd Life of Mine Water Management Strategy Vegetation Risk Assessment, January 2019
This page has been left blank intentionally.

Roy Hill Iron Ore Pty Ltd Life of Mine Water Management Strategy Vegetation Risk Assessment, January 2019
Table A.1: Data sources for vegetation mapping and point samples of Priority flora.
Name Description Source
1748 Flora Database Vegetation Vegetation mapping RHIO Vegetation database, acquisition date unknown
RHIO ENVR Vegetation Mapping Vegetation mapping G and G Environmental, acquired 2009
20180706 Maia Veg Mapping and Condition
Vegetation mapping Maia Environmental Consultancy, acquired 2009
20180706 Maia and GGE CSF Locations
Point survey for Priority flora G and G Environmental Consultancy, acquired 2009
1748 Flora Database DBCA TPFL Point survey for Priority flora DBCA search, unknown acquisition date
1748 Flora Database WAHerb Point survey for Priority flora Herbarium search, unknown acquisition date
1748 Flora Database Biologic Point survey for Priority flora DBCA search, unknown acquisition date

Roy Hill Iron Ore Pty Ltd Life of Mine Water Management Strategy Vegetation Risk Assessment, January 2019
This page has been left blank intentionally.

Roy Hill Iron Ore Pty Ltd Life of Mine Water Management Strategy Vegetation Risk Assessment, January 2019
Appendix B: GHD Ecohydrological Mapping

Roy Hill Iron Ore Pty Ltd Life of Mine Water Management Strategy Vegetation Risk Assessment, January 2019
This page has been left blank intentionally.
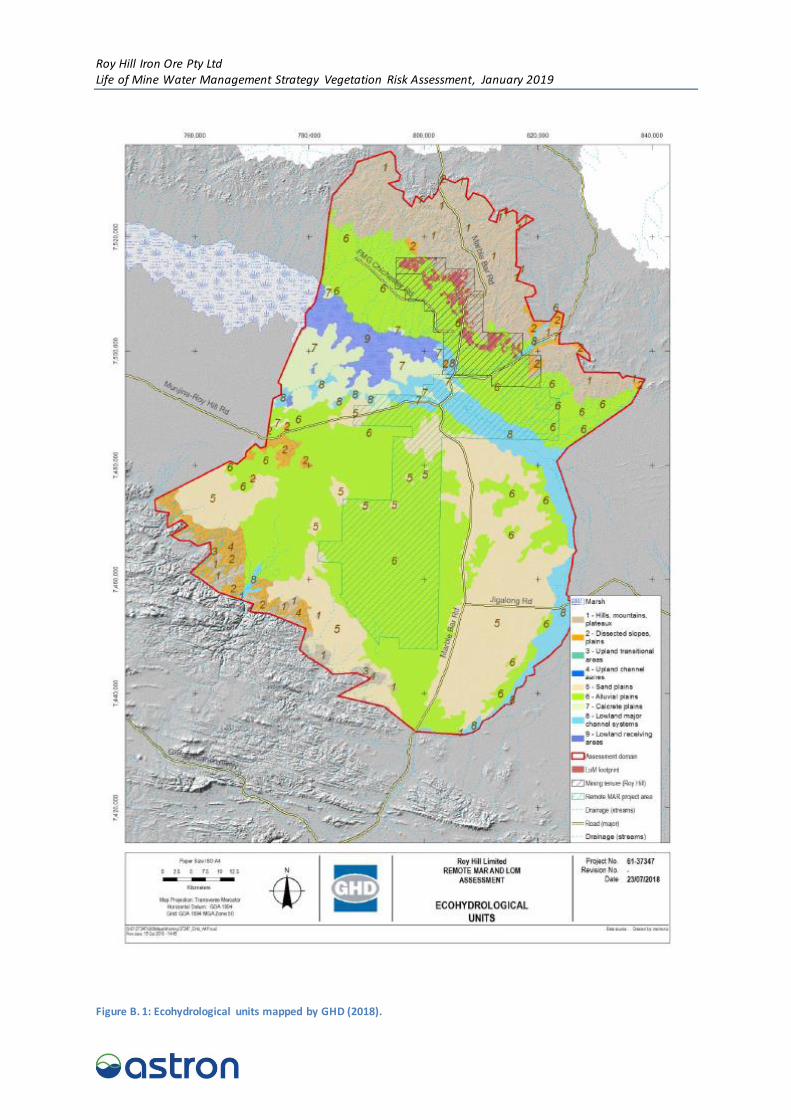
Roy Hill Iron Ore Pty Ltd Life of Mine Water Management Strategy Vegetation Risk Assessment, January 2019
Figure B. 1: Ecohydrological units mapped by GHD (2018).

Roy Hill Iron Ore Pty Ltd Life of Mine Water Management Strategy Vegetation Risk Assessment, January 2019
This page has been left blank intentionally.

Roy Hill Iron Ore Pty Ltd Life of Mine Water Management Strategy Vegetation Risk Assessment, January 2019
Appendix C: Likelihood Matrices

Roy Hill Iron Ore Pty Ltd Life of Mine Water Management Strategy Vegetation Risk Assessment, January 2019
This page has been left blank intentionally.

Roy Hill Iron Ore Pty Ltd Life of Mine Water Management Strategy Vegetation Risk Assessment, January 2019
Table C.1: Likelihood descriptors and associated scores used in the matrices and risk assessment.
Likelihood descriptor Likelihood score
Almost Certain 5
Likely 4
Possible 3
Unlikely 2
Rare 1
Negligible 0

Roy Hill Iron Ore Pty Ltd Life of Mine Water Management Strategy Vegetation Risk Assessment, January 2019
Figure C.1: Visual representation of likelihood matrices based on rate and magnitude of groundwater drawdown (A) and rate and magnitude of groundwater mounding (B). In B, the matrix is broadly representative of unbalanced growth where magnitude of mounding is equivalent to magnitude of groundwater recession. In C, the likelihood of decline or mortality due to groundwater mounding is compounded by salinisation.
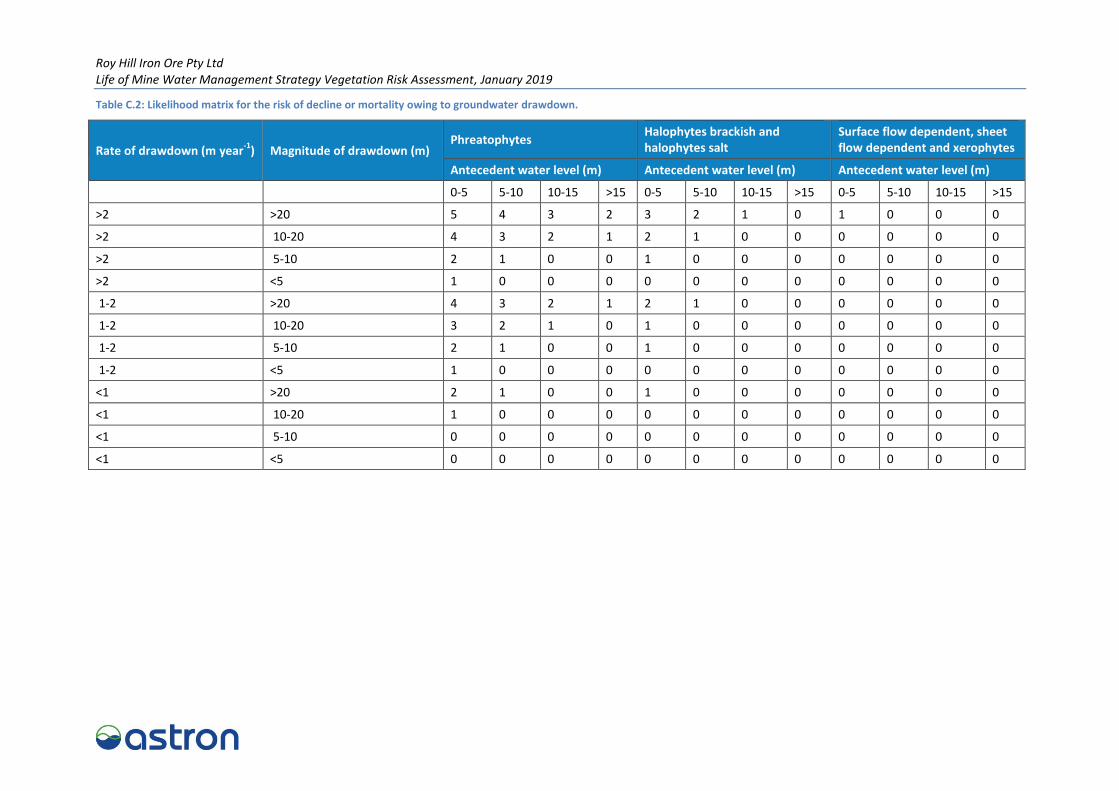
Roy Hill Iron Ore Pty Ltd Life of Mine Water Management Strategy Vegetation Risk Assessment, January 2019
Table C.2: Likelihood matrix for the risk of decline or mortality owing to groundwater drawdown.
Rate of drawdown (m year-1
) Magnitude of drawdown (m) Phreatophytes
Halophytes brackish and halophytes salt
Surface flow dependent, sheet flow dependent and xerophytes
Antecedent water level (m) Antecedent water level (m) Antecedent water level (m)
0-5 5-10 10-15 >15 0-5 5-10 10-15 >15 0-5 5-10 10-15 >15
>2 >20 5 4 3 2 3 2 1 0 1 0 0 0
>2 10-20 4 3 2 1 2 1 0 0 0 0 0 0
>2 5-10 2 1 0 0 1 0 0 0 0 0 0 0
>2 <5 1 0 0 0 0 0 0 0 0 0 0 0
1-2 >20 4 3 2 1 2 1 0 0 0 0 0 0
1-2 10-20 3 2 1 0 1 0 0 0 0 0 0 0
1-2 5-10 2 1 0 0 1 0 0 0 0 0 0 0
1-2 <5 1 0 0 0 0 0 0 0 0 0 0 0
<1 >20 2 1 0 0 1 0 0 0 0 0 0 0
<1 10-20 1 0 0 0 0 0 0 0 0 0 0 0
<1 5-10 0 0 0 0 0 0 0 0 0 0 0 0
<1 <5 0 0 0 0 0 0 0 0 0 0 0 0
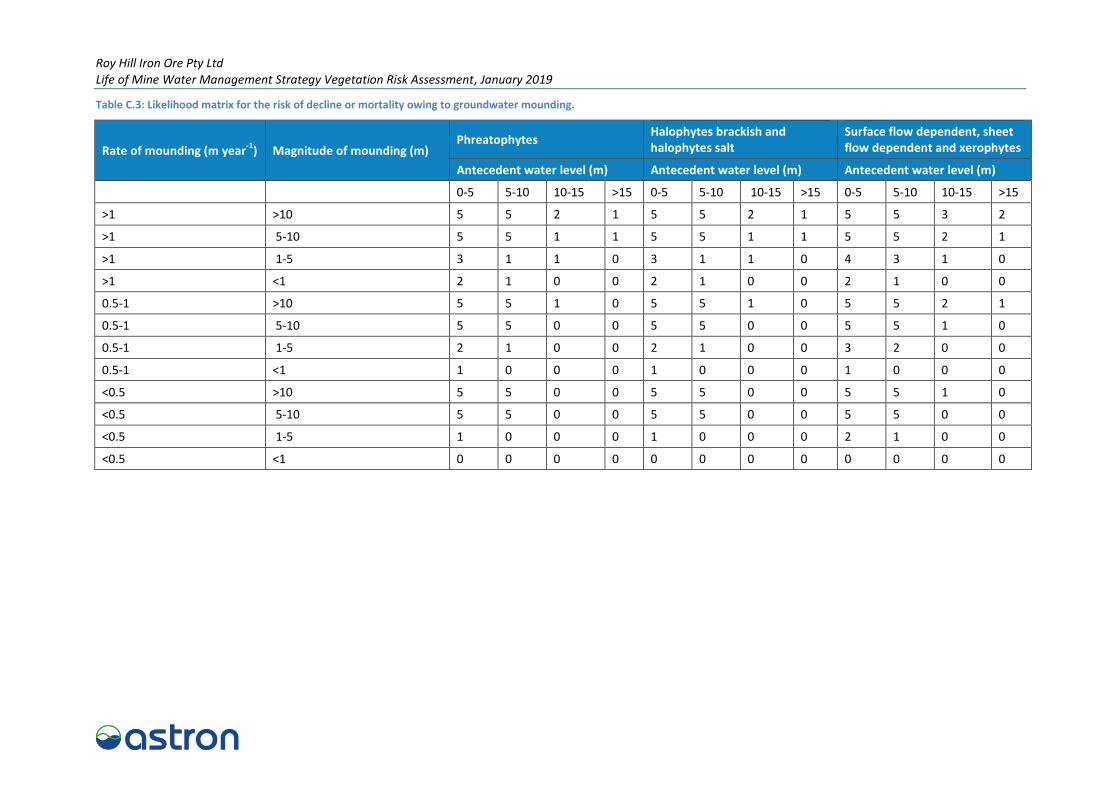
Roy Hill Iron Ore Pty Ltd Life of Mine Water Management Strategy Vegetation Risk Assessment, January 2019
Table C.3: Likelihood matrix for the risk of decline or mortality owing to groundwater mounding.
Rate of mounding (m year-1
) Magnitude of mounding (m) Phreatophytes
Halophytes brackish and halophytes salt
Surface flow dependent, sheet flow dependent and xerophytes
Antecedent water level (m) Antecedent water level (m) Antecedent water level (m)
0-5 5-10 10-15 >15 0-5 5-10 10-15 >15 0-5 5-10 10-15 >15
>1 >10 5 5 2 1 5 5 2 1 5 5 3 2
>1 5-10 5 5 1 1 5 5 1 1 5 5 2 1
>1 1-5 3 1 1 0 3 1 1 0 4 3 1 0
>1 <1 2 1 0 0 2 1 0 0 2 1 0 0
0.5-1 >10 5 5 1 0 5 5 1 0 5 5 2 1
0.5-1 5-10 5 5 0 0 5 5 0 0 5 5 1 0
0.5-1 1-5 2 1 0 0 2 1 0 0 3 2 0 0
0.5-1 <1 1 0 0 0 1 0 0 0 1 0 0 0
<0.5 >10 5 5 0 0 5 5 0 0 5 5 1 0
<0.5 5-10 5 5 0 0 5 5 0 0 5 5 0 0
<0.5 1-5 1 0 0 0 1 0 0 0 2 1 0 0
<0.5 <1 0 0 0 0 0 0 0 0 0 0 0 0

Roy Hill Iron Ore Pty Ltd Life of Mine Water Management Strategy Vegetation Risk Assessment, January 2019
Table C.4: Likelihood matrix for the risk of decline or mortality owing to unbalanced growth.
Rate of recession (m year-1) Magnitude of mounding (m) Phreatophytes
Halophytes brackish and halophytes salt
Surface flow dependent, sheet flow dependent and xerophytes
Antecedent water level (m) Antecedent water level (m) Antecedent water level (m)
0-5 5-10 10-15 >15 0-5 5-10 10-15 >15 0-5 5-10 10-15 >15
>1 >10 4 3 1 0 4 3 1 0 3 2 0 0
>1 5-10 3 2 0 0 3 2 0 0 2 1 0 0
>1 1-5 2 1 0 0 2 1 0 0 1 0 0 0
>1 <1 1 0 0 0 1 0 0 0 0 0 0 0
0.5-1 >10 3 2 0 0 3 2 0 0 2 1 0 0
0.5-1 5-10 2 1 0 0 2 1 0 0 1 0 0 0
0.5-1 1-5 1 0 0 0 1 0 0 0 0 0 0 0
0.5-1 <1 0 0 0 0 0 0 0 0 0 0 0 0
<0.5 >10 2 1 0 0 2 1 0 0 1 0 0 0
<0.5 5-10 1 0 0 0 1 0 0 0 0 0 0 0
<0.5 1-5 0 0 0 0 0 0 0 0 0 0 0 0
<0.5 <1 0 0 0 0 0 0 0 0 0 0 0 0

Roy Hill Iron Ore Pty Ltd Life of Mine Water Management Strategy Vegetation Risk Assessment, January 2019
Table C.5: Likelihood matrix for the risk of decline or mortality owing to groundwater mounding and salinisation.
Rate of mounding (m year
-1)
Magnitude of mounding (m)
Phreatophytes Halophytes salt Halophytes brackish Surface flow dependent, sheet flow dependent and xerophytes
Antecedent water level (m) Antecedent water level (m) Antecedent water level (m) Antecedent water level (m)
0-5 5-10 10-15 >15 0-5 5-10 10-15 >15 0-5 5-10 10-15 >15 0-5 5-10 10-15 >15
>1 >10 5 5 4 3 5 5 3 1 5 5 4 3 5 5 4 3
>1 5-10 5 5 3 2 5 5 2 1 5 5 3 2 5 5 3 2
>1 1-5 4 3 2 1 3 2 1 0 4 3 2 1 5 4 1 1
>1 <1 2 1 0 0 2 1 0 0 2 1 0 0 2 1 0 0
0.5-1 >10 5 5 3 2 5 5 2 1 5 5 3 2 5 5 3 2
0.5-1 5-10 5 5 2 1 5 5 1 0 5 5 2 1 5 5 2 1
0.5-1 1-5 3 2 1 0 2 1 0 0 3 2 1 0 4 3 0 0
0.5-1 <1 2 1 0 0 1 0 0 0 2 1 0 0 1 0 0 0
<0.5 >10 5 5 2 1 5 5 1 0 5 5 2 1 5 5 3 1
<0.5 5-10 5 5 1 0 5 5 0 0 5 5 1 0 5 5 1 0
<0.5 1-5 2 1 0 0 1 0 0 0 2 1 0 0 2 2 0 0
<0.5 <1 1 0 0 0 0 0 0 0 1 0 0 0 0 0 0 0

Roy Hill Iron Ore Pty Ltd Life of Mine Water Management Strategy Vegetation Risk Assessment, January 2019
Appendix D: System Flow Diagrams of the Risk Assessment

Roy Hill Iron Ore Pty Ltd Life of Mine Water Management Strategy Vegetation Risk Assessment, January 2019
This page has been left blank intentionally.

Roy Hill Iron Ore Pty Ltd Life of Mine Water Management Strategy Vegetation Risk Assessment, January 2019
Figure D.1: System flow diagram depicting the Risk Assessment associated with vegetation units.

Roy Hill Iron Ore Pty Ltd Life of Mine Water Management Strategy Vegetation Risk Assessment, January 2019
Figure D.2: System flow diagram depicting the Risk Assessment associated with Priority flora.
Related Documents


![Bitcoin Blockchain Dynamics: the Selfish-Mine Strategy in ...arXiv:1505.05343v2 [cs.CR] 21 May 2015 Bitcoin Blockchain Dynamics: the Selfish-Mine Strategy in the Presence of Propagation](https://static.cupdf.com/doc/110x72/5fe4e55a19fb4738fd4cd2d1/bitcoin-blockchain-dynamics-the-selish-mine-strategy-in-arxiv150505343v2.jpg)


