National Environmental Research Institute University of Aarhus . Denmark NERI Technical Report No. 694, 2008 Life in the marginal ice zone: oceanographic and biological surveys in Disko Bay and south-eastern Baffin Bay April-May 2006

Welcome message from author
This document is posted to help you gain knowledge. Please leave a comment to let me know what you think about it! Share it to your friends and learn new things together.
Transcript

National Environmental Research InstituteUniversity of Aarhus . Denmark
NERI Technical Report No. 694, 2008
Life in the marginal ice zone: oceanographic and biological surveys in Disko Bay and south-eastern Baffi n Bay April-May 2006

[Blank page]
National Environmental Research InstituteUniversity of Aarhus . Denmark
NERI Technical Report No. 694, 2008
Life in the marginal ice zone: oceanographic and biological surveys in Disko Bay and south-eastern Baffi n Bay April-May 2006
Morten FrederiksenDavid BoertmannAnn Braarup CuykensJannik HansenMartin JespersenKasper L. JohansenAnders MosbechTorkel Gissel NielsenJohan Söder kvist

Data sheet
Series title and no.: NERI Technical Report No. 694
Title: Life in the marginal ice zone: oceanographic and biological surveys in Disko Bay and south-eastern Baffin Bay - April-May 2006
Authors: Morten Frederiksen1, David Boertmann1, Ann Braarup Cuykens1, Jannik Hansen1, Martin Jes-persen1, Kasper L. Johansen1, Anders Mosbech1, Torkel Gissel Nielsen2 & Johan Söderkvist2
Departments: 1Department of Arctic Environment, 2Department of Marine Ecology Publisher: National Environmental Research Institute ©
Aarhus University - Denmark URL: http://www.neri.dk
Year of publication: November 2008 Editing completed: October 2008 Referees: Poul Johansen & Frank Rigét
Financial support: This work has been funded as part of the cooperation between NERI and the Bureau of Mine-rals and Petroleum, Greenland Government, on developing a Strategic Environmental Impact Assessment of oil activities in the Disko West area, south-eastern Baffin Bay
Please cite as: Frederiksen, M., Boertmann, D., Cuykens, A.B., Hansen, J., Jespersen, M., Johansen, K.L., Mosbech, A., Nielsen, T.G. & Söderkvist, J. 2008: Life in the marginal ice zone: oceanographic and biological surveys in Disko Bay and south-eastern Baffin Bay - April-May 2006. National Environmental Research Institute, Aarhus University, Denmark. 92 pp. – NERI Technical Report no. 694. http://www.dmu.dk/Pub/FR694.pdf
Reproduction permitted provided the source is explicitly acknowledged
Abstract: This report describes the results of a coordinated aerial and ship-based survey of seabirds, marine mammals, and physical and biological oceanography in the Disko Bay and south-eastern Baffin Bay in spring 2006. The main aim of the survey was to improve understanding of how top predators exploit the highly dynamic marginal ice zone during spring, when the ice is rapidly melting. The spatial distributions of primary production, zooplankton, seabirds and ma-rine mammals are described, and preliminary results are presented from analyses aimed at un-derstanding these distributions. Zooplankton biomass was dominated by Calanus copepods, shrimp larvae and barnacle nauplii, and the distribution of all three groups was related to ice concentration. The study area was estimated to be used by approx 1 million seabirds, including 430,000 thick-billed murres and 400,000 king eiders. King eiders were concentrated on the shallow Store Hellefiskebanke, whereas the distribution of most other seabirds was only weakly related to the physical and biological variables measured. Abundance of marine mammals was also estimated, including 1400 belugas and 450 bowhead whales.
Keywords: West Greenland, Disko Bay, Baffin Bay, oceanography, zooplankton, seabird distribution, sea-bird abundance, marine mammals
Layout: NERI Graphics Group, Silkeborg Drawings: Kasper L. Johansen, Martin Jespersen & Morten Frederiksen Cover photo: David Boertmann – Baffin Bay
ISBN: 978-87-7073-071-6 ISSN (electronic): 1600-0048
Number of pages: 92
Internet version: The report is available in electronic format (pdf) at NERI's website http://www.dmu.dk/Pub/FR694.pdf

Contents
Summary 5
Sammenfatning 7
Eqikkaaneq 9
1 Introduction 11 1.1 Aims and objectives 11 1.2 Study design and elements 11 1.3 Study area 12
2 Methods 14 2.1 Field methods – ship survey 14 2.2 Field methods – aerial survey 15 2.3 Remote sensing data 18 2.4 Generalised sea ice margins 18 2.5 Laboratory methods 18 2.6 Statistical methods 19
3 Results 24 3.1 Physical oceanography 24 3.2 Phytoplankton biomass (chlorophyll) 29 3.3 Zooplankton 31 3.4 Seabirds 50 3.5 Marine mammals 76
4 Discussion and conclusions 87 4.1 The spring phytoplankton bloom 87 4.2 Zooplankton distribution 87 4.3 Seabird distribution 87 4.4 Marine mammal distribution 89 4.5 Thick-billed murre diet 89
5 References 90
National Environmental Research Institute
NERI technical reports

[Blank page]
5
Summary
As part of a Strategic Environmental Impact Assessment of oil activities in the Disko West area, the spatiotemporal distribution of marine organ-isms and ecosystem processes in the marginal ice zone was studied in spring 2006. The study had two main objectives: 1) identifying key areas for biodiversity at this highly dynamic time of year, and 2) evaluating factors affecting the spatial distribution of key species and groups. Two surveys were carried out simultaneously in Disko Bay and south-eastern Baffin Bay: an aerial survey of seabirds and marine mammals, and an oceanographic cruise combined with transect surveys. On the cruise, physical and biological data were recorded at 116 stations situated approx. 10 km apart, and seabirds and marine mammals were surveyed between stations. Thick-billed murres were collected at sea to assess their diet. Where appropriate, remote sensing data were used to supplement the in situ measurements and observations.
Vertical profiles of salinity and temperature showed that stratification progressed over the three-week study period, with some spatial varia-tion. Nutrient concentrations were generally high, and conditions for a phytoplankton spring bloom were thus in place. Accordingly, in situ measurements of fluorescence as well as remote sensing data showed a gradual increase in chlorophyll concentration. The bloom seemed to oc-cur earlier on Store Hellefiskebanke in the southern part of the study area, perhaps because the shallow depth allowed phytoplankton to re-main in the photic zone before stratification was established, i.e. when the water column was fully mixed.
Mesozooplankton biomass in the upper part of the water column was dominated by Calanus copepods (64%), barnacle larvae (nauplii, 16%) and shrimp larvae (12%). Larger planktonic organisms were not sampled adequately by the available gear. Copepods were dominant in all areas except on Store Hellefiskebanke, where barnacle nauplii were most abundant. Total zooplankton biomass showed a high spatial variability, with few clear patterns. Statistical modelling showed that ice concentra-tion affected the distribution of all three key groups, with a weak avoid-ance of ice by copepods and shrimp larvae, and a strong preference for ice by barnacle nauplii, which also preferred areas where stratification was weak. All fish larvae observed were sand lance, and these were mainly found around Store Hellefiskebanke.
Abundance estimates based on the aerial survey showed that about one million seabirds used the study area in spring. The most numerous spe-cies were thick-billed murre (430,000) and king eider (400,000), followed by northern fulmar (89,000), black-legged kittiwake (77,000) and black guillemot (21,000). King eiders were concentrated on Store Hellefiske-banke and common eiders near coastlines, areas that are shallow enough to allow them access to their benthic prey. The spatial distribution of the other common species was much more complex, partly because the study period was relatively long and birds probably redistributed them-selves as food and ice conditions changed. Statistical modelling based on the ship survey data showed that northern fulmars and black-legged
6
kittiwakes were more likely to occur in areas where the spring bloom was well developed, whereas thick-billed murres preferred deep waters and black guillemots preferred shallow waters. None of these relation-ships were very strong. Further statistical analyses of the spatial distribu-tion of seabirds based on the aerial surveys are planned, using newly developed methods.
Many thick-billed murres had empty stomachs, and among the remain-der invertebrates (amphipods and squid) were more common than fish. Capelin was the only fish species positively identified in murre stom-achs.
Abundance estimates of marine mammals were based on the aerial sur-vey. These showed that the most numerous species in the study area were ringed seal (4600), beluga (1400), bearded seal (1200), bowhead whale (450) and walrus (420). However these estimates were very impre-cise and almost certainly too low, because they were not corrected for submerged animals.
7
Sammenfatning
Den rumlige og tidslige fordeling af marine organismer og økosystem-processer i iskant-zonen blev undersøgt i foråret 2006 som led i en Stra-tegisk Miljøvurdering af olieaktiviteter i Disko Vest-området. Formålet var dels at identificere vigtige områder for biodiversitet på denne særde-les dynamiske årstid, og dels at identificere faktorer som påvirker den rumlige fordeling af vigtige arter og grupper. To undersøgelser blev ud-ført samtidig: En optælling (linjetransekt) fra fly af havfugle og havpat-tedyr, samt et oceanografisk togt kombineret med linjetransekter. På tog-tet blev fysiske og biologiske data indsamlet ved 116 stationer med ca. 10 km’s mellemrum, og havfugle og havpattedyr blev talt mellem statio-nerne. Polarlomvier blev indsamlet til havs for at undersøge deres føde-valg. Satellitbaserede målinger blev i nogle tilfælde brugt til at supplere data og observationer fra togtet.
Lodrette profiler af temperatur og saltholdighed viste at lagdelingen af vandsøjlen blev stærkere over den tre uger lange undersøgelsesperiode, med nogen rumlig variation. Koncentrationerne af næringsstoffer var generelt høje, og betingelserne for en forårsopblomstring af fytoplankton (mikroskopiske alger) var således til stede. Målinger af klorofylkoncen-tration fra såvel skib som satellit viste da også en stigning over undersø-gelsesperioden. Opblomstringen syntes at ske tidligere på Store Helle-fiskebanke i den sydlige del af undersøgelsesområdet, måske fordi om-rådet er relativt lavvandet og fytoplankton derfor forblev i den fotiske zone (hvor der er lys nok til fotosyntese) også før en lagdeling var etable-ret.
Biomassen af mesozooplankton (smådyr under 2 mm) i den øvre del af vandsøjlen var domineret af tre grupper: Vandlopper af slægten Calanus (64%), rur-larver (16%) og rejelarver (12%). Større planktondyr blev kun undtagelsesvis fanget med det tilgængelige udstyr. Vandlopper domine-rede overalt i undersøgelsesområdet, undtagen omkring Store Helle-fiskebanke hvor rur-larver var meget talrige. Den samlede biomasse af zooplankton varierede meget fra sted til sted uden noget klart mønster. Statistiske modeller viste at iskoncentrationen påvirkede den rumlige fordeling af alle tre hovedgrupper. Vandlopper og rejelarver var mindre hyppige i områder med megen is, mens rur-larver var betydeligt mere hyppige i områder med megen is og svag lagdeling. Alle fiskelarver var tobis, og forekom mest omkring Store Hellefiskebanke.
Antallet af havfugle i undersøgelsesområdet blev estimeret ud fra flytæl-lingerne. Total blev området brugt af omkring en million fugle i forårs-perioden. De mest talrige arter var polarlomvie (430.000) og kongeeder-fugl (400.000), efterfulgt af mallemuk (89.000), ride (77.000) og tejst (21.000). Kongeederfugl var koncentreret omkring Store Hellefiskebanke og almindelig ederfugl nær kysten, områder som er tilstrækkelig lav-vandede til at de har adgang til de bunddyr de lever af. Den rumlige fordeling af de øvrige almindelige arter var mere kompleks, til dels fordi undersøgelsesperioden var ret lang og fuglene formodentlig ændrede fordeling efterhånden som føde- og isforholdene ændrede sig. Statistiske modeller baseret på skibstællingerne viste at mallemuk og ride optrådte

8
hyppigere i områder hvor forårsopblomstringen var veludviklet, mens polarlomvie foretrak dybt vand og tejst lavt vand. Ingen af disse mønstre var dog særligt stærke. Yderligere analyser af havfuglenes fordeling ba-seret på flytællingerne er planlagt, med anvendelse af helt nyudviklede metoder.
Mange polarlomvier havde tomme maver, og blandt de resterende var invertebrater (amfipoder og blæksprutter) mere almindelige end fisk. Den eneste fiskeart som med sikkerhed blev fundet i maverne var lodde.
Antallet af havpattedyr blev estimeret ud fra flytællingerne. De alminde-ligste arter i undersøgelsesområdet var ringsæl (4600), hvidhval (1400), remmesæl (1200), grønlandshval (450) og hvalros (420). Disse estimater var dog meget usikre og næsten sikkert for lave, da de ikke blev korrige-ret for at dyrene er neddykket en stor del af tiden.

9
Eqikkaaneq
Qeqertarsuup Tunuata Kitaata immikkoortoqarfiani uuliamut tunnga-sunik suliaqarnermi Periuseriniakkatut Avatangiisinik naliliinermut ilaa-titatut immap sikuata killeqarfiani imarmiunik uumassusilinnik aamma pinngortitami ataqatigiinnermi pisartunik inissisimaffikkut piffissallu ingerlaneratigut agguataartoqarsimaneq upernaaq 2006-imi misissorne-qarpoq. Ilaatigut ukiup ilaani assorsuaq pisoqarfiusumi uumassusillit assigiinngisitaarnerinut immikkoortortat pingaarutillit suussusersine-qarnissaat, ilaatigullu uumssusillit inissisimaffimmikkut agguataarfiinik sunniuteqartartunik atugassarisat suussusersinissaat siunertarineqarput. Misissuinerit marluk ataatsikkoortillugit suliarineqarput: Timmisartumit timmissanik imarmiunik aamma uumasunik miluumasunik imarmiunik kisitsinerit (linjetransekti), kiisalu imarsiorluni angalaarneq linjetransek-tinut ataqatigiissitaq. Angalaarnermi km-it qulit missiliorlugit uuttortaa-vinni 116-ini timitalinnik uumassusilinnullu paasissutissat katersorne-qarput, uuttortaaviillu akornanni timmissat imarmiut uumasullu mi-luumasut imarmiut kisinneqarput. Appat nerisaat suunersuut misissor-niarlugit imartami katersarineqarput. Angalaarnermit paasissutissanik ilalersuiniarluni ilaatigut qaammataasakkut tunngaveqartumik uuttor-taanerit atorneqarput.
Sap. akunnerini pingasuni misissuiffigisap ingerlanerani kissassutsimik tarajoqassutsimillu napparissunik misissuinerit inissisimaffikkut allann-goraalaartoqarfiusunik erngup napasuliaasanngorlugu misissugarisap ikiariissitaarnerata annertusiartuaarneranik takutitaqarput. Inuussutis-saasut katersuuffigisaat nalinginnaasumik annertupput, taamatullu fy-toplanktoninik (algit tappiorannartut) upernaakkut naajorartoqarnissaa-nut atugassarititat tamaaniillutik. Umiarsuarmit soorlulusooq qaamma-taasamit misissuiffittut piffissarisap ingerlanerani klorofyleqassutsimik uuttortaanerit qaffariaammik takutitaqarput. Misissuiffigisap kujataa-tungaani Ikkannersuarmi (Store Hellefiskebankemi) naajorarneq siusin-nerusorpasissukkut pisarpasippoq, immaqa tamanna ikkakannersuum-mat, taamaattumillu sumiiffimmi fotiskimi (fotosynteseliornissamut qaamanerup naammaffiani) fytoplanktonip illutik, tassalu aamma ikia-riissitaarisoqarnera sioqqullugu.
Erngup napasuliaasap qullersaani mesozooplanktonini uumassuseqati-giit (uumasuaraaqqat 2 mm-it inorlugit angissusillit) assigiinngiiaanik pingasunit takussutissaqarfiunerupput: Erngup pississartui kinguaariit Calanus (64%-it), kaattungiiaat ilaasa qullugiaat (16%-it) aamma kingup-paat qullugiaat (12%-it). Atortorissaarutinik pigineqartunik planktonit uumasuaqqat anginerusut qaqutiguinnaq pisarineqartarput. Misissuiffi-gisami erngup pississartui sumi tamani takussaanersaapput, taamaallaat Ikkannersuarmi kaattungiiaat ilaasa takussaaffiginerpaaffigisaanni pin-natik. Zooplanktonini uumassuseqatigiit ataatsimoortut sumiiffimmit sumiiffimmut assorsuaq assigiinngiiaarput, erseqqissumik najoqquta-qarpasinngitsumik. Eqimattakkuutaani pingaarnerni pingasuni tamani inissisimassutsimi agguataarnermik sikoqassutsip sunniivigigaa naatsor-sueqqissaaraluni ilusiliat takutippaat. Erngup pississartuisa kinguppaal-lu qullugiaasa sikortaqarpallaartut ilaatigut tikissimanaveersaartarpaat, kaattungiiaalli ilaasa sumiiffiit assorsuaq sikutaqartut annikitsumillu

10
ikiariissitaarisoqarfiusut annertuupilussuuffigalugit. Aalisakkat qullu-giaat tassaapput putooruttut, Ikkannersarsuup eqqaani takussaanerpaal-lutik.
Misissuiffiusumi timmissat imarmiut amerlassusaat timmisartumit kisit-sinernit missiliorneqarput. Upernaap nalaani sumiiffigisaq timmissanit millionit missaannit tamakkiisumik atorneqarpoq. Assigiiaat amerlaner-paat tassaapput appa (430.000-it) aamma miteq siorakitsoq (400.000-it), malitsigaallu qaqulluk (89.000-it), taateraaq (77.000-it) aamma serfaq (21.000-it). Ikkannersuup eqqaani naqqup uumasuinut nerisaminnut at-taveqarnissaminnut ikkassuseqartumi meqqit siorakitsut amerlaner-paapput. Assigiiaat nalinginnaat sinnerisa inissisimaffimmikkut aggua-taarnerat paasiuminaanneruvoq, ilaatigut piffissaq misissuiffiusoq sivi-sungaatsiarmat, ilaatigullu nerisatigut sikoqassutsimilu atugassarisat al-lanngoriartorneri ilutigalugit timmissat agguataarneri allanngorsimagu-narmata. Upernaami naajorarfiusut inerikkiartorluarsimaffigisaanni qa-qulluit taateraallu amerlanerusartut umiarsuarmit kisitsinernik tunnga-veqarluni naatsorsueqqissaaraluni ilusiliat takutippaat, appalli itisooqar-fiusut serfallu ikkattoqarfiusut najorumanerullugit. Ilutsilli tamakku ar-laannaalluunniit annertoorsuarmik takussutissaqarfiunngillat.
Apparpassuit nerisaqarsimanngillat, sinnerinilu ivertebratit (amfipodit amikullu) aalisakkanit nalinginnaanerupput. Aalisakkani assigiiaat naarmiorisaat qularisassaannginnerpaaq tassaavoq ammassak.
Immami uumasut miluumasut amerlassusaat timmisartumit kisitsinernit missiliorneqarput. Misissuiffigisami assigiiaat nalinginnaanerpaat tas-saapput natsiit (4600-it), qilalugaq qaqortaq (1400-it), ussuk (1200-it), ar-fivik (450-it) aamma aaveq (420-t). Missiliuinerilli assorsuaq isuman-nanngitsuupput, qularutissaagunanngitsumik ikippallaartutut missiliuu-taallutik, uumasut piffissap ilarujussuani aqqaamasimanerinut naqqis-sorneqarsimannginneri pissutigalugit.
11
1 Introduction
1.1 Aims and objectives
In 2006 the waters off West Greenland between 67° and 71° N, the north-eastern part of Davis Strait and the south-eastern part of Baffin Bay (= the Disko West area), were opened for hydrocarbon exploration. The first licenses were granted in 2007. Prior to opening of the area for hy-drocarbon exploration, a programme for Strategic Environmental Impact Assessment (SEIA) was initiated in 2004 in a co-operation between the Bureau of Minerals and Petroleum (BMP), the Greenland Institute of Natural Resources (GNIR) and the National Environmental Research In-stitute (NERI). In support of the SEIA a number of background studies were initiated, including the study reported here focusing on the rich life in the marginal ice zone in spring. The first results from this study con-ducted in 2006 were also included in the Strategic Environmental Impact Assessment (SEIA) (Mosbech et al. 2007).
The aims of this study were to a) identify ecological key areas with high concentrations of important animals, and b) attempt to identify key fac-tors determining the distribution of important species so that models can be developed in the future to predict recurrent concentrations. We have in this report mainly focused on analysing distributions in relation to bathymetry, ice conditions and distribution of food items.
1.2 Study design and elements
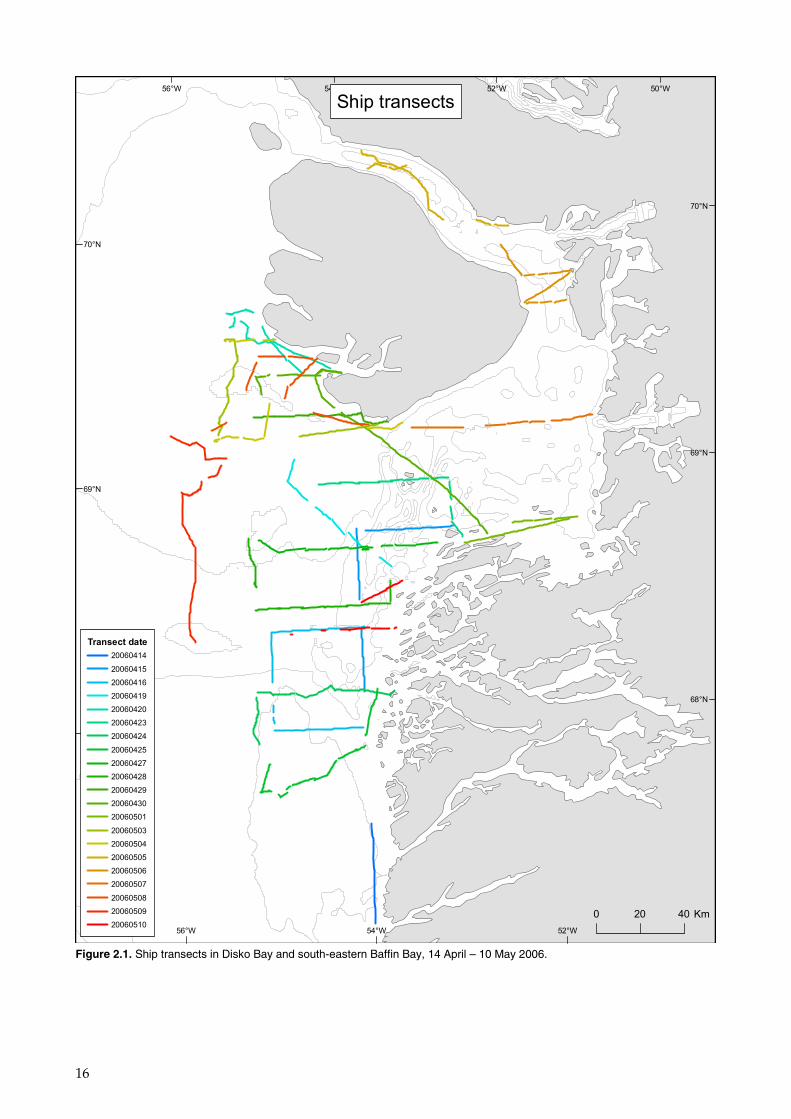
In spring (April to May) 2006, a multidisciplinary study was conducted in the marginal ice zone in Disko Bay and the Disko West area. The pro-gram included aerial surveys of seabirds and mammals covering the en-tire region with systematic transects (Figure 2.1), and a synoptic ship-based biological oceanographic survey covering transects from open wa-ter and into the drifting ice at the ice edge as well as use of satellite data (Figure 2.2).
This report summarises data collected from the aerial and ship-based surveys. The synoptic collection of data on seabirds, zooplankton as well as biological and physical oceanographic variables in the Ice Edge project provides a unique opportunity to examine what determines the spatial distribution of major food web components during a critical part of the seasonal cycle. At the upper trophic levels, it is reasonable to assume that seabirds distribute themselves mainly according to food availability. Seabird diet at this time of the year is not well known in W Greenland (but see Falk & Durinck 1993 and chapter 3.4), but it is likely that the main components of the diet for most species are small fish (e.g. Arctic cod (Boreogadus saida), capelin (Mallotus villosus) and sand lance (Ammo-dytes spp.)) as well as large planktonic crustaceans (amphipods, euphau-siids, and possibly large copepods and juvenile deep-water shrimps (Pandalus borealis)). Unfortunately, many of these potentially important prey organisms were either not sampled at all or not sampled very well
12
gear used in this study. As a consequence, the analyses of seabird distri-bution in relation to zooplankton abundance presented here rely on the assumption that the distribution of important seabird prey is largely driven by the abundance of their respective prey, namely abundant mesozooplankton organisms which were well sampled. In addition, we test whether the distribution of key zooplankton groups as well as sea-birds is linked to aspects of the physical and biological environment (depth, stability of the water column, ice concentration, chlorophyll con-tent). Because of the complex nature of the data (see next section), statis-tical analysis is far from simple and the results presented here should be regarded as preliminary.
1.3 Study area
The offshore parts of the study area are north-eastern Davis Strait and south-eastern Baffin Bay. The shelf is the rather shallow waters (depths less than 200 m) near the coast. This shelf includes several large shoals or banks, which typically range between 20 and 200 m in depth. In the southern part of the study area the shelf is up to 120 km wide, while it in the northern part is narrower and less well defined towards the deep sea. The shelf is traversed by deep troughs, which separate the fishing banks. There is deep water down to 2500 m to the west of the shelf.
Disko Bay is a 10,000 km2 large bay. Baffin Bay and the Banks of Disko border the bay. There are two entrances into Disko Bay. The southern en-trance is about 60 km wide, and has a narrow channel that is about 500 m deep. However, islands and shallow depths dominate the topography at the entrance. The northern entrance, Vaigat, is a 100 km long and 10-20 km wide channel with a sill depth of about 250 m.
Upwelling often occurs along the steep sides of the fishing banks driven by the tidal current, so that upwelling usually alternates with downwel-ling. Hydrodynamic simulations carried out as part of the Strategic Envi-ronmental Impact Assessment programme reveal a significant upwelling area around Hareø in the mouth of Vaigat, and a prominent upwelling area on the northeast corner of Store Hellefiskebanke, where a deep wedge cuts southwards between the bank and the coast. Further model simulations south of the study area predict that upwelling also occurs west of the banks and to a lesser extent in the deep channels separating the banks (Pedersen et al. 2005).
Two types of sea ice occur in the study area: fast ice, which is stable and anchored to the coast, and drift ice, which is very dynamic and consists of floes in varying size and degree of density. The drift ice is often re-ferred as “The West Ice” because it is formed to the west of Greenland (first-year ice). Icebergs, particularly originating from the very produc-tive glacier at Ilulissat, are also common in the study area.
The ice conditions between 60° N and 72° N are primarily determined by the relatively warm north- or northwest-flowing West Greenland Cur-rent and the cold south-flowing Baffin Current. The West Greenland Current delays the time of ice formation in eastern Davis Strait and re-sults in an earlier break-up than in the western parts. The Baffin Island Current conveys large amounts of sea ice from Baffin Bay to the Davis
13
Strait and the Labrador Sea for most of the year, especially during the winter and early spring months. During this period, sea ice normally covers most of the Davis Strait north of 65° N, except areas close to the Greenland coast, where a flaw lead or shear zone (consisting of open wa-ter or thin ice) of varying width often appears between the shore or the fast ice and the drift ice offshore as far north as latitude 67° N. The mar-ginal ice zone of the drift is normally oriented to the southwest towards Hudson Strait or the Labrador Coast. In the beginning of the melt season, a wide lead or polynya-like feature often forms west of Disko Island and off Disko Bay. The eastern part of Davis Strait, south of Disko Island, is free of sea ice during this period, whereas drift ice dominates to the west and north.
14
2 Methods
2.1 Field methods – ship survey
The research vessel used for the ship-based survey, R/V Adolf Jensen (Greenland Institute of Natural Resources), did not have ice-breaking capabilities, and generally ship transects did not proceed when ice cover was above 8/10. However, in some situations when ice thickness and size of floes were manageable for the vessel, samples were taken at loca-tions with ice concentration > 8/10. The ship survey took place from 18 April – 10 May 2006 and covered Disko Bay, Vaigat, and areas west and south of Disko including the northern half of Store Hellefiskebanke. From the vessel, oceanographic profiling of the water column and bio-logical sampling were conducted at 116 stations, and seabirds and ma-rine mammals were surveyed along transects between stations.
2.1.1 Oceanographic sampling
Physical and biological oceanographic sampling was carried out at 116 stations located approximately 10 km apart. Depth profiles of salinity, temperature and fluorescence were recorded from the surface to the bot-tom (or a maximum of 250 m) using a Seabird CTD 901. The salinity probe was calibrated against a Guildline Portasal salinometer using samples from 250 m depth at station 39. The calibration showed that the CTD had an accuracy of 0.05 salinity units. A Hydroscat-2 mounted on the CTD sampled fluorescence in the vertical water column.
Water samples for nutrients and chlorophyll were collected using Niskin bottles which were closed at specific depths. The Niskin bottle was at-tached to a wire and lowered with a winch. The water sample depths were 0.5 m, depth of max fluorescence (i.e. highest chlorophyll a concen-tration), and 50 m. The sampling depths at stations with no available fluorometer data were 0.5 m, 25 m, and 50 m.
Samples of mesozooplankton, ichthyoplankton and larger zooplankton from 0-50 m were collected using a WP-2 net (mesh size 200 µm) with a 0.25 m2 opening area. The net was deployed and retrieved at speeds of about 10 m min-1. The samples were concentrated on a 45 µm or a 200 µm filter, preserved in 2-4% buffered formalin, and stored for later enumera-tion and biomass estimation.
2.1.2 Bird counts
The counts followed the guidelines of Komdeur et al. (1992), in 6 parallel bands (Transect type 4; 1-50 m, 50-100 m, 100-200 m, 200-300 m, 300-400 m, 400-500 m). Counts were split in 2-minute intervals. Observations of flying birds were recorded in snapshots every second minute. In addi-tion to position, number and other standard data, we recorded behav-iour using the codes specified by Camphuysen & Garthe (2001). Ice con-centration was estimated in fractions of 10 for each 2-minute interval. Counts were conducted during most periods of sailing: between oceano-
15
graphic sampling stations and while transiting to and from ports and an-chorages. Birds were generally not counted during oceanographic sam-pling at the stations and during hours of darkness.
Observations were carried out throughout the day, most days starting between 0700 and 0830, and ending between 2030 and 2200. The transect plan is shown in Figure 2.1. Generally, weather conditions were fine, and surveying was impossible only for a total of 4 days; more specifically on 13, 21, 22 and 26 April. The first of these days, it was due to observer mo-tion sickness, the others due to mechanical problems.
2.1.3 Collection of specimens
The Ministry of Environment and Nature – under the Greenland Home Rule Government – granted permission to collect and export 50 thick-billed murres (Uria lomvia) to Denmark. All birds collected were shot from a Zodiac using a shotgun. Specimens were collected in areas where birds seemed to be foraging. The birds were frozen immediately after collection, and shipped to Denmark as frozen freight.
2.2 Field methods – aerial survey
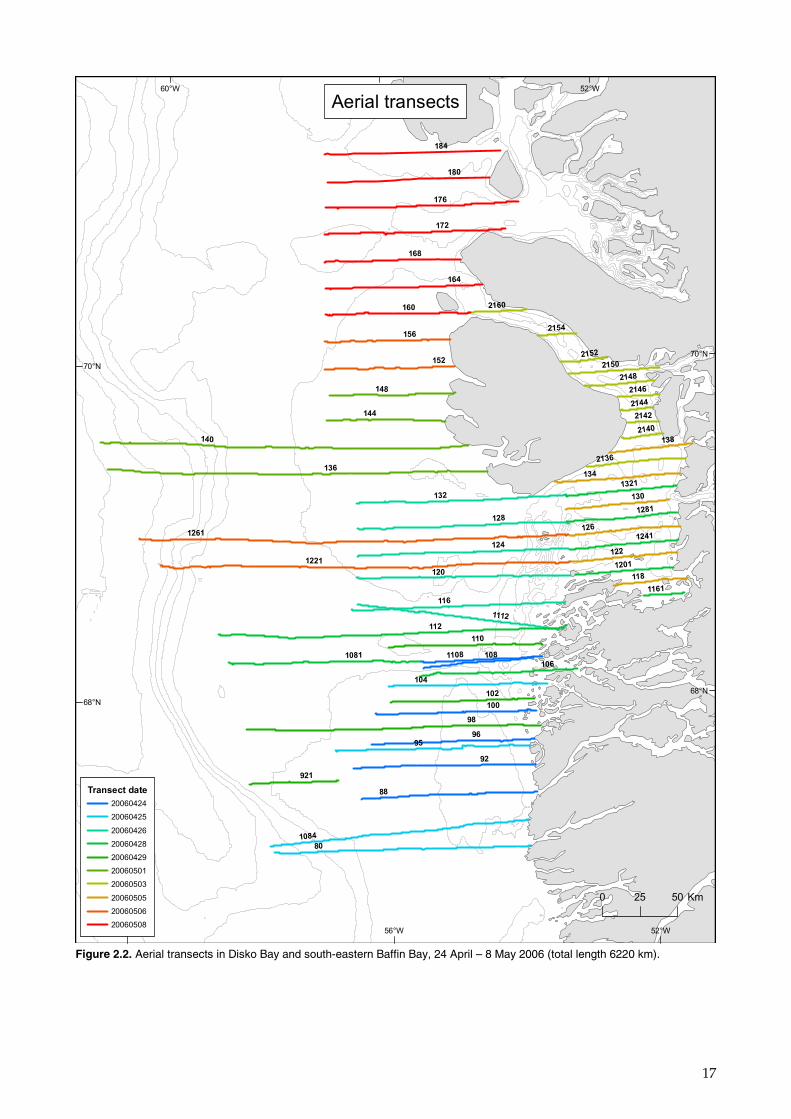
Aerial surveys for seabirds and marine mammals were carried out in the West Greenland waters between 67° 30’ N and 71° 30’ N in the period 24 April to 8 May 2006. A set of transects were selected in advance. They were spaced with 0.8 degrees and ran east-west between the coast of Greenland and the border to Canada. A selection of these were flown, and only some of these in their full length (Figure 2.2). The total length of all transects flown was 6220 km.
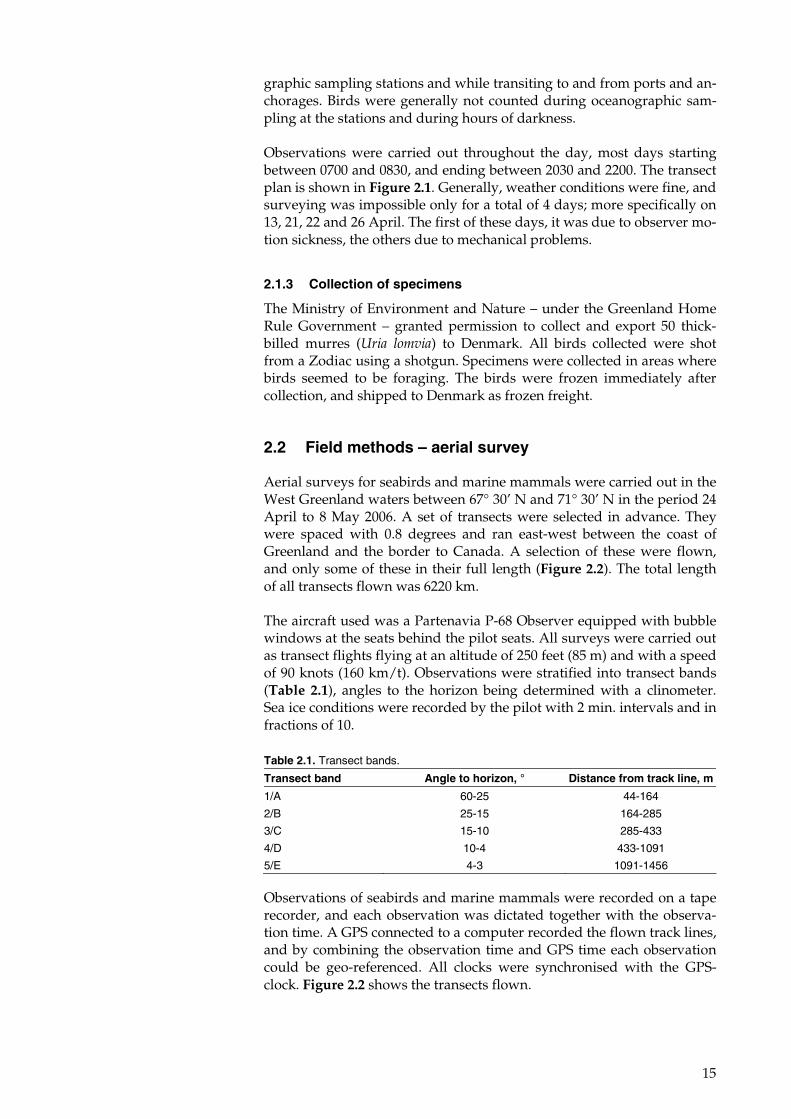
The aircraft used was a Partenavia P-68 Observer equipped with bubble windows at the seats behind the pilot seats. All surveys were carried out as transect flights flying at an altitude of 250 feet (85 m) and with a speed of 90 knots (160 km/t). Observations were stratified into transect bands (Table 2.1), angles to the horizon being determined with a clinometer. Sea ice conditions were recorded by the pilot with 2 min. intervals and in fractions of 10.
Observations of seabirds and marine mammals were recorded on a tape recorder, and each observation was dictated together with the observa-tion time. A GPS connected to a computer recorded the flown track lines, and by combining the observation time and GPS time each observation could be geo-referenced. All clocks were synchronised with the GPS-clock. Figure 2.2 shows the transects flown.
Table 2.1. Transect bands.
Transect band Angle to horizon, ° Distance from track line, m
1/A 60-25 44-164
2/B 25-15 164-285
3/C 15-10 285-433
4/D 10-4 433-1091
5/E 4-3 1091-1456
16
50°W
52°W
52°W
54°W
54°W
56°W
56°W
70°N
70°N
69°N
69°N
68°N
68°N
Ship transects
Transect date
20060414
20060415
20060416
20060419
20060420
20060423
20060424
20060425
20060427
20060428
20060429
20060430
20060501
20060503
20060504
20060505
20060506
20060507
20060508
20060509
20060510
0 20 40 Km
Figure 2.1. Ship transects in Disko Bay and south-eastern Baffin Bay, 14 April – 10 May 2006.
17
98
80
136
140
112
1261
1221
95
92
88
96
116
120
128
124
132
1084
176
172
184
180
100
1112
104
110
106
164
160
1081
102
168
152
148
156
134
108
144
126
122
130
921
1108
1321
1281
138
1241
118
2136
1201
2150
2148
2160
2152
2140
2146
1161
2154
2144
2142
52°W
52°W
56°W
56°W
60°W
60°W
70°N
70°N
68°N
68°N
Aerial transects
Transect date
20060424
20060425
20060426
20060428
20060429
20060501
20060503
20060505
20060506
20060508
0 25 50 Km
Figure 2.2. Aerial transects in Disko Bay and south-eastern Baffin Bay, 24 April – 8 May 2006 (total length 6220 km).
18
2.3 Remote sensing data
The surface concentration of chlorophyll derived from satellite observa-tions is a combined product derived from MODIS and SeaWiFS data, and has been processed by Oregon State University, US. Daily and weekly averaged remote sensing data were downloaded from Ocean-ColorWeb, NASA: http://oceancolor.gsfc.nasa.gov/cgi/level3.pl?DAY=12Apr2006&PER=&TYP=machl&RRW=16
In this report the data are presented as weekly averaged values.
2.4 Generalised sea ice margins
Information about sea ice coverage can be derived from a variety of sources, mainly based on remotely sensed data. The problem is that these data do not always agree with each other and that some are re-stricted due to clouds, presence of land etc. Thus, to give a summarised impression of the sea ice situation during the survey in April and May 2006 generalised ice margins were derived from the available data.
Data used in this comparison were mainly the public ice charts from the Danish Meteorological Institute (DMI) and systematic observations made by the pilot during the aerial surveys. To support these data, ar-chived data from the American National Ice Center (Natice) and remote sensed data from the MODIS-sensor were included sporadically.
Ice margins were derived from 13 April until 9 May, with about one week temporal resolution. On the maps, ice margins are symbolised with a simple line which could be regarded as corresponding to the bold line on the ice charts from DMI, symbolising the transition between ice-influenced areas and open water. These lines should not be regarded as the absolute truth regarding the location of the ice margin on the particu-lar date. Instead they show in more general terms the approximate loca-tion during the days around the given date. Thus, no mathematical or statistical methods have been developed for this task as the lines are only rather subjective interpretation of the data mentioned above.
2.5 Laboratory methods
2.5.1 Chlorophyll and nutrients
Samples (0.2-0.25 litres) obtained from the routine depths described above were placed in the dark and filtered at the ship-based laboratory onto GF/F filters, 10 µm, and 50 µm, extracted in 96% ethanol (Jespersen & Christoffersen 1987) and measured spectrophotometrically (Strickland & Parsons 1972). The discrete in situ measures of chlorophyll a were combined with the depth profiles of fluorescence to obtain depth profiles of chlorophyll. For each profile, a linear regression of fluorescence chlo-rophyll against spectrophotometric chlorophyll was carried out and used to calculate the depth profile. Integrated chlorophyll was then calculated as the area under this curve.
Samples obtained from the routine depths described above for the de-termination of nutrient concentration (NH4+, NO3-, PO43-, SiO43-) were

19
frozen on board the ship. Measurements were carried out at the National Environmental Research Institute (NERI) on a Skalar (Breda, Nether-lands) autoanalyser according to Andersen et al. (2004). All nutrient samples were analysed in duplicate with a precision of 0.06, 0.09 and 0.12 µM for nitrate, phosphate and silicate, respectively.
2.5.2 Zooplankton
Zooplankton samples were processed by Arctic Agency, Gdansk, Po-land. The samples were split using a plankton splitter to obtain sample sizes of approximately 500 individuals, and all identifiable zooplankton were identified to lowest possible taxonomic level and developmental stage. Prosome lengths were measured on 10 individuals from each cope-podite stage, and total body length was measured on 25 to 50 nauplii. Mean individual biomass (carbon content) was estimated from length-weight regressions collected as part of previous plankton studies in the area (T.G. Nielsen, unpubl. data).
2.5.3 Thick-billed murre diet
All collected birds (n = 49) were dissected, aged and sexed in the lab, and the contents of the stomach and oesophagus were removed and con-served in 70% ethanol. Prey items were classified, identified and meas-ured under microscope. Fish otoliths were identified following Härkönen (1986) and measured (length and width) to the nearest 0.03 mm. Two otoliths were considered originating from the same fish if the difference in length was less than 0.2 mm (Falk & Durinck 1993). Length and weight of fish were estimated from otolith size using equations in Härkönen (1986).
Crustaceans were identified using keys in Keast & Lawrence (1990) and Hayward & Ryland (1995). For the main species present (Parathemisto li-bellula), body length was measured or reconstructed using regressions between the size of specific segments and total body length. Weight was estimated using an equation in Bradstreet (1976). Length and weight of squid was estimated from jaw size according to Clarke (1986).
2.6 Statistical methods
2.6.1 Quantifying stability of the water column
The Simpson index (Si) is the vertical integration of the density variabil-ity for each station, thus
( )∫ −−=D
i zdzzD
gS
0
0)( ρρ
where g is the gravity of acceleration (9.81 m s-2), D (m) is the minimum value of bottom depth and 100, ρ(z) is the density (kg m-3) at the depth z (m), and ρ0 is the mean density for that particular profile. A high value of the Simpson index means that it takes more energy to mix the upper wa-ter column. It is thus more likely that plankton at the surface at stations with a high Simpson index will remain near the surface where there is

20
sufficient light to grow, compared to locations with a low Simpson in-dex.
2.6.2 Distance sampling and density surface modelling
During the aerial and ship surveys, counts of birds and marine mammals were recorded in bands around the transect line to allow abundance of the different species within the study area to be estimated by means of distance sampling (Buckland et al. 2001). Only the abundance estimates derived from the aerial survey are given in this report (chapters 3.4-3.5), as they are considered superior to the ship survey which covers a smaller area, spans a longer period of time, and are to some extent biased by the inability of the ship to travel in waters with high ice concentrations. The analyses were performed using the software Distance (Thomas et al. 2006a).
Following Buckland et al. (2001, 37), the density of sightings (clusters of animals) are given as D = n / (2wL* Pa), where n is the total number of sightings, w is the maximum search width, L is the total length of tran-sect line and Pa is the proportion of objects in the surveyed area a that are detected. The abundance of individuals, N, is thus given as N = A * E(s) * D, where A is the size of the study area, and E(s) is the expected or mean cluster size.
We estimated Pa by fitting a detection function to the data grouped into distance bands. Half-normal, uniform and hazard rate were considered as candidates for the key functions with either a simple or a Hermite polynomial or a cosine series expansion. The most likely model was gen-erally selected on the basis of Akaike Information Criterion (AIC), but goodness-of-fit chi-square test and visual inspection of the fit were also employed. There is often a tendency for small flocks to be missed at large distances, resulting in a positive bias in mean cluster size and an inflated abundance estimate. In case of a significant regression of log(cluster size) against detection probability (α = 0.05), we therefore used an expected cluster size at distance 0 based on the regression instead of merely the mean cluster size.
To gain insight into spatial patterning within the study area, and to re-duce the variance of the estimates, the study area was post-stratified into 17 geographic regions based on effort, ice cover and bathymetry. Most of the species were analysed according to this framework, and in these cases the global estimate was worked out by pooling the regional esti-mates. In order to obtain reliable abundance estimates within the re-gions, spatial patterning of flock size was carefully addressed before-hand. As abundance within a region is derived simply by multiplying the size of the region, the global mean (or expected) cluster size, and the estimated density of clusters within the region, a region with very large flocks may come out with a lower abundance estimate than a region of comparable size with only small flocks, if the encounter rate in the latter is just a little higher. For species with pronounced spatial patterning with regard to flock size, the data were thus stratified with regard to both geographic regions and flock size, if warranted by the sample size.
Using conventional distance sampling methods, the only way to increase the spatial resolution of the result is to increase the level of geographic

21
stratification. However, as stratification mandates that effort is exerted in each stratum, there is a limit to the level of spatial resolution that can be achieved in this way. Besides estimating abundance, uncovering spatial patterns in the distribution of seabirds and marine mammals was a key aim of the project. It was therefore decided to combine the conventional distance sampling analyses with a density surface modelling approach. Density surface modelling allows a high degree of spatial resolution, the maintenance of an abundance estimate which takes into account imper-fect detection as in conventional distance sampling, and the underpin-ning of the spatial patterns by explanatory variables (Hedley et al. 1999; Hedley & Buckland 2004; Hedley et al. 2004). We used a beta release of the software Distance (Thomas et al. 2006b), where density surface mod-elling is implemented as an analysis engine1.
In preparation of the data for density surface modelling, the line tran-sects were divided into 3 x 3 km squares, and within each square the number of sightings of the different species in question was determined. Further, x- and y-coordinates, depth, sea bottom slope and distance to coast were determined for each square using GIS software.
The first stage of the modelling process proceeds as conventional dis-tance sampling, where Pa is estimated on the basis of a detection function fitted to the grouped distance data. We used half-normal and hazard rate as key functions without series expansion. Problems with positive bias in cluster size were resolved by including cluster size as a covariate affect-ing the scale of the key function, and in many cases the model fit (AIC) was also improved by incorporating observer identity as a covariate.
Based on Pa, the number of groups within each square is estimated, and this forms the response variable in the second stage of the modelling process. We used Generalized Additive Models (GAM) with x, y, depth, sea bottom slope and distance to coast as possible predictor variables, and selected models on the basis of Generalized Cross Validation scores (GCV). In some cases, the maximum number of knots in the smoothing terms was reduced due to over-fitting, resulting in the selection of a model with slightly higher GCV-scores than the same model with the de-fault number of knots.
Finally the GAM models were used to make predictions over a grid of 3 x 3 km cells, populated with the explanatory variables and covering the study area. Most models performed poorly outside the range of observed data, and for this reason the prediction grid covers a somewhat smaller area than the regions used in the conventional distance sampling. Vari-ance was estimated by performing 999 bootstrap replicates, and the re-ported confidence intervals include both the uncertainty associated with the GAM model and the fitting of the detection function.
1 We wish to sincerely thank Eric Rexstad, Centre for Research into Ecological and Environmental Modelling, University of St. Andrews, for patiently answering questions with regard to density surface modelling, and for continu-ously and rapidly fixing software problems encountered in Distance.
22
2.6.3 Analyses of factors affecting zooplankton and seabird distribution
As described above (section 2.1), data were collected on different scales. Physical and biological oceanographic data were collected at 116 sta-tions, spaced approximately 10 km apart. In contrast, seabirds were counted along continuous transects between stations, and observations were summarised into 2-minute intervals. For each of these intervals, ice concentration was also noted. In order to examine factors affecting sea-bird distribution, we assigned each 2-minute interval to the nearest sta-tion, but only used intervals which were located less than 6 km from a station and sampled on the same day. A total of 2320 intervals were in-cluded; 3 of the 116 stations had no associated bird count intervals, and for the remaining stations the number of intervals ranged from 4 to 53 (mean 20).
Biomass of each zooplankton taxon or developmental stage was esti-mated as the product of mean individual biomass and the counted num-ber of individuals in the sample, and scaled to the unit mg C m-2 in the top 50 m of the water column. Total zooplankton biomass was then esti-mated as the sum of all groups. A few taxa were not included in the es-timate of total biomass, either because they had not been measured or because length-weight regressions could not be found. However, expert opinion suggests that the groups included are likely to account for 95-98% of true total mesozooplankton biomass. Larger and more mobile forms are more likely to have escaped the sampling gear and are thus not included in the biomass estimates. No forms larger than 10 mm were regularly caught, although a few individual euphausiids, amphipods and chaetognaths of this size did occur.
The frequency distributions of plankton biomass estimates were highly right-skewed, i.e. dominated by many small values and a few very large values. Analyses of factors affecting the spatial distribution of the most important taxa (Calanus copepods, shrimp larvae and barnacle nauplii, see Results) were therefore performed on ln-transformed data. Calanus copepods occurred at all stations, and barnacle nauplii were only absent at one station (87). In contrast, shrimp larvae were absent at 49 of the 116 stations. The analysis was therefore carried out both for the 67 stations with shrimp larvae and for all stations, in the latter case using an ln(x+1) transformation. The following predictors were used in the models: Simp-son index, depth, integrated chlorophyll concentration and mean ice concentration for all 2-minute intervals associated with the station. Inte-grated chlorophyll was only available for 86 of the 116 stations, so all analyses were performed both with and without this predictor. Standard multiple regression was used, with all possible models being fitted, ex-cluding interactions. Model ‘quality’ was assessed with Akaike’s Infor-mation Criterion corrected for sample size (AICc; Burnham & Anderson 2002), and the importance of each predictor was assessed as evidence ra-tios, i.e. the ratio of the summed Akaike weights (Burnham & Anderson 2002) of all models including the predictor to the summed weight of all models not including it. Evidence ratios > 10 indicate moderate to strong support for the predictor.
Seabird data from the ship-based survey were used to identify factors af-fecting spatial distribution, as these data were collected simultaneously with potential explanatory oceanographic variables. Four seabird species
23
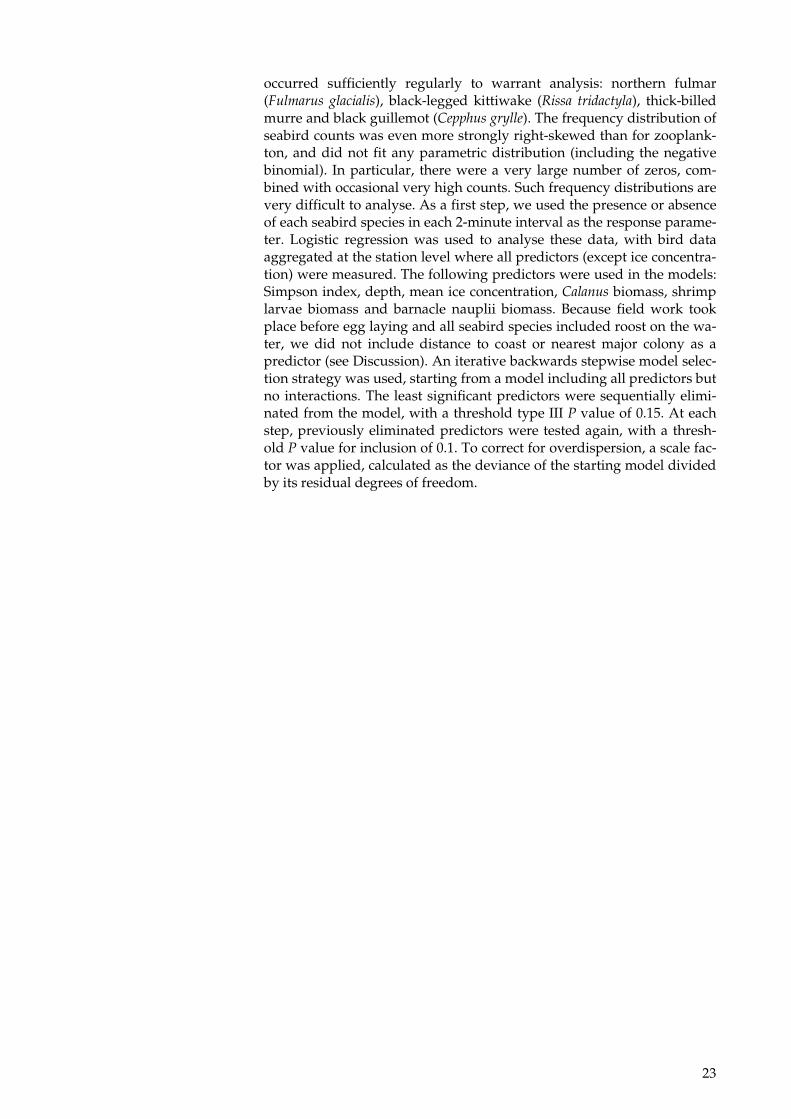
occurred sufficiently regularly to warrant analysis: northern fulmar (Fulmarus glacialis), black-legged kittiwake (Rissa tridactyla), thick-billed murre and black guillemot (Cepphus grylle). The frequency distribution of seabird counts was even more strongly right-skewed than for zooplank-ton, and did not fit any parametric distribution (including the negative binomial). In particular, there were a very large number of zeros, com-bined with occasional very high counts. Such frequency distributions are very difficult to analyse. As a first step, we used the presence or absence of each seabird species in each 2-minute interval as the response parame-ter. Logistic regression was used to analyse these data, with bird data aggregated at the station level where all predictors (except ice concentra-tion) were measured. The following predictors were used in the models: Simpson index, depth, mean ice concentration, Calanus biomass, shrimp larvae biomass and barnacle nauplii biomass. Because field work took place before egg laying and all seabird species included roost on the wa-ter, we did not include distance to coast or nearest major colony as a predictor (see Discussion). An iterative backwards stepwise model selec-tion strategy was used, starting from a model including all predictors but no interactions. The least significant predictors were sequentially elimi-nated from the model, with a threshold type III P value of 0.15. At each step, previously eliminated predictors were tested again, with a thresh-old P value for inclusion of 0.1. To correct for overdispersion, a scale fac-tor was applied, calculated as the deviance of the starting model divided by its residual degrees of freedom.
24
3 Results
3.1 Physical oceanography
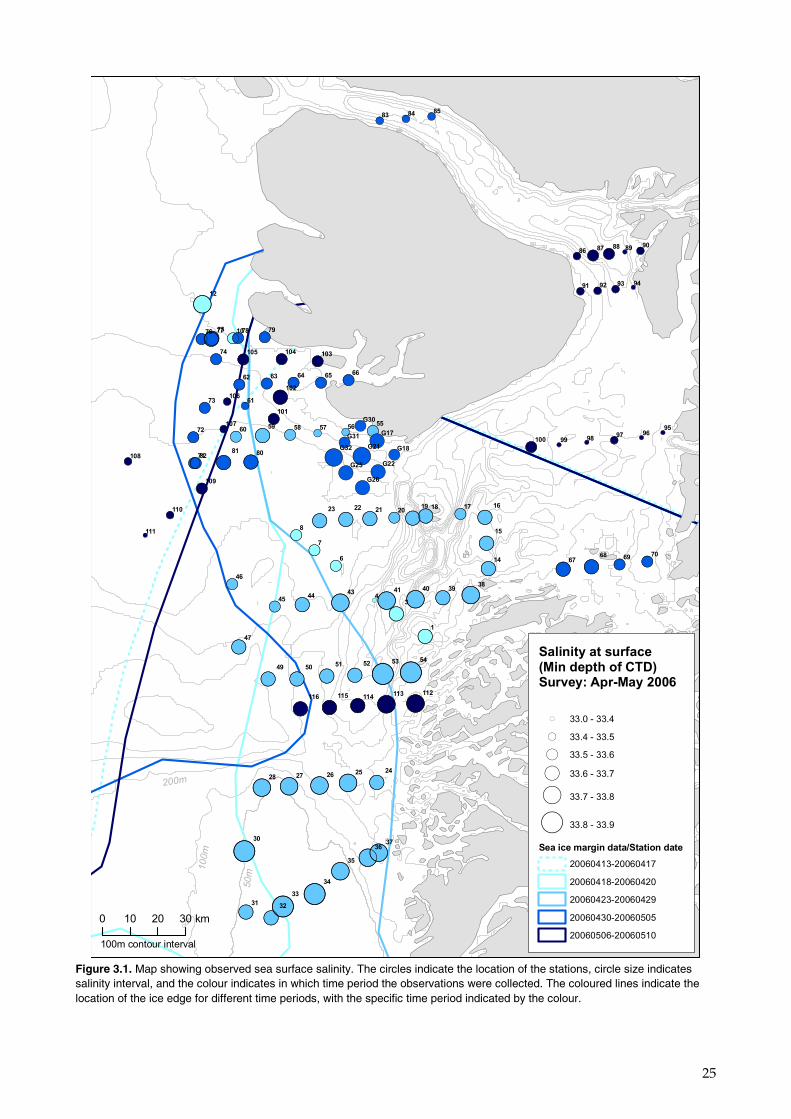
Relatively low values of sea surface salinity were observed in Disko Bay, and at the westernmost stations within the marginal ice zone, e.g. sta-tions 91-99, and stations 108-111 (Figure 3.1). In south-eastern Baffin Bay there was a general tendency for a decrease in sea surface salinity with increasing latitude and time. The sea surface salinity was typically 33.7 at the northern part of Store Hellefiskebanke (stations 24-28), and 33.5 along the east-west transects west of Disko Island (stations 55-60, sta-tions 62-66, and stations 75-79). An estimate of the decrease in sea surface salinity with time can be found by comparing two neighbouring tran-sects, e.g. stations 49-54 with stations 112-116. These two transects show that sea surface salinity decreased about 0.3 salinity units over six days (from April 28 to May 4). Mixed layer depth observed within the region ranged between 5 and 150 m (Figure 3.2). Mixed layer depth at stations in south-eastern Baffin Bay mostly ranged from 25-50 m, and was below 25 m in Disko Bay. As for the sea surface salinity, it seems that mixed layer depth also decreased with time. Söderkvist et al. (2006) showed that upwelling of warmer and more saline waters from below during late winter and spring 1997 and 2005 was the main driving mechanism for decreases in sea surface salinity and mixed layer depth. Melting of sea ice and solar heating are two other possible mechanisms for changes in hydrography during spring. Detailed studies of individual vertical pro-files of temperature and salinity are needed to identify the driving mechanism for changes in sea surface salinity and mixed layer depth.
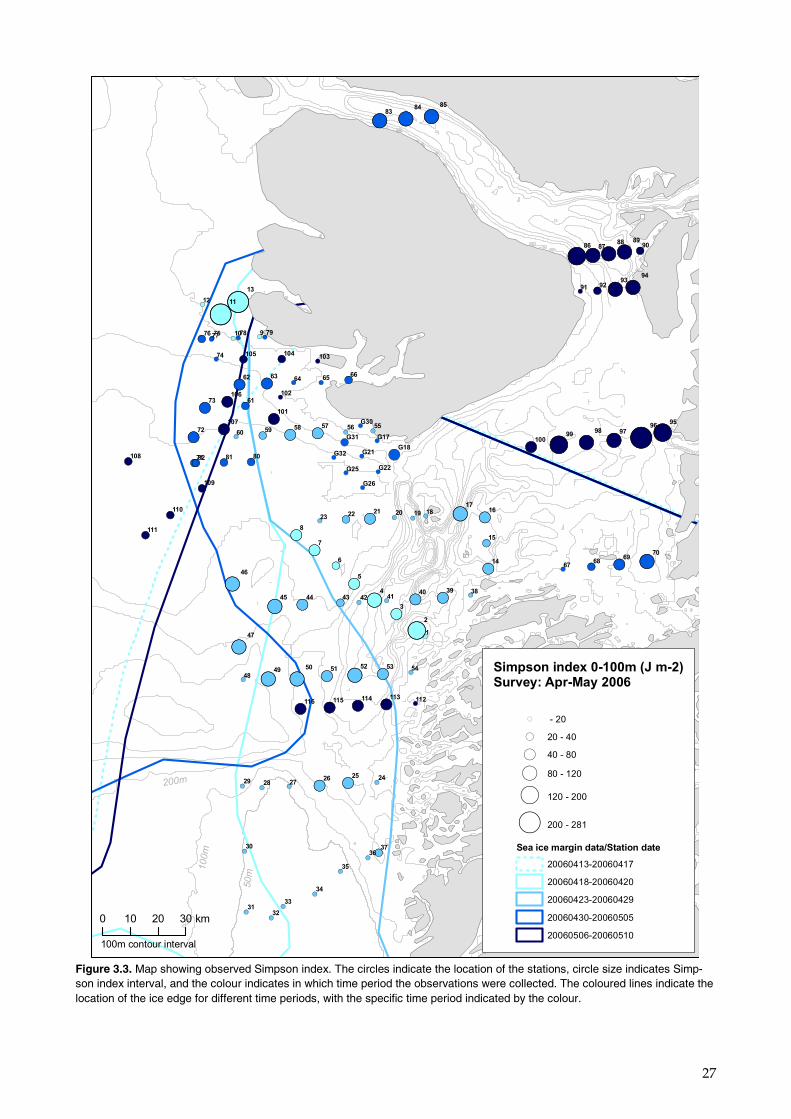
The highest values of the Simpson index, and thus the most stratified ar-eas, were found in Disko Bay and at the northernmost stations west of Disko Island (Figure 3.3). Low values of the Simpson index were ob-served at Store Hellefiskebanke, west of Disko Island, and at the en-trance of Disko Bay. However, since Store Hellefiskebanke is relatively shallow, plankton remained in the photic zone despite the well-mixed water column indicated by a low Simpson index.
Vertical profiles of density (measured as sigma-theta which is the density [kg m-3] – 1000) along an east-west transect south of Disko Bay entrance on April 27 showed some horizontal variation in surface density, while the density at 100 m depth was about 1027.2 kg m-3 at all stations along the transect (Figure 3.4). The strength of the vertical stratification and mixed layer depth affects the concentration of chlorophyll (see below). Along a transect sampled on May 10 approximately 50 km further south, the density in the surface layer and at 100 m depth were similar to the earlier transect (compare panels a and c in Figure 3.4). It seems that hori-zontal variability in density in this region is larger than temporal changes over this two-week period.
25
!(
!(!(
!(!(
!(
!(
!(
!(
!(
!(!(!(!(!(!(!(!(
!(!(!(!(!(
!(
!( !(!(!(
!(!(!(
!(!(!(!(!(!(!(
!(
!(
!( !( !( !( !( !(
!(!(!(!(!(!(
!(
!( !( !( !( !(
!( !( !( !(
!(
!(
!(
!(
!(!(!( !( !(
!(!(!(
!( !( !(
!( !( !( !( !(
!( !( !( !(
!(!(!(!(!(!(
!(
!(
!(!(!(
!(
!(
!(
!(
!(
!(
!(!(!(!(!(
(
(
( (
((
((
(
((
(
(
(
(
(
( (
(
((
(
( (
(
(
(
( (
(
((
(
(
(
((
(
(
(
(
(
(
(
(
(
(
(
(
(
(
(
(
(
(
(
(
(
(
(
(
(
(
((
(
(
(
(
((
( (
(
(
((
(((
(
(
(
(
(
( (
(( (
(
(
(
( (
(
((
(
(
(
(
((
(
(
((
!( !(
!(!( !(
!(!(
!(
!(
8
7
6
43
1
99 9897 96
95
94939291
9089888786
858483
8281 80
79787776
74
73
72
70696867
6665646362
61
60 59 58 57 5655
545352515049
47
46
4544
43 41 40 3938
3736
35
34
33
3231
30
28 27 26 25 24
23 22 21 2019 18 17 16
15
14
12
116 115 114113 112
111
110
109
108
107
106
105 104 103
102
101
100
G32
G31
G30
G26
G25 G22
G21 G18
G17
75
71
10
0 10 20 30 km
Salinity at surface(Min depth of CTD)Survey: Apr-May 2006
( 33.0 - 33.4
( 33.4 - 33.5
( 33.5 - 33.6
( 33.6 - 33.7
( 33.7 - 33.8
( 33.8 - 33.9
Sea ice margin data/Station date
20060413-20060417
20060418-20060420
20060423-20060429
20060430-20060505
20060506-20060510
50m
100m
200m
100m contour interval
Figure 3.1. Map showing observed sea surface salinity. The circles indicate the location of the stations, circle size indicates salinity interval, and the colour indicates in which time period the observations were collected. The coloured lines indicate the location of the ice edge for different time periods, with the specific time period indicated by the colour.

26
!(!(
!(
!(!(
!(
!(
!(
!(
!(!(!(!(!(!(!(!(
!(!(!(!(!(
!(
!( !(!(
!(
!(
!(!(
!(!(!(!(!(!(
!(
!(
!( !( !( !( !( !(
!(!(!(!(!(!(
!(
!( !( !( !( !(
!( !( !( !(
!(
!(
!(
!(!(!(!( !( !(
!(!(!(
!( !( !(
!( !( !( !( !(
!( !( !( !(
!(!(!(!(!(!(
!(
!(
!(!(!(
!(
!(
!(
!(
!(
!(
!(!(!(!(!(
(
(
(
(
((
(
(
(
(
(
((
(
((
(
(
(
( ( (
(
(
(
(
(
(
(
((
((((
((
(
((
(
(
(
(
(
(
(
(
(
(
( (
(
(
(
(
(
(
(
(
(
(
(
(
( (
(
(
(
(
(
(
(
( (
(
(
(
(
(
(
((
(
(
(
(
(
((
(
(
(
(
(
(
(
(
(
(((
(
(
((
!(
!(!(
!(
!(
!(
!(
!(
!(
8
7
6
5
43
99 98 97 9695
94939291
9089888786
858483
8281 80
79787776
74
73
72
70696867
6665646362
61
6059 58
57 5655
545352515049
47
46
4544 43 41 40
39
37
36
35
34
33
3231
30
28 27 26 25 24
2322 21 20 19 18 17
16
15
14
116 115114 113
112
111
110
109
108
107
106
105 104103
102
101
100
G32
G31
G30
G26
G25 G22
G21 G18
G17
75
71
10
0 10 20 30 km
Mixed layer Depth (m)Survey: Apr-May 2006
( 5 - 10
( 10 - 25
( 25 - 50
( 50 - 75
( 75 - 100
( 100 - 150
Sea ice margin data/Station date
20060413-20060417
20060418-20060420
20060423-20060429
20060430-20060505
20060506-20060510
50m
100m
200m
100m contour interval
Figure 3.2. Map showing observed mixed layer depth. The circles indicate the location of the stations, circle size indicates mixed layer interval, and the colour indicates in which time period the observations were collected. The coloured lines indicate the location of the ice edge for different time periods, with the specific time period indicated by the colour.
27
!(!(!(
!(!(
!(
!(!(
!(!(
!(!( !(
!(
!(
!(!(!(!(!(!(!(!(
!(!(!(!(!(!(
!(
!(!(
!(
!(
!(
!(!(
!(!(!(!(!(!(!(!(
!(
!(
!( !( !( !( !( !( !(
!(!(!(!(!(!(
!(
!( !( !( !( !(
!( !( !( !(
!(
!(
!(
!(
!(!( !( !( !(
!(!(!(
!( !( !(
!(!(!(!( !(
!( !( !(!(
!(!(!(!(!(!(
!(
!(
!(!(!(
!(
!(
!(
!(
!(
!(
!(!(!(!(!(
(
((
(
(
(
(
(
(
(
(
(
(
(
(
(
(
((
(
(
(
(
(
(
(
(
(
(
(
((
(
(
(
(
(
( (
(
(
(
(
((
(
(
(
(
( (( (
(
(
((
(
(
(
(
(
(
(
(
(
(
(
(
(
(
(
(
(
(
(
(
(
(
(
(
(
(
(
(
((
(
(
(
(
(
(
(
( (
(
(
(
(
(
(
(
(
(
(
(
(
(
(
(
(
(
(
(
(
!(!(
!(
!(
!(
!(
!(
!(
!(
9
8
7
6
5
4
3
2
1
9998 97
9695
9493
9291
908988
8786
858483
82 81 80
79787776
74
73
72
7069
6867
6665646362
61
60 59 58 57 56 55
54535251504948
47
46
45 44 43 42 4140 39 38
3736
35
34
33
3231
30
29 28 2726 25 24
23 22 21 20 19 1817
16
15
14
13
12 11
116 115 114 113 112
111
110
109
108
107
106
105 104103
102
101
100
G32
G31
G30
G26
G25 G22
G21G18
G17
75
71
10
0 10 20 30 km
Simpson index 0-100m (J m-2)Survey: Apr-May 2006
( - 20
( 20 - 40
( 40 - 80
( 80 - 120
( 120 - 200
( 200 - 281
Sea ice margin data/Station date
20060413-20060417
20060418-20060420
20060423-20060429
20060430-20060505
20060506-20060510
50m
100m
200m
100m contour interval
Figure 3.3. Map showing observed Simpson index. The circles indicate the location of the stations, circle size indicates Simp-son index interval, and the colour indicates in which time period the observations were collected. The coloured lines indicate the location of the ice edge for different time periods, with the specific time period indicated by the colour.

28
Time series of vertical stratification at the permanent station S of Disko (69°15’N, 53°33’W) showed that during the period April 22 - May 3 there was an upwelling of dense (more saline) water from below 80 m up to about 20 m depth (Figure 3.5). After May 3, the dense water descended to greater depths. The density of the surface layer decreased, due to both decreased salinity and increased temperature. The change in surface hy-drography suggests that solar heating was strong enough in early May to melt sufficient amounts of sea ice to change the vertical stratification, and in turn inhibit vertical mixing.
Figure 3.4. Vertical profiles of sigma-theta (density [kg m-3] – 1000) and fluorescence along two east-west transects south-west of the mouth of Disko Bay. The station number is shown in each figure, see Figure 3.1 for the location of each station. Pan-els a) and c) show the vertical variation of sigma-theta, and figures b) and d) show the verti-cal variation of fluorescence.

29
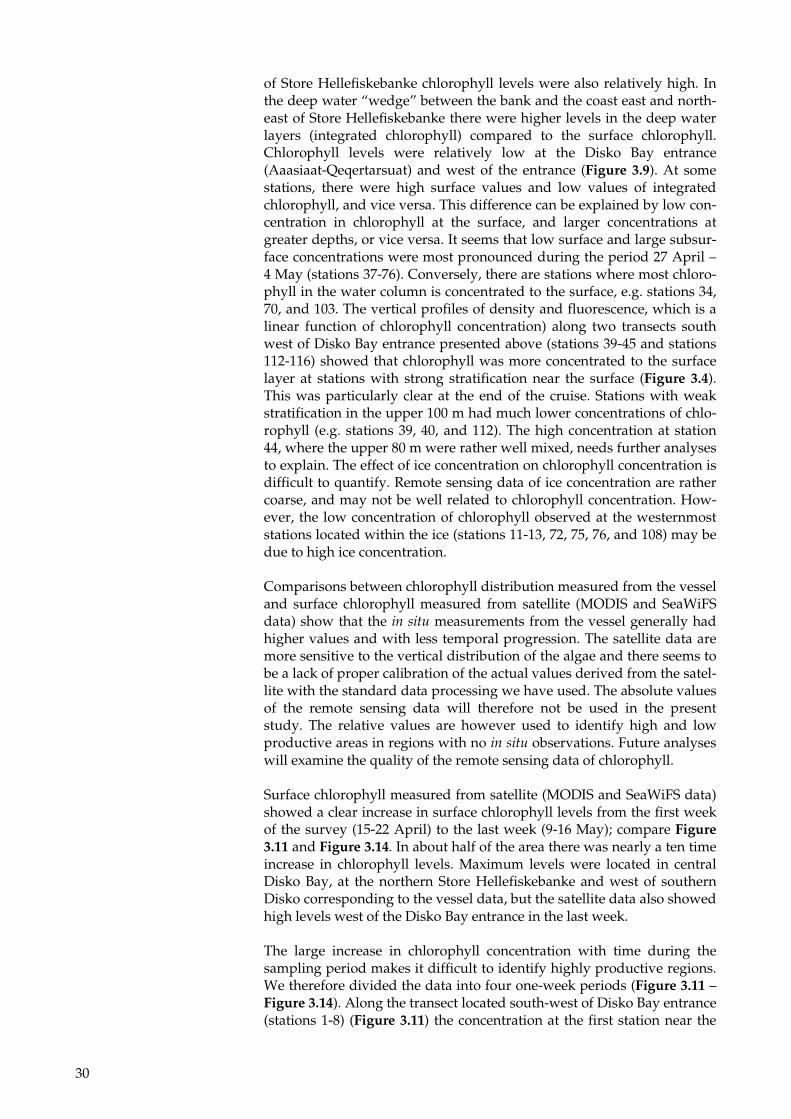
Nitrate (NO3-), phosphate (PO43-) and silicate (SiO43-) are three main nu-trients for the primary producers. During the initiation of the plankton bloom the nutrients are rapidly consumed by the primary producers, and concentrations decrease in the surface layer. At the beginning of the expedition (19 April – 28 April), nitrogen available to the primary pro-ducers (mainly NO3- and NH3+) southwest of Disko Bay entrance (sta-tions 2-54) was typically 7-9 μmol l-1 (Figure 3.6). For the same period, the concentration was below 4 μmol l-1 at most stations at Store Helle-fiskebanke, and above 9 μmol l-1 west of Disko Island. During the follow-ing two days the sum of nitrate and ammonium west of Disko Island de-creased from above 9 to about 6 μmol l-1, and to below 4 μmol l-1 in early May. In Disko Bay the sum of nitrate and ammonium was below 4 μmol l-1 at most stations. The concentration of phosphate showed a similar horizontal pattern as the sum of nitrogen and ammonium (Figure 3.7). Silicate (SiO43-) is another important nutrient that some primary produc-ers use. Thus horizontal and temporal variability of silicate may give an estimate of the relative importance of specific species. The variability of silicate was much lower than for nitrogen and phosphate (Figure 3.8). Low values were found at Store Hellefiskebanke. High values were found in the marginal ice zone around mid-May.
3.2 Phytoplankton biomass (chlorophyll)
Surface concentrations of chlorophyll were measured at stations indi-cated with circles on Figure 3.9, and from satellites. We use these two types of information to identify highly productive regions. For reference, the winter concentrations in the region are typically 0.05 mg m-3, and 2 mg m-3 during the early stage of plankton bloom.
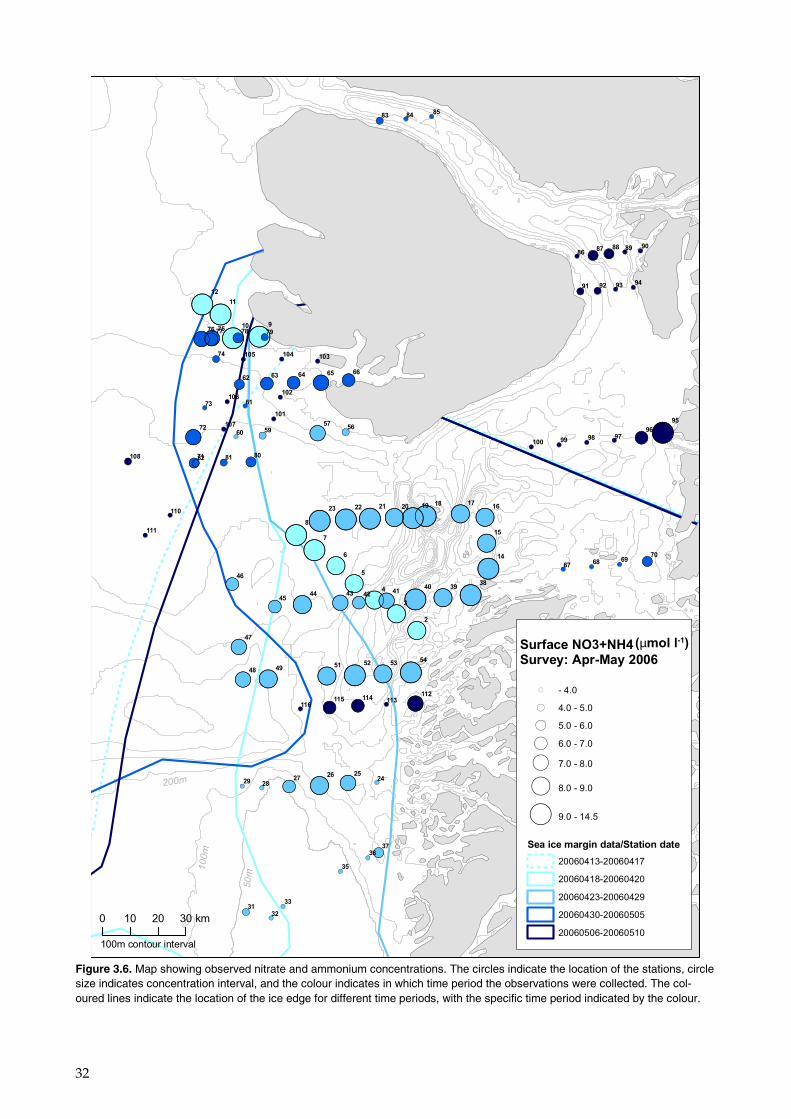
The overall distribution of chlorophyll during the sampling period was that in situ surface chlorophyll (1 m) as well as integrated chlorophyll (from surface to max sampling depth) showed relatively high levels in central and southern part of Disko Bay as well as west of southern Disko (west of Disko Fjord), (Figure 3.9 and Figure 3.10). On the northern part
Figure 3.5. Time series of sigma-theta (density [kg m-3] – 1000) and chlorophyll at the permanent station Qeqertarsuaq (69°15’N, 53°33’W) for the period April 22 – May 17. Black lines show sigma-theta, and the green colour scale shows the concentration of chlo-rophyll.
30
of Store Hellefiskebanke chlorophyll levels were also relatively high. In the deep water “wedge” between the bank and the coast east and north-east of Store Hellefiskebanke there were higher levels in the deep water layers (integrated chlorophyll) compared to the surface chlorophyll. Chlorophyll levels were relatively low at the Disko Bay entrance (Aaasiaat-Qeqertarsuat) and west of the entrance (Figure 3.9). At some stations, there were high surface values and low values of integrated chlorophyll, and vice versa. This difference can be explained by low con-centration in chlorophyll at the surface, and larger concentrations at greater depths, or vice versa. It seems that low surface and large subsur-face concentrations were most pronounced during the period 27 April – 4 May (stations 37-76). Conversely, there are stations where most chloro-phyll in the water column is concentrated to the surface, e.g. stations 34, 70, and 103. The vertical profiles of density and fluorescence, which is a linear function of chlorophyll concentration) along two transects south west of Disko Bay entrance presented above (stations 39-45 and stations 112-116) showed that chlorophyll was more concentrated to the surface layer at stations with strong stratification near the surface (Figure 3.4). This was particularly clear at the end of the cruise. Stations with weak stratification in the upper 100 m had much lower concentrations of chlo-rophyll (e.g. stations 39, 40, and 112). The high concentration at station 44, where the upper 80 m were rather well mixed, needs further analyses to explain. The effect of ice concentration on chlorophyll concentration is difficult to quantify. Remote sensing data of ice concentration are rather coarse, and may not be well related to chlorophyll concentration. How-ever, the low concentration of chlorophyll observed at the westernmost stations located within the ice (stations 11-13, 72, 75, 76, and 108) may be due to high ice concentration.
Comparisons between chlorophyll distribution measured from the vessel and surface chlorophyll measured from satellite (MODIS and SeaWiFS data) show that the in situ measurements from the vessel generally had higher values and with less temporal progression. The satellite data are more sensitive to the vertical distribution of the algae and there seems to be a lack of proper calibration of the actual values derived from the satel-lite with the standard data processing we have used. The absolute values of the remote sensing data will therefore not be used in the present study. The relative values are however used to identify high and low productive areas in regions with no in situ observations. Future analyses will examine the quality of the remote sensing data of chlorophyll.
Surface chlorophyll measured from satellite (MODIS and SeaWiFS data) showed a clear increase in surface chlorophyll levels from the first week of the survey (15-22 April) to the last week (9-16 May); compare Figure 3.11 and Figure 3.14. In about half of the area there was nearly a ten time increase in chlorophyll levels. Maximum levels were located in central Disko Bay, at the northern Store Hellefiskebanke and west of southern Disko corresponding to the vessel data, but the satellite data also showed high levels west of the Disko Bay entrance in the last week.
The large increase in chlorophyll concentration with time during the sampling period makes it difficult to identify highly productive regions. We therefore divided the data into four one-week periods (Figure 3.11 – Figure 3.14). Along the transect located south-west of Disko Bay entrance (stations 1-8) (Figure 3.11) the concentration at the first station near the

31
coast was just below 2 mg m-3 (sampled 18 April), and between 2 and 5.2 mg m-3 at stations 2-9 (sampled 19 April). Thus it seems that the primary production was in the early stage of a plankton bloom in this region. The 8 day mean value of the remote sensing data of surface chlorophyll (mg m-3) for the period 15 – 22 April showed relatively high values of chloro-phyll at Store Hellefiskebanke and lower concentration in Disko Bay and westwards towards the ice edge. Some local areas with high chlorophyll concentration were also observed at Disko Bay entrance and central Disko Bay. The areas with relative large concentration of chlorophyll in-dicate that the plankton bloom had already started before 15 April, or was just about to start. For the period 23 – 30 April the in situ chlorophyll concentration were above 2 mg m-3 at almost all stations (Figure 3.12). At Store Hellefiskebanke the surface chlorophyll concentration was typi-cally 10-25 mg m-3. North of Store Hellefiskebanke, west of Disko Bay and west of Disko Island the concentration ranged between 1.5 and 13.3 mg m-3, with the highest values west of Disko Island within the marginal ice zone. The remote sensing concentration of chlorophyll was largest at Store Hellefiskebanke and the central part of Disko Bay. During the pe-riod 1 – 8 May the in situ chlorophyll concentration was typically 10-20 mg m-3 west of Disko Island and in the eastern part of Disko Bay (Figure 3.13). The highest remote sensing values were observed in Store Helle-fiskebanke and central Disko Bay. During the period 9 – 16 May the in situ observations at the ice edge west of Disko Bay were typically 15-20 mg m-3, and around 2 mg m-3 to the west (Figure 3.14), where the ice concentration was higher (not shown). The observed concentration of chlorophyll northwest of Store Hellefiskebanke varied between 1.6 and 10 mg m-3. The chlorophyll concentrations using remote sensing data for this period were high at the Store Hellefiskebanke, central part of Disko Bay and outside Disko Bay. Low values were observed south-west of Disko Bay, west of Disko Island, and in the northern channel connecting the eastern part of Disko Bay with Baffin Bay (the Vaigat).
3.3 Zooplankton
3.3.1 Distribution, composition and total biomass
The mesozooplankton (i.e. the zooplankton organisms > 200 µm) in the upper 50 m of the study area was dominated by large calanoid cope-pods. In biomass terms, the three Calanus species were the most impor-tant contributors to the surface copepod community and between them accounted for on average 64% of total mesozooplankton biomass (C. fin-marchicus 42%, C. hyperboreus 15%, C. glacialis 4%). Calanus copepods mi-grate from deep overwintering zones offshore to the surface layer prior to the spring phytoplankton bloom, so that they can spawn, graze and refuel their lipid stores during the peak of the spring bloom. Biomass es-timates of the three Calanus species were highly correlated among sta-tions (all r > 0.64, all P < 0.0001), and therefore we only present total Ca-lanus biomass here. Calanus biomass was notably low around Store Hellefiskebanke, but otherwise high in most areas (Figure 3.15). The only other important contributors to total mesozooplankton biomass were zoea larvae of deep-water shrimp (Pandalus borealis) (12%) (Figure 3.16), and barnacle nauplii (16%) (Figure 3.17).
32
!(!(
!(!(
!(!(
!(
!(!(!(!(
!(!(!(!(!(!(!(!(!(!(
!(!(!(!(!(!(
!(!(
!(
!(
!( !(
!(!(!(!(!(!(!(!(
!(
!(
!( !( !( !( !( !(
!(!(!(!(
!(
!( !( !( !( !(
!( !( !( !(
!(
!(
!(
!(
!(!(!( !( !(
!(!(!(
!( !( !(
!( !( !( !( !(
!( !( !( !(
!(!(!(!(!(!(
!(
!(
!(!(!(
!(
!(
!(
!(
!(
!(!(!(!(!(
(
(
((
(
(
((
((
(
(
((
(
(
((
(
(
(
(
(
(
((
(
(
(
(
(( (
(
(
(
(
( (
(
(
(
((
(
(
(
(
(
(
(
(
(
((
(
(
(
(
(
(
(
(
(
(
(
((
(
( (
(
(
(
(
(
(
(
(
(
(
(
(
(
(
(
(
(
(
(
(
(
(
(
(
(
(
(
(
(
(
(
(
((
(
(
(
9
8
7
6
5
4
3
2
99 98 9796
95
94939291
9089888786
858483
82 81 80
79787776
74
73
72
70696867
6665646362
61
60 5957 56
545352514948
47
46
45 44 43 42 41 40 39 38
3736
35
33
3231
29 2827 26 25
24
23 22 21 20 19 18 17 16
15
14
1211
116115 114 113
112
111
110
108
107
106
105 104 103
102
101
100
75
71
10
0 10 20 30 km
( - 4.0
( 4.0 - 5.0
( 5.0 - 6.0
( 6.0 - 7.0
( 7.0 - 8.0
( 8.0 - 9.0
( 9.0 - 14.5
Sea ice margin data/Station date20060413-20060417
20060418-20060420
20060423-20060429
20060430-20060505
20060506-20060510
50m
100m
200m
100m contour interval
Surface NO3+NH4Survey: Apr-May 2006
(μmol l-1)
Figure 3.6. Map showing observed nitrate and ammonium concentrations. The circles indicate the location of the stations, circle size indicates concentration interval, and the colour indicates in which time period the observations were collected. The col-oured lines indicate the location of the ice edge for different time periods, with the specific time period indicated by the colour.

33
!(
!(
!(
!(!(
!(!(
!(!(
!(!(
!(
!(
!(!(!(!(!(!(!(!(
!(!(!(!(!(!(
!(!(
!(
!(
!(!(
!(!(!(!(!(!(!(!(
!(
!(
!( !( !( !( !( !(
!(!(!(!(
!(
!( !( !( !( !(
!( !( !(!(
!(
!(
!(
!(
!(!(!( !( !(
!(!(!(
!( !( !(
!( !( !( !( !(
!( !( !( !(
!(!(!(!(!(!(
!(
!(
!(!(!(
!(
!(
!(
!(
!(
!(!(!(!(!(
(
(
( ( ((
(
((
(
(
(
(
(
(
(
(
((
(
(
(
((
(
(
((
(
(
(
(
(
(
(
(
(
(
(
( (
(
(
(
(
(
(
(
(
(
(
(
(
(
(
(
(
(
(
((
(
(
(
(
(
(
(
(
(
(
(
(
(
(
(
(
(
(
(
(
(
(
(
(
(
(
(
(
(
(
(
(
((
(
(
(
(
(
(
(
(
(
(
((
(
9
8
7
6
5
4
3
2
99 98 9796
95
94939291
9089888786
858483
82 81 80
787776
74
73
72
70696867
6665646362
61
60 59 57 56
545352514948
47
46
45 44 43 42 41 40 39 38
3736
35
3332
31
29 28 27 26 25 24
23 22 21 20 1918 17 16
15
14
1211
116 115 114 113112
111
110
108
107
106
105 104 103
102
101
100
7975
71
10
0 10 20 30 km
( - 0.50
( 0.50 - 0.60
( 0.60 - 0.70
( 0.70 - 0.80
( 0.80 - 0.90
( 0.90 - 1.00
( 1.00 - 1.15
Sea ice margin data/Station date20060413-20060417
20060418-20060420
20060423-20060429
20060430-20060505
20060506-20060510
50m
100m
200m
100m contour interval
Surface PO4Survey: Apr-May 2006
(μmol l-1)
Figure 3.7. Map showing observed phosphate concentrations. The circles indicate the location of the stations, circle size indi-cates concentration interval, and the colour indicates in which time period the observations were collected. The coloured lines indicate the location of the ice edge for different time periods, with the specific time period indicated by the colour.

34
!(!(
!(!(
!(!(
!(
!(!(
!(!(
!(
!(
!(!(!(!(!(!(!(!(
!(!(!(!(!(!(
!(!(
!(
!(
!(!(
!(!(!(!(!(!(!(!(
!(
!(
!( !( !( !( !( !(
!(!(!(!(
!(
!( !( !( !( !(
!( !( !( !(
!(
!(
!(
!(
!(!(!( !( !(
!(!(!(
!( !( !(
!(!(!( !( !(
!( !( !( !(
!(!(!(!(!(!(
!(
!(
!(!(!(
!(
!(
!(
!(
!(
!(!(!(!(!(
(
(
(
((
( (
((
(( (
(
(
(
(
(
(
(
(
( (
(
(
(
((
(
(
(
(
(
(
(
(
(
(
(
(
((
(
((
(
(
(
(
(
(
(
(
(
(
(
(
( (
(
(
(
(
(
(
(
(
(
(
(
(
(
(
(
(
(
(
(
(
(
(
(
(
(
(
(
((
(
(
(
(
(
( (
(
(
((
(
(
(
((
((
((
(
9
8
7
6
5
4
3
2
99 98 97 9695
94939291
9089888786
858483
82 81 80
787776
74
73
72
70696867
6665646362
61
60 59 57 56
545352514948
47
46
45 44 43 42 41 40 39 38
3736
35
3332
31
29 28 27 26 25 24
23 22 21 20 19 18 17 16
15
14
1211
116 115 114 113 112
111
110
108
107
106
105 104 103
102
101
100
7975
71
10
0 10 20 30 km
( - 2.0
( 2.0 - 4.0
( 4.0 - 6.0
( 6.0 - 8.0
( 8.0 - 10.0
( 10.0 - 20.0
( 20.0 - 32.0
Sea ice margin data/Station date20060413-20060417
20060418-20060420
20060423-20060429
20060430-20060505
20060506-20060510
50m
100m
200m
100m contour interval
Surface SiSurvey: Apr-May 2006
(μmol l-1)
Figure 3.8. Map showing observed silicate concentrations. The circles indicate the location of the stations, circle size indicates concentration interval, and the colour indicates in which time period the observations were collected. The coloured lines indicate the location of the ice edge for different time periods, with the specific time period indicated by the colour.
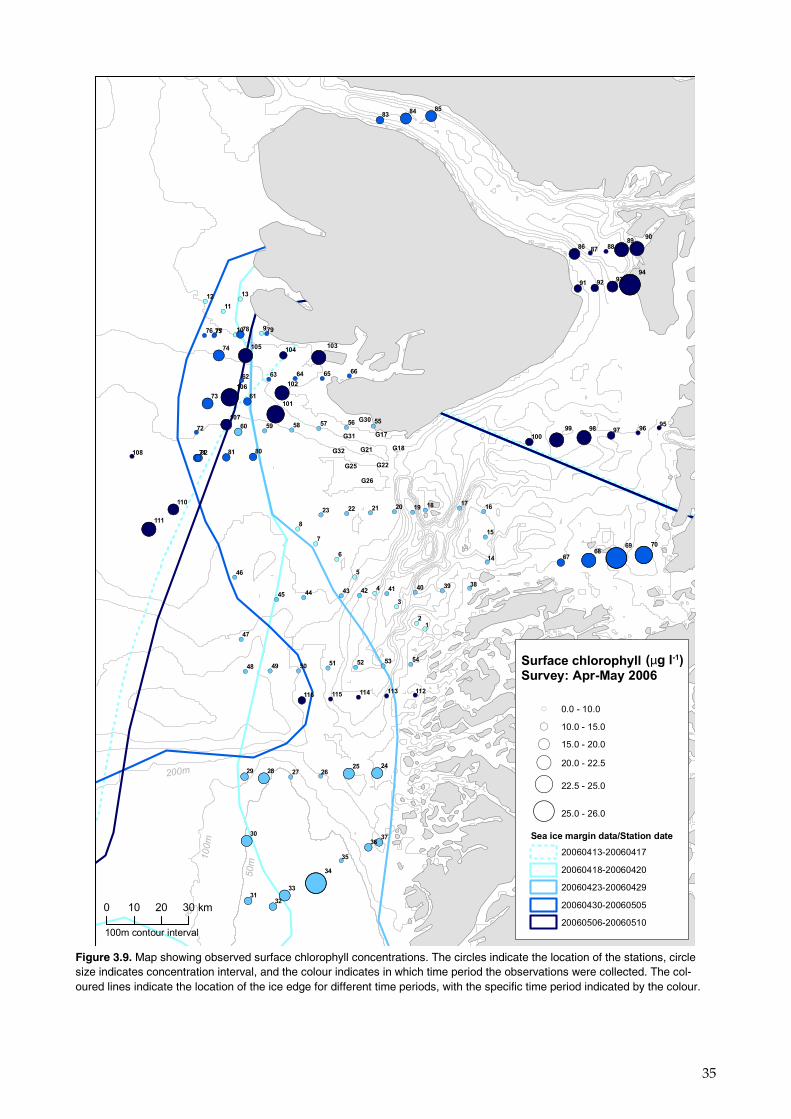
35
!(!(
!(
!(
!(
!(
!(
!(
!(!(
!(
!( !(
!(
!(
!(!(!(!(!(!(!(!(
!(!(!(!(!(!(
!(
!(!(!(!(
!(
!(!(
!(!(!(!(!(!(!(!(
!(
!(
!( !( !(!( !( !( !(
!(!(!(!(!(!(
!(
!( !( !( !(!(
!( !( !( !(
!(
!(
!(
!(
!(!( !( !( !(
!(!(!(
!( !( !(
!( !( !( !(!(
!( !( !(!(
!(!(!(!(!(!(
!(!(
!(!(!(
!(!(
!(
!(
!(
!(!(!(!(!(
(
(
(
(
((
(
(
((
(
(
(
(
(
(
(
(
(
(
((
(
(
(
(
(
(
(
(
(
(
(
(
(
(
(
(
(
(
((
(
(
(
(
(
(
(
(
(
((
(
(
(
(
(
(
(
(
( (
(
(
(
(
(
(
(
((
(
(
(
(
(
(
(
(
(
(
(
(
(
(
(
(
(
((
(
(
(
(
(
(
(
(
(
(
(
(
(
(
(
(
(
(
(
(
(
(
(
(
9
8
7
6
5
4
3
21
99 98 97 96 95
94939291
9089888786
858483
82 81 80
79787776
74
73
72
706968
67
6665646362
61
60 59 58 57 56 55
54535251504948
47
46
45 44 43 42 41 40 39 38
3736
35
34
33
3231
30
29 28 27 2625 24
23 22 21 20 19 18 17 16
15
14
131211
116 115 114 113 112
111
110
108
107
106
105 104 103
102
101
100
G32
G31
G30
G26
G25 G22
G21 G18
G17
75
71
10
0 10 20 30 km
( 0.0 - 10.0
( 10.0 - 15.0
( 15.0 - 20.0
( 20.0 - 22.5
( 22.5 - 25.0
( 25.0 - 26.0
Sea ice margin data/Station date20060413-20060417
20060418-20060420
20060423-20060429
20060430-20060505
20060506-20060510
50m
100m
200m
100m contour interval
Surface chlorophyllSurvey: Apr-May 2006
(μg l-1)
Figure 3.9. Map showing observed surface chlorophyll concentrations. The circles indicate the location of the stations, circle size indicates concentration interval, and the colour indicates in which time period the observations were collected. The col-oured lines indicate the location of the ice edge for different time periods, with the specific time period indicated by the colour.
36
!(
!(
!(
!(
!(!(!(!(!(!(!(!(
!(!(!(!(!(!(
!(
!(!(
!(!(
!(
!(!(
!(!(!(!(!(!(!(!(
!(
!(
!( !( !(!( !( !( !(
!(!(!(!(!(!(
!(
!( !( !( !( !(
!( !( !( !(
!(
!(!(!(
!( !( !(
!(!(!(!(!(!(
!(
!(!(!(
!(
!(
!(
!(!(
!(!(!(!(!(
(
(
(
(
(
(
((
(
(
(
(
((
(
(
(
(
(
(
(
(
(
(
(
(
(
(
(
(
(
(
((
(
(
(
(
(
(
(
(
(
(
(
( (
(
(
(
(
((
(
(
(
(
(
(
(
(
(
(
(
(
((
((
(
(
(
(
(
(
(
(
(
(
(
(
((
(
(
(
!(
!(
!(
!(
!(
!(
!(
!(
!(
9
8
5
99 98 97 9695
858483
7776
74
71
70696867
6665646362
61
60 59 58 57 56 55
54535251504948
47
46
45 44 43 42 41 40 39 38
37
36
35
34
33
3231
30
29 28 27 26
25 24
23 22 21 20 19 1817
16
15
116 115 114113 112
111
110
108
107
106
105 104103
101
100
G32
G31
G30
G26
G25 G22
G21 G18
G17
0 10 20 30 km
Int. chlorophyll (mg m-2)Survey: Apr-May 2006
( - 200
( 200 - 400
( 400 - 600
( 600 - 800
( 800 - 1000
( 1000 - 1230
Sea ice margin data/Station date
20060413-20060417
20060418-20060420
20060423-20060429
20060430-20060505
20060506-20060510
50m
100m
200m
100m contour interval
Figure 3.10. Map showing observed integrated chlorophyll concentrations. The circles indicate the location of the stations, circle size indicates concentration interval, and the colour indicates in which time period the observations were collected. The col-oured lines indicate the location of the ice edge for different time periods, with the specific time period indicated by the colour.

37
!(!(
!(
!(
!(
!(
!(
!(
!(!(
!(
!( !(
9/2.804
8/3.773
7/3.728
6/5.220
5/3.517
4/2.630
3/2.351
2/2.6191/1.644
13/2.87112/0.774
11/3.242
10/2.975
Surface chlorophyll (mg m-3)Measured and remote sensed values
Period: 20060415-20060422
0 20 40 Km
Measured Chl !( - 0.2!( 0.3 - 0.4!( 0.5 - 0.6!( 0.7 - 0.8!( 0.9 - 1.0!( 1.1 - 1.2!( 1.3 - 1.4!( 1.5 - 1.6!( 1.7 - 1.8!( 1.9 - 2.0!( 2.1 - 2.2!( 2.3 - 2.4!( 2.5 - 2.6!( 2.7 - 2.8!( 2.9 - 3.0!( 3.1 - 3.2!( 3.3 - 3.4!( 3.5 - 3.6!( 3.7 - 3.8!( 3.9 -
Remote sensed Chl - 0.20.3 - 0.40.5 - 0.60.7 - 0.80.9 - 1.01.1 - 1.21.3 - 1.41.5 - 1.61.7 - 1.81.9 - 2.02.1 - 2.22.3 - 2.42.5 - 2.62.7 - 2.82.9 - 3.03.1 - 3.23.3 - 3.43.5 - 3.63.7 - 3.83.9 -
Figure 3.11. Map showing surface concentration of chlorophyll (mg m-3) for the time period 15 – 22 April. The colour map shows the concentrations using remote sensing data. The coloured dots give the in situ concentration. The numbers right next to the coloured dot indicate the station number and the absolute value of the concentration. Note that the colour scale for remote sensing data and in situ observations is the same.
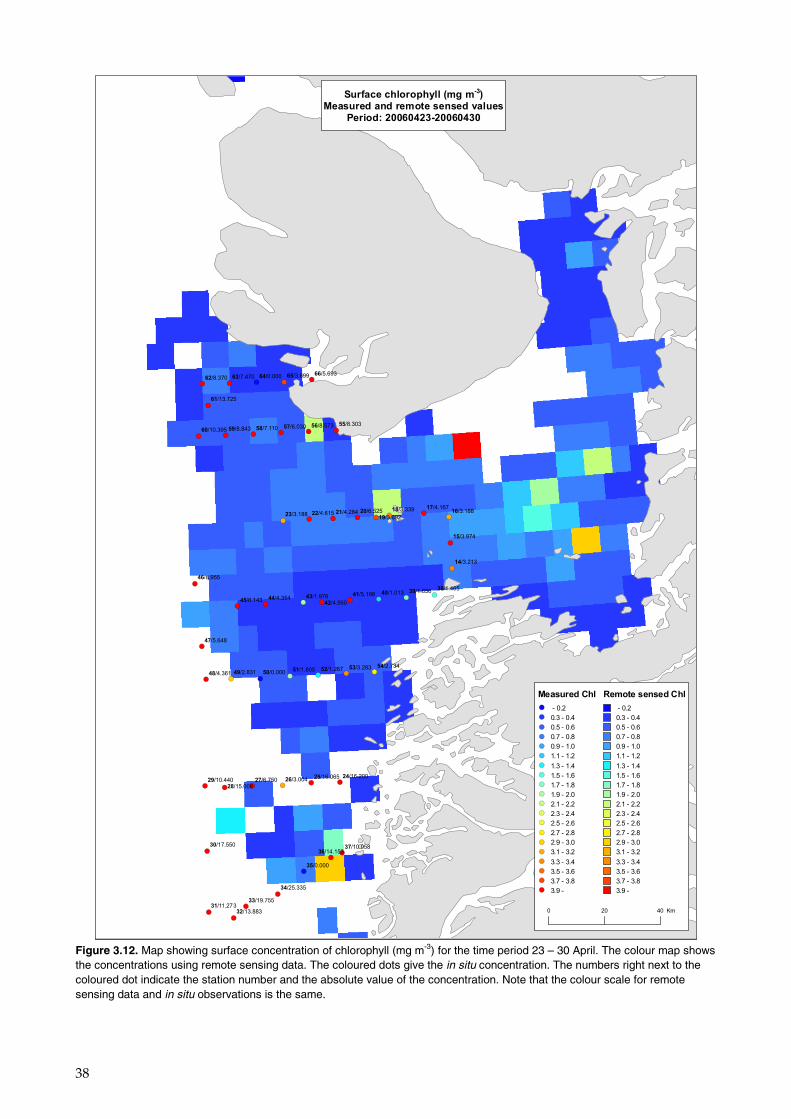
38
!(
!(
!(!(!(!(!(!(!(!(
!(!(!(!(!(!(
!(
!(!(
!(
!(
!(
!(!(
!(!(!(!(!(!(!(!(
!(
!(
!( !( !( !( !( !( !(
!(!(!(!(!(!(
!(
!( !( !( !( !(66/5.69365/3.69964/0.00063/7.47062/8.370
59/8.843 58/7.110 57/6.030 56/8.573 55/8.303
54/2.73453/3.28352/1.26751/1.80550/0.00049/2.83148/4.361
47/5.648
46/8.955
45/6.143 44/4.354 43/1.97642/4.950
41/5.198 40/1.013 39/1.656 38/1.465
35/0.000
27/6.750 26/3.004
23/3.188 22/4.615 21/4.284 20/6.52519/3.692
18/3.339 17/4.167 16/3.188
15/3.974
14/3.213
61/13.725
60/10.395
37/10.05836/14.153
34/25.335
33/19.755
32/13.88331/11.273
30/17.550
29/10.44028/15.008
25/16.065 24/16.200
Surface chlorophyll (mg m-3)Measured and remote sensed values
Period: 20060423-20060430
Measured Chl !( - 0.2!( 0.3 - 0.4!( 0.5 - 0.6!( 0.7 - 0.8!( 0.9 - 1.0!( 1.1 - 1.2!( 1.3 - 1.4!( 1.5 - 1.6!( 1.7 - 1.8!( 1.9 - 2.0!( 2.1 - 2.2!( 2.3 - 2.4!( 2.5 - 2.6!( 2.7 - 2.8!( 2.9 - 3.0!( 3.1 - 3.2!( 3.3 - 3.4!( 3.5 - 3.6!( 3.7 - 3.8!( 3.9 -
Remote sensed Chl - 0.20.3 - 0.40.5 - 0.60.7 - 0.80.9 - 1.01.1 - 1.21.3 - 1.41.5 - 1.61.7 - 1.81.9 - 2.02.1 - 2.22.3 - 2.42.5 - 2.62.7 - 2.82.9 - 3.03.1 - 3.23.3 - 3.43.5 - 3.63.7 - 3.83.9 -
0 20 40 Km
Figure 3.12. Map showing surface concentration of chlorophyll (mg m-3) for the time period 23 – 30 April. The colour map shows the concentrations using remote sensing data. The coloured dots give the in situ concentration. The numbers right next to the coloured dot indicate the station number and the absolute value of the concentration. Note that the colour scale for remote sensing data and in situ observations is the same.
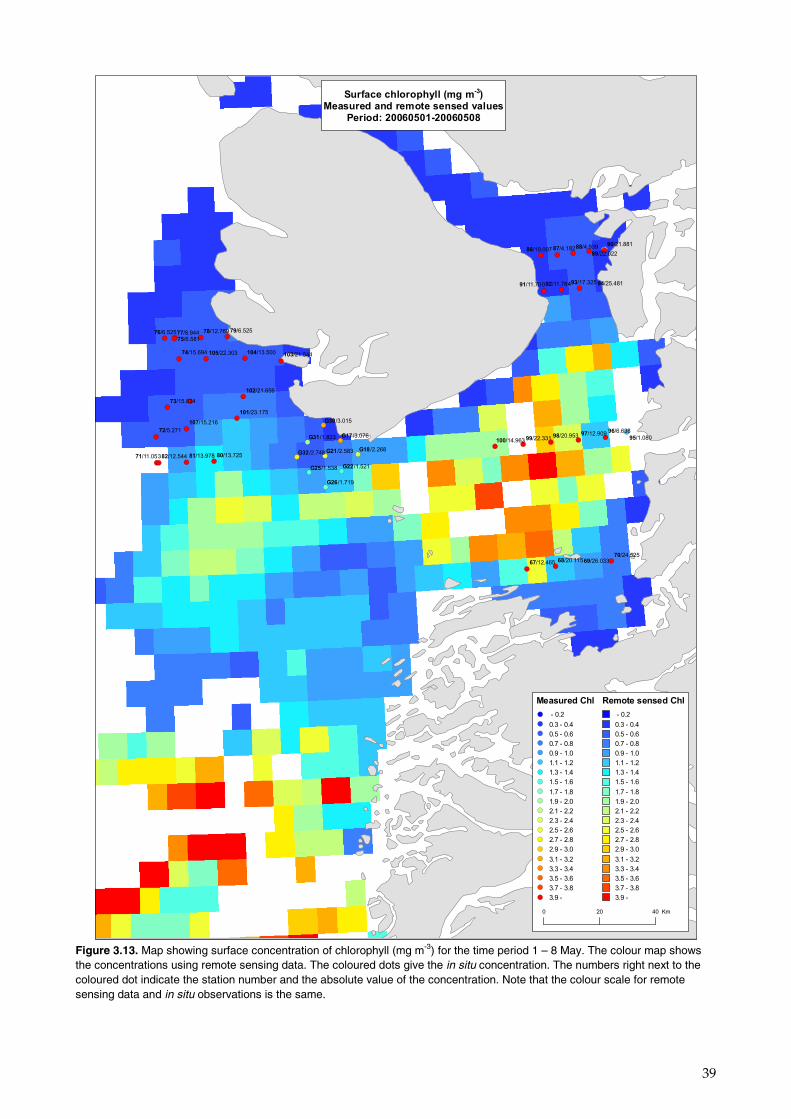
39
!( !(!(
!(
!(
!(
!(
!(!( !( !( !(
!(!(!(
!( !( !(
!( !( !( !( !(
!( !( !(
!(!(!(!(!(!(
!(
!(
!(!(!(
!(
!(
!(
!(!(
!(!(
!(
!(
!(
!(
96/6.63895/1.080
88/4.93987/4.182
79/6.52577/8.94476/6.52575/6.581
72/5.27199/22.331 98/20.953 97/12.909
94/25.48193/17.32592/11.78491/11.700
90/21.88189/22.022
86/19.097
85/16.34184/15.07583/14.372
82/12.544 81/13.978 80/13.725
78/12.769
74/15.694
73/15.834
71/11.053
70/24.52569/26.03368/20.11567/12.465
107/15.216
105/22.303 104/13.500 103/21.544
102/21.656
101/23.175
100/14.963
G32/2.748
G31/1.823
G30/3.015
G26/1.719
G25/1.538 G22/1.521
G21/2.583 G18/2.268
G17/3.076
Surface chlorophyll (mg m-3)Measured and remote sensed values
Period: 20060501-20060508
Measured Chl !( - 0.2!( 0.3 - 0.4!( 0.5 - 0.6!( 0.7 - 0.8!( 0.9 - 1.0!( 1.1 - 1.2!( 1.3 - 1.4!( 1.5 - 1.6!( 1.7 - 1.8!( 1.9 - 2.0!( 2.1 - 2.2!( 2.3 - 2.4!( 2.5 - 2.6!( 2.7 - 2.8!( 2.9 - 3.0!( 3.1 - 3.2!( 3.3 - 3.4!( 3.5 - 3.6!( 3.7 - 3.8!( 3.9 -
Remote sensed Chl - 0.20.3 - 0.40.5 - 0.60.7 - 0.80.9 - 1.01.1 - 1.21.3 - 1.41.5 - 1.61.7 - 1.81.9 - 2.02.1 - 2.22.3 - 2.42.5 - 2.62.7 - 2.82.9 - 3.03.1 - 3.23.3 - 3.43.5 - 3.63.7 - 3.83.9 -
0 20 40 Km
Figure 3.13. Map showing surface concentration of chlorophyll (mg m-3) for the time period 1 – 8 May. The colour map shows the concentrations using remote sensing data. The coloured dots give the in situ concentration. The numbers right next to the coloured dot indicate the station number and the absolute value of the concentration. Note that the colour scale for remote sensing data and in situ observations is the same.
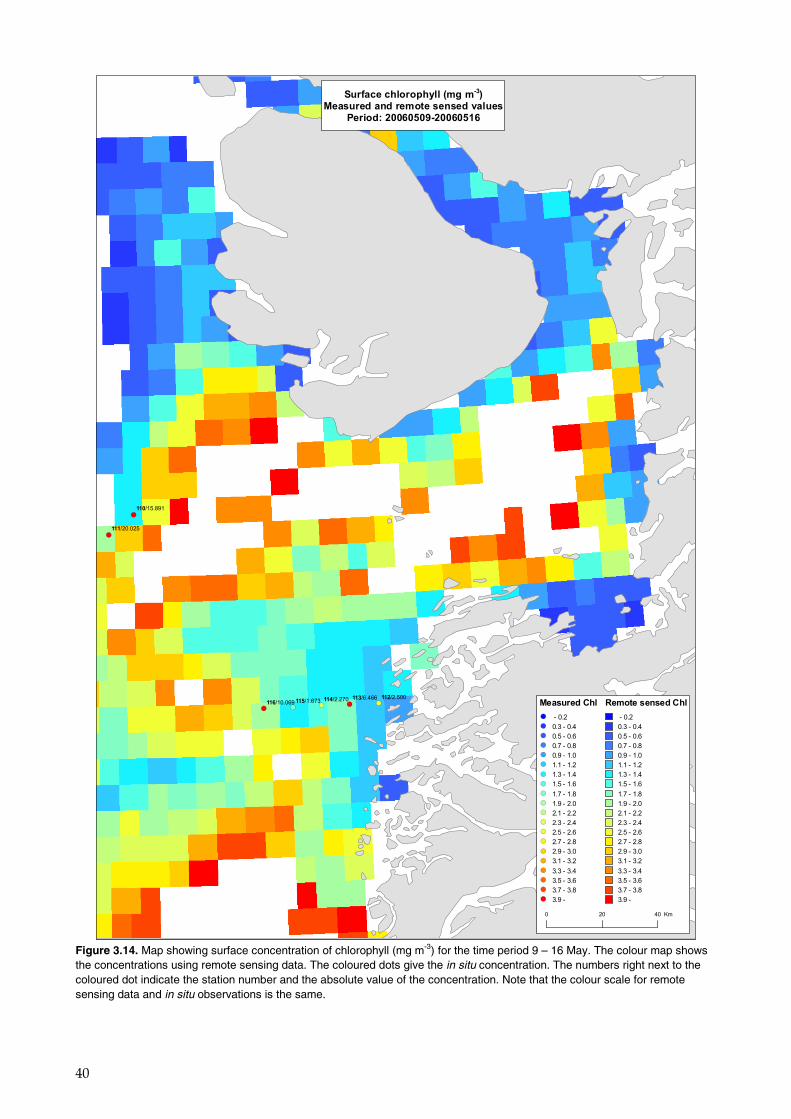
40
!(
!(
!(!(!(!(!(
115/1.673 114/2.270 113/6.466 112/2.500116/10.069
111/20.025
110/15.891
Surface chlorophyll (mg m-3)Measured and remote sensed values
Period: 20060509-20060516
0 20 40 Km
Measured Chl !( - 0.2!( 0.3 - 0.4!( 0.5 - 0.6!( 0.7 - 0.8!( 0.9 - 1.0!( 1.1 - 1.2!( 1.3 - 1.4!( 1.5 - 1.6!( 1.7 - 1.8!( 1.9 - 2.0!( 2.1 - 2.2!( 2.3 - 2.4!( 2.5 - 2.6!( 2.7 - 2.8!( 2.9 - 3.0!( 3.1 - 3.2!( 3.3 - 3.4!( 3.5 - 3.6!( 3.7 - 3.8!( 3.9 -
Remote sensed Chl - 0.20.3 - 0.40.5 - 0.60.7 - 0.80.9 - 1.01.1 - 1.21.3 - 1.41.5 - 1.61.7 - 1.81.9 - 2.02.1 - 2.22.3 - 2.42.5 - 2.62.7 - 2.82.9 - 3.03.1 - 3.23.3 - 3.43.5 - 3.63.7 - 3.83.9 -
Figure 3.14. Map showing surface concentration of chlorophyll (mg m-3) for the time period 9 – 16 May. The colour map shows the concentrations using remote sensing data. The coloured dots give the in situ concentration. The numbers right next to the coloured dot indicate the station number and the absolute value of the concentration. Note that the colour scale for remote sensing data and in situ observations is the same.
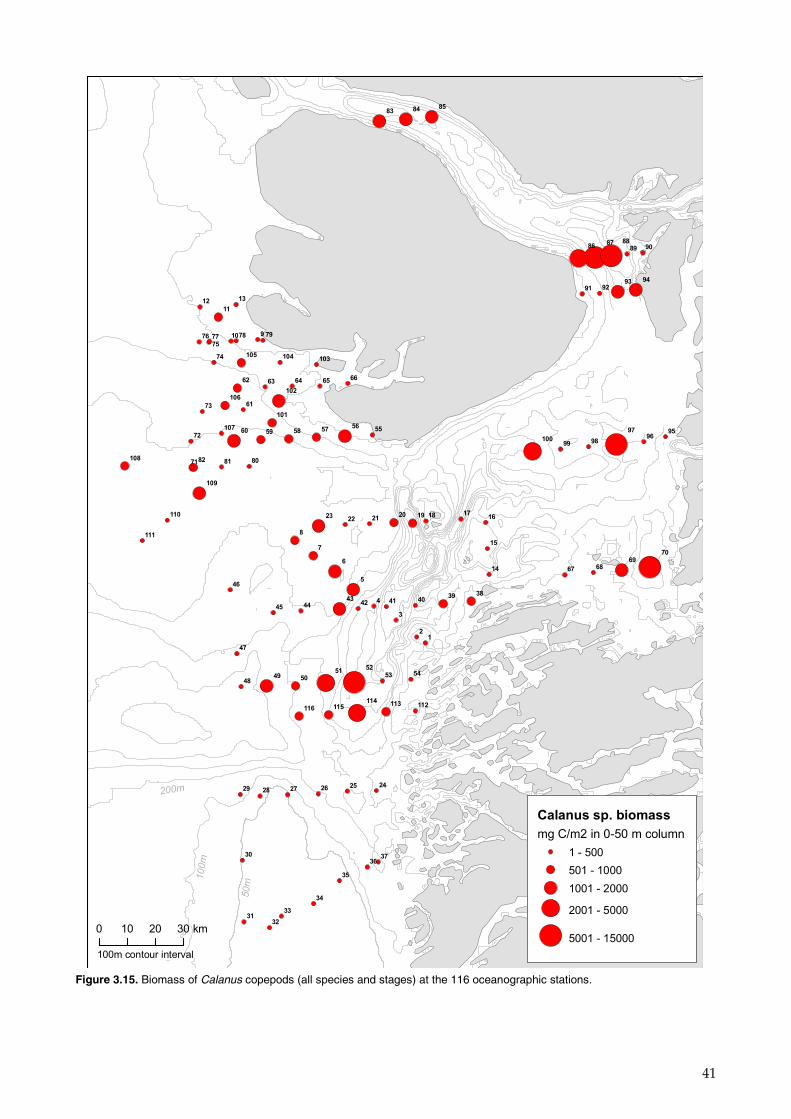
41
9
8
7
6
5
4
3
21
99 98
9796
95
94939291
90898887
86
858483
82 81 80
79787776
75
74
73
72
71
7069
6867
6665646362
61
60 59 58 5756 55
545352
515049
48
47
46
45 4443
42 41 4039 38
3736
35
34
33
3231
30
29 28 27 26 25 24
2322 21
20 19 18 1716
15
14
1312
11
10
116 115114 113 112
111
110
109
108
107
106
105 104 103
102
101
100
0 10 20 30 km
Calanus sp. biomass
mg C/m2 in 0-50 m column
1 - 500
501 - 1000
1001 - 2000
2001 - 5000
5001 - 15000
50m
100m
200m
100m contour interval
Figure 3.15. Biomass of Calanus copepods (all species and stages) at the 116 oceanographic stations.
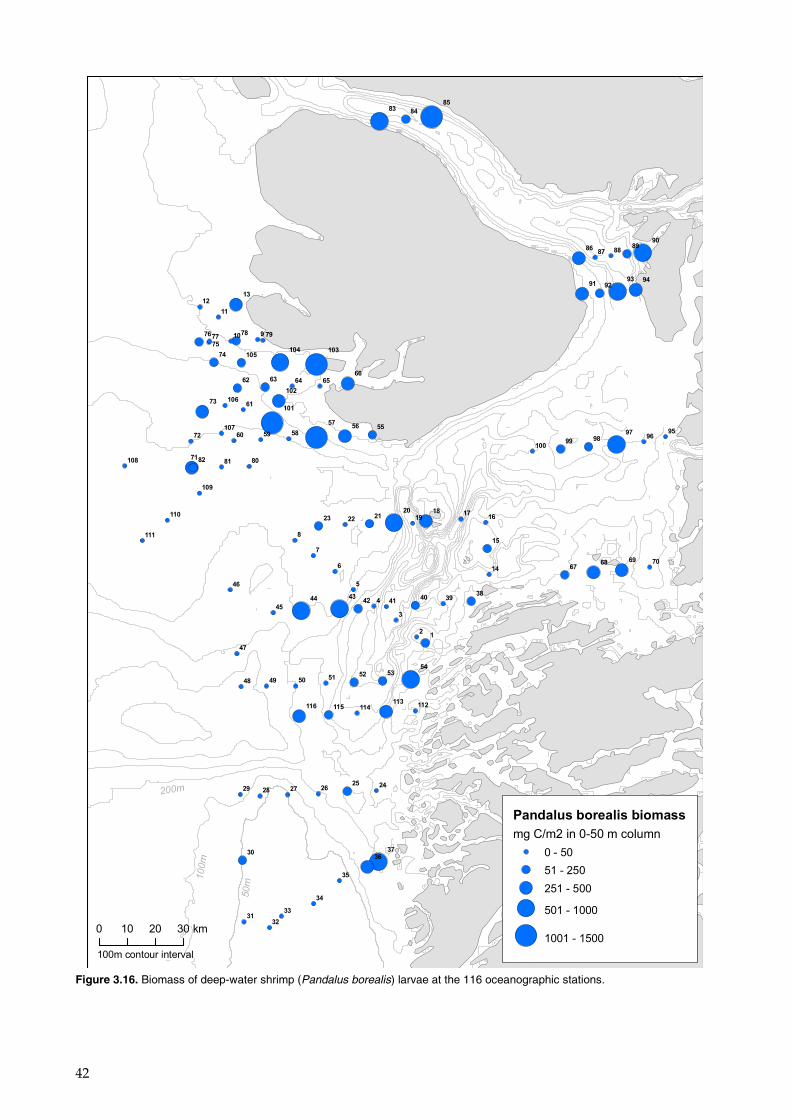
42
9
8
7
6
5
4
3
21
99 9897
9695
94939291
9089
888786
85
8483
82 81 80
79787776
75
74
73
72
71
70696867
6665646362
61
60 59 58
5756 55
545352
51504948
47
46
45
44 4342 41
40 3938
3736
35
34
33
3231
30
29 28 27 2625 24
23 22 2120
1918 17
16
15
14
1312
11
10
116 115 114113
112
111
110
109
108
107
106
105104 103
102
101
100
0 10 20 30 km
Pandalus borealis biomass
mg C/m2 in 0-50 m column
0 - 50
51 - 250
251 - 500
501 - 1000
1001 - 1500
50m
100m
200m
100m contour interval
Figure 3.16. Biomass of deep-water shrimp (Pandalus borealis) larvae at the 116 oceanographic stations.
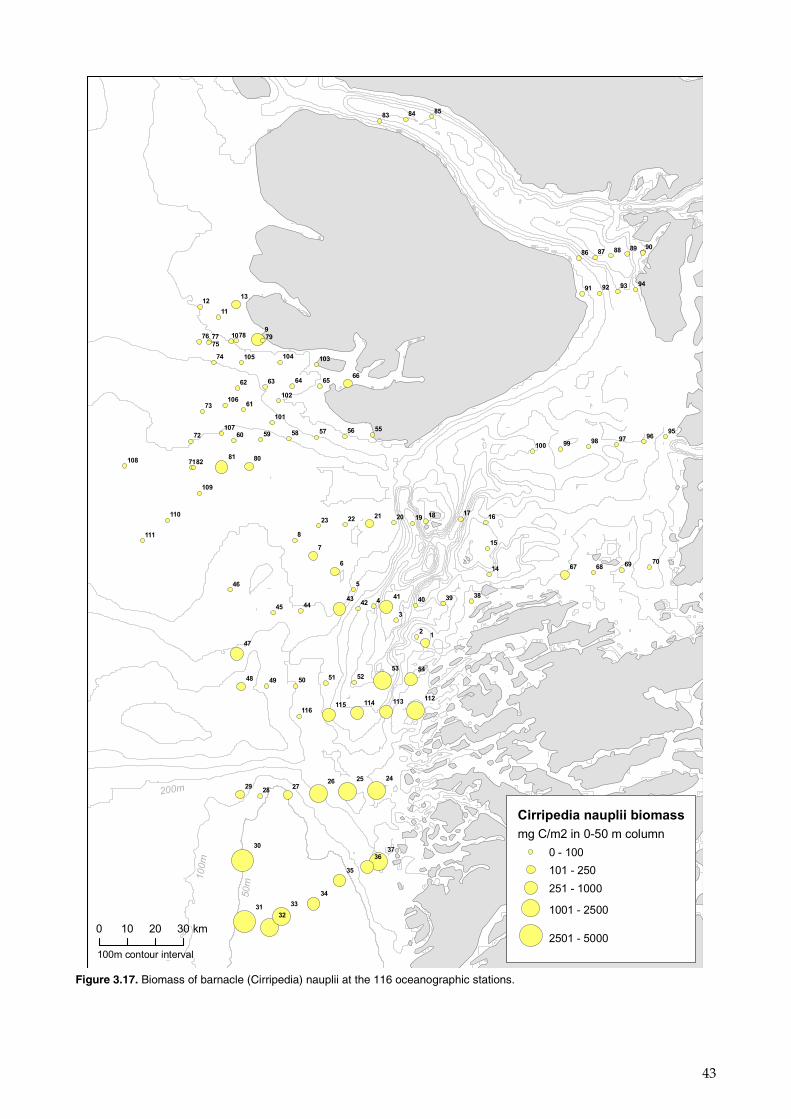
43
9
8
7
6
5
4
3
21
99 98 97 9695
94939291
9089888786
858483
8281 80
79787776
75
74
73
72
71
70696867
6665646362
61
60 59 58 57 56 55
5453
5251504948
47
46
45 4443
4241 40 39 38
3736
35
34
33
32
31
30
2928
2726 25 24
23 22 21 20 19 18 1716
15
14
1312
11
10
116115 114 113
112
111
110
109
108
107
106
105 104 103
102
101
100
0 10 20 30 km
Cirripedia nauplii biomass
mg C/m2 in 0-50 m column
0 - 100
101 - 250
251 - 1000
1001 - 2500
2501 - 5000
50m
100m
200m
100m contour interval
Figure 3.17. Biomass of barnacle (Cirripedia) nauplii at the 116 oceanographic stations.
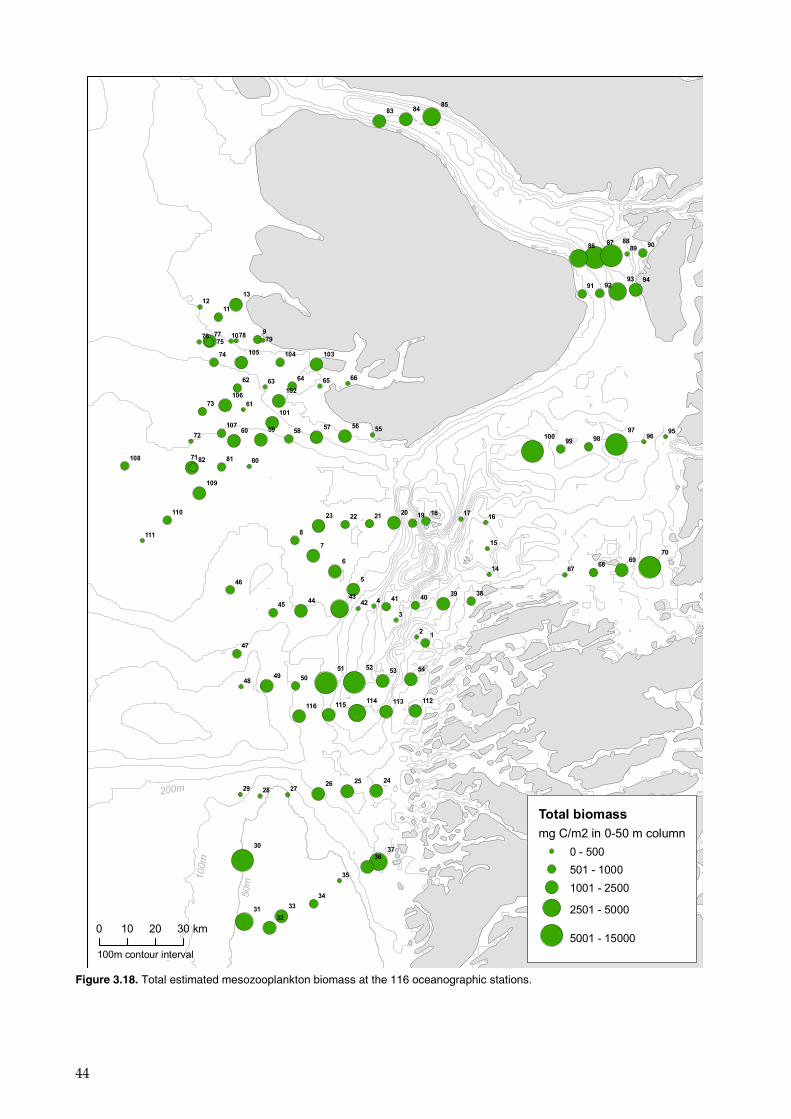
44
9
8
7
6
5
4
3
21
99 98
9796
95
94939291
9089
888786
858483
82 81 80
79787776
75
74
73
72
71
7069
6867
6665646362
61
60 59 5857 56 55
54535251
504948
47
46
4544
4342
41 4039 38
3736
35
34
33
32
31
30
29 28 2726 25 24
23 22 2120 19 18 17
16
15
14
1312
11
10
116 115114 113 112
111
110
109
108
107
106
105 104 103
102
101
100
0 10 20 30 km
Total biomass
mg C/m2 in 0-50 m column
0 - 500
501 - 1000
1001 - 2500
2501 - 5000
5001 - 15000
50m
100m
200m
100m contour interval
Figure 3.18. Total estimated mesozooplankton biomass at the 116 oceanographic stations.
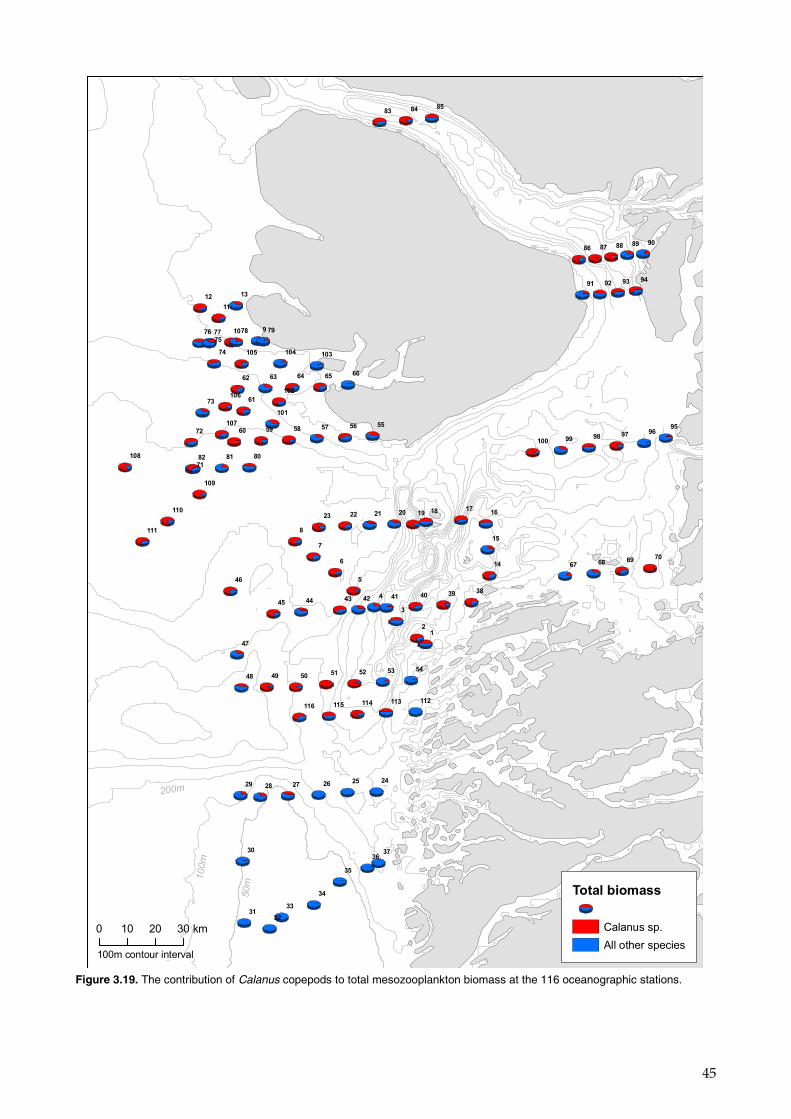
45
9
8
7
6
5
4
3
21
99 98 97 9695
94939291
9089888786
858483
82 81 80
7978777675
74
73
72
71
70696867
6665646362
61
60 59 58 57 56 55
54535251504948
47
46
45 44 43 42 41 40 39 38
3736
35
34
33
3231
30
29 28 27 26 25 24
23 22 21 20 19 18 1716
15
14
1312
11
10
116 115 114 113 112
111
110
109
108
107
106
105 104 103
102
101
100
0 10 20 30 km
Total biomass
Calanus sp.
All other species
50m
100m
200m
100m contour interval
Figure 3.19. The contribution of Calanus copepods to total mesozooplankton biomass at the 116 oceanographic stations.

46
!(!(
!(
!(
!(
!(!(
!(
!(
!(
!(
!(
!(
!(!(
!(
!(
!(
!(
!(
!(
!(
!(
!(
!(!(
!(
!(!(
!(
!(
!(
!(!(
!(
!(
!(
!( !(
!(
!(
DD
D
D
D
DD
D
D D
DDDD
DDD
DD
D
D
D D D D D
DDDDDD
D
D D D
D DD
D
D
D
D
DD D D
DDD
D D D
D D D D D
D D
DDDDD
D
D
DDD
D
D
D
D
D
!(
9
8
7
6
5
4
3
21
99 98 97 9695
94939291
9089888786
858483
82 81 80
79787776
75
74
73
72
71
70696867
6665646362
61
60 59 58 57 56 55
54535251504948
47
46
45 44 43 42 41 40 39 38
3736
35
34
33
3231
30
29 28 27 26 25 24
23 22 21 20 19 18 1716
15
14
1312
11
10
116 115 114 113 112
111
110
109
108
107
106
105 104 103
102
101
100
Perm
0 10 20 30 km
Fish larvae
n / m2
D 0
!( 1 - 10
!( 11 - 20
!( 21 - 40
!( 41 - 80
!( 81 - 120
!( 121 - 160
50m
100m
200m
100m contour interval
Figure 3.20. Abundance of fish larvae (# m-2) at the 116 oceanographic stations.
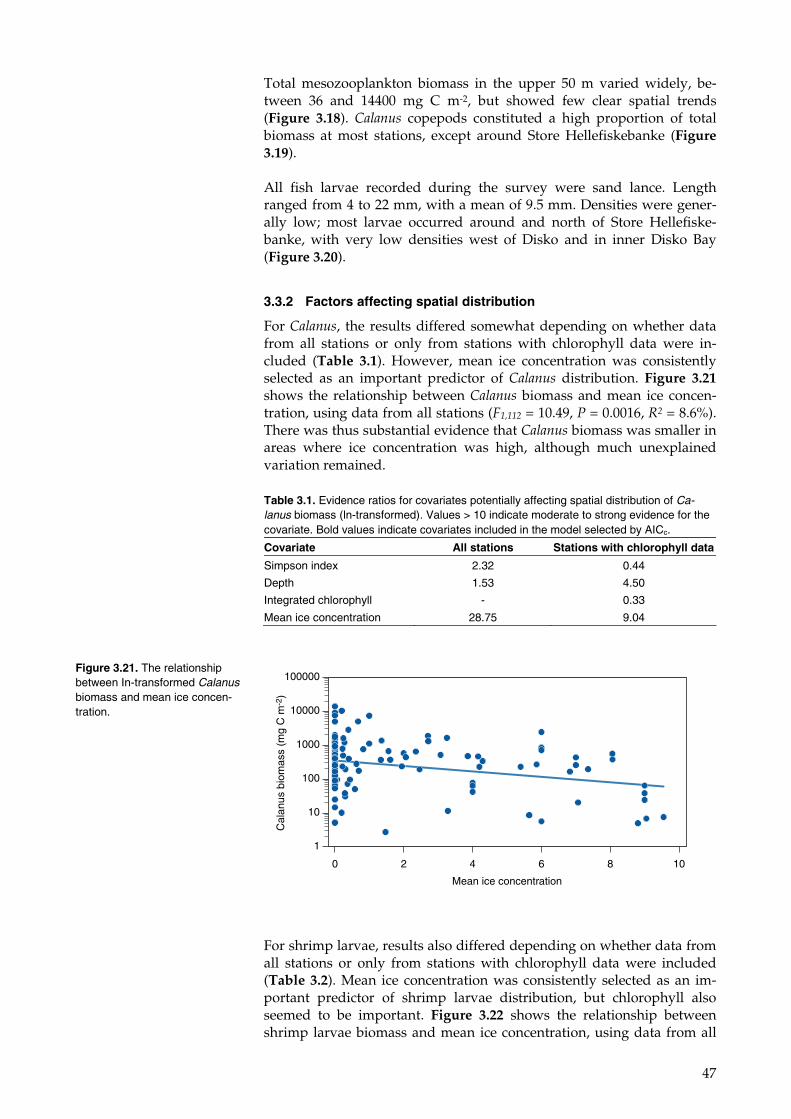
47
Total mesozooplankton biomass in the upper 50 m varied widely, be-tween 36 and 14400 mg C m-2, but showed few clear spatial trends (Figure 3.18). Calanus copepods constituted a high proportion of total biomass at most stations, except around Store Hellefiskebanke (Figure 3.19).
All fish larvae recorded during the survey were sand lance. Length ranged from 4 to 22 mm, with a mean of 9.5 mm. Densities were gener-ally low; most larvae occurred around and north of Store Hellefiske-banke, with very low densities west of Disko and in inner Disko Bay (Figure 3.20).
3.3.2 Factors affecting spatial distribution
For Calanus, the results differed somewhat depending on whether data from all stations or only from stations with chlorophyll data were in-cluded (Table 3.1). However, mean ice concentration was consistently selected as an important predictor of Calanus distribution. Figure 3.21 shows the relationship between Calanus biomass and mean ice concen-tration, using data from all stations (F1,112 = 10.49, P = 0.0016, R2 = 8.6%). There was thus substantial evidence that Calanus biomass was smaller in areas where ice concentration was high, although much unexplained variation remained.
For shrimp larvae, results also differed depending on whether data from all stations or only from stations with chlorophyll data were included (Table 3.2). Mean ice concentration was consistently selected as an im-portant predictor of shrimp larvae distribution, but chlorophyll also seemed to be important. Figure 3.22 shows the relationship between shrimp larvae biomass and mean ice concentration, using data from all
Table 3.1. Evidence ratios for covariates potentially affecting spatial distribution of Ca-lanus biomass (ln-transformed). Values > 10 indicate moderate to strong evidence for the covariate. Bold values indicate covariates included in the model selected by AICc.
Covariate All stations Stations with chlorophyll data
Simpson index 2.32 0.44
Depth 1.53 4.50
Integrated chlorophyll - 0.33
Mean ice concentration 28.75 9.04
Figure 3.21. The relationship between In-transformed Calanus biomass and mean ice concen-tration.
Mean ice concentration
0 2 4 6 8 10
Cal
anus
bio
mas
s (m
g C
m-2
)
1
10
100
1000
10000
100000

48
stations where any larvae occurred (F1,63 = 10.50, P = 0.0019, R2 = 14.3%), and Figure 3.23 shows the relationship with integrated chlorophyll, us-ing data from stations where this covariate was measured (F1,51 = 5.10, P = 0.0282, R2 = 9.1%). Results were very similar, although slightly less clear, when stations with no shrimp larvae were included. There was thus substantial evidence that shrimp larvae biomass was smaller in ar-eas where ice concentration was high and some evidence that it was higher in areas with high chlorophyll concentration.
Table 3.2. Evidence ratios for covariates potentially affecting spatial distribution of Panda-lus shrimp larvae biomass (ln-transformed). Values > 10 indicate moderate to strong evi-dence for the covariate. Bold values indicate covariates included in the model selected by AICc.
Covariate All stations Stations with chlorophyll data
Simpson index 0.75 0.33
Depth 0.57 0.48
Integrated chlorophyll - 12.44
Mean ice concentration 62.50 92.78
Figure 3.22. The relationship between In-transformed Panda-lus biomass and mean ice con-centration.
Mean ice concentration
0 2 4 6 8 10
Pan
dalu
s bi
omas
s (m
g C
m-2
)
10
100
1000
10000
Figure 3.23. The relationship between In-transformed Panda-lus biomass and integrated chlo-rophyll.
Pan
dalu
s bi
omas
s (m
g C
m-2
)
10
100
1000
10000
Integrated chlorophyll
0 200 400 600 800 1000 1200 1400
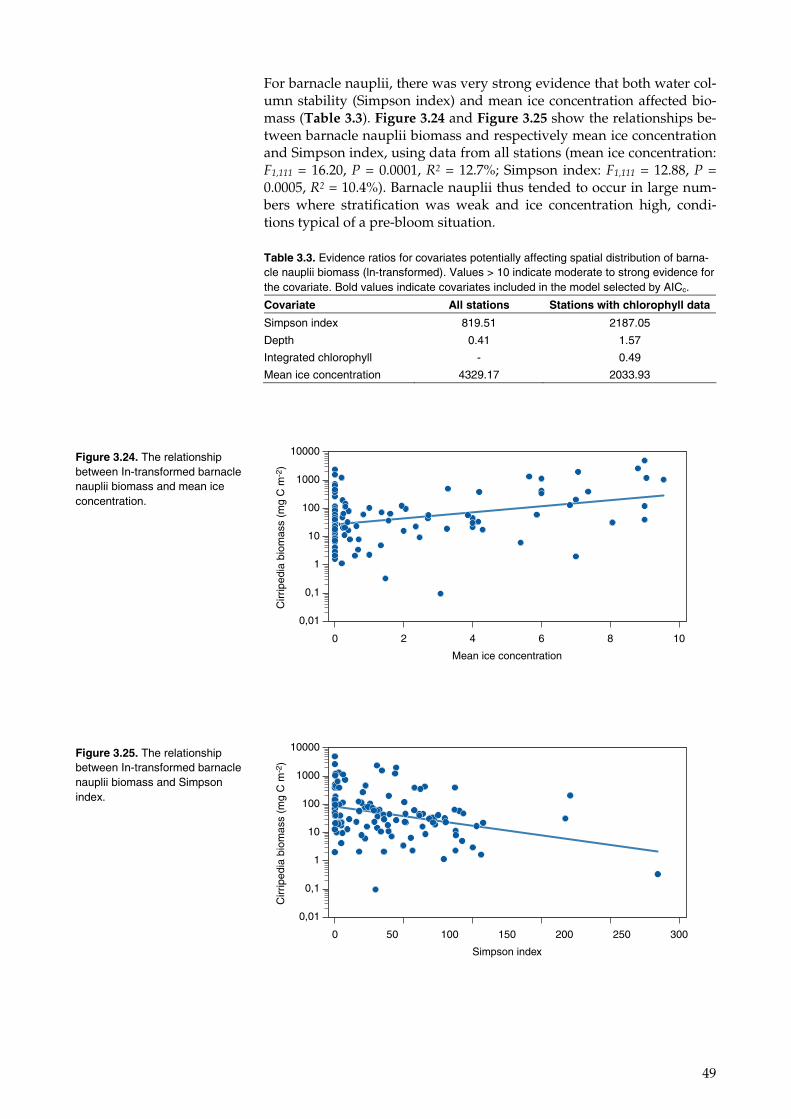
49
For barnacle nauplii, there was very strong evidence that both water col-umn stability (Simpson index) and mean ice concentration affected bio-mass (Table 3.3). Figure 3.24 and Figure 3.25 show the relationships be-tween barnacle nauplii biomass and respectively mean ice concentration and Simpson index, using data from all stations (mean ice concentration: F1,111 = 16.20, P = 0.0001, R2 = 12.7%; Simpson index: F1,111 = 12.88, P = 0.0005, R2 = 10.4%). Barnacle nauplii thus tended to occur in large num-bers where stratification was weak and ice concentration high, condi-tions typical of a pre-bloom situation.
Table 3.3. Evidence ratios for covariates potentially affecting spatial distribution of barna-cle nauplii biomass (ln-transformed). Values > 10 indicate moderate to strong evidence for the covariate. Bold values indicate covariates included in the model selected by AICc.
Covariate All stations Stations with chlorophyll data
Simpson index 819.51 2187.05
Depth 0.41 1.57
Integrated chlorophyll - 0.49
Mean ice concentration 4329.17 2033.93
Figure 3.24. The relationship between In-transformed barnacle nauplii biomass and mean ice concentration.
Cirr
iped
ia b
iom
ass
(mg
C m
-2)
0,01
0,1
1
10
100
1000
10000
0 2 4 6 8 10
Mean ice concentration
Figure 3.25. The relationship between In-transformed barnacle nauplii biomass and Simpson index.
Cirr
iped
ia b
iom
ass
(mg
C m
-2)
0,01
0,1
1
10
100
1000
10000
Simpson index
0 50 100 150 200 250 300
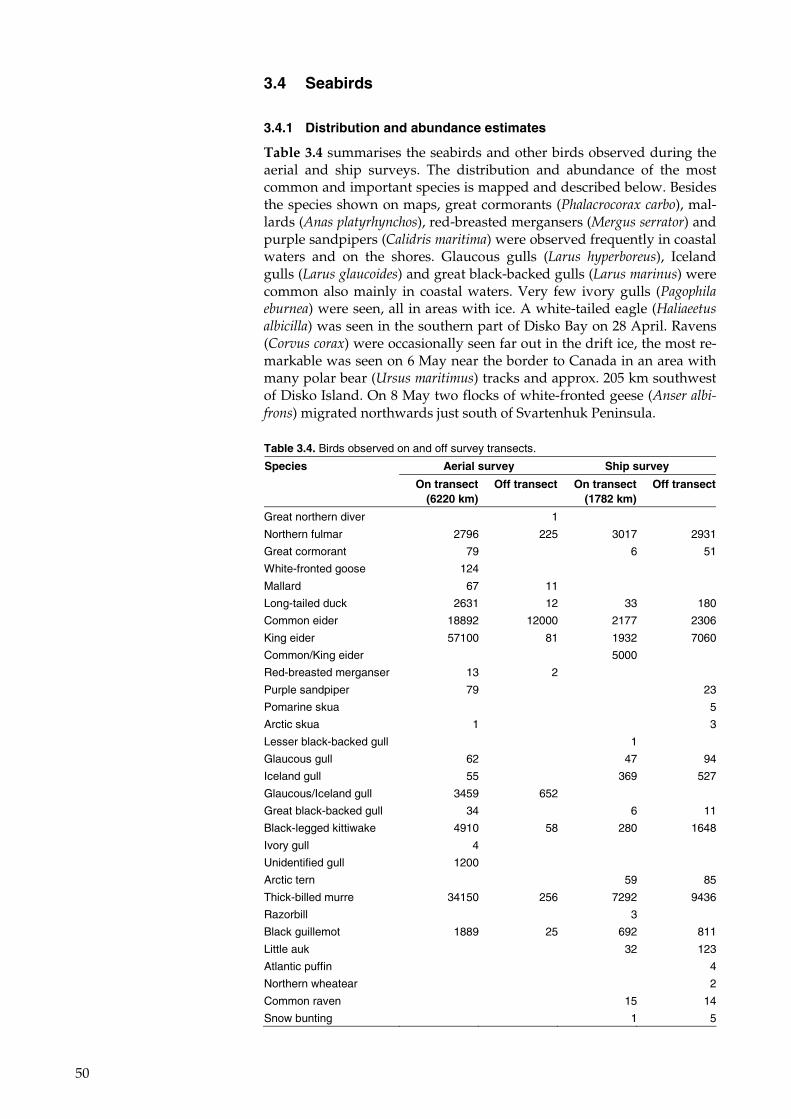
50
3.4 Seabirds
3.4.1 Distribution and abundance estimates
Table 3.4 summarises the seabirds and other birds observed during the aerial and ship surveys. The distribution and abundance of the most common and important species is mapped and described below. Besides the species shown on maps, great cormorants (Phalacrocorax carbo), mal-lards (Anas platyrhynchos), red-breasted mergansers (Mergus serrator) and purple sandpipers (Calidris maritima) were observed frequently in coastal waters and on the shores. Glaucous gulls (Larus hyperboreus), Iceland gulls (Larus glaucoides) and great black-backed gulls (Larus marinus) were common also mainly in coastal waters. Very few ivory gulls (Pagophila eburnea) were seen, all in areas with ice. A white-tailed eagle (Haliaeetus albicilla) was seen in the southern part of Disko Bay on 28 April. Ravens (Corvus corax) were occasionally seen far out in the drift ice, the most re-markable was seen on 6 May near the border to Canada in an area with many polar bear (Ursus maritimus) tracks and approx. 205 km southwest of Disko Island. On 8 May two flocks of white-fronted geese (Anser albi-frons) migrated northwards just south of Svartenhuk Peninsula.
Table 3.4. Birds observed on and off survey transects.
Aerial survey Ship survey Species
On transect (6220 km)
Off transect On transect (1782 km)
Off transect
Great northern diver 1
Northern fulmar 2796 225 3017 2931
Great cormorant 79 6 51
White-fronted goose 124
Mallard 67 11
Long-tailed duck 2631 12 33 180
Common eider 18892 12000 2177 2306
King eider 57100 81 1932 7060
Common/King eider 5000
Red-breasted merganser 13 2
Purple sandpiper 79 23
Pomarine skua 5
Arctic skua 1 3
Lesser black-backed gull 1
Glaucous gull 62 47 94
Iceland gull 55 369 527
Glaucous/Iceland gull 3459 652
Great black-backed gull 34 6 11
Black-legged kittiwake 4910 58 280 1648
Ivory gull 4
Unidentified gull 1200
Arctic tern 59 85
Thick-billed murre 34150 256 7292 9436
Razorbill 3
Black guillemot 1889 25 692 811
Little auk 32 123
Atlantic puffin 4
Northern wheatear 2
Common raven 15 14
Snow bunting 1 5
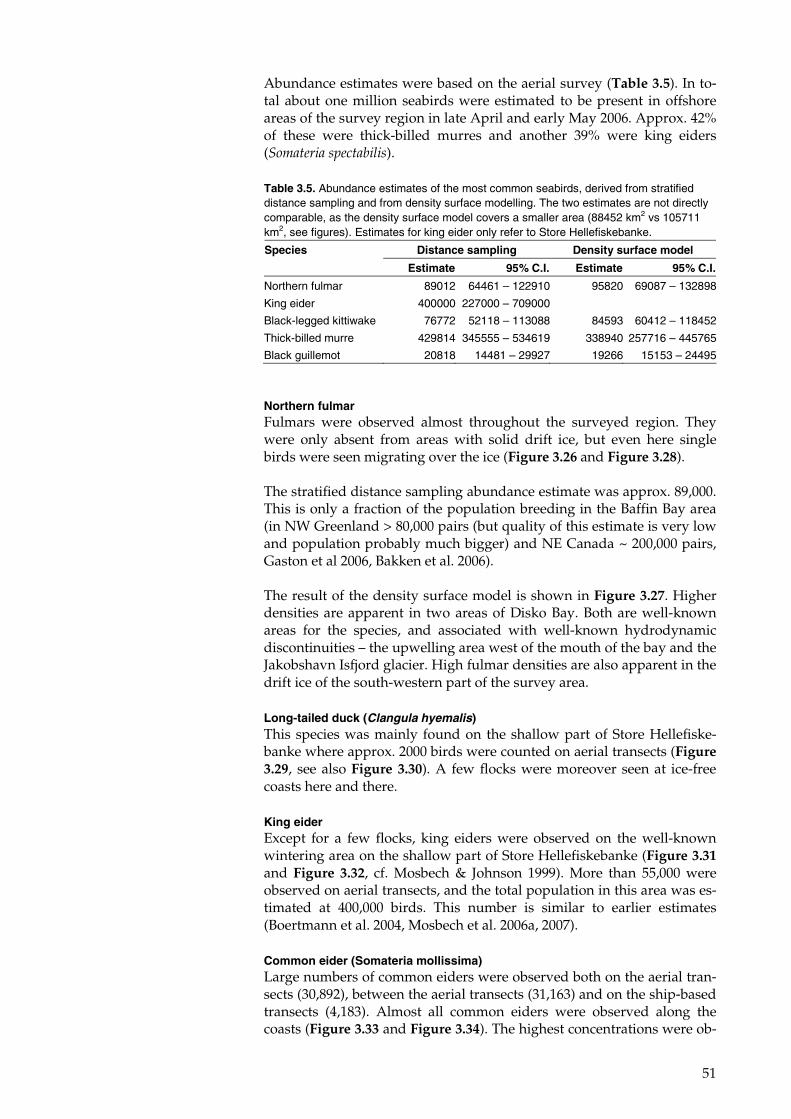
51
Abundance estimates were based on the aerial survey (Table 3.5). In to-tal about one million seabirds were estimated to be present in offshore areas of the survey region in late April and early May 2006. Approx. 42% of these were thick-billed murres and another 39% were king eiders (Somateria spectabilis).
Northern fulmar Fulmars were observed almost throughout the surveyed region. They were only absent from areas with solid drift ice, but even here single birds were seen migrating over the ice (Figure 3.26 and Figure 3.28).
The stratified distance sampling abundance estimate was approx. 89,000. This is only a fraction of the population breeding in the Baffin Bay area (in NW Greenland > 80,000 pairs (but quality of this estimate is very low and population probably much bigger) and NE Canada ~ 200,000 pairs, Gaston et al 2006, Bakken et al. 2006).
The result of the density surface model is shown in Figure 3.27. Higher densities are apparent in two areas of Disko Bay. Both are well-known areas for the species, and associated with well-known hydrodynamic discontinuities – the upwelling area west of the mouth of the bay and the Jakobshavn Isfjord glacier. High fulmar densities are also apparent in the drift ice of the south-western part of the survey area.
Long-tailed duck (Clangula hyemalis) This species was mainly found on the shallow part of Store Hellefiske-banke where approx. 2000 birds were counted on aerial transects (Figure 3.29, see also Figure 3.30). A few flocks were moreover seen at ice-free coasts here and there.
King eider Except for a few flocks, king eiders were observed on the well-known wintering area on the shallow part of Store Hellefiskebanke (Figure 3.31 and Figure 3.32, cf. Mosbech & Johnson 1999). More than 55,000 were observed on aerial transects, and the total population in this area was es-timated at 400,000 birds. This number is similar to earlier estimates (Boertmann et al. 2004, Mosbech et al. 2006a, 2007).
Common eider (Somateria mollissima) Large numbers of common eiders were observed both on the aerial tran-sects (30,892), between the aerial transects (31,163) and on the ship-based transects (4,183). Almost all common eiders were observed along the coasts (Figure 3.33 and Figure 3.34). The highest concentrations were ob-
Table 3.5. Abundance estimates of the most common seabirds, derived from stratified distance sampling and from density surface modelling. The two estimates are not directly comparable, as the density surface model covers a smaller area (88452 km2 vs 105711 km2, see figures). Estimates for king eider only refer to Store Hellefiskebanke.
Distance sampling Density surface model Species
Estimate 95% C.I. Estimate 95% C.I.
Northern fulmar 89012 64461 – 122910 95820 69087 – 132898
King eider 400000 227000 – 709000
Black-legged kittiwake 76772 52118 – 113088 84593 60412 – 118452
Thick-billed murre 429814 345555 – 534619 338940 257716 – 445765
Black guillemot 20818 14481 – 29927 19266 15153 – 24495
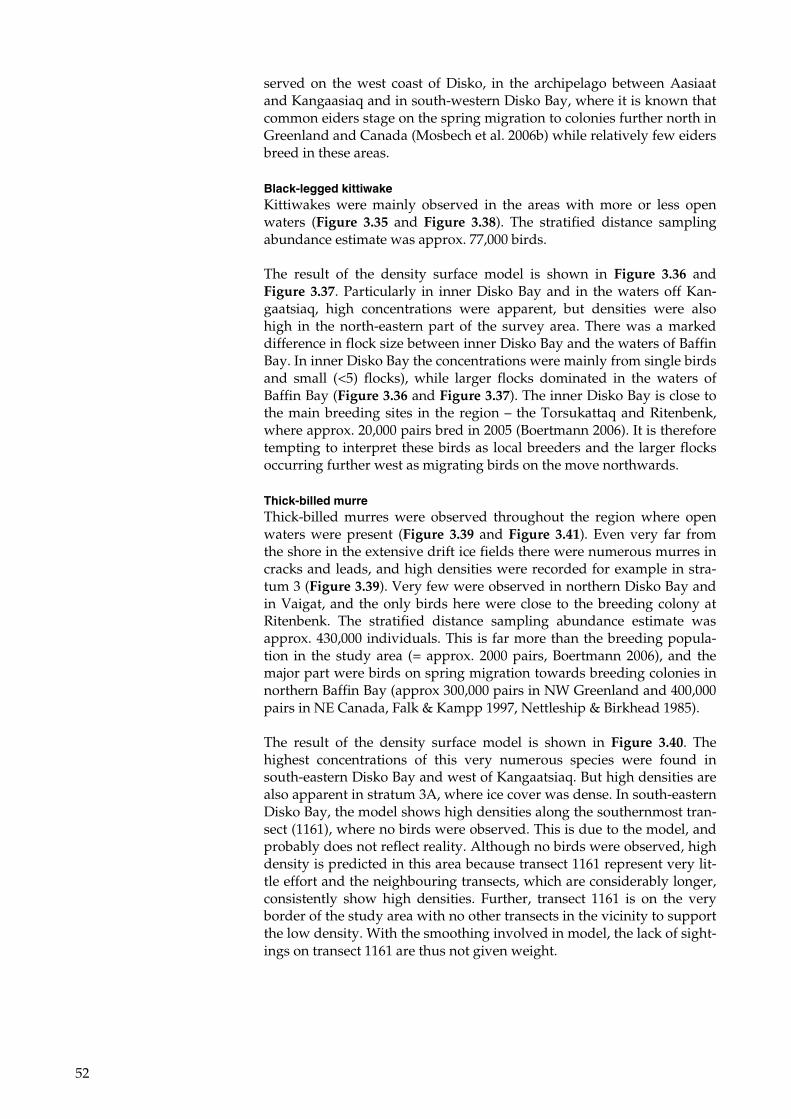
52
served on the west coast of Disko, in the archipelago between Aasiaat and Kangaasiaq and in south-western Disko Bay, where it is known that common eiders stage on the spring migration to colonies further north in Greenland and Canada (Mosbech et al. 2006b) while relatively few eiders breed in these areas.
Black-legged kittiwake Kittiwakes were mainly observed in the areas with more or less open waters (Figure 3.35 and Figure 3.38). The stratified distance sampling abundance estimate was approx. 77,000 birds.
The result of the density surface model is shown in Figure 3.36 and Figure 3.37. Particularly in inner Disko Bay and in the waters off Kan-gaatsiaq, high concentrations were apparent, but densities were also high in the north-eastern part of the survey area. There was a marked difference in flock size between inner Disko Bay and the waters of Baffin Bay. In inner Disko Bay the concentrations were mainly from single birds and small (<5) flocks), while larger flocks dominated in the waters of Baffin Bay (Figure 3.36 and Figure 3.37). The inner Disko Bay is close to the main breeding sites in the region – the Torsukattaq and Ritenbenk, where approx. 20,000 pairs bred in 2005 (Boertmann 2006). It is therefore tempting to interpret these birds as local breeders and the larger flocks occurring further west as migrating birds on the move northwards.
Thick-billed murre Thick-billed murres were observed throughout the region where open waters were present (Figure 3.39 and Figure 3.41). Even very far from the shore in the extensive drift ice fields there were numerous murres in cracks and leads, and high densities were recorded for example in stra-tum 3 (Figure 3.39). Very few were observed in northern Disko Bay and in Vaigat, and the only birds here were close to the breeding colony at Ritenbenk. The stratified distance sampling abundance estimate was approx. 430,000 individuals. This is far more than the breeding popula-tion in the study area (= approx. 2000 pairs, Boertmann 2006), and the major part were birds on spring migration towards breeding colonies in northern Baffin Bay (approx 300,000 pairs in NW Greenland and 400,000 pairs in NE Canada, Falk & Kampp 1997, Nettleship & Birkhead 1985).
The result of the density surface model is shown in Figure 3.40. The highest concentrations of this very numerous species were found in south-eastern Disko Bay and west of Kangaatsiaq. But high densities are also apparent in stratum 3A, where ice cover was dense. In south-eastern Disko Bay, the model shows high densities along the southernmost tran-sect (1161), where no birds were observed. This is due to the model, and probably does not reflect reality. Although no birds were observed, high density is predicted in this area because transect 1161 represent very lit-tle effort and the neighbouring transects, which are considerably longer, consistently show high densities. Further, transect 1161 is on the very border of the study area with no other transects in the vicinity to support the low density. With the smoothing involved in model, the lack of sight-ings on transect 1161 are thus not given weight.
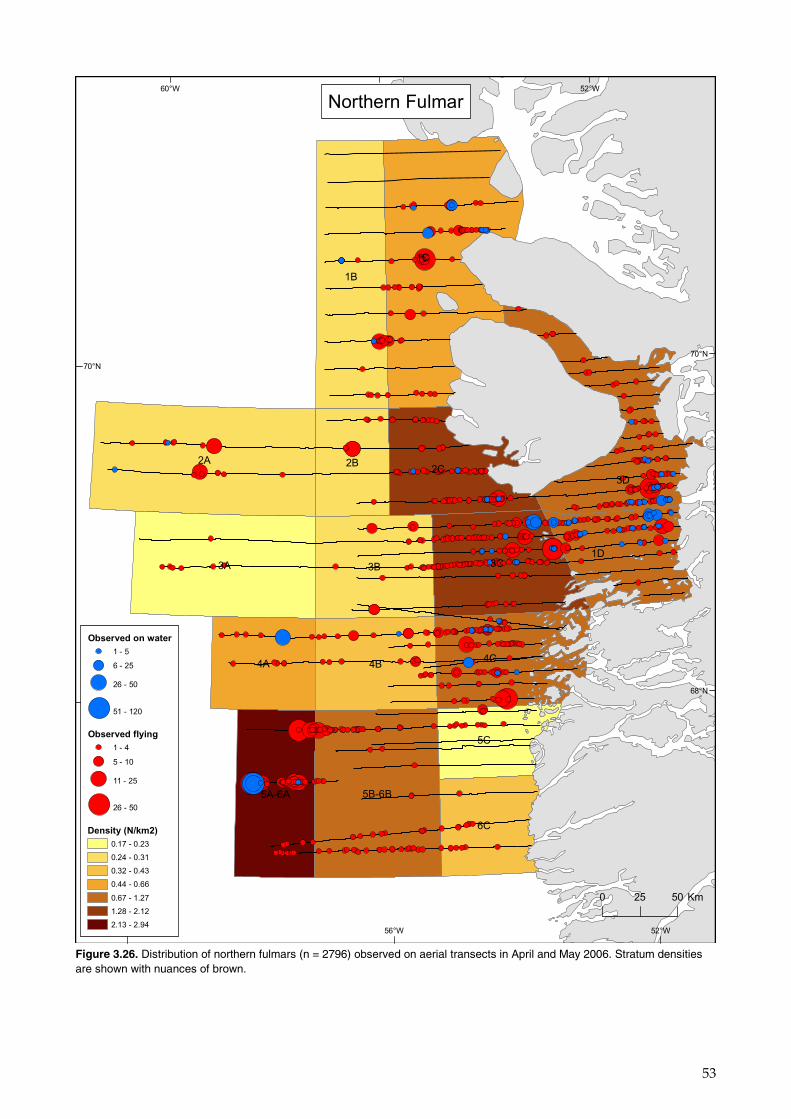
53
1C
2A
3A
1B
3D
3C
4C
3B
4B
2C
1D
4A
5B-6B
6C
2B
5C
5A-6A
52°W
52°W
56°W
56°W
60°W
60°W
70°N
70°N
68°N
68°N
Northern Fulmar
Observed on water
1 - 5
6 - 25
26 - 50
51 - 120
Observed flying
1 - 4
5 - 10
11 - 25
26 - 50
Density (N/km2)
0.17 - 0.23
0.24 - 0.31
0.32 - 0.43
0.44 - 0.66
0.67 - 1.27
1.28 - 2.12
2.13 - 2.94
0 25 50 Km
Figure 3.26. Distribution of northern fulmars (n = 2796) observed on aerial transects in April and May 2006. Stratum densities are shown with nuances of brown.
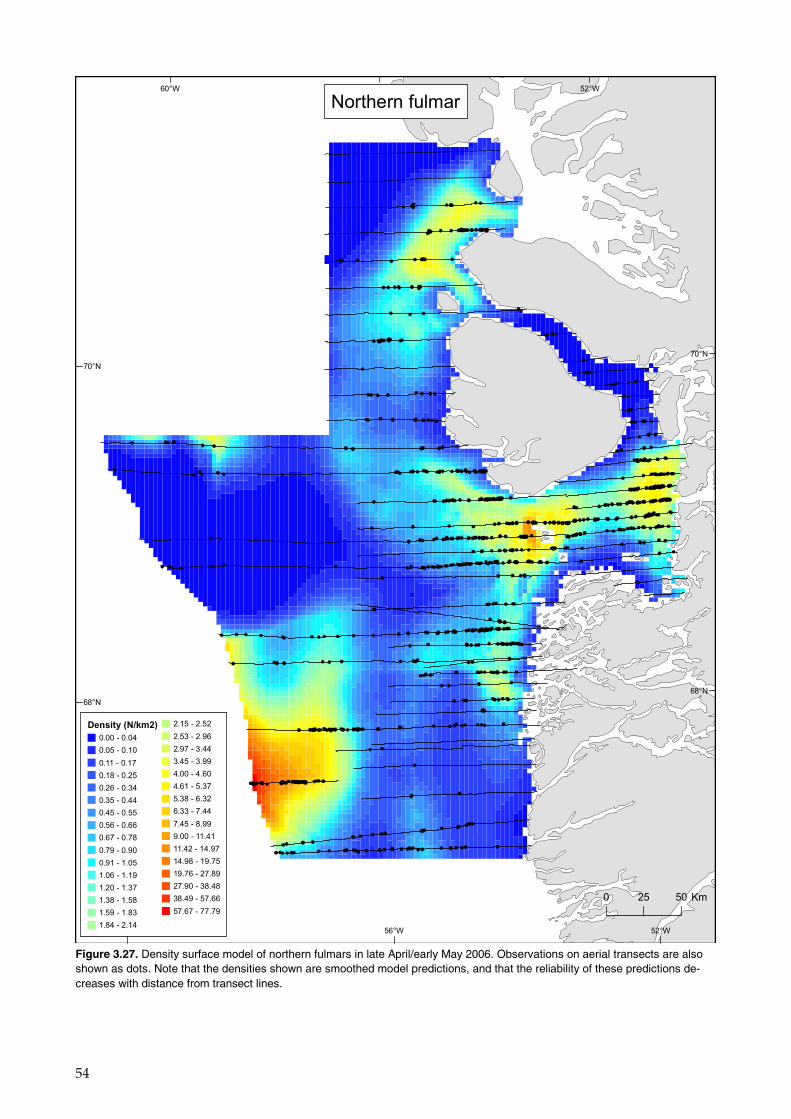
54
52°W
52°W
56°W
56°W
60°W
60°W
70°N
70°N
68°N
68°N
Northern fulmar
Density (N/km2)
0.00 - 0.04
0.05 - 0.10
0.11 - 0.17
0.18 - 0.25
0.26 - 0.34
0.35 - 0.44
0.45 - 0.55
0.56 - 0.66
0.67 - 0.78
0.79 - 0.90
0.91 - 1.05
1.06 - 1.19
1.20 - 1.37
1.38 - 1.58
1.59 - 1.83
1.84 - 2.14
2.15 - 2.52
2.53 - 2.96
2.97 - 3.44
3.45 - 3.99
4.00 - 4.60
4.61 - 5.37
5.38 - 6.32
6.33 - 7.44
7.45 - 8.99
9.00 - 11.41
11.42 - 14.97
14.98 - 19.75
19.76 - 27.89
27.90 - 38.48
38.49 - 57.66
57.67 - 77.79
0 25 50 Km
Figure 3.27. Density surface model of northern fulmars in late April/early May 2006. Observations on aerial transects are also shown as dots. Note that the densities shown are smoothed model predictions, and that the reliability of these predictions de-creases with distance from transect lines.

55
50°W
52°W
52°W
54°W
54°W
56°W
56°W
70°N
70°N
69°N
69°N
68°N
68°N
Northern fulmar
Observed flying
1
2 - 5
6 - 10
11 - 50
51 - 150
Observed on water
1 - 10
11 - 25
26 - 50
51 - 200
201 - 541 0 20 40 Km
Figure 3.28. Observations of northern fulmars (n = 3017) on ship transects in April and May 2006.

56
52°W
52°W
56°W
56°W
60°W
60°W
70°N
70°N
68°N
68°N
Long-tailed duck
Observed flying
1 - 10
11 - 50
51 - 100
101 - 200
201 - 500
Observed on water
1 - 2
3 - 10
11 - 25
26 - 50
51 - 200
0 25 50 Km
Figure 3.29. Distribution of long-tailed ducks (n = 2631) observed on aerial transects in April and May 2006.
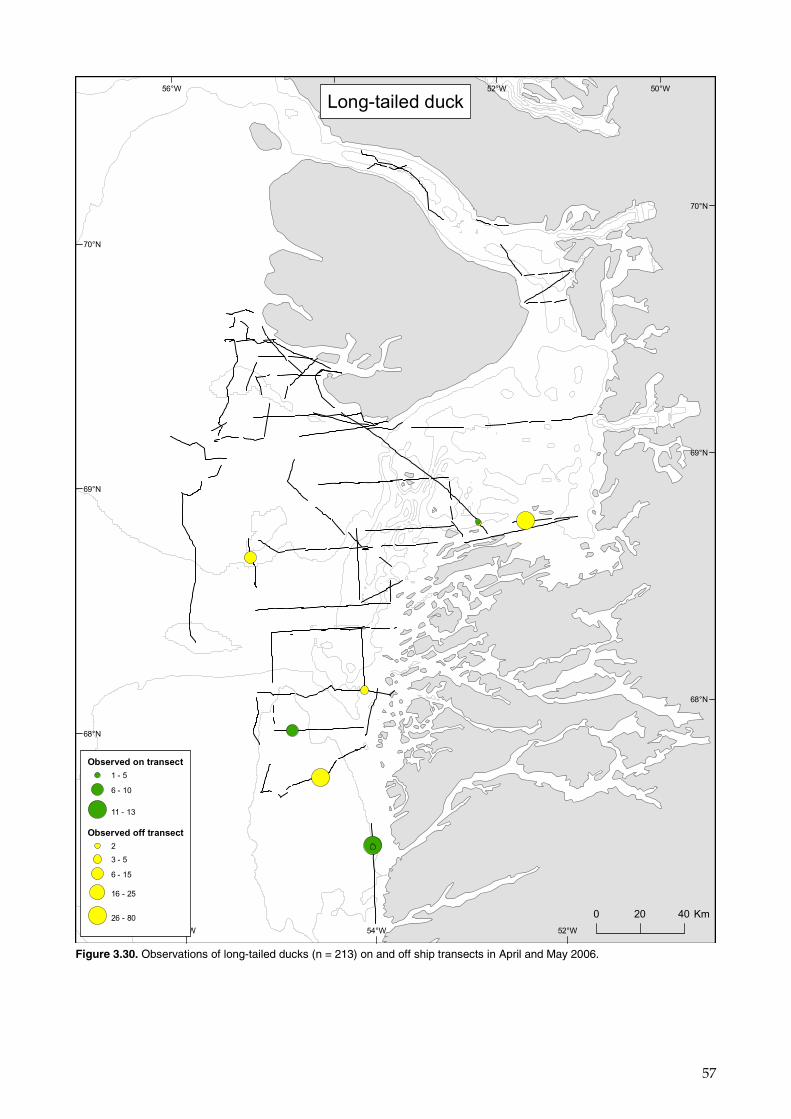
57
50°W
52°W
52°W
54°W
54°W
56°W
56°W
70°N
70°N
69°N
69°N
68°N
68°N
Long-tailed duck
Observed on transect
1 - 5
6 - 10
11 - 13
Observed off transect
2
3 - 5
6 - 15
16 - 25
26 - 80 0 20 40 Km
Figure 3.30. Observations of long-tailed ducks (n = 213) on and off ship transects in April and May 2006.
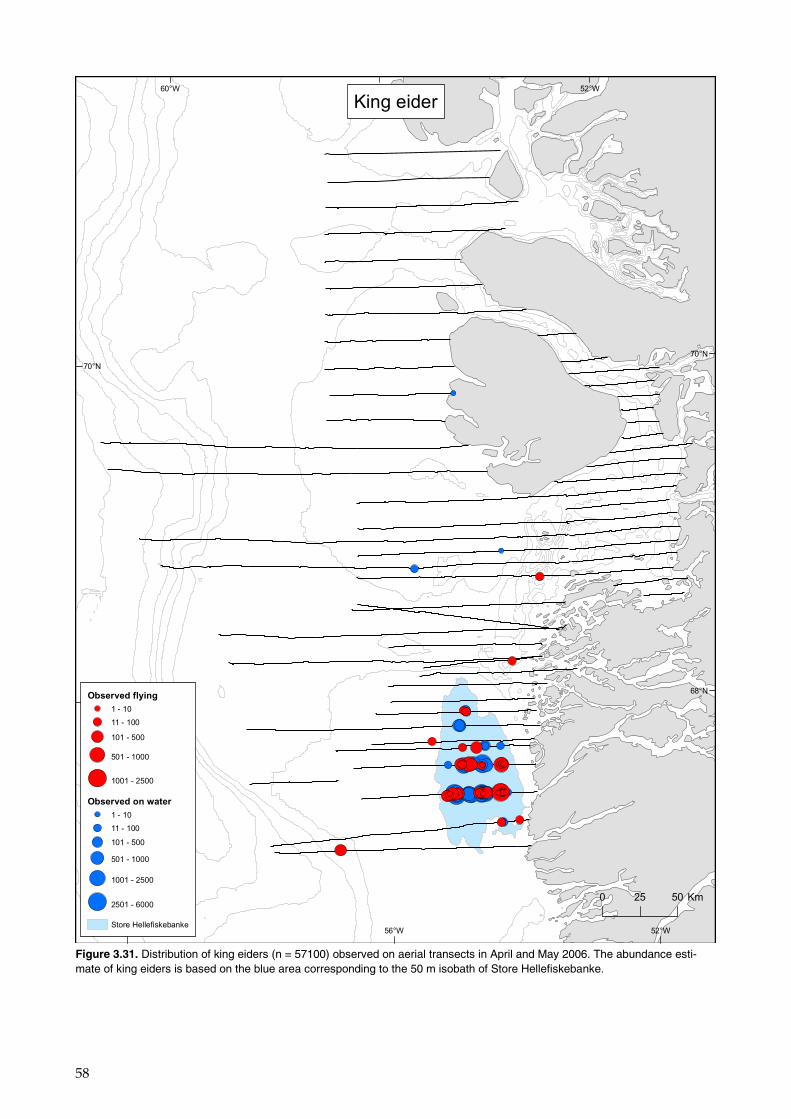
58
52°W
52°W
56°W
56°W
60°W
60°W
70°N
70°N
68°N
68°N
King eider
Observed flying
1 - 10
11 - 100
101 - 500
501 - 1000
1001 - 2500
Observed on water
1 - 10
11 - 100
101 - 500
501 - 1000
1001 - 2500
2501 - 6000
Store Hellefiskebanke
0 25 50 Km
Figure 3.31. Distribution of king eiders (n = 57100) observed on aerial transects in April and May 2006. The abundance esti-mate of king eiders is based on the blue area corresponding to the 50 m isobath of Store Hellefiskebanke.
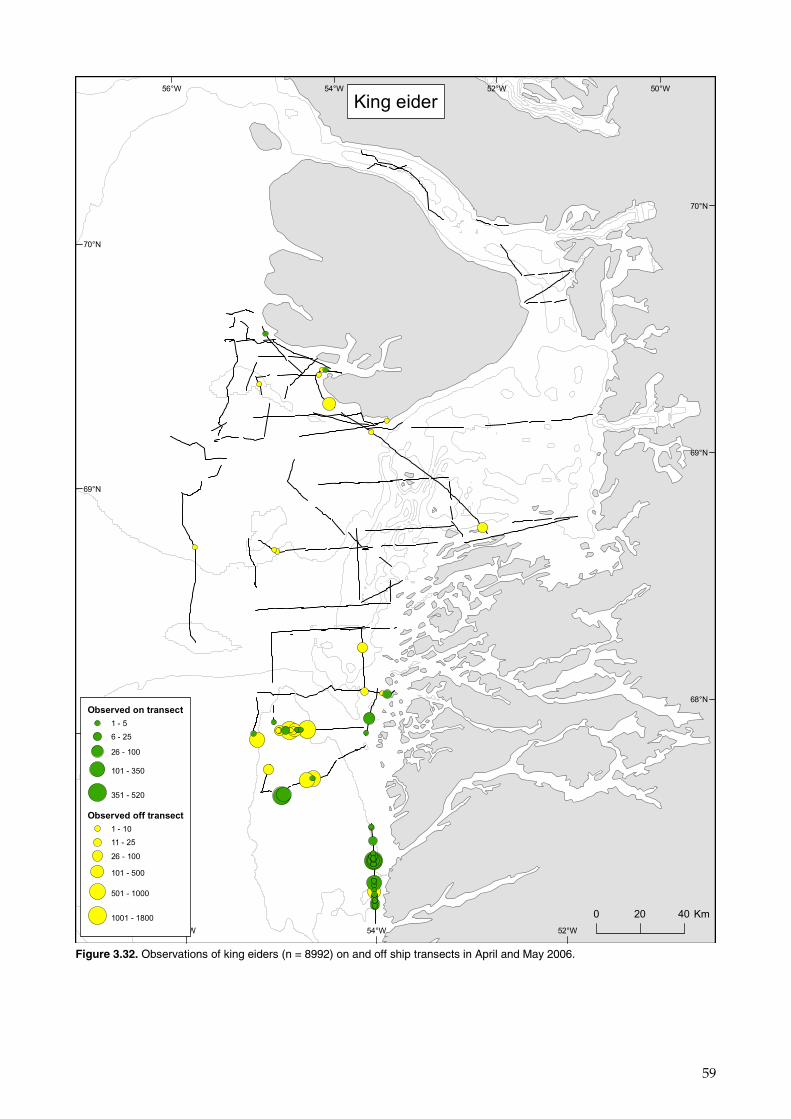
59
50°W
52°W
52°W
54°W
54°W
56°W
56°W
70°N
70°N
69°N
69°N
68°N
68°N
King eider
Observed on transect
1 - 5
6 - 25
26 - 100
101 - 350
351 - 520
Observed off transect
1 - 10
11 - 25
26 - 100
101 - 500
501 - 1000
1001 - 1800 0 20 40 Km
Figure 3.32. Observations of king eiders (n = 8992) on and off ship transects in April and May 2006.
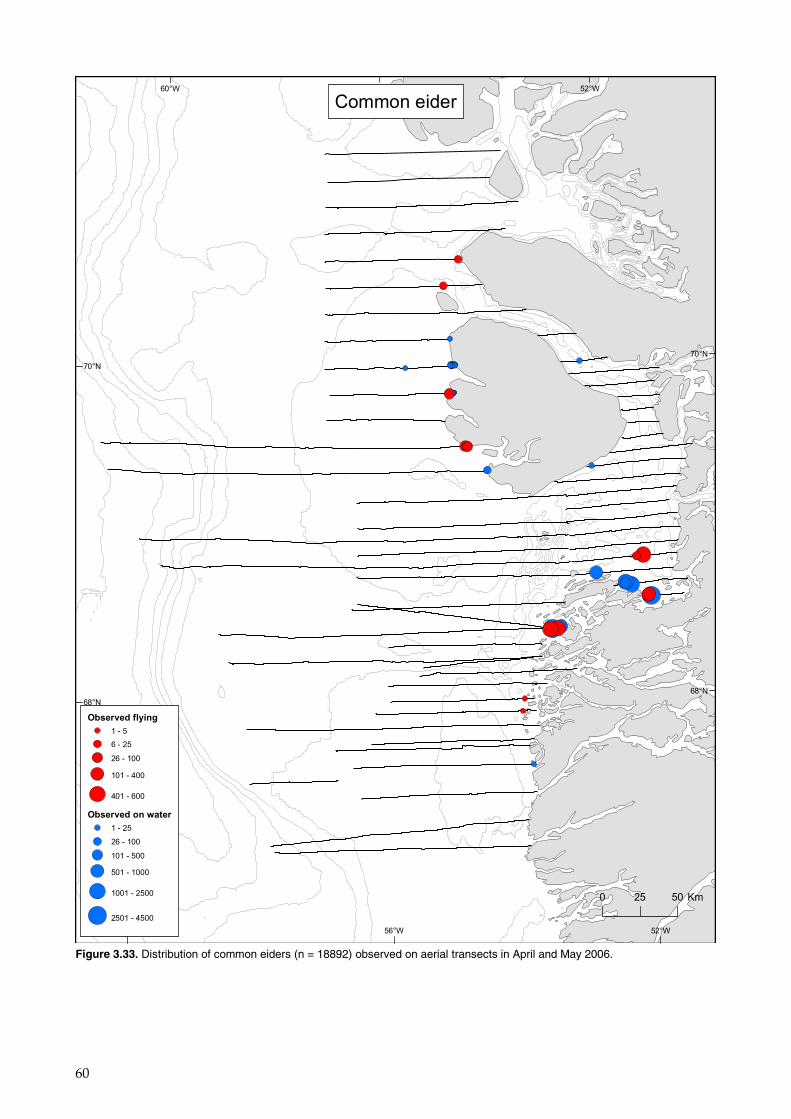
60
52°W
52°W
56°W
56°W
60°W
60°W
70°N
70°N
68°N
68°N
Common eider
Observed flying
1 - 5
6 - 25
26 - 100
101 - 400
401 - 600
Observed on water
1 - 25
26 - 100
101 - 500
501 - 1000
1001 - 2500
2501 - 4500
0 25 50 Km
Figure 3.33. Distribution of common eiders (n = 18892) observed on aerial transects in April and May 2006.

61
50°W
52°W
52°W
54°W
54°W
56°W
56°W
70°N
70°N
69°N
69°N
68°N
68°N
Common eider
Observed on transect
1
2 - 20
21 - 50
51 - 100
2000
Observed off transect
1 - 20
21 - 60
61 - 100
101 - 200
201 - 400 0 20 40 Km
Figure 3.34. Observations of common eiders (n = 4483) on and off ship transects in April and May 2006.
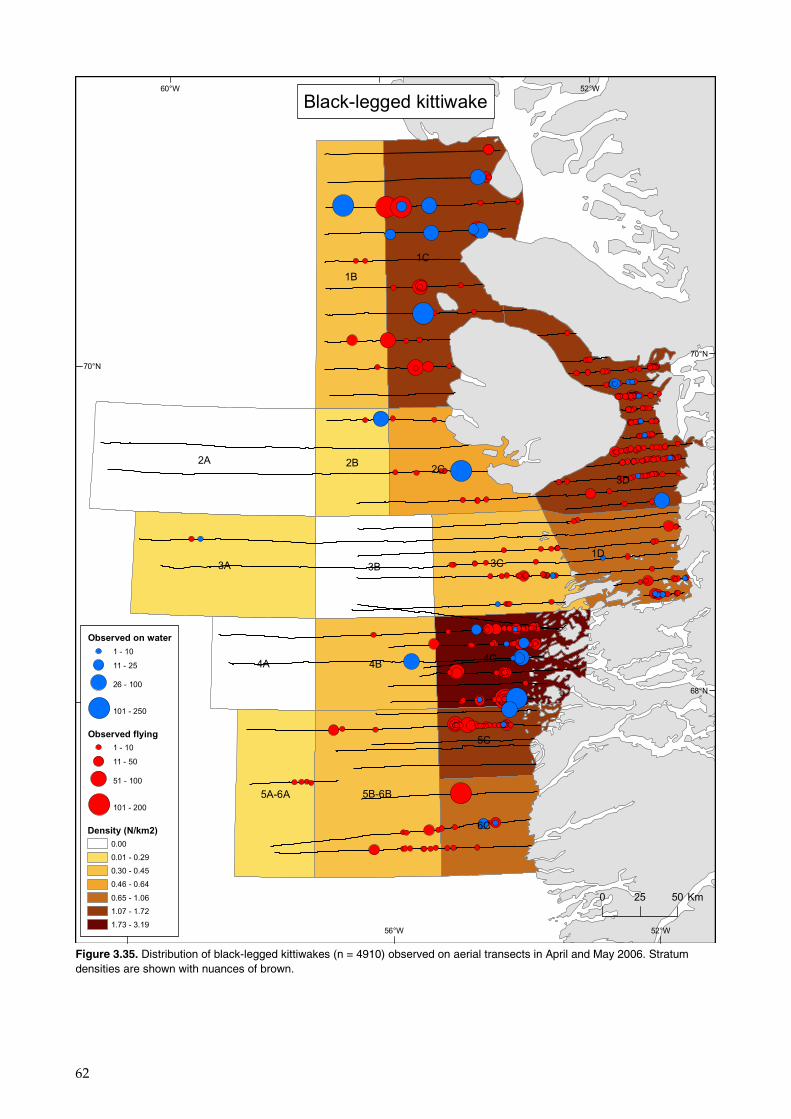
62
1C
2A
3A
1B
3D
3C
4C
3B
4B
2C
1D
4A
5B-6B
6C
2B
5C
5A-6A
52°W
52°W
56°W
56°W
60°W
60°W
70°N
70°N
68°N
68°N
Black-legged kittiwake
Observed on water
1 - 10
11 - 25
26 - 100
101 - 250
Observed flying
1 - 10
11 - 50
51 - 100
101 - 200
Density (N/km2)
0.00
0.01 - 0.29
0.30 - 0.45
0.46 - 0.64
0.65 - 1.06
1.07 - 1.72
1.73 - 3.19
0 25 50 Km
Figure 3.35. Distribution of black-legged kittiwakes (n = 4910) observed on aerial transects in April and May 2006. Stratum densities are shown with nuances of brown.
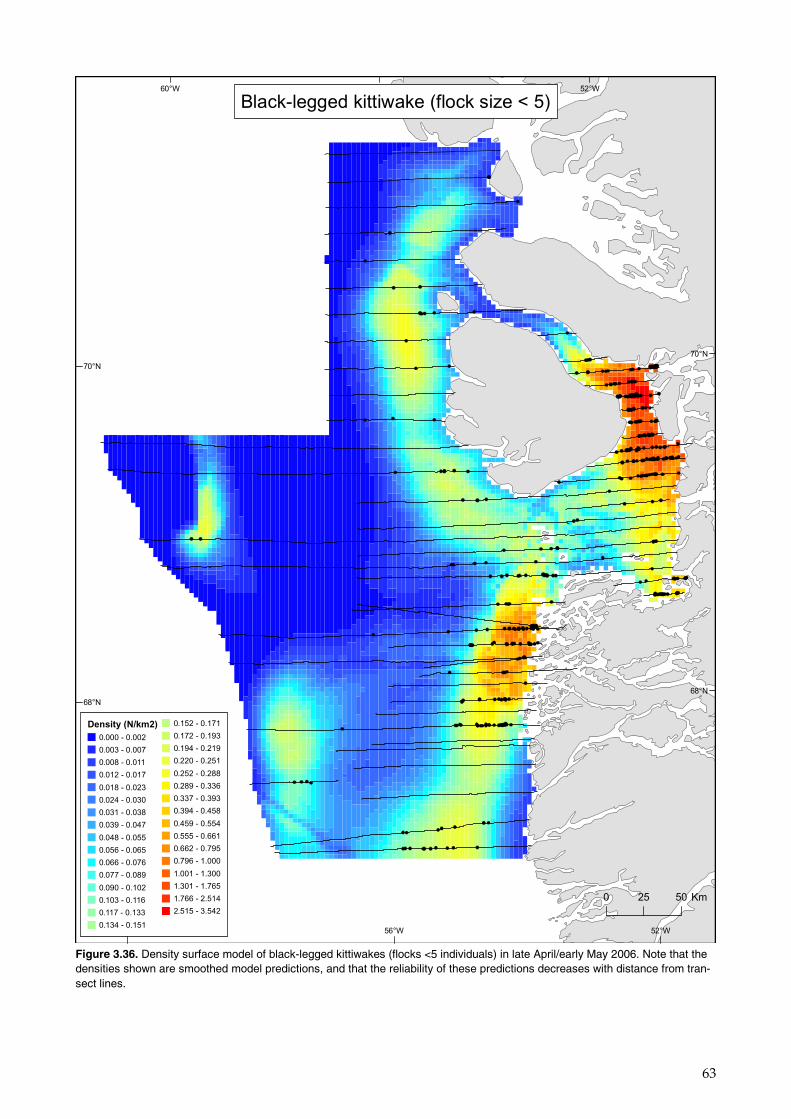
63
52°W
52°W
56°W
56°W
60°W
60°W
70°N
70°N
68°N
68°N
Black-legged kittiwake (flock size < 5)
Density (N/km2)
0.000 - 0.002
0.003 - 0.007
0.008 - 0.011
0.012 - 0.017
0.018 - 0.023
0.024 - 0.030
0.031 - 0.038
0.039 - 0.047
0.048 - 0.055
0.056 - 0.065
0.066 - 0.076
0.077 - 0.089
0.090 - 0.102
0.103 - 0.116
0.117 - 0.133
0.134 - 0.151
0.152 - 0.171
0.172 - 0.193
0.194 - 0.219
0.220 - 0.251
0.252 - 0.288
0.289 - 0.336
0.337 - 0.393
0.394 - 0.458
0.459 - 0.554
0.555 - 0.661
0.662 - 0.795
0.796 - 1.000
1.001 - 1.300
1.301 - 1.765
1.766 - 2.514
2.515 - 3.542
0 25 50 Km
Figure 3.36. Density surface model of black-legged kittiwakes (flocks <5 individuals) in late April/early May 2006. Note that the densities shown are smoothed model predictions, and that the reliability of these predictions decreases with distance from tran-sect lines.

64
52°W
52°W
56°W
56°W
60°W
60°W
70°N
70°N
68°N
68°N
Black-legged kittiwake (flock size > 4)
Density (N/km2)
0.000 - 0.015
0.016 - 0.048
0.049 - 0.084
0.085 - 0.119
0.120 - 0.159
0.160 - 0.212
0.213 - 0.277
0.278 - 0.346
0.347 - 0.422
0.423 - 0.508
0.509 - 0.609
0.610 - 0.734
0.735 - 0.872
0.873 - 1.023
1.024 - 1.181
1.182 - 1.354
1.355 - 1.552
1.553 - 1.770
1.771 - 2.000
2.001 - 2.238
2.239 - 2.490
2.491 - 2.773
2.774 - 3.096
3.097 - 3.483
3.484 - 3.949
3.950 - 4.483
4.484 - 5.134
5.135 - 6.186
6.187 - 7.578
7.579 - 9.140
9.141 - 10.614
10.615 - 12.427
0 25 50 Km
Figure 3.37. Density surface model of black-legged kittiwakes (flocks >4 individuals) in late April/early May 2006. Note that the densities shown are smoothed model predictions, and that the reliability of these predictions decreases with distance from tran-sect lines.

65
50°W
52°W
52°W
54°W
54°W
56°W
56°W
70°N
70°N
69°N
69°N
68°N
68°N
Black-legged kittiwake
Observed on water
1
2
3 - 5
6 - 10
11 - 17
Observed flying
1
2 - 3
4 - 5
6 - 15
16 - 63 0 20 40 Km
Figure 3.38. Observations of black-legged kittiwakes (n = 280) on ship transects in April and May 2006.

66
1C
2A
3A
1B
3D
3C
4C
3B
4B
2C
1D
4A
5B-6B
6C
2B
5C
5A-6A
52°W
52°W
56°W
56°W
60°W
60°W
70°N
70°N
68°N
68°N
Thick-billed murre
Observed on water
1 - 10
11 - 50
51 - 250
251 - 500
501 - 1200
Observed flying
1 - 10
11 - 25
26 - 50
51 - 100
Density (N/km2)
0.44 - 1.04
1.05 - 1.98
1.99 - 2.87
2.88 - 5.16
5.17 - 6.84
6.85 - 22.53
0 25 50 Km
Figure 3.39. Distribution of thick-billed murres (n = 34150) observed on aerial transects in April and May 2006. Densities calcu-lated in each of the 18 strata and shown in nuances of brown.

67
52°W
52°W
56°W
56°W
60°W
60°W
70°N
70°N
68°N
68°N
Thick-billed murre
Density (N/km2)
0.00 - 0.17
0.18 - 0.37
0.38 - 0.60
0.61 - 0.83
0.84 - 1.07
1.08 - 1.30
1.31 - 1.53
1.54 - 1.76
1.77 - 2.01
2.02 - 2.29
2.30 - 2.62
2.63 - 2.95
2.96 - 3.29
3.30 - 3.64
3.65 - 4.04
4.05 - 4.49
4.50 - 5.01
5.02 - 5.60
5.61 - 6.27
6.28 - 7.03
7.04 - 7.88
7.89 - 8.84
8.85 - 9.91
9.92 - 11.18
11.19 - 12.99
13.00 - 15.34
15.35 - 18.18
18.19 - 22.09
22.10 - 30.90
30.91 - 40.71
40.72 - 52.89
52.90 - 68.21
0 25 50 Km
Figure 3.40. Density surface model of thick-billed murres in late April/early May 2006. Note that the densities shown are smoothed model predictions, and that the reliability of these predictions decreases with distance from transect lines.
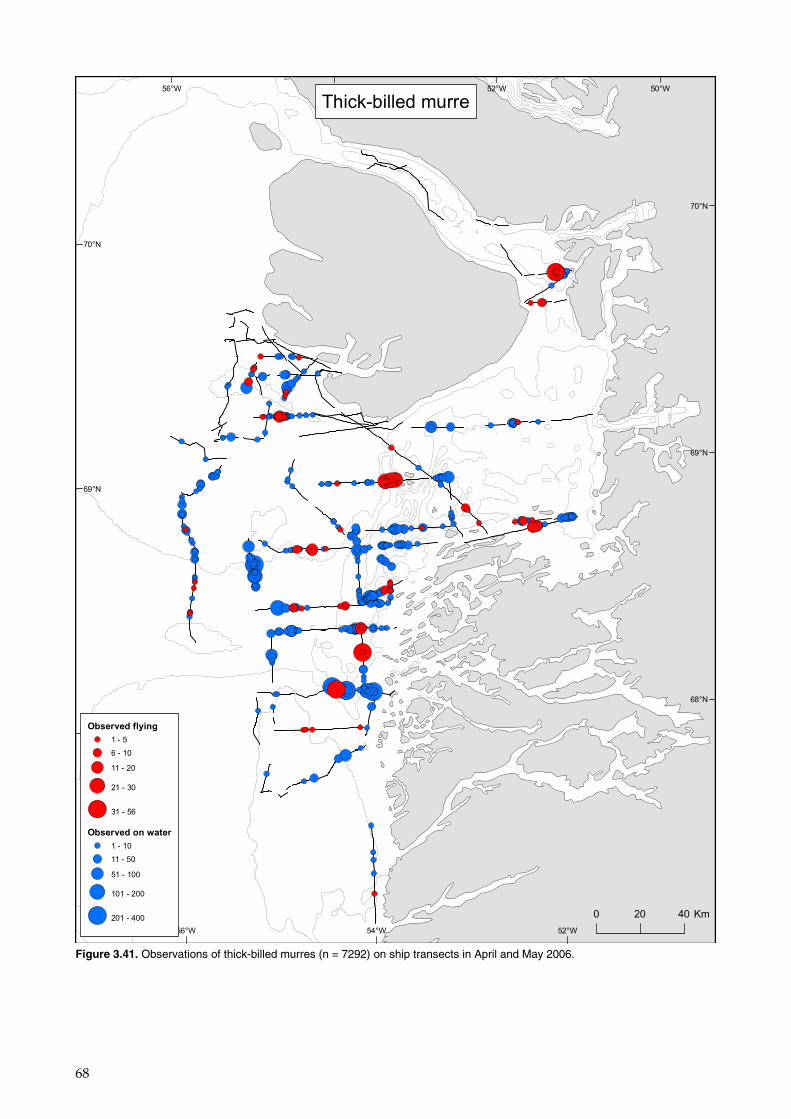
68
50°W
52°W
52°W
54°W
54°W
56°W
56°W
70°N
70°N
69°N
69°N
68°N
68°N
Thick-billed murre
Observed flying
1 - 5
6 - 10
11 - 20
21 - 30
31 - 56
Observed on water
1 - 10
11 - 50
51 - 100
101 - 200
201 - 400 0 20 40 Km
Figure 3.41. Observations of thick-billed murres (n = 7292) on ship transects in April and May 2006.

69
1C
2A
3A
1B
3D
3C
4C
3B
4B
2C
1D
4A
5B-6B
6C
2B
5C
5A-6A
52°W
52°W
56°W
56°W
60°W
60°W
70°N
70°N
68°N
68°N
Black guillemot
Observed on water
1 - 10
11 - 50
51 - 100
101 - 300
Observed flying
1 - 5
6 - 30
31 - 75
76 - 150
Density (N/km2)
0.0000
0.0001 - 0.0742
0.0743 - 0.1195
0.1196 - 0.1582
0.1583 - 0.2848
0.2849 - 0.4225
0.4226 - 0.6189
0 25 50 Km
Figure 3.42. Distribution of black guillemots (n = 1889) observed on aerial transects in April and May 2006. Densities calculated in each of the 18 strata and shown in nuances of brown.
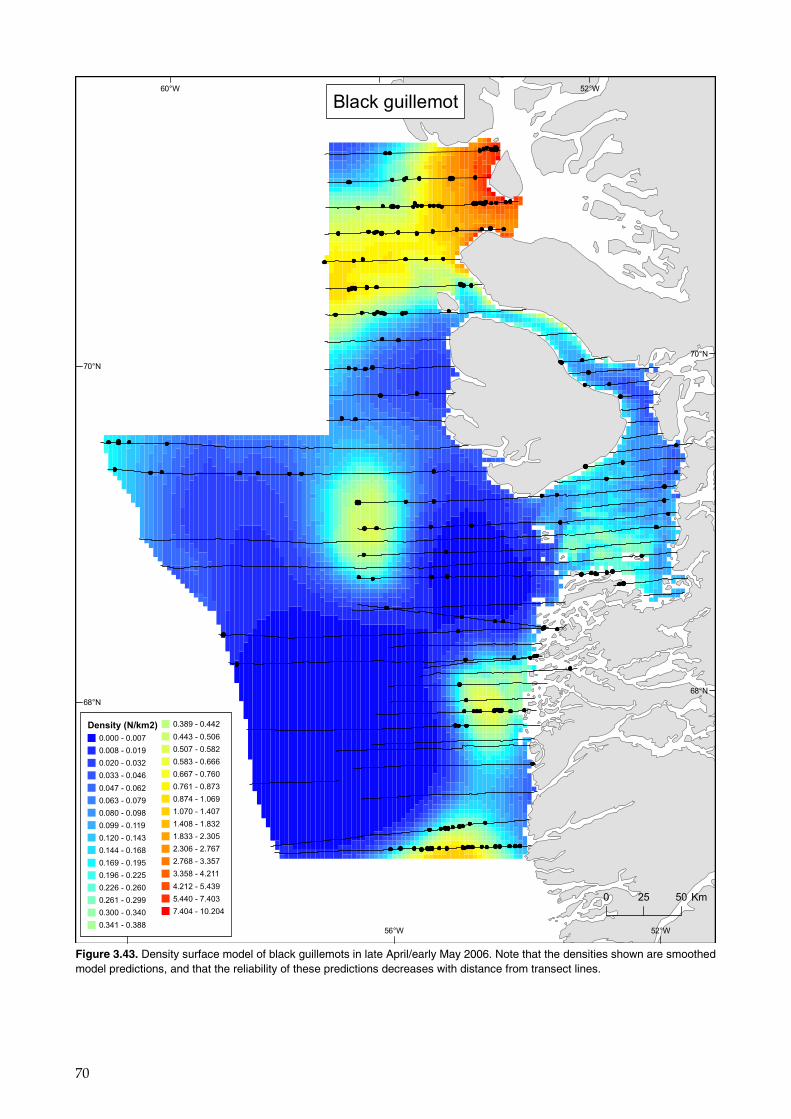
70
52°W
52°W
56°W
56°W
60°W
60°W
70°N
70°N
68°N
68°N
Black guillemot
Density (N/km2)
0.000 - 0.007
0.008 - 0.019
0.020 - 0.032
0.033 - 0.046
0.047 - 0.062
0.063 - 0.079
0.080 - 0.098
0.099 - 0.119
0.120 - 0.143
0.144 - 0.168
0.169 - 0.195
0.196 - 0.225
0.226 - 0.260
0.261 - 0.299
0.300 - 0.340
0.341 - 0.388
0.389 - 0.442
0.443 - 0.506
0.507 - 0.582
0.583 - 0.666
0.667 - 0.760
0.761 - 0.873
0.874 - 1.069
1.070 - 1.407
1.408 - 1.832
1.833 - 2.305
2.306 - 2.767
2.768 - 3.357
3.358 - 4.211
4.212 - 5.439
5.440 - 7.403
7.404 - 10.204
0 25 50 Km
Figure 3.43. Density surface model of black guillemots in late April/early May 2006. Note that the densities shown are smoothed model predictions, and that the reliability of these predictions decreases with distance from transect lines.

71
50°W
52°W
52°W
54°W
54°W
56°W
56°W
70°N
70°N
69°N
69°N
68°N
68°N
Black guillemot
Observed on water
1 - 2
3 - 5
6 - 15
16 - 50
51 - 150
Observed flying
1 - 2
3 - 4
5 - 8 0 20 40 Km
Figure 3.44. Observations of black guillemots (n = 692) on ship transects in April and May 2006.
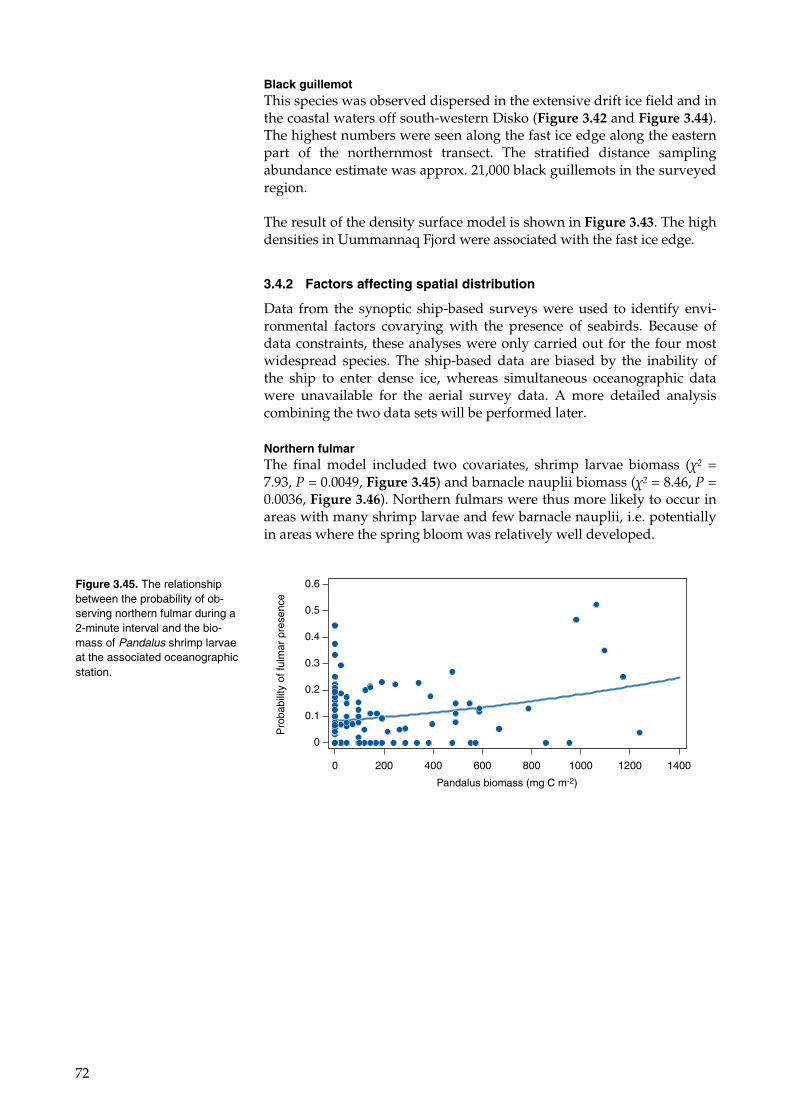
72
Black guillemot This species was observed dispersed in the extensive drift ice field and in the coastal waters off south-western Disko (Figure 3.42 and Figure 3.44). The highest numbers were seen along the fast ice edge along the eastern part of the northernmost transect. The stratified distance sampling abundance estimate was approx. 21,000 black guillemots in the surveyed region.
The result of the density surface model is shown in Figure 3.43. The high densities in Uummannaq Fjord were associated with the fast ice edge.
3.4.2 Factors affecting spatial distribution
Data from the synoptic ship-based surveys were used to identify envi-ronmental factors covarying with the presence of seabirds. Because of data constraints, these analyses were only carried out for the four most widespread species. The ship-based data are biased by the inability of the ship to enter dense ice, whereas simultaneous oceanographic data were unavailable for the aerial survey data. A more detailed analysis combining the two data sets will be performed later.
Northern fulmar The final model included two covariates, shrimp larvae biomass (χ2 = 7.93, P = 0.0049, Figure 3.45) and barnacle nauplii biomass (χ2 = 8.46, P = 0.0036, Figure 3.46). Northern fulmars were thus more likely to occur in areas with many shrimp larvae and few barnacle nauplii, i.e. potentially in areas where the spring bloom was relatively well developed.
Figure 3.45. The relationship between the probability of ob-serving northern fulmar during a 2-minute interval and the bio-mass of Pandalus shrimp larvae at the associated oceanographic station.
Pandalus biomass (mg C m-2)
0 200 400 600 800 1000 1200 1400
Pro
babi
lity
of fu
lmar
pre
senc
e
0
0.1
0.2
0.3
0.4
0.5
0.6

73
Black-legged kittiwake The final model included two covariates, mean ice concentration (χ2 = 4.98, P = 0.0257, Figure 3.47) and shrimp larvae biomass (χ2 = 5.79, P = 0.0161, Figure 3.48). Black-legged kittiwakes were thus more likely to oc-cur in areas with many shrimp larvae and little ice, i.e. potentially in ar-eas where the spring bloom was relatively well developed. However, these relationships were not very strong.
Figure 3.46. The relationship between the probability of ob-serving northern fulmar during a 2-minute interval and the bio-mass of barnacle nauplii at the associated oceanographic sta-tion.
Cirripedia biomass (mg C m-2)
Pro
babi
lity
of fu
lmar
pre
senc
e
0
0.1
0.2
0.3
0.4
0.5
0.6
0 1000 2000 3000 4000 5000
Figure 3.47. The relationship between the probability of ob-serving black-legged kittiwake during a 2-minute interval and the mean ice concentration at the associated oceanographic sta-tion.
0 2 4 6 8 10
Mean ice concentration
Pro
babi
lity
of k
ittiw
ake
pres
ence
0
0.05
0.10
0.15
0.20
0.25
0.30
Figure 3.48. The relationship between the probability of ob-serving black-legged kittiwake during a 2-minute interval and the biomass of Pandalus shrimp larvae at the associated oceano-graphic station.
Pro
babi
lity
of k
ittiw
ake
pres
ence
0
0.05
0.10
0.15
0.20
0.25
0.30
Pandalus biomass
0 200 400 600 800 1000 1200 1400

74
Thick-billed murre The final model included one covariate, depth (χ2 = 6.71, P = 0.0096, Fi-gure 3.49). Thick-billed murres thus tended to occur mainly in relatively deep areas, although there was much unexplained variation.
Black guillemot The final model included two covariates, Simpson index (χ2 = 5.49, P = 0.0192, Figure 3.50) and depth (χ2 = 36.49, P < 0.0001, Figure 3.51). Black guillemots thus strongly avoided deep areas and tended to occur where stratification was weak. Black guillemots are known to have two habi-tats: the shallow coastal waters where they forage on bottom-associated fauna, and (in winter) leads in dense ice where they forage on ice-associated fauna. Surprisingly, no association with ice cover was found here, and the reason is probably that the ship only marginally covered the habitat in dense ice. This bias will be corrected when we include ae-rial survey data in the analysis.
Figure 3.49. The relationship between the probability of ob-serving thick-billed murre during a 2-minute interval and depth at the associated oceanographic station.
Maximum depth (m)
0 200 400 600 800 1000
Pro
babi
lity
of g
uille
mot
pre
senc
e
0
0.1
0.2
0.3
0.4
0.5
0.6
0.7
Figure 3.50. The relationship between the probability of ob-serving black guillemot during a 2-minute interval and Simpson index at the associated oceano-graphic station.
0
0.1
0.2
0.3
0.4
0.5
Simpson index
0 100 200 300
Pro
babi
lity
of b
lack
gui
llem
ot p
rese
nce
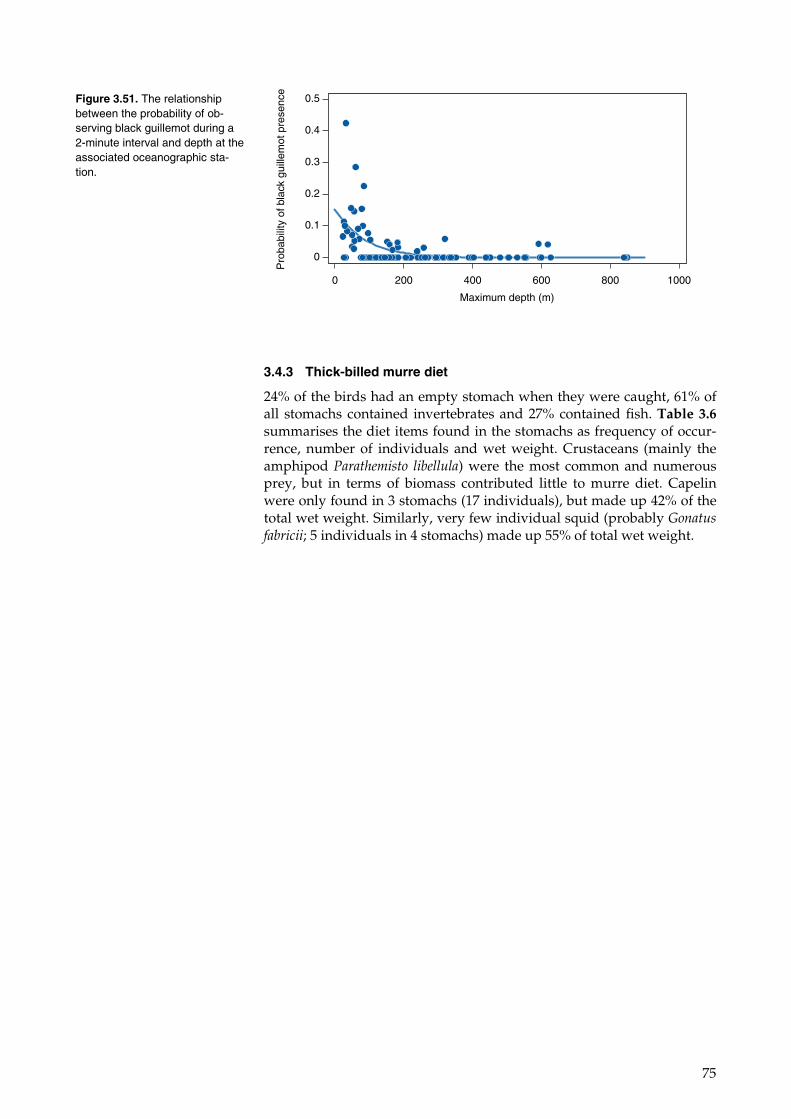
75
3.4.3 Thick-billed murre diet
24% of the birds had an empty stomach when they were caught, 61% of all stomachs contained invertebrates and 27% contained fish. Table 3.6 summarises the diet items found in the stomachs as frequency of occur-rence, number of individuals and wet weight. Crustaceans (mainly the amphipod Parathemisto libellula) were the most common and numerous prey, but in terms of biomass contributed little to murre diet. Capelin were only found in 3 stomachs (17 individuals), but made up 42% of the total wet weight. Similarly, very few individual squid (probably Gonatus fabricii; 5 individuals in 4 stomachs) made up 55% of total wet weight.
Figure 3.51. The relationship between the probability of ob-serving black guillemot during a 2-minute interval and depth at the associated oceanographic sta-tion.
0
0.1
0.2
0.3
0.4
0.5
Pro
babi
lity
of b
lack
gui
llem
ot p
rese
nce
Maximum depth (m)
0 200 400 600 800 1000
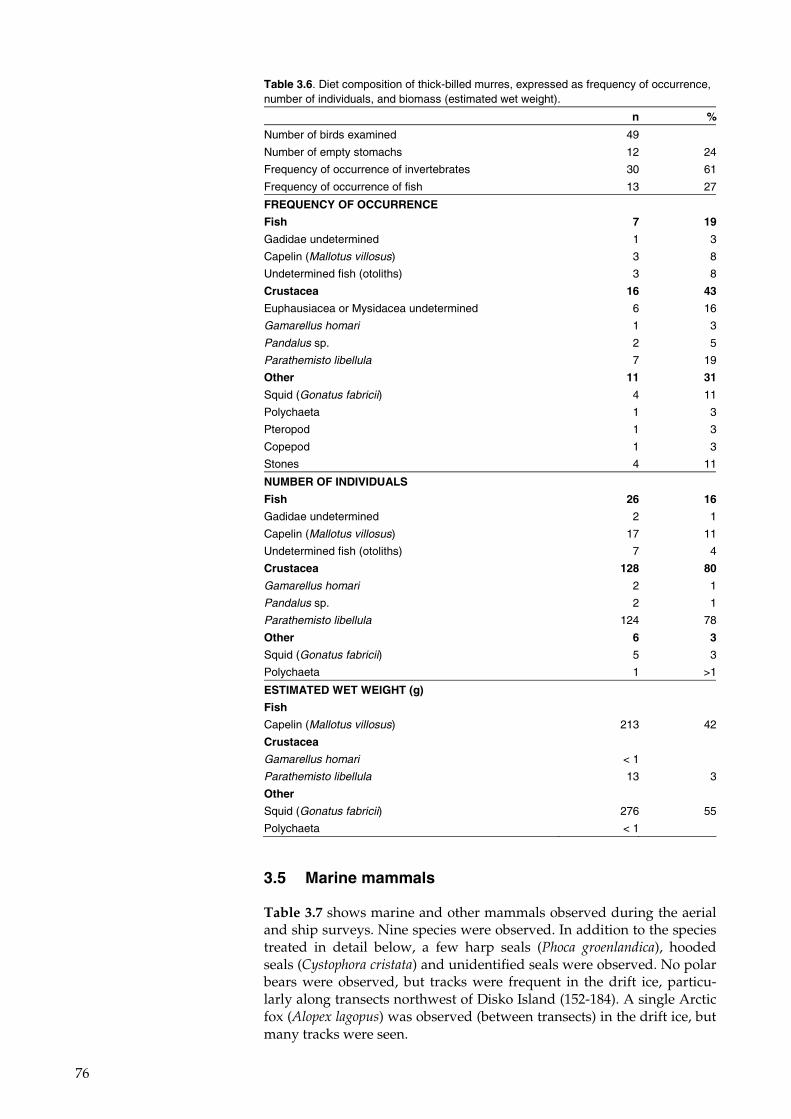
76
3.5 Marine mammals
Table 3.7 shows marine and other mammals observed during the aerial and ship surveys. Nine species were observed. In addition to the species treated in detail below, a few harp seals (Phoca groenlandica), hooded seals (Cystophora cristata) and unidentified seals were observed. No polar bears were observed, but tracks were frequent in the drift ice, particu-larly along transects northwest of Disko Island (152-184). A single Arctic fox (Alopex lagopus) was observed (between transects) in the drift ice, but many tracks were seen.
Table 3.6. Diet composition of thick-billed murres, expressed as frequency of occurrence, number of individuals, and biomass (estimated wet weight).
n %
Number of birds examined 49
Number of empty stomachs 12 24
Frequency of occurrence of invertebrates 30 61
Frequency of occurrence of fish 13 27
FREQUENCY OF OCCURRENCE
Fish 7 19
Gadidae undetermined 1 3
Capelin (Mallotus villosus) 3 8
Undetermined fish (otoliths) 3 8
Crustacea 16 43
Euphausiacea or Mysidacea undetermined 6 16
Gamarellus homari 1 3
Pandalus sp. 2 5
Parathemisto libellula 7 19
Other 11 31
Squid (Gonatus fabricii) 4 11
Polychaeta 1 3
Pteropod 1 3
Copepod 1 3
Stones 4 11
NUMBER OF INDIVIDUALS
Fish 26 16
Gadidae undetermined 2 1
Capelin (Mallotus villosus) 17 11
Undetermined fish (otoliths) 7 4
Crustacea 128 80
Gamarellus homari 2 1
Pandalus sp. 2 1
Parathemisto libellula 124 78
Other 6 3
Squid (Gonatus fabricii) 5 3
Polychaeta 1 >1
ESTIMATED WET WEIGHT (g)
Fish
Capelin (Mallotus villosus) 213 42
Crustacea
Gamarellus homari < 1
Parathemisto libellula 13 3
Other
Squid (Gonatus fabricii) 276 55
Polychaeta < 1
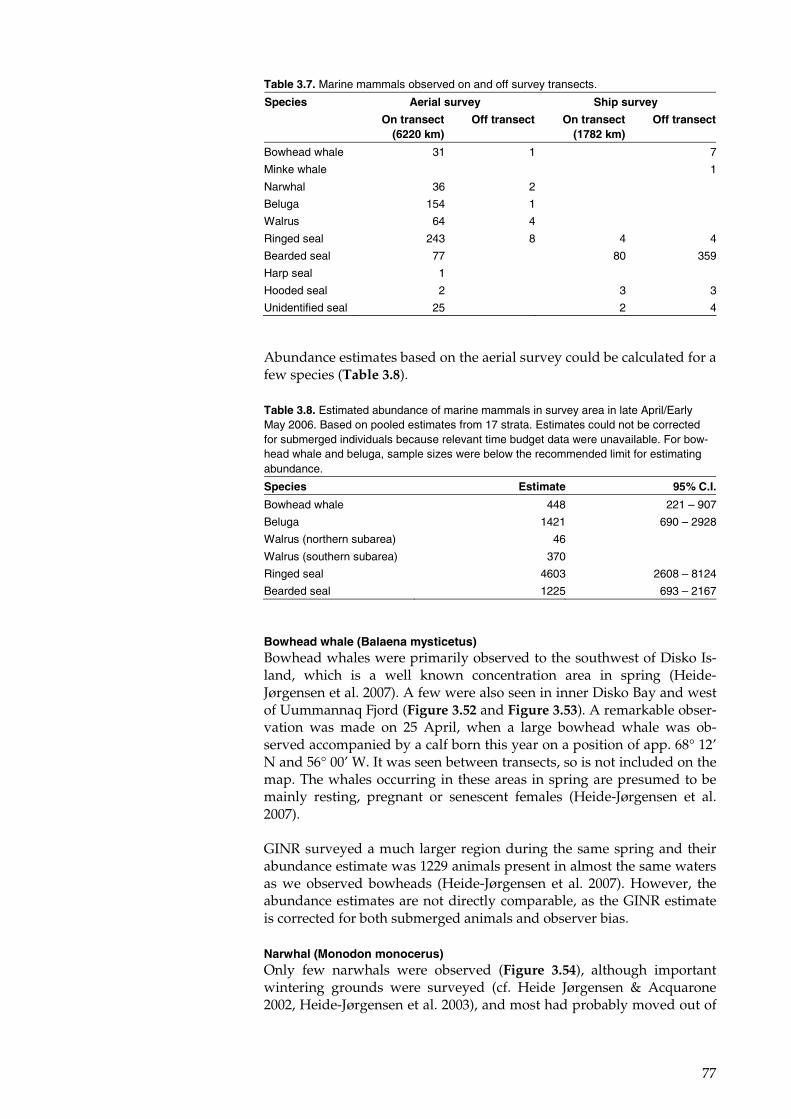
77
Abundance estimates based on the aerial survey could be calculated for a few species (Table 3.8).
Bowhead whale (Balaena mysticetus) Bowhead whales were primarily observed to the southwest of Disko Is-land, which is a well known concentration area in spring (Heide-Jørgensen et al. 2007). A few were also seen in inner Disko Bay and west of Uummannaq Fjord (Figure 3.52 and Figure 3.53). A remarkable obser-vation was made on 25 April, when a large bowhead whale was ob-served accompanied by a calf born this year on a position of app. 68° 12’ N and 56° 00’ W. It was seen between transects, so is not included on the map. The whales occurring in these areas in spring are presumed to be mainly resting, pregnant or senescent females (Heide-Jørgensen et al. 2007).
GINR surveyed a much larger region during the same spring and their abundance estimate was 1229 animals present in almost the same waters as we observed bowheads (Heide-Jørgensen et al. 2007). However, the abundance estimates are not directly comparable, as the GINR estimate is corrected for both submerged animals and observer bias.
Narwhal (Monodon monocerus) Only few narwhals were observed (Figure 3.54), although important wintering grounds were surveyed (cf. Heide Jørgensen & Acquarone 2002, Heide-Jørgensen et al. 2003), and most had probably moved out of
Table 3.7. Marine mammals observed on and off survey transects.
Aerial survey Ship survey Species
On transect(6220 km)
Off transect On transect (1782 km)
Off transect
Bowhead whale 31 1 7
Minke whale 1
Narwhal 36 2
Beluga 154 1
Walrus 64 4
Ringed seal 243 8 4 4
Bearded seal 77 80 359
Harp seal 1
Hooded seal 2 3 3
Unidentified seal 25 2 4
Table 3.8. Estimated abundance of marine mammals in survey area in late April/Early May 2006. Based on pooled estimates from 17 strata. Estimates could not be corrected for submerged individuals because relevant time budget data were unavailable. For bow-head whale and beluga, sample sizes were below the recommended limit for estimating abundance.
Species Estimate 95% C.I.
Bowhead whale 448 221 – 907
Beluga 1421 690 – 2928
Walrus (northern subarea) 46
Walrus (southern subarea) 370
Ringed seal 4603 2608 – 8124
Bearded seal 1225 693 – 2167
78
the region heading for their summering grounds. No abundance esti-mate was attempted for this species due to insufficient sample size.
Beluga (Delphinapterus leucas) Belugas were primarily observed on the north-eastern corner of Store Hellefiskebanke, which is a well-known upwelling area (Figure 3.55). A few were seen here and there in the marginal ice zone, and two single individuals were found far inside the drift ice near the Canadian border, perhaps whales which had initiated spring migration towards the Cana-dian summer grounds. Based on the observations, the abundance was es-timated at 1421 belugas in the whole study area. Regions 4C and 5C, which cover the northern part of Store Hellefiskebanke, were estimateed to contain 856 individuals.
Walrus (Odobenus rosmarus) In total 68 walruses were observed on transect. They were distributed be-tween two areas, both well known winter habitats for the species (Born et al. 1994). Most were observed on Store Hellefiskebanke and only a few off northwest Disko island (Figure 3.56). The abundance in these two ar-eas was calculated applying separate strata. 370 walruses were estimated to be present in the southern stratum on Store Hellefiskebanke and 46 in the northern (not corrected for submerged animals). GINR surveyed ma-rine mammals during the same season and estimated the total abun-dance between Nordre Strømfjord and Vaigat at 3100 individuals (cor-rected for submerged animals and observer bias) (Mosbech et al. 2007).
Ringed seal (Phoca hispida) This common seal occurred dispersed in the drift ice areas. The only ma-jor concentration was seen along the eastern part of the northernmost transect (184), where they were resting at breathing holes on the fast ice (Figure 3.57). The abundance in the entire survey area was estimated at 4600 individuals (not corrected for submerged animals).
Bearded seal (Erignathus barbatus) This species occurred dispersed in the drift ice, with some concentrations on the northern part of Store Hellefiskebanke (Figure 3.58 and Figure 3.59). This area is well known for its concentrations of bearded seals in winter (Boertmann et al. 1998). The abundance in the entire survey area was estimated at 1225 individuals (not corrected for submerged ani-mals).

79
1C
2A
3A
1B
3D
3C
4C
3B
4B
2C
1D
4A
5B-6B
6C
2B
5C
5A-6A
52°W
52°W
56°W
56°W
60°W
60°W
70°N
70°N
68°N
68°N
Bowhead whale
Observed on transect
1
2
Observed off transect
1
Density (N/km2)
0.0000
0.0001 - 0.0033
0.0034 - 0.0051
0.0052 - 0.0129
0.0130 - 0.0222
0 25 50 Km
Figure 3.52. Distribution of bowhead whales (n = 32) observed on and off aerial transects in April and May 2006. Densities calculated in each of the 18 strata and shown in nuances of brown.

80
50°W
52°W
52°W
54°W
54°W
56°W
56°W
70°N
70°N
69°N
69°N
68°N
68°N
Bowhead whale
Observed off transect
1
20 20 40 Km
Figure 3.53. Distribution of bowhead whales (n = 11) observed off ship transects in April and May 2006.
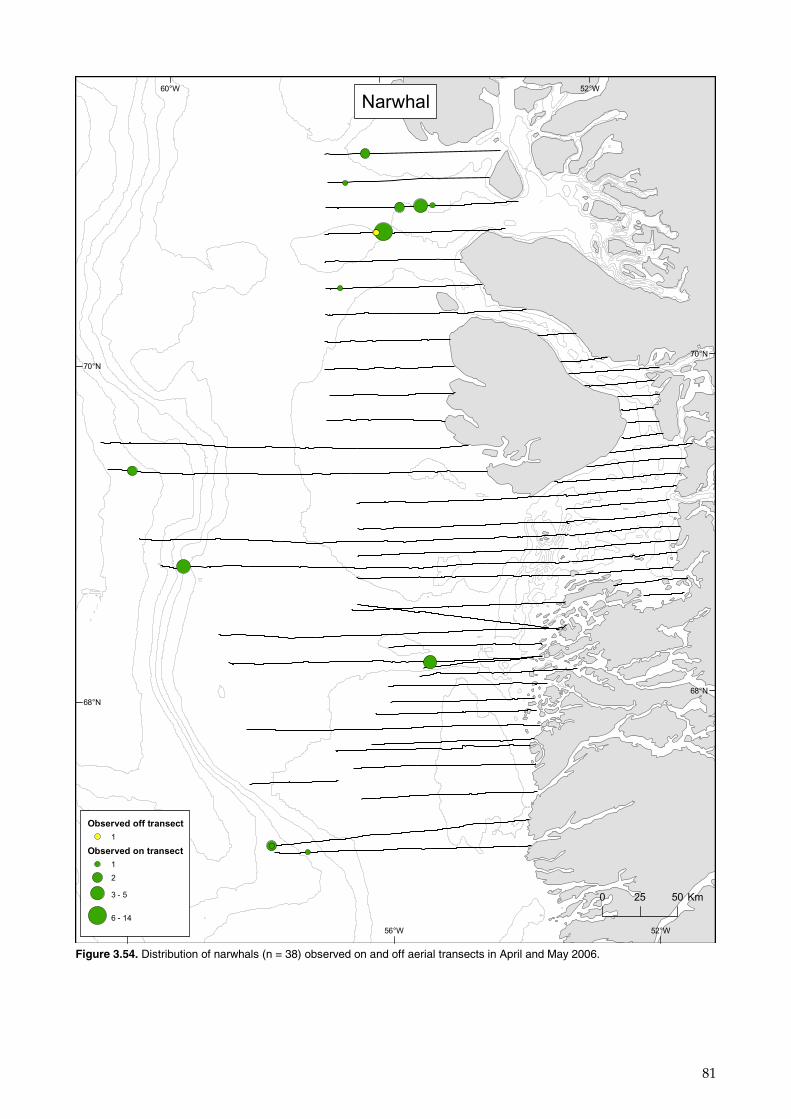
81
52°W
52°W
56°W
56°W
60°W
60°W
70°N
70°N
68°N
68°N
Narwhal
Observed off transect
1
Observed on transect
1
2
3 - 5
6 - 14
0 25 50 Km
Figure 3.54. Distribution of narwhals (n = 38) observed on and off aerial transects in April and May 2006.
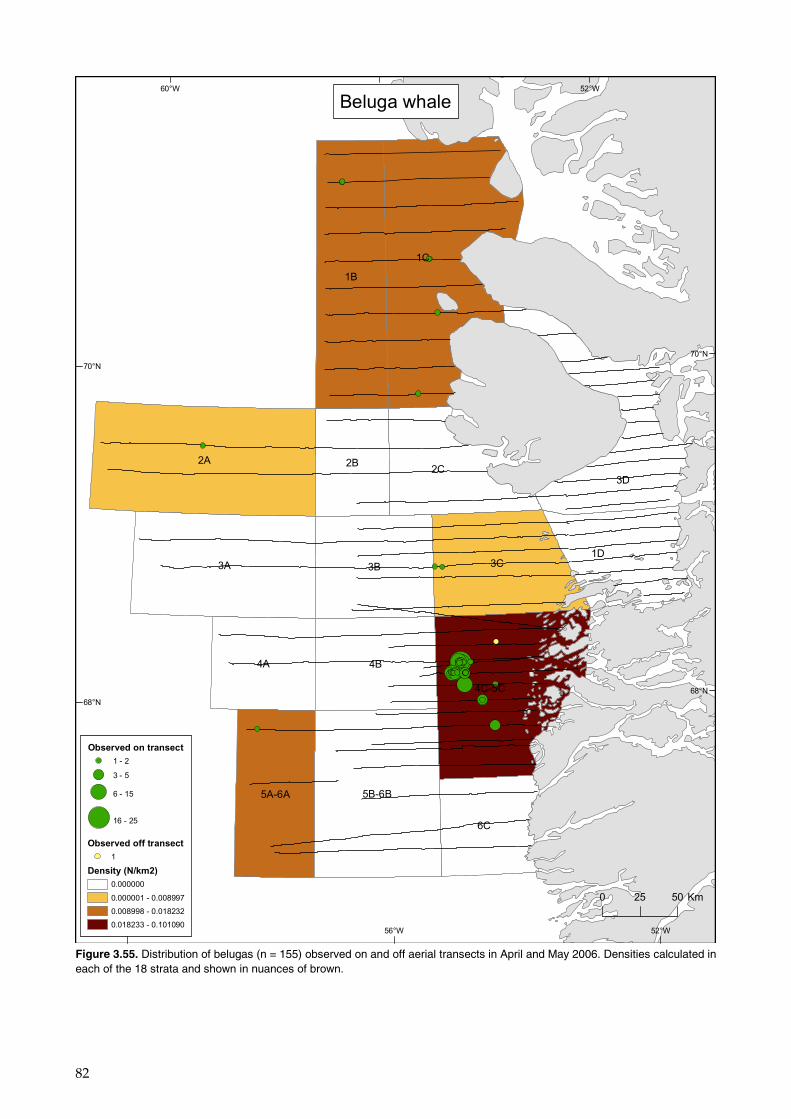
82
1C
2A
3A
1B
3D
3C3B
4B
2C
1D
4A
5B-6B
6C
4C-5C
2B
5A-6A
52°W
52°W
56°W
56°W
60°W
60°W
70°N
70°N
68°N
68°N
Beluga whale
Observed on transect
1 - 2
3 - 5
6 - 15
16 - 25
Observed off transect
1
Density (N/km2)
0.000000
0.000001 - 0.008997
0.008998 - 0.018232
0.018233 - 0.101090
0 25 50 Km
Figure 3.55. Distribution of belugas (n = 155) observed on and off aerial transects in April and May 2006. Densities calculated in each of the 18 strata and shown in nuances of brown.
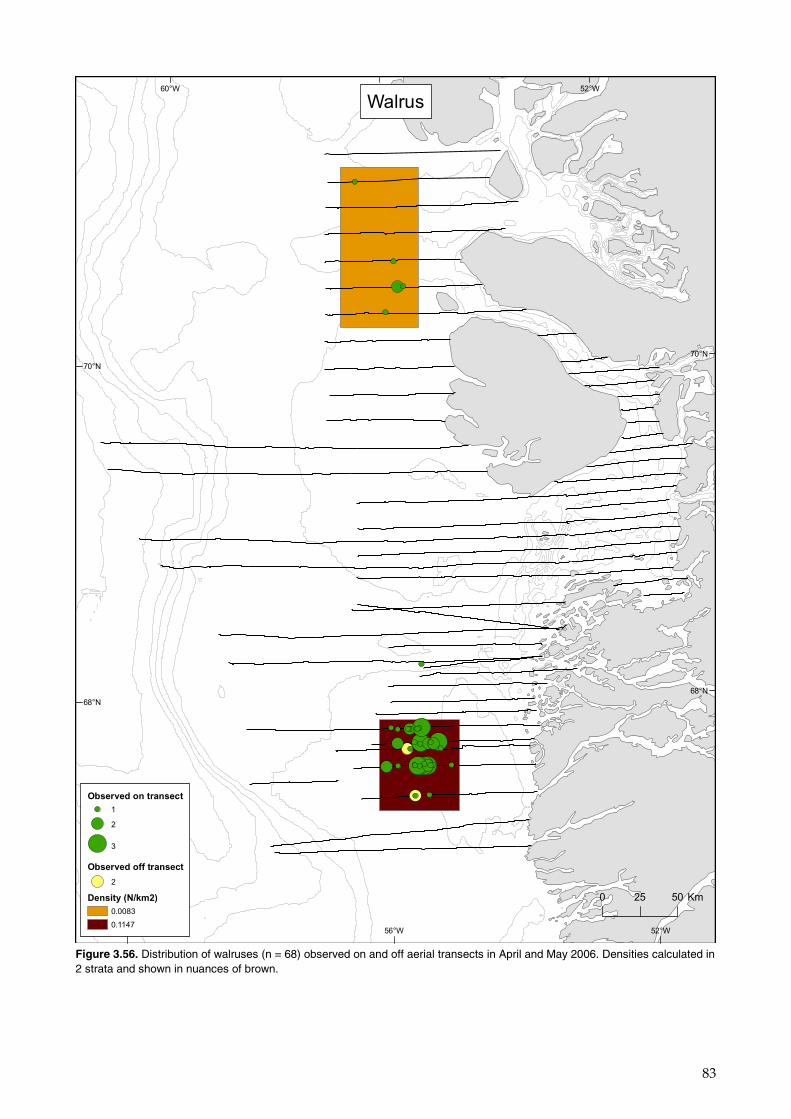
83
52°W
52°W
56°W
56°W
60°W
60°W
70°N
70°N
68°N
68°N
Walrus
Observed on transect
1
2
3
Observed off transect
2
Density (N/km2)
0.0083
0.1147
0 25 50 Km
Figure 3.56. Distribution of walruses (n = 68) observed on and off aerial transects in April and May 2006. Densities calculated in 2 strata and shown in nuances of brown.

84
1C
2A
3A
1B
3D
3C
4C
3B
4B
2C
1D
4A
5B-6B
6C
2B
5C
5A-6A
52°W
52°W
56°W
56°W
60°W
60°W
70°N
70°N
68°N
68°N
Ringed seal
Observed on transect
1
2 - 5
6 - 10
11 - 17
Observed off transect
1
2
Density (N/km2)
0.0000
0.0001 - 0.0059
0.0060 - 0.0094
0.0095 - 0.0122
0.0123 - 0.0271
0.0272 - 0.1308
0.1309 - 0.2057
0 25 50 Km
Figure 3.57. Distribution of ringed seals (n = 251) observed on and off aerial transects in April and May 2006. Densities calcu-lated in each of the 18 strata and shown in nuances of brown.
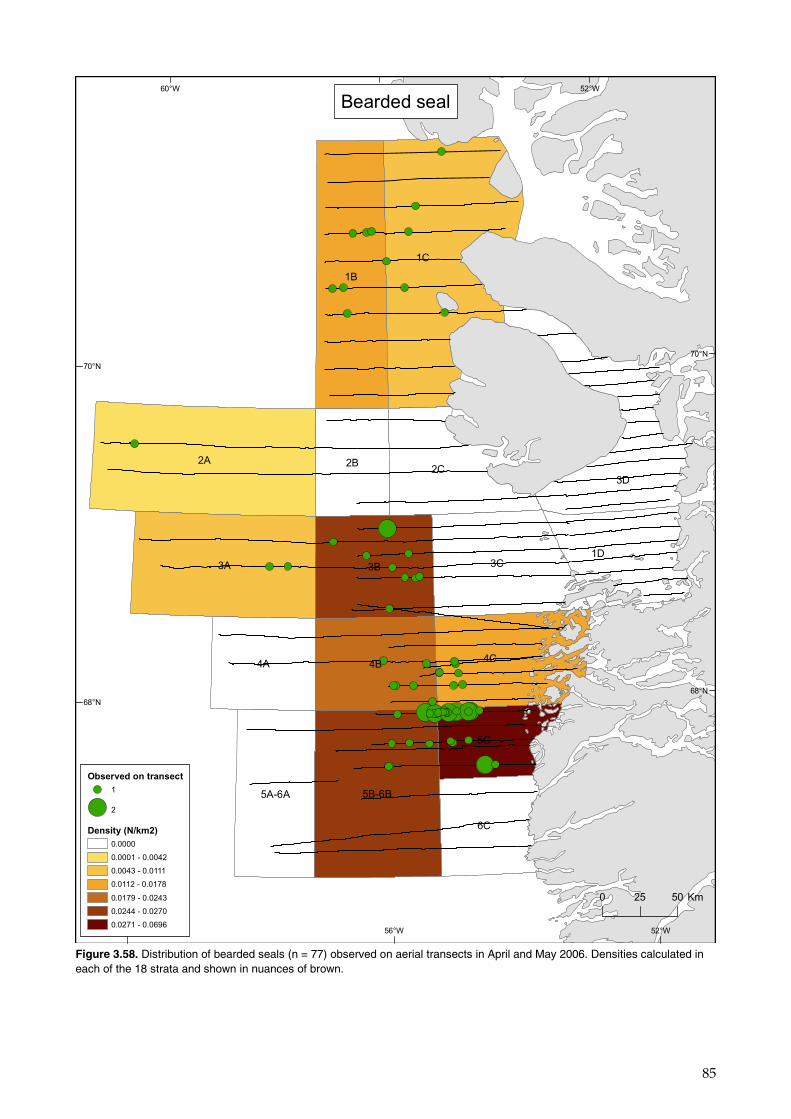
85
1C
2A
3A
1B
3D
3C
4C
3B
4B
2C
1D
4A
5B-6B
6C
2B
5C
5A-6A
52°W
52°W
56°W
56°W
60°W
60°W
70°N
70°N
68°N
68°N
Bearded seal
Observed on transect
1
2
Density (N/km2)
0.0000
0.0001 - 0.0042
0.0043 - 0.0111
0.0112 - 0.0178
0.0179 - 0.0243
0.0244 - 0.0270
0.0271 - 0.0696
0 25 50 Km
Figure 3.58. Distribution of bearded seals (n = 77) observed on aerial transects in April and May 2006. Densities calculated in each of the 18 strata and shown in nuances of brown.

86
50°W
52°W
52°W
54°W
54°W
56°W
56°W
70°N
70°N
69°N
69°N
68°N
68°N
Bearded seal
Observed on transect
1
2 - 5
6 - 10
11 - 15
16 - 19
Observed off transect
1
2 - 5
6 - 10
11 - 15
16 - 19 0 20 40 Km
Figure 3.59. Distribution of bearded seals (n = 439) observed on ship transects in April and May 2006.

87
4 Discussion and conclusions
4.1 The spring phytoplankton bloom
Based on the preliminary results from observations north of Store Helle-fiskebanke and the Disko Bay region from the period 18 April – 10 May, we conclude that there are at least two mechanisms for generating plank-ton in the region. In northern parts of Store Hellefiskebanke, the bloom starts earlier and is much stronger than observed elsewhere in the re-gion. The plankton bloom probably starts when there is sufficient light for plankton to grow. The shallow banks keep the phytoplankton in the in the photic zone where net growth is possible. Strong tidal mixing may also feed the upper layers with nutrients, which boosts the bloom even more. In Disko Bay and west of Disko Island, the plankton bloom starts when stratification is strong enough to keep the plankton in the upper photic parts of the water column. However, Söderkvist et al. (2006) showed that only a weak stratification is needed to initiate the plankton bloom, which was generated by upwelling of warmer and more salty water from below. The first analysis of the time series at the permanent station during spring 2006 showed that the concentration of chlorophyll increased during an upwelling event in late April. The signal was not as clear as in 1997 and 2005 though, and more analyses are needed to iden-tify the actual mechanism that initiated the plankton bloom in 2006. Ver-tical profiles of stratification and fluorescence along transects southwest of Disko Bay entrance do, however, illustrate the importance of vertical stratification for triggering plankton blooms.
4.2 Zooplankton distribution
The distribution pattern of the zooplankton was only weakly related to the water column structure and bloom development. In particular, it was unclear which factors were behind the large spatial variation in biomass of the quantitatively most important group, Calanus copepods, although biomass tended to be lower in areas where ice concentration was high. Calanus biomass was unusually low at Store Hellefiskebanke, perhaps because overwintering adults had not yet migrated into this relatively shallow area from deeper waters. Shrimp larvae also tended to be less abundant in areas with high ice concentrations, and showed a positive association with chlorophyll content, suggesting a link to a well-developed spring bloom. In contrast, barnacle nauplii strongly avoided stratified water and were common where ice concentration was high. In particular, they were extremely numerous at several shallow stations on Store Hellefiskebanke. This association with mixed waters and pre-bloom conditions may be explained by their benthic origin.
4.3 Seabird distribution
Seabird distribution is scale-dependent and patchy over a range of scales. At a regional scale (e.g. 300 km), it is evident from this and other
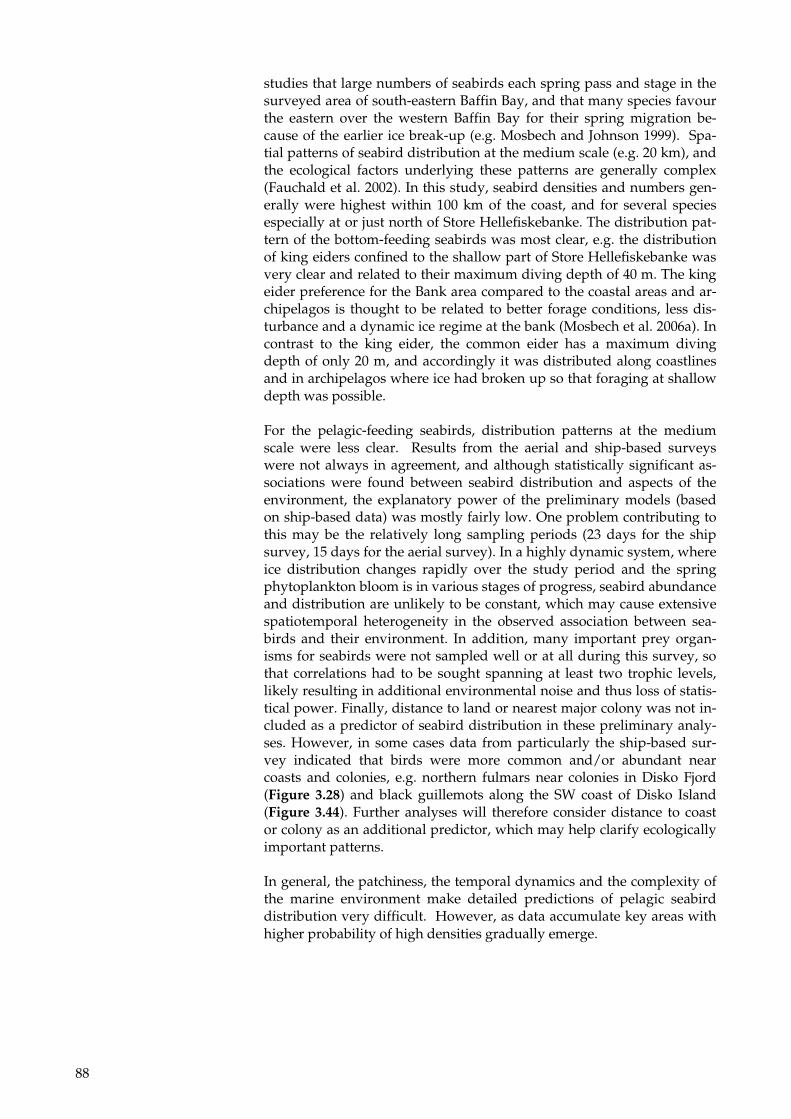
88
studies that large numbers of seabirds each spring pass and stage in the surveyed area of south-eastern Baffin Bay, and that many species favour the eastern over the western Baffin Bay for their spring migration be-cause of the earlier ice break-up (e.g. Mosbech and Johnson 1999). Spa-tial patterns of seabird distribution at the medium scale (e.g. 20 km), and the ecological factors underlying these patterns are generally complex (Fauchald et al. 2002). In this study, seabird densities and numbers gen-erally were highest within 100 km of the coast, and for several species especially at or just north of Store Hellefiskebanke. The distribution pat-tern of the bottom-feeding seabirds was most clear, e.g. the distribution of king eiders confined to the shallow part of Store Hellefiskebanke was very clear and related to their maximum diving depth of 40 m. The king eider preference for the Bank area compared to the coastal areas and ar-chipelagos is thought to be related to better forage conditions, less dis-turbance and a dynamic ice regime at the bank (Mosbech et al. 2006a). In contrast to the king eider, the common eider has a maximum diving depth of only 20 m, and accordingly it was distributed along coastlines and in archipelagos where ice had broken up so that foraging at shallow depth was possible.
For the pelagic-feeding seabirds, distribution patterns at the medium scale were less clear. Results from the aerial and ship-based surveys were not always in agreement, and although statistically significant as-sociations were found between seabird distribution and aspects of the environment, the explanatory power of the preliminary models (based on ship-based data) was mostly fairly low. One problem contributing to this may be the relatively long sampling periods (23 days for the ship survey, 15 days for the aerial survey). In a highly dynamic system, where ice distribution changes rapidly over the study period and the spring phytoplankton bloom is in various stages of progress, seabird abundance and distribution are unlikely to be constant, which may cause extensive spatiotemporal heterogeneity in the observed association between sea-birds and their environment. In addition, many important prey organ-isms for seabirds were not sampled well or at all during this survey, so that correlations had to be sought spanning at least two trophic levels, likely resulting in additional environmental noise and thus loss of statis-tical power. Finally, distance to land or nearest major colony was not in-cluded as a predictor of seabird distribution in these preliminary analy-ses. However, in some cases data from particularly the ship-based sur-vey indicated that birds were more common and/or abundant near coasts and colonies, e.g. northern fulmars near colonies in Disko Fjord (Figure 3.28) and black guillemots along the SW coast of Disko Island (Figure 3.44). Further analyses will therefore consider distance to coast or colony as an additional predictor, which may help clarify ecologically important patterns.
In general, the patchiness, the temporal dynamics and the complexity of the marine environment make detailed predictions of pelagic seabird distribution very difficult. However, as data accumulate key areas with higher probability of high densities gradually emerge.
89
4.4 Marine mammal distribution
Bowhead whale, beluga, walrus and bearded seal were all patchily dis-tributed with concentrations in areas previously known as aggregation areas for these species (Boertmann et al. 1998, Born et al. 1994, Heide-Jørgensen et al. 2007, Heide-Jørgensen & Acquarone 2002). Outside these aggregation areas, bowhead whales, walruses and bearded seals were found in low numbers in the northern part of the study area, and very few belugas were observed outside the concentration on Store Helle-fiskebanke. Narwhals had probably initiated their spring migration and many may have left the area as only few were observed. Ringed seals were more evenly distributed in low densities throughout the drift ice, and the higher densities observed in the northernmost part of the study area was the result of high numbers of seals on the fast ice edge south of Svartenhuk peninsula.
4.5 Thick-billed murre diet
The proportion of empty stomachs seemed high (24%) given that the birds were caught when they were supposed to be actively feeding or resting after a meal, particularly compared to 3% empty stomachs ob-tained by Falk & Durinck (1993) in the same area in winter. The fre-quency of occurrence of fish (mainly capelin) was also lower in this study (27%) than found by Falk & Durinck (1993) (70%). These results suggest that birds found it difficult to catch large and energy-rich fish and instead had to resort to presumably less profitable invertebrate prey.
90
5 References
Andersen, J., Markager, S.S. & Ærtebjerg, G. 2004: Tekniske anvisninger for marin overvågning. 2.2 Vandkemiske parametre. – NERI.
Bakken, V., Boertmann, D., Mosbech, A., Olsen, B., Petersen, A., Strøm, H. & Goodwin, H. 2006: Nordic seabird colony databases. – TemaNord 2006: 512: 1-96.
Boertmann, D. 2006: Optælling af ridekolonier i Disko Bugt, Arfersiorfik Fjord og Nordre Strømfjord. – Arbejdsrapport fra DMU, nr. 225.
Boertmann, D., Lyngs, P., Merkel, F. & Mosbech, A. 2004: The signifi-cance of Southwest Greenland as winter quarters for seabirds. – Bird Conservation International 14: 87-112.
Boertmann, D., Mosbech, A. & Johansen, P. 1998: A review of biological resources in West Greenland sensitive to oil spills during winter. – NERI Technical report No. 246.
Born, E. W., Heide-Jørgensen, M.P. & Davis, R.A. 1994: The Atlantic wal-rus (Odobenus rosmarus rosmarus) in West Greenland. – Meddelelser om Grønland, Bioscience 40: 1-33.
Bradstreet, M.S.W. 1976: Summer feeding of seabirds in eastern Lancas-ter Sound, 1976. – Unpubl. Rep. by LGL Ltd., Toronto, Ont., for Norlands Petroleums Ltd, 187 pp.
Buckland, S.T., Anderson, D.R., Burnham, K.P., Laake, J.L., Borchers, D.L. & Thomas, L. 2001: Introduction to Distance Sampling. Estimating abundance of biological populations. – Oxford University Press, Oxford, 432 pp.
Burnham, K.P. & Anderson, D.R. 2002: Model selection and multimodel inference: a practical information-theoretic approach. Second edition. – Springer, New York, 488 pp.
Camphuysen, C.J. & Garthe, S. 2001: Recording foraging seabirds at sea: standardised recording and coding of foraging behaviour and multi-species foraging associations. – NIOZ Internal Report, IMPRESS Report 2001-001. The Royal Netherlands Institute of Sea Research, Den Burg, Texel, The Netherlands.
Clarke, M. 1986: A handbook for the identification of Cephalopod beaks. – Clarendon Press, Oxford, 273 pp.
Falk, K. & Durinck, J. 1993: The winter diet of thick-billed murres, Uria lomvia, in western Greenland, 1988-1989. – Canadian Journal of Zoology 71: 264-272.

91
Falk, K. & Kampp, K. 1997: A manual for monitoring Thick-billed Murre populations in Greenland – Technical Report no. 7, Greenland Institute of Natural Resources.
Fauchald, P., Erikstad, K.E. & Systad, G.H. 2002: Seabirds and marine oil incidents: is it possible to predict the spatial distribution of pelagic sea-birds? – Journal of Applied Ecology 39: 349-360.
Gaston, A.J., Mallory, M., Gilchrist, H.G. & O’Donovan, K. 2006: Status, trends and attendance patterns of the northern fulmar Fulmarus glacialis in Nunavut Canada. – Arctic 59: 165-178.
Härkönen, T. 1986: Guide to the otoliths of the bony fishes of the North-east Atlantic. – Danbiu, Hellerup, 256 pp.
Hayward, P.J. & Ryland, J.S. 1995: Handbook of the marine fauna of North-West Europe. – Oxford University Press, Oxford, 800 pp.
Hedley, S.L. & Buckland, S.T. 2004: Spatial Models for Line Transect Sampling. – Journal of Agricultural, Biological, and Environmental Sta-tistics 9: 181-199.
Hedley, S.L., Buckland, S.T. & Borchers, D.L. 1999: Spatial modelling from line transect data. – Journal of Cetacean Research and Management 1: 255-264.
Hedley, S.L., Buckland, S.T. & Borchers, D.L. 2004: Spatial distance sam-pling models. – In Buckland, S.T., Anderson, D.R., Burnham, K.P., Laake, J.L., Borchers, D.L. & Thomas, L. (Eds): Advanced Distance Sampling. Estimating abundance of biological populations. Oxford University Press, Oxford, p. 48-70.
Heide-Jørgensen, M.P. & Acquarone, M. 2002: Size and trends of the bowhead whale, beluga and narwhal stocks wintering off West Greenland. – NAMMCO Scientific Publications 4: 191-210.
Heide-Jørgensen, M.P., Dietz, R., Laidre, K.L., Richard, P., Orr, J. & Schmidt, H.C. 2003: The migratory behaviour of narwhals (Monodon monoceros). – Can. J. Zool. 81: 1298-1305.
Heide-Jørgensen, M.P., Laidre, K., Borchers, D., Samarra, F. & Stern, H. 2007: Increasing abundance of bowhead whales in West Greenland. – Bi-ology Letters 3: 577-580.
Jespersen, A.M. & Christoffersen, K. 1987: Measurements of chlorophyll a from phytoplankton using ethanol as extraction solvent. – Archiv für Hydrobiologie 109: 445-454.
Keast, M.A. & Lawrence, M.J. 1990: A collection of Amphipoda from the Southern Beaufort Sea. – Canadian Data Report of Fisheries and Aquatic Sciences, 114 pp.
Komdeur, J., Bertelsen, J. & Cracknell, G. 1992: Manual for Aeroplane and Ship Surveys of Waterfowl and Seabirds. – IWRB Special Publica-tion, 19. Slimbridge, UK.
92
Mosbech, A., Boertmann, D. & Jespersen, M. 2007: Strategic Environ-mental Impact Assessment of hydrocarbon activities in the Disko West area. – NERI Technical Report no. 618. National Environmental Research Institute, University of Aarhus, 188 pp. http://www.dmu.dk/Pub/FR618.pdf
Mosbech, A., Danø, R.S., Merkel, F., Sonne, C., Gilchrist, G. & Flagstad, A. 2006a: Use of satellite telemetry to locate key habitats for king eiders Somateria spectabilis in West Greenland. – In: Boere, G.C., Galbraith, C.A. & Stroud, D.A. (Eds.): Waterbirds around the World. The Stationery Of-fice, Edinburgh, UK, pp. 769-776.
Mosbech, A., Gilchrist, G., Merkel, F., Sonne, C., Flagstad, A. & Nyegaard, H. 2006b: Year-round movements of Northern Common Ei-ders Somateria mollissima borealis breeding in Arctic Canada and West Greenland followed by satellite telemetry. – Ardea 94: 651-665.
Mosbech, A. & Johnson, S.R. 1999: Late winter distribution and abun-dance of sea-associated birds in south-western Greenland, the Davis Strait and southern Baffin Bay. – Polar Research 18: 1-17.
Nettleship, D.N. & Birkhead, T.R. 1985: The Atlantic Alcidae. – Academic Press, London, 574 pp.
Pedersen, S.A., Ribergaard, M. & Simonsen, C. 2005: Micro- and meso-plankton in Southwest Greenland waters in relation to environmental factors. – Journal of Marine Systems 56: 85-112.
Söderkvist, J., Nielsen, T.G. & Jespersen, M. 2006: Physical and biological oceanography in West Greenland waters with emphasis on shrimp and fish larvae distribution. – NERI Technical Report No. 581. National Envi-ronmental Research Institute, Denmark, 52 pp. http://technical-reports.dmu.dk
Strickland, J.D.H. & Parsons, T.R. 1972: A practical handbook of sea-water analysis. – Bulletin of the Fisheries Research Board of Canada 167: 1-310.
Thomas, L., Laake, J.L., Strindberg, S., Marques, F.F.C., Buckland, S.T., Borchers, D.L., Anderson, D.R., Burnham, K.P., Hedley, S.L., Pollard, J.H., Bishop, J.R.B. and Marques, T.A. 2006a. Distance 5.0 release 2. Re-search Unit for Wildlife Population Assessment, University of St. An-drews, UK. http://www.ruwpa.st-and.ac.uk/distance/
Thomas, L., Laake, J.L., Rexstad, E., Strindberg, S., Marques, F.F.C., Buckland, S.T., Borchers, D.L., Anderson, D.R., Burnham, K.P., Burt, M.L., Hedley, S.L., Pollard, J.H., Bishop, J.R.B. and Marques, T.A. (2006b): Distance 6.0 release beta 3. Research Unit for Wildlife Population Assessment, University of St. Andrews, UK. http://www.ruwpa.st-and.ac.uk/distance/
National Environmental Research Institute, NERI, is a part of
University of Aarhus.
NERI’s tasks are primarily to conduct research, collect data, and give advice
on problems related to the environment and nature.
At NERI’s website www.neri.dk you’ll fi nd information regarding ongoing research and development projects.
Furthermore the website contains a database of publications including scientifi c articles, reports, conference contributions etc. produced by NERI staff members.
National Environmental Research InstituteDanmarks Miljøundersøgelser
NERIDMU
Further information: www.neri.dk
National Environmental Research Institute Management Frederiksborgvej 399 Personnel and Economy Secretariat PO Box 358 Monitoring, Advice and Research Secretariat DK-4000 Roskilde Department of Policy Analysis Denmark Department of Atmospheric Environ ment Tel: +45 4630 1200 Department of Marine Ecology Fax: +45 4630 1114 Department of Environmental Chemistry and Microbiology Department of Arctic Environment
National Environmental Research Institute Monitoring, Advice and Research Secretariat Vejlsøvej 25 Department of Marine Ecology PO Box 314 Department of Terrestrial Ecology DK-8600 Silkeborg Department of Freshwater Ecology Denmark Tel: +45 8920 1400 Fax: +45 8920 1414
National Environmental Research Institute Department of Wildlife Ecology and Biodiversity Grenåvej 14, Kalø DK-8410 Rønde Denmark Tel: +45 8920 1700 Fax: +45 8920 1514
NERI Technical Reports
NERI’s website www.neri.dk contains a list of all published technical reports along with other NERI publications. All recent reports can be downloaded in electronic format (pdf) without charge. Some of the Danish reports include an English summary.
Nr./No. 2008
687 Udsætning af gråænder I Danmark og påvirkning af søers fosforindhold. Af Noer, H., Søndergaard, M. & Jørgensen, T.B. 43 s.
686 Danish emission inventories for road transport and other mobile sources. Inventories until year 2006. By Winther, M. 217 pp.
684 Environmental monitoring at the lead-zinc mine in Maarmorilik, Northwest Greenland, in 2007.By Johansen, P., Asmund, G., Riget, F. & Johansen, K. 54 pp.
682 Arealanvendelse i Danmark siden slutningen af 1800-tallet. Af Levin, G. & Normander, B. 44 s.
681 The Danish Air Quality Monitoring Programme. Annual Summary for 2007. By Kemp, K. et al. 47 pp.
680 Skarver og fi sk i Ringkøbing og Nissum Fjorde. En undersøgelse af skarvers prædation og effekter af skarvregulering 2002-2007. Af Bregnballe, T. & Groos, J.I. (red.) 123 s. (also available in print edition)
679 Økologisk risikovurdering af genmodifi cerede planter i 2007. Rapport over behandlede forsøgsudsætninger og markedsføringssager. Af Kjellsson, G., Damgaard, C., Strandberg, M. & Simonsen, V. 31 s.
677 Modellering af dioxindeposition i Danmark. Af Hansen, K.M. & Christensen, J.H. 27 s.
676 Fodring af kortnæbbede gæs om foråret i Vestjylland. Biologiske fakta til understøttelse af fremtidig forvaltningsstrategi. Af Madsen, J. 20 s.
675 Annual Danish Emission Inventory Report to UNECE. Inventories from the base year of the protocols to year 2006. By Nielsen, O.-K. et al. 504 pp.
674 Environmental monitoring at the cryolite mine in Ivittuut, Spouth Greenland, in 2007. By Johansen, P. et al. 31 pp.
673 Kvælstofbelastning af naturområder i Østjylland. Opgørelse for udvalgte Natura 2000 områder. Af Frohn, L.M., Geels, C., Madsen, P.V. & Hertel, O. 48 s.
672 Revised emission factors for gas engines including start/stop emissions. Sub-report 3 (NERI). By Nielsen, M., Illerup, J.B. & Birr-Petersen, K. 67 pp.
671 DEVANO. Decentral Vand- og Naturovervågning. Programbeskrivelse 2008. Af Boutrup, S. & Jensen, P.N. (red.). 33 s.
670 Prioriteringsmetoder i forvaltningen af Habitatdirektivets naturtyper og arter i Natura 2000-områder. Af Skov, F. et al. 36 s.
669 Identifi kation af referencevandløb til implementering af vandrammedirektivet i Danmark. Af Kristensen, E.A. et al. 55 s.
668 Brændefyring i hjemmet – praksis, holdninger og regulering. Af Petersen, L.K. & Martinsen, L. 48 s.
667 Denmark’s National Inventory Report 2008. Emission Inventories 1990-2006 – Submitted under the United Nations Framework Convention on Climate Change. By Nielsen, O.-K. et al. 701 pp.
666 Agerhønens biologi og bestandsregulering. En gennemgang af den nuværende viden. Af Kahlert, T., Asferg, T. & Odderskær, P. 61 s.
665 Individual traffi c-related air pollution and new onset adult asthma. A GIS-based pilot study. By Hansen, C.L. et al. 23 pp.
664 Aluminiumsmelter og vandkraft i det centrale Grønland. Datagrundlag for natur og ressourceudnyttelse i forbindelse med udarbejdelse af en Strategisk Miljøvurdering (SMV). Af Johansen, P. et al. 110 s.
663 Tools to assess conservation status on open water reefs in Nature-2000 areas. By Dahl, K. & Carstensen, J. 25 pp.
662 Environmental monitoring at the Nalunaq Gold Mine, South Greenland, 2007. By Glahder, C.M., Asmund, G. & Riget, F. 31 pp.
661 Tilstandsvurdering af levesteder for arter. Af Søgaard, B. et al. 72 s.
660 Opdatering af vurdering af anvendelse af SCR-katalysatorer på tunge køretøjer som virkemiddel til nedbringelse af NO2 forureningen i de største danske byer. Af Ketzel, M. & Palmgren, F. 37 s.

[Blank page]

National Environmental Research Institute ISBN 978-87-7073-071-6University of Aarhus . Denmark ISSN 1600-0048
This report describes the results of a coordinated aerial and ship-based survey of seabirds, marine mammals, and physical and biological oceno-graphy in the Disko Bay and southeastern Baffi n Bay in spring 2006. The main aim of the survey was to improve understanding of how top predators exploit the highly dynamic marginal ice zone during spring, when the ice is rapidly melting. The spatial distributions of primary pro-duction, zooplankton, seabirds and marine mammals are described, and preliminary results are presented from analyses aimed at understanding these distributions. Zooplankton biomass was dominated by Calanus copepods, shrimp larvae and barnacle nauplii, and the distribution of all three groups was related to ice concentration. The study area was esti-mated to be used by approx 1 million seabirds, including 430,000 thick-billed murres and 400,000 king eiders. King eiders were concentrated on the shallow Store Hellefi skebanke, whereas the distribution of most other seabirds was only weakly related to the physical and biological variables measured. Abundance of marine mammals was also estimated, including 1400 belugas and 450 bowhead whales.
694 Life in
the m
argin
al ice zon
e
Related Documents