This statistical report describes variation in life expectancy estimates for areas within Scotland for the period 2014-2016. It further breaks down the national life expectancy estimates (published on 27 September 2017) by council area, NHS health board and Scottish Parliamentary constituency, and also by deprivation and urban rural areas. Life expectancy for areas within Scotland 2014-2016 Published on 7 December 2017

Welcome message from author
This document is posted to help you gain knowledge. Please leave a comment to let me know what you think about it! Share it to your friends and learn new things together.
Transcript
OFFICIAL-SENSITIVE UNTIL 09:30 7 December 2017 - PRE-RELEASE STATISTICS
This statistical report describes variation in life
expectancy estimates for areas within Scotland for
the period 2014-2016. It further breaks down the
national life expectancy estimates (published on 27
September 2017) by council area, NHS health
board and Scottish Parliamentary constituency, and
also by deprivation and urban rural areas.
Life expectancy for areas
within Scotland 2014-2016
Published on 7 December 2017

2 © Crown Copyright 2017
3 © Crown Copyright 2017
4 © Crown Copyright 2017
Contents
Main points............................................................................................................ 6
1. Introduction....................................................................................................... 7
2. Life expectancy at birth in Scotland…………………………………………......... 7
3. Scottish life expectancy in a European context……………………………......... 8
4. Life expectancy at birth in Scottish council areas…………………………......... 9
5. Life expectancy at 65-69 in Scottish council areas……………………...…..... 12
6. Life expectancy at birth in NHS boards……………………………………….... 13
7. Life expectancy at birth in Scottish Parliamentary constituencies…………….14
8. Life expectancy at birth by deprivation............................................................ 15
9. Life expectancy at birth by deprivation and council area................................ 16
10. Life expectancy at birth by urban-rural classification.................................... 17
11. Further Information....................................................................................... 18
List of Figures and Tables
Figure 1: Life expectancy at birth, Scotland, 1980-1982 to 2014-2016 (males and
females)
Figure 2a: Life expectancy at birth in European Union countries, 1980-1982 to
2014-2016 (males)
Figure 2b: Life expectancy at birth in European Union countries, 1980-1982 to
2014-2016 (females)
Table 1: Change in life expectancy at birth and age 65-69, 2004-2006 to 2014-
2016, by council area (males and females)
Figure 3: Life expectancy at birth, 95 per cent confidence intervals for council
areas, 2014-2016 (males and females)
Table 2: Number of people expected to live until age 90 or older by council area,
2014-2016 (males and females)
Figure 4: Life expectancy at birth, 95 per cent confidence intervals for NHS board
areas, 2014-2016 (males and females)
Figure 5a: Scottish Parliamentary constituencies with the five highest and lowest
life expectancy at birth, 2014-2016 (males)

5 © Crown Copyright 2017
Figure 5b: Scottish Parliamentary constituencies with the five highest and lowest
life expectancy at birth, 2014-2016 (females)
Figure 6: Life expectancy at birth in Scotland, 2014-2016, by SIMD quintiles
(males and females)
Figure 7: Life expectancy at birth in Scotland, 2014-2016, by urban-rural
classification (males and females)
6 © Crown Copyright 2017
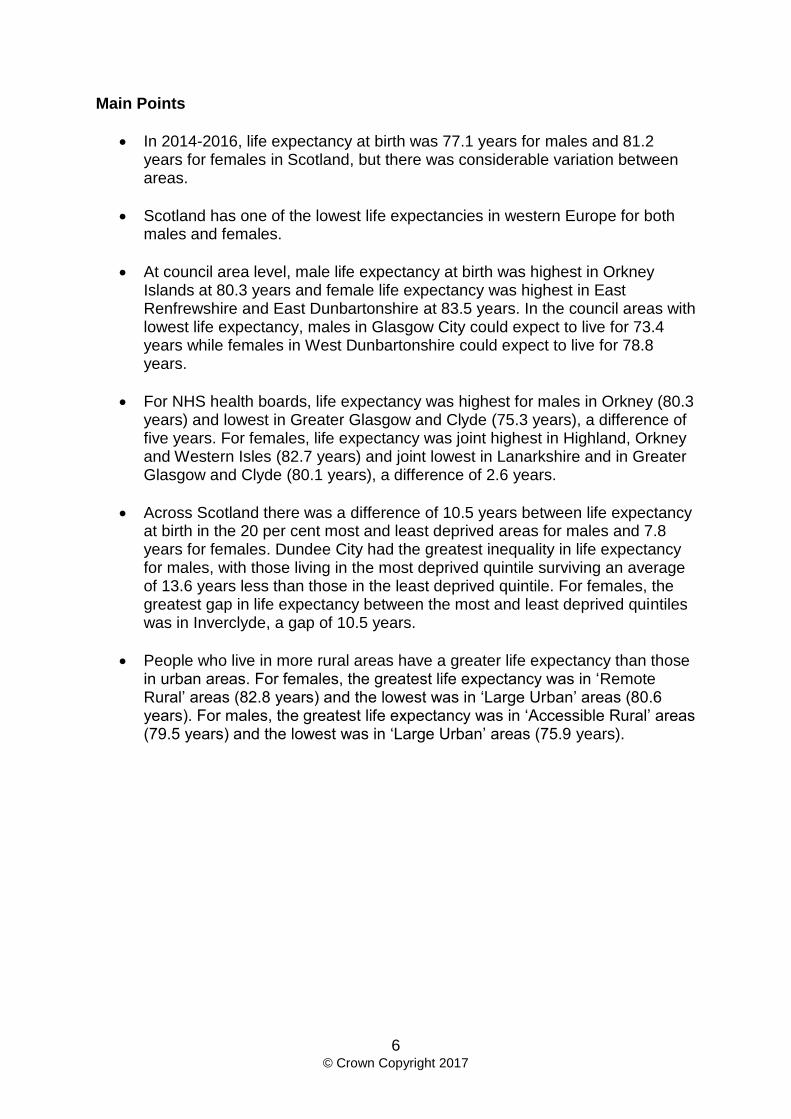
Main Points
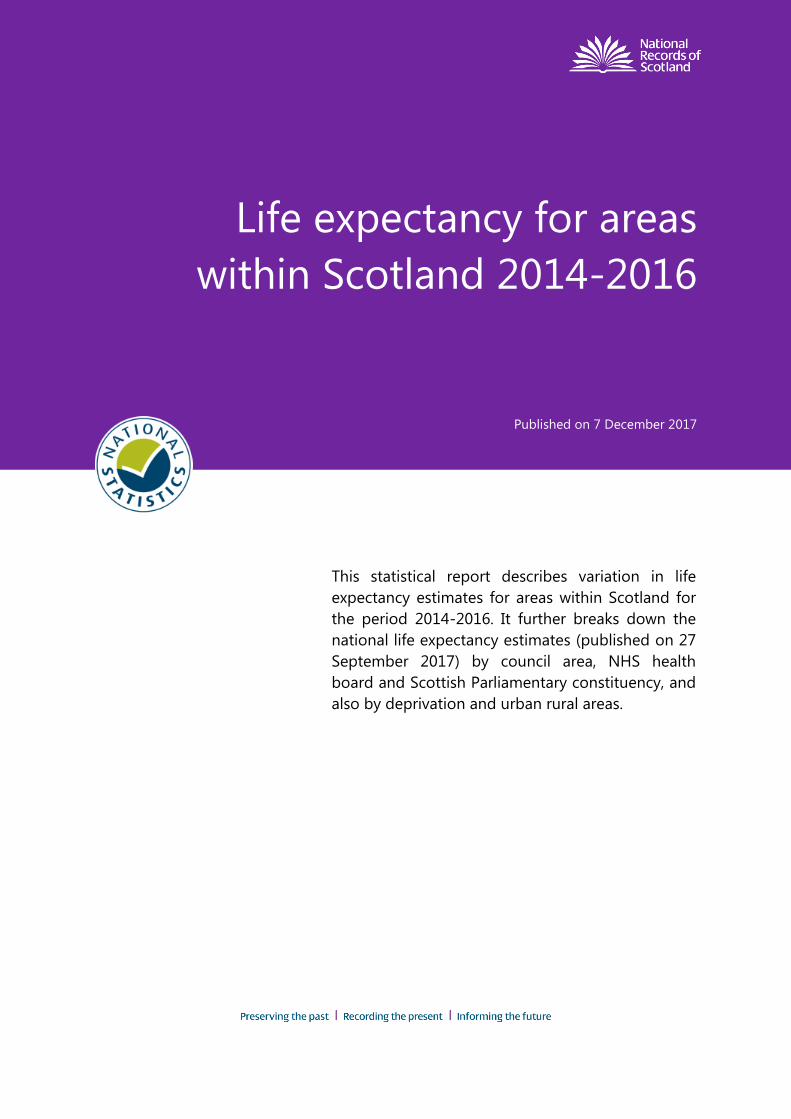
In 2014-2016, life expectancy at birth was 77.1 years for males and 81.2 years for females in Scotland, but there was considerable variation between areas.
Scotland has one of the lowest life expectancies in western Europe for both males and females.
At council area level, male life expectancy at birth was highest in Orkney Islands at 80.3 years and female life expectancy was highest in East Renfrewshire and East Dunbartonshire at 83.5 years. In the council areas with lowest life expectancy, males in Glasgow City could expect to live for 73.4 years while females in West Dunbartonshire could expect to live for 78.8 years.
For NHS health boards, life expectancy was highest for males in Orkney (80.3 years) and lowest in Greater Glasgow and Clyde (75.3 years), a difference of five years. For females, life expectancy was joint highest in Highland, Orkney and Western Isles (82.7 years) and joint lowest in Lanarkshire and in Greater Glasgow and Clyde (80.1 years), a difference of 2.6 years.
Across Scotland there was a difference of 10.5 years between life expectancy at birth in the 20 per cent most and least deprived areas for males and 7.8 years for females. Dundee City had the greatest inequality in life expectancy for males, with those living in the most deprived quintile surviving an average of 13.6 years less than those in the least deprived quintile. For females, the greatest gap in life expectancy between the most and least deprived quintiles was in Inverclyde, a gap of 10.5 years.
People who live in more rural areas have a greater life expectancy than those in urban areas. For females, the greatest life expectancy was in ‘Remote Rural’ areas (82.8 years) and the lowest was in ‘Large Urban’ areas (80.6 years). For males, the greatest life expectancy was in ‘Accessible Rural’ areas (79.5 years) and the lowest was in ‘Large Urban’ areas (75.9 years).
7 © Crown Copyright 2017
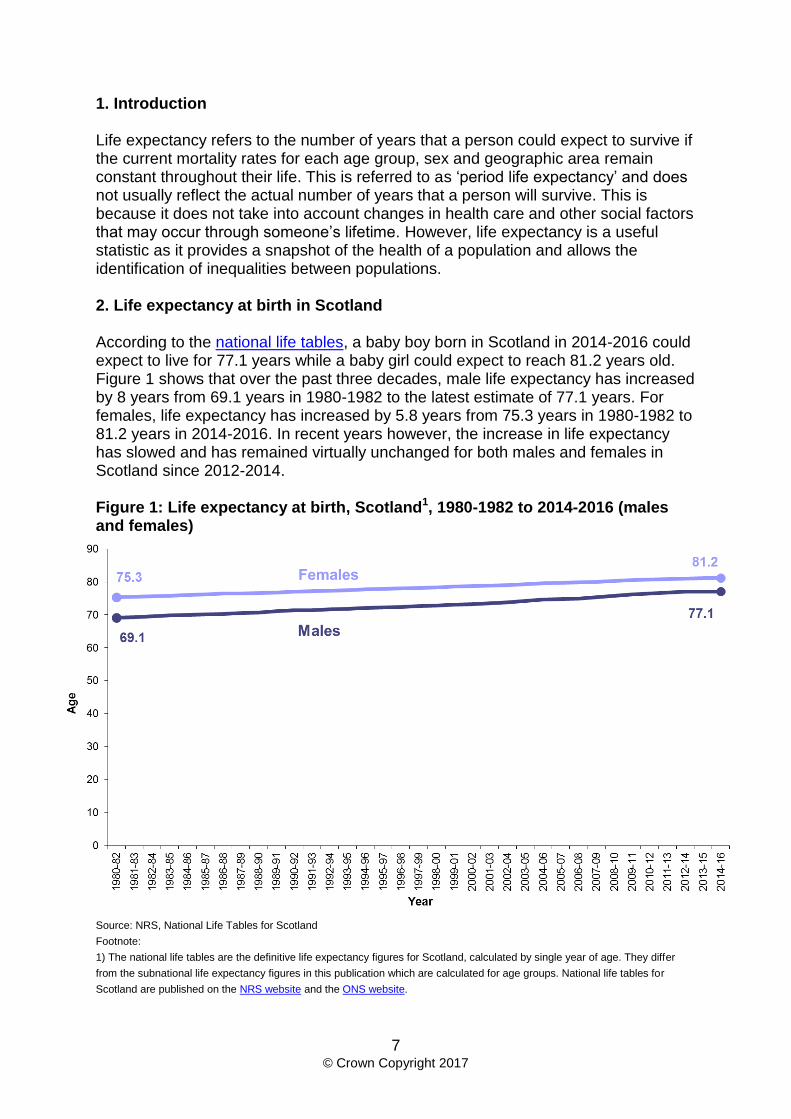
1. Introduction Life expectancy refers to the number of years that a person could expect to survive if the current mortality rates for each age group, sex and geographic area remain constant throughout their life. This is referred to as ‘period life expectancy’ and does not usually reflect the actual number of years that a person will survive. This is because it does not take into account changes in health care and other social factors that may occur through someone’s lifetime. However, life expectancy is a useful statistic as it provides a snapshot of the health of a population and allows the identification of inequalities between populations. 2. Life expectancy at birth in Scotland According to the national life tables, a baby boy born in Scotland in 2014-2016 could expect to live for 77.1 years while a baby girl could expect to reach 81.2 years old. Figure 1 shows that over the past three decades, male life expectancy has increased by 8 years from 69.1 years in 1980-1982 to the latest estimate of 77.1 years. For females, life expectancy has increased by 5.8 years from 75.3 years in 1980-1982 to 81.2 years in 2014-2016. In recent years however, the increase in life expectancy has slowed and has remained virtually unchanged for both males and females in Scotland since 2012-2014. Figure 1: Life expectancy at birth, Scotland1, 1980-1982 to 2014-2016 (males and females)
Source: NRS, National Life Tables for Scotland
Footnote:
1) The national life tables are the definitive life expectancy figures for Scotland, calculated by single year of age. They differ
from the subnational life expectancy figures in this publication which are calculated for age groups. National life tables for
Scotland are published on the NRS website and the ONS website.

8 © Crown Copyright 2017
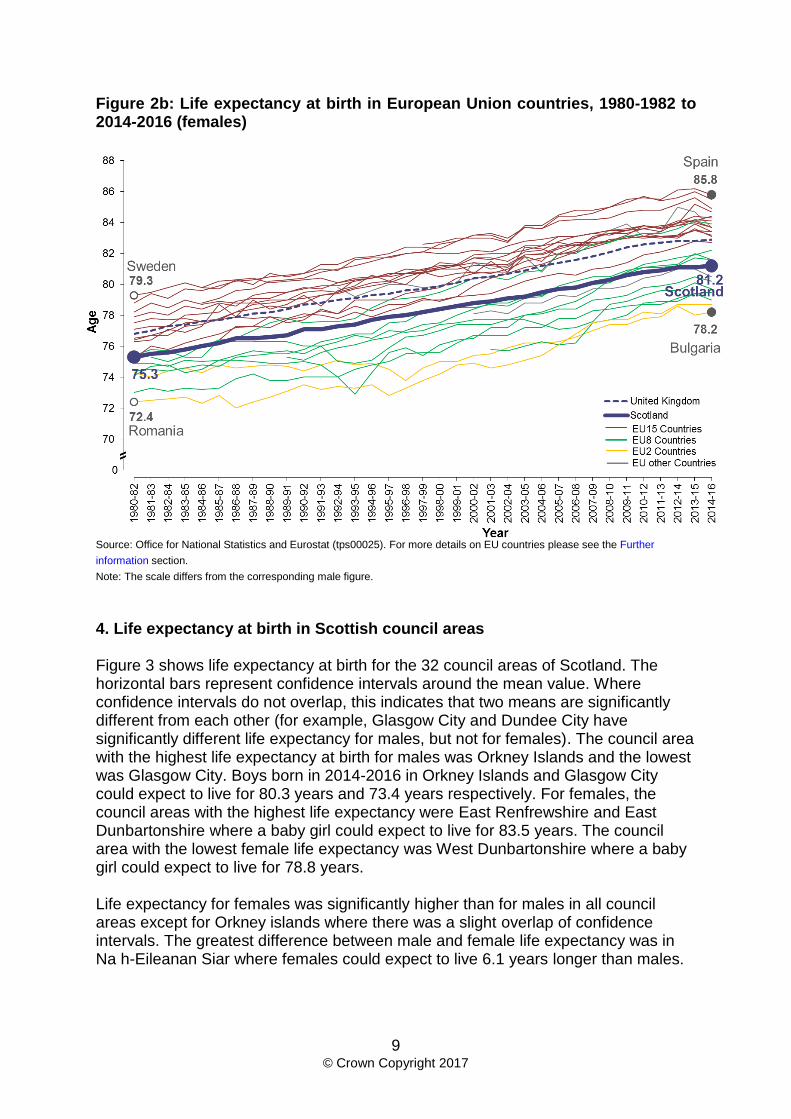
3. Scottish life expectancy in a European context Scotland has one of the lowest life expectancies in western Europe. Both males and females in Scotland have a lower expectation of life at birth than any EU15 country as seen in Figure 2a and Figure 2b. The country with the highest male life expectancy in Europe is Sweden where a boy born in 2014-2016 could expect to live for 80.4 years; 3.3 years longer than a boy in Scotland. For females, there is a difference of 4.6 years between life expectancy in Scotland and Spain which has the highest female life expectancy in Europe (85.8 years). All countries in the EU have experienced a rise in life expectancy over the past three decades. However, as has been seen in Scotland, the majority of countries have experienced a slowing in life expectancy with a stall or a drop over the most recent period (comparing 2013-2015 and 2014-2016 estimates). Figure 2a: Life expectancy at birth in European Union countries, 1980-1982 to 2014-2016 (males)
Source: Office for National Statistics and Eurostat (tps00025). For more details on EU countries please see the Further
information section.
Note: The scale differs from the corresponding female figure.
9 © Crown Copyright 2017
Figure 2b: Life expectancy at birth in European Union countries, 1980-1982 to 2014-2016 (females) Source: Office for National Statistics and Eurostat (tps00025). For more details on EU countries please see the Further
information section.
Note: The scale differs from the corresponding male figure.
4. Life expectancy at birth in Scottish council areas Figure 3 shows life expectancy at birth for the 32 council areas of Scotland. The horizontal bars represent confidence intervals around the mean value. Where confidence intervals do not overlap, this indicates that two means are significantly different from each other (for example, Glasgow City and Dundee City have significantly different life expectancy for males, but not for females). The council area with the highest life expectancy at birth for males was Orkney Islands and the lowest was Glasgow City. Boys born in 2014-2016 in Orkney Islands and Glasgow City could expect to live for 80.3 years and 73.4 years respectively. For females, the council areas with the highest life expectancy were East Renfrewshire and East Dunbartonshire where a baby girl could expect to live for 83.5 years. The council area with the lowest female life expectancy was West Dunbartonshire where a baby girl could expect to live for 78.8 years. Life expectancy for females was significantly higher than for males in all council areas except for Orkney islands where there was a slight overlap of confidence intervals. The greatest difference between male and female life expectancy was in Na h-Eileanan Siar where females could expect to live 6.1 years longer than males.

10 © Crown Copyright 2017
Life
expectancy
at birth
change from
2004-2006 to
2014-2016
Life
expectancy
at 65-69
change from
2004-2006 to
2014-2016
Life
expectancy
at birth
change from
2004-2006 to
2014-2016
Life
expectancy
at 65-69
change from
2004-2006 to
2014-2016
Aberdeen City 76.4 1.6 16.9 1.0 80.8 0.7 19.7 0.6
Aberdeenshire 79.2 2.3 18.3 1.2 82.4 1.3 20.3 0.9
Angus 78.5 2.3 17.9 1.5 81.8 1.9 20.5 1.5
Argyll and Bute 77.4 1.8 17.5 0.9 82.5 2.0 20.6 1.4
City of Edinburgh 78.0 2.4 18.0 1.7 82.2 1.5 20.5 1.0
Clackmannanshire 76.7 3.5 17.5 2.0 80.6 1.8 19.3 1.5
Dumfries and Galloway 77.8 1.8 17.9 1.5 81.8 1.5 20.1 1.3
Dundee City 74.5 1.1 16.9 1.0 79.6 0.6 19.3 0.7
East Ayrshire 76.5 2.0 17.0 1.6 79.8 1.7 18.5 0.9
East Dunbartonshire 80.1 2.2 19.4 2.1 83.5 2.0 21.2 1.4
East Lothian 78.3 1.9 18.0 1.9 82.7 2.0 20.7 1.5
East Renfrewshire 80.1 2.8 18.7 1.6 83.5 1.7 21.4 1.2
Falkirk 77.3 2.7 17.3 1.8 80.6 1.2 19.4 1.5
Fife 77.6 2.2 17.8 1.6 81.2 1.3 19.9 1.0
Glasgow City 73.4 3.0 15.2 1.4 78.9 2.1 18.2 1.0
Highland 77.9 2.7 18.3 1.9 82.9 2.3 21.0 1.6
Inverclyde 75.6 3.4 16.6 1.7 80.1 2.3 19.4 1.3
Midlothian 77.9 2.8 17.5 1.6 81.4 1.8 19.8 1.7
Moray 78.7 2.8 17.8 1.3 82.1 2.1 20.4 1.7
Na h-Eileanan Siar 76.6 3.4 17.2 1.6 82.7 2.6 21.2 1.4
North Ayrshire 75.9 2.0 17.1 1.7 80.5 1.6 19.5 1.1
North Lanarkshire 75.4 2.3 16.2 1.4 79.6 1.4 18.6 1.1
Orkney Islands 80.3 4.0 19.7 2.9 82.7 1.7 21.1 1.4
Perth and Kinross 79.9 3.5 19.2 2.3 82.6 1.5 20.9 1.5
Renfrewshire 76.4 3.0 16.6 1.6 80.2 1.7 19.1 1.5
Scotland1
77.1 2.5 17.4 1.6 81.1 1.6 19.7 1.2
Scottish Borders 78.6 2.1 18.2 1.3 82.6 1.9 20.4 1.3
Shetland Islands 77.6 1.4 17.6 0.0 82.0 0.7 20.1 -0.3
South Ayrshire 77.5 1.8 18.0 1.7 80.8 0.3 19.9 1.0
South Lanarkshire 76.8 2.4 17.2 1.9 80.7 1.4 19.2 1.0
Stirling 78.7 2.0 17.8 1.6 82.3 1.7 20.1 1.3
West Dunbartonshire 74.7 3.0 16.2 1.3 78.8 1.2 18.5 0.7
West Lothian 78.3 3.2 17.6 2.0 80.8 1.8 19.3 1.7
Females (years)Males (years)
The majority of council areas with low life expectancy are clustered around the west of the central belt of Scotland, this is true for both males and females. All 32 council areas have seen an increase in life expectancy at birth for both males and females since 2004-2006 as Table 1 shows. The largest increase in life expectancy for males was 4.0 years in Orkney Islands and the smallest increase for males was 1.1 years in Aberdeen City. For females, the largest increase in life expectancy was 2.6 years in Na h-Eileanan Siar and the smallest increase was 0.3 years in South Ayrshire. Table 1: Change in life expectancy at birth and age 65-69, 2004-2006 to 2014-2016, by council area (males and females) Footnote:
1) Please note that the Scotland-level life expectancy estimate shown here is for use only as a comparator for the
corresponding sub-Scotland-level figures. The definitive Scotland-level life expectancy estimate (based on national life tables)
is published in the National Life Tables section of the NRS website.

11 © Crown Copyright 2017
Figure 3: Life expectancy at birth, 95 per cent confidence intervals for council areas, 2014-2016 (males and females) Note: Ordered by lowest male life expectancy. Please note that the Scotland-level life expectancy estimate shown here is for use only as a comparator for the corresponding sub-Scotland-level figures. The definitive Scotland-level life expectancy estimate (based on national life tables) is published in the National Life Tables section of the NRS website.
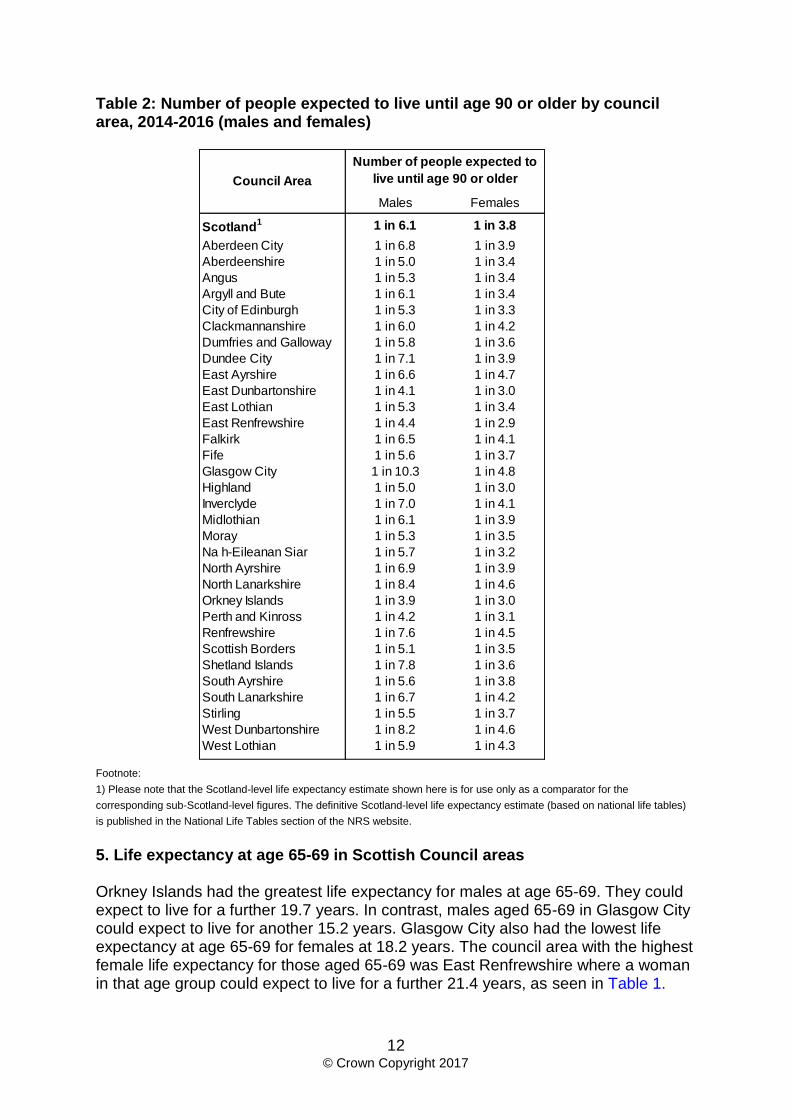
Table 2 shows that in Orkney Islands, one in four males born in 2014-16 could expect to live for 90 years or more if current age specific mortality rates remained constant throughout their lives. In contrast, only one in ten males born in Glasgow city could expect to reach the age of 90 under the same conditions. For females, one in three born in East Renfrewshire could expect to live until they were 90 while only one in five born in Glasgow city could expect to reach the same milestone.
12 © Crown Copyright 2017
Males Females
Scotland1 1 in 6.1 1 in 3.8
Aberdeen City 1 in 6.8 1 in 3.9
Aberdeenshire 1 in 5.0 1 in 3.4
Angus 1 in 5.3 1 in 3.4
Argyll and Bute 1 in 6.1 1 in 3.4
City of Edinburgh 1 in 5.3 1 in 3.3
Clackmannanshire 1 in 6.0 1 in 4.2
Dumfries and Galloway 1 in 5.8 1 in 3.6
Dundee City 1 in 7.1 1 in 3.9
East Ayrshire 1 in 6.6 1 in 4.7
East Dunbartonshire 1 in 4.1 1 in 3.0
East Lothian 1 in 5.3 1 in 3.4
East Renfrewshire 1 in 4.4 1 in 2.9
Falkirk 1 in 6.5 1 in 4.1
Fife 1 in 5.6 1 in 3.7
Glasgow City 1 in 10.3 1 in 4.8
Highland 1 in 5.0 1 in 3.0
Inverclyde 1 in 7.0 1 in 4.1
Midlothian 1 in 6.1 1 in 3.9
Moray 1 in 5.3 1 in 3.5
Na h-Eileanan Siar 1 in 5.7 1 in 3.2
North Ayrshire 1 in 6.9 1 in 3.9
North Lanarkshire 1 in 8.4 1 in 4.6
Orkney Islands 1 in 3.9 1 in 3.0
Perth and Kinross 1 in 4.2 1 in 3.1
Renfrewshire 1 in 7.6 1 in 4.5
Scottish Borders 1 in 5.1 1 in 3.5
Shetland Islands 1 in 7.8 1 in 3.6
South Ayrshire 1 in 5.6 1 in 3.8
South Lanarkshire 1 in 6.7 1 in 4.2
Stirling 1 in 5.5 1 in 3.7
West Dunbartonshire 1 in 8.2 1 in 4.6
West Lothian 1 in 5.9 1 in 4.3
Number of people expected to
live until age 90 or olderCouncil Area
Table 2: Number of people expected to live until age 90 or older by council area, 2014-2016 (males and females)
Footnote:
1) Please note that the Scotland-level life expectancy estimate shown here is for use only as a comparator for the
corresponding sub-Scotland-level figures. The definitive Scotland-level life expectancy estimate (based on national life tables)
is published in the National Life Tables section of the NRS website. 5. Life expectancy at age 65-69 in Scottish Council areas Orkney Islands had the greatest life expectancy for males at age 65-69. They could expect to live for a further 19.7 years. In contrast, males aged 65-69 in Glasgow City could expect to live for another 15.2 years. Glasgow City also had the lowest life expectancy at age 65-69 for females at 18.2 years. The council area with the highest female life expectancy for those aged 65-69 was East Renfrewshire where a woman in that age group could expect to live for a further 21.4 years, as seen in Table 1.
13 © Crown Copyright 2017
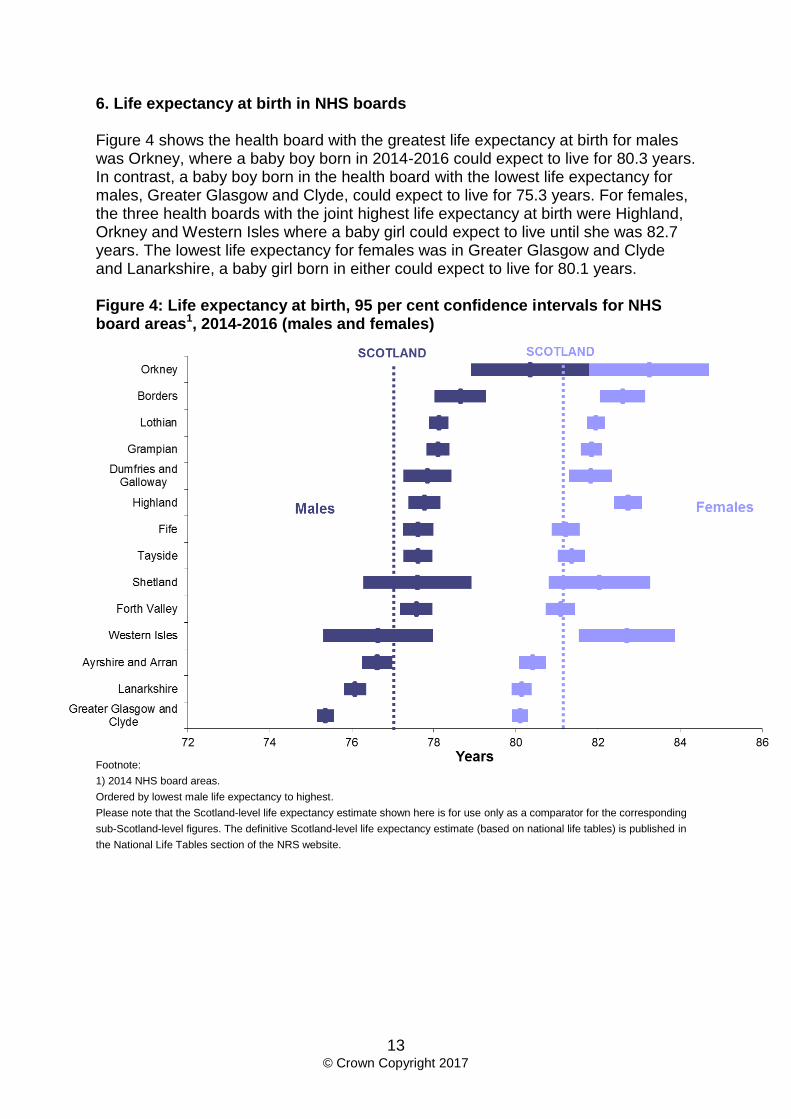
6. Life expectancy at birth in NHS boards Figure 4 shows the health board with the greatest life expectancy at birth for males was Orkney, where a baby boy born in 2014-2016 could expect to live for 80.3 years. In contrast, a baby boy born in the health board with the lowest life expectancy for males, Greater Glasgow and Clyde, could expect to live for 75.3 years. For females, the three health boards with the joint highest life expectancy at birth were Highland, Orkney and Western Isles where a baby girl could expect to live until she was 82.7 years. The lowest life expectancy for females was in Greater Glasgow and Clyde and Lanarkshire, a baby girl born in either could expect to live for 80.1 years. Figure 4: Life expectancy at birth, 95 per cent confidence intervals for NHS board areas1, 2014-2016 (males and females) Footnote:
1) 2014 NHS board areas.
Ordered by lowest male life expectancy to highest.
Please note that the Scotland-level life expectancy estimate shown here is for use only as a comparator for the corresponding
sub-Scotland-level figures. The definitive Scotland-level life expectancy estimate (based on national life tables) is published in
the National Life Tables section of the NRS website.

14 © Crown Copyright 2017
7. Life expectancy at birth in Scottish Parliamentary constituencies The Scottish Parliamentary constituency with the greatest life expectancy for males was Eastwood in the west of Scotland where a boy born in 2014-2016 could expect to live for 81.5 years, as seen in Figure 5a. In comparison, Glasgow Maryhill and Springburn was the constituency with the lowest male life expectancy. A boy born here in 2014-2016 could expect to live for 72.1 years. Eastwood also had the highest life expectancy for females, as a baby girl born in 2014-2016 could expect to live until she was 84.5 years old, as seen in Figure 5b. The constituency with the lowest female life expectancy was Glasgow Pollok where a baby girl could expect to live for 77.4 years. Figure 5a: Scottish Parliamentary constituencies with the five highest and lowest life expectancy at birth, 95 per cent confidence intervals, 2014-2016 (males) Note: Life expectancy in SPCs is calculated from counts of population and deaths in datazones that best fit to SPC boundaries. Please note that the Scotland-level life expectancy estimate shown here is for use only as a comparator for the corresponding sub-Scotland-level figures. The definitive Scotland-level life expectancy estimate (based on national life tables) is published in the National Life Tables section of the NRS website.
15 © Crown Copyright 2017
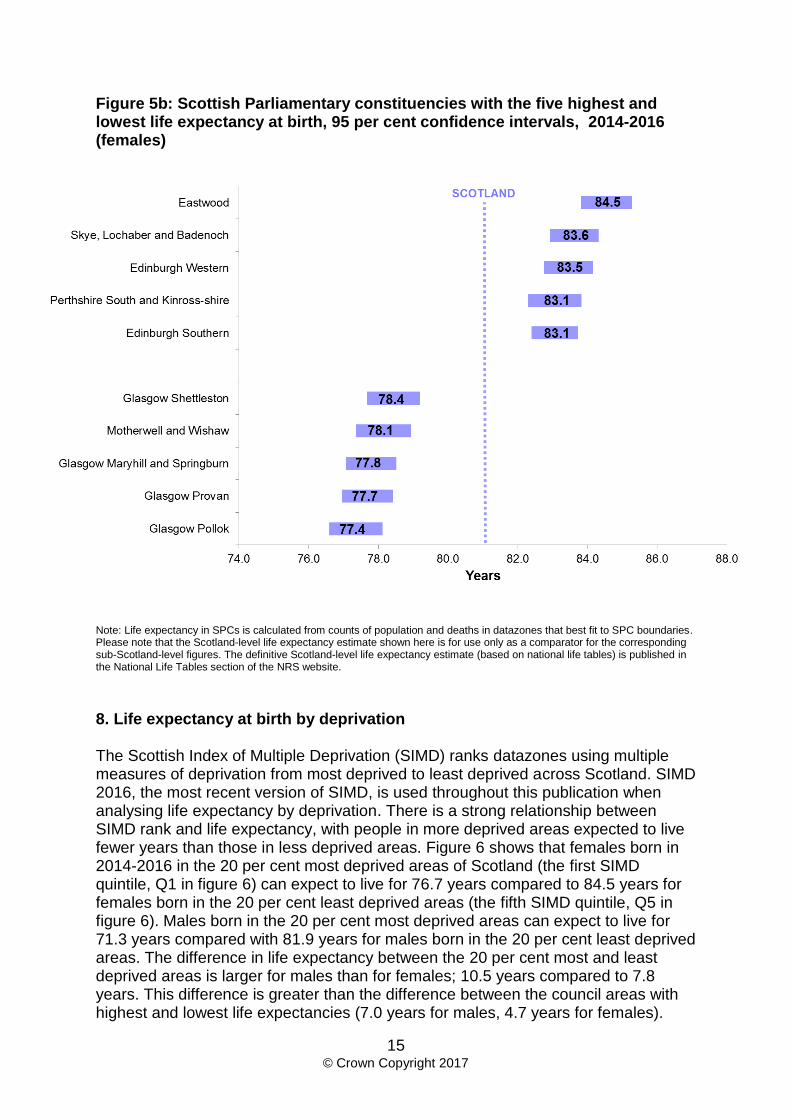
Figure 5b: Scottish Parliamentary constituencies with the five highest and lowest life expectancy at birth, 95 per cent confidence intervals, 2014-2016 (females) Note: Life expectancy in SPCs is calculated from counts of population and deaths in datazones that best fit to SPC boundaries. Please note that the Scotland-level life expectancy estimate shown here is for use only as a comparator for the corresponding sub-Scotland-level figures. The definitive Scotland-level life expectancy estimate (based on national life tables) is published in the National Life Tables section of the NRS website.
8. Life expectancy at birth by deprivation The Scottish Index of Multiple Deprivation (SIMD) ranks datazones using multiple measures of deprivation from most deprived to least deprived across Scotland. SIMD 2016, the most recent version of SIMD, is used throughout this publication when analysing life expectancy by deprivation. There is a strong relationship between SIMD rank and life expectancy, with people in more deprived areas expected to live fewer years than those in less deprived areas. Figure 6 shows that females born in 2014-2016 in the 20 per cent most deprived areas of Scotland (the first SIMD quintile, Q1 in figure 6) can expect to live for 76.7 years compared to 84.5 years for females born in the 20 per cent least deprived areas (the fifth SIMD quintile, Q5 in figure 6). Males born in the 20 per cent most deprived areas can expect to live for 71.3 years compared with 81.9 years for males born in the 20 per cent least deprived areas. The difference in life expectancy between the 20 per cent most and least deprived areas is larger for males than for females; 10.5 years compared to 7.8 years. This difference is greater than the difference between the council areas with highest and lowest life expectancies (7.0 years for males, 4.7 years for females).

16 © Crown Copyright 2017
This indicates that deprivation has a greater influence on life expectancy than geographic location does. The difference between male and female life expectancy also varies with deprivation. In the 20 per cent most deprived areas the gender gap is 5.4 years compared to 2.7 years in the 20 per cent least deprived areas. Figure 6: Life expectancy at birth in Scotland, 2014-2016, by SIMD1 quintiles (males and females)
Footnote:
1) SIMD 2016 Please note: Q1-Q5 refer to SIMD quintiles. These are all of the datazones in Scotland divided into five groups based on their SIMD 2016 rank, so that Q1 is the 20% most deprived, Q2 is the next 20% most deprived and so on until Q5 which is the 20% least deprived areas.
9. Life expectancy at birth by deprivation and council area NRS also publishes life expectancy for SIMD quintiles within a council area. Because the population is so small in some of these areas, we aggregate five years of population and deaths data to calculate life expectancy so that the sample size is large enough to produce meaningful results. For most council areas there is a negative relationship between deprivation and life expectancy the same as is seen at Scotland level. In some of the less populated council areas however, this relationship does not exist in the data, as smaller
17 © Crown Copyright 2017
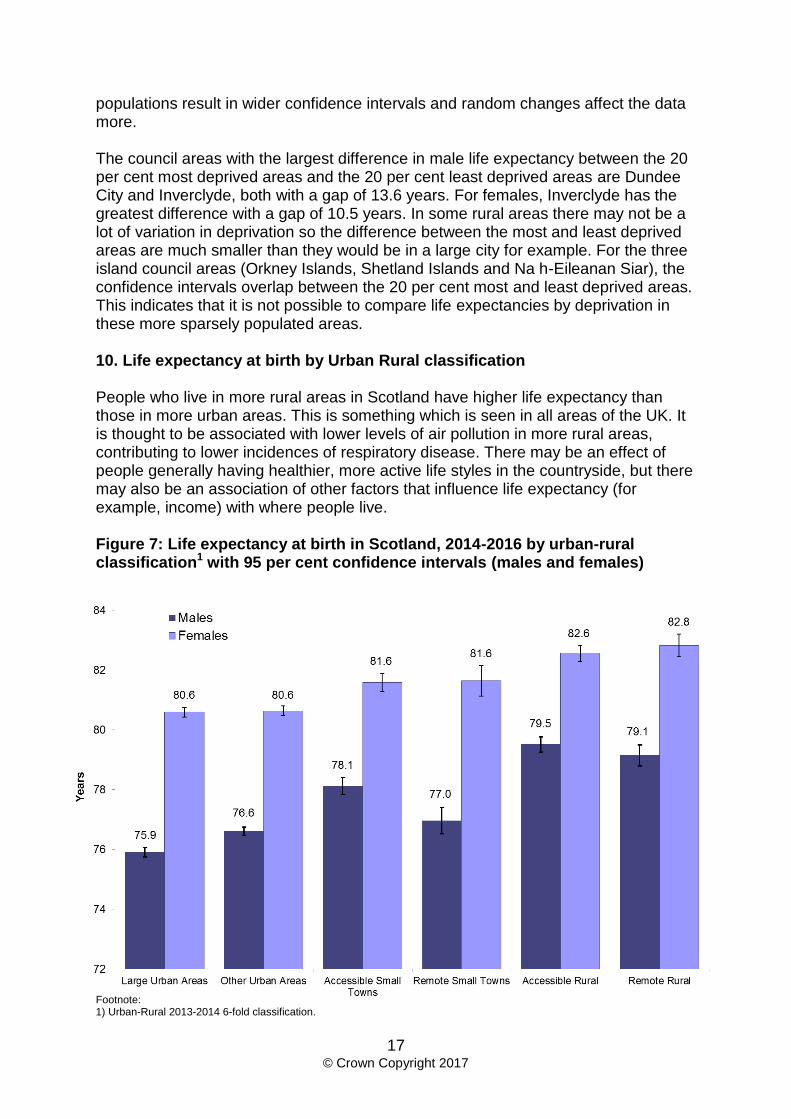
populations result in wider confidence intervals and random changes affect the data more. The council areas with the largest difference in male life expectancy between the 20 per cent most deprived areas and the 20 per cent least deprived areas are Dundee City and Inverclyde, both with a gap of 13.6 years. For females, Inverclyde has the greatest difference with a gap of 10.5 years. In some rural areas there may not be a lot of variation in deprivation so the difference between the most and least deprived areas are much smaller than they would be in a large city for example. For the three island council areas (Orkney Islands, Shetland Islands and Na h-Eileanan Siar), the confidence intervals overlap between the 20 per cent most and least deprived areas. This indicates that it is not possible to compare life expectancies by deprivation in these more sparsely populated areas. 10. Life expectancy at birth by Urban Rural classification People who live in more rural areas in Scotland have higher life expectancy than those in more urban areas. This is something which is seen in all areas of the UK. It is thought to be associated with lower levels of air pollution in more rural areas, contributing to lower incidences of respiratory disease. There may be an effect of people generally having healthier, more active life styles in the countryside, but there may also be an association of other factors that influence life expectancy (for example, income) with where people live. Figure 7: Life expectancy at birth in Scotland, 2014-2016 by urban-rural classification1 with 95 per cent confidence intervals (males and females) Footnote: 1) Urban-Rural 2013-2014 6-fold classification.
18 © Crown Copyright 2017
In 2014-2016, females living in ‘Remote Rural’ areas had the greatest life expectancy (82.8 years) while those living in ‘Large Urban’ and ‘Other Urban’ areas had the lowest life expectancy (80.6 years), as shown in figure 7. For males, the greatest life expectancy was in ‘Accessible Rural’ areas (79.5 years) while the lowest life expectancy was in ‘Large Urban’ areas (75.9 years). Figure 7 shows the life expectancy for males and females living in different urban-rural areas, with confidence intervals displayed as vertical bars. Where confidence intervals do not overlap this indicates that values are significantly different. For females there was virtually no difference in life expectancy between those living in ‘Accessible Small Towns’ and ‘Remote Small Towns’. In comparison, males born in ‘Accessible Small Towns’ could expect to live 1.1 years longer than those born in ‘Remote Small Towns’. Similarly, there was no significant difference in female life expectancy for those born in ‘Large Urban’ areas and ‘Other Urban’ areas whereas males could expect to live 0.7 years longer in ‘Other Urban’ areas compared to ‘Large Urban’ areas. A similar pattern has been present in the data every year since 2001-2003. For both males and females, there was overlap in the confidence intervals for those living in ‘Accessible Rural’ and ‘Remote Rural’ areas, indicating that there is no significant difference in life expectancy between these areas. 11. Further information Past data Previous NRS publications covering life expectancy in administrative areas (Council and NHS board) and special areas (Community Health Partnership, Urban/Rural and Deprivation) within Scotland can be found in the Life Expectancy in Scottish Areas (archives section) of the NRS website. Earlier life expectancy tables for Scottish Council and NHS board areas, back to 1981-1983 (in the form of abridged life tables) are also available in this archive section. Healthy life expectancy As well as how many years a person might expect to live, it is also useful to understand how many years a person can expect to spend in good health. This is useful from a policy perspective in terms of planning health care, pensions and benefits. It also provides a further way of identifying inequalities and assessing the health of communities. Healthy life expectancy and disability free life expectancy for Scotland and Scottish council areas is published today for 2014-2016 by the Office for National Statistics, along with estimates for the rest of the UK enabling consistent comparisons across the whole of the UK. Healthy life expectancy for Scotland by council area, NHS board, deprivation and urban rural classification is also published by the Scottish Public Health Observatory (ScotPHO) on the ScotPHO website. It should be noted that life expectancy and healthy life expectancy data published by ScotPHO is reported for different time
19 © Crown Copyright 2017
periods to the life expectancy estimates published by NRS and ONS and is therefore not directly comparable. National life tables The definitive life expectancy figures for Scotland are produced by ONS and published in the National Life Tables, UK publication. NRS also produce a statistical bulletin containing the national life tables with some additional commentary on the Scottish National Life Tables section of the NRS website. Following publication of the census data, a set of graduated (smoothed) life tables for Scotland is published for some years. They are available for the years 1930-1932 to 2000-2002 (excluding 1940-1942) and are available from the decennial life tables page on the NRS website. Period and cohort life expectancy The life expectancy figures quoted in this publication are period life expectancies which are calculated using the age-specific mortality rates for a given period (either a single year, or aggregated years) and make no allowance for any later actual or projected changes in future mortality. Cohort life expectancies are calculated using age-specific mortality rates which allow for known or projected changes in mortality in later years. Period and cohort life expectancies based on projected mortality rates from the 2014-based national population projections can be accessed from the ONS website. Period life expectancy projections are also available on the ONS website. Methodology Life expectancy for areas within Scotland is calculated by NRS using the Chiang II method. For more details please see the methodology paper published on the NRS website. EU countries The EU 15 countries refers to the countries that were members of the EU prior to 2004: Austria, Belgium, Denmark, Finland, France, Germany, Greece, Ireland, Italy, Luxembourg, Netherlands, Portugal, Spain, Sweden and the UK. The EU 8 countries refer to a group of eight of the 10 countries that joined the European Union in 2004: Czech Republic, Estonia, Hungary, Latvia, Lithuania, Poland, Slovakia and Slovenia. The EU 2 countries are Bulgaria and Romania which joined the EU in 2014. The EU ‘other’ countries are Cyprus and Malta which joined the EU in 2004 but are usually counted separately to the EU8 because they have different per capita income levels.
20 © Crown Copyright 2017
Notes on statistical publications National Statistics The United Kingdom Statistics Authority (UKSA) has designated these statistics as National Statistics, in line with the Statistics and Registration Service Act 2007 and signifying compliance with the Code of Practice for Official Statistics (available on the UKSA website). National Statistics status means that official statistics meet the highest standards of trustworthiness, quality and public value. All official statistics should comply with all aspects of the Code of Practice for Official Statistics. They are awarded National Statistics status following an assessment by the Authority’s regulatory arm. The Authority considers whether the statistics meet the highest standards of Code compliance, including the value they add to public decisions and debate. It is National Records of Scotland’s responsibility to maintain compliance with the standards expected of National Statistics. If we become concerned about whether these statistics are still meeting the appropriate standards, we will discuss any concerns with the Authority promptly. National Statistics status can be removed at any point when the highest standards are not maintained, and reinstated when standards are restored. Information on background and source data Further details on data source(s), timeframe of data and timeliness, continuity of data, accuracy, etc can be found in the About this Publication document that is published alongside this publication on the NRS website. National Records of Scotland We, the National Records of Scotland, are a non-ministerial department of the devolved Scottish Administration. Our aim is to provide relevant and reliable information, analysis and advice that meets the needs of government, business and the people of Scotland. We do this as follows: Preserving the past – We look after Scotland’s national archives so that they are available for current and future generations, and we make available important information for family history. Recording the present – At our network of local offices, we register births, marriages, civil partnerships, deaths, divorces and adoptions in Scotland. Informing the future – We are responsible for the Census of Population in Scotland which we use, with other sources of information, to produce statistics on the population and households.

21 © Crown Copyright 2017
You can get other detailed statistics that we have produced from the Statistics section of our website. Scottish Census statistics are available on the Scotland’s Census website. We also provide information about future publications on our website. If you would like us to tell you about future statistical publications, you can register your interest on the Scottish Government ScotStat website. You can also follow us on twitter @NatRecordsScot Enquiries and suggestions Please contact our Statistics Customer Services if you need any further information. Email: [email protected] If you have comments or suggestions that would help us improve our standards of service, please contact:
Alan Ferrier Senior Statistician National Records of Scotland Room 1/2/12 Ladywell House Ladywell Road Edinburgh EH12 7TF Phone: 0131 314 4530 Email: [email protected]
© Crown Copyright You may use or re-use this information (not including logos) free of charge in any format or medium, under the terms of the Open Government Licence. Further information is available within the Copyright and Disclaimer section of the National Records of Scotland website.
Related Documents

![Proposals to Extend Healthy Life Expectancy in Shizuoka ...€¦ · [Gap between life expectancy and healthy life expectancy in Shizuoka Prefecture] Healthy life expectancy *Source:](https://static.cupdf.com/doc/110x72/5f427921a09c2479a15262fb/proposals-to-extend-healthy-life-expectancy-in-shizuoka-gap-between-life-expectancy.jpg)