DIPLOMARBEIT Life cycle design of a single family house in Poland – comparative study unter der Leitung von Univ.-Prof. Dipl.-Ing. Dr. Techn. Ardeshir Mahdavi E 259-3 Abteilung für Bauphysik und Bauökologie Institut für Architekturwissenschaften eingereicht an der Technischen Universität Wien Fakultät für Architektur und Raumplanung von Szymon Zwoniarkiewicz 1428438 Wien, October 2017 Die approbierte Originalversion dieser Diplom-/ Masterarbeit ist in der Hauptbibliothek der Tech- nischen Universität Wien aufgestellt und zugänglich. http://www.ub.tuwien.ac.at The approved original version of this diploma or master thesis is available at the main library of the Vienna University of Technology. http://www.ub.tuwien.ac.at/eng

Welcome message from author
This document is posted to help you gain knowledge. Please leave a comment to let me know what you think about it! Share it to your friends and learn new things together.
Transcript
DIPLOMARBEIT
Life cycle design of a single family house in Poland – comparative study
unter der Leitung von
Univ.-Prof. Dipl.-Ing. Dr. Techn. Ardeshir Mahdavi
E 259-3 Abteilung für Bauphysik und Bauökologie
Institut für Architekturwissenschaften
eingereicht an der
Technischen Universität Wien
Fakultät für Architektur und Raumplanung
von
Szymon Zwoniarkiewicz
1428438
Wien, October 2017
Die approbierte Originalversion dieser Diplom-/ Masterarbeit ist in der Hauptbibliothek der Tech-nischen Universität Wien aufgestellt und zugänglich.
http://www.ub.tuwien.ac.at
The approved original version of this diploma or master thesis is available at the main library of the Vienna University of Technology.
http://www.ub.tuwien.ac.at/eng
KURZFASSUNG Die aktuelle Marktsituation in Polen wird von einem fachspezifischen
Informationsmangel beeinflusst welcher bewirkt, dass Neubauten meistens auf
konventionelle Weise gebaut werden. Andererseits werden Niedrigenergiebauten
und energieeffiziente Systeme öffentlich stark gefördert. Ziel dieser Masterthesis
war es ökologische, wirtschaftliche und energiespezifische Aspekte solcher
Konstruktionen über die gesamte Gebäudelebenszyklusdauer zu analysieren.
Fünf Szenarien wurden in Bezug auf Leistung und Kosten über eine 50 Jahre lange
Lebenszyklusdauer analysiert und verglichen. Zu den Szenarien gehören typische
Bauten von Einfamilienhäusern in Polen, d.h. Kalksandsteinziegel mit Mineralwolle
isoliert, Keramikziegel isoliert mit EPS und Porenbetonziegel. Das Stampflehmhaus
mit Holzfasern isoliert wurde als Repräsentant von Konstruktionen mit niedrigem
Verbrauch von grauer Energie analysiert. Zwei Arten von Gebäudeausstattungen
wurden simuliert, d.h. ein konventionelles System bestehend aus Gaskessel sowie
ein modernes System bestehend aus mechanischer Belüftung, Photovoltaik,
solarthermisch unterstützter Fußbodenheizung und Warmwasser. Einer der
Forschungsschwerpunkte war eine dynamische Energiesimulation, welche zur
Analyse des operativen Energieverbrauchs der unterschiedlichen Szenarien
beiträgt.
Die Energiesimulation verdeutlicht wie erwartet, dass das Szenario mit der high-end
energieeffizienter Gebäudeausstattung den kleinsten Energiebedarf hat. Dennoch
zeigt der Vergleich der Primärenergie-Indikatoren aufgrund des besonderen
elektrischen Energieportfolios in Polen fast keinen Unterschied zwischen den
Szenarien. In Abhängigkeit von der Umweltverträglichkeitskategorie (GWP, ODP,
AP, POCP, ADPF) wurde jedes Szenario unterschiedlich positioniert.
Als Ergebnis konnte kein klarer Gewinner der Lebenszyklusanalyse gewählt
werden. In Bezug auf die Kosten, die als Nettogegenwartswert repräsentiert wurden,
führte das Szenario welches mit Keramikziegel gebaut und mit konventionellem
Energiesystem ausgestattet wurde, während das energieeffiziente
Hochleistungsgebäude und jene Konstruktion mit niedrigem Verbrauch von grauer
Energie schlechter abschnitten.
Schlüsselwörter
LCA, LCC, Energy Simulation, Low-energy housing, Poland

ABSTRACT Current situation on the market in Poland and lack of proper information causes that
the most popular new built houses are still conventional ones. On the other hand,
low energy and low embodied energy objects are highly promoted. The goal of this
thesis was to investigate environmental, economic and energy performance aspects
of these constructions during their life cycle.
Five scenarios were analysed and compared in regard of Life Cycle Assessment
and Life Cycle Cost over 50 years of service life. The scenarios include typical
constructions of single family houses in Poland, i.e. sand-lime brick insulated with
mineral wool, ceramic brick insulated with EPS and aerated concrete brick.
Rammed earth house insulated with wood fibre was analysed as a representative of
low-embodied energy constructions. Two types of building services were
investigated, i.e. conventional system including a condensing gas boiler, as well as
advanced system consisting of mechanical ventilation, photovoltaic panels, solar
thermal assisted underfloor radiant heating and DHW supported with an electric coil.
One of the focuses of the research has been also dynamic energy simulation
contributing to analysis of the impact of the operational energy use in every
scenario.
Energy simulation showed as expected that Scenario containing high performance
building services has the smallest energy demand. Nevertheless, due to particular
electrical energy mix in Poland, comparison of the primary energy demand shows
very small difference among the scenarios. Depending on environmental impact
category (GWP, ODP, AP, POCP, ADPF) every scenario was positioned differently.
As a result a clear leader in whole Life Cycle Assessment has not been chosen.
Concerning cost represented as a Net Present Value, a scenario built with ceramic
brick and equipped with conventional energy system performed the best, while high
performance building and low-embodied energy building the worst.
Keywords
LCA, LCC, Energy Simulation, Low-energy housing, Poland

LIST OF ABBREVIATIONS Abbreviation .............................. Explanation
ach ............................................. Air change rate
ADPF .......................................... Abiotic Resource Depletion Potential of fossil fuels
AP .............................................. Acidification Potential
BEM............................................ Building Energy Modelling
BIM ............................................. Building Information Modelling
BoQ ............................................ Bill of Quantities
CO2 ............................................. Carbon Dioxide
CFC11 ........................................ Trichlorofluoromethane
EPD ............................................ Environmental Product Declaration
EPS ............................................ Expanded polystyrene
EU .............................................. European Union
GWP ........................................... Global Warming Potential
LCA ............................................ Life Cycle Assessment
LCC ............................................ Life Cycle Costing
NPV ............................................ Net Present Value
n50 ............................................... Air changes at a differential pressure of 50 Pa
ODP............................................ Ozone Depletion Potential
PEF ............................................ Primary Energy Conversion Factor
POCP ......................................... Photochemical Ozone Creation Potential
PV .............................................. Photovoltaic
RES ............................................ Renewable Energy Source
S1 ............................................... Scenario 1: Sand lime brick insulated with mineral
wool
S2 ............................................... Scenario 2: Sand lime brick insulated with mineral
wool, PV, Solar thermal assisted underfloor radiant
heating and DHW supported with an electric coil,
mechanical ventilation

S3 ............................................... Scenario 3: Brick insulated with EPS, gas boiler,
natural ventilation
S4 ............................................... Scenario 4: Aerated concrete, gas boiler, natural
ventilation
S5 ............................................... Scenario 5: Rammed earth insulated with wood
fibre, gas boiler, natural ventilation
SO2 ............................................. Sulphur Dioxide
CONTENTS 1 Introduction ....................................................................................................... 1
1.1 Overview ................................................................................................... 1
1.2 Motivation .................................................................................................. 2
1.3 Background ............................................................................................... 3
1.3.1 Sustainable development ................................................................... 3
1.3.2 Energy sector in Poland ...................................................................... 4
1.3.3 Typology of residential housing in Poland ........................................... 8
1.3.4 Life-cycle design ................................................................................. 9
2 Method ............................................................................................................15
2.1 Overview ..................................................................................................15
2.2 Hypothesis ................................................................................................19
2.3 Building Information Modelling for LCC and LCA ......................................20
2.4 Life Cycle Assessment (LCA) ...................................................................21
2.4.1 Overview ...........................................................................................21
2.4.2 Scope of the Life Cycle Assessment ..................................................22
2.4.3 Life Cycle Inventory (LCI) ..................................................................23
2.4.4 Life Cycle Impact Assessment (LCIA) ................................................23
2.4.5 Normalization ....................................................................................24
2.5 Life Cycle Costing .....................................................................................24
2.5.1 Overview ...........................................................................................24
2.5.2 Scope of the Life Cycle Costing .........................................................25
2.5.3 Inventory analysis ..............................................................................27
2.5.4 Impact assessment ............................................................................27
2.5.5 Interpretation phase ...........................................................................29
2.6 Building Energy Modelling ........................................................................30
2.6.1 Geometry and zoning ........................................................................30
2.6.2 Weather data .....................................................................................30
2.6.3 Input parameters ...............................................................................32
3 Results and discussion ....................................................................................36
3.1 Overview ..................................................................................................36
3.2 Life-Cycle Assessment .............................................................................38
3.2.1 Global Warming Potential ..................................................................38
3.2.2 Ozone Depletion Potential .................................................................39
3.2.3 Photochemical Ozone Creation Potential...........................................41
3.2.4 Acidification Potential.........................................................................41
3.2.5 Abiotic Depletion Potential for Fossil Resources ................................43
3.2.6 Normalization ....................................................................................44
3.3 Life Cycle Costing .....................................................................................44
3.4 Sensitivity analysis ...................................................................................46
3.4.1 LCA ...................................................................................................47
3.4.2 LCC ...................................................................................................49
4 Conclusion .......................................................................................................51
4.1 Conclusions ..............................................................................................51
4.2 Future research ........................................................................................52
5 Index................................................................................................................53
5.1 List of Figures ...........................................................................................53
5.2 List of Tables ............................................................................................55
5.3 List of Equations .......................................................................................56
6 Literature .........................................................................................................57
7 Appendix .........................................................................................................61
A. Cumulative cost of respective scenarios ......................................................61
B. Service life of the building components ........................................................64

INTRODUCTION
1
1 INTRODUCTION
1.1 Overview
The concept of Life Cycle Design is to analyse cost and environmental impact of a
designed building during its whole life cycle. Such holistic concept allows
optimization of materials or building services in order to select the most
environmentally friendly and/or cost efficient combination within service life of a
building. Currently, the main indicator influencing choice of building components in
Poland is their initial investment cost. Impact on energy demand, maintenance or
disposal cost are usually omitted or roughly estimated. Moreover, environmental
impact in any form is a concept which is barely known among Polish construction
professionals.
This thesis investigates environmental impact and cost during life cycle of a single
family house constructed in four combinations of materials and two combinations of
building services resulting in five scenarios as follows:
Table 1 Overview of investigated scenarios
Scenario Characteristic of materials Characteristic of building services
S1 Sand lime brick insulated with mineral wool
PV, Solar thermal assisted underfloor radiant heating and DHW supported with an electric coil, mechanical ventilation
S2 Sand lime brick insulated with mineral wool Gas boiler, natural ventilation
S3 Brick insulated with EPS Gas boiler, natural ventilation
S4 Aerated concrete Gas boiler, natural ventilation
S5 Rammed earth insulated with wood fibre Gas boiler, natural ventilation
Chapter 2 presents methodology used in the research. It describes all assumptions
made in Life Cycle Assessment and Life Cycle Costing. Furthermore, it defines
approach and parameters used in in the whole building energy simulation, as well as
the weather data.
Chapter 3 depicts results of all Scenarios during 50 years of service life of a
building. LCA results are subject of normalisation which defines significance of
chosen environmental impact categories. Additionally, sensitivity analysis is
performed in order to investigate impact of duration of service life of a building on
final result. 30 and 80 years of service life are taken into consideration.

INTRODUCTION
2
Chapter 4 presents conclusion of the whole research study in view of the defined
hypothesis. It shows the most favourable of investigated Scenarios in view of Life
Cycle Assessment and Life Cycle Cost.
1.2 Motivation
All over the Europe low-energy housing is promoted as a mean of energy
conservation. However, the most popular houses in Poland are still conventional
ones. It is a result of a belief that a cost of a low-energy house is higher than
conventional one and its pay-off period is unreasonably long. In terms of low-energy
housing, due to its expansive marketing and lobbying by manufacturers of
mechanical equipment, the most popular are ones in passive standard. Low-energy
(without heat recovery system or ground heat exchanger) or low-embodied energy
houses, both constructed using passive solar techniques are rather rare. Lack of
clear and objective comparative estimation of energy demand, ecological and
economic impact of mentioned housing types during whole life cycle results in
popularity of a conventional type of construction, rarely related to local microclimate,
orientation or other local factors.
The outcome of performed research may lead to more conscious decisions about
new housing constructions in Poland by private customers as well as construction
developers. Information gap about performance of mentioned buildings types will be
filled. Life cycle assessment, life cycle cost and energy performance analyses based
on dynamic simulation are the concepts, which need to be emerged into Polish
market, which is currently dominated by much less precise steady-state
certifications, investment cost factors and materials considered as energy saving,
but only during operation phase of the life cycle of the building.

INTRODUCTION
3
Figure 1 Stages of life cycle of a building
1.3 Background
1.3.1 Sustainable development
The definition of the term sustainable development was described in October 1987
in the Brundtland Report “Our Common Future”. The document, released by World
Commission on Environment and Development (WCED) led by Norwegian Prime
Minister Gro Harlem Brundtland states: “Sustainable development is development
that meets the needs of the present without compromising the ability of future
generations to meet their own needs“ (WCED 1987, p. 54). There exist several
models of sustainable development (Figure 2), but all of them base on three
dimensions: economic, social and environmental, which form “[…] interdependent
and mutually reinforcing pillars” (United Nations General Assembly 2005, p. 12).
Figure 2 Models of three dimensions of sustainable development
INTRODUCTION
4
The meaning and scope of these components was described as follows:
“Environmental. Reduction of local and global pollution (among them, emissions of
greenhouse gases), lower exploitation of the natural resources in the territory and
maintenance of the resilience (ability to adapt to change), integrity and stability of
the ecosystem.
Economic. Increase of regional per capita income, improvement in the standard of
living of the local population, reduction of energy dependence and increase in the
diversification of energy supply.
Social. […] the achievement of peace and social cohesion, stability, social
participation, respect for cultural identity and institutional development. Reducing
unemployment and improving the quality of jobs (more permanent jobs), increasing
regional cohesion and reducing poverty levels are key actions at local level to
achieve social sustainability” (Jaramillo-Nieves & del Río 2010, p. 787).
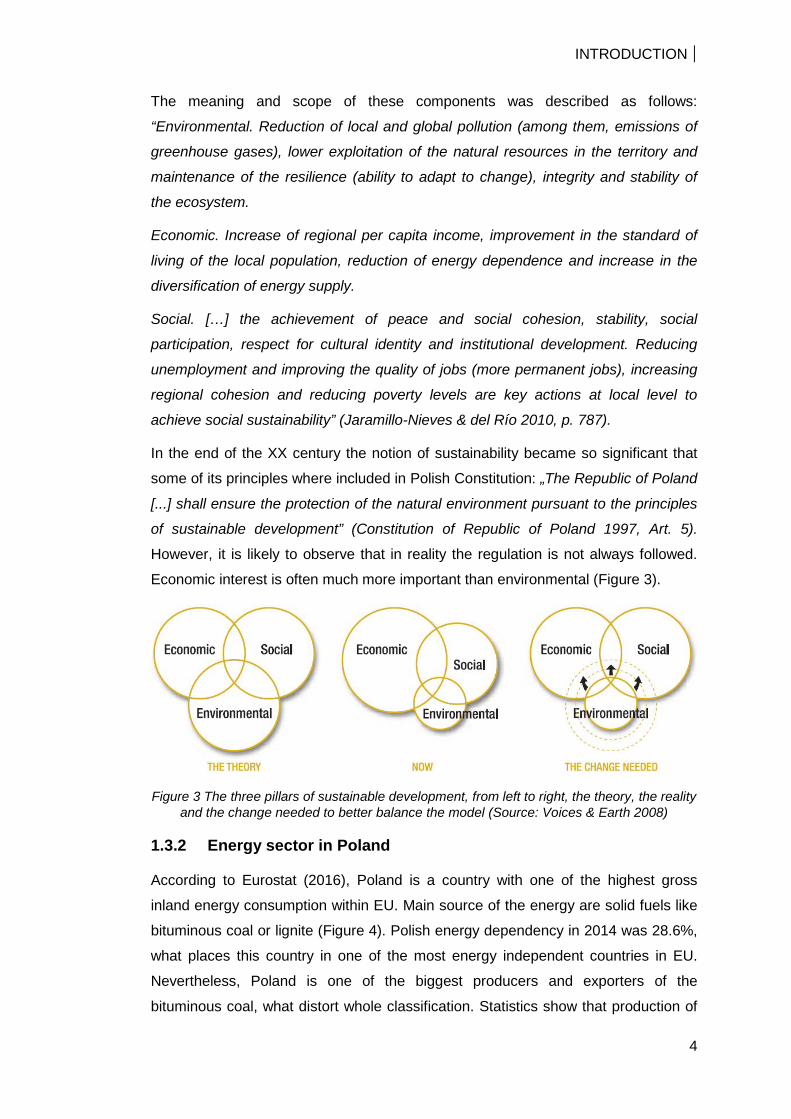
In the end of the XX century the notion of sustainability became so significant that
some of its principles where included in Polish Constitution: „The Republic of Poland
[...] shall ensure the protection of the natural environment pursuant to the principles
of sustainable development” (Constitution of Republic of Poland 1997, Art. 5).
However, it is likely to observe that in reality the regulation is not always followed.
Economic interest is often much more important than environmental (Figure 3).
Figure 3 The three pillars of sustainable development, from left to right, the theory, the reality and the change needed to better balance the model (Source: Voices & Earth 2008)
1.3.2 Energy sector in Poland
According to Eurostat (2016), Poland is a country with one of the highest gross
inland energy consumption within EU. Main source of the energy are solid fuels like
bituminous coal or lignite (Figure 4). Polish energy dependency in 2014 was 28.6%,
what places this country in one of the most energy independent countries in EU.
Nevertheless, Poland is one of the biggest producers and exporters of the
bituminous coal, what distort whole classification. Statistics show that production of

INTRODUCTION
5
this source has been decreasing for last decade. Hence, in order to keep relatively
low level of energy dependency, other sources will need to enhance their role in the
energy production.
Figure 4 Gross inland energy consumption by fuel type in 2014 (Source: Eurostat 2016)
In order to fulfil the ecological goals of EU, but also to become less dependent on
imported energy Polish government enacted a resolution containing fundamental
goals of Polish Energy Strategy until year 2030:
− Improvement of energy efficiency;
− Improvement of safety regarding fuels and energy supply;
− Diversification of the structure of electricity production by implementation
of nuclear energy;
− Development of acquisition of energy from renewable resources;
− Development of competitive fuel and energy markets;
− Reduction of the environmental impact of the energy sector (Polish
Ministry of Economy 2009).
Figure 5 shows that the final energy consumption is the biggest in the residential
sector (excluding production and transportation of the construction materials).
Therefore this master’s thesis will give a set of information, which might be valuable
in achieving the first of the mentioned goals.
52%
24%
14%
9%
1%
Solid fuels
Total petroleum products
Gas
Renewable energies
Waste (non-renewable)

INTRODUCTION
6
Figure 5 Final energy consumption by sector in 2014 (Source: Eurostat 2016)
Share of renewable energy in gross final energy consumption in 2014 according to
Eurostat data is 11.4%. The goal set by Polish authorities to be achieved in 2030 is
15%. Majority of current clean energy production comes from biomass and
renewable wastes plants (89%) and wind turbines (8%). Thanks to favourable wind
conditions, especially in the northern part of the country, the latter source has a
potential for further development (International Renewable Energy Agency 2015).
Nevertheless, turbulent airflow triggered by the obstructions like trees or houses
affects the efficiency of the wind turbines. There are suggestions regarding minimum
distance and height of such installations, which in case of house microturbines set in
rural environment might be hard to achieve or in case of urban one even impossible.
0
2,000
4,000
6,000
8,000
10,000
12,000
14,000
16,000
18,000
20,000
1 00
0 to
nnes
of o
il eq
uiva
lent

INTRODUCTION
7
Figure 6 Primary production of energy from renewable resources in 2014 (Source: Eurostat 2016)
The primary energy conversion factor (PEF) of electrical energy after a report of
(Molenbroek et al. 2011) is 3. PEF of natural gas is assumed to be 1.24 after Anke
Esser & Frank Sensfuss (2016). The referenced document does not provide
information on PEF in Poland. Hence one for Czech Republic was selected.
Every phase, starting with extraction of fossil fuels, through energy generation and
ending with energy supply to a consumer has particular impact on environment. Due
to domination of solid fossil fuels in Polish energy mix its environmental impact is
noticeably higher in comparison to Western countries like Germany relying on more
ecological energy sources (Table 2).
Table 2 Comparison of environmental impact of electrical energy mix per kWh) in Poland and Germany (Source: Ökobaudat.de 2015; Lelek et al. 2016)
GWP [kg CO2 equiv.]
ODP [kg CFC11
equiv.]
POCP [kg Ethene
equiv.]
AP [kg SO2 equiv.]
ADPF [MJ]
Poland 0.6215 2.7E-09 1.9E-05 0.0065 7.3453
Germany 0.5345 3.6E-11 6.1E-05 0.0008 5.455
89.0%
8.2%
2.3% 0.3% 0.2%
Biomass and renewablewastes
Wind power
Hydro power
Geothermal Energy
Solar

INTRODUCTION
8
1.3.3 Typology of residential housing in Poland
Detached single family houses are major type of housing across the country. The
observation was confirmed by Atanasiu (2012) in his report for The Buildings
Performance Institute Europe and presented on Figure 7.
Figure 7 Distribution of residential floor area by building type (Source: Atanasiu et al. 2012)
In his research feasibility of implementation of nearly Zero Energy Buildings (nZEB)
in polish environment was investigated. As a reference house he used detached,
two floors building of an area of 183.5 m2. In another study performed for project
‘EPISCOPE’ a two floors house with heating area of 172 m2 was defined as a typical
one (National Energy Conservation Agency 2011).
20%
36%
4% 2%
37%
1%
Detached single family houses- urban
Detached single family houses- rural
Semi-detached and terracedsingle family houses - urban
Semi-detached and terracedsingle family houes - rural
Multi family houses - urban
Multi family houses - rural
INTRODUCTION
9
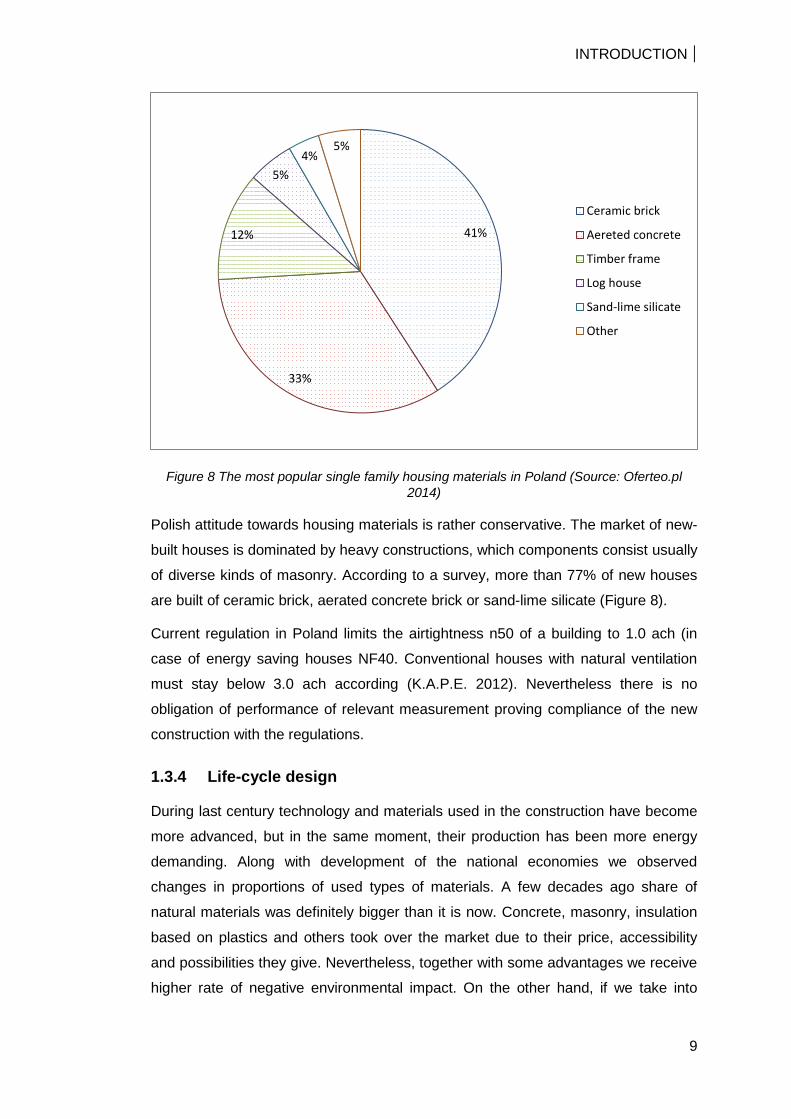
Figure 8 The most popular single family housing materials in Poland (Source: Oferteo.pl 2014)
Polish attitude towards housing materials is rather conservative. The market of new-
built houses is dominated by heavy constructions, which components consist usually
of diverse kinds of masonry. According to a survey, more than 77% of new houses
are built of ceramic brick, aerated concrete brick or sand-lime silicate (Figure 8).
Current regulation in Poland limits the airtightness n50 of a building to 1.0 ach (in
case of energy saving houses NF40. Conventional houses with natural ventilation
must stay below 3.0 ach according (K.A.P.E. 2012). Nevertheless there is no
obligation of performance of relevant measurement proving compliance of the new
construction with the regulations.
1.3.4 Life-cycle design
During last century technology and materials used in the construction have become
more advanced, but in the same moment, their production has been more energy
demanding. Along with development of the national economies we observed
changes in proportions of used types of materials. A few decades ago share of
natural materials was definitely bigger than it is now. Concrete, masonry, insulation
based on plastics and others took over the market due to their price, accessibility
and possibilities they give. Nevertheless, together with some advantages we receive
higher rate of negative environmental impact. On the other hand, if we take into
41%
33%
12%
5% 4%
5%
Ceramic brick
Aereted concrete
Timber frame
Log house
Sand-lime silicate
Other

INTRODUCTION
10
consideration contemporary materials, it may happen, that price of a product will be
misleading. A cheaper product might have bigger ecological footprint than more
expensive one. Furthermore, costs and activities required for maintenance during
whole life cycle of a building can turn up-side-down initial financial and ecological
assessment of the products. Hence, this thesis focuses on analysis during life cycle
of a building.
Assessment of ecological impact – Life Cycle Assessment
The Life Cycle Assessment (LCA) reports and assesses all inputs (for example:
energy, raw material, water and others), outputs (emissions, product, co-product,
waste and others) and environmental consequences of a product (goods and
services) during all phases of its life, including production, transportation, operation,
disposal and others. Any social or economic aspects are excluded. Main purpose is
to give exhaustive information and opportunity of benchmarking of the products or
buildings in range of an environmental footprint. It allows to choose components
according to the scientific environmental characteristics (ISO14040 2009; ISO14044
2006).

INTRODUCTION
11
Figure 9 Definition of life cycle stages according to EN15804 2012

INTRODUCTION
12
Assessment of economic impact – Life Cycle Cost
The Life Cycle Cost (LCC) is a tool serving for evaluation of costs of a product
(goods and services) during all stages of its life including production, transportation,
operation, disposal and others. The main purpose of the study is to support
decisions regarding various investment scenarios, design optimization, components,
etc. and assess their financial benefits (Islam et al. 2015). Ideally, LCC should be
performed during planning phase, giving the biggest saving potential during life
cycle (Figure 10). “Up to 80 % of the operation, maintenance and replacement costs
of a building can be influenced in the first 20 % of the design process” (ISO 2009,
p. 12). The final result should include such parameters like change of costs of
energy, products and services, but discounted to current value of the money (ISO
2009). The relevant definitions are explained in chapter 2.5.
Figure 10 Scope to influence LCC savings over time (Source: ISO 2009)
Literature review
There is no complete comparative research concerning all aspects or cases
published. Nonetheless, several studies investigate some of proposed in this
research features.
Wang et al (2009) performed simulation based research on conceptualization of
zero-energy house in UK and possible solutions necessary to implement. Life cycle
design was not approached.
Citherlet & Defaux (2007) focused on three variants of a house in Switzerland, but
only in terms of building certification and life cycle assessment. One of the crucial
INTRODUCTION
13
input factors – service life of the house was not described though. Hence, the results
are incomparable with other studies.
Feist (1997) in his non-peered research focused on life cycle energy analyses of six
types of houses in Germany. As expected, invented by him passive house
performed the best during 80 years life cycle. Due to improvements on the market of
construction products and systems, the study might be not up-to-date anymore.
Atanasiu et al. (2012) in his research investigates nearly-zero energy housing
possibilities in Poland comparing diverse options of heating for a few variants of the
single family house. He takes into consideration cost, energy demand and CO2
emissions. However, study is focused on the systems, instead of passive solar
design or specific properties of the materials. Moreover, environmental impact is
limited to only one factor.
Audenaert et al. (2008) performed economic analysis of a passive, low-energy and
conventional houses in Belgian market and environment conditions. It was pointed
out that economic feasibility of passive house is highly dependent on source of the
energy and resulting from it price and its annual growth. Taking into consideration
the most common in Belgium gas heating a passive house becomes profitable in its
life cycle only in case of doubtful energy price increase >10% annually. However,
Badescu (2007) proved that application of ground source heat pump for house
heating systems brings economically the best results.
Economic viability of passive houses was also investigated by Galvin (2014). He
refers to big amount of studies presenting big discrepancy between measured and
modelled values of energy demand of both conventional and passive houses
ranging from 20% to 250% of their Energy Performance Ratings resulting obviously
from various behavioural schemes of the occupants. Moreover, he questions the
typical experts’ assumptions regarding future fuel price increase and the discount
rate suggesting that the latter is investor household based. According to the author,
using a rule of thumb, a potential investor should believe that a passive house would
out-perform a standard house by 50 kWh/m² per annum in order to pay back in less
than 25 years.
Rammed earth is a very prolific construction material for hot and arid climates. Its
use, performance and possible flaws with various position of insulation in cold
climate of Canada were analysed by Fix and Richman (2009). Technical feasibility
studies are the only ones they focused on, in contrary to Dong et al. (2015), who
takes into consideration Life Cycle Cost as well. The research in which they

INTRODUCTION
14
investigate optimization of insulated cavity rammed earth walls is performed in three
different climates of Australia. Nevertheless, the range of winter temperatures in the
coldest one is much higher than in Poland.
Thiers & Peuportier (2012) and Citherlet & Defaux (2007) point out impact of
national electricity generation mix on LCA results. In countries with developed
nuclear or renewable electricity supply, electricity driven devices like heat pumps are
put in favours due to lower environmental impact. In Poland major part in electricity
generation play solid fuels, so other solutions in regard of building services might be
applicable in this context.
METHOD
15
2 METHOD
2.1 Overview
Due to the high cost, an experiment with use of built examples, followed by their
long term measurements is unlikely to happen. Hence, simulation of a presented
problem was chosen as a tool. Life cycle assessment (LCA) and Life cycle costing
(LCC) based on publically available databases and results of dynamic energy
simulation performed in EnergyPlus software were determined as a basic
methodology. As every energy simulation engine, EnergyPlus is inaccurate.
However, it allows to estimate and, what is more important, compare the results,
which are considered to contain the same level of error. Obtained result will bring an
answer with the enough accuracy for the target group of this research.
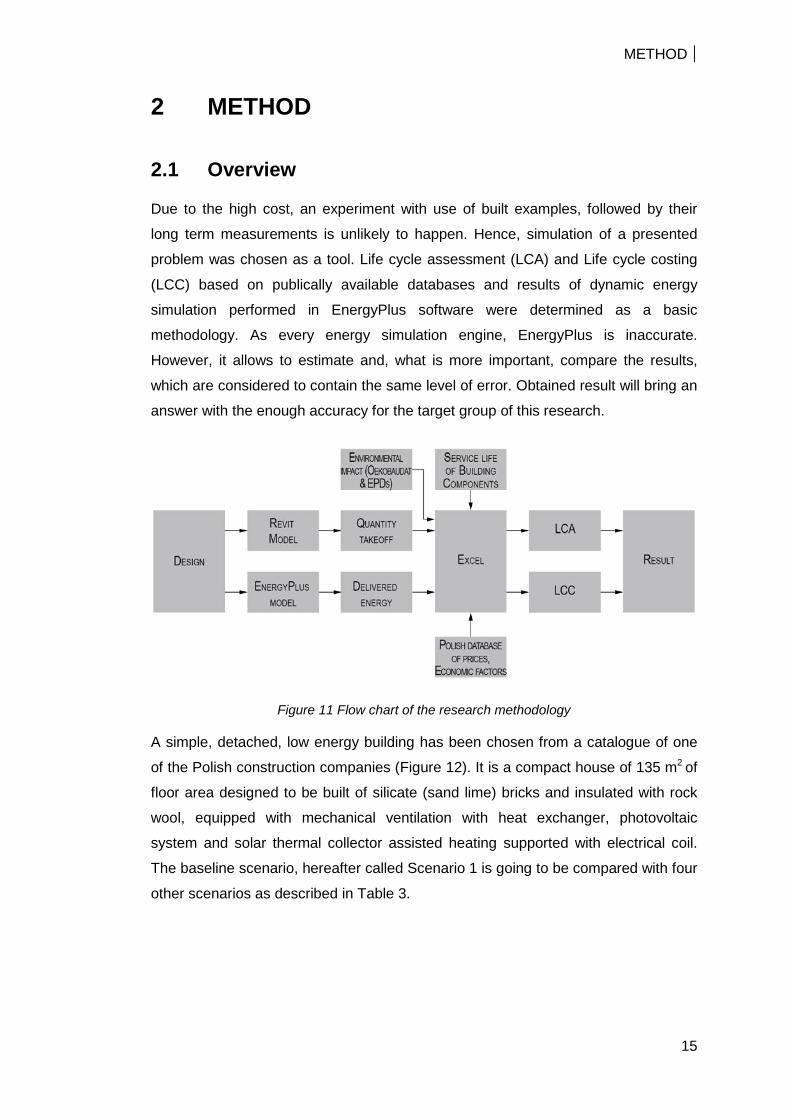
Figure 11 Flow chart of the research methodology
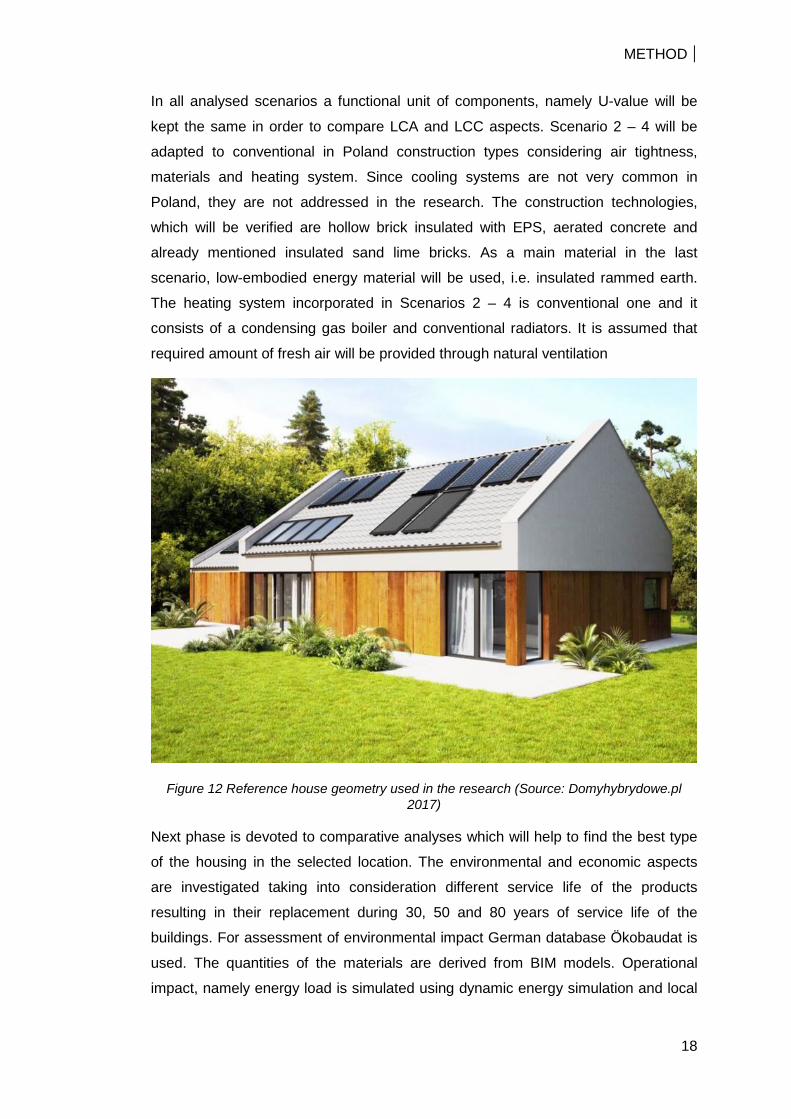
A simple, detached, low energy building has been chosen from a catalogue of one
of the Polish construction companies (Figure 12). It is a compact house of 135 m2 of
floor area designed to be built of silicate (sand lime) bricks and insulated with rock
wool, equipped with mechanical ventilation with heat exchanger, photovoltaic
system and solar thermal collector assisted heating supported with electrical coil.
The baseline scenario, hereafter called Scenario 1 is going to be compared with four
other scenarios as described in Table 3.

METHOD
16
Table 3 Overview of the properties of studied scenarios
Property Scenario 1 Scenario 2 Scenario 3 Scenario 4 Scenario 5
Main feature Sand-lime construction Advanced building services
Sand lime construction Conventional building services
Brick construction Conventional building services
Aerated concrete construction Conventional building services
Rammed earth construction Conventional building services
Area [m2] 135
Construction of the external walls
Gypsum plaster Sand lime brick
Rock wool Silicate-silicone plaster
Sand-concrete plaster Hollow brick EPS Acrylic plaster
Sand-concrete plaster Aerated concrete Acrylic plaster
Clay plaster Rammed earth Wood fibre insulation Lime plaster
U-value of the external walls [W/(m2K)] 0.15
Construction of the ceiling* Gypsum plaster
Gypsum card plate Vapour Protection
Rock wool
Sand-concrete plaster Gypsum card plate Vapour Protection
Rock wool
Clay plaster Clay plate Wood fibre insulation
U-value of the ceiling [W/(m2K)] 0.88
Construction of the slab Wooden floor
Reinforced concrete slab XPS
Wooden floor Reinforced concrete slab Foam Glass
U-value of the slab [W/(m2K)] 0.18
Construction of the windows 4e-10-4-10-e4 Krypton 92%
U-value of the windows [W/(m2K)] 0.7
g-value of the windows 0.62 Airtightness n50 [ach] 0.6 1.7
*ceiling is the part of thermal envelope
METHOD
17
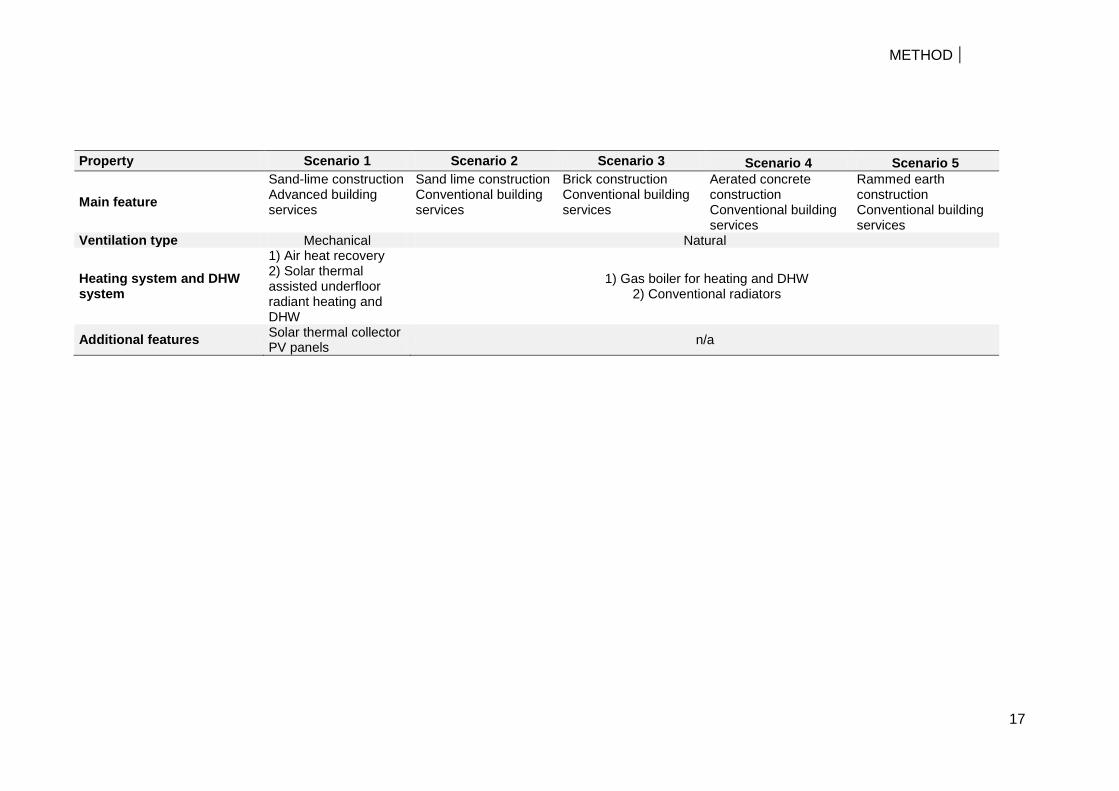
Property Scenario 1 Scenario 2 Scenario 3 Scenario 4 Scenario 5
Main feature Sand-lime construction Advanced building services
Sand lime construction Conventional building services
Brick construction Conventional building services
Aerated concrete construction Conventional building services
Rammed earth construction Conventional building services
Ventilation type Mechanical Natural
Heating system and DHW system
1) Air heat recovery 2) Solar thermal assisted underfloor radiant heating and DHW
1) Gas boiler for heating and DHW 2) Conventional radiators
Additional features Solar thermal collector PV panels n/a
METHOD
18
In all analysed scenarios a functional unit of components, namely U-value will be
kept the same in order to compare LCA and LCC aspects. Scenario 2 – 4 will be
adapted to conventional in Poland construction types considering air tightness,
materials and heating system. Since cooling systems are not very common in
Poland, they are not addressed in the research. The construction technologies,
which will be verified are hollow brick insulated with EPS, aerated concrete and
already mentioned insulated sand lime bricks. As a main material in the last
scenario, low-embodied energy material will be used, i.e. insulated rammed earth.
The heating system incorporated in Scenarios 2 – 4 is conventional one and it
consists of a condensing gas boiler and conventional radiators. It is assumed that
required amount of fresh air will be provided through natural ventilation
Figure 12 Reference house geometry used in the research (Source: Domyhybrydowe.pl 2017)
Next phase is devoted to comparative analyses which will help to find the best type
of the housing in the selected location. The environmental and economic aspects
are investigated taking into consideration different service life of the products
resulting in their replacement during 30, 50 and 80 years of service life of the
buildings. For assessment of environmental impact German database Ökobaudat is
used. The quantities of the materials are derived from BIM models. Operational
impact, namely energy load is simulated using dynamic energy simulation and local
METHOD
19
weather data. For LCC similar strategy is used. The difference is the ‘impact’, which
in this case is money, with its changing value over the years. Hence, discount and
growth rates are introduced and the result is presented in terms of Net Present
Value.
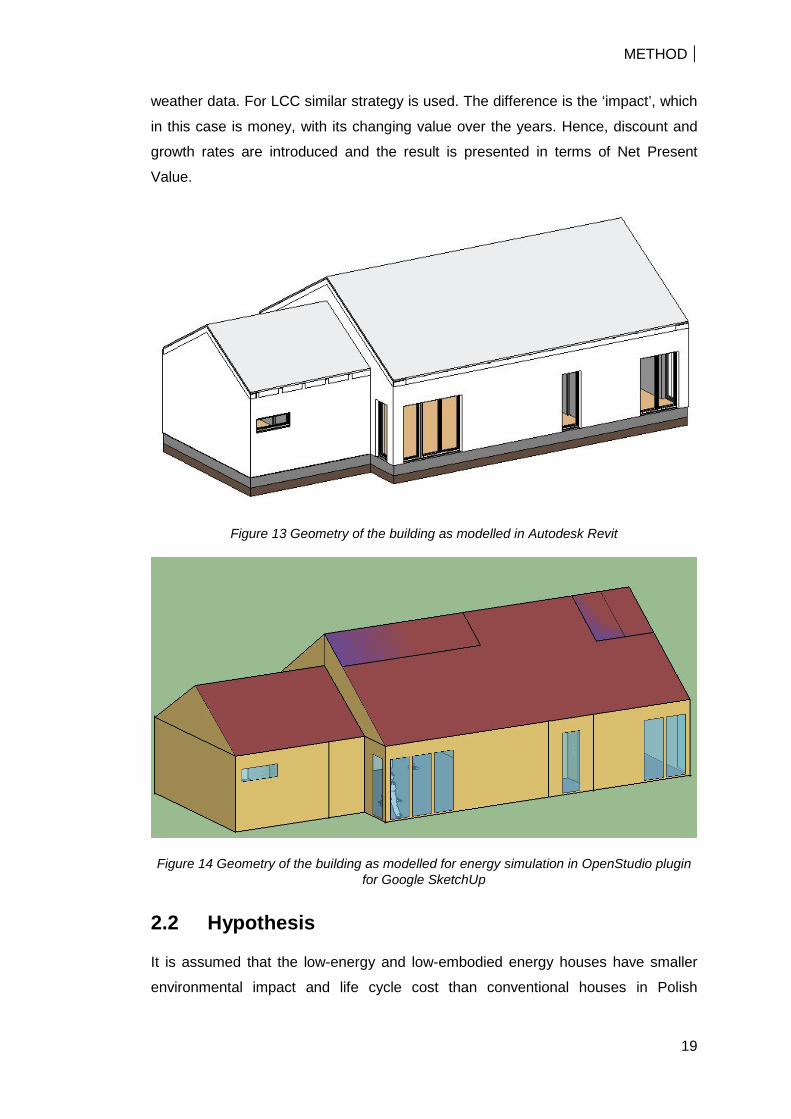
Figure 13 Geometry of the building as modelled in Autodesk Revit
Figure 14 Geometry of the building as modelled for energy simulation in OpenStudio plugin for Google SketchUp
2.2 Hypothesis
It is assumed that the low-energy and low-embodied energy houses have smaller
environmental impact and life cycle cost than conventional houses in Polish
METHOD
20
conditions concerning the climate and electrical energy mix. The major question is to
what extent choice of the construction materials and heating strategy has impact on
the final result of mentioned economic and environmental analyses.
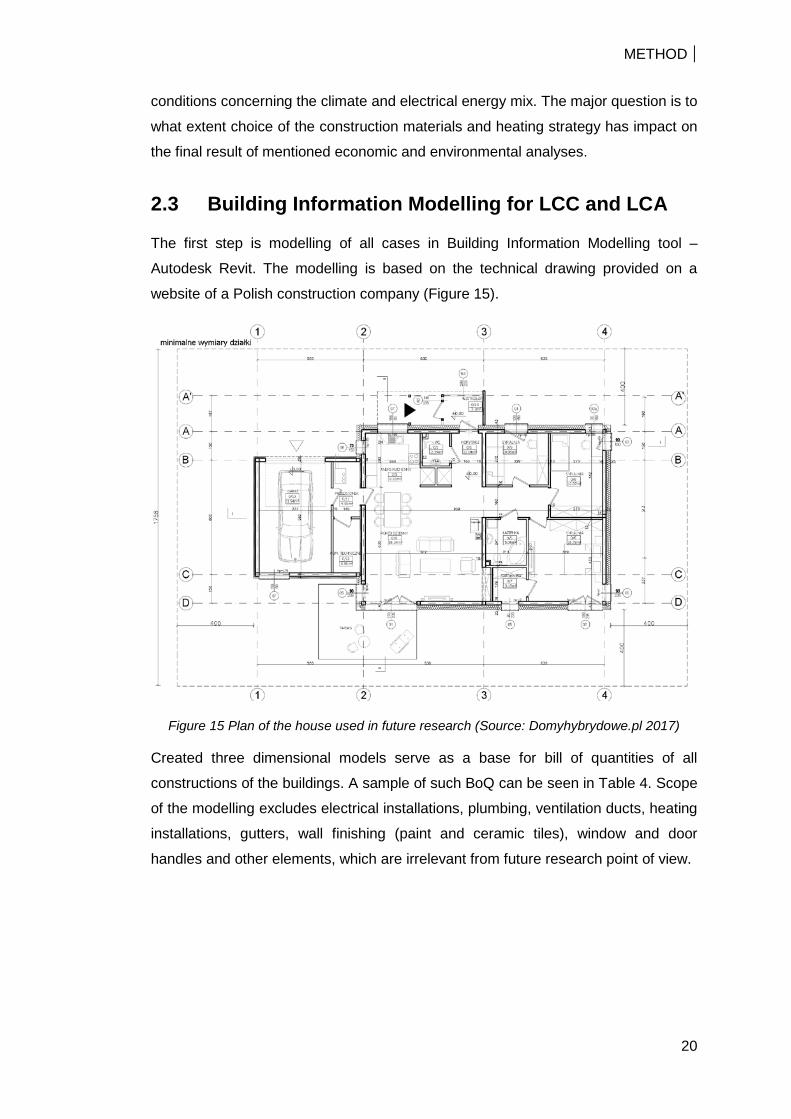
2.3 Building Information Modelling for LCC and LCA
The first step is modelling of all cases in Building Information Modelling tool –
Autodesk Revit. The modelling is based on the technical drawing provided on a
website of a Polish construction company (Figure 15).
Figure 15 Plan of the house used in future research (Source: Domyhybrydowe.pl 2017)
Created three dimensional models serve as a base for bill of quantities of all
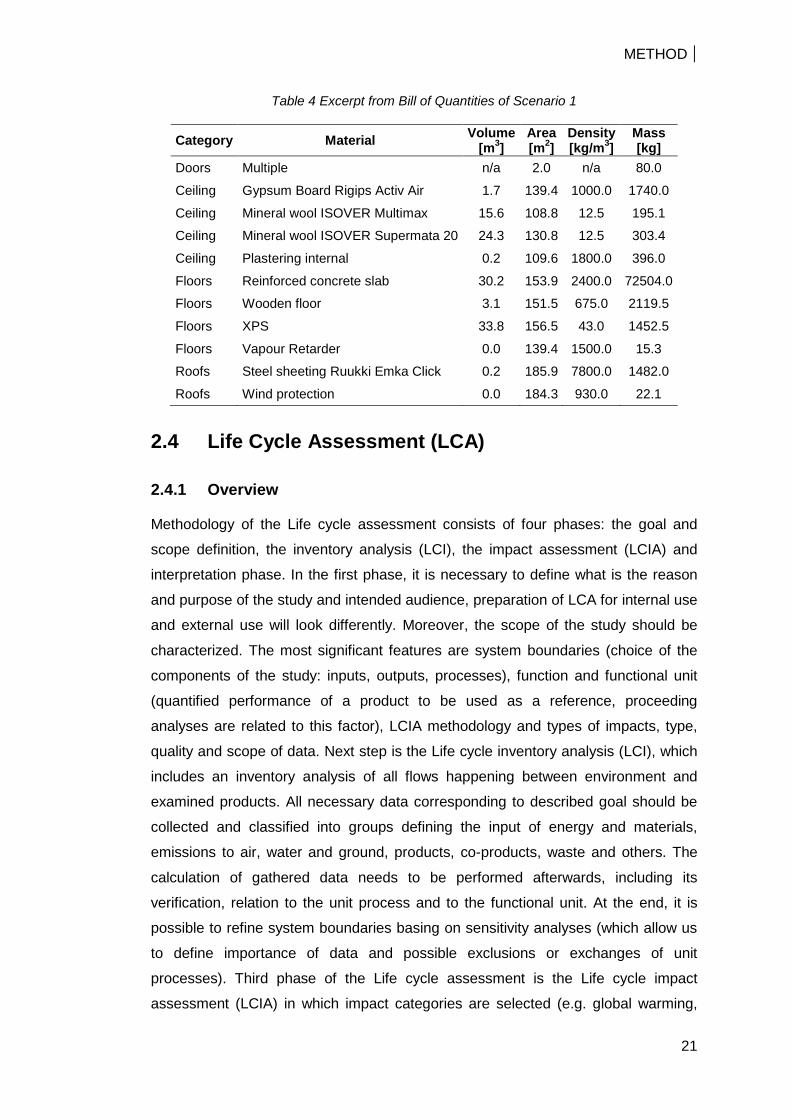
constructions of the buildings. A sample of such BoQ can be seen in Table 4. Scope
of the modelling excludes electrical installations, plumbing, ventilation ducts, heating
installations, gutters, wall finishing (paint and ceramic tiles), window and door
handles and other elements, which are irrelevant from future research point of view.
METHOD
21
Table 4 Excerpt from Bill of Quantities of Scenario 1
Category Material Volume [m3]
Area [m2]
Density [kg/m3]
Mass [kg]
Doors Multiple n/a 2.0 n/a 80.0
Ceiling Gypsum Board Rigips Activ Air 1.7 139.4 1000.0 1740.0
Ceiling Mineral wool ISOVER Multimax 15.6 108.8 12.5 195.1
Ceiling Mineral wool ISOVER Supermata 20 24.3 130.8 12.5 303.4
Ceiling Plastering internal 0.2 109.6 1800.0 396.0
Floors Reinforced concrete slab 30.2 153.9 2400.0 72504.0
Floors Wooden floor 3.1 151.5 675.0 2119.5
Floors XPS 33.8 156.5 43.0 1452.5
Floors Vapour Retarder 0.0 139.4 1500.0 15.3
Roofs Steel sheeting Ruukki Emka Click 0.2 185.9 7800.0 1482.0
Roofs Wind protection 0.0 184.3 930.0 22.1
2.4 Life Cycle Assessment (LCA)
2.4.1 Overview
Methodology of the Life cycle assessment consists of four phases: the goal and
scope definition, the inventory analysis (LCI), the impact assessment (LCIA) and
interpretation phase. In the first phase, it is necessary to define what is the reason
and purpose of the study and intended audience, preparation of LCA for internal use
and external use will look differently. Moreover, the scope of the study should be
characterized. The most significant features are system boundaries (choice of the
components of the study: inputs, outputs, processes), function and functional unit
(quantified performance of a product to be used as a reference, proceeding
analyses are related to this factor), LCIA methodology and types of impacts, type,
quality and scope of data. Next step is the Life cycle inventory analysis (LCI), which
includes an inventory analysis of all flows happening between environment and
examined products. All necessary data corresponding to described goal should be
collected and classified into groups defining the input of energy and materials,
emissions to air, water and ground, products, co-products, waste and others. The
calculation of gathered data needs to be performed afterwards, including its
verification, relation to the unit process and to the functional unit. At the end, it is
possible to refine system boundaries basing on sensitivity analyses (which allow us
to define importance of data and possible exclusions or exchanges of unit
processes). Third phase of the Life cycle assessment is the Life cycle impact
assessment (LCIA) in which impact categories are selected (e.g. global warming,

METHOD
22
water depletion, acidification and others) and then defined. All results from previous
phase (LCI) are assigned to suitable impact categories and characterized.
Additionally, there may be performed optional elements: grouping, normalization,
weighting and data quality analyses. Last phase of the LCA is interpretation of the
inventory and an impact assessment combined together. It should deliver some
conclusions, limitations and recommendations coherent to the goal and scope
defined at the beginning. Interpretations should include also sensitivity check, which
main point is assessment of reliability of the results under influence of uncertainties.
An additional part of the LCA is reporting, which structure differs depending on
intended audience (ISO14040 2009; ISO14044 2006).
2.4.2 Scope of the Life Cycle Assessment
The functional unit of the LCA performed in this master’s thesis is a single family
house occupied by a family of four over a fifty-year service life of the building. After
analyses of available data the scope of the LCA was determined to include the LCA
stages as marked below on Figure 16. Therefore, the final selection of LCA stages
can be referred as cradle to gate with options including its construction (stages A1-
A4), replacement (B4), operational energy use (B6), operational water use (B7),
disposal (stages C2-C4). Benefits of reuse, recovery and recycle potential (stage D)
are studied additionally as well.
Figure 16 Scope of performed Life Cycle Assessment
As described in chapter 2.3, building components having minor impact on final
results are excluded from the study. Moreover, avoided impact is the same in every
scenario, due to exclusion of the same building components.
All building elements got assigned their hypothetical service life resulting in
particular amount of their replacement during the lifetime of the buildings according
to Association of the generally sworn and legally certified experts of Austria (2006)
and can be found in Annex B.

METHOD
23
2.4.3 Life Cycle Inventory (LCI)
The LCI phase was performed as described in chapter 2.3.
2.4.4 Life Cycle Impact Assessment (LCIA)
Due to influence of the age, origin and accuracy of the inventory data on precision of
LCA studies (Szalay 2007) German database Ökobaudat has been chosen as a
main source of environmental impact of relevant building elements. Ökobaudat
database has been developed by German Federal Ministry for the Environment,
Nature Conservation, Building and Nuclear Safety and is assumed to represent the
Polish conditions the best.
As presented in Table 2 on page 7, the Polish electrical energy mix significantly
varies from German one. Hence, the environmental impact values were excerpted
from a study referring to the Polish electrical energy mix (Lelek et al. 2016) and used
in this study. Nevertheless, the latter was assessed in regard of only five impact
categories in contrary to seven provided in Ökobaudat, what shortened future choice
of impact categories for whole research to following:
− Global Warming Potential [kg CO2 equiv.],
− Ozone Depletion Potential [kg CFC11 equiv.],
− Tropospheric Ozone Creation Potential [kg Ethene equiv.],
− Acidification Potential [kg SO2 equiv.],
− Abiotic Resource Depletion Potential of fossil fuels [MJ].
Following environmental indicators were excluded from data taken from Ökobaudat:
− Eutrophication Potential [kg PO4 equiv.],
− Abiotic Resource Depletion Potential for elements [kg Sb. equiv.].
Transport related LCA stages (A4 and C2) are based on an assumption that goods
are transported with a small truck over a distance of:
− 300 km in construction stage (A4),
− 15 km in disposal stage (C2).
The environmental impact of described transportation service after Ökobaudat.de is
presented in Table 5.

METHOD
24
Table 5 Environmental impact of transportation of 1000 kg of goods per km (Source: Ökobaudat.de 2015)
GWP [kg CO2 equiv.]
ODP [kg CFC11
equiv.]
POCP [kg Ethene
equiv.]
AP [kg SO2 equiv.]
ADPF [MJ]
0.1466 2.8E-13 -0.0002 0.00057 1.991
2.4.5 Normalization
“Normalization is the calculation of the magnitude of the category indicator results
relative to some reference information” (ISO14044 2006, p. 41). The absolute
results of each environmental impact category of LCA calculations are normalized
through division by a selected reference score resulting in their conversion to
unitless values. Such representation of the environmental indicators helps to
understand their relative impact. The reference scores used in this master’s thesis
were developed by Building Research Establishment and represents the
environmental impact of one European citizen
Table 6 Normalization factors based on impact of Western European citizen (BRE 2008)
Category Unit Per Citizen
Global Warming Potential [kg CO2 equiv.] 12,300
Ozone Depletion Potential [kg CFC 11 equiv.] 0.217
Tropospheric Ozone Creation Potential [kg ethene equiv.] 21.5
Acidification Potential [kg SO2 equiv.] 71.2
Abiotic Resource Depletion Potential of fossil fuels [MJ] 273,000
2.5 Life Cycle Costing
2.5.1 Overview
Methodology of LCC is comparable with the one of LCA, however the unit of the
impact of a building is expressed in monetary value. Therefore LCC can be split into
four phases as well:
− Goal and scope definition;
− Inventory analysis;
− Impact assessment;
− Interpretation phase.
METHOD
25
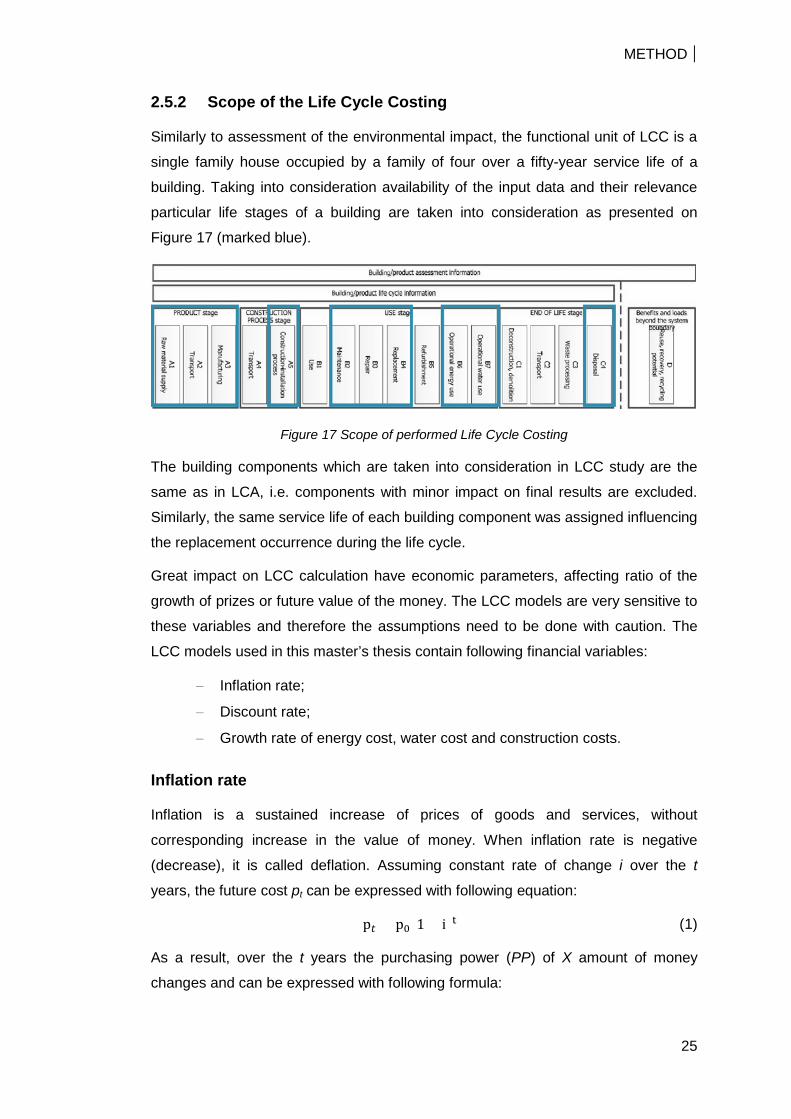
2.5.2 Scope of the Life Cycle Costing
Similarly to assessment of the environmental impact, the functional unit of LCC is a
single family house occupied by a family of four over a fifty-year service life of a
building. Taking into consideration availability of the input data and their relevance
particular life stages of a building are taken into consideration as presented on
Figure 17 (marked blue).
Figure 17 Scope of performed Life Cycle Costing
The building components which are taken into consideration in LCC study are the
same as in LCA, i.e. components with minor impact on final results are excluded.
Similarly, the same service life of each building component was assigned influencing
the replacement occurrence during the life cycle.
Great impact on LCC calculation have economic parameters, affecting ratio of the
growth of prizes or future value of the money. The LCC models are very sensitive to
these variables and therefore the assumptions need to be done with caution. The
LCC models used in this master’s thesis contain following financial variables:
− Inflation rate;
− Discount rate;
− Growth rate of energy cost, water cost and construction costs.
Inflation rate
Inflation is a sustained increase of prices of goods and services, without
corresponding increase in the value of money. When inflation rate is negative
(decrease), it is called deflation. Assuming constant rate of change i over the t
years, the future cost pt can be expressed with following equation:
p𝑡 = p0(1 + i)t ( 1)
As a result, over the t years the purchasing power (PP) of X amount of money
changes and can be expressed with following formula:

METHOD
26
𝑃𝑃[𝑋𝑡] =𝑋𝑡
(1 + 𝑖)𝑡 ( 2)
The inflation rate incorporated in the calculations is 1.8% after the forecast of
Organisation for Economic Co-operation and Development for the year 2018 (OECD
2017).
Discount rate
Discount rate is a “factor reflecting the time value of money that is used to convert
cash flows occurring at different times to a common time” (ISO15686-5 2009, p. 4).
The discount rate affects Net Present Value of a cost occurring in the future by its
discounting. The more time distant cost is, the bigger discount ratio. Through
discounting the NPV is reduced and as result the importance of the future cost is
diminished.
According to Kohler et al. (2010, p. 72) the discount rate could be assumed as one
of the follows:
− “The discount rate of a 10 year government bond;
− An average hypothetical discount rate for investments in real estate
predominantly made by third parties;
− The relevant return on property;
− A discount rate appropriate to the particular risk (the higher risk, the
higher discount rate);
− A discount rate based on a company’s own defined or desired return on
capital.”
The discount rate of 3.0% is assigned according to the first point. It is based on past
trading and a forecast of tradingeconomics.com (2017).
Nevertheless, described discount rate is nominal, what means that it does not
include future change of value of money known as inflation. The real discount rate
(incl. inflation) can be calculated using following formula:
𝑑′ =1 + 𝑑1 + 𝑖
− 1 ( 3)
where
i average yearly inflation
d nominal yearly discount rate
d’ real yearly discount rate
METHOD
27
Growth rate
Historical patterns show that change of price of some goods or services not always
go in line with inflation rate. Hence, another set of parameters which is taken into
consideration in LCC calculation was determined, namely growth rate of:
− 0.5% for construction cost based on a trend of construction costs in
Poland in last 10 years (Eurostat 2017a);
− 2.4% for electrical energy cost based on a trend of electrical energy costs
in Poland in last 10 years (Eurostat 2017b);
− 2.4% for feed-in remuneration currently the feed-in tariff is equal to the
electrical energy cost, therefore it is assumed that it will rise accordingly;
− 4.0% for gas cost based on a trend of gas costs in Poland in last 10 years
(Eurostat 2017c);
− 3.0% for water cost based on a trend of water from municipal water
supply cost on last 9 years (GUS 2017).
The growth rate is assumed to be constant over the years. The price over t periods
is calculated using following equation:
𝑝𝑡 = 𝑝0(1 + 𝑔)𝑡 ( 4)
where
p0 Initial price
pt price over t periods
g growth rate
2.5.3 Inventory analysis
The inventory analysis phase was performed as described in chapter 2.3.
2.5.4 Impact assessment
There are three main groups of costs which are assigned to every building
throughout its life cycle and which have impact on NPV of each of them:
− Investment costs;
− Periodic costs;
− End of life costs.
All the prices used in the study exclude VAT.

METHOD
28
Investment cost
All components derived from inventory analysis have assigned its investment cost
consisting of labour cost and material cost. The prices come from a polish database
(Wolters Kluwer 2016). Transportation costs, material losses resulting from
construction processes, as well as cost of the land are excluded from the
calculation.
Periodic costs
There are several groups of periodic costs which are taken into consideration. Some
of them are related to everyday use of media like water or energy and appear in
short intervals, e.g. monthly. Others result from maintenance of the building and
ware-and-tear of its components. The assumptions concerning all of them are
described below.
Energy and water cost
There are two types of energy investigated throughout all research scenarios,
namely electrical energy obtained from the grid and thermal energy generated on-
site using natural gas. The prices incorporated into the calculations are the prices of
respective energy types for medium type households and they amount to 0.03917
€/kWh for natural gas and to 0.1332 €/kWh for electricity (Eurostat 2017b; Eurostat
2017c).
Similarly to introduced energy cost, water cost is based on average value for
municipal water supply from year 2016 and it is equal 2.55 €/m³ (GUS 2017).
Cleaning
The cost of cleaning is excluded from LCC calculation.
Replacement and maintenance
All building components have assigned their service life according to Association of
the generally sworn and legally certified experts of Austria (2006). As a result, the
occurrence of replacement during service life of a building was determined.
The maintenance cost consists of the following parts and associated costs:
− Inspection and maintenance resulting in 0.5% of cost of a component per
year;
− Regular repair cost resulting in 1.0% of cost of a component per year;
− Irregular repair cost resulting in 1.0% of cost of a component per year.
METHOD
29
End of life cost
The last main group of cost includes end of life costs of building components, which
appear both, after replacement of an element and at the end of service life of a
whole building. The cost is simplified to landfill cost only. The adobe components of
scenario 5 i.e. rammed earth walls, clay plasters, etc. are assumed to consist fully of
the ingredients existing in the soil of the construction plot, therefore at their end of
life they will be disposed on the spot resulting in no cost.
Feed-in remuneration
The Scenario 1 has installed photovoltaic installation, which besides on-site
electricity use feeds in the grid as well. The Polish Act on Renewable Energy
Sources (2016) states that 80% of electrical energy fed into the grid within preceding
365 days can be balanced with utilised one. Hence, the feed-in tariff used in the
calculation is assumed to be the same as electricity price, but applied only to 80% of
supplied energy.
2.5.5 Interpretation phase
The result of LCC calculation is presented as a Net Present Value (NPV), which is
sum of all present values of all costs appearing during the life cycle of a building as
described in previous chapter. The present value is the result of discounting future
cash flows and it defines a value which “should be allocated for future expenditure
on an asset (ISO 2009 p. 25).”
𝑁𝑃𝑉 = �𝐶𝑛
(1 + 𝑑)𝑛
𝑝
𝑛=1
( 5)
where
Cn cost in year n;
d real discount rate per year;
n number of years between the base date and the occurrence of the
cost;
p is the period of analysis.
The crucial for the calculation real discount rate is assumed as described in chapter
2.5.2.

METHOD
30
2.6 Building Energy Modelling
Dynamic energy modelling is an approach which goal is to represent numerous
physical phenomena occurring inside a building as close as possible to reality.
Thanks to the complex and interdependent equations behind, the result is more
reliable than simple stable state calculations lacking impact of one phenomenon on
another. The simulations are performed using a calculation engine EnergyPlus,
which is developed by an American governmental institution, namely Office of
Energy Efficiency and Renewable Energy. “EnergyPlus implements detailed building
physics for air, moisture, and heat transfer including treating radiative and
convective heat-transfer [...]; calculates lighting, [...] shading; supports flexible
component-level configuration of HVAC [...]; simulates sub-hourly timesteps to
handle fast system dynamics and control strategies.” (energy.gov 2017)
Hence, Building Energy Modelling is incorporated in the study in order to determine
energy and water demand necessary for assessment of environmental and financial
impact of the operational phase of a building life cycle.
2.6.1 Geometry and zoning
Geometry and zones of all scenarios are the same. Due to size of the house and
simplicity of the model the thermal zones were assigned without any simplification,
i.e. each room of the house is assigned as separate thermal zone.
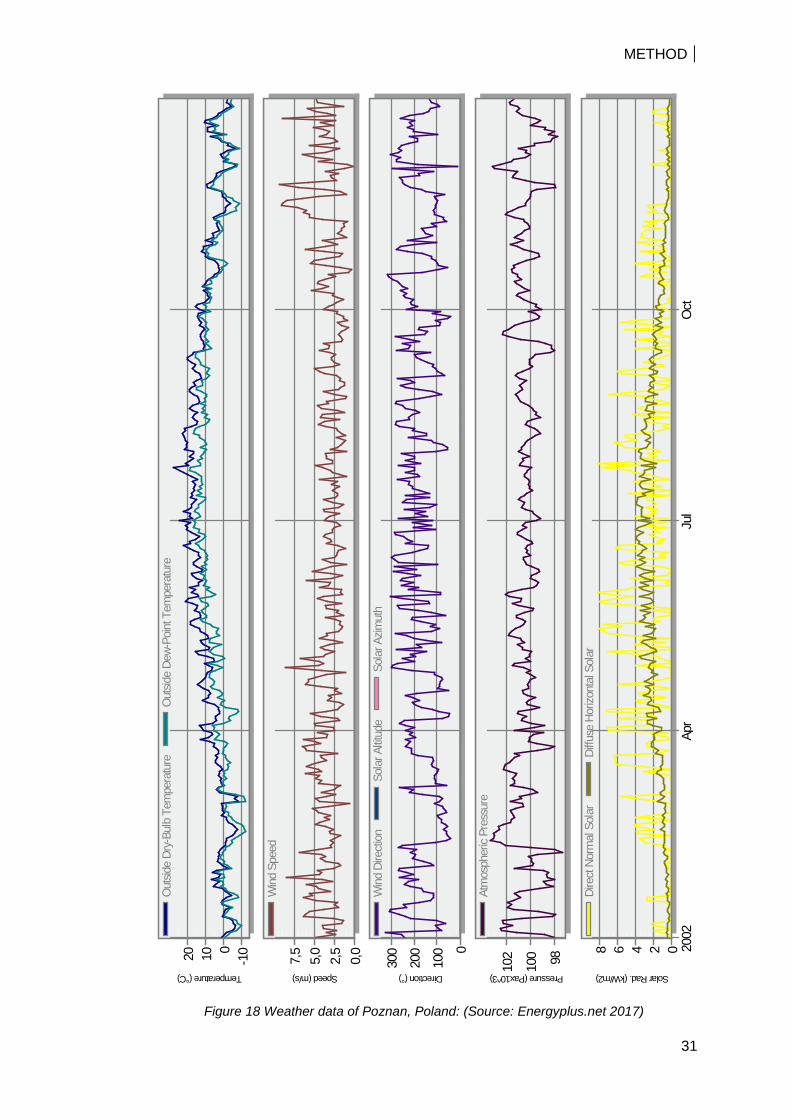
2.6.2 Weather data
The weather data used for simulation represents average weather of the city of
Poznan, Poland and it is based on measurements of nine reference years. The data
includes information on dry and wet bulb temperature, direction and speed of wind,
sky cover atmospheric pressure, and liquid precipitation. Solar radiation data in
contrary to other information is not measured, but calculated based previously
mentioned weather indicators and sun-earth geometry (ashrae.org 2017).
METHOD
31
Figure 18 Weather data of Poznan, Poland: (Source: Energyplus.net 2017)
-1001020 0,0
2,5
5,0
7,5 0
100
200
300
98
100
102 02468 20
02
Apr
Jul
Oct
Temperature (°C) Speed (m/s) Direction (°) Pressure (Pax10^3) Solar Rad. (kW/m2)
Out
side
Dry-
Bulb
Tem
pera
ture
Out
side
Dew-
Point
Tem
pera
ture
Wind
Spe
ed
Wind
Dire
ction
Sola
r Altit
ude
Sola
r Azim
uth
Atm
osph
eric
Pres
sure
Dire
ct N
orm
al S
olar
Diffu
se H
orizo
ntal
Sol
ar

METHOD
32
2.6.3 Input parameters
Thermal properties
Every investigated scenarios, even though build with different materials,
incorporates U-value as a functional unit. Nevertheless, other indicators like density
or specific heat capacity vary, what might result in small deviations of simulated
energy demand due to the thermal mass effect. The properties of building
components were modelled as described in Table 3 on page 16.
Air tightness
Important aspect of a building envelope is its airtightness. The assumed values
presented in Table 3 represent airtightness under 50 Pa pressure difference.
However, EnergyPlus does not provide possibility of such input. Therefore a
methodology allowing conversion of airtightness n50 to one under normal pressure
presented in a norm EN 12831:2003 is applied (Equation 6.
𝑉𝑖𝑛𝑓,𝑖 = 2 × 𝑉𝑖 × 𝑛50 × 𝑒𝑖 × ԑ𝑖 ( 6)
where
Vi heated volume [m³];
n50 air change rate per hour [h-1] under 50 Pa pressure difference;
ei shielding coefficient;
ԑi height correction factor.
The volume of each space was derived from BIM model, n50 air change rate per hour
as in Table 3 on page 16 and coefficients ei and ԑi from Table 7 and Table 8.
Table 7 Shielding coefficient (Source: PN-EN12831 2006)
Shielding class
e Heated space
without exposed openings
Heated space with
one exposed opening
Heated space with more than
one exposed opening
No shielding (buildings in windy areas, high rise buildings in city centres) 0 0.03 0.05
Moderate shielding (buildings in the country with trees or other buildings around them, suburbs)
0 0.02 0.03
Heavy shielding (average height buildings in city centres, buildings in forests) 0 0.01 0.02
METHOD
33
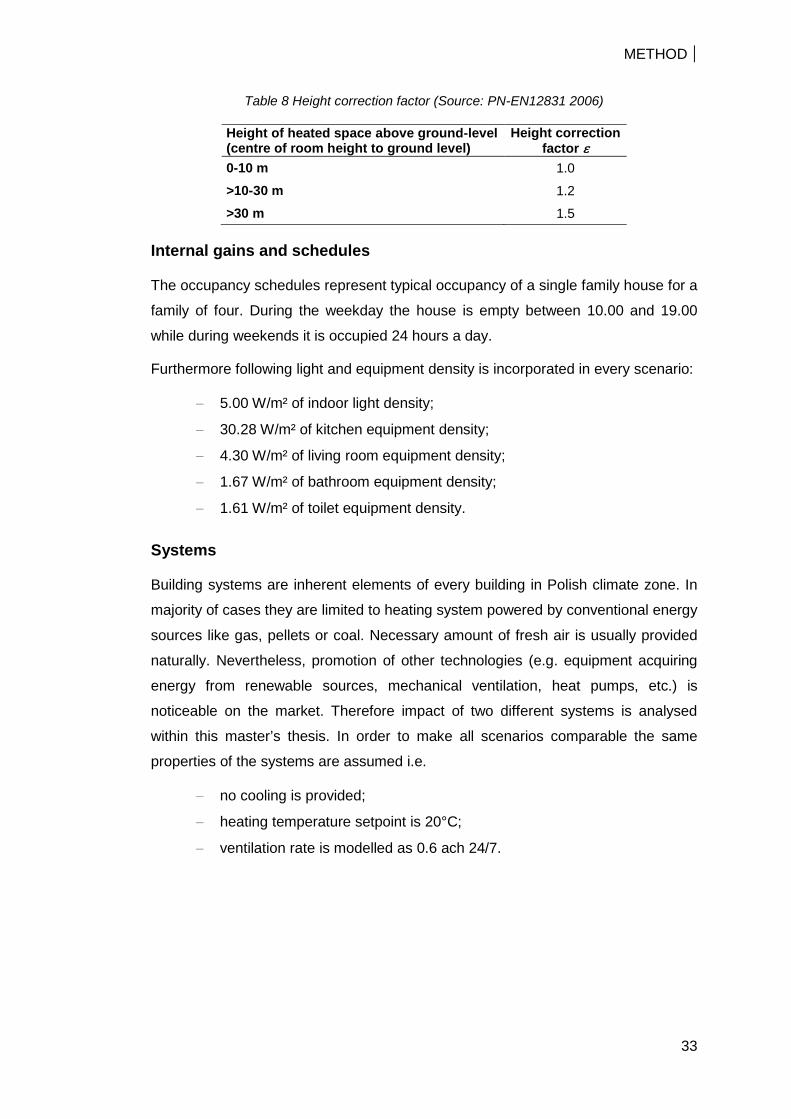
Table 8 Height correction factor (Source: PN-EN12831 2006)
Height of heated space above ground-level (centre of room height to ground level)
Height correction factor ԑ
0-10 m 1.0
>10-30 m 1.2
>30 m 1.5
Internal gains and schedules
The occupancy schedules represent typical occupancy of a single family house for a
family of four. During the weekday the house is empty between 10.00 and 19.00
while during weekends it is occupied 24 hours a day.
Furthermore following light and equipment density is incorporated in every scenario:
− 5.00 W/m² of indoor light density;
− 30.28 W/m² of kitchen equipment density;
− 4.30 W/m² of living room equipment density;
− 1.67 W/m² of bathroom equipment density;
− 1.61 W/m² of toilet equipment density.
Systems
Building systems are inherent elements of every building in Polish climate zone. In
majority of cases they are limited to heating system powered by conventional energy
sources like gas, pellets or coal. Necessary amount of fresh air is usually provided
naturally. Nevertheless, promotion of other technologies (e.g. equipment acquiring
energy from renewable sources, mechanical ventilation, heat pumps, etc.) is
noticeable on the market. Therefore impact of two different systems is analysed
within this master’s thesis. In order to make all scenarios comparable the same
properties of the systems are assumed i.e.
− no cooling is provided;
− heating temperature setpoint is 20°C;
− ventilation rate is modelled as 0.6 ach 24/7.

METHOD
34
System 1 – advanced
System 1 is incorporated within Scenario 1 and it is equipped with advanced heating
and energy generation systems containing following components (Figure 19 and
Figure 20):
− Mechanical ventilation with air heat recovery of 90% effectiveness;
− 5.46 m² of solar thermal flat plate collectors;
− Solar assisted underfloor radiant heating;
− Solar assisted DHW;
− 8.85 m² of photovoltaic panels;
− Inverter of 96% efficiency;
− Electrical backup coil.
Figure 19 Schema of the advanced system incorporated in Scenario 1 (Stiebel Eltron 2017)

METHOD
35
Figure 20 Schematic of the advanced system incorporated into Scenario 1
System 2 – simple
System 2 is incorporated within Scenarios 2 – 5 and it is equipped with simple
heating system containing following components:
− Gas boiler of 89% efficiency;
− Conventional convectors.
The required volume of fresh air is provided naturally.

RESULTS AND DISCUSSION
36
3 RESULTS AND DISCUSSION
3.1 Overview
The results of the energy simulation clearly show that energy demand of Scenarios
2 – 5 featuring conventional heating system, natural ventilation and no renewable
energy sources is two times bigger than in case of Scenario 1 (Figure 21). The
same figure shows that the building components not related directly to provision of
the heat or DHW (i.e. light and equipment) have minor effect on total energy
demand in all cases: respectively approx. 10% and 16% in Scenario 1 and 6% and
10% in Scenarios 2 – 5.
Figure 21 Site energy demand per year
Smaller heating and DHW energy demand of the Scenario 1 results on the one hand
from smaller heat losses due to better airtightness and mechanical ventilation
equipped with heat exchanger and on the other hand from incorporated equipment
allowing use of solar energy (solar thermal flat collectors and photovoltaic
installation). The contribution of on-site renewable energy to total energy use is
presented on Figure 22. As described in chapter 2.5.4, according to Polish
legislation 80% of surplus energy fed into the grid can be balanced with utilised one.
Therefore this ratio was taken into account in the calculation of the RES coverage
rate of total energy demand.
0
2,000
4,000
6,000
8,000
10,000
12,000
14,000
S1 S2 S3 S4 S5
Ener
gy u
se [k
Wh]
Scenario
Natural gas - DHW
Natural gas - Heating
Electricity - Fans
Electricity - Heating and DHW
Electricity - Equipment
Electricity - Light

RESULTS AND DISCUSSION
37
Figure 22 Coverage rate of energy in Scenario 1 by various energy sources
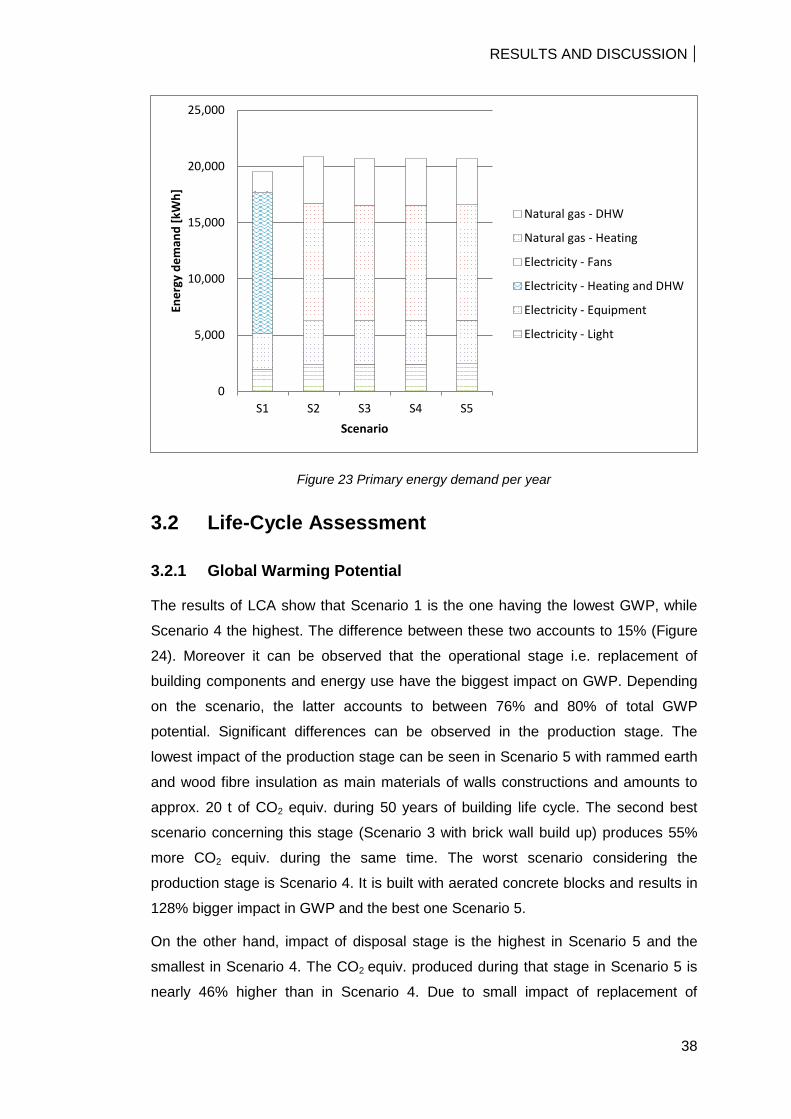
As described in chapter 1.3.2 the assumed primary energy conversion factor for
electrical energy is 3 and for natural gas 1.12.
The building analysed in Scenario 1 is equipped with solar thermal collectors and
photovoltaic panels. Nevertheless, remaining energy is provided from the grid in
form of electrical energy. The PEF of electrical energy is nearly 2.5 times larger than
PEF of gas source energy. As a result, the relative difference between all scenarios
concerning primary energy demand becomes smaller than in case of site energy.
Scenario 1 accounts to approx.19.5 MWh per annum, while Scenarios 2 to 5 to
approx.. 20.9 MWh per annum.
14%
15%
71%
Photovoltaic
Solar thermal
Utility
RESULTS AND DISCUSSION
38
Figure 23 Primary energy demand per year
3.2 Life-Cycle Assessment
3.2.1 Global Warming Potential
The results of LCA show that Scenario 1 is the one having the lowest GWP, while
Scenario 4 the highest. The difference between these two accounts to 15% (Figure
24). Moreover it can be observed that the operational stage i.e. replacement of
building components and energy use have the biggest impact on GWP. Depending
on the scenario, the latter accounts to between 76% and 80% of total GWP
potential. Significant differences can be observed in the production stage. The
lowest impact of the production stage can be seen in Scenario 5 with rammed earth
and wood fibre insulation as main materials of walls constructions and amounts to
approx. 20 t of CO2 equiv. during 50 years of building life cycle. The second best
scenario concerning this stage (Scenario 3 with brick wall build up) produces 55%
more CO2 equiv. during the same time. The worst scenario considering the
production stage is Scenario 4. It is built with aerated concrete blocks and results in
128% bigger impact in GWP and the best one Scenario 5.
On the other hand, impact of disposal stage is the highest in Scenario 5 and the
smallest in Scenario 4. The CO2 equiv. produced during that stage in Scenario 5 is
nearly 46% higher than in Scenario 4. Due to small impact of replacement of
0
5,000
10,000
15,000
20,000
25,000
S1 S2 S3 S4 S5
Ener
gy d
eman
d [k
Wh]
Scenario
Natural gas - DHW
Natural gas - Heating
Electricity - Fans
Electricity - Heating and DHW
Electricity - Equipment
Electricity - Light

RESULTS AND DISCUSSION
39
building components (2-6% of total impact) this stage can be assumed to be of
rather minor relevance. Nevertheless, it is important to mention that highest impact
during this stage is achieved by Scenario 1 (high performance building with
advanced building services).
Figure 24 Global warming potential during different stages of the life cycle
3.2.2 Ozone Depletion Potential
Looking at absolute values the worst is Scenario 1 where only production phase has
ODP as whole impact of Scenario 5. The result of the Scenario 1 is three times
bigger than the result of Scenario 5. The increased value of ODP in regard of energy
use results from electricity driven heating system, which due to Polish energy mix
relying mainly on solid fuels (as described in chapter 1.3.2) is two times bigger than
Scenarios incorporating a gas boiler.
The only difference between Scenario 1 and Scenario 2 besides airtightness is the
system. Scenario 1 incorporating advanced building services can be directly
translated into growth of impact of replacement stage. The difference between these
two scenarios in regard of replacement stages reaches 85%.
Significance of energy use during the service life is much smaller than in GWP
impact category amounts to 17% - 38%. On the other hand, impact of the production
stage (37% - 73%) as well as reuse, recovery and recycling potential become more
important. In fact, in some of the scenarios the latter exceeds total ODP. Effect of
-50,000
0
50,000
100,000
150,000
200,000
250,000
300,000
350,000
S1 S2 S3 S4 S5
kg C
O2 e
quiv
.
Scenario
Reuse, recovery, recyclingpotential
Disposal
Replacement
Operational energy use
Production and construction

RESULTS AND DISCUSSION
40
the disposal stage is negligible (1% - 3%). Depending on the scenarios replacement
stage has small impact of approx. 2% reaching in 35% in Scenario 1.
Big reuse, recovery and recycling potential is a result of thermal utilisation of
wooden roof construction.
Figure 25 Ozone depletion potential during different stages of the life cycle
-0.003
-0.002
-0.001
0.000
0.001
0.002
0.003
0.004
S1 S2 S3 S4 S5kg C
FC11
equ
iv.
Scenario
Reuse, recovery, recyclingpotential
Disposal
Replacement
Operational energy use
Production and construction

RESULTS AND DISCUSSION
41
3.2.3 Photochemical Ozone Creation Potential
Similarly to ODP, the differences between all the scenarios are more vivid than in
GWP (Figure 26). Clearly Scenario 5 built of rammed earth and wood fibre board
has the smallest POCP impact, mainly because of reduction of POCP in production
stage of the building. Scenario 4 – built of aerated concrete as an only case does
not have insulated walls what influence reduction of POCP in production and
replacement stage. Concerning operational energy use, it is visible that Scenarios 2
– 5, heated with gas boiler have more than three times bigger POCP impact than
Scenario 1 which is heated with solar energy and supporter with electrical heating
coil.
Figure 26 Photochemical ozone creation potential during different stages of the life cycle
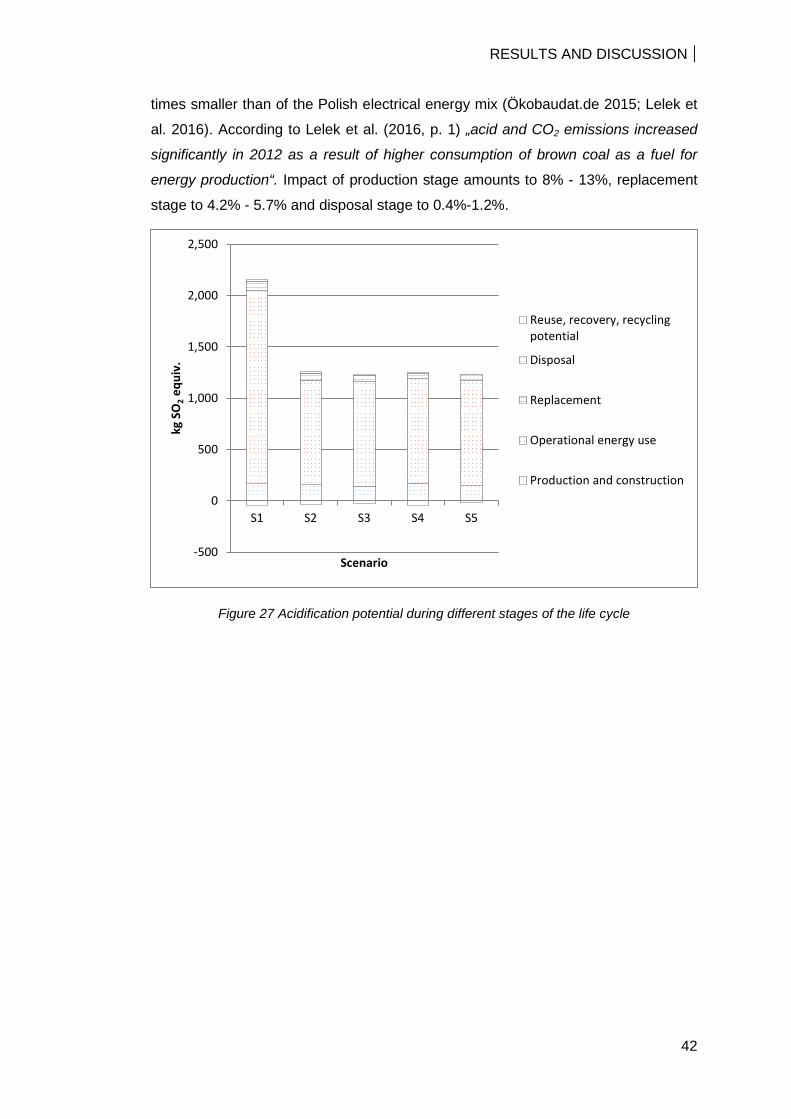
3.2.4 Acidification Potential
As seen on Figure 27, the results of Scenarios 2 – 5 are 40% better than Scenario
1. The component having the biggest impact on Acidification Potential in all
Scenarios is operational energy use. The differences between the Scenario 1
incorporating advanced, electrical building services and Scenarios 2 – 5 (with gas
boiler) are substantial. In Scenarios 2 – 5 energy use contributes in 81% - 83%,
while in Scenario 1 in 87%. Such difference results from particular electrical energy
mix in Poland described in chapter 1.3.2, which clearly puts in favour natural gas.
The acidification potential of the energy generated with natural gas is nearly 37
-10
0
10
20
30
40
50
60
70
80
S1 S2 S3 S4 S5
kg E
then
equ
iv.
Scenario
Reuse, recovery, recyclingpotential
Disposal
Replacement
Operational energy use
Production and construction
RESULTS AND DISCUSSION
42
times smaller than of the Polish electrical energy mix (Ökobaudat.de 2015; Lelek et
al. 2016). According to Lelek et al. (2016, p. 1) „acid and CO2 emissions increased
significantly in 2012 as a result of higher consumption of brown coal as a fuel for
energy production“. Impact of production stage amounts to 8% - 13%, replacement
stage to 4.2% - 5.7% and disposal stage to 0.4%-1.2%.
Figure 27 Acidification potential during different stages of the life cycle
-500
0
500
1,000
1,500
2,000
2,500
S1 S2 S3 S4 S5
kg S
O2 e
quiv
.
Scenario
Reuse, recovery, recyclingpotential
Disposal
Replacement
Operational energy use
Production and construction

RESULTS AND DISCUSSION
43
3.2.5 Abiotic Depletion Potential for Fossil Resources
Scenario 2 built of sand lime brick and using conventional building services has the
worst result in contrary to Scenario 1, which differs with the building services (and
related to the types of the energy sources) and airtightness.
The biggest impact (reaching depending on the scenario between 68% and 81%)
has again operational energy use stage. It is the smallest in Scenario 1 and differs
from other scenarios due to the electricity as an only source of energy. The impact
of the production stage is between 14% and 21%, replacement 4% - 9% and
disposal 0.4% - 1.2%.
Figure 28 Abiotic depletion potential for fossil resources
-500,000
0
500,000
1,000,000
1,500,000
2,000,000
2,500,000
3,000,000
3,500,000
4,000,000
4,500,000
S1 S2 S3 S4 S5
MJ
Scenario
Reuse, recovery, recyclingpotential
Disposal
Replacement
Operational energy use
Production and construction
RESULTS AND DISCUSSION
44
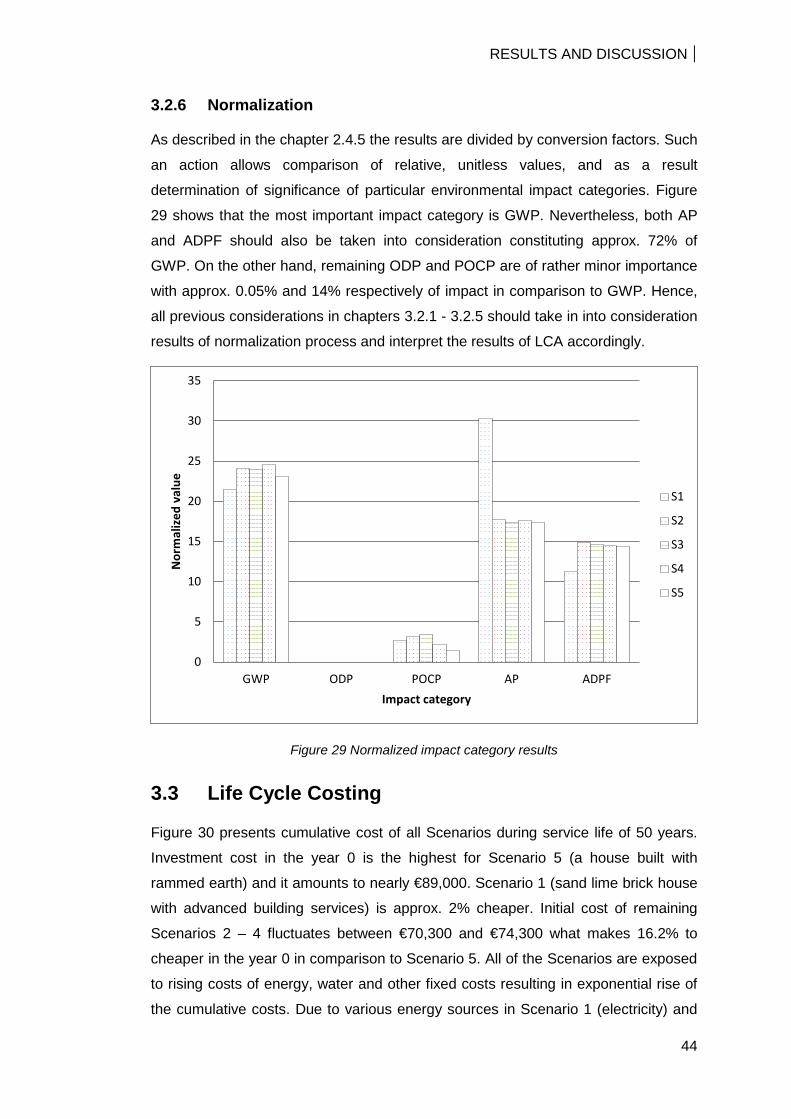
3.2.6 Normalization
As described in the chapter 2.4.5 the results are divided by conversion factors. Such
an action allows comparison of relative, unitless values, and as a result
determination of significance of particular environmental impact categories. Figure
29 shows that the most important impact category is GWP. Nevertheless, both AP
and ADPF should also be taken into consideration constituting approx. 72% of
GWP. On the other hand, remaining ODP and POCP are of rather minor importance
with approx. 0.05% and 14% respectively of impact in comparison to GWP. Hence,
all previous considerations in chapters 3.2.1 - 3.2.5 should take in into consideration
results of normalization process and interpret the results of LCA accordingly.
Figure 29 Normalized impact category results
3.3 Life Cycle Costing
Figure 30 presents cumulative cost of all Scenarios during service life of 50 years.
Investment cost in the year 0 is the highest for Scenario 5 (a house built with
rammed earth) and it amounts to nearly €89,000. Scenario 1 (sand lime brick house
with advanced building services) is approx. 2% cheaper. Initial cost of remaining
Scenarios 2 – 4 fluctuates between €70,300 and €74,300 what makes 16.2% to
cheaper in the year 0 in comparison to Scenario 5. All of the Scenarios are exposed
to rising costs of energy, water and other fixed costs resulting in exponential rise of
the cumulative costs. Due to various energy sources in Scenario 1 (electricity) and
0
5
10
15
20
25
30
35
GWP ODP POCP AP ADPF
Nor
mal
ized
val
ue
Impact category
S1
S2
S3
S4
S5
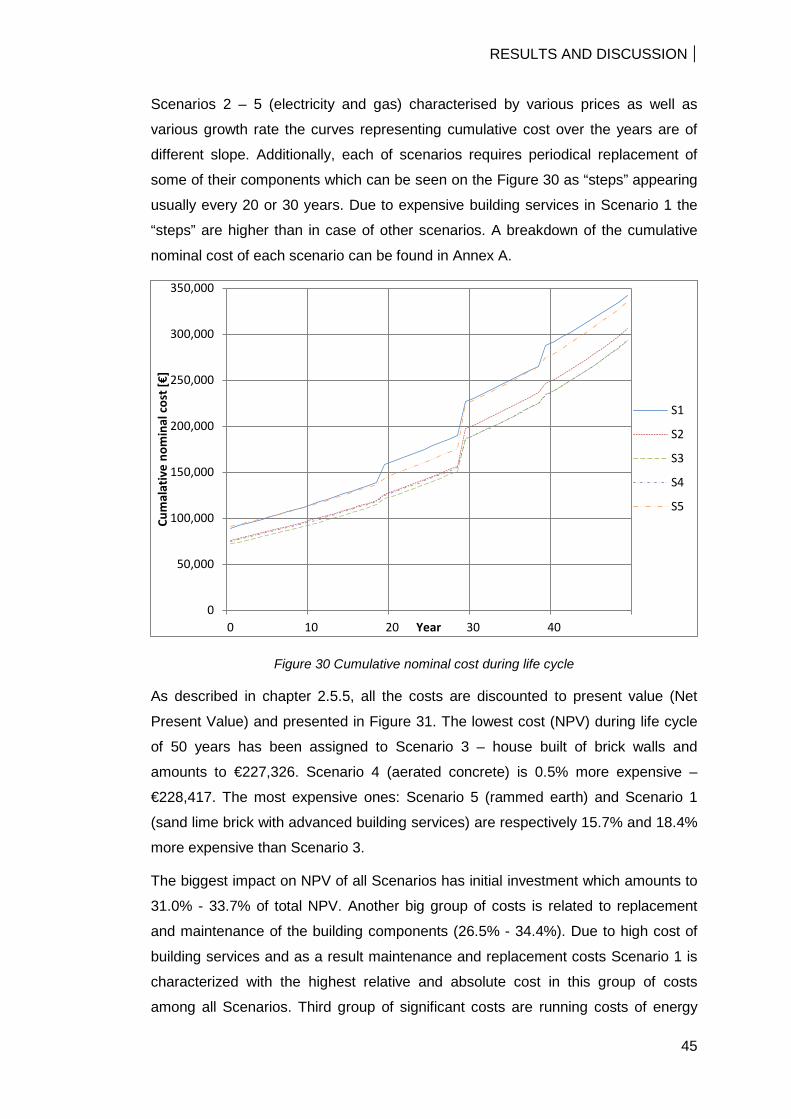
RESULTS AND DISCUSSION
45
Scenarios 2 – 5 (electricity and gas) characterised by various prices as well as
various growth rate the curves representing cumulative cost over the years are of
different slope. Additionally, each of scenarios requires periodical replacement of
some of their components which can be seen on the Figure 30 as “steps” appearing
usually every 20 or 30 years. Due to expensive building services in Scenario 1 the
“steps” are higher than in case of other scenarios. A breakdown of the cumulative
nominal cost of each scenario can be found in Annex A.
Figure 30 Cumulative nominal cost during life cycle
As described in chapter 2.5.5, all the costs are discounted to present value (Net
Present Value) and presented in Figure 31. The lowest cost (NPV) during life cycle
of 50 years has been assigned to Scenario 3 – house built of brick walls and
amounts to €227,326. Scenario 4 (aerated concrete) is 0.5% more expensive –
€228,417. The most expensive ones: Scenario 5 (rammed earth) and Scenario 1
(sand lime brick with advanced building services) are respectively 15.7% and 18.4%
more expensive than Scenario 3.
The biggest impact on NPV of all Scenarios has initial investment which amounts to
31.0% - 33.7% of total NPV. Another big group of costs is related to replacement
and maintenance of the building components (26.5% - 34.4%). Due to high cost of
building services and as a result maintenance and replacement costs Scenario 1 is
characterized with the highest relative and absolute cost in this group of costs
among all Scenarios. Third group of significant costs are running costs of energy
0
50,000
100,000
150,000
200,000
250,000
300,000
350,000
0 10 20 30 40
Cum
alat
ive
nom
inal
cos
t [€]
Year
S1
S2
S3
S4
S5
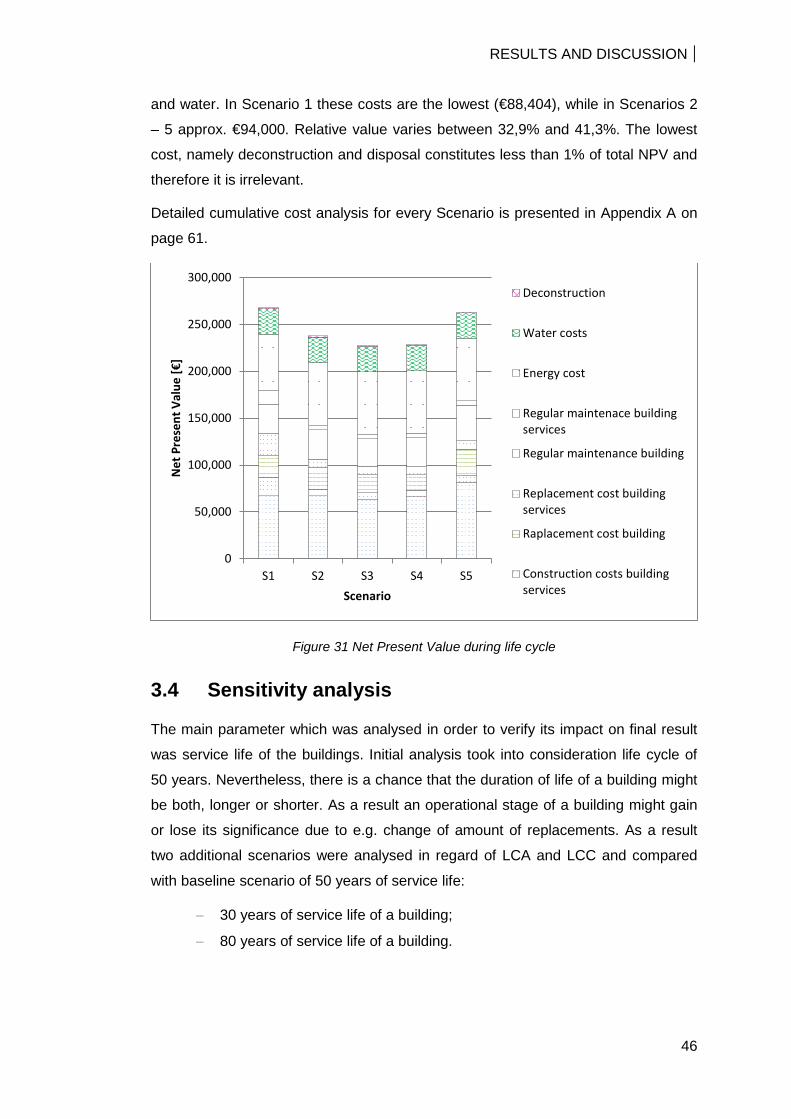
RESULTS AND DISCUSSION
46
and water. In Scenario 1 these costs are the lowest (€88,404), while in Scenarios 2
– 5 approx. €94,000. Relative value varies between 32,9% and 41,3%. The lowest
cost, namely deconstruction and disposal constitutes less than 1% of total NPV and
therefore it is irrelevant.
Detailed cumulative cost analysis for every Scenario is presented in Appendix A on
page 61.
Figure 31 Net Present Value during life cycle
3.4 Sensitivity analysis
The main parameter which was analysed in order to verify its impact on final result
was service life of the buildings. Initial analysis took into consideration life cycle of
50 years. Nevertheless, there is a chance that the duration of life of a building might
be both, longer or shorter. As a result an operational stage of a building might gain
or lose its significance due to e.g. change of amount of replacements. As a result
two additional scenarios were analysed in regard of LCA and LCC and compared
with baseline scenario of 50 years of service life:
− 30 years of service life of a building;
− 80 years of service life of a building.
0
50,000
100,000
150,000
200,000
250,000
300,000
S1 S2 S3 S4 S5
Net
Pre
sent
Val
ue [€
]
Scenario
Deconstruction
Water costs
Energy cost
Regular maintenace buildingservices
Regular maintenance building
Replacement cost buildingservices
Raplacement cost building
Construction costs buildingservices
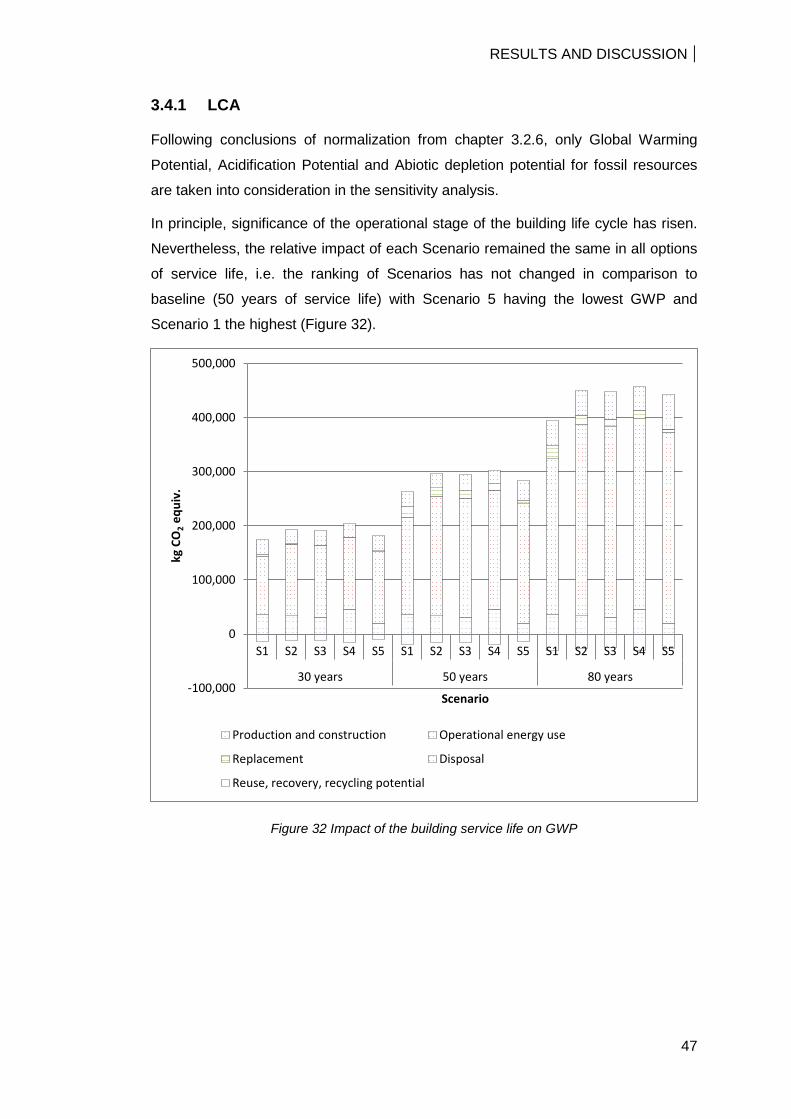
RESULTS AND DISCUSSION
47
3.4.1 LCA
Following conclusions of normalization from chapter 3.2.6, only Global Warming
Potential, Acidification Potential and Abiotic depletion potential for fossil resources
are taken into consideration in the sensitivity analysis.
In principle, significance of the operational stage of the building life cycle has risen.
Nevertheless, the relative impact of each Scenario remained the same in all options
of service life, i.e. the ranking of Scenarios has not changed in comparison to
baseline (50 years of service life) with Scenario 5 having the lowest GWP and
Scenario 1 the highest (Figure 32).
Figure 32 Impact of the building service life on GWP
-100,000
0
100,000
200,000
300,000
400,000
500,000
S1 S2 S3 S4 S5 S1 S2 S3 S4 S5 S1 S2 S3 S4 S5
30 years 50 years 80 years
kg C
O2 e
quiv
.
Scenario
Production and construction Operational energy use
Replacement Disposal
Reuse, recovery, recycling potential

RESULTS AND DISCUSSION
48
Similar trend can be observed in regard of Acidification Potential (Figure 33). As in
baseline, the biggest impact in this category has Scenario 1 (sand lime brick with
advanced building services). Extension of the operational stage affect amount of
supplied energy which in case of Scenario 1 is produced mainly from solid fuels.
Remaining Scenarios present rather similar impact throughout all durations of
service life.
Figure 33 Impact of the building service life on AP
-500
0
500
1,000
1,500
2,000
2,500
3,000
3,500
S1 S2 S3 S4 S5 S1 S2 S3 S4 S5 S1 S2 S3 S4 S5
30 years 50 years 80 years
kg S
O2 e
quiv
.
Scenario
Production and construction Operational energy use
Replacement Disposal
Reuse, recovery, recycling potential

RESULTS AND DISCUSSION
49
As seen on Figure 34 throughout all analysed durations of service life of a building
the worst is Scenario 2 (sand lime brick), while the best Scenario 1 (sand lime brick
with advanced building services). Ranking of remaining Scenarios 3 – 5 differs
depending on analysed service life, hoverer the differences are limited up to 5.6%
regardless the duration of service life.
Figure 34 Impact of the building service life on ADPF
3.4.2 LCC
Analysing impact of service life of a building on LCC it can be easily determined that
operational stage is the one having the greatest impact on final result (Figure 35).
Taking into consideration 30 years of service life the ranking of Scenarios does not
change. As in baseline scenario of fifty years of service life Scenario 3 (brick) results
in the best score, while Scenario 1 (sand lime brick with advanced building services)
the worst.
On the other hand, analysing 80 years of service life the ranking alters. Prolonged
duration of operational stage results in higher running costs (energy, water),
maintenance costs and more replacements of building components. As a result,
Scenario 5 (rammed earth) has the highest Net Present Value over the period of 80
-1,000,000
0
1,000,000
2,000,000
3,000,000
4,000,000
5,000,000
6,000,000
7,000,000
S1 S2 S3 S4 S5 S1 S2 S3 S4 S5 S1 S2 S3 S4 S5
30 years 50 years 80 years
MJ
Scenario
Production and construction Operational energy use
Replacement Disposal
Reuse, recovery, recycling potential

RESULTS AND DISCUSSION
50
years of service life of a building, while Scenario 4 (aerated concrete) the lowest.
The best within 30 and 50 years of service life Scenario 3 (brick) is 0.3% more
expensive than Scenario 4.
80 years of service life of a building is also a time period which makes Scenario 1
(sand lime brick with advanced building services) worth considering. In this time
frame Scenario 1 stops being the most expensive as considering 30 or 50 years of
service life. This electricity powered Scenario becomes more competitive (3.8%
more expensive than the cheapest Scenario 4) due to differences in gas and
electricity price increase ratio (4% p.a. and 2.4% p.a. respectively). Consequently,
total discounted energy price within 80 years of service life is the lowest in Scenario
1. Savings on energy nearly fully pay for increased costs associated with more
advanced and thus more expensive building services (investment, replacement and
regular maintenance).
Figure 35 Impact of the building life on NPV
0
50,000
100,000
150,000
200,000
250,000
300,000
350,000
400,000
450,000
500,000
S1 S2 S3 S4 S5 S1 S2 S3 S4 S5 S1 S2 S3 S4 S5
30 years 50 years 80 years
Net
pre
sent
val
ue [€
]
Scenario
Construction costs building Construction costs building services
Raplacement cost building Replacement cost building services
Regular maintenance building Regular maintenace building services
Energy cost Water costs
Deconstruction
CONCLUSION
51
4 CONCLUSION
4.1 Conclusions
This work is an attempt of proving that low-energy and low-embodied energy houses
have smaller environmental impact (LCA) and life cycle cost (LCC) than
conventional houses in Polish conditions concerning the climate and electrical
energy mix. The major question asked in this research work was as follows:
To what extent choice of the construction materials and heating strategy in single
family house in Poland has impact on the results of LCA and LCC?
There are five scenarios analysed varying with main construction materials (sand
lime brick, fired brick, aerated concrete, rammed earth) and building services
(mechanically ventilated house with solar thermal supported heating with electrical
coil and naturally ventilated house with conventional gas boiler). The service life of
the building is assumed to be 50 years. Nevertheless sensitivity analysis taking into
consideration 30 and 80 years has been performed as well. The results of LCA have
been normalized in order to define impact categories with relevant environmental
impact (GPW, AP, ADPF).
The hypothesis has not been proved. Depending on assessed performance
indicator various Scenarios were in favour and can be break into following:
− Energy demand of Scenarios 2 – 5 featuring conventional heating
system, natural ventilation and no renewable energy sources is two
times bigger than in case of Scenario 1;
− Different PEF of natural gas and electrical energy result in nearly the
same primary energy demand of all the Scenarios with Scenario 1
being better than the others by max. 7%;
− The results of LCA show that Scenario 1 is the one having the
smallest GWP, while Scenario 4 the highest. Nevertheless, the
difference between them is only 15%
− The energy type has the biggest impact on AP. As a result Scenario 1
is nearly two times worse than the others;
− Concerning ADPF Scenario 1 the best, while Scenario 2 the worst.
Similarly to other impact categories operational energy use is the most
relevant stage;

CONCLUSION
52
− Normalisation shows that ODP and POCP are not relevant for the final
result of the research;
− The lowest Net Present Value over 50 years of service life of a
building has Scenario 3 (brick build-up with conventional heating),
while the highest Scenarios 1 and 5 (sand-lime brick with advanced
systems and rammed earth with conventional heating respectively).
Research shows that the biggest impact on both LCA and LCC has operational
stage of building life. Polish energy mix relying mostly on solid fuels has extremely
negative influence on environmental impact of houses using electrical energy. It can
be assumed that the same research performed in countries depending on cleaner
energy mix would bring different results i.e. working more in favour of systems
powered with electrical energy like Scenario 1. Furthermore, all building services
require periodical maintenance and replacement. Nevertheless, advanced and thus
expensive systems result in higher operational costs. Consequently, Scenario 1
equipped with such system does not present enough energy saving during 50 years
of service life to pay back.
It is impossible though to foresee development of energy mix and of its
environmental impact and price. Especially the latter depends strongly on political
and economic situation in and between Poland and countries exporting gas. In case
of significant changes in any of analysed aspects i.e. price or environmental impact
results of this research may not be valid anymore.
4.2 Future research
The goal of this research was to analyse if nonconventional technologies of house
construction will outrun typical ones in Polish conditions. A sample of both has been
chosen. Nevertheless, selection and combination of construction materials is way
bigger. Moreover, construction industry is constantly developing and as a result
introduces new materials and building services. Hence, potential future research
should take into consideration more extensive sample of products. Collaboration
with IT sector is desirable in order to respond to enormous amount of products, their
producers, all the thermal and environmental properties, as well as costs. Automatic
acquisition of such data should be performed followed by generic optimization of
acquired building products and services.

INDEX
53
5 INDEX
5.1 List of Figures
Figure 1 Stages of life cycle of a building ................................................................. 3
Figure 2 Models of three dimensions of sustainable development ........................... 3
Figure 3 The three pillars of sustainable development, from left to right, the theory,
the reality and the change needed to better balance the model (Source: Voices &
Earth 2008) .............................................................................................................. 4
Figure 4 Gross inland energy consumption by fuel type in 2014 (Source: Eurostat
2016) ....................................................................................................................... 5
Figure 5 Final energy consumption by sector in 2014 (Source: Eurostat 2016) ........ 6
Figure 6 Primary production of energy from renewable resources in 2014 (Source:
Eurostat 2016) ......................................................................................................... 7
Figure 7 Distribution of residential floor area by building type (Source: Atanasiu et al.
2012) ....................................................................................................................... 8
Figure 8 The most popular single family housing materials in Poland (Source:
Oferteo.pl 2014) ....................................................................................................... 9
Figure 9 Definition of life cycle stages according to EN15804 2012 ........................11
Figure 10 Scope to influence LCC savings over time (Source: ISO 2009) ..............12
Figure 11 Flow chart of the research methodology .................................................15
Figure 12 Reference house geometry used in the research (Source:
Domyhybrydowe.pl 2017) .......................................................................................18
Figure 13 Geometry of the building as modelled in Autodesk Revit ........................19
Figure 14 Geometry of the building as modelled for energy simulation in OpenStudio
plugin for Google SketchUp ....................................................................................19
Figure 15 Plan of the house used in future research (Source: Domyhybrydowe.pl
2017) ......................................................................................................................20
Figure 16 Scope of performed Life Cycle Assessment ............................................22
Figure 17 Scope of performed Life Cycle Costing ...................................................25
Figure 18 Weather data of Poznan, Poland: (Source: Energyplus.net 2017)...........31
Figure 19 Schema of the advanced system incorporated in Scenario 1 (Stiebel
Eltron 2017) ............................................................................................................34
Figure 20 Schematic of the advanced system incorporated into Scenario 1 ............35
Figure 21 Site energy demand per year ..................................................................36
Figure 22 Coverage rate of energy in Scenario 1 by various energy sources ..........37

INDEX
54
Figure 23 Primary energy demand per year ............................................................38
Figure 24 Global warming potential during different stages of the life cycle ............39
Figure 25 Ozone depletion potential during different stages of the life cycle ...........40
Figure 26 Photochemical ozone creation potential during different stages of the life
cycle .......................................................................................................................41
Figure 27 Acidification potential during different stages of the life cycle ..................42
Figure 28 Abiotic depletion potential for fossil resources.........................................43
Figure 29 Normalized impact category results ........................................................44
Figure 30 Cumulative nominal cost during life cycle ................................................45
Figure 31 Net Present Value during life cycle .........................................................46
Figure 32 Impact of the building service life on GWP ..............................................47
Figure 33 Impact of the building service life on AP ..................................................48
Figure 34 Impact of the building service life on ADPF .............................................49
Figure 35 Impact of the building life on NPV ...........................................................50
Figure 36 Cumulative nominal cost of Scenario 1 ...................................................61
Figure 37 Cumulative nominal cost of Scenario 2 ...................................................62
Figure 38 Cumulative nominal cost of Scenario 3 ...................................................62
Figure 39 Cumulative nominla cost of Scenario 4 ...................................................63
Figure 40 Cumulative nominal cost of Scenario 5 ...................................................63

INDEX
55
5.2 List of Tables
Table 1 Overview of investigated scenarios ............................................................. 1
Table 2 Comparison of environmental impact of electrical energy mix per kWh) in
Poland and Germany (Source: Ökobaudat.de 2015; Lelek et al. 2016) .................... 7
Table 3 Overview of the properties of studied scenarios .........................................16
Table 4 Excerpt from Bill of Quantities of Scenario 1 ..............................................21
Table 5 Environmental impact of transportation of 1000 kg of goods per km (Source:
Ökobaudat.de 2015) ...............................................................................................24
Table 6 Normalization factors based on impact of Western European citizen (BRE
2008) ......................................................................................................................24
Table 7 Shielding coefficient (Source: PN-EN12831 2006) .....................................32
Table 8 Height correction factor (Source: PN-EN12831 2006) ................................33
Table 9 Service life of building components of Scenario 1(Association of the
generally sworn and legally certified experts of Austria 2006) .................................64
Table 10 Service life of building components of Scenario 2 (Association of the
generally sworn and legally certified experts of Austria 2006) .................................65
Table 11 Service life of building components of Scenario 3 (Association of the
generally sworn and legally certified experts of Austria 2006) .................................66
Table 12 Service life of building components of Scenario 4 (Association of the
generally sworn and legally certified experts of Austria 2006) .................................67
Table 13 Service life of building components of Scenario 5 (Association of the
generally sworn and legally certified experts of Austria 2006) .................................68

INDEX
56
5.3 List of Equations
Equation 1 Inflation based future cost .....................................................................25
Equation 2 Inflation based purchasing power ..........................................................26
Equation 3 Real discount rate .................................................................................26
Equation 4 Growth rate ...........................................................................................27
Equation 5 Net Present Value .................................................................................29
Equation 6 Conversion of n50 airtightness to normal pressure airtightness ..............32
LITERATURE
57
6 LITERATURE Act on Renewable Energy Sources, 2016. Act of 22 June 2016 amending the Act on
Renewable Energy Sources and some other acts [Ustawa dnia 22 czerwca
2016 r. o zmianie ustawy o odnawialnych źródłach energii oraz niektórych
innych ustaw], Poland.
Anke Esser & Frank Sensfuss, 2016. Evaluation of primary energy factor calculation
options for electricity, Karlsruhe. Available at:
https://ec.europa.eu/energy/sites/ener/files/documents/final_report_pef_eed.pdf
[Accessed August 30, 2017].
ashrae.org, 2017. International Weather for Energy Calculations. Available at:
https://www.ashrae.org/resources--publications/bookstore/international-
weather-for-energy-calculations [Accessed August 3, 2017].
Association of the generally sworn and legally certified experts of Austria, 2006.
Service life of building and buidling services components
[Nutzungsdauerkatalog baulicher Anlagen und Anlagenteile] 3rd ed., Graz:
Association of the generally sworn and legally certified experts of Austria.
Atanasiu, B. et al., 2012. Implementing nearly Zero-Energy Buildings (nZEB) in
Poland - Towards a definition and roadmap, Brussels: Buildings Performance
Institute Europe (BPIE).
Audenaert, A., De Cleyn, S.H. & Vankerckhove, B., 2008. Economic analysis of
passive houses and low-energy houses compared with standard houses.
Energy Policy, 36(1), pp.47–55.
Badescu, V., 2007. Economic aspects of using ground thermal energy for passive
house heating. Renewable Energy, 32(6), pp.895–903.
BRE, 2008. BRE Global Methodology for Environmental Profiles of Construction
Products. SD6050, Walford. Available at:
http://www.greenbooklive.com/filelibrary/environmental_profiles/Methodology_f
or_Environmental_Profiles_2008_SD6050.pdf [Accessed August 1, 2017].
Citherlet, S. & Defaux, T., 2007. Energy and environmental comparison of three
variants of a family house during its whole life span. Building and Environment,
42(2), pp.591–598.
Constitution of Republic of Poland, 1997. Kancelaria Sejmu, Poland.
LITERATURE
58
Domyhybrydowe.pl, 2017. Ecological and hybrid houses [Domy ekologiczne i
hybrydowe]. Available at: http://domyhybrydowe.pl/ [Accessed July 30, 2017].
Dong, X., Soebarto, V. & Griffith, M., 2015. Design optimization of insulated cavity
rammed earth walls for houses in Australia. Energy and Buildings, 86, pp.852–
863.
EN15804, 2012. Sustainability of construction works – Environmental product
declarations – Core rules for the product category of construction products EN
15804:2012+A1:2013, Berlin: Deutsches Institut für Normung.
energy.gov, 2017. EnergyPlus. Available at:
https://energy.gov/eere/buildings/downloads/energyplus-0 [Accessed August 3,
2017].
Energyplus.net, 2017. Weather Data by Location. Available at:
https://energyplus.net/weather-
location/europe_wmo_region_6/POL//POL_Poznan.123300_IMGW [Accessed
August 3, 2017].
Eurostat, 2017a. Construction cost (or producer prices), new residential buildings.
Available at:
http://appsso.eurostat.ec.europa.eu/nui/show.do?dataset=sts_copi_a&lang=en
[Accessed August 2, 2017].
Eurostat, 2017b. Electricity prices by type of user. Available at:
http://ec.europa.eu/eurostat/tgm/table.do?tab=table&plugin=1&language=en&p
code=ten00117 [Accessed August 2, 2017].
Eurostat, 2016. Energy statistics. Available at: http://ec.europa.eu/eurostat
[Accessed April 21, 2016].
Eurostat, 2017c. Gas prices by type of user. Available at:
http://ec.europa.eu/eurostat/tgm/table.do?tab=table&init=1&language=en&pcod
e=ten00118&plugin=1 [Accessed August 2, 2017].
Feist, W., 1997. Life-Cycle Energy Analysis: Comparison of Low-Energy House,
Passive house, Self-Sufficient House. Passive House Institut, p.13.
Fix, S. & Richman, R., 2009. Viability of Rammed Earth Building construction in Cold
Climates, Toronto.
Galvin, R., 2014. Are passive houses economically viable? A reality-based,
subjectivist approach to cost-benefit analyses. Energy and Buildings, 80,

LITERATURE
59
pp.149–157.
GUS, 2017. Concise Statistical Yearbook of Poland 2008-2017, Warsaw.
International Renewable Energy Agency, 2015. Remap 2030: Renewable Energy
Prospects for Poland, Abu Dhabi. Available at: www.irena.org/remap.
Islam, H., Jollands, M. & Setunge, S., 2015. Life cycle assessment and life cycle
cost implication of residential buildings—A review. Renewable and Sustainable
Energy Reviews, 42, pp.129–140.
ISO14040, 2009. Environmental management – Life cycle assessment – Principles
and framework (ISO 14040:2006), Berlin: Deutsches Institut für Normung.
ISO14044, 2006. Environmental management – Life cycle assessment –
Requirements and guidelines (ISO 14044:2006), Berlin: Deutsches Institut für
Normung.
ISO15686-5, 2009. Buildings and constructed assets — Service-life planning — Part
5: Life-cycle costing, Geneva: International Organization for Standardization.
Jaramillo-Nieves, L. & del Río, P., 2010. Contribution of renewable energy sources
to the sustainable development of islands: An overview of the literature and a
research agenda. Sustainability, 2(3), pp.783–811.
K.A.P.E., 2012. Energysaving houses. Manual of good practices [Domy
energooszczędne. Podręcznik dobrych praktyk], Krajowa Agencja
Poszanowania Energii.
Kohler, N. et al., 2010. A life cycle approach to buildings, Munich: Institut für
Internationale Architektur-Dokumentation.
Lelek, L. et al., 2016. Life cycle assessment of energy generation in Poland. The
International Journal of Life Cycle Assessment, 21, pp.1–14.
Molenbroek, M., Stricker, E. & Boermans, T., 2011. Primary energy factors for
electricity in buildings, Utrecht.
National Energy Conservation Agency, 2011. Manual of typology of residential
buildings with examples of actions toward reduction of their energy use
[Podręcznik typologii budynków mieszkalnych z przykładami działań mających
na celu zmniejszenie ich energochłonności], Warsaw.
OECD, 2017. Inflation forecast (indicator). Available at:
https://data.oecd.org/price/inflation-forecast.htm [Accessed August 2, 2017].

LITERATURE
60
Oferteo.pl, 2014. What houses built Polish in 2014 - Report [Jakie domy budowali
Polacy w roku 2014 - Raport]. Available at: http://www.oferteo.pl/raporty/jakie-
domy-budowali-polacy-w-roku-2014 [Accessed April 11, 2016].
Ökobaudat.de, 2015. ÖKOBAUDAT. Available at: http://www.oekobaudat.de/
[Accessed July 29, 2017].
PN-EN12831, 2006. Heating systems in buildings — Method for calculation of the
design heat load [Instalacje ogrzewcze w budynkach -- Metoda obliczania
projektowego obciążenia cieplnego] 2006th ed., Warsaw: Polski Komitet
Normalizacyjny.
Polish Ministry of Economy, 2009. Energy policy of Poland until 2030 [Polityka
energetyczna Polski do roku 2030], Poland.
Stiebel Eltron, 2017. STIEBEL ELTRON. Available at: https://www.stiebel-
eltron.com/en/home.html [Accessed August 15, 2017].
Szalay, Z., 2007. Life cycle environmental impacts of residential buildings. Budapest
University of Technology and Economics, Hungary.
The World Conservation Union, 2008. The IUCN Programme 2005 – 2008 Many
Voices , One Earth, Bangkok.
Thiers, S. & Peuportier, B., 2012. Energy and environmental assessment of two high
energy performance residential buildings. Building and Environment, 51,
pp.276–284.
tradingeconomics.com, 2017. Poland Government 10 Years Bond Forecast.
Available at: https://tradingeconomics.com/poland/government-bond-yield
[Accessed August 2, 2017].
United Nations General Assembly, 2005. World Summit Outcome, Available at:
http://www.un.org/womenwatch/ods/A-RES-60-1-E.pdf.
Wang, L., Gwilliam, J. & Jones, P., 2009. Case study of zero energy house design in
UK. Energy and Buildings, 41(11), pp.1215–1222.
WCED, 1987. Our Common Future: Report of the World Commission on
Environment and Development,
Wolters Kluwer, 2016. Price list of works and investment objects, Q3 2016. [Katalog
cen jednostkowych robót i obiektów inwestycyjnych, III kwartał 2016], Warsaw:
Wolters Kluwer SA.

APPENDIX
61
7 APPENDIX
A. Cumulative cost of respective scenarios
Figure 36 Cumulative nominal cost of Scenario 1
0
50,000
100,000
150,000
200,000
250,000
300,000
350,000
0 10 20 30 40
Cuul
ativ
e co
st [€
]
Year
Water cost
Energy cost
Regularmaintenacebuilding servicesRegularmaintenancebuildingReplacement costbuilding services
Raplacement costbuilding
Constructioncosts buildingservicesConstructioncosts building

APPENDIX
62
Figure 37 Cumulative nominal cost of Scenario 2
Figure 38 Cumulative nominal cost of Scenario 3
0
50,000
100,000
150,000
200,000
250,000
300,000
350,000
0 10 20 30 40
Cum
ulat
ive
cost
[€]
Year
Water cost
Energy cost
Regularmaintenacebuilding servicesRegularmaintenancebuildingReplacement costbuilding services
Raplacement costbuilding
Constructioncosts buildingservicesConstructioncosts building

APPENDIX
63
Figure 39 Cumulative nominla cost of Scenario 4
Figure 40 Cumulative nominal cost of Scenario 5
0
50,000
100,000
150,000
200,000
250,000
300,000
350,000
0 10 20 30 40
Cum
ulat
ive
cost
[€]
Year
Water cost
Energy cost
Regularmaintenacebuilding servicesRegularmaintenancebuildingReplacement costbuilding services
Raplacement costbuilding
Constructioncosts buildingservicesConstructioncosts building
0
50,000
100,000
150,000
200,000
250,000
300,000
350,000
400,000
0 10 20 30 40
Cum
ulat
ive
cost
[€]
Year
Water cost
Energy cost
Regularmaintenacebuilding servicesRegularmaintenancebuildingReplacement costbuilding services
Raplacement costbuilding
Constructioncosts buildingservicesConstructioncosts building

APPENDIX
64
B. Service life of the building components
Table 9 Service life of building components of Scenario 1(Association of the generally sworn and legally certified experts of Austria 2006)
Category Material Service life [years]
Garage doors Multiple 30 Outside doors Multiple 30 Ceiling GypsumBoard Rigips Activ Air 30 Ceiling Mineral wool ISOVER Multimax 30 Ceiling Mineral wool ISOVER Supermata 30 Ceiling Plastering internal As building Floor Reinforced concrete slab As building Floor Wooden floor 60 Floor XPS slab insulation As building Floor Vapor Retarder As building Reinforcing Carbon Steel Reinforcing Bar As building Roof Steel sheeting Ruukki Emka Click 30 Roof Wind protection 30 Structural framing Reinforced concrete As building Steel profile for suspended ceiling Steel 50 Roof construction Wood 50 Wall Calcium silicate block Silka A12 As building Wall Calcium silicate block Silka A18 As building Wall Mineral wool ISOVER TF Profi 30 Wall Plastering external silicate-silicone 30 Wall Plastering internal As building Window Window 30 Building services Solar flat collector 20 Building services Underfloor radiant heating 50 Building services Photovoltaic panel 20 Building services Inverter 25 Building services Circulation pump 15 Building services Buffer tank 20 Building services Ventilation system with heat recovery 20 Building services Electric heater 30

APPENDIX
65
Table 10 Service life of building components of Scenario 2 (Association of the generally sworn and legally certified experts of Austria 2006)
Category Material Service life [years]
Garage doors Multiple 30 Outside doors Multiple 30 Ceiling Gypsum Board Rigips Activ Air 30 Ceiling Mineral wool ISOVER Multimax 30 Ceiling Mineral wool ISOVER Supermata 30 Ceiling Plastering internal As building Floor Reinforced concrete slab As building Floor Wooden floor 60 Floor XPS slab insulation As building Floor Vapor Retarder As building Reinforcing Carbon Steel Reinforcing Bar As building Basic Roof Mineral wool_ISOVER Multimax 30 Basic Roof Steel sheeting Ruukki Emka Click 30 Basic Roof Wind protection 30 Structural framing Reinforced concrete As building Steel profile for suspended ceiling Steel 50 Roof construction Wood 50 Wall Calcium silicate block Silka A12 As building Wall Calcium silicate block Silka A18 As building Wall Mineral wool ISOVER TF Profi 30 Wall Plastering external silicate-silicone 30 Wall Plastering internal As building Window Window 30 Building services Radiators 30 Building services Boiler 20 Building services Circulation pump 15 Building services Buffer tank 20

APPENDIX
66
Table 11 Service life of building components of Scenario 3 (Association of the generally sworn and legally certified experts of Austria 2006)
Category Material Service life [years]
Garage doors Multiple 30 Outside doors Multiple 30 Ceiling Gypsum Board Rigips Activ Air 30 Ceiling Mineral wool ISOVER Multimax 30 Ceiling Mineral wool ISOVER Supermata 30 Ceiling Plastering internal As building Floor Reinforced concrete slab As building Floor Wooden floor 60 Floor XPS slab insulation As building Floor Vapor Retarder As building Reinforcing Carbon Steel Reinforcing Bar As building Roof Steel sheeting Ruukki Emka Click 30 Roof Wind protection 30 Structural framing Reinforced concrete As building Steel profile for suspended ceiling Steel 50 Roof construction Wood 50 Wall EPS 30 Wall Plaster acrylic 30 Wall Plaster concrete sand As building Wall Porotherm 8 P+W As building Wall Porotherm 25 P+W As building Window Window 30 Building services Radiators 30 Building services Boiler 20 Building services Circulation pump 15 Building services Buffer tank 20

APPENDIX
67
Table 12 Service life of building components of Scenario 4 (Association of the generally sworn and legally certified experts of Austria 2006)
Category Material Service life [years]
Garage doors Multiple 30 Outside doors Multiple 30 Ceiling Gypsum Board Rigips Activ Air 30 Ceiling Mineral wool ISOVER Multimax 30 Ceiling Mineral wool ISOVER Supermata 30 Ceiling Plaster concrete sand 30 Floor Reinforced concrete slab As building Floor Wooden floor 60 Floor XPS slab insulation As building Floor Vapor Retarder 50 Reinforcement Carbon Steel Reinforcing Bar As building Roof Steel sheeting Ruukki Emka Click 30 Roof Wind protection 30 Structural framing Reinforced concrete As building Steel profile for suspended ceiling Steel 50 Roof construction Wood 50 Wall Plaster acrylic 50 Wall Plaster concrete sand As building Wall Ytong Energo+ As building Wall Ytong G4 As building Wall Ytong PP3 As building Window Window 30 Building services Radiators 30 Building services Boiler 20 Building services Circulation pump 15 Building services Buffer tank 20

APPENDIX
68
Table 13 Service life of building components of Scenario 5 (Association of the generally sworn and legally certified experts of Austria 2006)
Category Material Service life [years]
Garage doors Multiple 30 Outside doors Multiple 30 Ceiling Clay cealing panel 30 Ceiling Wood fiber insulation 30 Ceiling Clay plaster 30 Floor Reinforced concrete slab As building Floor Wooden floor 60 Floor Foam glass As building Floor Vapor Retarder 50 Reinforcement Carbon Steel Reinforcing Bar As building Basic Roof Steel sheeting Ruukki Emka Click 30 Basic Roof Wind protection 30 Structural framing Reinforced concrete As building Steel profile for suspended ceiling Steel 50 Roof construction Wood 50 Wall Clay plaster 30 Wall Lime plaster 30 Wall Rammed earth 50 Wall Dry brick As building Wall Wood fiber insulation 30 Window Window 30 Building services Radiators 30 Building services Boiler 20 Building services Circulation pump 15 Building services Buffer tank 20
Related Documents