66 TRANSPORTATION RESEARCH RECORD 1344 Life-Cycle Cost Versus Network Analysis EDWIN C. NovAK, JR., AND WEN-Hou Kuo Pavement management y tems (PMS ) are typically designed to elect projects and. treatments on the ba is of which alternatives have the lowe t project life-cycle cost. Ways to use project life- cycle cost analysis to increa e the total cost of network preser- vation are illu trated. In addition, it is not a handy PMS tool for policy makers to use to spend available funds more efficiently. lt i proposed that th_e policy level use network life-cycle cost analysis to minimize the total cost of network preservation. Eco- nomic analysi would then be a three-step process: network life. cycle cost analysi , to establi. h program development constraints that minimize the total cost of preservation; program analysi , to select the combination of projects and treatments chat meet policy con craints and maximize program benefits; and engineering anal- ysis, to minimize project co. t. Network Iifo-cycle cost analysis is based on the remaining service life and trategy analysi concept , which are not in wide use. Therefore, these methods are explained briefly. Conceptually, network and project life-cycle cost analysis arc similar in that for network analysis the lane-mile length of each alternative program is used in place of each alternative proj- ect, and each alternative program's average desigI1 ervice life is substituted for alternative project treatments. FHW A• late t pavement policy (1) require economic anal- ysis (life-cycle cost) to be taken into account when mainte- nance, rehabilitation, and reconstruction (MR&R) alterna- tives are selected. To comply with U1is policy statement, agencies typically use project life-cycle co t (LCC) to select MR&R treatments for proposed MR&R projects. The general con- cept is that by selecting the lowest LC treatment for each proposed project and then by selecting Lhe optimal combi- nation of proposed projects the agency and FHW A are ensured that the total long-term cost of preservation is minimized. The FHW A policy on economic analysis goes on by asking agencies to weigh L C results against the needs £ the entire system . It explains that available funds may not permit e- lection of the lowest LC treatment and that inve tment in project must be timely to avoid more costly repairs in the future. These factors should be taken into account when de- veloping MR&R programs, but there is little guidance about how they can be objectively accomplished. Nevertheless the FHW A show concern for network-level considerations when selecting treatments and recognizes that what is best for the project may not be best for the network. This paper proposes that che relationship between total long-term cost of network preservation and performance has the highest priority in the proces of economic analysis of alternatives. That i the L C of preserving networks is of first-order importance, and the LCC of preserving projects is of third-order importance. Maximizing program benefit is considered to be of second-order importance. Michigan Department of Transportation, Materials and Technology Division, Lansing, Mich. 48909. When LCC analysis is applied to networks instead of proj- ects, the following two conceptual changes are necessary: 1. Lane-mile length of alternative MR&R programs is sub- stituted for projects. 2. The average design service life (ADSL) of alternative MR&R programs is substituted for MR&R treatments. The purpose of network LCC analysis is to establish the MR&R program development constraints needed to guide program development so that it will achieve long-term net- work condition and funding goals at minimum total cost. Only the simplest form of network LCC analysis is presented to illustrate methodology. Network LCC analysis should be an attractive form of economic analysis because it is a policy- level tool that provides for top-down decision making yet it is easy to understand and to display results for the the con- sideration of many alternative funding and network condition schemes. And using network LCC analysis can substantially reduce the total cost of network preservation compared to that possible with project LCC analysis. Network LCC anal- ysis is based on remaining service life (RSL) presented by Baladi et al. (2) and illustrated in Figure 1. Definitions of the terms used in this paper are defined in another paper by Novak and Kuo in this Record. BASIC NETWORK LCC ANALYSIS CONCEPTS The performance of projects, network and MR&R pro- grams or strategies are all characterized by their lane-mile length and RSL or design service life (DSL). RSL and DSL are the ame at the time of construction .. With time, condition 0 ....... - ... ···-- -,,-············-.. , .. ,_ UNACCEPTABLE CONDITION THRESHOLD VALUE __., / -I- CURRENT SURFACE AGE / . I I I I I ACCEPTABLE CONDITION REMAINING SERVICE LIFE 10 20 SURFACE AGE, YEARS FIGURE 1 Conceptual diagram of remaining service life.

Welcome message from author
This document is posted to help you gain knowledge. Please leave a comment to let me know what you think about it! Share it to your friends and learn new things together.
Transcript
66 TRANSPORTATION RESEARCH RECORD 1344
Life-Cycle Cost Versus Network Analysis
EDWIN C. NovAK, JR., AND WEN-Hou Kuo
Pavement management y tems (PMS ) are typically designed to elect projects and. treatments on the ba is of which alternatives
have the lowe t project life-cycle cost. Ways to use project lifecycle cost analysis to increa e the total cost of network preservation are illu trated . In addition, it is not a handy PMS tool for policy makers to use to spend available funds more efficiently. lt i proposed that th_e policy level use network life-cycle cost analysis to minimize the total cost of network preservation. Economic analysi would then be a three-step process: network life. cycle cost analysi , to establi. h program development constraints that minimize the total cost of preservation ; program analysi , to select the combination of projects and treatments chat meet policy con craints and maximize program benefits; and engineering analysis, to minimize project co. t. Network Iifo-cycle cost analysis is based on the remaining service life and trategy analysi concept , which are not in wide use. Therefore, these methods are explained briefly. Conceptually, network and project life-cycle cost analysis arc similar in that for network analysis the lane-mile length of each alternative program is used in place of each alternative project, and each alternative program's average desigI1 ervice life is substituted for alternative project treatments.
FHW A• late t pavement policy (1) require economic analysis (life-cycle cost) to be taken into account when maintenance, rehabilitation , and reconstruction (MR&R) alternatives are selected. To comply with U1is policy statement, agencies typically use project life-cycle co t (LCC) to select MR&R treatments for proposed MR&R projects. The general concept is that by selecting the lowest LC treatment for each proposed project and then by selecting Lhe optimal combination of proposed projects the agency and FHW A are ensured that the total long-term cost of preservation is minimized.
The FHW A policy on economic analysis goes on by asking agencies to weigh L C results against the needs £ the entire system. It explains that available funds may not permit election of the lowest LC treatment and that inve tment in project must be timely to avoid more costly repairs in the future. These factors should be taken into account when developing MR&R programs, but there is little guidance about how they can be objectively accomplished. Nevertheless the FHW A show concern for network-level considerations when selecting treatments and recognizes that what is best for the project may not be best for the network .
This paper proposes that che relationship between total long-term cost of network preservation and performance has the highest priority in the proces of economic analysis of alternatives. That i the L C of preserving networks is of first-order importance, and the LCC of preserving projects is of third-order importance. Maximizing program benefit is considered to be of second-order importance.
Michigan Department of Transportation, Materials and Technology Division, Lansing, Mich. 48909.
When LCC analysis is applied to networks instead of projects, the following two conceptual changes are necessary:
1. Lane-mile length of alternative MR&R programs is substituted for projects.
2. The average design service life (ADSL) of alternative MR&R programs is substituted for MR&R treatments.
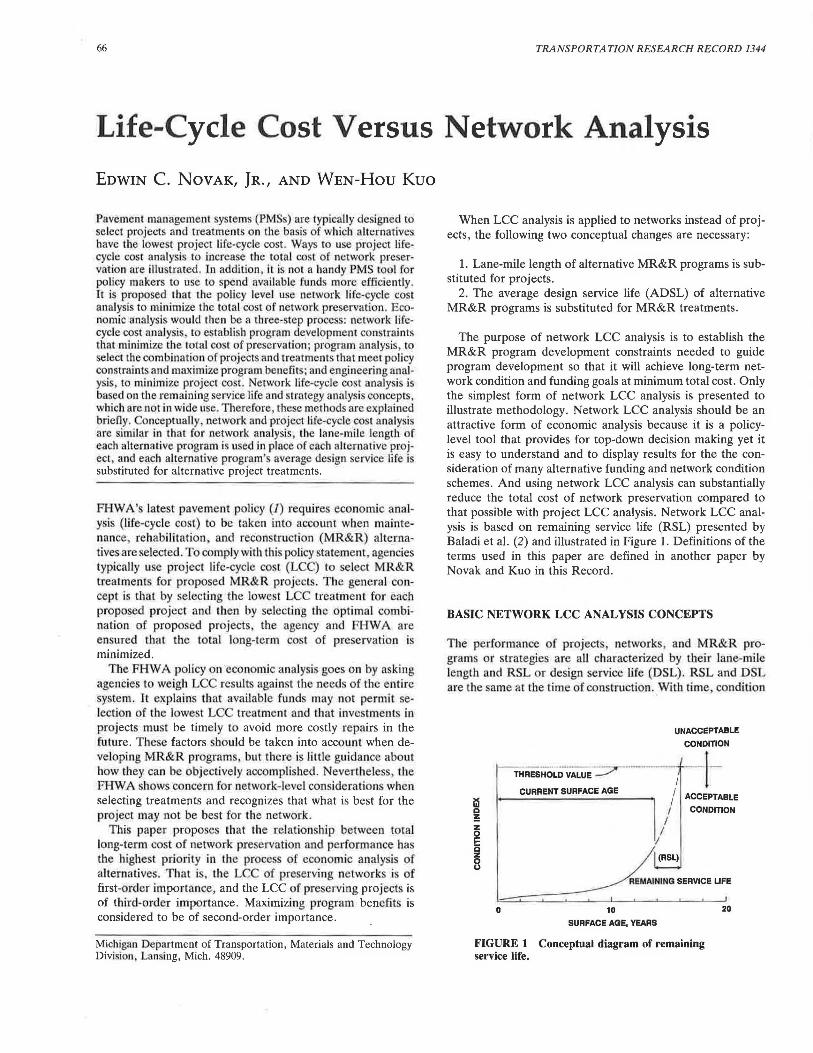
The purpose of network LCC analysis is to establish the MR&R program development constraints needed to guide program development so that it will achieve long-term network condition and funding goals at minimum total cost. Only the simplest form of network LCC analysis is presented to illustrate methodology. Network LCC analysis should be an attractive form of economic analysis because it is a policylevel tool that provides for top-down decision making yet it is easy to understand and to display results for the the consideration of many alternative funding and network condition schemes. And using network LCC analysis can substantially reduce the total cost of network preservation compared to that possible with project LCC analysis. Network LCC analysis is based on remaining service life (RSL) presented by Baladi et al. (2) and illustrated in Figure 1. Definitions of the terms used in this paper are defined in another paper by Novak and Kuo in this Record.
BASIC NETWORK LCC ANALYSIS CONCEPTS
The performance of projects, network and MR&R programs or strategies are all characterized by their lane-mile length and RSL or design service life (DSL). RSL and DSL are the ame at the time of construction . . With time, condition
0
....... - ... ···---,,-············-.. , .. ,_
UNACCEPTABLE
CONDITION
THRESHOLD VALUE __., / -I-CURRENT SURFACE AGE /
. I
I
I I
I
ACCEPTABLE
CONDITION
REMAINING SERVICE LIFE
10 20
SURFACE AGE, YEARS
FIGURE 1 Conceptual diagram of remaining service life.

Novak and Kuo
deteriorates and RSL decreases. When condition reaches the threshold value defining acceptable condition, its RSL is zero. The performance of networks and MR&R programs is based on the average RSL (ARSL) or ADSL of the projects they are made up of. For networks, the sections of pavement of most concern are those in unacceptable condition. They make up the majority of projects considered for annual MR&R programs. Figure 2 illustrates the network rehabilitation process (based on RSL) . Network performance expressed in terms of RSL enables an accounting process to be used to keep track of the rate at which projects or uniform sections deteriorate from each higher to each lower RSL category and the rate they are rehabilitated out of lower RSL categories . It also keeps track of which higher RSL category the designer's estimate of DSL would place the projects or uniform sections.
Relationship Between Network Performance and MR&R Strategy
The condition of a network is simply the percentage of network having an RSL of zero, which is the same as the per-
I<: a:
~ z LL 0 ..... z w 0 a: w 11.
I<: a:
~ z LL 0
!z w 0 a: ~
I<: a:
~ z LL 0 ..... z w 0 a: w 11.
0 5 10 15 20
REMAINING SERVICE LIFE, YRS.
0 5 10 15 20
REMAINING SERVICE LIFE, YRS.
0 5 10 15 20
REMAINING SERVICE LIFE, YRS.
67
centage of network in unacceptable condition. Network condition is a function of the network's rate of deterioration and the annual MR&R program. For network analysis , it is beneficial to deal with MR&R strategies instead of MR&R programs. MR&R strategy is defined as the percentage of network to be annually rehabilitated from each lower to each higher RSL category. For convenience, MR&R strategies can be generalized to percentage of network preserved annually and its average DSL. The relationship between network condition (at equilibrium) and the generalized form of MR&R strategy is as follows:
P0 = 100 percent - (P x ADSL) (1)
where P0 is the network condition and Pis the percentage of network annually preserved.
If the MR&R strategy is to preserve 4 percent of the network's length and its ADSL is 20 years, 80 percent of network would be in acceptable condition. Assumptions are that ADSL estimates are accurate, the MR&R strategy of 4 percent of the network and ADSL of 20 years is used annually, and enough time has elapsed for the network to reach equilibrium.
I<: a:
~ z LL 0
!z w &! w 11.
5YRSLATER
5 10 15 20
REMAINING SERVICE LIFE, YRS.
0 5 10 15 20
REMAINING SERVICE LIFE, YRS.
0 5 10 15 20
REMAINING SERVICE LIFE, YRS.
FIGURE 2 Illustration of network performance and rehabilitation processes (5-year program: ADSL = 20 years, % network = 20).
68
The network's ARSL is calculated as follows:
Network ARSL = L X;Y;/100 (2)
where X; is the RSL of the ith uniform section and Y; is the percentage of network in the ith uniform section.
This calculation is the same as taking moments about the zero RSL category. On the basis of Equation 2, it can be seen that the ADSL of the MR&R strategy is directly related to the network's ARSL.
Cost of Alternative MR&R Programs
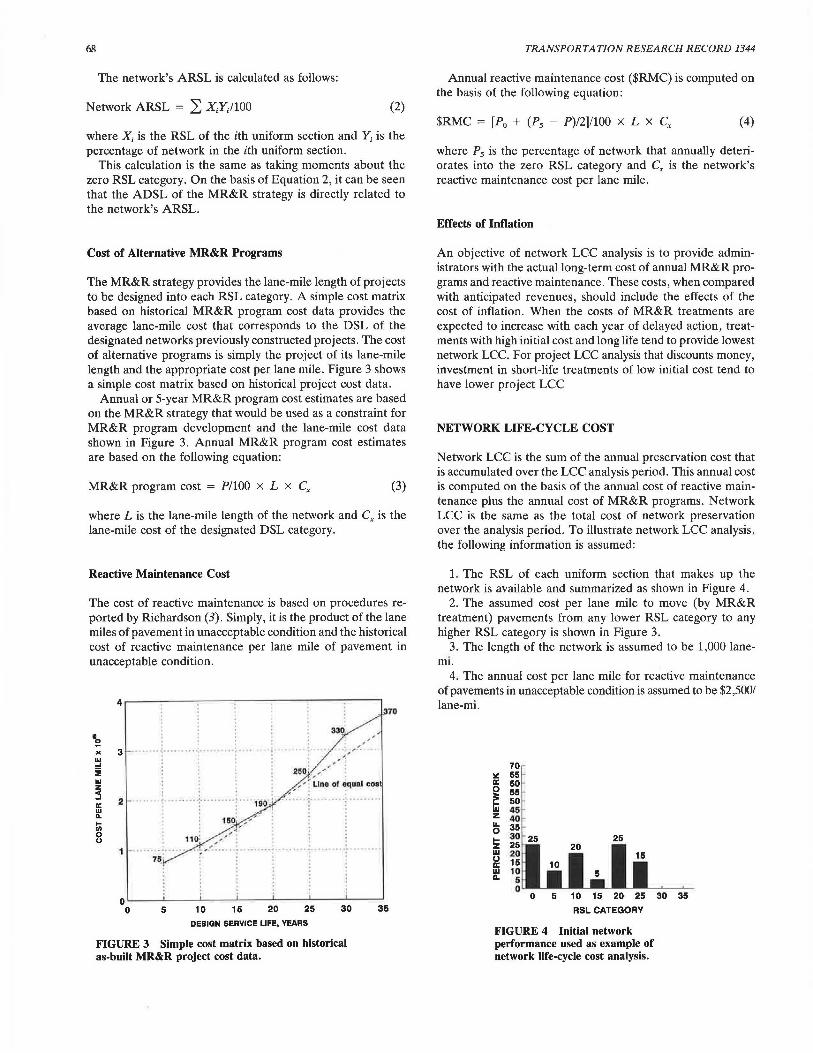
The MR&R strategy provides the lane-mile length of projects to be designed into each RSL category. A simple cost matrix based on historical MR&R program cost data provides the average lane-mile cost that corresponds to the DSL of the designated networks previously constructed projects. The cost of alternative programs is simply the project of its lane-mile length and the appropriate cost per lane mile. Figure 3 shows a simple cost matrix based on historical project cost data.
Annual or 5-year MR&R program cost estimates are based on the MR&R strategy that would be used as a constraint for MR&R program development and the lane-mile cost data shown in Figure 3. Annual MR&R program cost estimates are based on the following equation:
MR&R program cost = P/100 x L x ex (3)
where L is the lane-mile length of the network and ex is the lane-mile cost of the designated DSL category.
Reactive Maintenance Cost
The cost of reactive maintenance is based on procedures reported by Richardson (3). Simply, it is the product of the lane miles of pavement in unacceptable condition and the historical cost of reactive maintenance per lane mile of pavement in unacceptable condition.
70
I . . 2 ........ 1' ........ l ......... t. ·--,·uo"
75~
o '--~---'-~~-'-~~-'-~--'~~~~~~~~
0 5 10 15 20 25 30 35
DESIGN SERVICE LIFE, YEARS
FIGURE 3 Simple cost matrix based on historical as-built MR&R project cost data.
TRANSPORTATION RESEARCH RECORD 1344
Annual reactive maintenance cost ($RMC) is computed on the basis of the following equation:
$RMC = [P0 + (P5 - P)/2]/100 x L x ex (4)
where P5 is the percentage of network that annually deteriorates into the zero RSL category and ex is the network's reactive maintenance cost per lane mile.
Effects of Inflation
An objective of network LCC analysis is to provide administrators with the actual long-term cost of annual MR&R programs and reactive maintenance. These costs, when compared with anticipated revenues, should include the effects of the cost of inflation. When the costs of MR&R treatments are expected to increase with each year of delayed action, treatments with high initial cost and long life tend to provide lowest network LCC. For project LCC analysis that discounts money, investment in short-life treatments of low initial cost tend to have lower project LCC
NETWORK LIFE-CYCLE COST
Network LCC is the sum of the annual preservation cost that is accumulated over the LCC analysis period. This annual cost is computed on the basis of the annual cost of reactive maintenance plus the annual cost of MR&R programs. Network LCC is the same as the total cost of network preservation over the analysis period. To illustrate network LCC analysis, the following information is assumed:
1. The RSL of each uniform section that makes up the network is available and summarized as shown in Figure 4.
2. The assumed cost per lane mile to move (by MR&R treatment) pavements from any lower RSL category to any higher RSL category is shown in Figure 3.
3. The length of the network is assumed to be 1,000 lanemi.
4. The annual cost per lane mile for reactive maintenance of pavements in unacceptable condition is assumed to be $2,500/ lane-mi.
70 Ii:: 65 IC 60 0 55
~ 50 45 z 40 -... 35 -0
I- 30 25 z 25 w 20 0 15 IC w 10 a. 5
25 20
0 0 5 10 15 20 25 30 35
RSL CATEGORY
FIGURE 4 Initial network performance used as example of network life-cycle cost analysis.

Novak and Kuo
Network LCC is based on the need of an agency to minimize the total cost of pavement preservation and the need to control the relationship between cost of preservation and the network's condition over long periods of time. An analysis period of 40 years is used to insure that the network's condition and annual preservation cost have stabilized. It is assumed that funding level and size of the annual MR&R program are to be as consistent from year to year as possible .
Network Life-Cycle Cost Analysis
It is assumed that the network whose performance is shown in Figure 4 is to be improved so that zero percent of it will be in unacceptable condition at the end of 5 years , and this condition is to be maintained for the 40-year analysis period . The objective is to minimize annual MR&R program cost as well as network LCC. To do this, the lowest-cost MR&R strategies are to be used . Figure 3 indicates that the lowest cost per lane mile DSL is 20 years and that the 10-, 15-, and 25-year categories have only slightly higher cost.
Figure 4 illustrates that 25 percent of the network is currently in unacceptable condition, and 10 percent will become unacceptable within 5 years. Therefore, 35 percent of the network must be moved out of the zero RSL category in the first 5 years, as Figure 5 illustrates. The percentage of network in each RSL category at the end of each 5-year analysis period is computed as the sum of the percentage of network rehabilitated into each category plus the percentage of network that deteriorates into it from the next higher RSL category. On the basis of Equation 3 and the lane-mile cost data shown in Figure 3, the cost of the MR&R program for the first 5 years is given in Table 1.
The cost of reactive maintenance must be added to the cost of the MR&R program to determine the total cost of preservation. Based on Equation 2 and a cost of $2,500/lane-mi, the cost of reactive maintenance during each year of the first 5-year periods is given in Table 2.
Figure 5 indicates the performance of the network at the end of 5 years . Because 20 percent of the network will deteriorate into the zero RSL category in the 5- to 10-year analysis period, it is necessary to rehabil_itate 20 percent of the network out of the same category to meet the network condition objective of zero percent of the network in unac-
:.I: a:
~ z LI. 0
~ w 0 a: w 0.
25
0 5 10 15 20 25 30
RSL CATEGORY
FIGURE 5 Performance of network after 5 years and MR&R strategy used to preserve it.
69
ceptable condition. Figure 6 illustrates the MR&R strategy selected. The estimated cost of reactive maintenance is zero; the MR&R program cost (when calculated as for the first 5 years) is $48,000 ,000.
Figure 6 shows the performance of the network at the end of 10 years. Because 20 percent of the network will deteriorate into the zero RSL category in the next 10- to 15-year period, it is necessary to rehabilitate 20 percent of the network out of this category to meet the network condition objective. Figure 7 shows that the MR&R strategy selected is the same as for a 5- to 10-year period, so the total estimated cost of preservation for a 10- to 15-year period is $48,000,000.
Figure 7 illustrates the performance of the network at the end of 15 years. Because 25 percent of the network will deteriorate into the zero RSL category in the 15- to 20-year analysis period, 25 percent of the network must be rehabilitated. Figure 8 illustrates the MR&R strategy selected. The estimated cost of reactive maintenance is zero, and the MR&R program cost is $60,500 ,000.
Figure 8 presents the performance at the end of 20 years. Because 20 percent of the network will deteriorate into the zero RSL category in the 20- to 25-year analysis period, 20 percent of the network must be rehabilitated. Figure 9 illustrates the MR&R strategy selected. The estimated cost of reactive maintenance is zero, and the MR&R program cost is $47 ,000,000.
Figure 9 presents the performance of the network at the end of 25 years. The network's performance is now stable if the same MR&R strategy is used from this point on. Hence, the MR&R program cost of all future 5-year MR&R programs should be the same as the cost for the 20- to 25-year period . The estimated cost of reactive maintenance is zero, and the total cost of MR&R programs for the three 5-year periods between Years 25 and 40 is $141,000,000.
The total 40-year netowrk LCC is given in Table 3.
MR&R Program Development Constraints
If this network LCC analysis were to be accepted by policy makers, the MR&R strategy and estimated cost would become funding and MR&R program development constraints. That is, those responsible for program development would be required to select projects and treatments whose lane-mile length and ADSL meet or exceed MR&R strategy constraints and whose cost is equal to or less than the funding constraint . Policy makers are responsible for the first level of economic analysis (minimize network preservation cost). The program development process is then responsible for the second (maximize program benefits) and third levels (minimize project cost) .
PROJECT LIFE-CYCLE COST
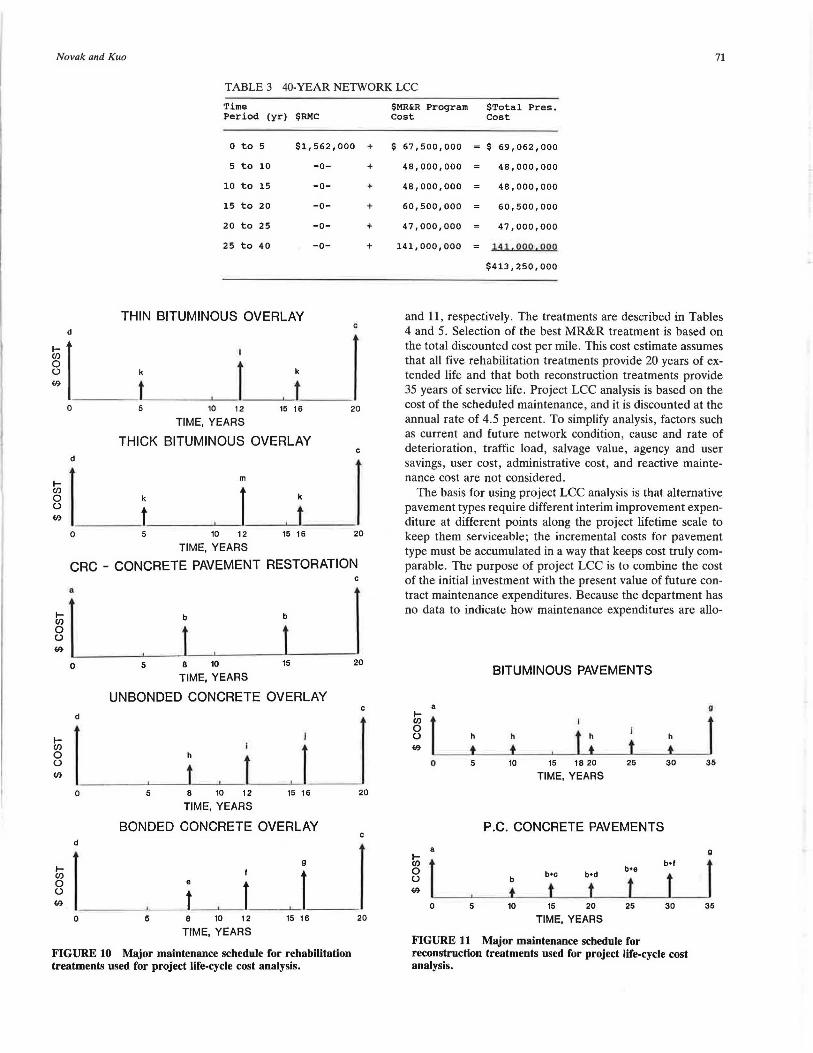
The Michigan Department of Transportation (DOT) uses a simplified project LCC analysis procedure based on the Minnesota DOT's method of pavement selection. For project LCC estimates, Michigan considers five alternative rehabilitation and two alternative reconstruction treatments. The major maintenance schedule and descriptions of each rehabilitation and reconstruction alternative are shown in Figures 10
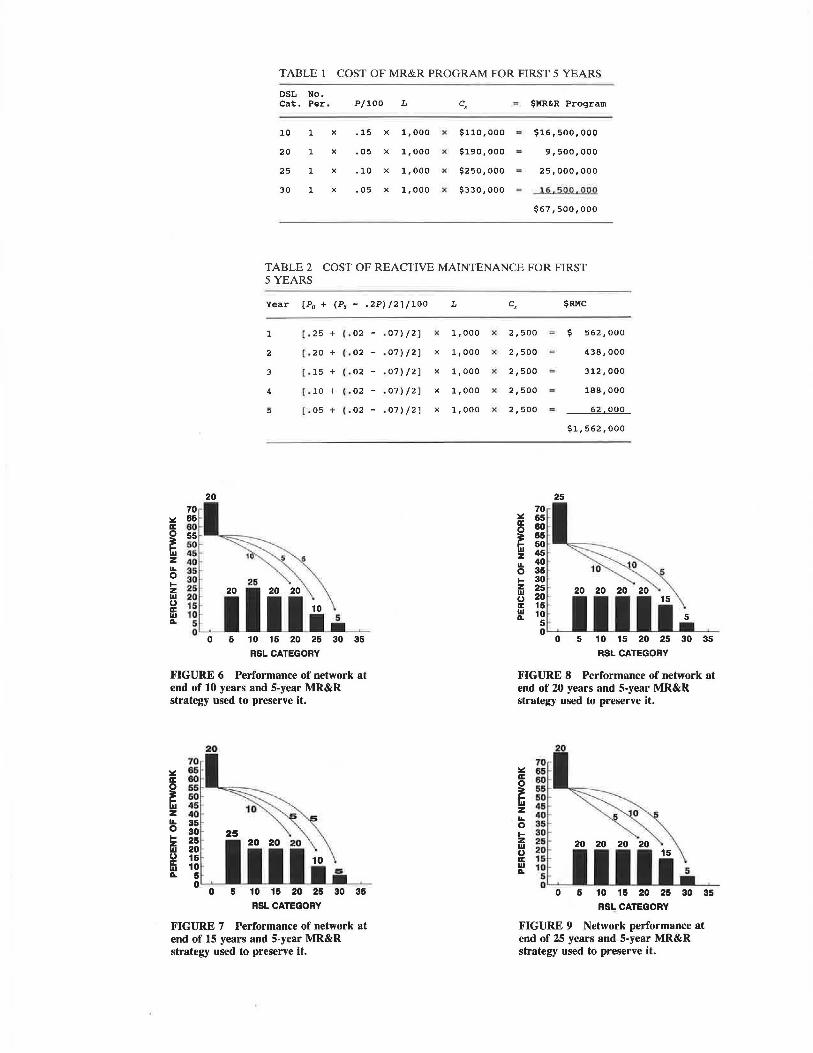
TABLE 1 COST OF MR&R PROGRAM FOR FIRST 5 YEARS
DSL No. Cat. Per . P/100 L c, $MR&R Program
10 1 x .15 x 1,000 x $110,000 - $16,500,000
20 1 x .05 x 1,000 x $190,000 - 9,500,000
25 1 x .10 x 1,000 >( $250,000 - 25,000,000
30 1 x .05 x 1,000 x $330,000 - i ~. !i QQ,QQQ
$67,500,000
TABLE2 COST OF REACTIVE MAINTENANCE FOR FIRST 5 YEARS
Year [Po + (P, - .2P) /2]/100
70 ~ 65 IC 60 0 55 ~w 60
45 z 40 u.. 36 0 30 -!z: 25 -w 20 0 15 -ffi 10 -II. 5
0
1 [ .25 + (. 02 -
2 [.20 + (. 02 -
3 (.15 + (. 02 -
4 [ .10 + (. 02 -
5 [ .05 + (. 02 -
20
0 5 10 15 20 25 30 35
RSL CATEGORY
FIGURE 6 Performance of network at end of 10 years and 5-year MR&R strategy used to preserve it.
~ IC
~ z u.. 0
~ ffi II.
20
5 10 15 20 25 30 35
RSL CATEGORY
FIGURE 7 Performance of network at end of 15 years and 5-year MR&R strategy used to preserve it.
.07)/2]
.07)/2]
.07)/2]
.07)/2]
• 07) /2]
L
.x 1,000 " x 1,000 " x 1,000 x
x 1,000 x
x 1,000 x
c, $RMC
2,500 $ 562,000
2,500 ~ 438,000
2,500 - 312,000
2,500 - 188,000
2,500 62,000
$1,562,000
25 70
~ 65 · IC 60
~ ~g _ z 45 • u.. 40 · 0 35 !ii: 30 w 25 0 20 IC 15 w 10 -11. 5 .
0 0 5 10 15 20 25 30 35
RSL CATEGORY
FIGURE 8 Performance of network at end of 20 years and 5-year MR&R strategy used to preserve it.
~ IC
~ z u.. 0
!ii: w 0 IC w II.
2.0
0 5 10 15 20 25 30 35
RSL CATEGORY
FIGURE 9 Network performance at end of 25 years and 5-year MR&R strategy used to preserve it.
Novak and Kuo 71
TABLE 3 40-YEAR NETWORK LCC
Time Period (yr) $RMC
o to 5 $1,562,000
5 to 10 -o-
10 to 15 -o-
15 to 20 -o-
20 to 25 -o-
25 to 40 -o-
THIN BITUMINOUS OVERLAY c
d
I ~r J k
t t 0 5 10 12 15 16 20
TIME, YEARS
THICK BITUMINOUS OVERLAY c
d
I I m I-
J (/)
k 0 k ()
t f ti)
0 5 10 12 15 16 20
TIME, YEARS
CRC - CONCRETE PAVEMENT RESTORATION c
~ f._~i '---'-i ~l 0 5 8 10 15
TIME, YEARS
UNBONDED CONCRETE OVERLAY
20
c d
~ f.._____._.i_.____..l__._.. LJ
+
+
+
+
+
+
0 5 8 10 12 15 16
TIME, YEARS 20
BONDED CONCRETE OVERLAY c
d
I g
I-
J en 0 e
l () t ti) _l
0 5 8 10 12 15 16
TIME, YEARS
FIGURE 10 Major maintenance schedule for rehabilitation treatments used for project life-cycle cost analysis.
20
$MR&R Program $Total Pres. Cost Cost
$ 67,500,000 $ 69,062,000
48,000,000 48,000,000
48,000,000 48,000,000
60,500,000 60,500,000
47,000,000 47,000,000
141,000,000 .Ul,OQQ,QQQ
$413,250,000
and 11, respectively. The treatments are described in Tables 4 and 5. Selection of the best MR&R treatment is based on the total discounted cost per mile. This cost estimate assumes that all five rehabilitation treatments provide 20 years of extended life and that both reconstruction treatments provide 35 years of service life . Project LCC analysis is based on the cost of the scheduled maintenance, and it is discounted at the annual rate of 4 .5 percent . To simplify analysis, factors such as current and future network condition, cause and rate of deterioration, traffic load, salvage value, agency and user savings, user cost, administrative cost, and reactive maintenance cost are not considered.
The basis for using project LCC analysis is that alternative pavement types require different interim improvement expenditure at different points along the project lifetime scale to keep them serviceable; the incremental costs for pavement type must be accumulated in a way that keeps cost truly comparable. The purpose of project LCC is to combine the cost of the initial investment with the present value of future contract maintenance expenditures. Because the department has no data to indicate how maintenance expenditures are allo-
BITUMINOUS PAVEMENTS
a g I-en 0 () h h h h 0
0 5 10 15 18 20 25 30 35
TIME, YEARS
P .C. CONCRETE PAVEMENTS
a g I-en
I b•e i_J 0 b•c b•d () b t 0 t t t 0 5 10 15 20 25 30
TIME, YEARS
FIGURE 11 Major maintenance schedule for reconstruction treatments used for project life-cycle cost analysis.
35

72 TRANSPORTATION RESEARCH RECORD 1344
TABLE 4 DESCRIPTION OF TREATMENTS, FIGURE 10
Letter
a
b
c
d
e
f
g
h
i
k
1
m
Description of Treatments
Repair cracks, replace joints, replace old patches,
grinding, replace seals, subbase underdrains, and
undersea ling
Replace joints, grinding, replace seals, repair cracks
Reconstruct/rehabilitate
Initial rehabilitation
Replace 10% of seals and 15% of joints
Replace 10% of seals, 20% of joints; repair 100% of
cracks
Replace 10% of seals and 10% of joints
Replace 10% of seals
Replace 10% of seals, 5% of joints; repair cracks
Replace 10% of seals, 5% of joints
crack fill 3,000 ft
Remove 440 psy, replace 440 psy, replace 20% of joints
Remove 330 psy, replace 330 psy, replace 10% of joints
NOTE: All treatments include cost to maintain traffic.
cated to projects over their normal life cycle, Figures 10 and 11 are the hypothetical timing and extent of maintenance treatments that the Michigan DOT uses.
Figures 12 and 13 show estimated initial costs and major maintenance costs used for the rehabilitation and reconstruction options. Assuming a discount rate of 4.5 percent and an analysis period of 40 years, the rehabilitation project LCC is $281,600 and the reconstruction project LCC is $370,700.
Project Life-Cycle Cost Analysis
A frequent concern is whether to rehabilitate or reconstruct. Assuming the proposed project is a rigid pavement, the thick overlay option from Figure 10 is compared with the rigid reconstruction option from Figure 11.
TABLE 5 DESCRIPTION OF TREATMENTS, FIGURE 11
Letter Description of Treatments
a Initial construction
b Replace seals
c Replace 5% of joints
d Replace 10% of joints
e Replace 15% of joints
f Replace 20% of joints
g Rehabilitate/reconstruct
h Crack fill 3,000 ft
i Mill 4.0 in.; recycle 130T, 140L,
j 170 psy overlay
1708
NOTE: All treatments include cost to maintain traffic.
On the basis of these results, the rehabilitation alternative would be selected because it is has the lowest project LCC. Economic analysis based on project LCC would have been completed at this point. Any further consideration of this project will include only the rehabilitation treatment selected by the project LCC method.
Impact of Project LCC on Total Cost of Network Preservation
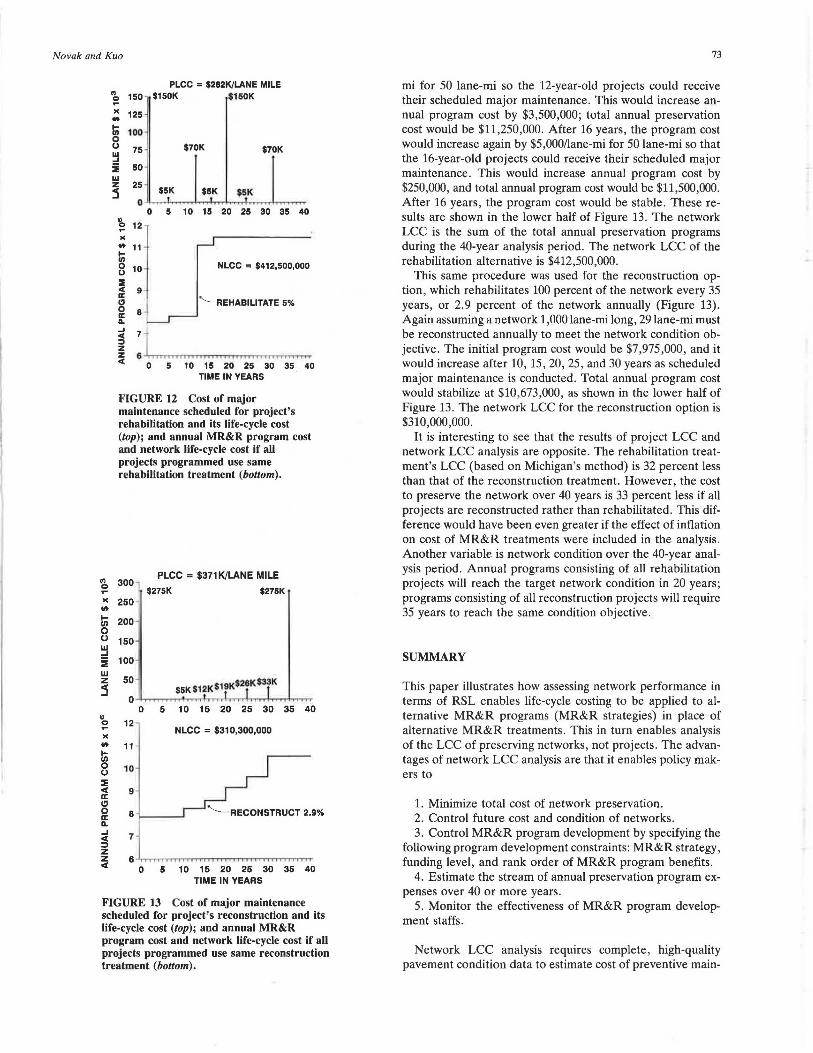
The simplest way to look at the impact of alternative treatments on network LCC is to assume all preservation projects are rehabilitation projects that have the expense stream shown in Figure 12. It is assumed that each rehabilitation project will reach unacceptable condition at the end of its 20-year extended life and that network condition objectives are to eliminate all pavement in unacceptable condition. To meet this network condition objective, 100 percent of the network must be rehabilitated every 20 years, or 5 percent yearly. Assuming a network length of 1,000 lane-mi, 50 lane-mi must be annually rehabilitated at a cost of $150,000/lane-mi for an annual program cost of $7,500,000. After 5 years, the program cost would increase by $5,000/lane-mi for 50 lane-mi so the 5-year-old projects could receive their scheduled major maintenance. This would increase annual program cost by $250,000, so total annual preservation cost would be $7,750,000. After 1_2 years , the program cost would increase by $70,000/lane-
Novak and Kuo
PLCC = $2821</LANE MILE ~ 150 $150K $150K ..
>< 125 ... Iii 100 0 0 75 ~ i 50 w z :5
25 -
0
'b 12 .. >< ... 11
8 0 10
:I : 9
g a: B a.. ct 7 j z
$5K
' 0 5
$70K $70K
$5K $~K '
10 15 20 25 30 35 40
NLCC = $412,500,000
'- REHABILITATE 5%
Z 6 _.,..,.,..,.,.,.,.,.,.,..,.,.,,........,.,.,.,..,.,.,....,,.,.,.,.T"n"'rrTI"T"l"TTT ct 0 5 10 15 20 25 30 35 40
TIME IN YEARS
FIGURE 12 Cost of major maintenance scheduled for project's rehabilitation and its life-cycle cost (top); and annual MR&R program cost and network life-cycle cost if all projects programmed use same rehabilitation treatment (bottom).
<6 300 PLCC = $371 K/LANE MILE
$275K $275K .. >< 250 ... Iii 0 0 w ..J
200
150
:ii 100 w z 50 j
O-'t-r,-,...,,.,....,,.,-t..,TTThTTT+rTTirl-nn-rf"TTT,-t..,....,.,.,. 0 ..
:: 12 )( ... Iii 0 0 :I < a: Cl 0 a: a.. ..J
~
11
7
5 10 15 20 25 30 35 40
NLCC = $310,300,000
z z <
6 -'rrrrrrmnTT"TTTTTTTTTMT',...,..,nTT"T"l"TT'n'TTl'T 0 5 10 15 20 25 30 35 40
TIME IN YEARS
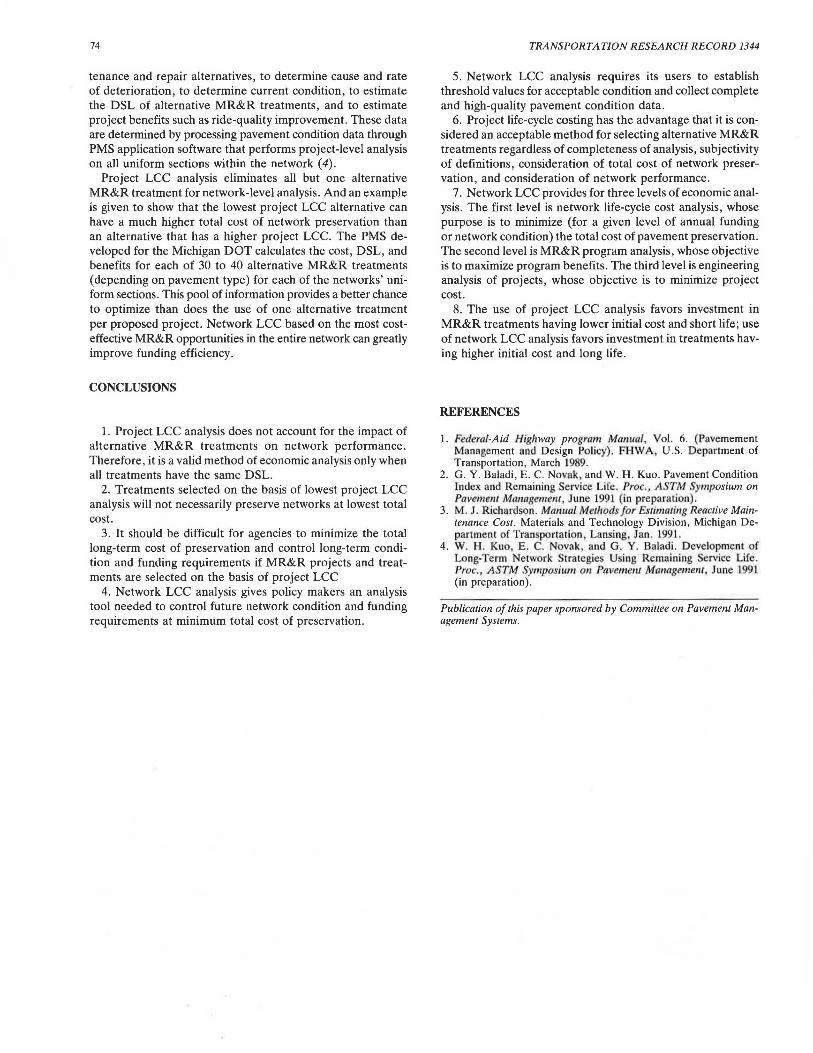
FIGURE 13 Cost of major maintenance scheduled for project's reconstruction and its life-cycle cost (top); and annual MR&R program cost and network life-cycle cost if all projects programmed use same reconstruction treatment (bottom).
73
mi for 50 lane-mi so the 12-year-old projects could receive their scheduled major maintenance. This would increase annual program cost by $3,500,000; total annual preservation cost would be $11,250,000. After 16 years, the program cost would increase again by $5,000/Jane-mi for 50 lane-mi so that the 16-year-old projects could receive their scheduled major maintenance. This would increase annual program cost by $250,000, and total annual program cost would be $11,500,000. After 16 years, the program cost would be stable. These results are shown in the lower half of Figure 13. The network LCC is the sum of the total annual preservation programs during the 40-year analysis period. The network LCC of the rehabilitation alternative is $412,500,000.
This same procedure was used for the reconstruction option , which rehabilitates 100 percent of the network every 35 years, or 2.9 percent of the network annually (Figure 13). Again assuming a network 1,000 Jane-mi long, 29 lane-mi must be reconstructed annually to meet the network condition objective. The initial program cost would be $7,975,000, and it would increase after 10, 15, 20, 25, and 30 years as scheduled major maintenance is conducted. Total annual program cost would stabilize at $10,673,000, as shown in the lower half of Figure 13. The network LCC for the reconstruction option is $310,000,000.
It is interesting to see that the results of project LCC and network LCC analysis are opposite. The rehabilitation treatment's LCC (based on Michigan's method) is 32 percent less than that of the reconstruction treatment. However, the cost to preserve the network over 40 years is 33 percent Jess if all projects are reconstructed rather than rehabilitated. This difference would have been even greater if the effect of inflation on cost of MR&R treatments were included in the analysis. Another variable is network condition over the 40-year analysis period. Annual programs consisting of all rehabilitation projects will reach the target network condition in 20 years; programs consisting of all reconstruction projects will require 35 years to reach the same condition objective.
SUMMARY
This paper illustrates how assessing network performance in terms of RSL enables life-cycle costing to be applied to alternative MR&R programs (MR&R strategies) in place of alternative MR&R treatments . This in turn enables analysis of the LCC of preserving networks, not projects. The advantages of network LCC analysis are that it enables policy makers to
1. Minimize total cost of network preservation. 2. Control future cost and condition of networks. 3. Control MR&R program development by specifying the
following program development constraints: MR&R strategy, funding level, and rank order of MR&R program benefits.
4. Estimate the stream of annual preservation program ex-penses over 40 or more years.
5. Monitor the effectiveness of MR&R program development staffs.
Network LCC analysis requires complete, high-quality pavement condition data to estimate cost of preventive main-
74
tenance and repair alternatives, to determine cause and rate of deterioration, to determine current condition, to estimate the DSL of alternative MR&R treatments, and to estimate project benefits such as ride-quality improvement. These data are determined by processing pavement condition data through PMS application software that performs project-level analysis on all uniform sections within the network (4).
Project LCC analysis eliminates all but one alternative MR&R treatment for network-level analysis. And an example is given to show that the lowest project LCC alternative can have a much higher total cost of network preservation than an alternative that has a higher project LCC. The PMS developed for the Michigan DOT calculates the cost, DSL, and benefits for each of 30 to 40 alternative MR&R treatments (depending on pavement type) for each of the networks' uniform sections. This pool of information provides a better chance to optimize than does the use of one alternative treatment per proposed project. Network LCC based on the most costeffective MR&R opportunities in the entire network can greatly improve funding efficiency.
CONCLUSIONS
1. Project LCC analysis does not account for the impact of alternative MR&R treatments on network performance. Therefore , it is a valid method of economic analysis only when all treatments have the same DSL.
2. Treatments selected on the basis of lowest project LCC analysis will not necessarily preserve networks at lowest total cost.
3. It should be difficult for agencies to minimize the total long-term cost of preservation and control long-term condition and funding requirements if MR&R projects and treatments are selected on the basis of project LCC
4. Network LCC analysis gives policy makers an analysis tool needed to control future network condition and funding requirements at minimum total cost of preservation.
TRANSPORTATION RESEARCH RECORD 1344
5. Network LCC analysis requires its users to establish threshold values for acceptable condition and collect complete and high-quality pavement condition data.
6. Project life-cycle costing has the advantage that it is considered an acceptable method for selecting alternative MR&R treatments regardless of completeness of analysis, subjectivity of definitions, consideration of total cost of network preservation, and consideration of network performance.
7. Network LCC provides for three levels of economic analysis. The first level is network life-cycle cost analysis, whose purpose is to minimize (for a given level of annual funding or network condition) the total cost of pavement preservation. The second level is MR&R program analysis, whose objective is to maximize program benefits . The third level is engineering analysis of projects , whose objective is to minimize project cost .
8. The use of project LCC analysis favors investment in MR&R treatments having lower initial cost and short life; use of network LCC analysis favors investment in treatments having higher initial cost and long life.
REFERENCES
1. Federal-Aid Highway program Ma11L1al , Vol. 6. (Pavemement Management and Design Policy). F HWA , U.S. Department of Transportation, March 19 9.
2. G. Y. Baladi, E . C. Novak, and W. H . Kuo. Pavement Condition fndex nnd Remai ning Service Life. Proc., ASTM Symposium on Pave111e111 Management , June 1991 (in preparation) .
3. M. J. Richardson. Manual Methods for Estimating Reactive Maintenance Cost. Materials and Technology Division, Michigan Department of Transporta tion, Lansi ng, Jan. 1991.
4. W. H. Kuo, E. C. Novak, and G. Y. Bnladi . Development of Long-Term Network Strategic Using Remaining Service Life. Proc., A STM Symposium 0 11 Pavem em Management, June 1991 (in preparation).
Publication of this paper sponsored by Committee on Pavement Management Systems.
Related Documents


![Impact Sarbanes Oxley Act Security 1344[1]](https://static.cupdf.com/doc/110x72/577d33c11a28ab3a6b8ba601/impact-sarbanes-oxley-act-security-13441.jpg)


