RESEARCH AND ANALYSIS Life Cycle Assessment of ICT Carbon Footprint and Operational Electricity Use from the Operator, National, and Subscriber Perspective in Sweden Jens Malmodin, Dag Lund´ en, ˚ Asa Moberg, Greger Andersson, and Mikael Nilsson Summary The use of information and communication technology (ICT) is growing throughout society, and new products and solutions are developed at an increasing rate. To enable environmen- tal assessment of specific ICT products and other products that rely on ICT in some way, a more complete, detailed, and up-to-date study based on real measurements is needed. To date, similar studies have not been readily available or fully comprehensive. This study assessed the overall operational electricity use and life-cycle–based carbon footprint (CF) relating to ICT in Sweden, including activities not commonly addressed previously, such as shared data transport networks and data centers and manufacturing of network infrastruc- ture. Specific, detailed inventory data are presented and used for assessment of the Internet Protocol core network, data transmission, operator activities, and access network. These specific data, in combination with secondary, more generic data for end-user equipment, allow a comprehensive overall assessment. The majority of the ICT network CF is the result of end-user equipment, mainly personal computers, followed by third-party enterprise net- works and data centers and then access networks. The parts closest to the user proved to be clearly responsible for the majority of the impact. The results are presented for Swedish ICT networks and for ICT networks in general based on a global average electricity mix. Keywords: carbon emissions industrial ecology information and communications technology (ICT) Internet life cycle assessment (LCA) telecommunications Supporting information is available on the JIE Web site Introduction The move toward more information and communication technology (ICT) in various sectors of modern society is rapid. Introduction of new devices, or new designs of old devices, is making it possible for people and things to be always available or accessible. Use of ICT networks, which is necessary for the connection of devices and transmission of data, forms a vital part in the growing use of products and services in society. Con- sequently, life cycle assessments (LCAs) of different products and services performed during the past 10 years have demanded an inventory of data regarding ICT. There are several databases Address correspondence to: Dag Lund´ en, TeliaSonera AB, Business Area Broadband Technology Solutions, Farsta SE-123 86, Sweden. Email: [email protected] Web: http://www.cesc.kth.se/ © 2014 by Yale University DOI: 10.1111/jiec.12145 Editor managing review: H. Scott Matthews Volume 18, Number 6 providing comprehensive information on conventional trans- portation infrastructure, such as road systems and railways, and the environmental impacts related to these and all vehicles that use them. In contrast, for electronic distribution, the inventory data are less comprehensive and not as readily available. Some studies have been made for parts of the ICT network system and some on products and services using ICT networks, in which estimates and best available data are used. However, comprehensive studies including user equipment and internet data services (or other managed Internet Protocol [IP] services) are few in number. The physical transmission links (hereafter “data transmission”) and the IP edge/metro/core www.wileyonlinelibrary.com/journal/jie Journal of Industrial Ecology 829

Welcome message from author
This document is posted to help you gain knowledge. Please leave a comment to let me know what you think about it! Share it to your friends and learn new things together.
Transcript
R E S E A R C H A N D A N A LYS I S
Life Cycle Assessment of ICTCarbon Footprint and Operational Electricity Use from theOperator, National, and Subscriber Perspective in Sweden
Jens Malmodin, Dag Lunden, Asa Moberg, Greger Andersson, and Mikael Nilsson
Summary
The use of information and communication technology (ICT) is growing throughout society,and new products and solutions are developed at an increasing rate. To enable environmen-tal assessment of specific ICT products and other products that rely on ICT in some way,a more complete, detailed, and up-to-date study based on real measurements is needed.To date, similar studies have not been readily available or fully comprehensive. This studyassessed the overall operational electricity use and life-cycle–based carbon footprint (CF)relating to ICT in Sweden, including activities not commonly addressed previously, such asshared data transport networks and data centers and manufacturing of network infrastruc-ture. Specific, detailed inventory data are presented and used for assessment of the InternetProtocol core network, data transmission, operator activities, and access network. Thesespecific data, in combination with secondary, more generic data for end-user equipment,allow a comprehensive overall assessment. The majority of the ICT network CF is the resultof end-user equipment, mainly personal computers, followed by third-party enterprise net-works and data centers and then access networks. The parts closest to the user proved tobe clearly responsible for the majority of the impact. The results are presented for SwedishICT networks and for ICT networks in general based on a global average electricity mix.
Keywords:
carbon emissionsindustrial ecologyinformation and communications
technology (ICT)Internetlife cycle assessment (LCA)telecommunications
Supporting information is availableon the JIE Web site
Introduction
The move toward more information and communicationtechnology (ICT) in various sectors of modern society is rapid.Introduction of new devices, or new designs of old devices, ismaking it possible for people and things to be always availableor accessible. Use of ICT networks, which is necessary for theconnection of devices and transmission of data, forms a vitalpart in the growing use of products and services in society. Con-sequently, life cycle assessments (LCAs) of different productsand services performed during the past 10 years have demandedan inventory of data regarding ICT. There are several databases
Address correspondence to: Dag Lunden, TeliaSonera AB, Business Area Broadband Technology Solutions, Farsta SE-123 86, Sweden. Email: [email protected]: http://www.cesc.kth.se/
© 2014 by Yale UniversityDOI: 10.1111/jiec.12145 Editor managing review: H. Scott Matthews
Volume 18, Number 6
providing comprehensive information on conventional trans-portation infrastructure, such as road systems and railways, andthe environmental impacts related to these and all vehiclesthat use them. In contrast, for electronic distribution, theinventory data are less comprehensive and not as readilyavailable. Some studies have been made for parts of the ICTnetwork system and some on products and services using ICTnetworks, in which estimates and best available data are used.However, comprehensive studies including user equipment andinternet data services (or other managed Internet Protocol [IP]services) are few in number. The physical transmission links(hereafter “data transmission”) and the IP edge/metro/core
www.wileyonlinelibrary.com/journal/jie Journal of Industrial Ecology 829
R E S E A R C H A N D A N A LYS I S
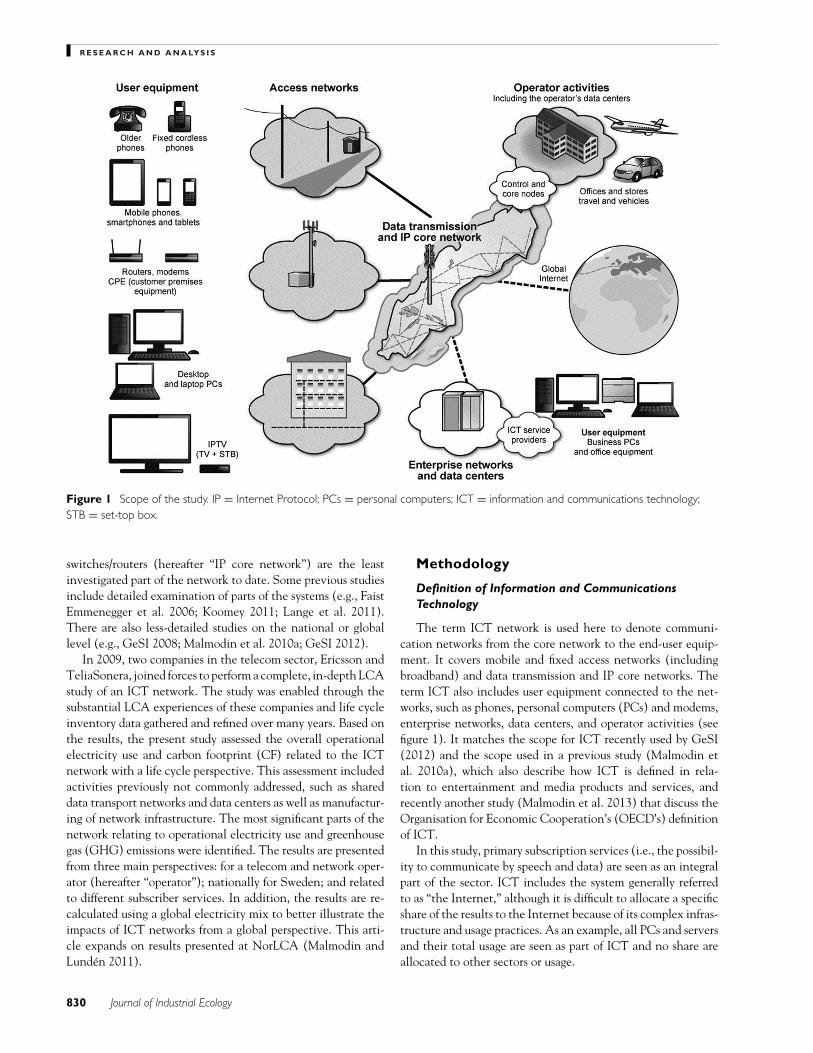
Figure 1 Scope of the study. IP = Internet Protocol; PCs = personal computers; ICT = information and communications technology;STB = set-top box.
switches/routers (hereafter “IP core network”) are the leastinvestigated part of the network to date. Some previous studiesinclude detailed examination of parts of the systems (e.g., FaistEmmenegger et al. 2006; Koomey 2011; Lange et al. 2011).There are also less-detailed studies on the national or globallevel (e.g., GeSI 2008; Malmodin et al. 2010a; GeSI 2012).
In 2009, two companies in the telecom sector, Ericsson andTeliaSonera, joined forces to perform a complete, in-depth LCAstudy of an ICT network. The study was enabled through thesubstantial LCA experiences of these companies and life cycleinventory data gathered and refined over many years. Based onthe results, the present study assessed the overall operationalelectricity use and carbon footprint (CF) related to the ICTnetwork with a life cycle perspective. This assessment includedactivities previously not commonly addressed, such as shareddata transport networks and data centers as well as manufactur-ing of network infrastructure. The most significant parts of thenetwork relating to operational electricity use and greenhousegas (GHG) emissions were identified. The results are presentedfrom three main perspectives: for a telecom and network oper-ator (hereafter “operator”); nationally for Sweden; and relatedto different subscriber services. In addition, the results are re-calculated using a global electricity mix to better illustrate theimpacts of ICT networks from a global perspective. This arti-cle expands on results presented at NorLCA (Malmodin andLunden 2011).
Methodology
Definition of Information and CommunicationsTechnology
The term ICT network is used here to denote communi-cation networks from the core network to the end-user equip-ment. It covers mobile and fixed access networks (includingbroadband) and data transmission and IP core networks. Theterm ICT also includes user equipment connected to the net-works, such as phones, personal computers (PCs) and modems,enterprise networks, data centers, and operator activities (seefigure 1). It matches the scope for ICT recently used by GeSI(2012) and the scope used in a previous study (Malmodin etal. 2010a), which also describe how ICT is defined in rela-tion to entertainment and media products and services, andrecently another study (Malmodin et al. 2013) that discuss theOrganisation for Economic Cooperation’s (OECD’s) definitionof ICT.
In this study, primary subscription services (i.e., the possibil-ity to communicate by speech and data) are seen as an integralpart of the sector. ICT includes the system generally referredto as “the Internet,” although it is difficult to allocate a specificshare of the results to the Internet because of its complex infras-tructure and usage practices. As an example, all PCs and serversand their total usage are seen as part of ICT and no share areallocated to other sectors or usage.
830 Journal of Industrial Ecology
R E S E A R C H A N D A N A LYS I S
Results are presented here for both the actual ICT net-work itself and also for the “extended ICT network,” in whichend-user equipment and third-party enterprise networks anddata centers are included, which, also short, can be denotedICT.
Life Cycle Assessment of Information andCommunications Technology in General
By using a life cycle perspective, the environmental impactthroughout the whole system from cradle to grave is considered.For ICT networks, this means that the energy used for operatingthe network, but also the manufacturing and maintenance ofinfrastructure and equipment and their end-of-life treatment(EoLT) are included.
Performing an LCA of an ICT network is very complex. Be-cause the telecommunication and Internet services are globallyconnected and some national nodes are accessed by many op-erators, description of a national ICT network is complicatedin terms of both scope and allocation. How this was handled inthe current study is described in the following sections.
Scope of the Study
The case study performed covered TeliaSonera’s actual ICTnetwork and its connected Swedish customers in the extendednetwork, including its share of impact from international datatraffic network equipment and third-party enterprise networksand data centers. The functional unit was 1 year of networkoperation. In addition, the impact was calculated in relation tospecific primary subscription services, including subscriptionsfor mobile and fixed voice or broadband connections.
All networks included and calculations made were basedon 2009 data, except measurements of user equipment inSwedish households in 2008 (Zimmermann 2009), TeliaSon-era operator activities in 2007 (TeliaSonera 2008), and datatraffic in Sweden in 2010 (PTS 2011). Manufacturing andconstruction-related LCA inventory data were normalized to1 year of operation (2009) using relevant lifetime estimates.Earlier LCA studies performed at Ericsson and TeliaSonera onvarious parts of the ICT network in Sweden were used as themain data source for embodied emissions (see the supportinginformation on the Journal’s website). Based on observations,energy and manufacturing data change slowly year by year,despite the rapid increase in data traffic. This argues for theestimates being appropriate also for 2010 when using datatraffic measurements from the same year.
Operational electricity use and overall GHG emissionsrelated to ICT networks and the operator’s activities wereassessed. The GHG emissions included both use stage andembodied emissions. The embodied carbon emissions for anyequipment are defined as the total life cycle carbon dioxideequivalent (CO2-eq) emissions associated with manufacturing,transportation, and EoLT for that equipment (i.e., all emissionsexcept those related to its operational energy use). All relevantGHG emissions are included, for example, GHG emissions re-
lated to cement production (construction of infrastructure) anduse of fluorinated gases (electronic component manufacturing).
As illustrated in figure 1, the ICT network system studiedwas comprehensive. The subsystems included in the study were:
User equipment:
� Basic mobile phones and more advanced smartphones,fixed (cordless) phones, PCs/terminals, office equipment,televisions (TVs) used together with IPTV subscriptions.Additional equipment, such as personal data storage andaudio peripherals, were excluded because they were de-fined as entertainment and media products (Malmodinet al. 2010a).
� Home network equipment or customer premises equip-ment (CPE), for example, modems, routers and gateways,and set-top boxes (STBs) used together with IPTV
Access networks:
� Second-generation (2G; global system for mobile commu-nications [GSM]) and third-generation (3G; widebandcode division multiple access [WCDMA]) mobile ra-dio access networks, public switched telephone networks(PSTNs), digital subscriber line (xDSL), cable TV, fiberoptic cable to the home/curb, and so on
Control and core nodes (allocated to each service):
� PSTN voice, 2G and 3G mobile core networks, voice-over IP (VoIP)
Operator activities and operator data centers:
� Offices and stores (energy), internal data centers, businesstravel, service vehicles (own and third-party services),and activities required for operation and maintenance ofthe ICT networks, to serve the subscribers, and so on
Data transmission and IP core network:
� A large number of different types of transmission link el-ements (copper, fiber optics, radio links, and so on), IPedge/metro/core switches/routers, including all support-ing infrastructure for cooling, power, and so on
� International data transport, IP core networks anddata centers, routers and fiber optic links, and subma-rine fiber optic cable systems for data traffic outsideSweden/European Union, and so on
Third-party enterprise networks and third-party data cen-ters:
� Enterprise networks (local area network; LAN) with ac-cess and aggregation switches and routers
� Servers, storage, and routers and switches in data cen-ters, including all supporting infrastructure for cooling,rectifiers, and back-up systems
For a more detailed description of ICT network subsystemsand their function, see appendices S3 and S5 in the supportinginformation available on the Web.
Malmodin et al., LCA of ICT Networks from the Operator, National, and Subscriber Perspective 831
R E S E A R C H A N D A N A LYS I S
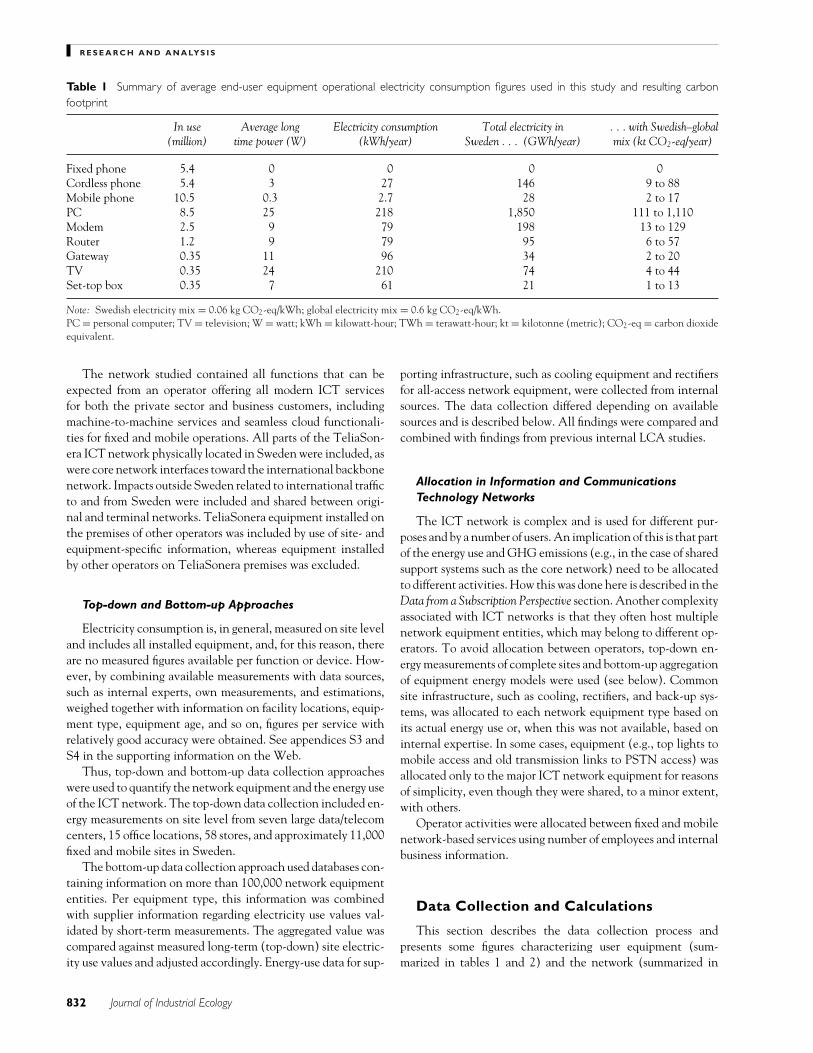
Table 1 Summary of average end-user equipment operational electricity consumption figures used in this study and resulting carbonfootprint
In use Average long Electricity consumption Total electricity in . . . with Swedish–global(million) time power (W) (kWh/year) Sweden . . . (GWh/year) mix (kt CO2-eq/year)
Fixed phone 5.4 0 0 0 0Cordless phone 5.4 3 27 146 9 to 88Mobile phone 10.5 0.3 2.7 28 2 to 17PC 8.5 25 218 1,850 111 to 1,110Modem 2.5 9 79 198 13 to 129Router 1.2 9 79 95 6 to 57Gateway 0.35 11 96 34 2 to 20TV 0.35 24 210 74 4 to 44Set-top box 0.35 7 61 21 1 to 13
Note: Swedish electricity mix = 0.06 kg CO2-eq/kWh; global electricity mix = 0.6 kg CO2-eq/kWh.PC = personal computer; TV = television; W = watt; kWh = kilowatt-hour; TWh = terawatt-hour; kt = kilotonne (metric); CO2-eq = carbon dioxideequivalent.
The network studied contained all functions that can beexpected from an operator offering all modern ICT servicesfor both the private sector and business customers, includingmachine-to-machine services and seamless cloud functionali-ties for fixed and mobile operations. All parts of the TeliaSon-era ICT network physically located in Sweden were included, aswere core network interfaces toward the international backbonenetwork. Impacts outside Sweden related to international trafficto and from Sweden were included and shared between origi-nal and terminal networks. TeliaSonera equipment installed onthe premises of other operators was included by use of site- andequipment-specific information, whereas equipment installedby other operators on TeliaSonera premises was excluded.
Top-down and Bottom-up Approaches
Electricity consumption is, in general, measured on site leveland includes all installed equipment, and, for this reason, thereare no measured figures available per function or device. How-ever, by combining available measurements with data sources,such as internal experts, own measurements, and estimations,weighed together with information on facility locations, equip-ment type, equipment age, and so on, figures per service withrelatively good accuracy were obtained. See appendices S3 andS4 in the supporting information on the Web.
Thus, top-down and bottom-up data collection approacheswere used to quantify the network equipment and the energy useof the ICT network. The top-down data collection included en-ergy measurements on site level from seven large data/telecomcenters, 15 office locations, 58 stores, and approximately 11,000fixed and mobile sites in Sweden.
The bottom-up data collection approach used databases con-taining information on more than 100,000 network equipmententities. Per equipment type, this information was combinedwith supplier information regarding electricity use values val-idated by short-term measurements. The aggregated value wascompared against measured long-term (top-down) site electric-ity use values and adjusted accordingly. Energy-use data for sup-
porting infrastructure, such as cooling equipment and rectifiersfor all-access network equipment, were collected from internalsources. The data collection differed depending on availablesources and is described below. All findings were compared andcombined with findings from previous internal LCA studies.
Allocation in Information and CommunicationsTechnology Networks
The ICT network is complex and is used for different pur-poses and by a number of users. An implication of this is that partof the energy use and GHG emissions (e.g., in the case of sharedsupport systems such as the core network) need to be allocatedto different activities. How this was done here is described in theData from a Subscription Perspective section. Another complexityassociated with ICT networks is that they often host multiplenetwork equipment entities, which may belong to different op-erators. To avoid allocation between operators, top-down en-ergy measurements of complete sites and bottom-up aggregationof equipment energy models were used (see below). Commonsite infrastructure, such as cooling, rectifiers, and back-up sys-tems, was allocated to each network equipment type based onits actual energy use or, when this was not available, based oninternal expertise. In some cases, equipment (e.g., top lights tomobile access and old transmission links to PSTN access) wasallocated only to the major ICT network equipment for reasonsof simplicity, even though they were shared, to a minor extent,with others.
Operator activities were allocated between fixed and mobilenetwork-based services using number of employees and internalbusiness information.
Data Collection and Calculations
This section describes the data collection process andpresents some figures characterizing user equipment (sum-marized in tables 1 and 2) and the network (summarized in
832 Journal of Industrial Ecology
R E S E A R C H A N D A N A LYS I S
Table 2 Summary of average end-user equipment manufacturingcarbon footprint figures used in this study
Manufacturing TotalPut on market CF (kg CO2- manufacturing CF(million/year) eq/device) (kt CO2-eq/year)
Fixed phone 0 5 0Cordless phone 0.8 15 12Mobile phone 3.5 24 84PC 2.1 375 790Modem 0.5 15 7.5Router 0.2 20 4Gateway 0.08 50 4TV 0.05 300 15Set-top box 0.07 25 2
Note: PC = personal computer; TV = television; CF = carbon foot-print; kg = kilogram; CO2-eq = carbon dioxide equivalent; kt = kilotonne(metric).
table 3). The main data used in the study can be found in thesupporting information on the Web, where network elementsand abbreviations used are also explained.
User Equipment
One key challenge in this study was to find representativefigures for the energy use and the embodied CF of a number of
user equipment categories reflecting the current use of ICT inSweden. Typical user equipment per subscription was estimatedfor the whole of Sweden and the same values were used forTeliaSonera subscriptions.
Based on number of PCs sold and in use in Sweden everyyear, it was clear that PCs would play a major role for the ICTnetworks studied. Therefore, PCs are used here as an example toillustrate how calculations were made for user equipment. Fur-ther information and calculations regarding other equipmentcategories are presented in the Supporting Information on theWeb, where all references to the LCA studies used are alsolisted.
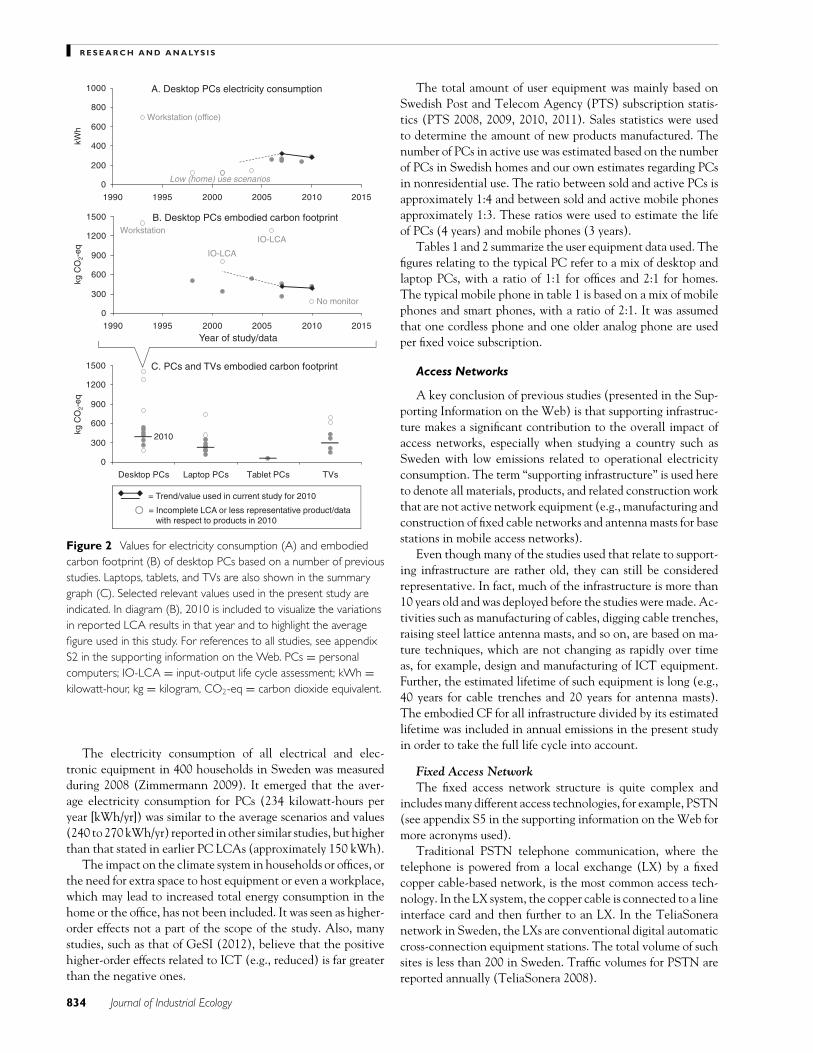
According to some 20 LCA studies, the embodied CF of aPC is between 200 and 800 kilograms (kg) CO2-eq for a desktopcomputer and between 100 and 400 kg CO2-eq for a laptop. Thetwo most important reasons for the range of values are the typeof PC studied (from inexpensive small basic to expensive largehigh-end) and the age of the data. Based on the LCA studiesreviewed, a number of LCA models for the average embodiedcarbon footprint and electricity consumption for the main PCtypes were established; see figure 2 and appendix S2 in thesupporting information on the Web. Standard peripherals, suchas keyboard and mouse, were included, but other peripherals,such as external storage, speakers, and gaming peripherals, werenot. Extra monitors and docking stations for office laptops wereincluded in the study as separate equipment.
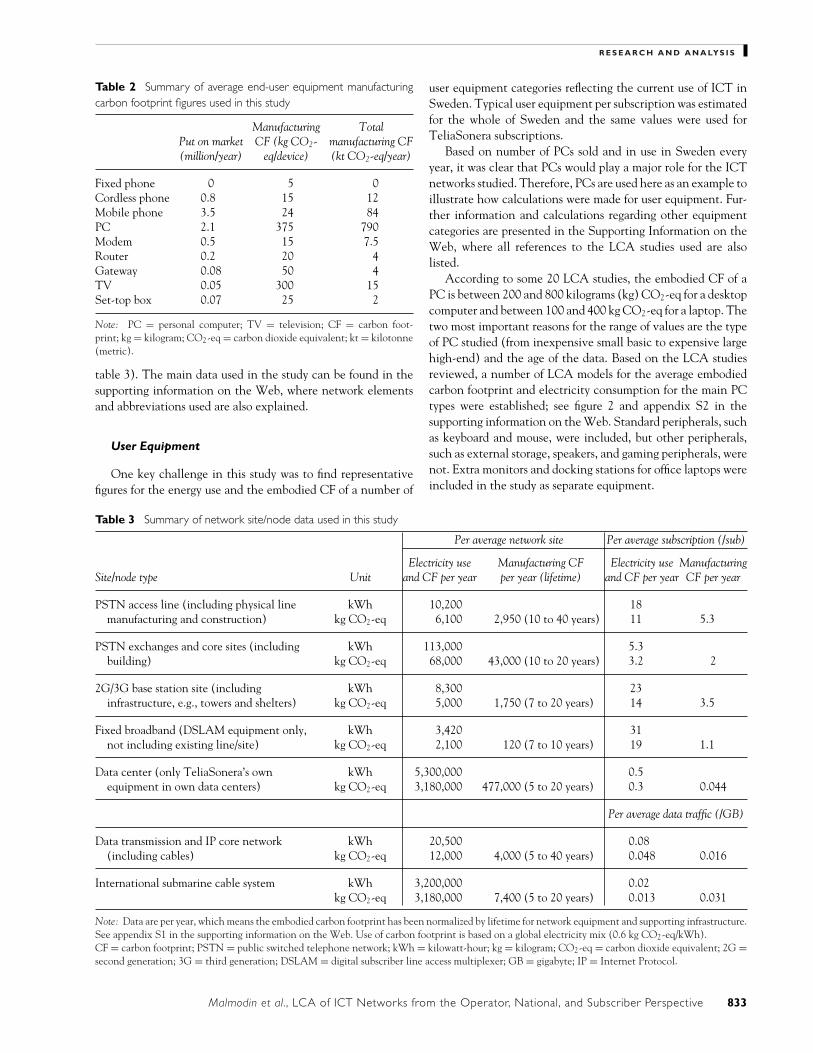
Table 3 Summary of network site/node data used in this study
Per average network site Per average subscription (/sub)
Electricity use Manufacturing CF Electricity use ManufacturingSite/node type Unit and CF per year per year (lifetime) and CF per year CF per year
PSTN access line (including physical line kWh 10,200 18manufacturing and construction) kg CO2-eq 6,100 2,950 (10 to 40 years) 11 5.3
PSTN exchanges and core sites (including kWh 113,000 5.3building) kg CO2-eq 68,000 43,000 (10 to 20 years) 3.2 2
2G/3G base station site (including kWh 8,300 23infrastructure, e.g., towers and shelters) kg CO2-eq 5,000 1,750 (7 to 20 years) 14 3.5
Fixed broadband (DSLAM equipment only, kWh 3,420 31not including existing line/site) kg CO2-eq 2,100 120 (7 to 10 years) 19 1.1
Data center (only TeliaSonera’s own kWh 5,300,000 0.5equipment in own data centers) kg CO2-eq 3,180,000 477,000 (5 to 20 years) 0.3 0.044
Per average data traffic (/GB)
Data transmission and IP core network kWh 20,500 0.08(including cables) kg CO2-eq 12,000 4,000 (5 to 40 years) 0.048 0.016
International submarine cable system kWh 3,200,000 0.02kg CO2-eq 3,180,000 7,400 (5 to 20 years) 0.013 0.031
Note: Data are per year, which means the embodied carbon footprint has been normalized by lifetime for network equipment and supporting infrastructure.See appendix S1 in the supporting information on the Web. Use of carbon footprint is based on a global electricity mix (0.6 kg CO2-eq/kWh).CF = carbon footprint; PSTN = public switched telephone network; kWh = kilowatt-hour; kg = kilogram; CO2-eq = carbon dioxide equivalent; 2G =second generation; 3G = third generation; DSLAM = digital subscriber line access multiplexer; GB = gigabyte; IP = Internet Protocol.
Malmodin et al., LCA of ICT Networks from the Operator, National, and Subscriber Perspective 833
R E S E A R C H A N D A N A LYS I S
0
200
400
600
800
1000
1990 1995 2000 2005 2010 2015
kWh
A. Desktop PCs electricity consumption
Workstation (office)
Low (home) use scenarios
0
300
600
900
1200
1500
Desktop PCs Laptop PCs Tablet PCs TVs
0
300
600
900
1200
1500
1990 1995 2000 2005 2010 2015
B. Desktop PCs embodied carbon footprint
C. PCs and TVs embodied carbon footprint
kg C
O2
OC gk
qe-2-
eq
2010
WorkstationIO-LCA
IO-LCA
No monitor
= Trend/value used in current study for 2010
= Incomplete LCA or less representative product/datawith respect to products in 2010
Year of study/data
Figure 2 Values for electricity consumption (A) and embodiedcarbon footprint (B) of desktop PCs based on a number of previousstudies. Laptops, tablets, and TVs are also shown in the summarygraph (C). Selected relevant values used in the present study areindicated. In diagram (B), 2010 is included to visualize the variationsin reported LCA results in that year and to highlight the averagefigure used in this study. For references to all studies, see appendixS2 in the supporting information on the Web. PCs = personalcomputers; IO-LCA = input-output life cycle assessment; kWh =kilowatt-hour, kg = kilogram, CO2-eq = carbon dioxide equivalent.
The electricity consumption of all electrical and elec-tronic equipment in 400 households in Sweden was measuredduring 2008 (Zimmermann 2009). It emerged that the aver-age electricity consumption for PCs (234 kilowatt-hours peryear [kWh/yr]) was similar to the average scenarios and values(240 to 270 kWh/yr) reported in other similar studies, but higherthan that stated in earlier PC LCAs (approximately 150 kWh).
The impact on the climate system in households or offices, orthe need for extra space to host equipment or even a workplace,which may lead to increased total energy consumption in thehome or the office, has not been included. It was seen as higher-order effects not a part of the scope of the study. Also, manystudies, such as that of GeSI (2012), believe that the positivehigher-order effects related to ICT (e.g., reduced) is far greaterthan the negative ones.
The total amount of user equipment was mainly based onSwedish Post and Telecom Agency (PTS) subscription statis-tics (PTS 2008, 2009, 2010, 2011). Sales statistics were usedto determine the amount of new products manufactured. Thenumber of PCs in active use was estimated based on the numberof PCs in Swedish homes and our own estimates regarding PCsin nonresidential use. The ratio between sold and active PCs isapproximately 1:4 and between sold and active mobile phonesapproximately 1:3. These ratios were used to estimate the lifeof PCs (4 years) and mobile phones (3 years).
Tables 1 and 2 summarize the user equipment data used. Thefigures relating to the typical PC refer to a mix of desktop andlaptop PCs, with a ratio of 1:1 for offices and 2:1 for homes.The typical mobile phone in table 1 is based on a mix of mobilephones and smart phones, with a ratio of 2:1. It was assumedthat one cordless phone and one older analog phone are usedper fixed voice subscription.
Access Networks
A key conclusion of previous studies (presented in the Sup-porting Information on the Web) is that supporting infrastruc-ture makes a significant contribution to the overall impact ofaccess networks, especially when studying a country such asSweden with low emissions related to operational electricityconsumption. The term “supporting infrastructure” is used hereto denote all materials, products, and related construction workthat are not active network equipment (e.g., manufacturing andconstruction of fixed cable networks and antenna masts for basestations in mobile access networks).
Even though many of the studies used that relate to support-ing infrastructure are rather old, they can still be consideredrepresentative. In fact, much of the infrastructure is more than10 years old and was deployed before the studies were made. Ac-tivities such as manufacturing of cables, digging cable trenches,raising steel lattice antenna masts, and so on, are based on ma-ture techniques, which are not changing as rapidly over timeas, for example, design and manufacturing of ICT equipment.Further, the estimated lifetime of such equipment is long (e.g.,40 years for cable trenches and 20 years for antenna masts).The embodied CF for all infrastructure divided by its estimatedlifetime was included in annual emissions in the present studyin order to take the full life cycle into account.
Fixed Access NetworkThe fixed access network structure is quite complex and
includes many different access technologies, for example, PSTN(see appendix S5 in the supporting information on the Web formore acronyms used).
Traditional PSTN telephone communication, where thetelephone is powered from a local exchange (LX) by a fixedcopper cable-based network, is the most common access tech-nology. In the LX system, the copper cable is connected to a lineinterface card and then further to an LX. In the TeliaSoneranetwork in Sweden, the LXs are conventional digital automaticcross-connection equipment stations. The total volume of suchsites is less than 200 in Sweden. Traffic volumes for PSTN arereported annually (TeliaSonera 2008).
834 Journal of Industrial Ecology
R E S E A R C H A N D A N A LYS I S
VoIP is the IP-based fixed telephone system that, in thelong run, will replace conventional PSTN. The usage is stilllimited, but the network equipment already exists and increasedcustomer volumes will only increase the need for hardware andthe electricity consumption to a limited extent. VoIP requiresfixed broadband access.
Fixed broadband access by xDSL communication over cop-per cable is the most common solution in Sweden to achievehigh-capacity data streams up to 20 megabits per second (2009).To achieve xDSL communication either by asymmetrical dig-ital subscriber line or very-high-bit-rate digital subscriber line,there is a need for a digital subscriber line access multiplexer(DSLAM) or similar equipment, which distributes the broad-band signal to the end customer. The DSLAM can supply manycustomers and the electricity consumption varies, depending onbroadband capacity, distance to the customer, and quality of thecopper wire. On the end-user side, there is a need for a modemthat converts the xDSL signal to a data stream that, in normalcases, is distributed on a local fixed or wireless local LAN net-work. Fiber optic cable to the home network also exists, butvolumes were quite low in 2009.
The supporting infrastructure is mainly made up of ca-ble ducts and trenches. The average distance to an LX inSweden is approximately 2 km. On average, approximately 33lines share a physical cable deployment, approximately twothirds of which is outside buildings in cable ducts. TeliaSonerahas made an extensive LCA study of manufacturing and con-struction of fixed copper networks, including all active equip-ment as well as supporting infrastructure (see appendix S1 in thesupporting information on the Web). According to that study,the embodied carbon footprint is 5.3 kg CO2-eq for the physicalline itself and approximately 2 kg CO2-eq for active equipmentand sites per average fixed line and year. The DSLAM describedabove, which is needed to enable fixed broadband in existingcopper access networks, has an embodied footprint for its ac-tive equipment of approximately 1.1 kg CO2-eq per new fixedbroadband line.
Mobile Access NetworkThe mobile network was divided into radio access and mo-
bile core networks. Different methods were used to collect elec-tricity consumption figures for these parts.
The radio access network consists of base stations, includingtransmitters and receivers. There are two parallel systems: 2G(GSM) and 3G (WCDMA). The TeliaSonera 3G network inSweden is shared with another operator, a fact that was takeninto account in the calculations. Measured electricity-use datawere available for 36% of the base station sites. Based on theseand a bottom-up approach regarding installed network equip-ment and different site sizes, a model was created to estimateelectricity use for all base stations.
The mobile core network consists of mobile switches, sub-scriber databases, base station controllers, and so on. Energy-usecalculations were based on bottom-up energy models, includingenergy figures from vendors for each node type.
For transmission between base stations and core networks,several technologies, such as radio link and fixed broadband
communication, are used. Energy figures for transmission persite were based on an average of the different technologies.
Ericsson has made an extensive LCA study of manufactur-ing and construction of mobile networks and all base stationsites, including all active equipment as well as supporting in-frastructure (see appendix S1 in the supporting information onthe Web). The supporting infrastructure is mainly made up ofantenna masts and site housings, but also includes power instal-lations, battery backup, and climate equipment. According tothat study, the related carbon footprint is approximately 2.1 kgCO2-eq per mobile subscription and year, mainly the result ofthe supporting infrastructure and antenna towers.
Transmission and Internet Protocol Core Network
The transmission and IP core network parts of the ICT net-work are complex. A simplified version of the ICT network isillustrated in figure 1 and in appendix S3 in the supporting infor-mation on the Web. Different methods and different in-housecompetences were used here to collect information on differ-ent network elements. As a general rule, internal inventorydata were used. All active (i.e., power-consuming) network ele-ments were identified and divided into categories, as presentedin appendix S4 in the supporting information on the Web.
The transmission and IP core network equipment is spreadout across many locations and its energy use is included in to-tal electricity consumption figures for different sites. For datatransmission and IP core network, each equipment type wasidentified and nominal energy figures from suppliers were used.In some cases, especially for network core routers, these fig-ures were verified by energy measurements. Some measurementsshowed a large difference (+100%/–50%), compared to specifi-cations by suppliers. However, because the aggregated nominalelectricity consumption in total was in the same range as mea-sured, the overall figures and their distribution between networkparts were assumed to be good estimates.
Electricity consumption for each equipment type was calcu-lated by multiplying the amount of equipment by the typicalelectricity consumption. To this figure, electricity for backupand cooling was added. The back-up and cooling figures werebased on in-house estimates made by infrastructure experts.Measurements were made for verification. Most figures werealso verified through comparing calculated electricity figureswith real electricity consumption figures per site.
The data transmission and IP core network have been theleast studied network part in previous LCAs of ICT. There-fore, this part is described in more detail in a separate article(Malmodin et al. 2012), which also describes how the Telia-Sonera core network data can be extrapolated to model thecorresponding overall Swedish core network parts. A subma-rine optical cable system, which is used for data traffic acrossthe Atlantic, was included based on an LCA of sea cable-layingoperations (Donovan 2009).
Operator Activities and Operator Data Centers
To install, maintain, and operate an ICT network, thereis a need for human resources, machines, and energy. Human
Malmodin et al., LCA of ICT Networks from the Operator, National, and Subscriber Perspective 835
R E S E A R C H A N D A N A LYS I S
resources are associated with energy use in offices and stores,business travel, service vehicles, and commuting and were mod-eled based on measurements of TeliaSonera activities in Swe-den. Impacts from operator activities were included within thesystem boundaries, both when performed by internal personneland when outsourced (Malmodin et al. 2010b).
TeliaSonera’s annual report (2008), written in accord withthe Global Reporting Intiative standard Scope I, II, and,partially, III (TeliaSonera), was used as the basis for all in-ternal and external contractor work performed, including useof vehicles and other machines, transport and travel.
Data centers containing servers for business support systems,operations support systems, and so on, were allocated to this cat-egory. The seven largest data centers in TeliaSonera Swedencover almost 80% of the total number of internal servers rele-vant to this study. Five of these (>70% of total server volume)were studied in depth (i.e., manufacturer information, equip-ment types, supporting infrastructure, and so on). Equipment inthese data centers was categorized as servers, storage, or otherinformation techonology (IT) equipment. For these categories,LCA studies, such as Hermann (2008), Google (2011) and We-ber (2010), provided information on the embodied CF. Thisinformation was combined with electricity consumption fig-ures from suppliers. Site-specific supporting infrastructure data(cooling, uninterruptible power supply [UPS], rectifiers, and soon) were collected from each data center and combined withestimates made by internal experts. All this information wasused to validate the total electricity consumption.
For the remaining server volume, a rough estimate of equip-ment composition (mainly numbers and types), together withextrapolated figures from the more detailed assessment, wereused to allocate overall electricity consumption to the specificequipment.
Third-Party Enterprise Networks and Third-Party DataCenters
For third-party data centers (e.g., Google and Facebook,but also including all servers in enterprise networks), the totaloperational energy use in Sweden was based on Koomey (2011)because of the lack of good server sales data for Sweden. Thenumber of active servers was estimated based on the globalratio between estimated active servers and PCs globally andthe number of PCs in Sweden. Approximately the same ratiowas found between global domain name system registrationsglobally and in Sweden, as well as approximately the same ratioalso for data traffic volumes and colocation data center count.The data from Koomey (2011) were used, which include a factorof 1.3 to include storage and network equipment and then afactor of 1.8 to include cooling and power systems (power usageeffectiveness factor), as defined by The Green Grid (2011).TeliaSonera’s share was based on number of subscriptions andshare of enterprise customers.
The energy use of enterprise LAN network equipment inSweden was estimated to be 74 gigawatt-hours (GWh), basedon 35 kWh per active LAN PC (based on internal studies) and
2.1 million LAN PCs (see section S6.5 in the supporting infor-mation on the Web). Based on internal studies, it was estimatedthat the server-to-PC ratio in enterprise networks was approx-imately 1:10, compared to an overall ratio of approximately1:30. The energy consumption for a service such as Google israther low, at 2 kWh per average user and year (Google 2012),whereas it is far higher for average total enterprise network dataservices (>200 kWh).
Approximately 35% of all access data traffic was estimatedto be to and from data centers. Based on the same data trafficmeasurements in IP core networks in Sweden, it was estimatedthat approximately one quarter of the data centers are locatedabroad (e.g., Google and Facebook) and that one quarter ofthe data centers in Sweden serve customers abroad. In practicalterms when studying Sweden, this means that one quarter of thedata centers were modeled using a global average electricity mix.It was also assumed that approximately 50% of this internationaldata traffic proceeds through a long-distance submarine fiberoptic connection, based on Donovan (2009). See appendix S5in the supporting information on the Web for more informationabout the data traffic model developed for Sweden.
The embodied CF for servers and other network equipmentwas based on the same LCA studies described in the operatorsections. Electricity consumption in the use stage typically rep-resents approximately 90% of the total CF for such networkequipment (see appendix S1 in the supporting information onthe Web). To what extent offices and travel activities (similarto TeliaSonera operator activities) are included in used LCAdata for network equipment is not fully known. Ericsson in-cludes offices and travel related to the design, manufacturing,sales, and so on, in LCA of its products and services, but itrepresents typically only approximately 1% of total life cycleenergy or CF.
Data Extrapolation to Sweden and Recalculations toIllustrate Global Conditions
The data gathered for TeliaSonera were extrapolated to es-timate values for the overall Swedish ICT networks. Each net-work part was scaled individually using best available informa-tion (see appendix S4 in the supporting information on theWeb). End-user equipment data were available on the nationallevel, as previously described.
For operator activities, it was assumed that, per subscrip-tion, other operators in Sweden have as many employees andstores, travel as much, and have as many vehicles servicingthe networks as TeliaSonera, if PSTN maintenance specific forTeliaSonera is excluded.
As a result of Sweden’s relatively low GHG-emitting elec-tricity mix (0.06 kg CO2-eq/kWh), which is based mainly onhydro and nuclear sources, use stage results were recalculatedfor a global average electricity mix (0.6 kg CO2-eq/kWh) tomake the results more relevant for non-Swedish conditions.The emission factors for electricity consumption are based onLCAs of electricity production, including fuel supply chainand construction of power plants and the grid itself (including
836 Journal of Industrial Ecology
R E S E A R C H A N D A N A LYS I S
losses), which is described in Malmodin and colleagues(2010a).
In many other ways, Swedish ICT networks are believed tocorrespond rather well to global conditions. In brief, the ge-ographical density (subscriptions per square kilometer [km2])of mobile subscriptions is slightly lower, but the density offixed subscriptions is somewhat higher. The number of mobilesubscriptions per area in Sweden is of the same order of mag-nitude as the global average, at 27 and 33 subscriptions/km2,respectively (based on ITU [2011]). The number of fixed sub-scriptions per area in Sweden is higher than the correspondingglobal average, at 18 and 11 subscriptions/km2, respectively.The voice and data traffic is higher per subscription in Sweden,but this is not crucial for the extrapolation. The average out-door temperature in Sweden is approximately 5°C, comparedwith a global average of approximately 15°C. Because of thisfact, free air cooling is used more frequently in Sweden. Overall,the energy use related to climate is lower in Sweden.
Data from a Subscription Perspective
The subscription perspective was calculated for the Swedishand global results, but not for TeliaSonera, because parts of thekey data were only publicly available on the national level (e.g.,data traffic and sales statistics).
The recalculations from total network values to subscriptionwere generally straightforward (e.g., total results for PSTN net-work were divided by PSTN subscriptions). Dedicated PSTNand mobile transmission links were first related to PSTN andmobile networks, respectively. However, whereas the accessequipment for PSTN and xDSL is dedicated to subscriptions,the physical line itself is shared. Several alternative alloca-tion principles may be applied (e.g., one line per subscriptionor based on share of data traffic). Using data traffic would beconsistent with the allocation choice used for other networkand transmission components here. However, this would al-locate nearly all the line impact to broadband subscriptions.Such an allocation seems unreasonable, because approximatelythree quarters of the PSTN lines deployed have no broadbandequipment connected. Also, in the future, all households willprobably have xDSL (or another broadband connection), butno active PSTN. The data for the physical line constructionis approximately a decade old, when there were about as manymore active PSTN lines as there are new broadband lines to-day. Therefore, the full impact of an average physical line wasallocated to both PSTN (approximately 10% of the total PSTNimpact; see section S6.1 in the supporting information on theWeb) and broadband connection (only approximately 1% ofthe total broadband impact; see section S6.5 in the supportinginformation on the Web).
Data centers were allocated 50/50 between propriety en-terprise networks (“intranet”) and the public Internet based ontypical server-to-PC ratios for enterprise networks. The Internetpart was then allocated to different subscription services basedon data volume, including also enterprise network PC Internetdata volume. Data transmission and IP core networks were al-located to different subscription services based on data volume.
Results and Discussion
The Information and Communications TechnologyNetwork: Operator and National Perspective
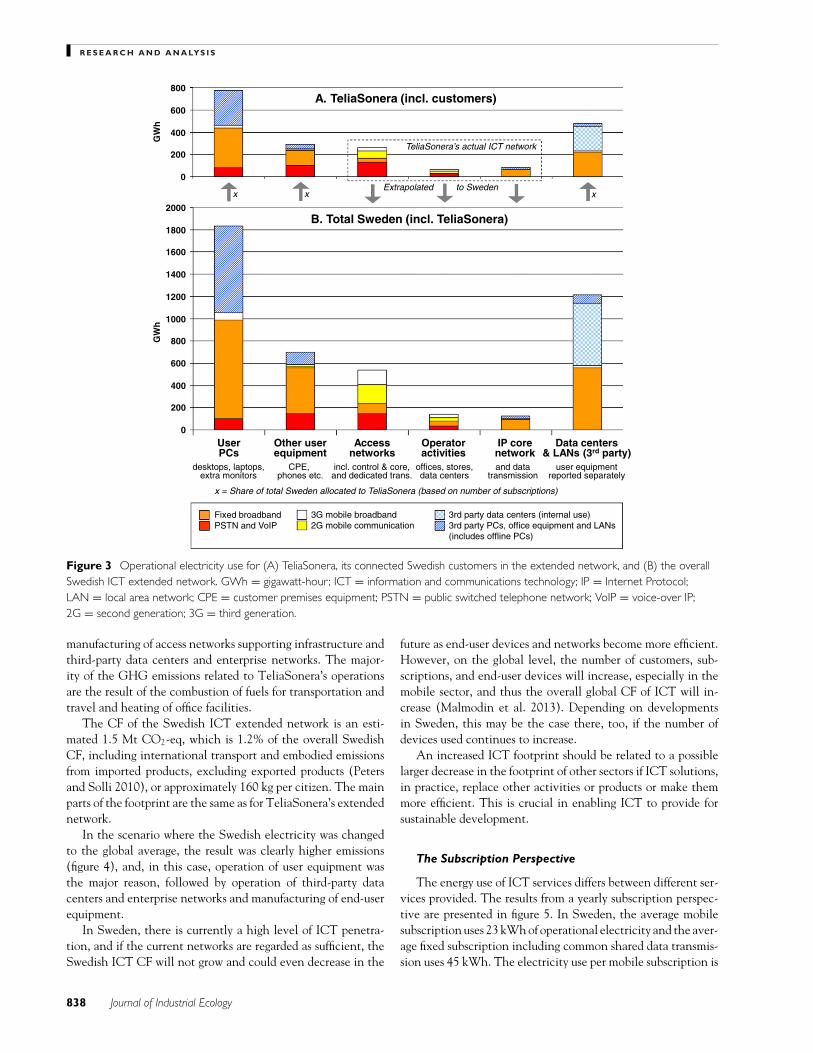
The TeliaSonera actual network consumes approximately0.42 terrawatt-hours (TWh). This includes access networks,data transmission, and IP networks, but excludes TeliaSoneracustomers’ colocated equipment. It can be noted that the oldpublic fixed access network (i.e., PSTN) represents almost 25%of this (figure 3) because it has quite high, constant electricityconsumption. This includes traditional PSTN network nodesand concentrators. There is potential to decrease the overallenergy use by replacing old with new technology (i.e., by usingIP-based PSTN solutions). This is also true for the mobile net-work. Thus, in new markets, where state-of-the-art technologycan be applied from the start, the energy use may be lower thanthe average presented here. However, it is worth highlightingthe in-built conflict between choosing to invest in expensive,but modern, IP-based solutions and relying on older, perfectlyworking, but not as energy-efficient, solutions that are in op-eration subsequent to investments made more than 15 yearsago.
Another way of presenting the operational electricity ofthe TeliaSonera actual network (excluding offices) is: networkequipment, 65%; cooling, 19%; rectifier/UPS, 12%; and oth-ers 4% (see appendix S4 in the supporting information on theWeb).
User equipment, third-party data centers, and enterprise net-works consume 1.5 TWh. Together with the energy of theactual network, this results in 1.9 TWh for TeliaSonera, itsconnected Swedish customers, and accessed third-party equip-ment in the extended network (figure 3). Note that numberof PCs and their electricity consumption is not modeled, butbased on actual measurements in 400 Swedish households fora whole year (Zimmerman 2009). These measurements showedhigh “on-time” (5 hours/PC/day) and high electricity consump-tion (240 kWh/PC/year). It is also worth mentioning that cus-tomer premises equipment (CPE) in people’s homes consumesslightly more electricity than the mobile and fixed broadbandaccess networks altogether.
To reduce the total electricity consumption of ICT, the focusshould primarily be on PCs, data centers (servers), and CPE,where the largest potentials are. New energy-efficient laptopsand tablets have the potential to lower the consumption ofuser equipment in the future as their share of user equipmentgrows. Electricity consumption should also be an importantaspect when access network nodes are added or modernized.The core network’s consumption is, on the other hand, low, incomparison to its importance.
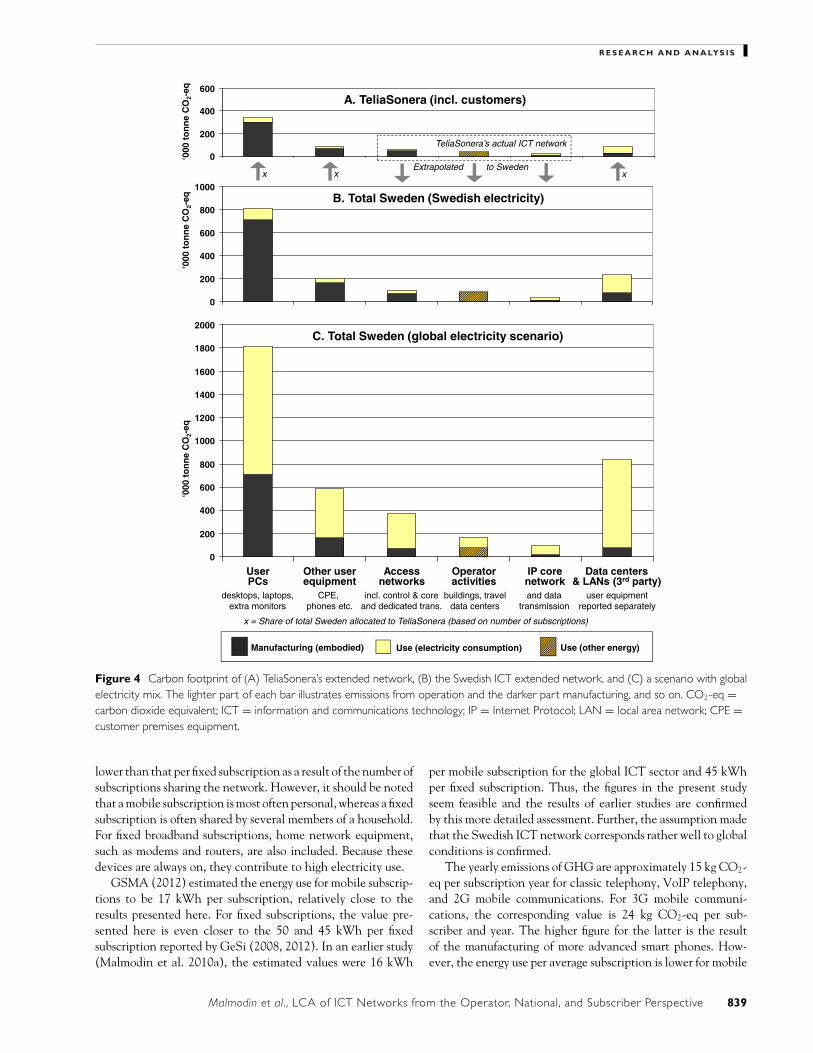
The overall CF of TeliaSonera’s extended network during1 year is equal to 0.65 million metric tonnes (Mt) CO2-eq (fig-ure 4). This is mainly the result of the end-user equipmentand, more specifically, their manufacturing (0.37 Mt CO2-eq), because the electricity used in manufacturing is highlyfossil based, unlike the Swedish electricity mix used for op-eration. Other important contributors are construction and
Malmodin et al., LCA of ICT Networks from the Operator, National, and Subscriber Perspective 837
R E S E A R C H A N D A N A LYS I S
0
200
400
600
800
0
200
400
600
800
1000
1200
1400
1600
1800
2000
A. TeliaSonera (incl. customers)
Accessnetworks
IP corenetwork
Operatoractivities
Other userequipment
UserPCs
and datatransmission
offices, stores,data centers
incl. control & core,and dedicated trans.
Data centers& LANs (3rd party)
desktops, laptops,extra monitors
CPE, phones etc.
user equipmentreported separately
GW
hG
Wh
B. Total Sweden (incl. TeliaSonera)
Fixed broadbandPSTN and VoIP
3rd party data centers (internal use)3rd party PCs, office equipment and LANs(includes offline PCs)
3G mobile broadband2G mobile communication
TeliaSonera’s actual ICT network
Extrapolated to Sweden
x = Share of total Sweden allocated to TeliaSonera (based on number of subscriptions)
x x x
Figure 3 Operational electricity use for (A) TeliaSonera, its connected Swedish customers in the extended network, and (B) the overallSwedish ICT extended network. GWh = gigawatt-hour; ICT = information and communications technology; IP = Internet Protocol;LAN = local area network; CPE = customer premises equipment; PSTN = public switched telephone network; VoIP = voice-over IP;2G = second generation; 3G = third generation.
manufacturing of access networks supporting infrastructure andthird-party data centers and enterprise networks. The major-ity of the GHG emissions related to TeliaSonera’s operationsare the result of the combustion of fuels for transportation andtravel and heating of office facilities.
The CF of the Swedish ICT extended network is an esti-mated 1.5 Mt CO2-eq, which is 1.2% of the overall SwedishCF, including international transport and embodied emissionsfrom imported products, excluding exported products (Petersand Solli 2010), or approximately 160 kg per citizen. The mainparts of the footprint are the same as for TeliaSonera’s extendednetwork.
In the scenario where the Swedish electricity was changedto the global average, the result was clearly higher emissions(figure 4), and, in this case, operation of user equipment wasthe major reason, followed by operation of third-party datacenters and enterprise networks and manufacturing of end-userequipment.
In Sweden, there is currently a high level of ICT penetra-tion, and if the current networks are regarded as sufficient, theSwedish ICT CF will not grow and could even decrease in the
future as end-user devices and networks become more efficient.However, on the global level, the number of customers, sub-scriptions, and end-user devices will increase, especially in themobile sector, and thus the overall global CF of ICT will in-crease (Malmodin et al. 2013). Depending on developmentsin Sweden, this may be the case there, too, if the number ofdevices used continues to increase.
An increased ICT footprint should be related to a possiblelarger decrease in the footprint of other sectors if ICT solutions,in practice, replace other activities or products or make themmore efficient. This is crucial in enabling ICT to provide forsustainable development.
The Subscription Perspective
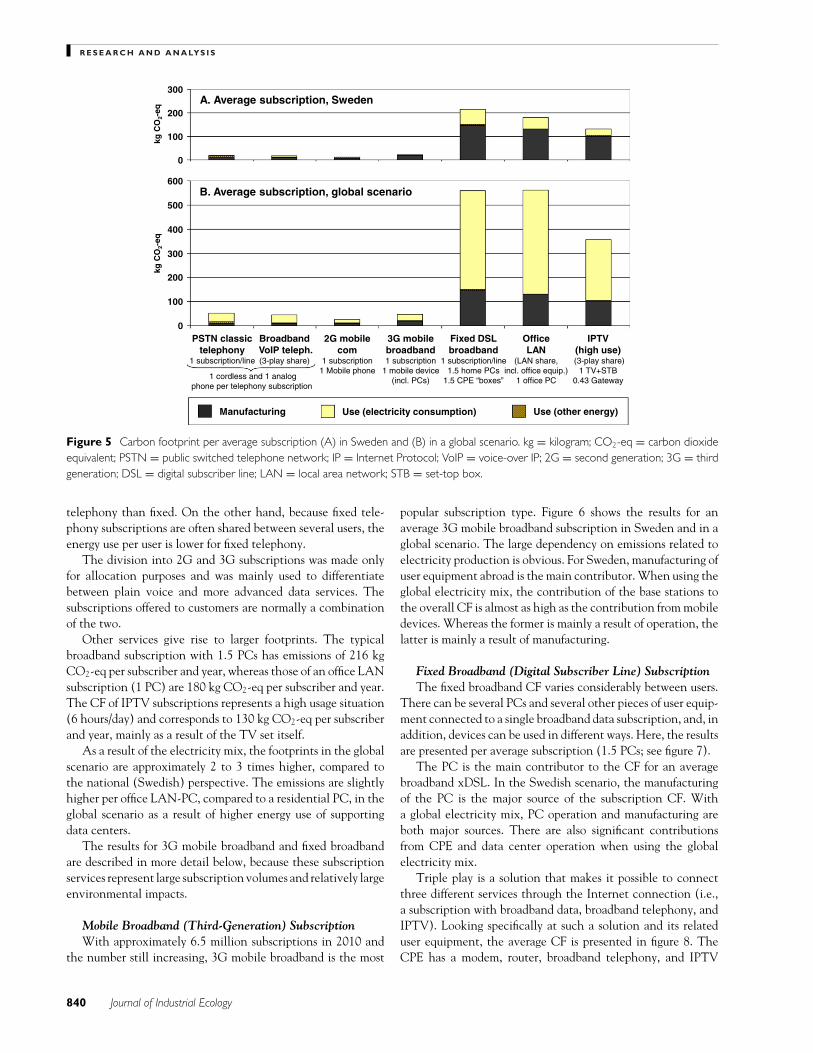
The energy use of ICT services differs between different ser-vices provided. The results from a yearly subscription perspec-tive are presented in figure 5. In Sweden, the average mobilesubscription uses 23 kWh of operational electricity and the aver-age fixed subscription including common shared data transmis-sion uses 45 kWh. The electricity use per mobile subscription is
838 Journal of Industrial Ecology
R E S E A R C H A N D A N A LYS I S
0
200
400
600
0
200
400
600
800
1000
1200
1400
1600
1800
2000
A. TeliaSonera (incl. customers)
Accessnetworks
IP corenetwork
Operatoractivities
Other userequipment
UserPCs
and datatransmission
buildings, traveldata centers
incl. control & coreand dedicated trans.
Data centers& LANs (3rd party)
desktops, laptops,extra monitors
CPE, phones etc.
‘000
to
nn
e C
O2-
eq
0
200
400
600
800
1000‘0
00 t
on
ne
CO
2-eq B. Total Sweden (Swedish electricity)
C. Total Sweden (global electricity scenario)
‘000
to
nn
e C
O2-
eq
Use (electricity consumption)Manufacturing (embodied)
TeliaSonera’s actual ICT network
Extrapolated to Swedenx x x
Use (other energy)
x = Share of total Sweden allocated to TeliaSonera (based on number of subscriptions)
user equipmentreported separately
Figure 4 Carbon footprint of (A) TeliaSonera’s extended network, (B) the Swedish ICT extended network, and (C) a scenario with globalelectricity mix. The lighter part of each bar illustrates emissions from operation and the darker part manufacturing, and so on. CO2-eq =carbon dioxide equivalent; ICT = information and communications technology; IP = Internet Protocol; LAN = local area network; CPE =customer premises equipment.
lower than that per fixed subscription as a result of the number ofsubscriptions sharing the network. However, it should be notedthat a mobile subscription is most often personal, whereas a fixedsubscription is often shared by several members of a household.For fixed broadband subscriptions, home network equipment,such as modems and routers, are also included. Because thesedevices are always on, they contribute to high electricity use.
GSMA (2012) estimated the energy use for mobile subscrip-tions to be 17 kWh per subscription, relatively close to theresults presented here. For fixed subscriptions, the value pre-sented here is even closer to the 50 and 45 kWh per fixedsubscription reported by GeSi (2008, 2012). In an earlier study(Malmodin et al. 2010a), the estimated values were 16 kWh
per mobile subscription for the global ICT sector and 45 kWhper fixed subscription. Thus, the figures in the present studyseem feasible and the results of earlier studies are confirmedby this more detailed assessment. Further, the assumption madethat the Swedish ICT network corresponds rather well to globalconditions is confirmed.
The yearly emissions of GHG are approximately 15 kg CO2-eq per subscription year for classic telephony, VoIP telephony,and 2G mobile communications. For 3G mobile communi-cations, the corresponding value is 24 kg CO2-eq per sub-scriber and year. The higher figure for the latter is the resultof the manufacturing of more advanced smart phones. How-ever, the energy use per average subscription is lower for mobile
Malmodin et al., LCA of ICT Networks from the Operator, National, and Subscriber Perspective 839
R E S E A R C H A N D A N A LYS I S
0
100
200
300
2G mobilecom
1 subscription1 Mobile phone
3G mobilebroadband1 subscription
1 mobile device(incl. PCs)
PSTN classictelephony
1 subscription/line
BroadbandVoIP teleph.(3-play share)
Fixed DSLbroadband
1 subscription/line1.5 home PCs
1.5 CPE “boxes”
OfficeLAN
(LAN share,incl. office equip.)
1 office PC
IPTV(high use)(3-play share)
1 TV+STB0.43 Gateway
0
100
200
300
400
500
600
A. Average subscription, Sweden
kg C
O2-
eq
B. Average subscription, global scenario
kg C
O2-
eq
1 cordless and 1 analogphone per telephony subscription
Use (electricity consumption)Manufacturing Use (other energy)
Figure 5 Carbon footprint per average subscription (A) in Sweden and (B) in a global scenario. kg = kilogram; CO2-eq = carbon dioxideequivalent; PSTN = public switched telephone network; IP = Internet Protocol; VoIP = voice-over IP; 2G = second generation; 3G = thirdgeneration; DSL = digital subscriber line; LAN = local area network; STB = set-top box.
telephony than fixed. On the other hand, because fixed tele-phony subscriptions are often shared between several users, theenergy use per user is lower for fixed telephony.
The division into 2G and 3G subscriptions was made onlyfor allocation purposes and was mainly used to differentiatebetween plain voice and more advanced data services. Thesubscriptions offered to customers are normally a combinationof the two.
Other services give rise to larger footprints. The typicalbroadband subscription with 1.5 PCs has emissions of 216 kgCO2-eq per subscriber and year, whereas those of an office LANsubscription (1 PC) are 180 kg CO2-eq per subscriber and year.The CF of IPTV subscriptions represents a high usage situation(6 hours/day) and corresponds to 130 kg CO2-eq per subscriberand year, mainly as a result of the TV set itself.
As a result of the electricity mix, the footprints in the globalscenario are approximately 2 to 3 times higher, compared tothe national (Swedish) perspective. The emissions are slightlyhigher per office LAN-PC, compared to a residential PC, in theglobal scenario as a result of higher energy use of supportingdata centers.
The results for 3G mobile broadband and fixed broadbandare described in more detail below, because these subscriptionservices represent large subscription volumes and relatively largeenvironmental impacts.
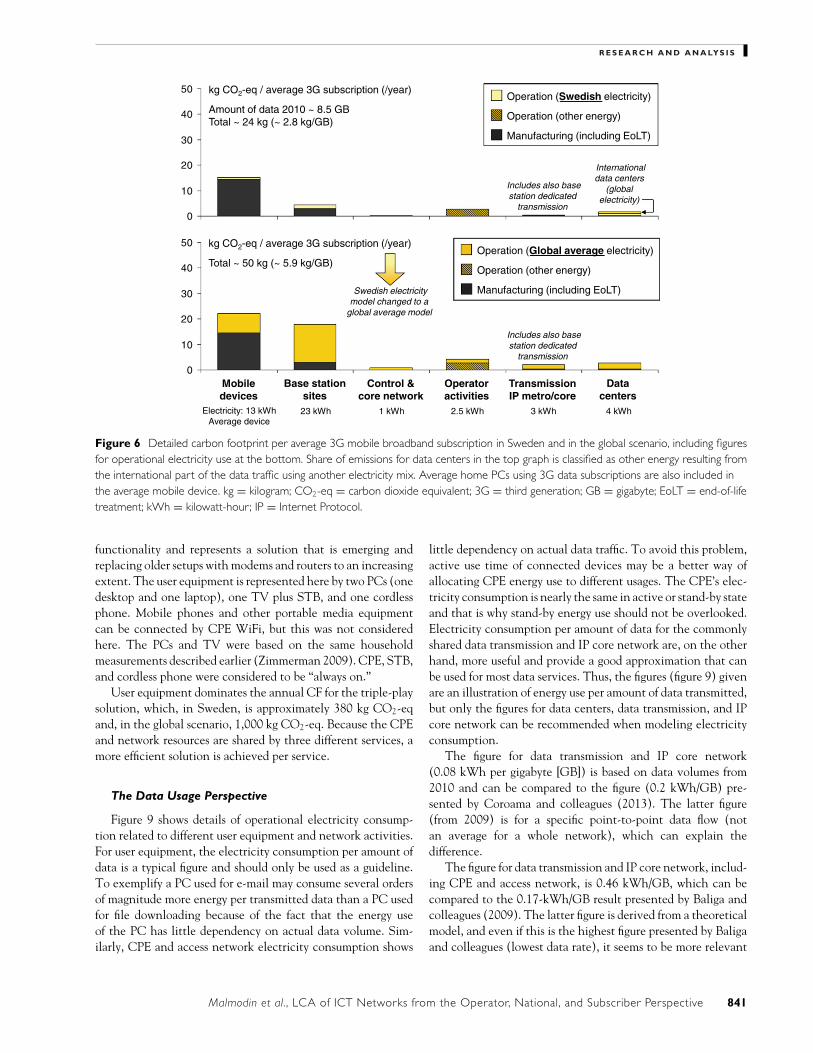
Mobile Broadband (Third-Generation) SubscriptionWith approximately 6.5 million subscriptions in 2010 and
the number still increasing, 3G mobile broadband is the most
popular subscription type. Figure 6 shows the results for anaverage 3G mobile broadband subscription in Sweden and in aglobal scenario. The large dependency on emissions related toelectricity production is obvious. For Sweden, manufacturing ofuser equipment abroad is the main contributor. When using theglobal electricity mix, the contribution of the base stations tothe overall CF is almost as high as the contribution from mobiledevices. Whereas the former is mainly a result of operation, thelatter is mainly a result of manufacturing.
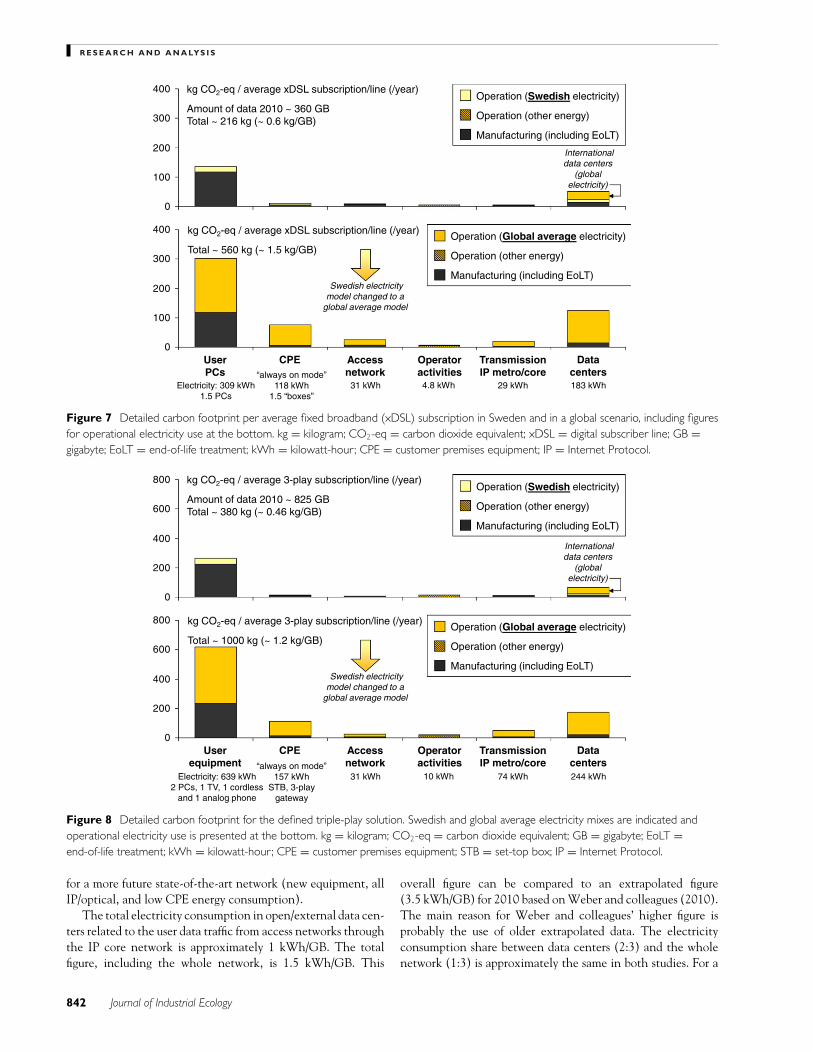
Fixed Broadband (Digital Subscriber Line) SubscriptionThe fixed broadband CF varies considerably between users.
There can be several PCs and several other pieces of user equip-ment connected to a single broadband data subscription, and, inaddition, devices can be used in different ways. Here, the resultsare presented per average subscription (1.5 PCs; see figure 7).
The PC is the main contributor to the CF for an averagebroadband xDSL. In the Swedish scenario, the manufacturingof the PC is the major source of the subscription CF. Witha global electricity mix, PC operation and manufacturing areboth major sources. There are also significant contributionsfrom CPE and data center operation when using the globalelectricity mix.
Triple play is a solution that makes it possible to connectthree different services through the Internet connection (i.e.,a subscription with broadband data, broadband telephony, andIPTV). Looking specifically at such a solution and its relateduser equipment, the average CF is presented in figure 8. TheCPE has a modem, router, broadband telephony, and IPTV
840 Journal of Industrial Ecology
R E S E A R C H A N D A N A LYS I S
0
10
20
30
40
50
TransmissionIP metro/core
Base stationsites
Mobiledevices
Operatoractivities
Datacenters
Control &core network
Operation (Swedish electricity)
Operation (other energy)
Manufacturing (including EoLT)
0
10
20
30
40
50Operation (Global average electricity)
Operation (other energy)
Manufacturing (including EoLT)
Includes also basestation dedicated
transmission
Includes also basestation dedicated
transmission
kg CO2-eq / average 3G subscription (/year)
Amount of data 2010 ~ 8.5 GBTotal ~ 24 kg (~ 2.8 kg/GB)
kg CO2-eq / average 3G subscription (/year)
Total ~ 50 kg (~ 5.9 kg/GB)
3 kWh hWk 4hWk 5.2hWk 32 1 kWhElectricity: 13 kWhAverage device
Swedish electricitymodel changed to a
global average model
Internationaldata centers
(globalelectricity)
Figure 6 Detailed carbon footprint per average 3G mobile broadband subscription in Sweden and in the global scenario, including figuresfor operational electricity use at the bottom. Share of emissions for data centers in the top graph is classified as other energy resulting fromthe international part of the data traffic using another electricity mix. Average home PCs using 3G data subscriptions are also included inthe average mobile device. kg = kilogram; CO2-eq = carbon dioxide equivalent; 3G = third generation; GB = gigabyte; EoLT = end-of-lifetreatment; kWh = kilowatt-hour; IP = Internet Protocol.
functionality and represents a solution that is emerging andreplacing older setups with modems and routers to an increasingextent. The user equipment is represented here by two PCs (onedesktop and one laptop), one TV plus STB, and one cordlessphone. Mobile phones and other portable media equipmentcan be connected by CPE WiFi, but this was not consideredhere. The PCs and TV were based on the same householdmeasurements described earlier (Zimmerman 2009). CPE, STB,and cordless phone were considered to be “always on.”
User equipment dominates the annual CF for the triple-playsolution, which, in Sweden, is approximately 380 kg CO2-eqand, in the global scenario, 1,000 kg CO2-eq. Because the CPEand network resources are shared by three different services, amore efficient solution is achieved per service.
The Data Usage Perspective
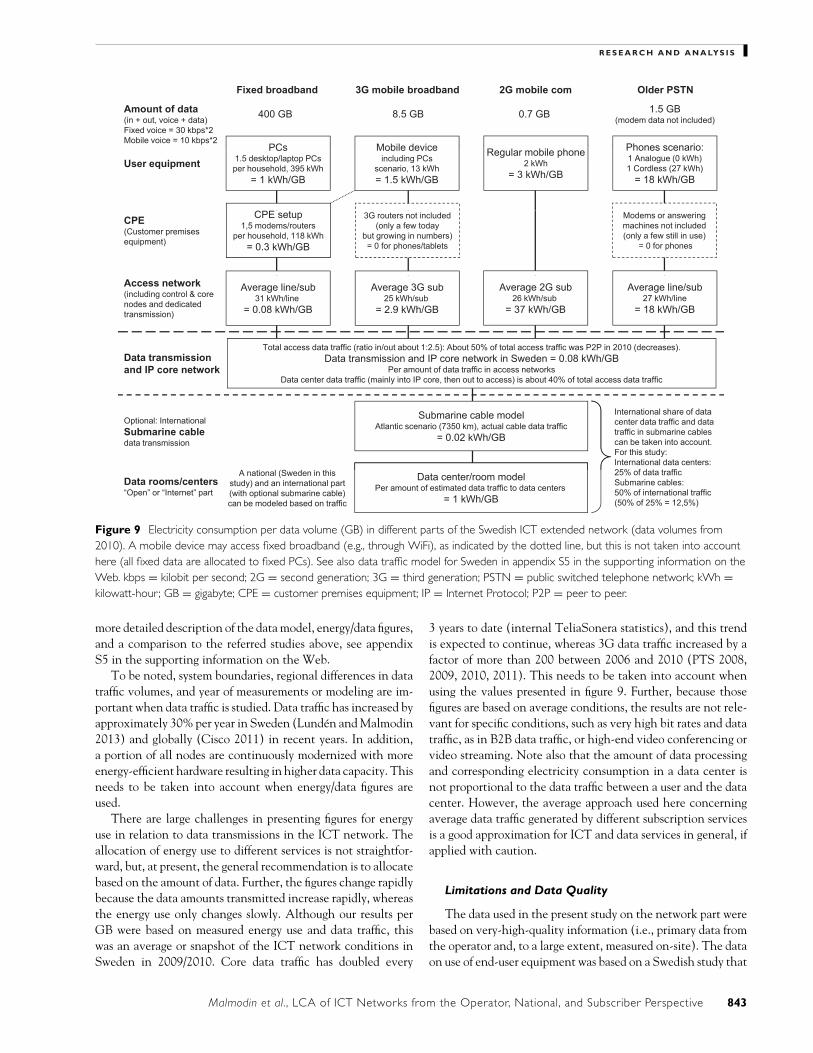
Figure 9 shows details of operational electricity consump-tion related to different user equipment and network activities.For user equipment, the electricity consumption per amount ofdata is a typical figure and should only be used as a guideline.To exemplify a PC used for e-mail may consume several ordersof magnitude more energy per transmitted data than a PC usedfor file downloading because of the fact that the energy useof the PC has little dependency on actual data volume. Sim-ilarly, CPE and access network electricity consumption shows
little dependency on actual data traffic. To avoid this problem,active use time of connected devices may be a better way ofallocating CPE energy use to different usages. The CPE’s elec-tricity consumption is nearly the same in active or stand-by stateand that is why stand-by energy use should not be overlooked.Electricity consumption per amount of data for the commonlyshared data transmission and IP core network are, on the otherhand, more useful and provide a good approximation that canbe used for most data services. Thus, the figures (figure 9) givenare an illustration of energy use per amount of data transmitted,but only the figures for data centers, data transmission, and IPcore network can be recommended when modeling electricityconsumption.
The figure for data transmission and IP core network(0.08 kWh per gigabyte [GB]) is based on data volumes from2010 and can be compared to the figure (0.2 kWh/GB) pre-sented by Coroama and colleagues (2013). The latter figure(from 2009) is for a specific point-to-point data flow (notan average for a whole network), which can explain thedifference.
The figure for data transmission and IP core network, includ-ing CPE and access network, is 0.46 kWh/GB, which can becompared to the 0.17-kWh/GB result presented by Baliga andcolleagues (2009). The latter figure is derived from a theoreticalmodel, and even if this is the highest figure presented by Baligaand colleagues (lowest data rate), it seems to be more relevant
Malmodin et al., LCA of ICT Networks from the Operator, National, and Subscriber Perspective 841
R E S E A R C H A N D A N A LYS I S
0
100
200
300
400
TransmissionIP metro/core
CPEUserPCs
Operatoractivities
Datacenters
Accessnetwork
Operation (Global average electricity)
Operation (other energy)
Manufacturing (including EoLT)
kg CO2-eq / average xDSL subscription/line (/year)
Total ~ 560 kg (~ 1.5 kg/GB)
“always on mode”118 kWh
1.5 “boxes”31 kWhElectricity: 309 kWh
1.5 PCs29 kWh 183 kWh
0
100
200
300
400 kg CO2-eq / average xDSL subscription/line (/year)
Amount of data 2010 ~ 360 GBTotal ~ 216 kg (~ 0.6 kg/GB)
Operation (Swedish electricity)
Operation (other energy)
Manufacturing (including EoLT)
4.8 kWh
Swedish electricitymodel changed to a
global average model
Internationaldata centers
(globalelectricity)
Figure 7 Detailed carbon footprint per average fixed broadband (xDSL) subscription in Sweden and in a global scenario, including figuresfor operational electricity use at the bottom. kg = kilogram; CO2-eq = carbon dioxide equivalent; xDSL = digital subscriber line; GB =gigabyte; EoLT = end-of-life treatment; kWh = kilowatt-hour; CPE = customer premises equipment; IP = Internet Protocol.
0
200
400
600
800
TransmissionIP metro/core
CPEUserequipment
Operatoractivities
Datacenters
Accessnetwork
Operation (Global average electricity)
Operation (other energy)
Manufacturing (including EoLT)
kg CO2-eq / average 3-play subscription/line (/year)
Total ~ 1000 kg (~ 1.2 kg/GB)
“always on mode”157 kWh
STB, 3-playgateway
31 kWhElectricity: 639 kWh2 PCs, 1 TV, 1 cordless
and 1 analog phone
74 kWh 244 kWh
0
200
400
600
800 kg CO2-eq / average 3-play subscription/line (/year)
Amount of data 2010 ~ 825 GBTotal ~ 380 kg (~ 0.46 kg/GB)
Operation (Swedish electricity)
Operation (other energy)
Manufacturing (including EoLT)
10 kWh
Swedish electricitymodel changed to a
global average model
Internationaldata centers
(globalelectricity)
Figure 8 Detailed carbon footprint for the defined triple-play solution. Swedish and global average electricity mixes are indicated andoperational electricity use is presented at the bottom. kg = kilogram; CO2-eq = carbon dioxide equivalent; GB = gigabyte; EoLT =end-of-life treatment; kWh = kilowatt-hour; CPE = customer premises equipment; STB = set-top box; IP = Internet Protocol.
for a more future state-of-the-art network (new equipment, allIP/optical, and low CPE energy consumption).
The total electricity consumption in open/external data cen-ters related to the user data traffic from access networks throughthe IP core network is approximately 1 kWh/GB. The totalfigure, including the whole network, is 1.5 kWh/GB. This
overall figure can be compared to an extrapolated figure(3.5 kWh/GB) for 2010 based on Weber and colleagues (2010).The main reason for Weber and colleagues’ higher figure isprobably the use of older extrapolated data. The electricityconsumption share between data centers (2:3) and the wholenetwork (1:3) is approximately the same in both studies. For a
842 Journal of Industrial Ecology
R E S E A R C H A N D A N A LYS I S
PC M bil d i Phones scenario
400 GB 8.5 GBAmount of data(in + out, voice + data)Fixed voice = 30 kbps*2Mobile voice = 10 kbps*2
0.7 GB 1.5 GB(modem data not included)
Fixed broadband 3G mobile broadband 2G mobile com Older PSTN
PCs1.5 desktop/laptop PCsper household, 395 kWh
= 1 kWh/GB
Mobile deviceincluding PCs
scenario, 13 kWh= 1.5 kWh/GB
Phones scenario:1 Analogue (0 kWh)1 Cordless (27 kWh)
= 18 kWh/GB
Regular mobile phone2 kWh
= 3 kWh/GBUser equipment
CPE setup1,5 modems/routers
per household, 118 kWh = 0.3 kWh/GB
3G routers not included(only a few today
but growing in numbers)= 0 for phones/tablets
Modems or answeringmachines not included(only a few still in use)
= 0 for phones
CPE(Customer premisesequipment)
Average line/sub31 kWh/line
= 0.08 kWh/GB
Average 3G sub25 kWh/sub
= 2.9 kWh/GB
Average line/sub27 kWh/line
= 18 kWh/GB
Average 2G sub26 kWh/sub
= 37 kWh/GB
Access network(including control & corenodes and dedicatedtransmission)
Total access data traffic (ratio in/out about 1:2.5): About 50% of total access traffic was P2P in 2010 (decreases).Data transmission and IP core network in Sweden = 0.08 kWh/GB
Per amount of data traffic in access networksData center data traffic (mainly into IP core, then out to access) is about 40% of total access data traffic
Data transmissionand IP core network
Submarine cable modelAtlantic scenario (7350 km), actual cable data traffic
= 0.02 kWh/GB
Optional: InternationalSubmarine cabledata transmission
International share of data center data traffic and datatraffic in submarine cables can be taken into account.For this study:International data centers: 25% f d t t ffiA ti l (S d i thi Data center/room model
Per amount of estimated data traffic to data centers = 1 kWh/GB
Data rooms/centers“Open” or “Internet” part
25% of data trafficSubmarine cables:50% of international traffic (50% of 25% = 12,5%)
A national (Sweden in thisstudy) and an international part(with optional submarine cable)can be modeled based on traffic
Figure 9 Electricity consumption per data volume (GB) in different parts of the Swedish ICT extended network (data volumes from2010). A mobile device may access fixed broadband (e.g., through WiFi), as indicated by the dotted line, but this is not taken into accounthere (all fixed data are allocated to fixed PCs). See also data traffic model for Sweden in appendix S5 in the supporting information on theWeb. kbps = kilobit per second; 2G = second generation; 3G = third generation; PSTN = public switched telephone network; kWh =kilowatt-hour; GB = gigabyte; CPE = customer premises equipment; IP = Internet Protocol; P2P = peer to peer.
more detailed description of the data model, energy/data figures,and a comparison to the referred studies above, see appendixS5 in the supporting information on the Web.
To be noted, system boundaries, regional differences in datatraffic volumes, and year of measurements or modeling are im-portant when data traffic is studied. Data traffic has increased byapproximately 30% per year in Sweden (Lunden and Malmodin2013) and globally (Cisco 2011) in recent years. In addition,a portion of all nodes are continuously modernized with moreenergy-efficient hardware resulting in higher data capacity. Thisneeds to be taken into account when energy/data figures areused.
There are large challenges in presenting figures for energyuse in relation to data transmissions in the ICT network. Theallocation of energy use to different services is not straightfor-ward, but, at present, the general recommendation is to allocatebased on the amount of data. Further, the figures change rapidlybecause the data amounts transmitted increase rapidly, whereasthe energy use only changes slowly. Although our results perGB were based on measured energy use and data traffic, thiswas an average or snapshot of the ICT network conditions inSweden in 2009/2010. Core data traffic has doubled every
3 years to date (internal TeliaSonera statistics), and this trendis expected to continue, whereas 3G data traffic increased by afactor of more than 200 between 2006 and 2010 (PTS 2008,2009, 2010, 2011). This needs to be taken into account whenusing the values presented in figure 9. Further, because thosefigures are based on average conditions, the results are not rele-vant for specific conditions, such as very high bit rates and datatraffic, as in B2B data traffic, or high-end video conferencing orvideo streaming. Note also that the amount of data processingand corresponding electricity consumption in a data center isnot proportional to the data traffic between a user and the datacenter. However, the average approach used here concerningaverage data traffic generated by different subscription servicesis a good approximation for ICT and data services in general, ifapplied with caution.
Limitations and Data Quality
The data used in the present study on the network part werebased on very-high-quality information (i.e., primary data fromthe operator and, to a large extent, measured on-site). The dataon use of end-user equipment was based on a Swedish study that
Malmodin et al., LCA of ICT Networks from the Operator, National, and Subscriber Perspective 843
R E S E A R C H A N D A N A LYS I S
measured 400 households during 1 year (Zimmerman 2009).Thus, these data are also of high quality. Data on manufacturingof end-user equipment were based on previous LCA studies withvarying quality. However, in this study, best estimates based oninformation from several studies were used and this is probablythe largest source to the overall uncertainty of the study. Theoverall finding, that end-user equipment is the major reasonfor the overall CF of the ICT network, is valid, but more casestudies of generic products are needed for improved data andresults in the future. This is especially true owing to the rapiddevelopment in ICT-related home and office equipment, wherePCs are getting smaller and more energy efficient, whereas, onthe other hand, mobile phones are getting larger and moreadvanced.
There are some uncertainties in the study related to theallocation of energy. Most of the allocations made were in re-lation to different subscription services and thus there is someuncertainty in the resulting figures per subscription.
This study focused on CF and operational electricity, whichare both important aspects for sustainable development. How-ever, there are also other environmental aspects that should beconsidered, such as toxicological impacts, land use and biodi-versity, and so on. Further, matters such as health issues relatedto raw material extraction and disposal of e-waste are importantin relation to the ICT sector. Future studies covering other im-portant aspects would provide more comprehensive life cycleinformation related to ICT networks.
Conclusions
This detailed and LCA-based study resulted in an estimatedtotal CF of 1.5 Mt for ICT in Sweden, of which 0.65 Mt isattributable to TeliaSonera and its customers. The CF of ICTis approximately 160 kg per person in Sweden, or approxi-mately 1.2% of Sweden’s total CF (including transportationand manufacturing abroad of imported goods). The majorityof the footprint originates from user equipment, mainly PCs,followed by third-party enterprise networks and data centers,and then access networks. User equipment itself is responsiblefor more than 50% of the CF, mainly as a result of emissionsrelated to manufacturing abroad.
The yearly CF for an average subscription in Sweden rangesfrom 15 kg CO2-eq for classic telephony, VoIP telephony, and2G mobile communications up to 216 kg CO2-eq for a fixed(xDSL) broadband subscription. In a triple-play average case,the CF is 380 kg CO2-eq.
Applying a global electricity mix, the CF is considerably in-creased and operation contributes a larger share of the overallfootprint, but the major impact is still the result of end-userequipment, followed by third-party enterprise networks anddata centers and access networks. The yearly CF for an av-erage subscription with global electricity mix ranges from 26 kgCO2-eq for 2G mobile communications up to 560 kg CO2-eq fora fixed (xDSL) broadband subscription or a workplace (LAN)PC. In a triple-play average case, the CF is 1,000 kg CO2-eq.
Energy use and embodied CF per data transmitted can beused as intensity metrics and in LCA studies on transmissionand IP core networks. However, when focusing on access net-works and end-user equipment, use time is more relevant be-cause the energy consumption and embodied CF is not to thesame extent related to transmitted data volume.
Acknowledgments
Financial support from Vinnova and partners of CESCCentre for Sustainable Communications at KTH Royal Insti-tute of Technology in Stockholm, Sweden, is gratefully ap-preciated. The authors also acknowledge several people whohave contributed to making this article possible: former MScthesis students Frida Bergelin and Craig Donovan at Erics-son and Sofia Tingstorp and Mikael Lindroth at TeliaSon-era, as well as several KTH researchers and, especially, FredrikGuldbrandsson and Pernilla Bergmark at Ericsson and Flem-ming Heden, a former employee at TeliaSonera.
References
Baliga, J., R. Ayre, K. Hinton, W. V. Sorin, and R. S. Tucker. 2009.Energy consumption in optical IP networks. Journal of LightwaveTechnology 27(13): 2391–2403.
Cisco. 2011. Cisco Visual Networking Index: Forecast and method-ology, 2010–2015. Cisco white paper. www.cisco.com/en/US/solutions/collateral/ns341/ns525/ns537/ns705/ns827/white_paper_c11481360_ns827_Networking_Solutions_White_Paper.html. Accessed November 2011.
Coroama, V., L. Hilty, E. Heiri, and F. Horn. 2013. The direct energydemand of internet data flows. Journal of Industrial Ecology 17(5):680–688.
Donovan, C. 2009. Twenty thousand leagues under the sea: A life cycleassessment of fibre optic submarine cable systems. M.Sc. thesis,degree project SoM Ex 2009:40, Department of Urban Planningand Environment, Royal Institute of Technology, Stockholm,Sweden.
Faist Emmenegger, M., R. Frischknecht, M. Stutz, M. Guggisberg, R.Witschi, and T. Otto. 2006. Life cycle assessment of the mo-bile communication system UMTS towards eco-efficient systems.The International Journal of Life Cycle Assessment 11(4): 265–276.
GeSi. 2008. SMART 2020: Enabling the low carbon economy in theinformation age. The Climate Group on behalf of the GlobaleSustainability Initiative (GeSI). http://gesi.org/files/Reports/Smart%202020%20report%20in%20English.pdf. Accessed 15April 2014.
GeSi. 2012. SMARTer2020: The role of ICT in driving a sustainable fu-ture. Global eSustainability Initiative and The Boston ConsultingGroup, Inc. http://gesi.org/portfolio/report/72. Accessed 15 April2014.
Google. 2011. Google carbon footprint 2010. www.google.com/green/the-big-picture.html. Accessed November 2011.
Google. 2012. Google apps: Energy efficiency in the cloud. Googlewhite paper. http://static.googleusercontent.com/external_content/untrusted_dlcp/www.google.com/en//green/pdf/google-apps.pdf. Accessed November 2012.
844 Journal of Industrial Ecology
R E S E A R C H A N D A N A LYS I S
GSMA. 2012. Mobile’s Green Manifesto 2012. GSM Association.http://www.gsma.com/publicpolicy/wp-content/uploads/2012/06/Green-Manifesto-2012.pdf. Accessed December 2013.
Hermann, C. 2008. Environmental footprint of ICT equipment inmanufacture, use and end of life. Paper presented at the 34thEuropean Conference and Exhibition on Optical Communica-tion (ECOC), 23 September, Brussels, Belgium.
ITU (International Telecommunication Union). 2011. WorldTelecommunication/ICT Indicators Database 2010, 15th edition.www.itu.int/ITU-D/ict/publications/world/world.html. AccessedNovember 2011.
Koomey, J. G. 2011. Growth in data center electricity use 2005to 2010. Oakland, CA, USA: Analytics Press. 1 August.www.analyticspress.com/datacenters.html. Accessed May 2012.
Lange, C., D. Kosiankowski, R. Weidmann, and A. Gladisch. 2011.Energy consumption of telecommunication network and relatedimprovement options. IEEE Journal of Selected Topics in QuantumElectronics 17(2): 285–295.
Lunden, D. and J. Malmodin. 2013. Changes in environmentalimpacts over time in the fast developing ICT industry. Presentedat the 6th International Conference on Life Cycle ManagementProgram (LCM 2013), 26–29 August, Gothenburg, Sweden.http://conferences.chalmers.se/index.php/LCM/LCM2013/paper/view/580/180. Accessed December 2013.
Malmodin, J., A. Moberg, D. Lunden, G. Finnveden, and N.Lovehagen. 2010a. Greenhouse gas emissions and operationalelectricity use in the ICT and entertainment & media sectors.Journal of Industrial Ecology 14(5): 770–790.
Malmodin, J., D. Lunde n, and N. Lovehagen. 2010b. Methodologyfor life cycle based assessments of the CO2 reduction potentialof ICT services. IEEE International Symposium on SustainableSystems and Technology (ISSST), 16–19 May, Washington, DC.http://ieeexplore.ieee.org/xpls/abs_all.jsp?arnumber=5507738.Accessed December 2012.
Malmodin, J. and D. Lunde n. 2011. Life-cycle assessment of ICT net-works and primary subscription services in Sweden. Abstract andpresentation at NorLCA, 15–16 September, Helsinki, Finland.www.dtu.dk/upload/norlca/malmodin%20&%20lunden.pdf.
Malmodin, J., D. Lunde n, M. Nilsson, and G. Andersson. 2012. LCAof data transmission and IP core networks. Paper presented atElectronics Goes Green 2012+ (EGG), 9–12 September, Berlin,Germany.
Malmodin, J., P. Bergmark, and D. Lunde n. 2013. The future carbonfootprint of the ICT and E&M sectors. Paper presented at ICTfor Sustainability (ICT4S), 9–12 February, Zurich, Switzerland.
Peters, G. and C. Solli. 2010. Global carbon footprints: Meth-ods and import/export corrected results from the Nordic coun-
tries in global carbon footprint studies. TemaNord 2010:592.ISBN 978-92-893-2159-4. Copenhagen: Nordic Council ofMinisters.
PTS (The Swedish Post and Telecom Agency). 2008. TheSwedish telecommunications market 2007, PTS-ER-2008:15.www.statistics.pts.se/start_en. Accessed October 2011.
PTS (The Swedish Post and Telecom Agency). 2009. TheSwedish Telecommunications Market 2008, PTS-ER-2009:21.www.statistics.pts.se/start_en. Accessed October 2011.
PTS (The Swedish Post and Telecom Agency). 2010. TheSwedish Telecommunications Market 2009, PTS-ER-2010:13.www.statistics.pts.se/start_en. Accessed October 2011.
PTS (The Swedish Post and Telecom Agency). 2011. TheSwedish Telecommunications Market 2010, PTS-ER-2011:15.www.statistics.pts.se/start_en. Accessed October 2011.
TeliaSonera. 2008. Annual reporting. Stockholm: TeliaSonera.www.teliasonera.com/en/investors/reports-and-presentations/annual-reports/. Accessed 1 December 2013.
The Green Grid. 2011. Data center efficiency metrics—PUETM,partial PUE, ERE, DCcE. Technical forum presentation. www.thegreengrid.org/Global/Content/TechnicalForumPresentation/2011TechForumDataCenterEfficiencyMetrics. Accessed 1December 2013.
Weber, C. 2010. Uncertainty and variability in carbon footprintingfor electronics: Case study of an IBM rack-mount server. Exec-utive summary. Carnegie Mellon University technical report2010.
Weber, C. L., J. G. Koomey, and H. S. Matthews. 2010. The energyand climate change impacts of different music delivery methods.The Journal of Industrial Ecology 14(5): 754–769.
Zimmermann, J. P. 2009. End-use metering campaign in 400 households inSweden. Assessment of the potential of electricity savings. Enertech.Eskilstuna, Sweden: Swedish Energy Agency.
About the Authors
Jens Malmodin is a senior researcher at Ericsson Research,Stockholm, Sweden. Dag Lunden is an environmental man-ager at TeliaSonera, Stockholm, Sweden. Asa Moberg is anassistant professor at the Division of Environmental StrategiesResearch at KTH Royal Institute of Technology in Stockholm,Sweden. Greger Andersson is a senior strategic network archi-tect and Mikael Nilsson is a product security specialist, bothat TeliaSonera, Stockholm, Sweden. All authors are involvedin the Centre for Sustainable Communications at KTH RoyalInstitute of Technology in Stockholm, Sweden.
Supporting Information
Additional Supporting Information may be found in the online version of this article at the publisher’s web site:
Supporting Information S1: This supporting information provides additional information regarding inventory data basedon previous LCA studies (appendix S1), user equipment data (appendix S2), ICT network description (appendix S3), ICTnetwork data for TeliaSonera and Sweden (appendix S4), data traffic model for Sweden (appendix S5), detailed results fordifferent primary subscription services (appendix S6), abbreviations and terminology used (appendix S7), and additionalreferences.
Malmodin et al., LCA of ICT Networks from the Operator, National, and Subscriber Perspective 845
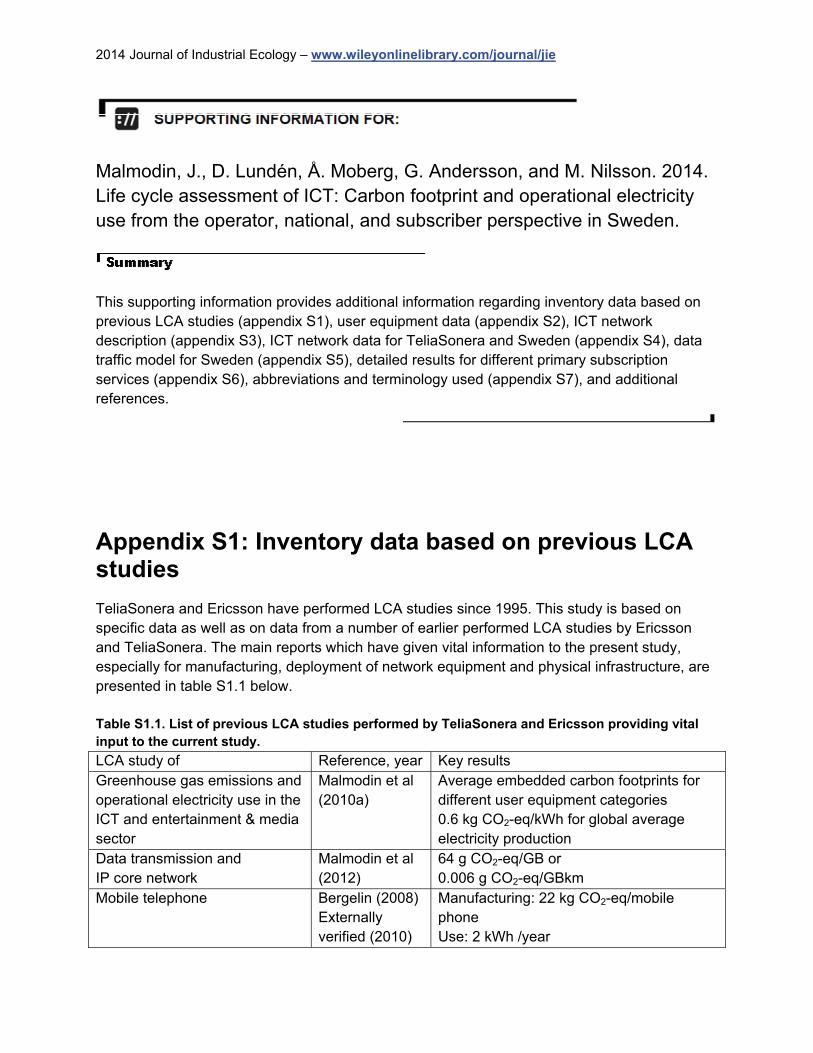
2014 Journal of Industrial Ecology – www.wileyonlinelibrary.com/journal/jie
Malmodin, J., D. Lundén, Å. Moberg, G. Andersson, and M. Nilsson. 2014. Life cycle assessment of ICT: Carbon footprint and operational electricity use from the operator, national, and subscriber perspective in Sweden.
This supporting information provides additional information regarding inventory data based on previous LCA studies (appendix S1), user equipment data (appendix S2), ICT network description (appendix S3), ICT network data for TeliaSonera and Sweden (appendix S4), data traffic model for Sweden (appendix S5), detailed results for different primary subscription services (appendix S6), abbreviations and terminology used (appendix S7), and additional references.
Appendix S1: Inventory data based on previous LCA studies
TeliaSonera and Ericsson have performed LCA studies since 1995. This study is based on specific data as well as on data from a number of earlier performed LCA studies by Ericsson and TeliaSonera. The main reports which have given vital information to the present study, especially for manufacturing, deployment of network equipment and physical infrastructure, are presented in table S1.1 below. Table S1.1. List of previous LCA studies performed by TeliaSonera and Ericsson providing vital input to the current study.
LCA study of Reference, year Key results Greenhouse gas emissions and operational electricity use in the ICT and entertainment & media sector
Malmodin et al (2010a)
Average embedded carbon footprints for different user equipment categories 0.6 kg CO2-eq/kWh for global average electricity production
Data transmission and IP core network
Malmodin et al (2012)
64 g CO2-eq/GB or 0.006 g CO2-eq/GBkm
Mobile telephone Bergelin (2008) Externally verified (2010)
Manufacturing: 22 kg CO2-eq/mobile phone Use: 2 kWh /year
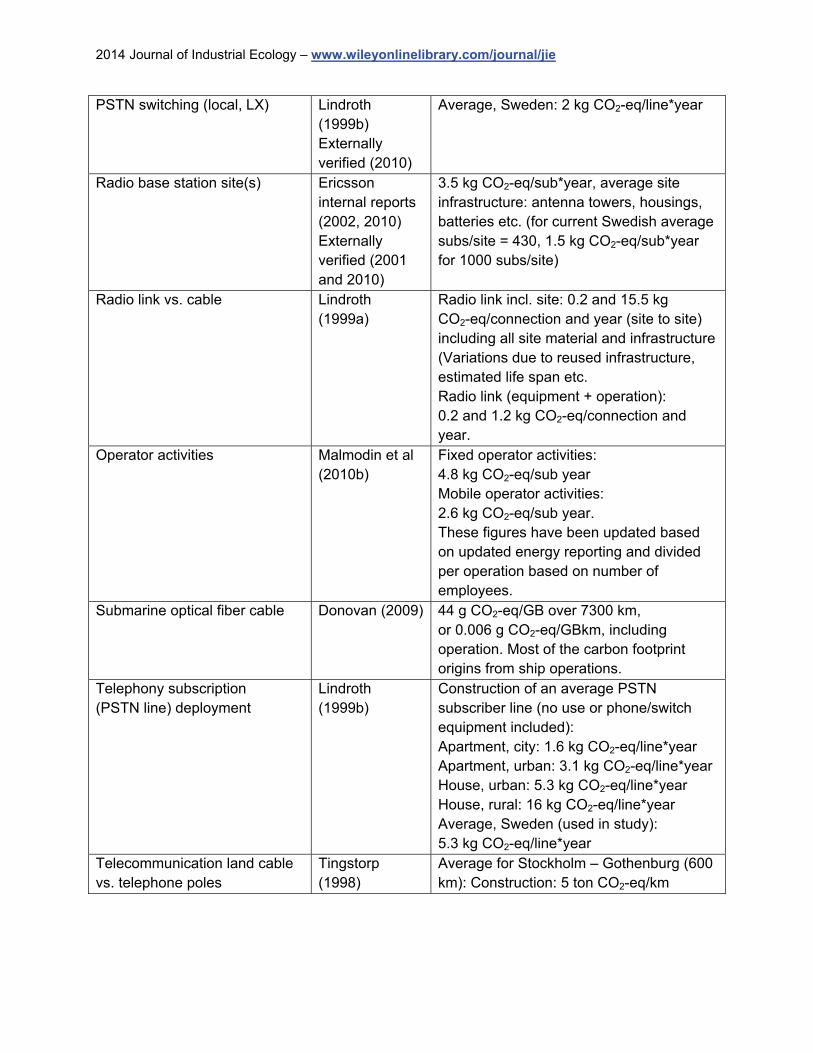
2014 Journal of Industrial Ecology – www.wileyonlinelibrary.com/journal/jie
PSTN switching (local, LX) Lindroth (1999b) Externally verified (2010)
Average, Sweden: 2 kg CO2-eq/line*year
Radio base station site(s) Ericsson internal reports (2002, 2010) Externally verified (2001 and 2010)
3.5 kg CO2-eq/sub*year, average site infrastructure: antenna towers, housings, batteries etc. (for current Swedish average subs/site = 430, 1.5 kg CO2-eq/sub*year for 1000 subs/site)
Radio link vs. cable Lindroth (1999a)
Radio link incl. site: 0.2 and 15.5 kg CO2-eq/connection and year (site to site) including all site material and infrastructure (Variations due to reused infrastructure, estimated life span etc. Radio link (equipment + operation): 0.2 and 1.2 kg CO2-eq/connection and year.
Operator activities Malmodin et al (2010b)
Fixed operator activities: 4.8 kg CO2-eq/sub year Mobile operator activities: 2.6 kg CO2-eq/sub year. These figures have been updated based on updated energy reporting and divided per operation based on number of employees.
Submarine optical fiber cable Donovan (2009) 44 g CO2-eq/GB over 7300 km, or 0.006 g CO2-eq/GBkm, including operation. Most of the carbon footprint origins from ship operations.
Telephony subscription (PSTN line) deployment
Lindroth (1999b)
Construction of an average PSTN subscriber line (no use or phone/switch equipment included): Apartment, city: 1.6 kg CO2-eq/line*year Apartment, urban: 3.1 kg CO2-eq/line*year House, urban: 5.3 kg CO2-eq/line*year House, rural: 16 kg CO2-eq/line*year Average, Sweden (used in study): 5.3 kg CO2-eq/line*year
Telecommunication land cable vs. telephone poles
Tingstorp (1998)
Average for Stockholm – Gothenburg (600 km): Construction: 5 ton CO2-eq/km
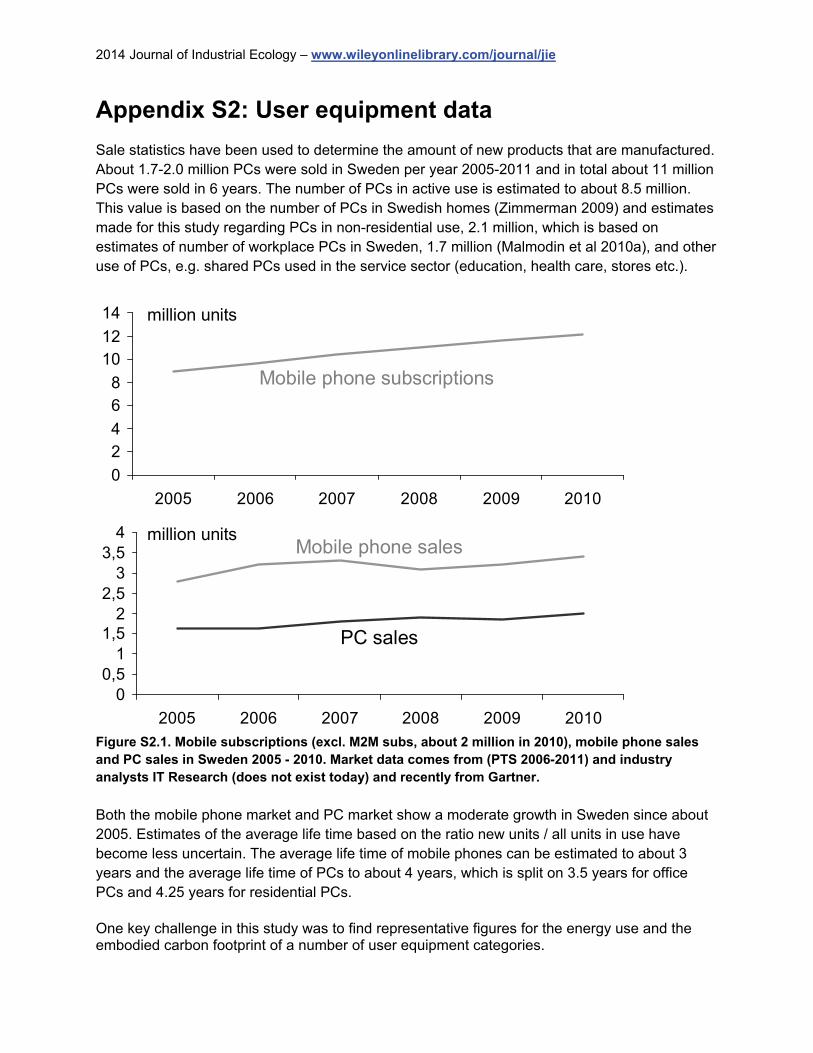
2014 Journal of Industrial Ecology – www.wileyonlinelibrary.com/journal/jie
Appendix S2: User equipment data Sale statistics have been used to determine the amount of new products that are manufactured. About 1.7-2.0 million PCs were sold in Sweden per year 2005-2011 and in total about 11 million PCs were sold in 6 years. The number of PCs in active use is estimated to about 8.5 million. This value is based on the number of PCs in Swedish homes (Zimmerman 2009) and estimates made for this study regarding PCs in non-residential use, 2.1 million, which is based on estimates of number of workplace PCs in Sweden, 1.7 million (Malmodin et al 2010a), and other use of PCs, e.g. shared PCs used in the service sector (education, health care, stores etc.).
Figure S2.1. Mobile subscriptions (excl. M2M subs, about 2 million in 2010), mobile phone sales and PC sales in Sweden 2005 - 2010. Market data comes from (PTS 2006-2011) and industry analysts IT Research (does not exist today) and recently from Gartner.
Both the mobile phone market and PC market show a moderate growth in Sweden since about 2005. Estimates of the average life time based on the ratio new units / all units in use have become less uncertain. The average life time of mobile phones can be estimated to about 3 years and the average life time of PCs to about 4 years, which is split on 3.5 years for office PCs and 4.25 years for residential PCs. One key challenge in this study was to find representative figures for the energy use and the embodied carbon footprint of a number of user equipment categories.
0
24
68
1012
14
2005 2006 2007 2008 2009 2010
Mobile phone subscriptions
million units
00,5
11,5
22,5
33,5
4
2005 2006 2007 2008 2009 2010
PC sales
Mobile phone salesmillion units
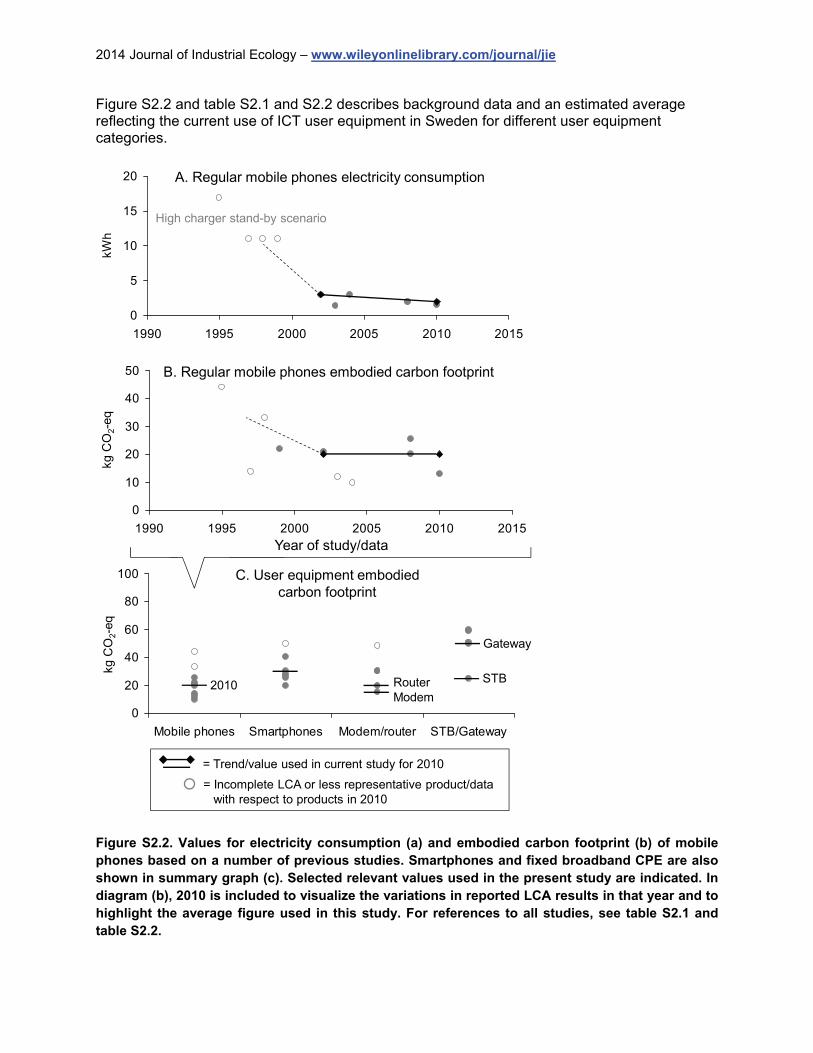
2014 Journal of Industrial Ecology – www.wileyonlinelibrary.com/journal/jie
Figure S2.2 and table S2.1 and S2.2 describes background data and an estimated average reflecting the current use of ICT user equipment in Sweden for different user equipment categories.
0
5
10
15
20
1990 1995 2000 2005 2010 2015
kWh
A. Regular mobile phones electricity consumption
High charger stand-by scenario
0
20
40
60
80
100
Mobile phones Smartphones Modem/router STB/Gateway
0
10
20
30
40
50
1990 1995 2000 2005 2010 2015
B. Regular mobile phones embodied carbon footprint
C. User equipment embodiedcarbon footprint
kg C
O2-e
qkg
CO
2-e
q
2010 RouterModem
STB
Gateway
= Trend/value used in current study for 2010
= Incomplete LCA or less representative product/datawith respect to products in 2010
Year of study/data
Figure S2.2. Values for electricity consumption (a) and embodied carbon footprint (b) of mobile phones based on a number of previous studies. Smartphones and fixed broadband CPE are also shown in summary graph (c). Selected relevant values used in the present study are indicated. In diagram (b), 2010 is included to visualize the variations in reported LCA results in that year and to highlight the average figure used in this study. For references to all studies, see table S2.1 and table S2.2.
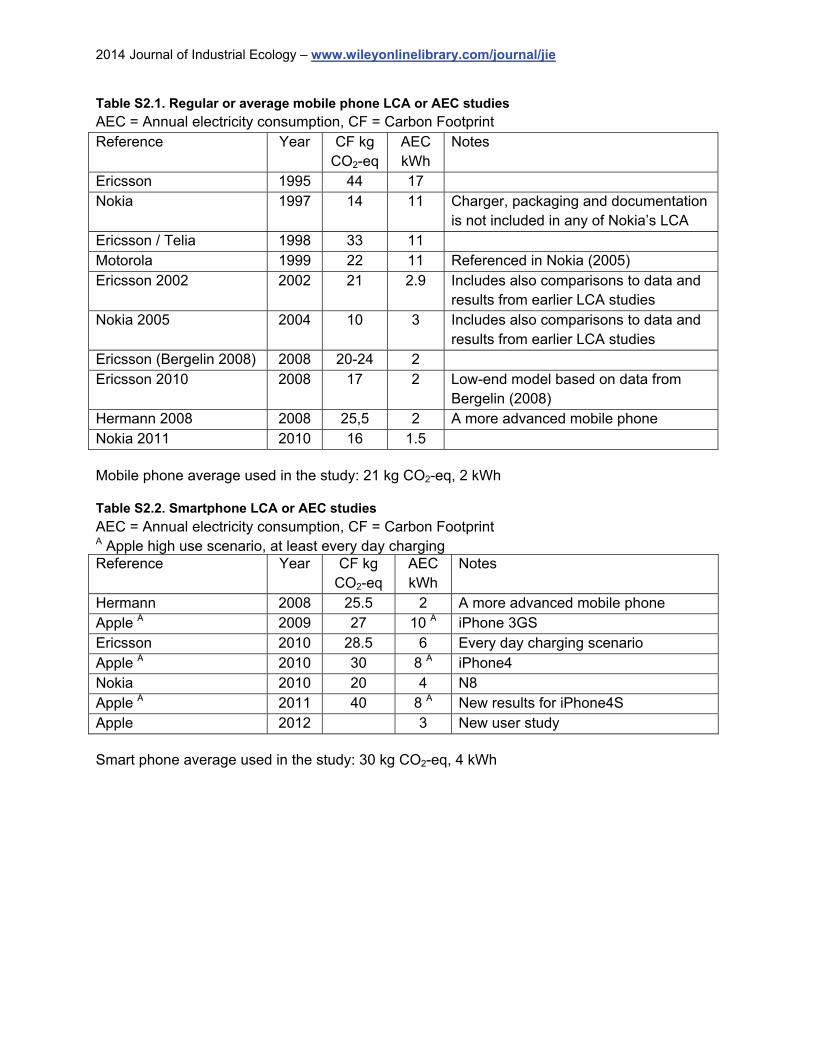
2014 Journal of Industrial Ecology – www.wileyonlinelibrary.com/journal/jie
Table S2.1. Regular or average mobile phone LCA or AEC studies
AEC = Annual electricity consumption, CF = Carbon Footprint Reference Year CF kg
CO2-eq AEC kWh
Notes
Ericsson 1995 44 17 Nokia 1997 14 11 Charger, packaging and documentation
is not included in any of Nokia’s LCA Ericsson / Telia 1998 33 11 Motorola 1999 22 11 Referenced in Nokia (2005) Ericsson 2002 2002 21 2.9 Includes also comparisons to data and
results from earlier LCA studies Nokia 2005 2004 10 3 Includes also comparisons to data and
results from earlier LCA studies Ericsson (Bergelin 2008) 2008 20-24 2 Ericsson 2010 2008 17 2 Low-end model based on data from
Bergelin (2008) Hermann 2008 2008 25,5 2 A more advanced mobile phone Nokia 2011 2010 16 1.5 Mobile phone average used in the study: 21 kg CO2-eq, 2 kWh Table S2.2. Smartphone LCA or AEC studies
AEC = Annual electricity consumption, CF = Carbon Footprint A Apple high use scenario, at least every day charging Reference Year CF kg
CO2-eq AEC kWh
Notes
Hermann 2008 25.5 2 A more advanced mobile phone Apple A 2009 27 10 A iPhone 3GS Ericsson 2010 28.5 6 Every day charging scenario Apple A 2010 30 8 A iPhone4 Nokia 2010 20 4 N8 Apple A 2011 40 8 A New results for iPhone4S Apple 2012 3 New user study Smart phone average used in the study: 30 kg CO2-eq, 4 kWh
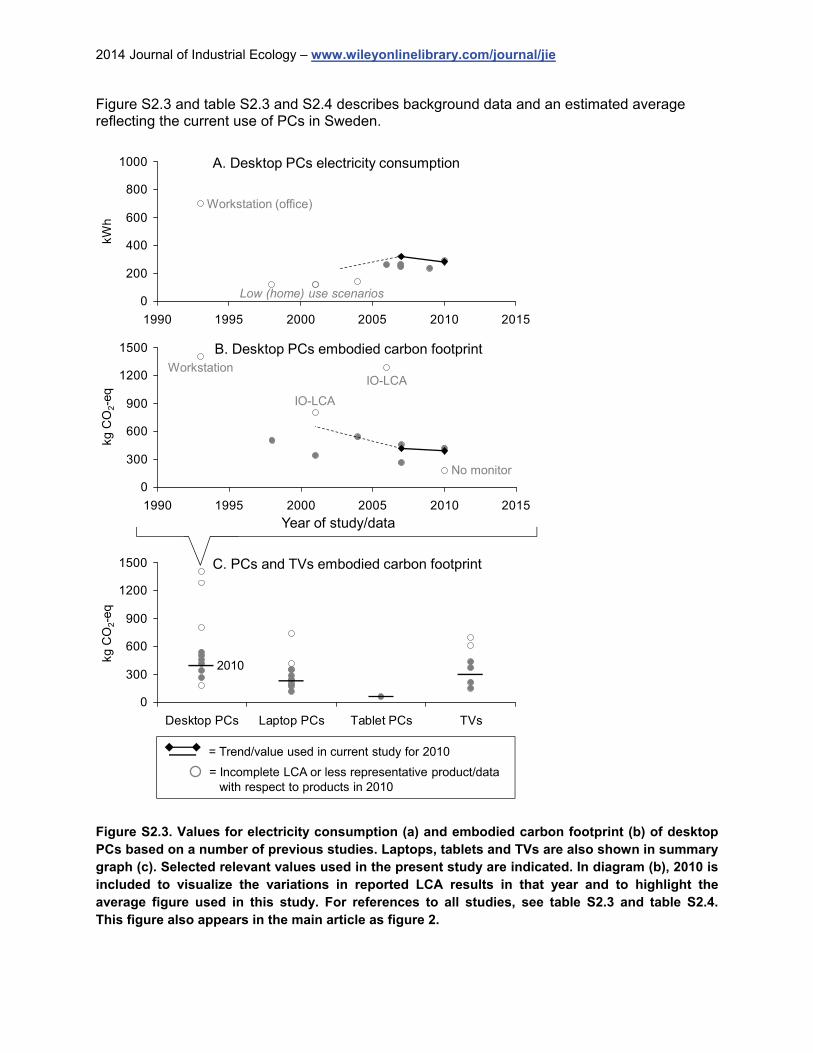
2014 Journal of Industrial Ecology – www.wileyonlinelibrary.com/journal/jie
Figure S2.3 and table S2.3 and S2.4 describes background data and an estimated average reflecting the current use of PCs in Sweden.
0
200
400
600
800
1000
1990 1995 2000 2005 2010 2015
kWh
A. Desktop PCs electricity consumption
Workstation (office)
Low (home) use scenarios
0
300
600
900
1200
1500
Desktop PCs Laptop PCs Tablet PCs TVs
0
300
600
900
1200
1500
1990 1995 2000 2005 2010 2015
B. Desktop PCs embodied carbon footprint
C. PCs and TVs embodied carbon footprint
kg C
O2-e
qkg
CO
2-e
q
2010
WorkstationIO-LCA
IO-LCA
No monitor
= Trend/value used in current study for 2010
= Incomplete LCA or less representative product/datawith respect to products in 2010
Year of study/data
Figure S2.3. Values for electricity consumption (a) and embodied carbon footprint (b) of desktop PCs based on a number of previous studies. Laptops, tablets and TVs are also shown in summary graph (c). Selected relevant values used in the present study are indicated. In diagram (b), 2010 is included to visualize the variations in reported LCA results in that year and to highlight the average figure used in this study. For references to all studies, see table S2.3 and table S2.4. This figure also appears in the main article as figure 2.
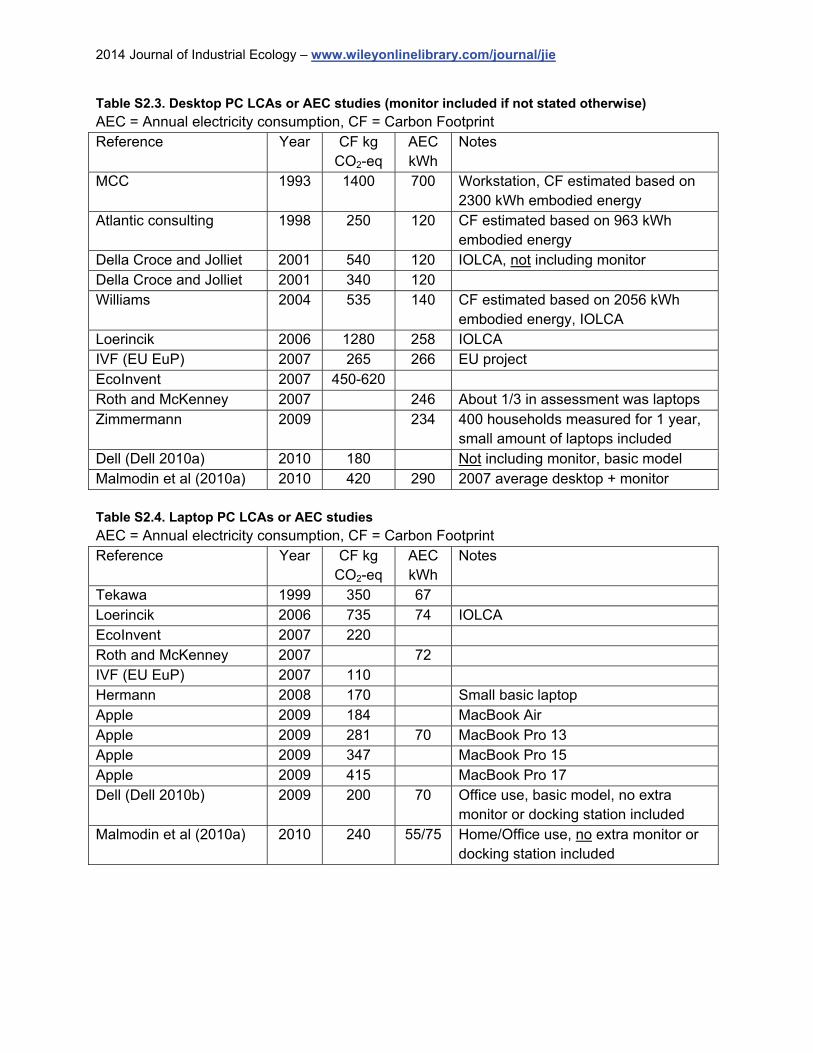
2014 Journal of Industrial Ecology – www.wileyonlinelibrary.com/journal/jie
Table S2.3. Desktop PC LCAs or AEC studies (monitor included if not stated otherwise)
AEC = Annual electricity consumption, CF = Carbon Footprint Reference Year CF kg
CO2-eq AEC kWh
Notes
MCC 1993 1400 700 Workstation, CF estimated based on 2300 kWh embodied energy
Atlantic consulting 1998 250 120 CF estimated based on 963 kWh embodied energy
Della Croce and Jolliet 2001 540 120 IOLCA, not including monitor Della Croce and Jolliet 2001 340 120 Williams 2004 535 140 CF estimated based on 2056 kWh
embodied energy, IOLCA Loerincik 2006 1280 258 IOLCA IVF (EU EuP) 2007 265 266 EU project EcoInvent 2007 450-620 Roth and McKenney 2007 246 About 1/3 in assessment was laptops Zimmermann 2009 234 400 households measured for 1 year,
small amount of laptops included Dell (Dell 2010a) 2010 180 Not including monitor, basic model Malmodin et al (2010a) 2010 420 290 2007 average desktop + monitor Table S2.4. Laptop PC LCAs or AEC studies
AEC = Annual electricity consumption, CF = Carbon Footprint Reference Year CF kg
CO2-eq AEC kWh
Notes
Tekawa 1999 350 67 Loerincik 2006 735 74 IOLCA EcoInvent 2007 220 Roth and McKenney 2007 72 IVF (EU EuP) 2007 110 Hermann 2008 170 Small basic laptop Apple 2009 184 MacBook Air Apple 2009 281 70 MacBook Pro 13 Apple 2009 347 MacBook Pro 15 Apple 2009 415 MacBook Pro 17 Dell (Dell 2010b) 2009 200 70 Office use, basic model, no extra
monitor or docking station included Malmodin et al (2010a) 2010 240 55/75 Home/Office use, no extra monitor or
docking station included
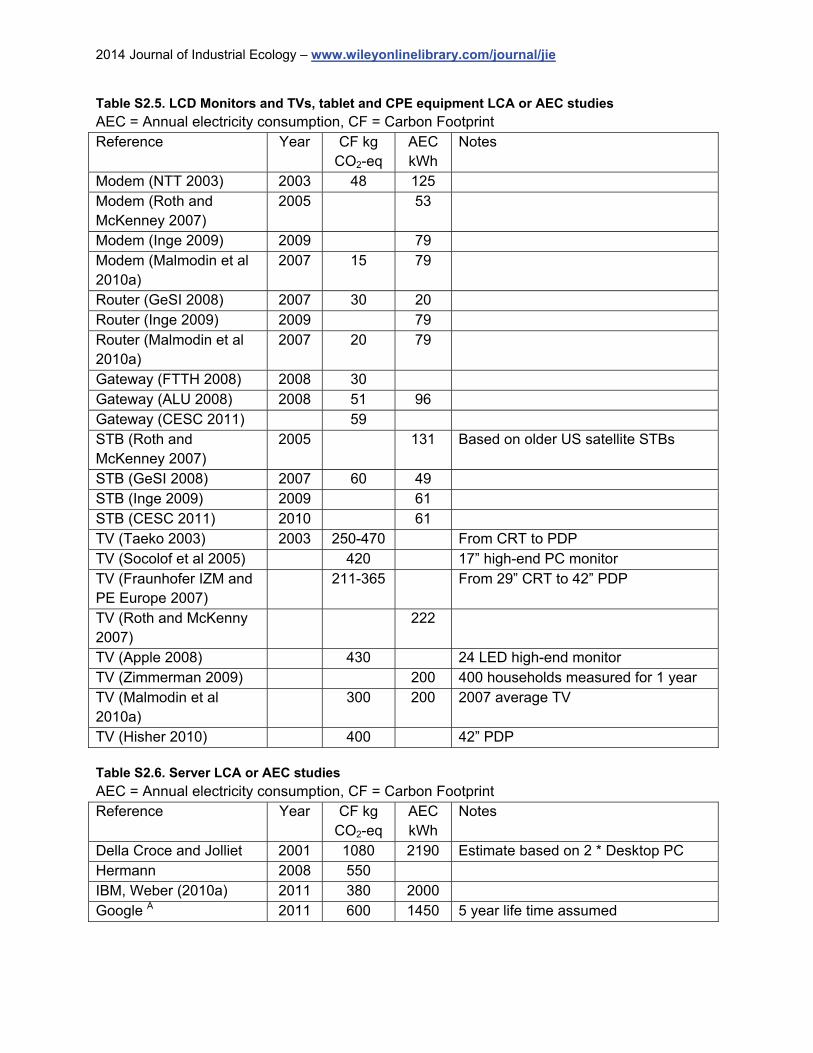
2014 Journal of Industrial Ecology – www.wileyonlinelibrary.com/journal/jie
Table S2.5. LCD Monitors and TVs, tablet and CPE equipment LCA or AEC studies
AEC = Annual electricity consumption, CF = Carbon Footprint Reference Year CF kg
CO2-eq AEC kWh
Notes
Modem (NTT 2003) 2003 48 125 Modem (Roth and McKenney 2007)
2005 53
Modem (Inge 2009) 2009 79 Modem (Malmodin et al 2010a)
2007 15 79
Router (GeSI 2008) 2007 30 20 Router (Inge 2009) 2009 79 Router (Malmodin et al 2010a)
2007 20 79
Gateway (FTTH 2008) 2008 30 Gateway (ALU 2008) 2008 51 96 Gateway (CESC 2011) 59 STB (Roth and McKenney 2007)
2005 131 Based on older US satellite STBs
STB (GeSI 2008) 2007 60 49 STB (Inge 2009) 2009 61 STB (CESC 2011) 2010 61 TV (Taeko 2003) 2003 250-470 From CRT to PDP TV (Socolof et al 2005) 420 17” high-end PC monitor TV (Fraunhofer IZM and PE Europe 2007)
211-365 From 29” CRT to 42” PDP
TV (Roth and McKenny 2007)
222
TV (Apple 2008) 430 24 LED high-end monitor TV (Zimmerman 2009) 200 400 households measured for 1 year TV (Malmodin et al 2010a)
300 200 2007 average TV
TV (Hisher 2010) 400 42” PDP Table S2.6. Server LCA or AEC studies
AEC = Annual electricity consumption, CF = Carbon Footprint Reference Year CF kg
CO2-eq AEC kWh
Notes
Della Croce and Jolliet 2001 1080 2190 Estimate based on 2 * Desktop PC Hermann 2008 550 IBM, Weber (2010a) 2011 380 2000 Google A 2011 600 1450 5 year life time assumed
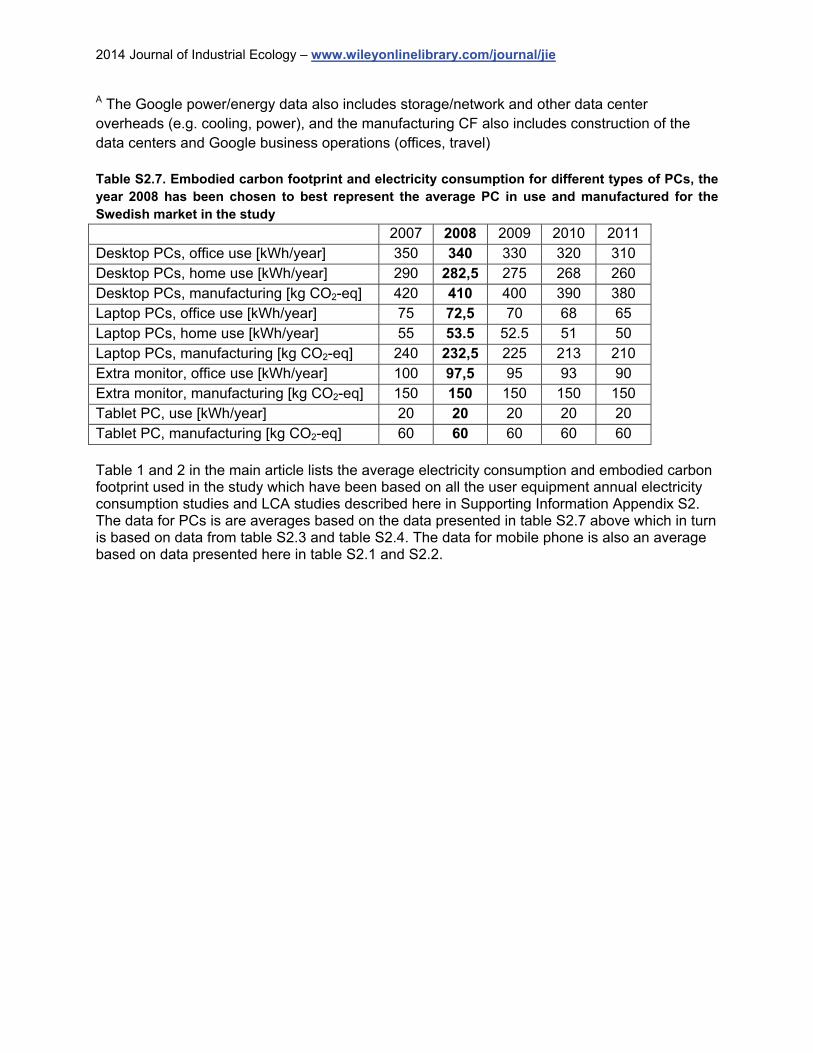
2014 Journal of Industrial Ecology – www.wileyonlinelibrary.com/journal/jie
A The Google power/energy data also includes storage/network and other data center overheads (e.g. cooling, power), and the manufacturing CF also includes construction of the data centers and Google business operations (offices, travel) Table S2.7. Embodied carbon footprint and electricity consumption for different types of PCs, the year 2008 has been chosen to best represent the average PC in use and manufactured for the Swedish market in the study
2007 2008 2009 2010 2011 Desktop PCs, office use [kWh/year] 350 340 330 320 310 Desktop PCs, home use [kWh/year] 290 282,5 275 268 260 Desktop PCs, manufacturing [kg CO2-eq] 420 410 400 390 380 Laptop PCs, office use [kWh/year] 75 72,5 70 68 65 Laptop PCs, home use [kWh/year] 55 53.5 52.5 51 50 Laptop PCs, manufacturing [kg CO2-eq] 240 232,5 225 213 210 Extra monitor, office use [kWh/year] 100 97,5 95 93 90 Extra monitor, manufacturing [kg CO2-eq] 150 150 150 150 150 Tablet PC, use [kWh/year] 20 20 20 20 20 Tablet PC, manufacturing [kg CO2-eq] 60 60 60 60 60 Table 1 and 2 in the main article lists the average electricity consumption and embodied carbon footprint used in the study which have been based on all the user equipment annual electricity consumption studies and LCA studies described here in Supporting Information Appendix S2. The data for PCs is are averages based on the data presented in table S2.7 above which in turn is based on data from table S2.3 and table S2.4. The data for mobile phone is also an average based on data presented here in table S2.1 and S2.2.
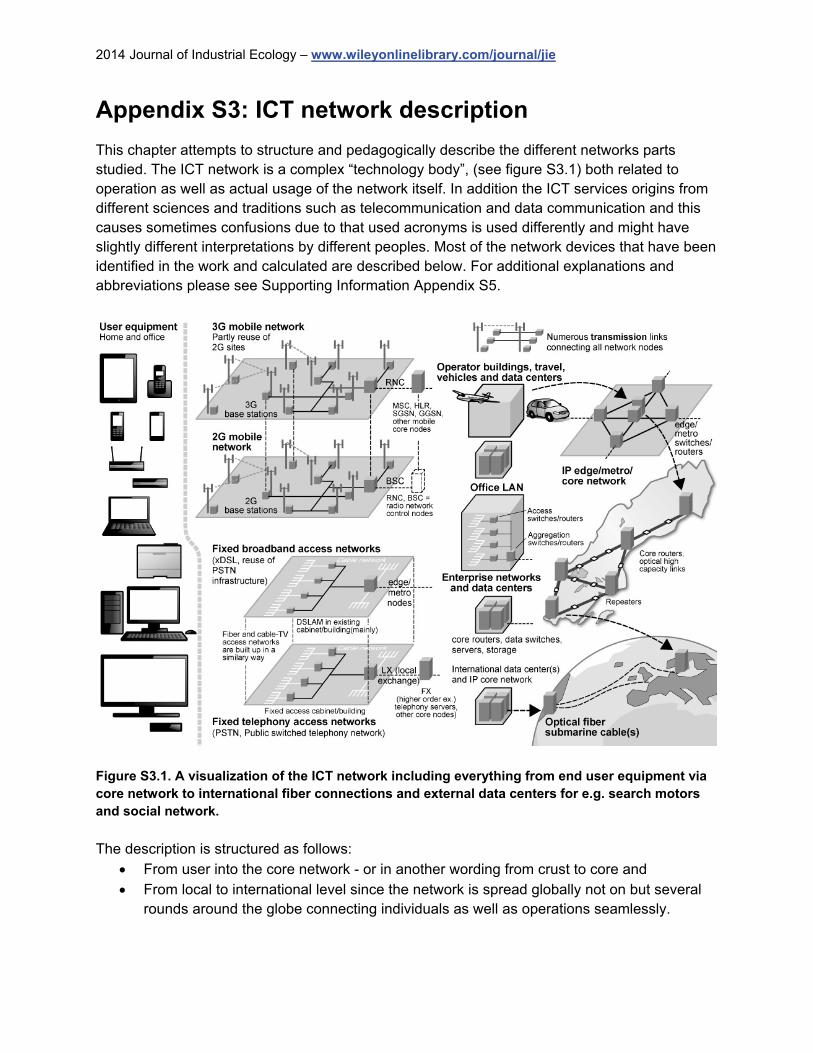
2014 Journal of Industrial Ecology – www.wileyonlinelibrary.com/journal/jie
Appendix S3: ICT network description This chapter attempts to structure and pedagogically describe the different networks parts studied. The ICT network is a complex “technology body”, (see figure S3.1) both related to operation as well as actual usage of the network itself. In addition the ICT services origins from different sciences and traditions such as telecommunication and data communication and this causes sometimes confusions due to that used acronyms is used differently and might have slightly different interpretations by different peoples. Most of the network devices that have been identified in the work and calculated are described below. For additional explanations and abbreviations please see Supporting Information Appendix S5.
Figure S3.1. A visualization of the ICT network including everything from end user equipment via core network to international fiber connections and external data centers for e.g. search motors and social network.
The description is structured as follows:
From user into the core network - or in another wording from crust to core and From local to international level since the network is spread globally not on but several
rounds around the globe connecting individuals as well as operations seamlessly.
2014 Journal of Industrial Ecology – www.wileyonlinelibrary.com/journal/jie
S3.1: User equipment The terminal or end user equipment has many names and abbreviations e.g. the concept “Customer premises equipment” (CPE) is used in some parts of the world. In short the function can be described as the way an end user is accessing the shared resources available on the internet. The access forms can be either fixed or wireless. It can also be automatic without any previous human interaction or require user activities in some form. The following widely adopted terminal types have been included in the study: Mobile phones, smartphones, fixed (cordless) phones, PCs/terminals, office equipment,
TVs used together with IPTV subscriptions. Additional equipment like personal data storage and audio peripherals are excluded, as they are defined as entertainment and media products (Malmodin et al. 2010a)
Home network equipment or customer premises equipment (CPE), e.g. modems, routers and gateways, and set-top-boxes (STBs) used together with IPTV
S3.2: Access network + control and core nodes Access network is the part of the telecom operator’s network that is interfacing and is located closest to the terminal / end user equipment but “on the other side of the wire”. The wire can be either physical such as optical fiber or copper or wireless such as mobile communication as presented below:
2G and 3G mobile radio access, public switched telephone network (PSTN), digital subscriber line (xDSL), cable TV (CATV), fiber to the home/curb (FTTx), etc.
The additional required control and core nodes (for the actual services) has been included in the Access network part despite the fact that these systems (normally very few with limited impact) often is located in Data centers. However since the main function is to control and steer the access network the impact has been allocated to the Access network for the following services:
PSTN voice 2G and 3G mobile voice and data and voice over IP (VoIP)
S3.3: Transmission and IP core network The transmission and IP core network is the “backbone” of al communication. It connects data streams between different access nodes as well as data centers and “internet”. It consists of active parts as well as optical fiber and high capacity radio link point to point communication. The Transmission and IP core network is shared by all users whether they use Mobile or Fixed communication. However since there’s a difference in data capacity usage a larger share of the total capacity is allocated to Fixed communications. The following services have in this study been allocated to the Transmission and IP core network:
A large number of different transmission link equipment (copper, optical fibers, radio links etc.), IP switches and (core) routers including supporting infrastructure for cooling, power, etc.

2014 Journal of Industrial Ecology – www.wileyonlinelibrary.com/journal/jie
S3.4: Operator Data center The operator data center sites including data storage are used by telecom operators for administrative purposes e.g. to keep track of all technical sites including a huge number of ICT devices and data servers and where the electricity consumption, cooling demand and where need for backup power supply is significant. It’s worth noticing that devices belonging to Transmission and IP core network are often in many studies partly located in “data centers”. However in the study a distinction is made between the traditional Transmission and IP core network on one hand and data server operations on the other hand to more clearly indicate how the environmental load is distributed between different functional parts of the network. The number of actual servers in a data center varies quite much but the main criteria for labeling a telecom site as “data center” is important. Of all 11 000 sites in TeliaSonera Swedish ICT network only 7 are labeled data center. The following devices can normally be found in a data center:
Servers, storage, routers and switches in data centers including all supporting infrastructure for cooling, rectifiers and back-up systems
S3.5: Third party enterprise networks and third party data centers
Dedicated enterprise networks including data centers are connected to the Swedish ICT network and by that accessible for selected users in Sweden as well as globally. All these connections are normally based on optical fiber or broadband communication via SDH links. The following “devices” have been added for this part:
Third party enterprise networks and data centers in Sweden: o Enterprise networks (LAN) with access and aggregation switches and routers o Servers, storage, routers and switches in data centers including all supporting
infrastructure for cooling, rectifiers and back-up systems
S3.6: Internet Global The ICT network in Sweden operated by TeliaSonera is connected via different nodes to the ICT network in Europe. The European ICT network is then connected to other continents via underwater fiber cables to America, Asia and further, often referred to as the global ICT backbone network. Each continental backbone network is then divided equal to the European network. All these connections are nowadays based on optical fiber communication via SDH links. Global public server data providers such as social networks and search engines are connected to the local ICT provider where their Data centers are located, and further connected and accessible via the Transmission and IP core network in each country and further.
2014 Journal of Industrial Ecology – www.wileyonlinelibrary.com/journal/jie
Public data centers in combination with national Transmission and IP core networks, continental back bone network, cross linking submarine optical fiber networks etc. is better known as “the Internet”.
International data transport, IP core networks and data centers, routers and optical fiber links and submarine optical fiber cable systems for data traffic outside Sweden/EU, etc.
International third party enterprise networks and data centers accessible also for Swedish users:
o Enterprise networks (LAN) with access and aggregation switches and routers o Servers, storage, routers and switches in data centers including all supporting
infrastructure for cooling, rectifiers and back-up systems
S3.7: Operator activities For a telecom operator there is a significant impact not only from the actual network but also from other parts of the operations; personnel is traveling, offices needs to be heated, contracting work etc. And all these must also be included into a comprehensive assessment. The following operator aspects have been included in the study:
Offices and stores (energy), business travel, service vehicles (own and third party services), as well as activities required for operation and maintenance of the ICT networks and to serve the subscribers, etc.
S3.8: Summary The network studied contained all functions that can be expected from an operator that aims to offer all modern ICT services for both the private sector and business customers, including machine to machine services and seamless cloud functionalities for fixed and mobile operations. All parts of the TeliaSonera ICT network physically located in Sweden were included also core network interfaces towards the international backbone network. Impacts outside of Sweden related to international traffic to and from Sweden were included and shared between originating and terminating networks. Equipment of TeliaSonera installed at other operators’ premises was included, and other operators’ equipment installed at TeliaSonera premises was excluded, by use of site and equipment specific information. The Home/CPE network includes modems, routers and gateways (combination products) which can be fixed and/or wireless equipment inside the home (LAN/WLAN), see figure S3.8.1.
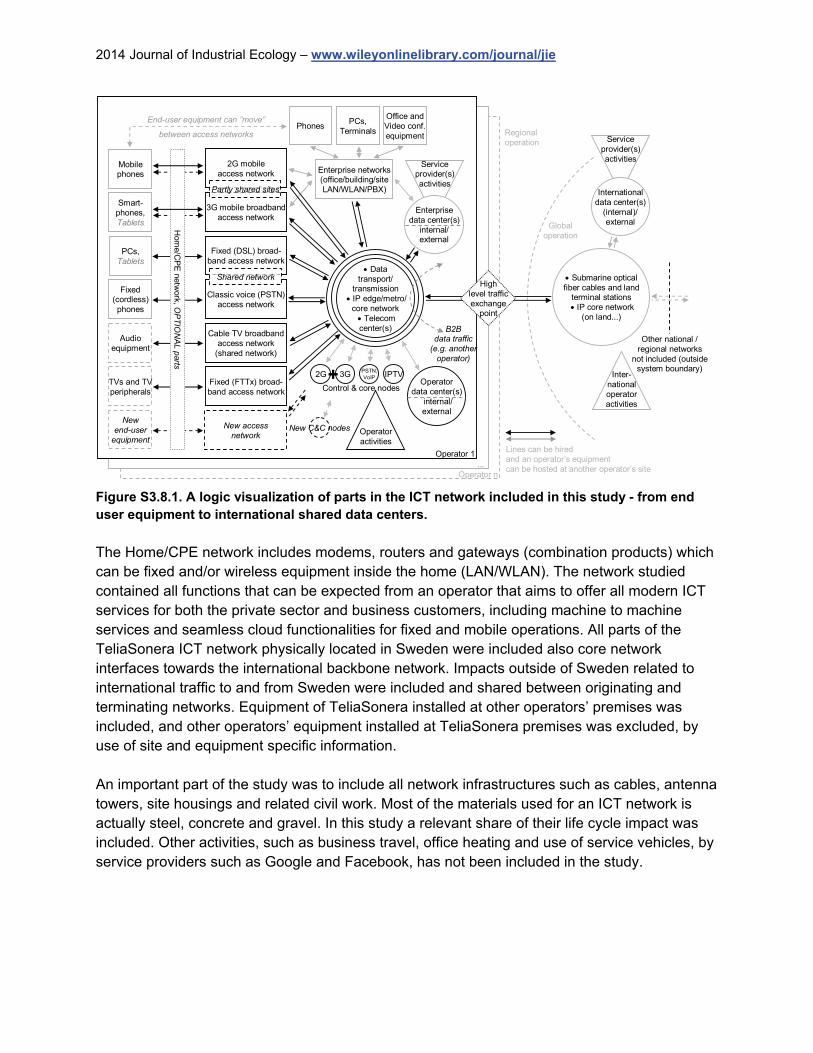
2014 Journal of Industrial Ecology – www.wileyonlinelibrary.com/journal/jie
Figure S3.8.1. A logic visualization of parts in the ICT network included in this study - from end user equipment to international shared data centers. The Home/CPE network includes modems, routers and gateways (combination products) which can be fixed and/or wireless equipment inside the home (LAN/WLAN). The network studied contained all functions that can be expected from an operator that aims to offer all modern ICT services for both the private sector and business customers, including machine to machine services and seamless cloud functionalities for fixed and mobile operations. All parts of the TeliaSonera ICT network physically located in Sweden were included also core network interfaces towards the international backbone network. Impacts outside of Sweden related to international traffic to and from Sweden were included and shared between originating and terminating networks. Equipment of TeliaSonera installed at other operators’ premises was included, and other operators’ equipment installed at TeliaSonera premises was excluded, by use of site and equipment specific information. An important part of the study was to include all network infrastructures such as cables, antenna towers, site housings and related civil work. Most of the materials used for an ICT network is actually steel, concrete and gravel. In this study a relevant share of their life cycle impact was included. Other activities, such as business travel, office heating and use of service vehicles, by service providers such as Google and Facebook, has not been included in the study.
Datatransport/
transmission IP edge/metro/
core network Telecomcenter(s)
2G mobileaccess network
PSTN,VoIP
3G mobile broadbandaccess network
Fixed (DSL) broad-band access network
Classic voice (PSTN)access network
Cable TV broadbandaccess network
(shared network)
Fixed (FTTx) broad-band access network
New accessnetwork Operator
activities
2G 3G IPTV
Mobilephones
Smart-phones,Tablets
Fixed(cordless)phones
TVs and TVperipherals
Audioequipment
Newend-user
equipment
Enterprise networks(office/building/siteLAN/WLAN/PBX)
PCs,Terminals
Office andVideo conf.equipment
Operatordata center(s)
internal/external
PCs,Tablets
Hom
e/CP
E netw
ork,OP
TIO
NA
L parts
Control & core nodes
Phones
New C&C nodes
Submarine opticalfiber cables and land
terminal stations IP core network
(on land...)
Inter-nationaloperatoractivities
Serviceprovider(s)activities
Serviceprovider(s)activities
Enterprisedata center(s)
internal/external
Internationaldata center(s)
(internal)/external
+
Operator 1
Operator n...
Highlevel trafficexchange
point
End-user equipment can ”move”
between access networks
Globaloperation
Other national /regional networks
not included (outsidesystem boundary)
B2Bdata traffic
(e.g. anotheroperator)
Partly shared sites
Shared network
Regionaloperation
Lines can be hiredand an operator’s equipmentcan be hosted at another operator’s site
2014 Journal of Industrial Ecology – www.wileyonlinelibrary.com/journal/jie
S.3.9: Additional information
S.3.9.1: Back ground data on TeliaSonera’s network TeliaSonera is the 5th largest telecom operator in Europe with a focus on Nordic, Baltic and Eurasia (a total of 17 countries). In addition TeliaSonera is also the 3th largest global internet backbone provider covering almost 80 countries. In Sweden TeliaSonera operates one of three national wide GSM networks and has the largest geographical coverage. The operator is also the shared owner (50%) of one of tree national wide 3G networks. It is worth noticing that 4G/LTE was not included in the study since this technology was launched in December 2009. TeliaSonera is also the national wide operator of the PSTN network in Sweden and maintains the fixed access network for other operators. In addition TeliaSonera is one of 4 national wide fixed broadband operators (xDSL). The operator is also the major national ICT core network provider in Sweden both in relation to fiber lengths as well as data transmission. Finally TeliaSonera is one of several suppliers of collocated data services and is also the third largest backbone provider for international traffic globally.
2014 Journal of Industrial Ecology – www.wileyonlinelibrary.com/journal/jie
Appendix S4: ICT network data for TeliaSonera and Sweden The results of the network analysis as well as results of the investigation of TeliaSonera’s operator activities are shown in table S4.1. The operator activities are described in more detail in Malmodin et al. (2010b) but new electricity consumption data for offices, stores and internal data centers based on the current study have been used in this study. Data transmission and IP core network is based on the average model developed for Sweden which has been described in more detail in Malmodin et al (2012), see also Supporting Information Appendix S5. The extrapolation to Sweden is done using subscription data or other quantifying data described in table S4.1. A summary of the estimations of 3rd part enterprise networks and data centers described in chapter 3.5 of the article is also included in table S4.1. These parts have been estimated based on statistics on the national level. The allocation to TeliaSonera (50%) is based on the average share of other subscribers (40%) and the share of the IP core network (~2/3 of fiber length). The 3rd part enterprise network and data centers are not related to a specific operator in the same way as a PSTN/mobile/broadband subscriber.
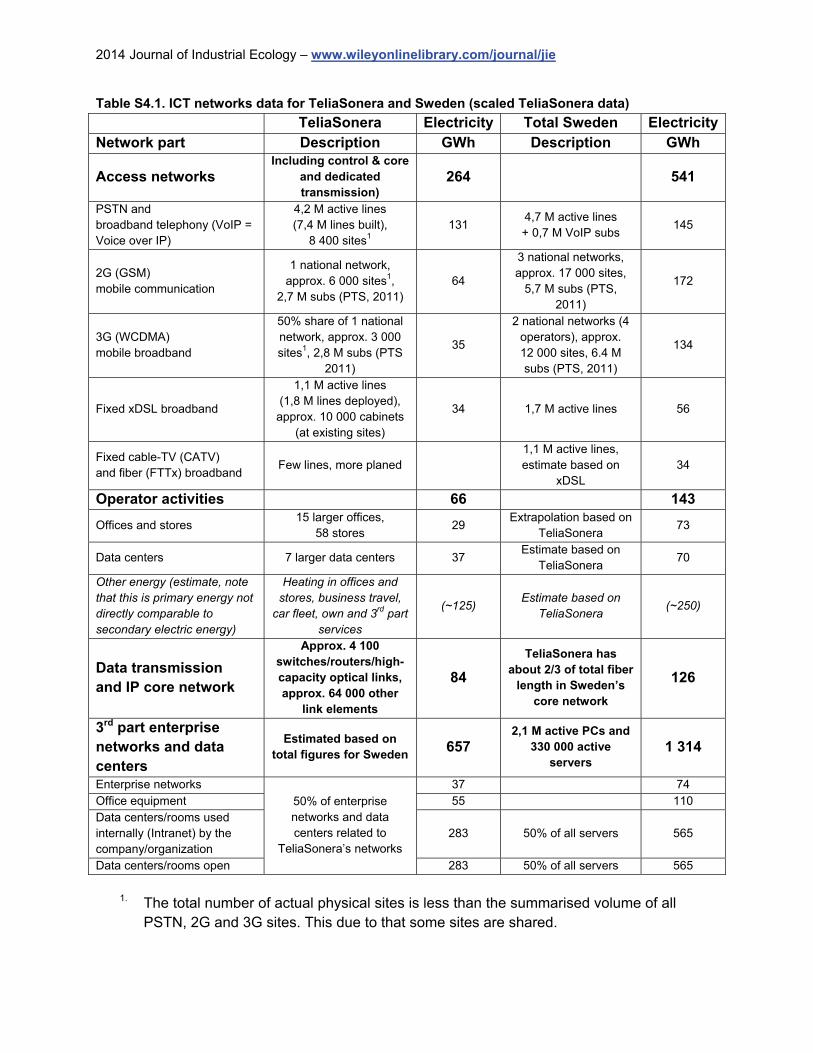
2014 Journal of Industrial Ecology – www.wileyonlinelibrary.com/journal/jie
Table S4.1. ICT networks data for TeliaSonera and Sweden (scaled TeliaSonera data)
TeliaSonera Electricity Total Sweden ElectricityNetwork part Description GWh Description GWh
Access networks Including control & core
and dedicated transmission)
264 541
PSTN and broadband telephony (VoIP = Voice over IP)
4,2 M active lines (7,4 M lines built),
8 400 sites1 131
4,7 M active lines + 0,7 M VoIP subs
145
2G (GSM) mobile communication
1 national network, approx. 6 000 sites1,
2,7 M subs (PTS, 2011) 64
3 national networks, approx. 17 000 sites,
5,7 M subs (PTS, 2011)
172
3G (WCDMA) mobile broadband
50% share of 1 national network, approx. 3 000 sites1, 2,8 M subs (PTS
2011)
35
2 national networks (4 operators), approx. 12 000 sites, 6.4 M subs (PTS, 2011)
134
Fixed xDSL broadband
1,1 M active lines (1,8 M lines deployed), approx. 10 000 cabinets
(at existing sites)
34 1,7 M active lines 56
Fixed cable-TV (CATV) and fiber (FTTx) broadband
Few lines, more planed 1,1 M active lines, estimate based on
xDSL 34
Operator activities 66 143
Offices and stores 15 larger offices,
58 stores 29
Extrapolation based on TeliaSonera
73
Data centers 7 larger data centers 37 Estimate based on
TeliaSonera 70
Other energy (estimate, note that this is primary energy not directly comparable to secondary electric energy)
Heating in offices and stores, business travel,
car fleet, own and 3rd part services
(~125) Estimate based on
TeliaSonera (~250)
Data transmission and IP core network
Approx. 4 100 switches/routers/high-capacity optical links, approx. 64 000 other
link elements
84
TeliaSonera has about 2/3 of total fiber
length in Sweden’s core network
126
3rd part enterprise networks and data centers
Estimated based on total figures for Sweden
657 2,1 M active PCs and
330 000 active servers
1 314
Enterprise networks
50% of enterprise networks and data centers related to
TeliaSonera’s networks
37 74 Office equipment 55 110 Data centers/rooms used internally (Intranet) by the company/organization
283 50% of all servers 565
Data centers/rooms open 283 50% of all servers 565
1. The total number of actual physical sites is less than the summarised volume of all
PSTN, 2G and 3G sites. This due to that some sites are shared.
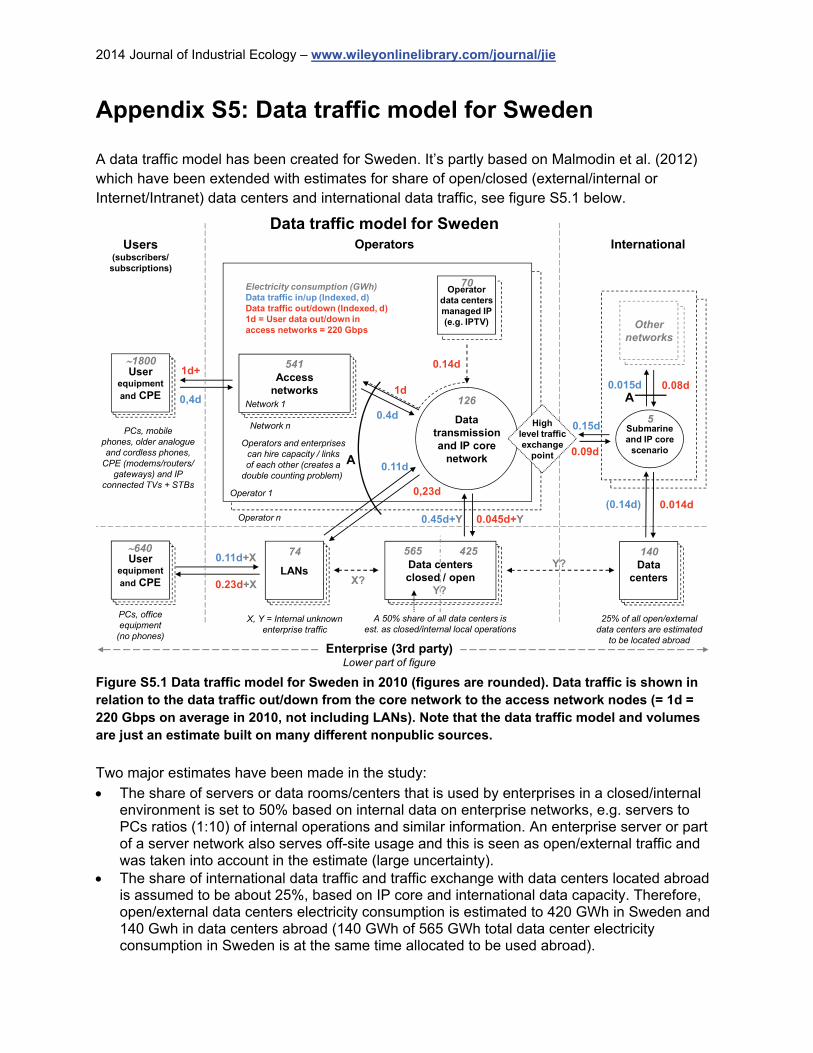
2014 Journal of Industrial Ecology – www.wileyonlinelibrary.com/journal/jie
Appendix S5: Data traffic model for Sweden A data traffic model has been created for Sweden. It’s partly based on Malmodin et al. (2012) which have been extended with estimates for share of open/closed (external/internal or Internet/Intranet) data centers and international data traffic, see figure S5.1 below.
Accessnetworks
LANs
Datatransmissionand IP core
network
Datacenters
Data centersclosed / open
Submarineand IP core
scenario
Othernetworks
Operators International
Highlevel trafficexchange
point
0,23d
0.11d
1d
0.4d
0.09d
0.15d
0.045d+Y0.45d+Y
0.14d
Operatordata centersmanaged IP(e.g. IPTV)
Operator 1
Operator n
Network n
74 565 425 140
126
5
70
Userequipmentand CPE
Userequipmentand CPE
1800
640
0,4d
1d+
0.11d+X
0.23d+X X?
X, Y = Internal unknownenterprise traffic
A 50% share of all data centers isest. as closed/internal local operations
Accessnetworks
Network 1
541
Operators and enterprisescan hire capacity / linksof each other (creates a
double counting problem)
PCs, officeequipment
(no phones)
PCs, mobilephones, older analogueand cordless phones,
CPE (modems/routers/gateways) and IP
connected TVs + STBs
Users(subscribers/
subscriptions)
Electricity consumption (GWh)Data traffic in/up (Indexed, d)Data traffic out/down (Indexed, d)1d = User data out/down inaccess networks = 220 Gbps
0.015d
(0.14d) 0.014d
0.08d
25% of all open/externaldata centers are estimated
to be located abroad
Data traffic model for Sweden
Enterprise (3rd party)Lower part of figure
Y?
Y?
S S
A
A
Figure S5.1 Data traffic model for Sweden in 2010 (figures are rounded). Data traffic is shown in relation to the data traffic out/down from the core network to the access network nodes (= 1d = 220 Gbps on average in 2010, not including LANs). Note that the data traffic model and volumes are just an estimate built on many different nonpublic sources. Two major estimates have been made in the study: The share of servers or data rooms/centers that is used by enterprises in a closed/internal
environment is set to 50% based on internal data on enterprise networks, e.g. servers to PCs ratios (1:10) of internal operations and similar information. An enterprise server or part of a server network also serves off-site usage and this is seen as open/external traffic and was taken into account in the estimate (large uncertainty).
The share of international data traffic and traffic exchange with data centers located abroad is assumed to be about 25%, based on IP core and international data capacity. Therefore, open/external data centers electricity consumption is estimated to 420 GWh in Sweden and 140 Gwh in data centers abroad (140 GWh of 565 GWh total data center electricity consumption in Sweden is at the same time allocated to be used abroad).
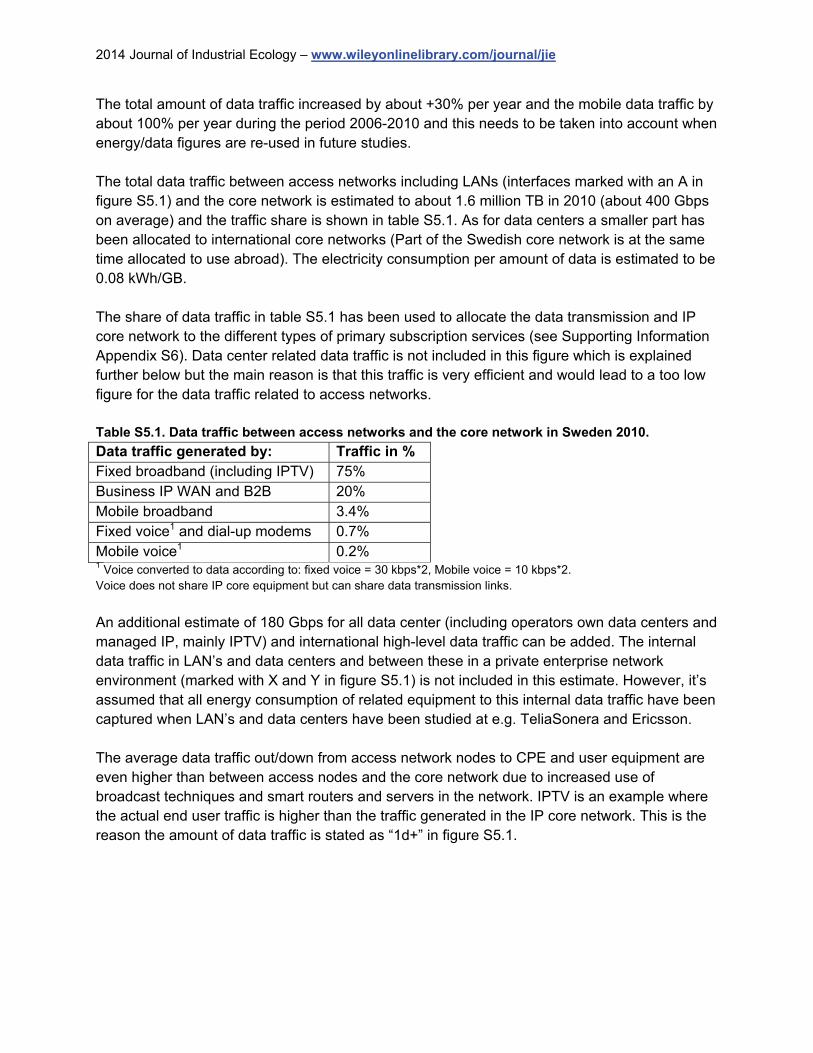
2014 Journal of Industrial Ecology – www.wileyonlinelibrary.com/journal/jie
The total amount of data traffic increased by about +30% per year and the mobile data traffic by about 100% per year during the period 2006-2010 and this needs to be taken into account when energy/data figures are re-used in future studies. The total data traffic between access networks including LANs (interfaces marked with an A in figure S5.1) and the core network is estimated to about 1.6 million TB in 2010 (about 400 Gbps on average) and the traffic share is shown in table S5.1. As for data centers a smaller part has been allocated to international core networks (Part of the Swedish core network is at the same time allocated to use abroad). The electricity consumption per amount of data is estimated to be 0.08 kWh/GB. The share of data traffic in table S5.1 has been used to allocate the data transmission and IP core network to the different types of primary subscription services (see Supporting Information Appendix S6). Data center related data traffic is not included in this figure which is explained further below but the main reason is that this traffic is very efficient and would lead to a too low figure for the data traffic related to access networks. Table S5.1. Data traffic between access networks and the core network in Sweden 2010.
Data traffic generated by: Traffic in % Fixed broadband (including IPTV) 75% Business IP WAN and B2B 20% Mobile broadband 3.4% Fixed voice1 and dial-up modems 0.7% Mobile voice1 0.2% 1 Voice converted to data according to: fixed voice = 30 kbps*2, Mobile voice = 10 kbps*2. Voice does not share IP core equipment but can share data transmission links.
An additional estimate of 180 Gbps for all data center (including operators own data centers and managed IP, mainly IPTV) and international high-level data traffic can be added. The internal data traffic in LAN’s and data centers and between these in a private enterprise network environment (marked with X and Y in figure S5.1) is not included in this estimate. However, it’s assumed that all energy consumption of related equipment to this internal data traffic have been captured when LAN’s and data centers have been studied at e.g. TeliaSonera and Ericsson. The average data traffic out/down from access network nodes to CPE and user equipment are even higher than between access nodes and the core network due to increased use of broadcast techniques and smart routers and servers in the network. IPTV is an example where the actual end user traffic is higher than the traffic generated in the IP core network. This is the reason the amount of data traffic is stated as “1d+” in figure S5.1.
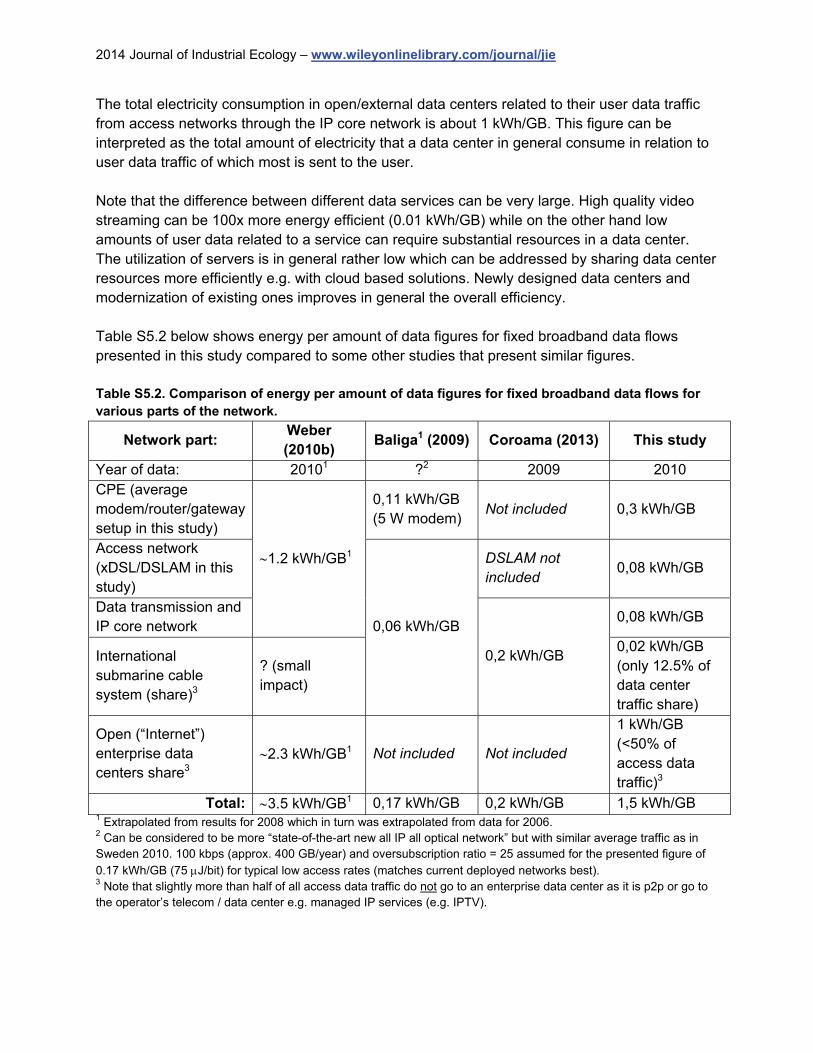
2014 Journal of Industrial Ecology – www.wileyonlinelibrary.com/journal/jie
The total electricity consumption in open/external data centers related to their user data traffic from access networks through the IP core network is about 1 kWh/GB. This figure can be interpreted as the total amount of electricity that a data center in general consume in relation to user data traffic of which most is sent to the user. Note that the difference between different data services can be very large. High quality video streaming can be 100x more energy efficient (0.01 kWh/GB) while on the other hand low amounts of user data related to a service can require substantial resources in a data center. The utilization of servers is in general rather low which can be addressed by sharing data center resources more efficiently e.g. with cloud based solutions. Newly designed data centers and modernization of existing ones improves in general the overall efficiency. Table S5.2 below shows energy per amount of data figures for fixed broadband data flows presented in this study compared to some other studies that present similar figures. Table S5.2. Comparison of energy per amount of data figures for fixed broadband data flows for various parts of the network.
Network part: Weber (2010b)
Baliga1 (2009) Coroama (2013) This study
Year of data: 20101 ?2 2009 2010 CPE (average modem/router/gateway setup in this study)
1.2 kWh/GB1
0,11 kWh/GB (5 W modem)
Not included 0,3 kWh/GB
Access network (xDSL/DSLAM in this study)
0,06 kWh/GB
DSLAM not included
0,08 kWh/GB
Data transmission and IP core network
0,2 kWh/GB
0,08 kWh/GB
International submarine cable system (share)3
? (small impact)
0,02 kWh/GB (only 12.5% of data center traffic share)
Open (“Internet”) enterprise data centers share3
2.3 kWh/GB1 Not included Not included
1 kWh/GB (<50% of access data traffic)3
Total: 3.5 kWh/GB1 0,17 kWh/GB 0,2 kWh/GB 1,5 kWh/GB 1 Extrapolated from results for 2008 which in turn was extrapolated from data for 2006. 2 Can be considered to be more “state-of-the-art new all IP all optical network” but with similar average traffic as in Sweden 2010. 100 kbps (approx. 400 GB/year) and oversubscription ratio = 25 assumed for the presented figure of 0.17 kWh/GB (75 J/bit) for typical low access rates (matches current deployed networks best). 3 Note that slightly more than half of all access data traffic do not go to an enterprise data center as it is p2p or go to the operator’s telecom / data center e.g. managed IP services (e.g. IPTV).
2014 Journal of Industrial Ecology – www.wileyonlinelibrary.com/journal/jie
In this study, the term data center have been used for all types of server deployments or server networks in various scales and in various types of buildings. All servers and related infrastructure is included in the study under the term data center, from a single server to large enterprise data centers. The total operational energy use for data centers in Sweden was based on Koomey (2011) due to lack of server sale statistics for Sweden. The number of active servers was estimated based on the global ratio between estimated active servers and PCs and the number of PCs in Sweden. About the same ratio was found between global DNS (Domain Name System) registrations globally and in Sweden, same ratio also for data traffic volumes and data center count. Investigations of energy consumptions of PCs and data centers/rooms in offices and other service buildings in Sweden added to the picture but were incomplete and uncertain estimates for industry classified buildings had to be added. The different data sources and estimates ended up close to each other but it was decided to use the estimates by (Koomey 2011) and PCs to server ratios. Ericsson and TeliaSonera operates a few of the largest data centers in Sweden or has hosted equipment in other large co-location data centers and all together this information have been used to build a data model for Sweden. The average PUE-factor (1.8) was found to be close to the average used by (Koomey 2011). At the moment Facebook are building a mega data center in the north of Sweden which in terms of energy will add an estimated 20%-30% in full operation to the total electricity consumption of data centers in Sweden. The share of p2p (peer-to-peer) data traffic was still rather high in Sweden in 2010 and as much as about 50% of the data traffic between access networks and the core network was p2p. When looking at all data traffic including data centers about 1/3 was p2p. This is slowly changing and more and more videos will come from data centers in the future. Video will still be the dominating type of traffic but the source is slowly changing. To be noted: The data traffic model and amounts of data traffic is just an estimate built from many different nonpublic sources. In the end it’s almost impossible to measure the total data traffic with high accuracy in a large region due to the many operators and enterprises that operates parts of the total network.
2014 Journal of Industrial Ecology – www.wileyonlinelibrary.com/journal/jie
Appendix S6: Detailed results
Detailed results are presented for all different primary subscription services and their subparts, e.g. user equipment, access network and operator activities. The manufacturing or embodied carbon footprint and operational electricity consumption for user equipment is described more in detail in S2. The results are for an average subscription with average user equipment and average ICT network usage. The electricity consumption for each network subpart (total Sweden) is taken from table S4.1 in Supporting Information Appendix S4 divided by number of subscriptions in Sweden. Each subpart is described short followed by energy and embodied carbon footprint data and a short result summary including a graph with results for both Sweden and the global scenario.
S6.1: Detailed results for PSTN subscription According to PTS (2010) there were about 4.7 million active PSTN subscription/lines in Sweden on average in 2009 (mid year average). User (phone) equipment: 1 analog and 1 basic cordless phone is assumed to be used per average PSTN line in Sweden. No investigation of cordless phones in active use has been carried out. Data for electricity consumption and manufacturing are based on Malmodin et al (2010a). No PCs connected to PSTN (have usually an internal PSTN data modem) or older answering machines or number presenters are included in this study as very few are still in use. PSTN data subscriptions have decreased from 1.1 million in 2006 to 0.34 million in 2009 with a further decrease to 0.24 million in 2010, a reduction of nearly 80% since 2006 (PTS 2008-2011). PSTN access line (and PSTN access site): Manufacturing and construction data for the cable infrastructure is from Lindroth (1999b) which was based on an average PSTN line deployed in Sweden prior to 2000. About 1.7 million physical PSTN lines are shared with xDSL broadband lines but no share of the embodied footprint has been subtracted (allocated to broadband) and therefore a whole line (100%) is allocated to a PSTN subscription. Exchanges & core nodes: Manufacturing data is from Lindroth (1999b) and is based on the average PSTN exchange & core nodes equipment installed in Sweden prior to 2000. Electricity consumption and the manufacturing CF would be considerably lower if new PSTN equipment was studied (also valid for the PSTN access line equipment described above). Operator activities: Based on TeliaSonera’s operator activities (offices, stores, own cars, business travel) per average fixed subscription, including third party services and their car travel, see further Supporting Information Appendix S4. No manufacturing of buildings or vehicles or other infrastructure is included. Transmission and IP core network: Based on the average transmission and IP core network and data traffic model developed for Sweden (Malmodin et al 2012), and the average data traffic
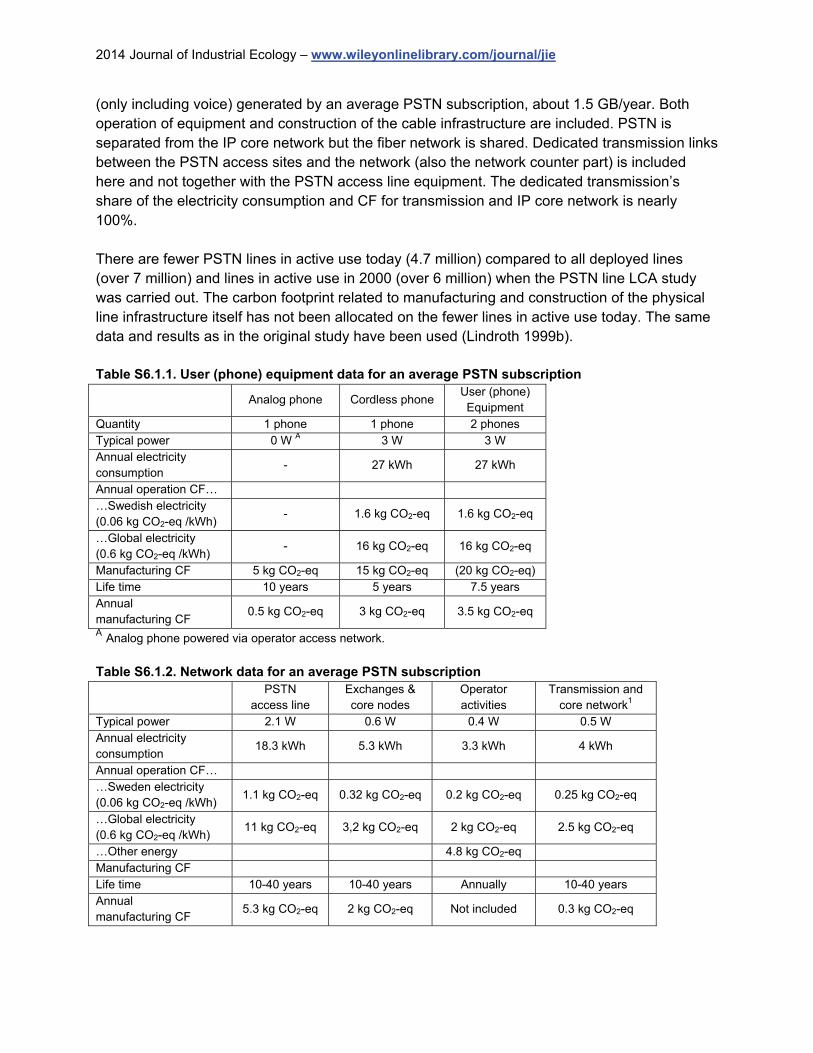
2014 Journal of Industrial Ecology – www.wileyonlinelibrary.com/journal/jie
(only including voice) generated by an average PSTN subscription, about 1.5 GB/year. Both operation of equipment and construction of the cable infrastructure are included. PSTN is separated from the IP core network but the fiber network is shared. Dedicated transmission links between the PSTN access sites and the network (also the network counter part) is included here and not together with the PSTN access line equipment. The dedicated transmission’s share of the electricity consumption and CF for transmission and IP core network is nearly 100%. There are fewer PSTN lines in active use today (4.7 million) compared to all deployed lines (over 7 million) and lines in active use in 2000 (over 6 million) when the PSTN line LCA study was carried out. The carbon footprint related to manufacturing and construction of the physical line infrastructure itself has not been allocated on the fewer lines in active use today. The same data and results as in the original study have been used (Lindroth 1999b). Table S6.1.1. User (phone) equipment data for an average PSTN subscription
Analog phone Cordless phone User (phone) Equipment
Quantity 1 phone 1 phone 2 phones Typical power 0 W A 3 W 3 W Annual electricity consumption
- 27 kWh 27 kWh
Annual operation CF… …Swedish electricity (0.06 kg CO2-eq /kWh)
- 1.6 kg CO2-eq 1.6 kg CO2-eq
…Global electricity (0.6 kg CO2-eq /kWh)
- 16 kg CO2-eq 16 kg CO2-eq
Manufacturing CF 5 kg CO2-eq 15 kg CO2-eq (20 kg CO2-eq) Life time 10 years 5 years 7.5 years Annual manufacturing CF
0.5 kg CO2-eq 3 kg CO2-eq 3.5 kg CO2-eq
A Analog phone powered via operator access network.
Table S6.1.2. Network data for an average PSTN subscription
PSTN
access line Exchanges & core nodes
Operator activities
Transmission and core network1
Typical power 2.1 W 0.6 W 0.4 W 0.5 W Annual electricity consumption
18.3 kWh 5.3 kWh 3.3 kWh 4 kWh
Annual operation CF… …Sweden electricity (0.06 kg CO2-eq /kWh)
1.1 kg CO2-eq 0.32 kg CO2-eq 0.2 kg CO2-eq 0.25 kg CO2-eq
…Global electricity (0.6 kg CO2-eq /kWh)
11 kg CO2-eq 3,2 kg CO2-eq 2 kg CO2-eq 2.5 kg CO2-eq
…Other energy 4.8 kg CO2-eq Manufacturing CF Life time 10-40 years 10-40 years Annually 10-40 years Annual manufacturing CF
5.3 kg CO2-eq 2 kg CO2-eq Not included 0.3 kg CO2-eq
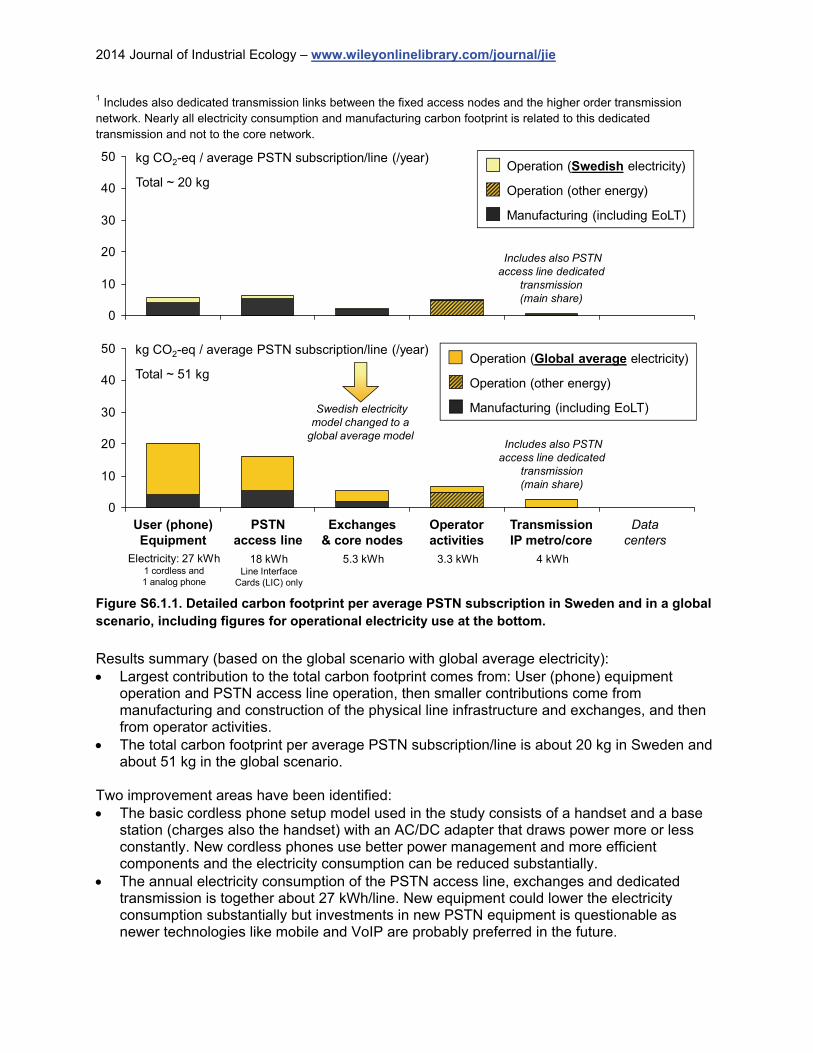
2014 Journal of Industrial Ecology – www.wileyonlinelibrary.com/journal/jie
1 Includes also dedicated transmission links between the fixed access nodes and the higher order transmission network. Nearly all electricity consumption and manufacturing carbon footprint is related to this dedicated transmission and not to the core network.
TransmissionIP metro/core
PSTNaccess line
User (phone)Equipment
Operatoractivities
Datacenters
Exchanges& core nodes
0
10
20
30
40
50
0
10
20
30
40
50Operation (Global average electricity)
Operation (other energy)
Manufacturing (including EoLT)Swedish electricitymodel changed to a
global average modelIncludes also PSTN
access line dedicatedtransmission(main share)
Includes also PSTNaccess line dedicated
transmission(main share)
kg CO2-eq / average PSTN subscription/line (/year)
Total ~ 20 kg
kg CO2-eq / average PSTN subscription/line (/year)
Total ~ 51 kg
4 kWh18 kWhLine Interface
Cards (LIC) only
3.3 kWh5.3 kWhElectricity: 27 kWh1 cordless and1 analog phone
Operation (Swedish electricity)
Operation (other energy)
Manufacturing (including EoLT)
Figure S6.1.1. Detailed carbon footprint per average PSTN subscription in Sweden and in a global scenario, including figures for operational electricity use at the bottom.
Results summary (based on the global scenario with global average electricity): Largest contribution to the total carbon footprint comes from: User (phone) equipment
operation and PSTN access line operation, then smaller contributions come from manufacturing and construction of the physical line infrastructure and exchanges, and then from operator activities.
The total carbon footprint per average PSTN subscription/line is about 20 kg in Sweden and about 51 kg in the global scenario.
Two improvement areas have been identified: The basic cordless phone setup model used in the study consists of a handset and a base
station (charges also the handset) with an AC/DC adapter that draws power more or less constantly. New cordless phones use better power management and more efficient components and the electricity consumption can be reduced substantially.
The annual electricity consumption of the PSTN access line, exchanges and dedicated transmission is together about 27 kWh/line. New equipment could lower the electricity consumption substantially but investments in new PSTN equipment is questionable as newer technologies like mobile and VoIP are probably preferred in the future.
2014 Journal of Industrial Ecology – www.wileyonlinelibrary.com/journal/jie
S6.2: Detailed results for VoIP subscription According to PTS (2010) there were about 0.7 million active VoIP subscriptions in Sweden on average in 2009 (mid year average). User (phone) equipment: The same analog phone and basic cordless phone setup as for an average PSTN subscription is used, see table S6.1.1 in S6.1. CPE & xDSL access line: The CPE and xDSL access line data is the same as used for an average 3-play subscription (see S6.6). The components in the gateway dedicated for VoIP is estimated to consume about 1 W (EU 2011) and this part is allocated to VoIP. The other gateway parts share allocated to VoIP is based on average time of use. If amount of data would be used, the share would have been nearly 10 times larger but still only about 1/5 of the dedicated components fully allocated to VoIP. Control & core nodes: Manufacturing data is from Lindroth (1999b) and is based on the average PSTN exchange & core nodes equipment installed in Sweden prior to 2000. The electricity consumption is based on TeliaSonera’s operation of VoIP node equipment in 2009 that served about 70k subscriptions. This subscription service was under development at the time of the study and it is believed that a more mature service with more subscriptions will reduce the electricity consumption and equipment needed per subscription in the future. Operator activities: Based on TeliaSonera’s operator activities (offices, stores, own cars, business travel) per average fixed subscription, including third party services, maintenance etc., see further Supporting Information Appendix S4. Manufacturing of buildings, vehicles and other infrastructure is not included. Transmission and IP core network: Based on the average data traffic model developed for Sweden (Malmodin et al 2012) and the average data traffic generated by an average VoIP subscription, about 1.5 GB/year. The results are for private residential VoIP subscriptions which make up more than 90% of all VoIP subscriptions in Sweden in 2009 (PTS 2010). The same analog phone and basic cordless phone setup as for an average PSTN subscription is used, see table S6.1.1 in S6.1.
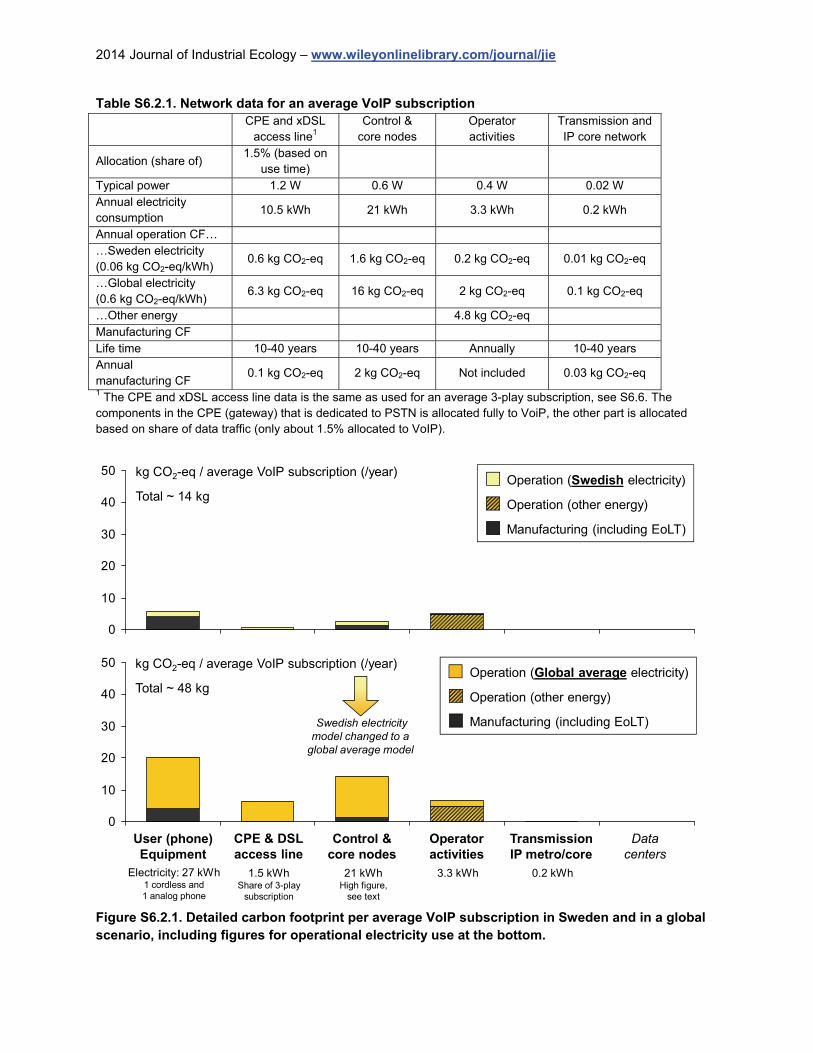
2014 Journal of Industrial Ecology – www.wileyonlinelibrary.com/journal/jie
Table S6.2.1. Network data for an average VoIP subscription
CPE and xDSL
access line1 Control &
core nodes Operator activities
Transmission and IP core network
Allocation (share of) 1.5% (based on
use time)
Typical power 1.2 W 0.6 W 0.4 W 0.02 W Annual electricity consumption
10.5 kWh 21 kWh 3.3 kWh 0.2 kWh
Annual operation CF… …Sweden electricity (0.06 kg CO2-eq/kWh)
0.6 kg CO2-eq 1.6 kg CO2-eq 0.2 kg CO2-eq 0.01 kg CO2-eq
…Global electricity (0.6 kg CO2-eq/kWh)
6.3 kg CO2-eq 16 kg CO2-eq 2 kg CO2-eq 0.1 kg CO2-eq
…Other energy 4.8 kg CO2-eq Manufacturing CF Life time 10-40 years 10-40 years Annually 10-40 years Annual manufacturing CF
0.1 kg CO2-eq 2 kg CO2-eq Not included 0.03 kg CO2-eq
1 The CPE and xDSL access line data is the same as used for an average 3-play subscription, see S6.6. The components in the CPE (gateway) that is dedicated to PSTN is allocated fully to VoiP, the other part is allocated based on share of data traffic (only about 1.5% allocated to VoIP).
0
10
20
30
40
50
TransmissionIP metro/core
CPE & DSLaccess line
User (phone)Equipment
Operatoractivities
Datacenters
Control &core nodes
Operation (Swedish electricity)
Operation (other energy)
Manufacturing (including EoLT)
0
10
20
30
40
50Operation (Global average electricity)
Operation (other energy)
Manufacturing (including EoLT)
kg CO2-eq / average VoIP subscription (/year)
Total ~ 14 kg
kg CO2-eq / average VoIP subscription (/year)
Total ~ 48 kg
0.2 kWh1.5 kWhShare of 3-play
subscription
3.3 kWh21 kWhHigh figure,
see text
Electricity: 27 kWh1 cordless and1 analog phone
Swedish electricitymodel changed to a
global average model
Figure S6.2.1. Detailed carbon footprint per average VoIP subscription in Sweden and in a global scenario, including figures for operational electricity use at the bottom.
2014 Journal of Industrial Ecology – www.wileyonlinelibrary.com/journal/jie
Results summary (based on the global scenario with global average electricity): Largest contribution to the total carbon footprint comes from: User (phone) equipment
operation and control & core nodes operation, and then from operator activities. The control & core nodes and operator activities carbon footprint are expected to be smaller per subscription/line in the future when the service is more mature and more subscriptions are served.
The total carbon footprint per average VoIP subscription/line is about 14 kg in Sweden and about 48 kg in the global scenario.
Two improvement areas have been identified: The same basic cordless phone setup as for an average PSTN subscription is used for VoIP
with the same identified improvement potential, see PSTN S6.1. Operation of control & core nodes and operator activities can be reduced substantially in the
future which has been described in the subpart list and the results summary.
S6.3: Detailed results for 2G (GSM) subscription According to PTS (2011) there were about 5.7 million active 2G subscriptions in Sweden on average in 2010 (midyear average). However, 3G subscribers can also use the older 2G network for voice but also for data when no 3G coverage exist. User (mobile phone) equipment: Based on an average mobile phone specified in table S6.4.1 in S6.4. Supporting Information Appendix S2 describes how quantities and type of user equipment was estimated and how average manufacturing and electricity consumption data for user equipment have been estimated based on other studies, e.g. LCA studies. Ericsson has performed a number of LCAs of mobile phones over the years of which the latest published is Bergelin (2008). Base station sites: 3G subscribers (subscriptions) as defined by PTS can also access older 2G base stations for voice but also for data when no 3G coverage exist, therefore the average electricity consumption for base stations uses the combined 2G and 3G base station average, 23 kWh/subscription. This average also better describes . The electricity consumption for 2G base stations divided by 2G subscriptions is about 27 kWh/subscription. Manufacturing data is from Ericsson (2010) and is based on the average base station site installed in Sweden prior to 2005. Electricity consumption and the manufacturing CF could be considerably lower if new base station equipment was used and studied. Control & core nodes: Core nodes shared by 2G and 3G have been allocated to each network based on internal experts at TeliaSonera. Manufacturing data is from Ericsson (2010) and is based on the average control and core node site installed in Sweden prior to 2005. Operator activities: Based on TeliaSonera’s operator activities (offices, stores, own cars, business travel) per average mobile subscription, including third party services and their car travel, see further Supporting Information Appendix S4. No manufacturing of buildings or vehicles or other infrastructure is included.
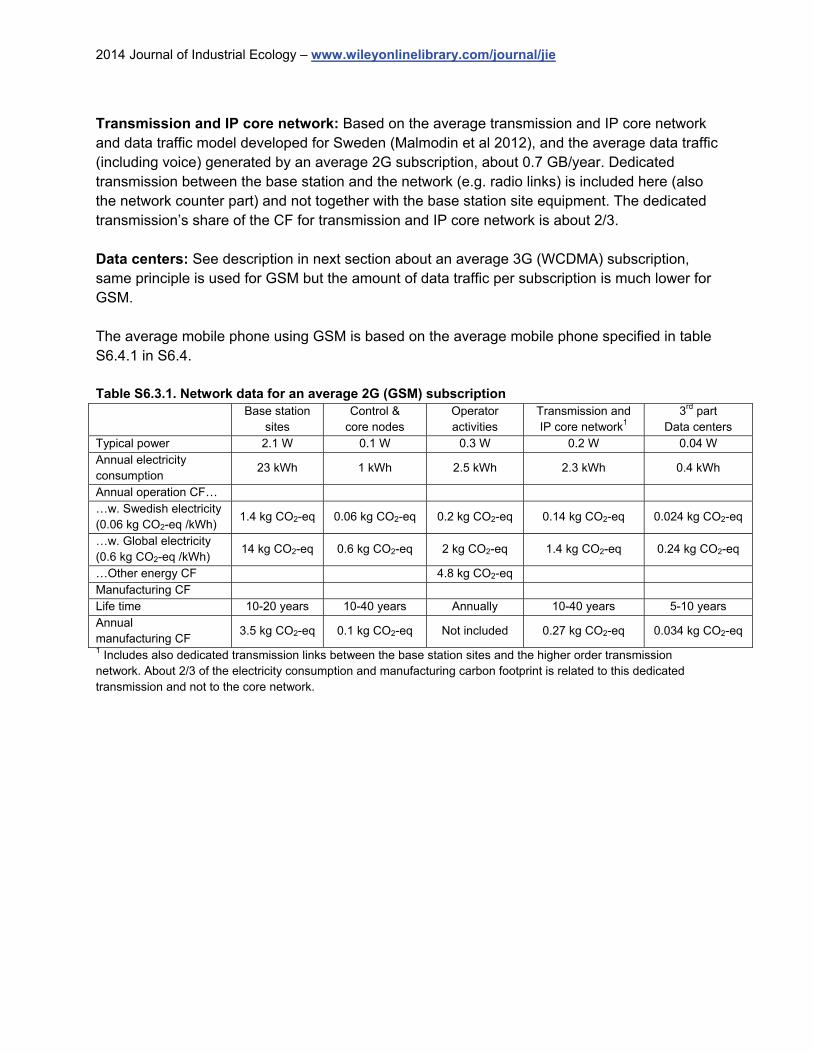
2014 Journal of Industrial Ecology – www.wileyonlinelibrary.com/journal/jie
Transmission and IP core network: Based on the average transmission and IP core network and data traffic model developed for Sweden (Malmodin et al 2012), and the average data traffic (including voice) generated by an average 2G subscription, about 0.7 GB/year. Dedicated transmission between the base station and the network (e.g. radio links) is included here (also the network counter part) and not together with the base station site equipment. The dedicated transmission’s share of the CF for transmission and IP core network is about 2/3. Data centers: See description in next section about an average 3G (WCDMA) subscription, same principle is used for GSM but the amount of data traffic per subscription is much lower for GSM. The average mobile phone using GSM is based on the average mobile phone specified in table S6.4.1 in S6.4. Table S6.3.1. Network data for an average 2G (GSM) subscription
Base station
sites Control &
core nodes Operator activities
Transmission and IP core network1
3rd part Data centers
Typical power 2.1 W 0.1 W 0.3 W 0.2 W 0.04 W Annual electricity consumption
23 kWh 1 kWh 2.5 kWh 2.3 kWh 0.4 kWh
Annual operation CF… …w. Swedish electricity (0.06 kg CO2-eq /kWh)
1.4 kg CO2-eq 0.06 kg CO2-eq 0.2 kg CO2-eq 0.14 kg CO2-eq 0.024 kg CO2-eq
…w. Global electricity (0.6 kg CO2-eq /kWh)
14 kg CO2-eq 0.6 kg CO2-eq 2 kg CO2-eq 1.4 kg CO2-eq 0.24 kg CO2-eq
…Other energy CF 4.8 kg CO2-eq Manufacturing CF Life time 10-20 years 10-40 years Annually 10-40 years 5-10 years Annual manufacturing CF
3.5 kg CO2-eq 0.1 kg CO2-eq Not included 0.27 kg CO2-eq 0.034 kg CO2-eq
1 Includes also dedicated transmission links between the base station sites and the higher order transmission network. About 2/3 of the electricity consumption and manufacturing carbon footprint is related to this dedicated transmission and not to the core network.
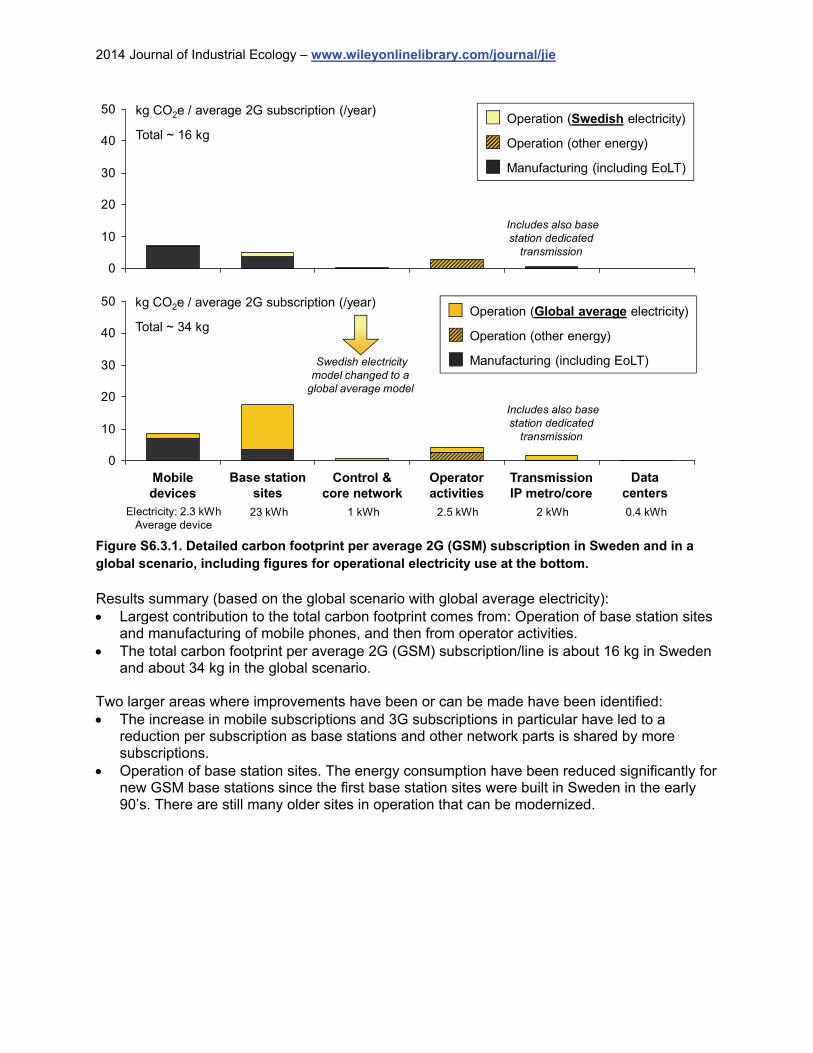
2014 Journal of Industrial Ecology – www.wileyonlinelibrary.com/journal/jie
0
10
20
30
40
50
TransmissionIP metro/core
Base stationsites
Mobiledevices
Operatoractivities
Datacenters
Control &core network
Operation (Swedish electricity)
Operation (other energy)
Manufacturing (including EoLT)
0
10
20
30
40
50Operation (Global average electricity)
Operation (other energy)
Manufacturing (including EoLT)
Includes also basestation dedicated
transmission
Includes also basestation dedicated
transmission
kg CO2e / average 2G subscription (/year)
Total ~ 16 kg
kg CO2e / average 2G subscription (/year)
Total ~ 34 kg
2 kWh23 kWh 2.5 kWh 0.4 kWh1 kWhElectricity: 2.3 kWhAverage device
Swedish electricitymodel changed to a
global average model
Figure S6.3.1. Detailed carbon footprint per average 2G (GSM) subscription in Sweden and in a global scenario, including figures for operational electricity use at the bottom.
Results summary (based on the global scenario with global average electricity): Largest contribution to the total carbon footprint comes from: Operation of base station sites
and manufacturing of mobile phones, and then from operator activities. The total carbon footprint per average 2G (GSM) subscription/line is about 16 kg in Sweden
and about 34 kg in the global scenario. Two larger areas where improvements have been or can be made have been identified: The increase in mobile subscriptions and 3G subscriptions in particular have led to a
reduction per subscription as base stations and other network parts is shared by more subscriptions.
Operation of base station sites. The energy consumption have been reduced significantly for new GSM base stations since the first base station sites were built in Sweden in the early 90’s. There are still many older sites in operation that can be modernized.
2014 Journal of Industrial Ecology – www.wileyonlinelibrary.com/journal/jie
S6.4: Detailed results for 3G (WCDMA) subscription According to PTS (2011) definitions there were about 6.4 million active 3G subscriptions in Sweden in 2010 with average data traffic of about 8.5 GB. User (mobile device) equipment: Based on an average mobile device specified in table S6.4.1. Supporting Information Appendix S2 describes how quantities and type of user equipment was estimated and how average manufacturing and electricity consumption data for user equipment have been estimated based on other studies, e.g. LCA studies. Ericsson has performed a number of LCAs of mobile phones over the years of which the latest published is Bergelin (2008). Base station sites: 3G subscribers (subscriptions) as defined by PTS can also access older 2G base stations for voice but also for data when no 3G coverage exist, therefore the average electricity consumption for base stations uses the combined 2G and 3G base station average, 23 kWh/subscription. The electricity consumption for 3G base stations divided by 3G subscriptions is about 19 kWh/subscription. Manufacturing data is from Ericsson (2010) and is based on an average base station site installed in Sweden prior to 2005. Control & core nodes: Core nodes shared by 2G and 3G have been allocated to each network based on internal experts at TeliaSonera. Manufacturing data is from Ericsson (2010) and is based on the average control and core node site installed in Sweden prior to 2005. Operator activities: Based on TeliaSonera’s operator activities (offices, stores, own cars, business travel) per average mobile subscription, including third party services and their car travel, see further Supporting Information Appendix S4. No manufacturing of buildings or vehicles or other infrastructure is included. Transmission and IP core network: Electricity consumption and manufacturing is based on the average transmission and IP core network and data traffic model developed for Sweden (Malmodin et al 2012), and the average data traffic (including voice) generated by an average 3G subscription, about 8.5 GB/year. Dedicated transmission between the base station and the network (e.g. radio links) is included here (also the network counter part) and not together with the base station site equipment. The dedicated transmission’s share of the CF for transmission and IP core network is about half of the total footprint. Data centers: Based on the external/open or “Internet” part of all data centers in Sweden (50% of all servers estimated). About 25% of all data center locations and data traffic is estimated to be international which is accounted for by using global average electricity emissions for this part, even when studying Sweden only. See also Supporting Information Appendix S4.
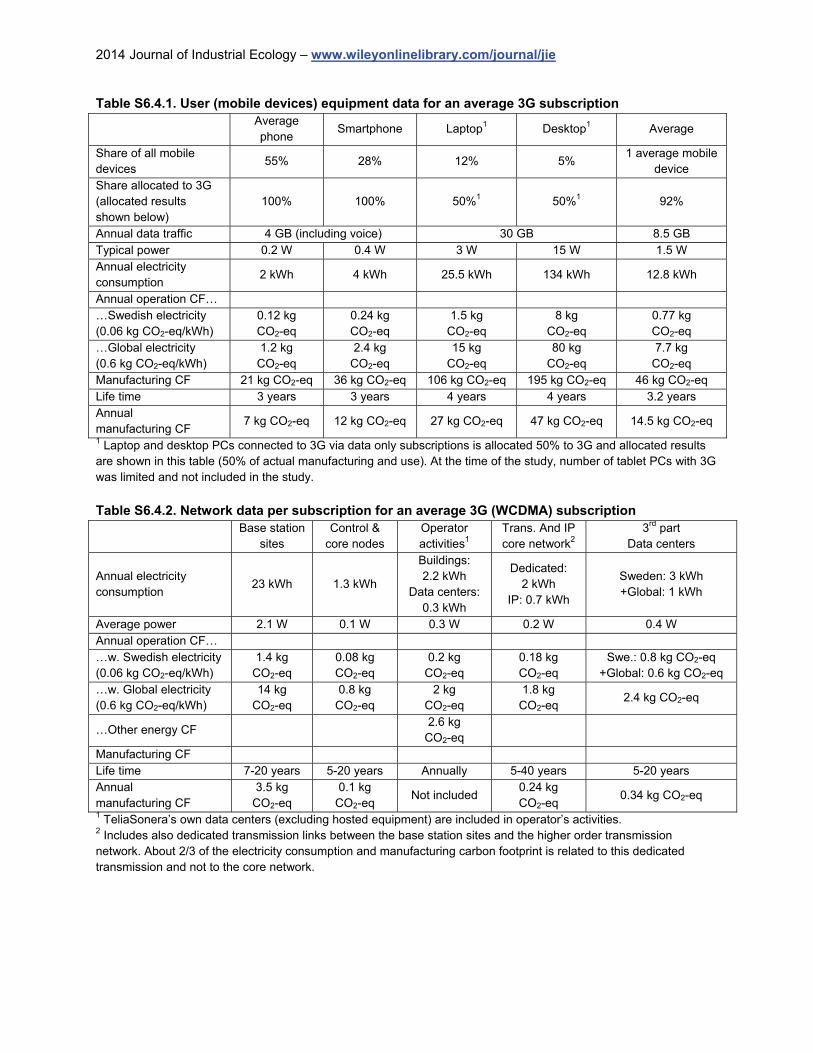
2014 Journal of Industrial Ecology – www.wileyonlinelibrary.com/journal/jie
Table S6.4.1. User (mobile devices) equipment data for an average 3G subscription
Average phone
Smartphone Laptop1 Desktop1 Average
Share of all mobile devices
55% 28% 12% 5% 1 average mobile
device Share allocated to 3G (allocated results shown below)
100% 100% 50%1 50%1 92%
Annual data traffic 4 GB (including voice) 30 GB 8.5 GB Typical power 0.2 W 0.4 W 3 W 15 W 1.5 W Annual electricity consumption
2 kWh 4 kWh 25.5 kWh 134 kWh 12.8 kWh
Annual operation CF… …Swedish electricity (0.06 kg CO2-eq/kWh)
0.12 kg CO2-eq
0.24 kg CO2-eq
1.5 kg CO2-eq
8 kg CO2-eq
0.77 kg CO2-eq
…Global electricity (0.6 kg CO2-eq/kWh)
1.2 kg CO2-eq
2.4 kg CO2-eq
15 kg CO2-eq
80 kg CO2-eq
7.7 kg CO2-eq
Manufacturing CF 21 kg CO2-eq 36 kg CO2-eq 106 kg CO2-eq 195 kg CO2-eq 46 kg CO2-eq Life time 3 years 3 years 4 years 4 years 3.2 years Annual manufacturing CF
7 kg CO2-eq 12 kg CO2-eq 27 kg CO2-eq 47 kg CO2-eq 14.5 kg CO2-eq
1 Laptop and desktop PCs connected to 3G via data only subscriptions is allocated 50% to 3G and allocated results are shown in this table (50% of actual manufacturing and use). At the time of the study, number of tablet PCs with 3G was limited and not included in the study.
Table S6.4.2. Network data per subscription for an average 3G (WCDMA) subscription
Base station
sites Control &
core nodes Operator activities1
Trans. And IP core network2
3rd part Data centers
Annual electricity consumption
23 kWh 1.3 kWh
Buildings: 2.2 kWh
Data centers:0.3 kWh
Dedicated: 2 kWh
IP: 0.7 kWh
Sweden: 3 kWh +Global: 1 kWh
Average power 2.1 W 0.1 W 0.3 W 0.2 W 0.4 W Annual operation CF… …w. Swedish electricity (0.06 kg CO2-eq/kWh)
1.4 kg CO2-eq
0.08 kg CO2-eq
0.2 kg CO2-eq
0.18 kg CO2-eq
Swe.: 0.8 kg CO2-eq +Global: 0.6 kg CO2-eq
…w. Global electricity (0.6 kg CO2-eq/kWh)
14 kg CO2-eq
0.8 kg CO2-eq
2 kg CO2-eq
1.8 kg CO2-eq
2.4 kg CO2-eq
…Other energy CF 2.6 kg
CO2-eq
Manufacturing CF Life time 7-20 years 5-20 years Annually 5-40 years 5-20 years Annual manufacturing CF
3.5 kg CO2-eq
0.1 kg CO2-eq
Not included 0.24 kg CO2-eq
0.34 kg CO2-eq
1 TeliaSonera’s own data centers (excluding hosted equipment) are included in operator’s activities. 2 Includes also dedicated transmission links between the base station sites and the higher order transmission network. About 2/3 of the electricity consumption and manufacturing carbon footprint is related to this dedicated transmission and not to the core network.
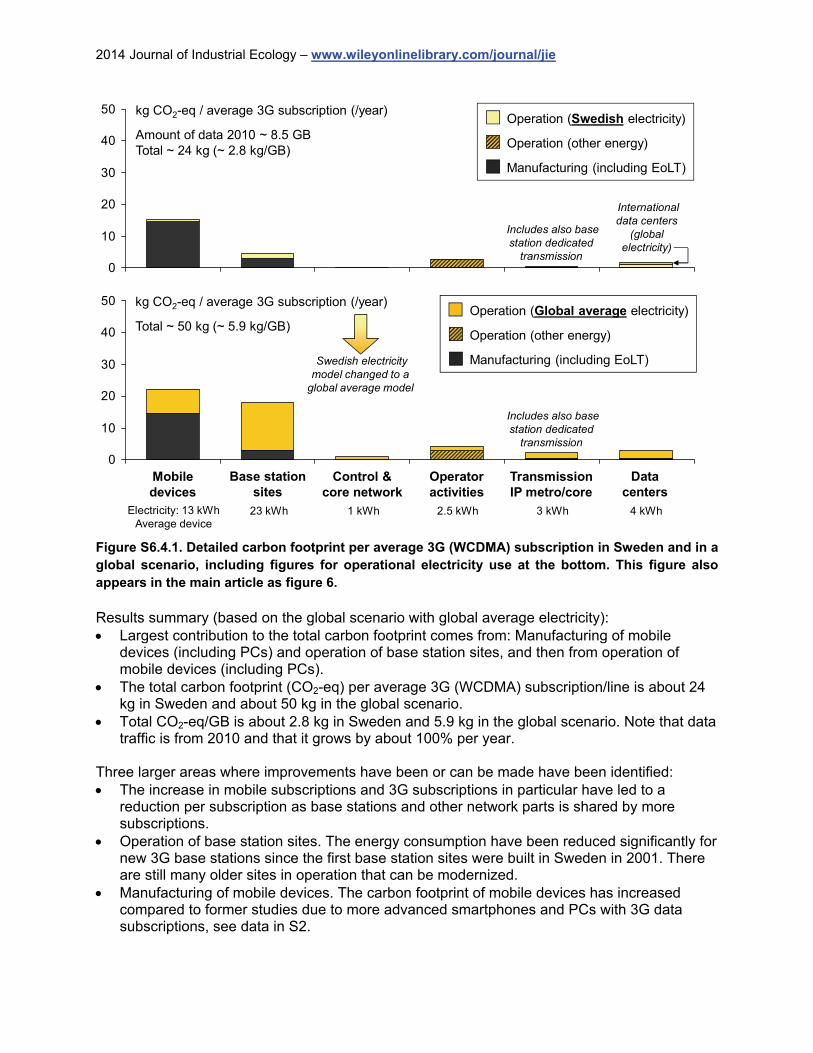
2014 Journal of Industrial Ecology – www.wileyonlinelibrary.com/journal/jie
0
10
20
30
40
50
TransmissionIP metro/core
Base stationsites
Mobiledevices
Operatoractivities
Datacenters
Control &core network
Operation (Swedish electricity)
Operation (other energy)
Manufacturing (including EoLT)
0
10
20
30
40
50Operation (Global average electricity)
Operation (other energy)
Manufacturing (including EoLT)
Includes also basestation dedicated
transmission
Includes also basestation dedicated
transmission
kg CO2-eq / average 3G subscription (/year)
Amount of data 2010 ~ 8.5 GBTotal ~ 24 kg (~ 2.8 kg/GB)
kg CO2-eq / average 3G subscription (/year)
Total ~ 50 kg (~ 5.9 kg/GB)
3 kWh23 kWh 2.5 kWh 4 kWh1 kWhElectricity: 13 kWhAverage device
Swedish electricitymodel changed to a
global average model
Internationaldata centers
(globalelectricity)
Figure S6.4.1. Detailed carbon footprint per average 3G (WCDMA) subscription in Sweden and in a global scenario, including figures for operational electricity use at the bottom. This figure also appears in the main article as figure 6.
Results summary (based on the global scenario with global average electricity): Largest contribution to the total carbon footprint comes from: Manufacturing of mobile
devices (including PCs) and operation of base station sites, and then from operation of mobile devices (including PCs).
The total carbon footprint (CO2-eq) per average 3G (WCDMA) subscription/line is about 24 kg in Sweden and about 50 kg in the global scenario.
Total CO2-eq/GB is about 2.8 kg in Sweden and 5.9 kg in the global scenario. Note that data traffic is from 2010 and that it grows by about 100% per year.
Three larger areas where improvements have been or can be made have been identified: The increase in mobile subscriptions and 3G subscriptions in particular have led to a
reduction per subscription as base stations and other network parts is shared by more subscriptions.
Operation of base station sites. The energy consumption have been reduced significantly for new 3G base stations since the first base station sites were built in Sweden in 2001. There are still many older sites in operation that can be modernized.
Manufacturing of mobile devices. The carbon footprint of mobile devices has increased compared to former studies due to more advanced smartphones and PCs with 3G data subscriptions, see data in S2.
2014 Journal of Industrial Ecology – www.wileyonlinelibrary.com/journal/jie
S6.5: Detailed results for xDSL subscription According to PTS (2010) there were about 1.7 million active xDSL subscriptions in Sweden on average in 2009 (mid year average). User PCs: Based on an average PC used in homes specified in table 7. Supporting Information Appendix S2 describes how quantities and type of user equipment was estimated and how average manufacturing and electricity consumption data for user equipment have been estimated based on other studies, e.g. LCA studies. According to Zimmerman (2009) about 1.5 PCs is in active use in an average Swedish household. The estimated life time is estimated to 4.25 years, slightly higher than the average 4 year life time for PCs in Sweden as home PCs is used longer than office PCs. CPE: Based on an average home modem and router setup with 1 modem and 0.5 routers. Both devices are estimated to consume about 80 kWh per year (9 W continuously), see further S2. 1 modem for 1 PC or 1 modem + 1 router for 2 PCs give the same average electricity consumption per PC. Manufacturing data for home modems and routers are taken from Malmodin et al (2010a). Access network (xDSL access line): The copper cable infrastructure is shared with a PSTN subscription, see description in S6.1. About 1.7 million physical PSTN lines are shared with xDSL broadband lines but no share of the embodied footprint has been subtracted (allocated to PSTN) and therefore a whole line (100%) is allocated to a xDSL broadband subscription. If this allocation would have been based on data, nearly 100% would in fact be allocated to xDSL broadband. Operator activities: Based on TeliaSonera’s operator activities (offices, stores, own cars, business travel) per average fixed subscription, including third party services and their car travel, see further Supporting Information Appendix S4. No manufacturing of buildings or vehicles or other infrastructure is included. Transmission and IP core network: Based on the average transmission and IP core network and data traffic model developed for Sweden (Malmodin et al 2012), and the average data traffic generated by an average xDSL subscription without IPTV, about 360 GB/year for an average broadband in Sweden excluding IPTV. Both operation of equipment and construction of the cable infrastructure are included. Data centers: Based on the estimated external/open or “Internet” part of all data centers in Sweden and abroad, and the data traffic amount described above. About 25% of all data center locations and data traffic is estimated to be international which is accounted for by using global average electricity emissions for this part, even when studying ICT in Sweden only. See also Supporting Information Appendix S4.
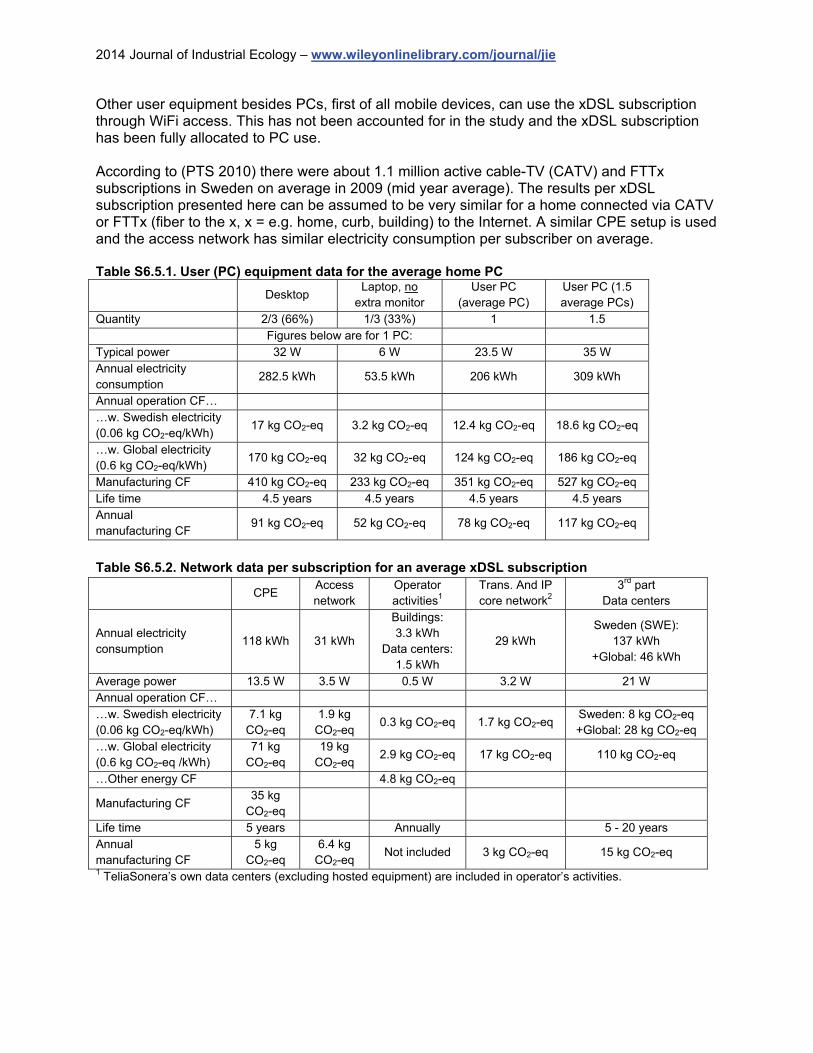
2014 Journal of Industrial Ecology – www.wileyonlinelibrary.com/journal/jie
Other user equipment besides PCs, first of all mobile devices, can use the xDSL subscription through WiFi access. This has not been accounted for in the study and the xDSL subscription has been fully allocated to PC use. According to (PTS 2010) there were about 1.1 million active cable-TV (CATV) and FTTx subscriptions in Sweden on average in 2009 (mid year average). The results per xDSL subscription presented here can be assumed to be very similar for a home connected via CATV or FTTx (fiber to the x, x = e.g. home, curb, building) to the Internet. A similar CPE setup is used and the access network has similar electricity consumption per subscriber on average. Table S6.5.1. User (PC) equipment data for the average home PC
Desktop Laptop, no
extra monitor User PC
(average PC) User PC (1.5 average PCs)
Quantity 2/3 (66%) 1/3 (33%) 1 1.5 Figures below are for 1 PC: Typical power 32 W 6 W 23.5 W 35 W Annual electricity consumption
282.5 kWh 53.5 kWh 206 kWh 309 kWh
Annual operation CF… …w. Swedish electricity (0.06 kg CO2-eq/kWh)
17 kg CO2-eq 3.2 kg CO2-eq 12.4 kg CO2-eq 18.6 kg CO2-eq
…w. Global electricity (0.6 kg CO2-eq/kWh)
170 kg CO2-eq 32 kg CO2-eq 124 kg CO2-eq 186 kg CO2-eq
Manufacturing CF 410 kg CO2-eq 233 kg CO2-eq 351 kg CO2-eq 527 kg CO2-eq Life time 4.5 years 4.5 years 4.5 years 4.5 years Annual manufacturing CF
91 kg CO2-eq 52 kg CO2-eq 78 kg CO2-eq 117 kg CO2-eq
Table S6.5.2. Network data per subscription for an average xDSL subscription
CPE Access network
Operator activities1
Trans. And IP core network2
3rd part Data centers
Annual electricity consumption
118 kWh 31 kWh
Buildings: 3.3 kWh
Data centers: 1.5 kWh
29 kWh Sweden (SWE):
137 kWh +Global: 46 kWh
Average power 13.5 W 3.5 W 0.5 W 3.2 W 21 W Annual operation CF… …w. Swedish electricity (0.06 kg CO2-eq/kWh)
7.1 kg CO2-eq
1.9 kg CO2-eq
0.3 kg CO2-eq 1.7 kg CO2-eq Sweden: 8 kg CO2-eq +Global: 28 kg CO2-eq
…w. Global electricity (0.6 kg CO2-eq /kWh)
71 kg CO2-eq
19 kg CO2-eq
2.9 kg CO2-eq 17 kg CO2-eq 110 kg CO2-eq
…Other energy CF 4.8 kg CO2-eq
Manufacturing CF 35 kg
CO2-eq
Life time 5 years Annually 5 - 20 years Annual manufacturing CF
5 kg CO2-eq
6.4 kg CO2-eq
Not included 3 kg CO2-eq 15 kg CO2-eq
1 TeliaSonera’s own data centers (excluding hosted equipment) are included in operator’s activities.
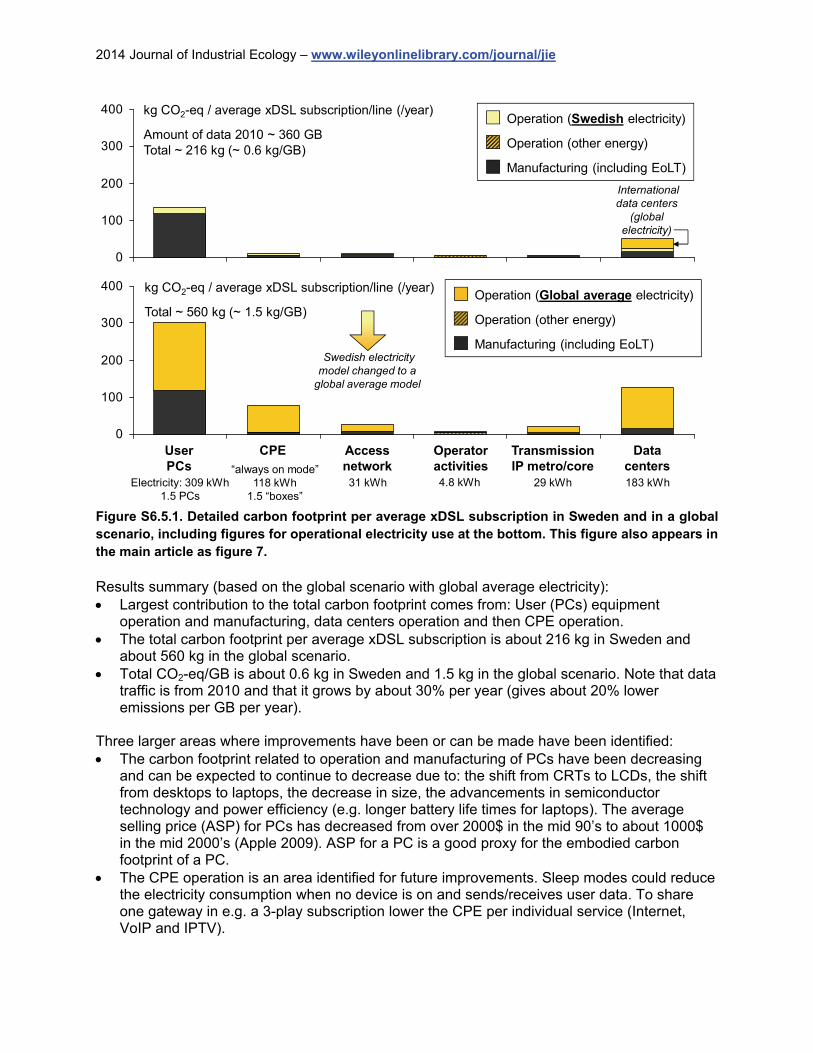
2014 Journal of Industrial Ecology – www.wileyonlinelibrary.com/journal/jie
0
100
200
300
400
TransmissionIP metro/core
CPEUserPCs
Operatoractivities
Datacenters
Accessnetwork
Operation (Global average electricity)
Operation (other energy)
Manufacturing (including EoLT)
kg CO2-eq / average xDSL subscription/line (/year)
Total ~ 560 kg (~ 1.5 kg/GB)
“always on mode”118 kWh
1.5 “boxes”31 kWhElectricity: 309 kWh
1.5 PCs29 kWh 183 kWh
0
100
200
300
400 kg CO2-eq / average xDSL subscription/line (/year)
Amount of data 2010 ~ 360 GBTotal ~ 216 kg (~ 0.6 kg/GB)
Operation (Swedish electricity)
Operation (other energy)
Manufacturing (including EoLT)
4.8 kWh
Swedish electricitymodel changed to a
global average model
Internationaldata centers
(globalelectricity)
Figure S6.5.1. Detailed carbon footprint per average xDSL subscription in Sweden and in a global scenario, including figures for operational electricity use at the bottom. This figure also appears in the main article as figure 7.
Results summary (based on the global scenario with global average electricity): Largest contribution to the total carbon footprint comes from: User (PCs) equipment
operation and manufacturing, data centers operation and then CPE operation. The total carbon footprint per average xDSL subscription is about 216 kg in Sweden and
about 560 kg in the global scenario. Total CO2-eq/GB is about 0.6 kg in Sweden and 1.5 kg in the global scenario. Note that data
traffic is from 2010 and that it grows by about 30% per year (gives about 20% lower emissions per GB per year).
Three larger areas where improvements have been or can be made have been identified: The carbon footprint related to operation and manufacturing of PCs have been decreasing
and can be expected to continue to decrease due to: the shift from CRTs to LCDs, the shift from desktops to laptops, the decrease in size, the advancements in semiconductor technology and power efficiency (e.g. longer battery life times for laptops). The average selling price (ASP) for PCs has decreased from over 2000$ in the mid 90’s to about 1000$ in the mid 2000’s (Apple 2009). ASP for a PC is a good proxy for the embodied carbon footprint of a PC.
The CPE operation is an area identified for future improvements. Sleep modes could reduce the electricity consumption when no device is on and sends/receives user data. To share one gateway in e.g. a 3-play subscription lower the CPE per individual service (Internet, VoIP and IPTV).
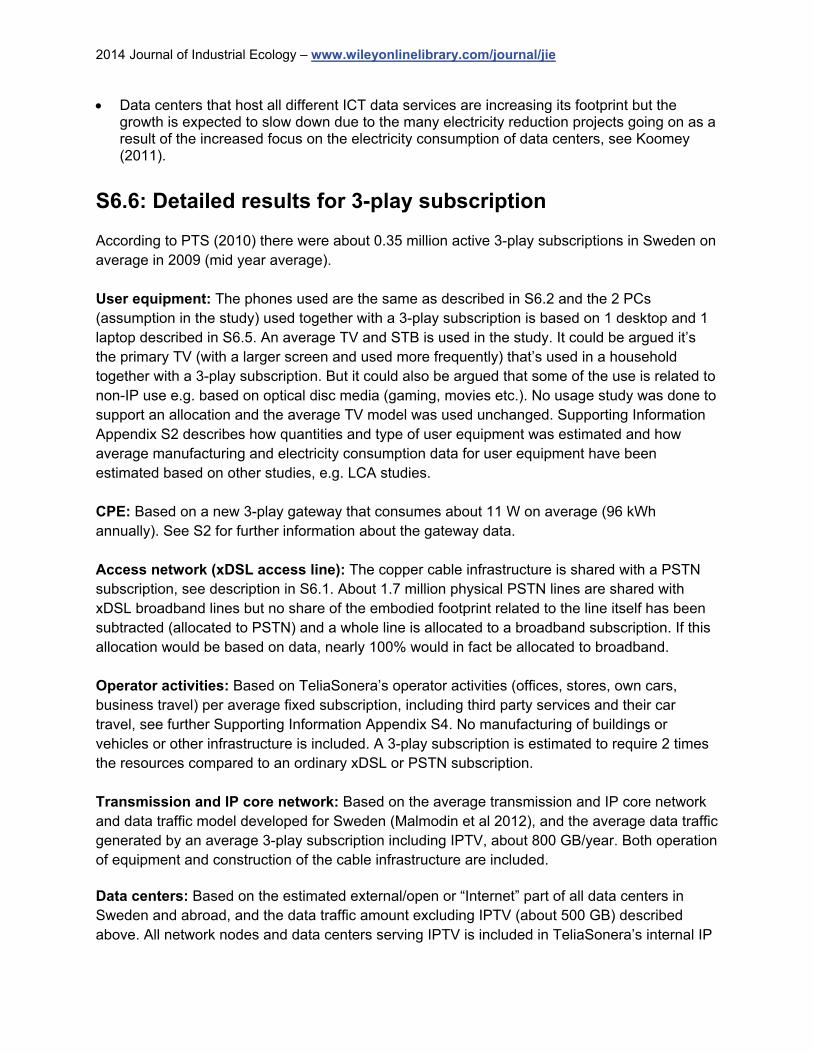
2014 Journal of Industrial Ecology – www.wileyonlinelibrary.com/journal/jie
Data centers that host all different ICT data services are increasing its footprint but the growth is expected to slow down due to the many electricity reduction projects going on as a result of the increased focus on the electricity consumption of data centers, see Koomey (2011).
S6.6: Detailed results for 3-play subscription According to PTS (2010) there were about 0.35 million active 3-play subscriptions in Sweden on average in 2009 (mid year average). User equipment: The phones used are the same as described in S6.2 and the 2 PCs (assumption in the study) used together with a 3-play subscription is based on 1 desktop and 1 laptop described in S6.5. An average TV and STB is used in the study. It could be argued it’s the primary TV (with a larger screen and used more frequently) that’s used in a household together with a 3-play subscription. But it could also be argued that some of the use is related to non-IP use e.g. based on optical disc media (gaming, movies etc.). No usage study was done to support an allocation and the average TV model was used unchanged. Supporting Information Appendix S2 describes how quantities and type of user equipment was estimated and how average manufacturing and electricity consumption data for user equipment have been estimated based on other studies, e.g. LCA studies. CPE: Based on a new 3-play gateway that consumes about 11 W on average (96 kWh annually). See S2 for further information about the gateway data. Access network (xDSL access line): The copper cable infrastructure is shared with a PSTN subscription, see description in S6.1. About 1.7 million physical PSTN lines are shared with xDSL broadband lines but no share of the embodied footprint related to the line itself has been subtracted (allocated to PSTN) and a whole line is allocated to a broadband subscription. If this allocation would be based on data, nearly 100% would in fact be allocated to broadband. Operator activities: Based on TeliaSonera’s operator activities (offices, stores, own cars, business travel) per average fixed subscription, including third party services and their car travel, see further Supporting Information Appendix S4. No manufacturing of buildings or vehicles or other infrastructure is included. A 3-play subscription is estimated to require 2 times the resources compared to an ordinary xDSL or PSTN subscription. Transmission and IP core network: Based on the average transmission and IP core network and data traffic model developed for Sweden (Malmodin et al 2012), and the average data traffic generated by an average 3-play subscription including IPTV, about 800 GB/year. Both operation of equipment and construction of the cable infrastructure are included. Data centers: Based on the estimated external/open or “Internet” part of all data centers in Sweden and abroad, and the data traffic amount excluding IPTV (about 500 GB) described above. All network nodes and data centers serving IPTV is included in TeliaSonera’s internal IP
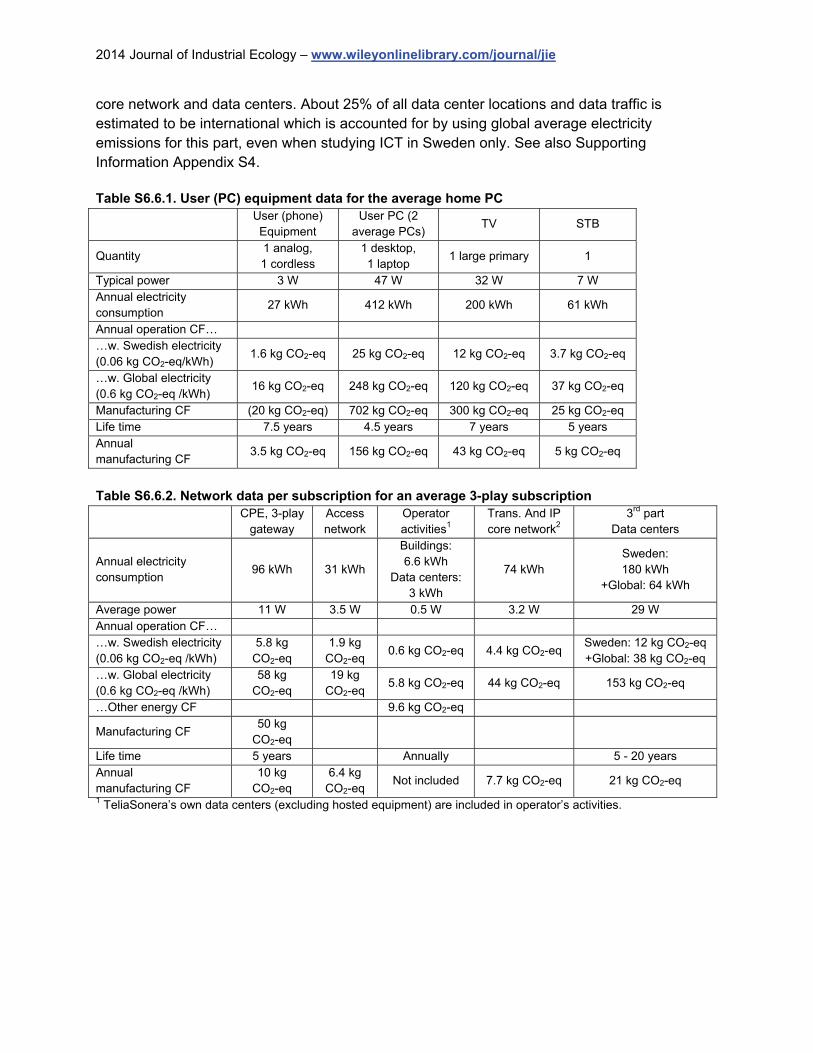
2014 Journal of Industrial Ecology – www.wileyonlinelibrary.com/journal/jie
core network and data centers. About 25% of all data center locations and data traffic is estimated to be international which is accounted for by using global average electricity emissions for this part, even when studying ICT in Sweden only. See also Supporting Information Appendix S4. Table S6.6.1. User (PC) equipment data for the average home PC
User (phone) Equipment
User PC (2 average PCs)
TV STB
Quantity 1 analog, 1 cordless
1 desktop, 1 laptop
1 large primary 1
Typical power 3 W 47 W 32 W 7 W Annual electricity consumption
27 kWh 412 kWh 200 kWh 61 kWh
Annual operation CF… …w. Swedish electricity (0.06 kg CO2-eq/kWh)
1.6 kg CO2-eq 25 kg CO2-eq 12 kg CO2-eq 3.7 kg CO2-eq
…w. Global electricity (0.6 kg CO2-eq /kWh)
16 kg CO2-eq 248 kg CO2-eq 120 kg CO2-eq 37 kg CO2-eq
Manufacturing CF (20 kg CO2-eq) 702 kg CO2-eq 300 kg CO2-eq 25 kg CO2-eq Life time 7.5 years 4.5 years 7 years 5 years Annual manufacturing CF
3.5 kg CO2-eq 156 kg CO2-eq 43 kg CO2-eq 5 kg CO2-eq
Table S6.6.2. Network data per subscription for an average 3-play subscription
CPE, 3-play
gateway Access network
Operator activities1
Trans. And IP core network2
3rd part Data centers
Annual electricity consumption
96 kWh 31 kWh
Buildings: 6.6 kWh
Data centers: 3 kWh
74 kWh Sweden: 180 kWh
+Global: 64 kWh
Average power 11 W 3.5 W 0.5 W 3.2 W 29 W Annual operation CF… …w. Swedish electricity (0.06 kg CO2-eq /kWh)
5.8 kg CO2-eq
1.9 kg CO2-eq
0.6 kg CO2-eq 4.4 kg CO2-eq Sweden: 12 kg CO2-eq +Global: 38 kg CO2-eq
…w. Global electricity (0.6 kg CO2-eq /kWh)
58 kg CO2-eq
19 kg CO2-eq
5.8 kg CO2-eq 44 kg CO2-eq 153 kg CO2-eq
…Other energy CF 9.6 kg CO2-eq
Manufacturing CF 50 kg
CO2-eq
Life time 5 years Annually 5 - 20 years Annual manufacturing CF
10 kg CO2-eq
6.4 kg CO2-eq
Not included 7.7 kg CO2-eq 21 kg CO2-eq
1 TeliaSonera’s own data centers (excluding hosted equipment) are included in operator’s activities.
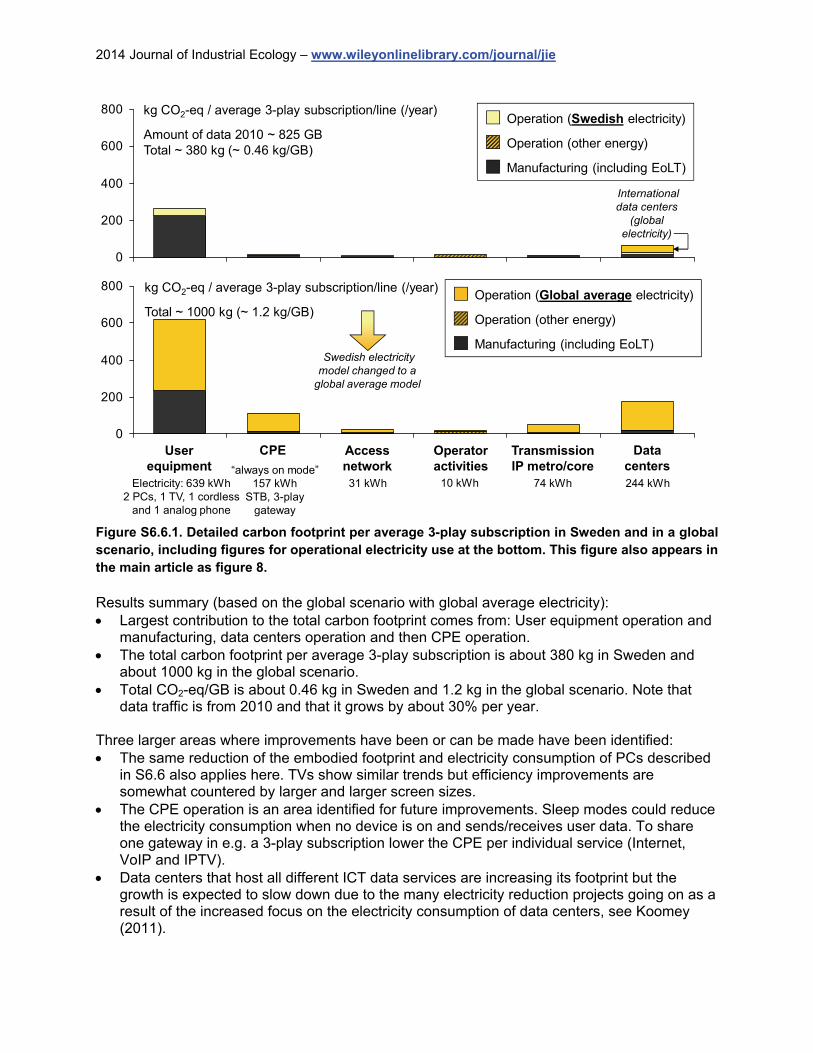
2014 Journal of Industrial Ecology – www.wileyonlinelibrary.com/journal/jie
0
200
400
600
800
TransmissionIP metro/core
CPEUserequipment
Operatoractivities
Datacenters
Accessnetwork
Operation (Global average electricity)
Operation (other energy)
Manufacturing (including EoLT)
kg CO2-eq / average 3-play subscription/line (/year)
Total ~ 1000 kg (~ 1.2 kg/GB)
“always on mode”157 kWh
STB, 3-playgateway
31 kWhElectricity: 639 kWh2 PCs, 1 TV, 1 cordless
and 1 analog phone
74 kWh 244 kWh
0
200
400
600
800 kg CO2-eq / average 3-play subscription/line (/year)
Amount of data 2010 ~ 825 GBTotal ~ 380 kg (~ 0.46 kg/GB)
Operation (Swedish electricity)
Operation (other energy)
Manufacturing (including EoLT)
10 kWh
Swedish electricitymodel changed to a
global average model
Internationaldata centers
(globalelectricity)
Figure S6.6.1. Detailed carbon footprint per average 3-play subscription in Sweden and in a global scenario, including figures for operational electricity use at the bottom. This figure also appears in the main article as figure 8.
Results summary (based on the global scenario with global average electricity): Largest contribution to the total carbon footprint comes from: User equipment operation and
manufacturing, data centers operation and then CPE operation. The total carbon footprint per average 3-play subscription is about 380 kg in Sweden and
about 1000 kg in the global scenario. Total CO2-eq/GB is about 0.46 kg in Sweden and 1.2 kg in the global scenario. Note that
data traffic is from 2010 and that it grows by about 30% per year. Three larger areas where improvements have been or can be made have been identified: The same reduction of the embodied footprint and electricity consumption of PCs described
in S6.6 also applies here. TVs show similar trends but efficiency improvements are somewhat countered by larger and larger screen sizes.
The CPE operation is an area identified for future improvements. Sleep modes could reduce the electricity consumption when no device is on and sends/receives user data. To share one gateway in e.g. a 3-play subscription lower the CPE per individual service (Internet, VoIP and IPTV).
Data centers that host all different ICT data services are increasing its footprint but the growth is expected to slow down due to the many electricity reduction projects going on as a result of the increased focus on the electricity consumption of data centers, see Koomey (2011).
2014 Journal of Industrial Ecology – www.wileyonlinelibrary.com/journal/jie
S6.7: Detailed results for workplace PC Number of workplace PCs have been estimated to about 2.1 million in Sweden in 2010. Workplace PCs: The average workplace PC is based on desktops (50%) and laptops (50%) including extra monitors and docking stations. The share of laptops is increasing and about 2/3 of all PCs sold in Sweden in 2010 was laptops. The estimated life time is estimated to 3.5 years, a bit lower than the average 4 year life time for PCs in Sweden as office PCs is used shorter than home PCs. CPE: The term CPE is usually used for residential equipment but here used for office equipment and includes printers and copiers (largest share of CPE electricity consumption), projectors and video- and teleconference equipment. Based on internal studies at TeliaSonera and Ericsson, the electricity consumption of workplace CPE has been reduced substantially and is today only about 1/3 per workplace PC compared to about 10 years ago. LAN: LAN equipment includes all access switches/routers and aggregation switches/routers and all network cables. Total electricity consumption of all equipment per active workplace PC is based on internal studies at TeliaSonera and Ericsson. Service provider activities: Can be both in-house or sourced from a third party (more common today) but they are not included in this study. Transmission and IP core network: Based on the average transmission and IP core network and data traffic model developed for Sweden (Malmodin et al 2012), and the average data traffic generated by an average LAN or workplace PC on the external IP core network, about 100 GB/year. Both operation of equipment and construction of the cable infrastructure are included. All internal LAN data traffic is included in the LAN part above (third bullet). Data centers: Based also on the estimated external/open or “Internet” part of all data centers in Sweden and abroad, and the WAN data traffic amount (100 GB) described above. About 25% of all data center locations and data traffic is estimated to be international which is accounted for by using global average electricity emissions for this part, even when studying ICT in Sweden only. See also Supporting Information Appendix S4.
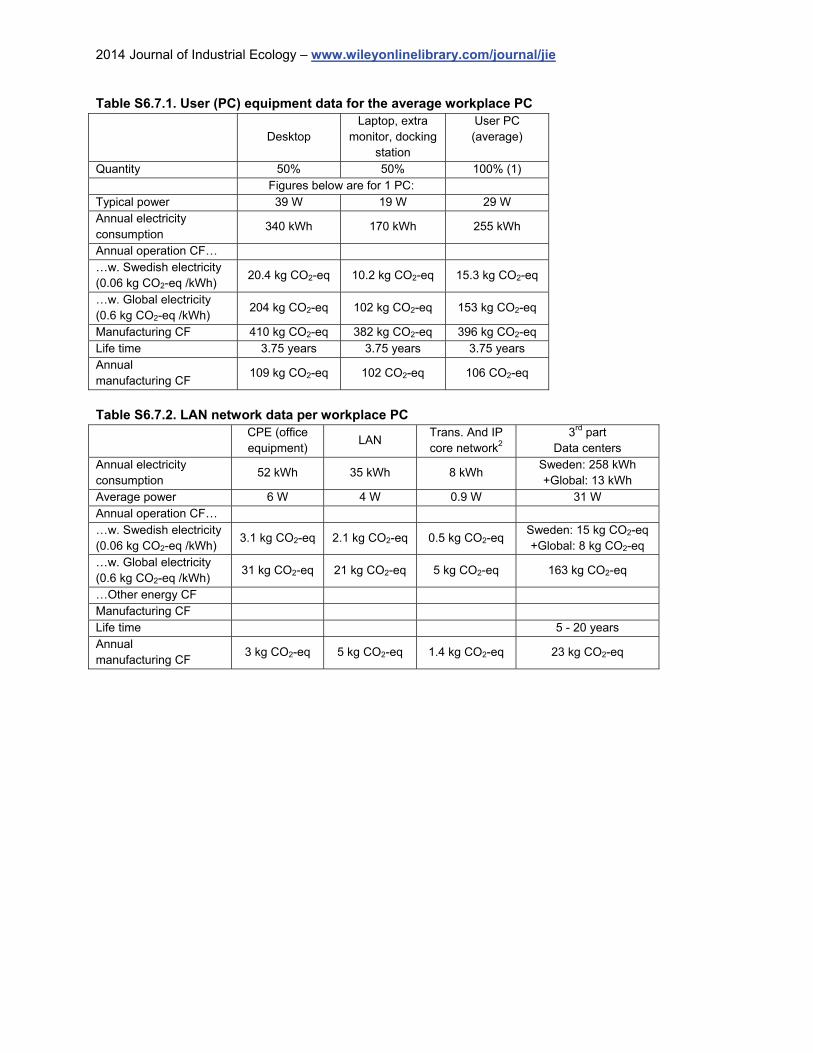
2014 Journal of Industrial Ecology – www.wileyonlinelibrary.com/journal/jie
Table S6.7.1. User (PC) equipment data for the average workplace PC
Desktop Laptop, extra
monitor, docking station
User PC (average)
Quantity 50% 50% 100% (1) Figures below are for 1 PC: Typical power 39 W 19 W 29 W Annual electricity consumption
340 kWh 170 kWh 255 kWh
Annual operation CF… …w. Swedish electricity (0.06 kg CO2-eq /kWh)
20.4 kg CO2-eq 10.2 kg CO2-eq 15.3 kg CO2-eq
…w. Global electricity (0.6 kg CO2-eq /kWh)
204 kg CO2-eq 102 kg CO2-eq 153 kg CO2-eq
Manufacturing CF 410 kg CO2-eq 382 kg CO2-eq 396 kg CO2-eq Life time 3.75 years 3.75 years 3.75 years Annual manufacturing CF
109 kg CO2-eq 102 CO2-eq 106 CO2-eq
Table S6.7.2. LAN network data per workplace PC
CPE (office equipment)
LAN Trans. And IP core network2
3rd part Data centers
Annual electricity consumption
52 kWh 35 kWh 8 kWh Sweden: 258 kWh +Global: 13 kWh
Average power 6 W 4 W 0.9 W 31 W Annual operation CF… …w. Swedish electricity (0.06 kg CO2-eq /kWh)
3.1 kg CO2-eq 2.1 kg CO2-eq 0.5 kg CO2-eq Sweden: 15 kg CO2-eq +Global: 8 kg CO2-eq
…w. Global electricity (0.6 kg CO2-eq /kWh)
31 kg CO2-eq 21 kg CO2-eq 5 kg CO2-eq 163 kg CO2-eq
…Other energy CF Manufacturing CF Life time 5 - 20 years Annual manufacturing CF
3 kg CO2-eq 5 kg CO2-eq 1.4 kg CO2-eq 23 kg CO2-eq
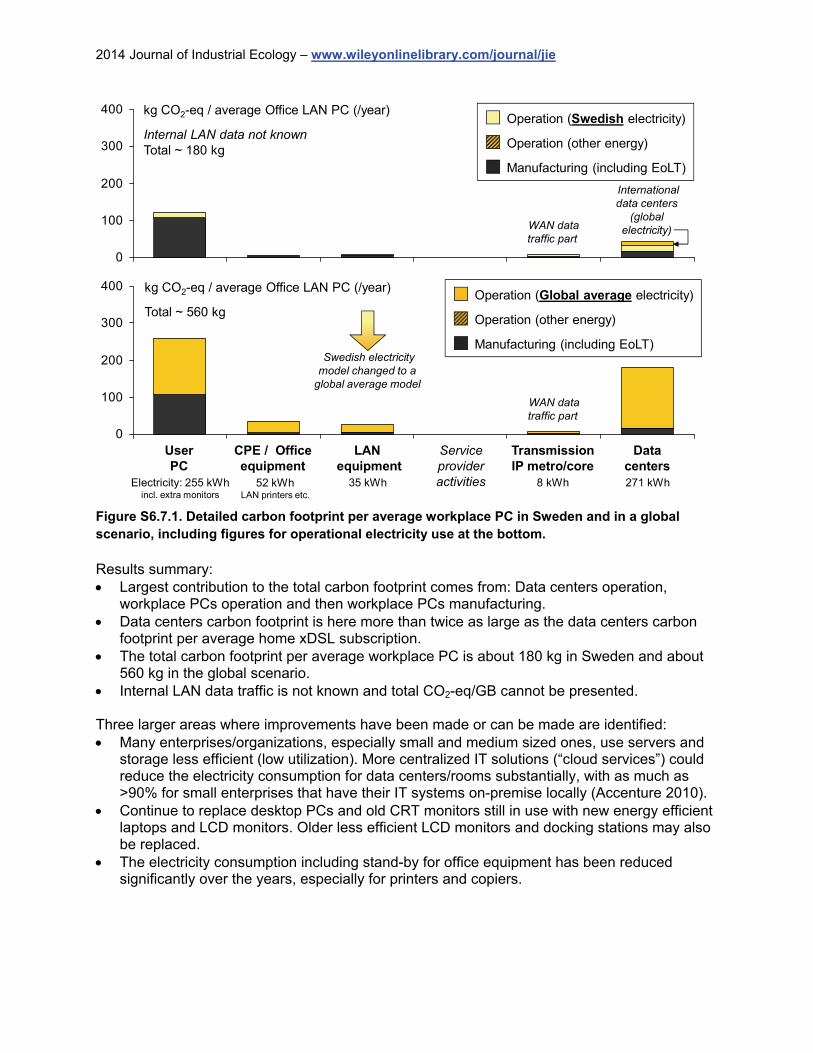
2014 Journal of Industrial Ecology – www.wileyonlinelibrary.com/journal/jie
0
100
200
300
400
TransmissionIP metro/core
CPE / Officeequipment
UserPC
Serviceprovideractivities
Datacenters
LANequipment
Operation (Global average electricity)
Operation (other energy)
Manufacturing (including EoLT)
35 kWhElectricity: 255 kWhincl. extra monitors
8 kWh 271 kWh
0
100
200
300
400Operation (Swedish electricity)
Operation (other energy)
Manufacturing (including EoLT)
kg CO2-eq / average Office LAN PC (/year)
Total ~ 560 kg
kg CO2-eq / average Office LAN PC (/year)
Internal LAN data not knownTotal ~ 180 kg
52 kWhLAN printers etc.
WAN datatraffic part
WAN datatraffic part
Swedish electricitymodel changed to a
global average model
Internationaldata centers
(globalelectricity)
Figure S6.7.1. Detailed carbon footprint per average workplace PC in Sweden and in a global scenario, including figures for operational electricity use at the bottom.
Results summary: Largest contribution to the total carbon footprint comes from: Data centers operation,
workplace PCs operation and then workplace PCs manufacturing. Data centers carbon footprint is here more than twice as large as the data centers carbon
footprint per average home xDSL subscription. The total carbon footprint per average workplace PC is about 180 kg in Sweden and about
560 kg in the global scenario. Internal LAN data traffic is not known and total CO2-eq/GB cannot be presented. Three larger areas where improvements have been made or can be made are identified: Many enterprises/organizations, especially small and medium sized ones, use servers and
storage less efficient (low utilization). More centralized IT solutions (“cloud services”) could reduce the electricity consumption for data centers/rooms substantially, with as much as >90% for small enterprises that have their IT systems on-premise locally (Accenture 2010).
Continue to replace desktop PCs and old CRT monitors still in use with new energy efficient laptops and LCD monitors. Older less efficient LCD monitors and docking stations may also be replaced.
The electricity consumption including stand-by for office equipment has been reduced significantly over the years, especially for printers and copiers.
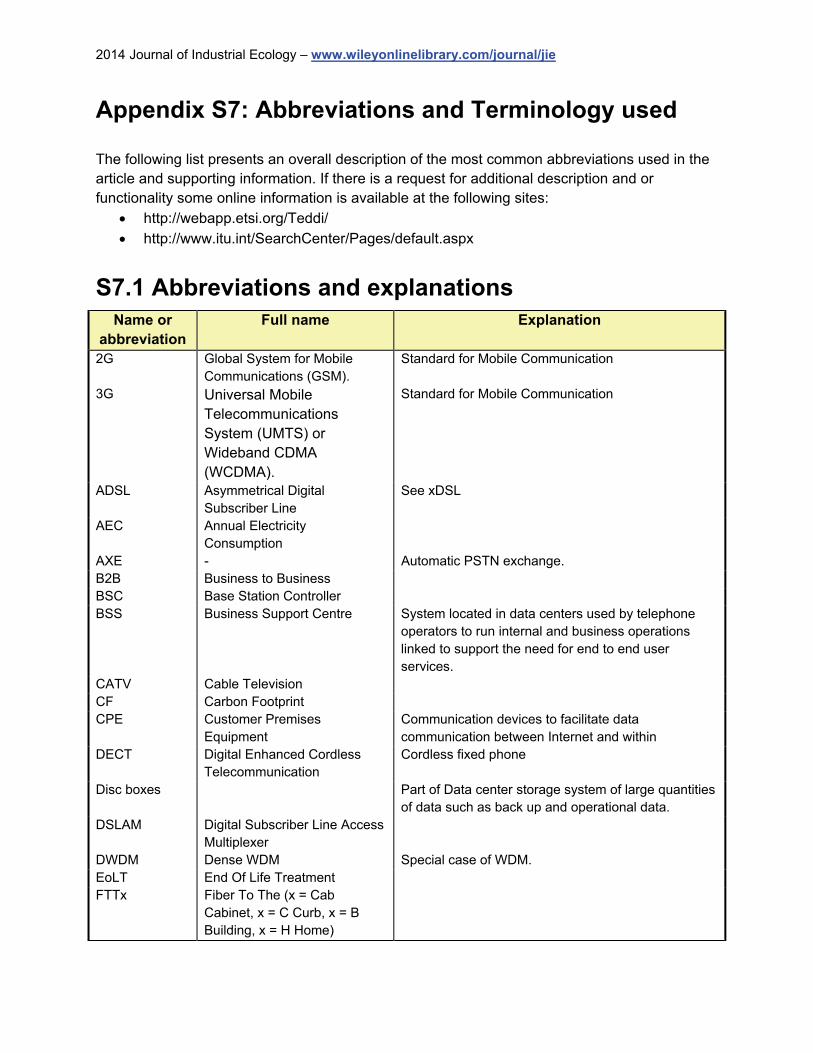
2014 Journal of Industrial Ecology – www.wileyonlinelibrary.com/journal/jie
Appendix S7: Abbreviations and Terminology used The following list presents an overall description of the most common abbreviations used in the article and supporting information. If there is a request for additional description and or functionality some online information is available at the following sites:
http://webapp.etsi.org/Teddi/ http://www.itu.int/SearchCenter/Pages/default.aspx
S7.1 Abbreviations and explanations Name or
abbreviation Full name Explanation
2G Global System for Mobile Communications (GSM).
Standard for Mobile Communication
3G Universal Mobile Telecommunications System (UMTS) or Wideband CDMA (WCDMA).
Standard for Mobile Communication
ADSL Asymmetrical Digital Subscriber Line
See xDSL
AEC Annual Electricity Consumption
AXE - Automatic PSTN exchange. B2B Business to Business BSC Base Station Controller BSS Business Support Centre System located in data centers used by telephone
operators to run internal and business operations linked to support the need for end to end user services.
CATV Cable Television CF Carbon Footprint CPE Customer Premises
Equipment Communication devices to facilitate data communication between Internet and within
DECT Digital Enhanced Cordless Telecommunication
Cordless fixed phone
Disc boxes Part of Data center storage system of large quantities of data such as back up and operational data.
DSLAM Digital Subscriber Line Access Multiplexer
DWDM Dense WDM Special case of WDM. EoLT End Of Life Treatment FTTx Fiber To The (x = Cab
Cabinet, x = C Curb, x = B Building, x = H Home)
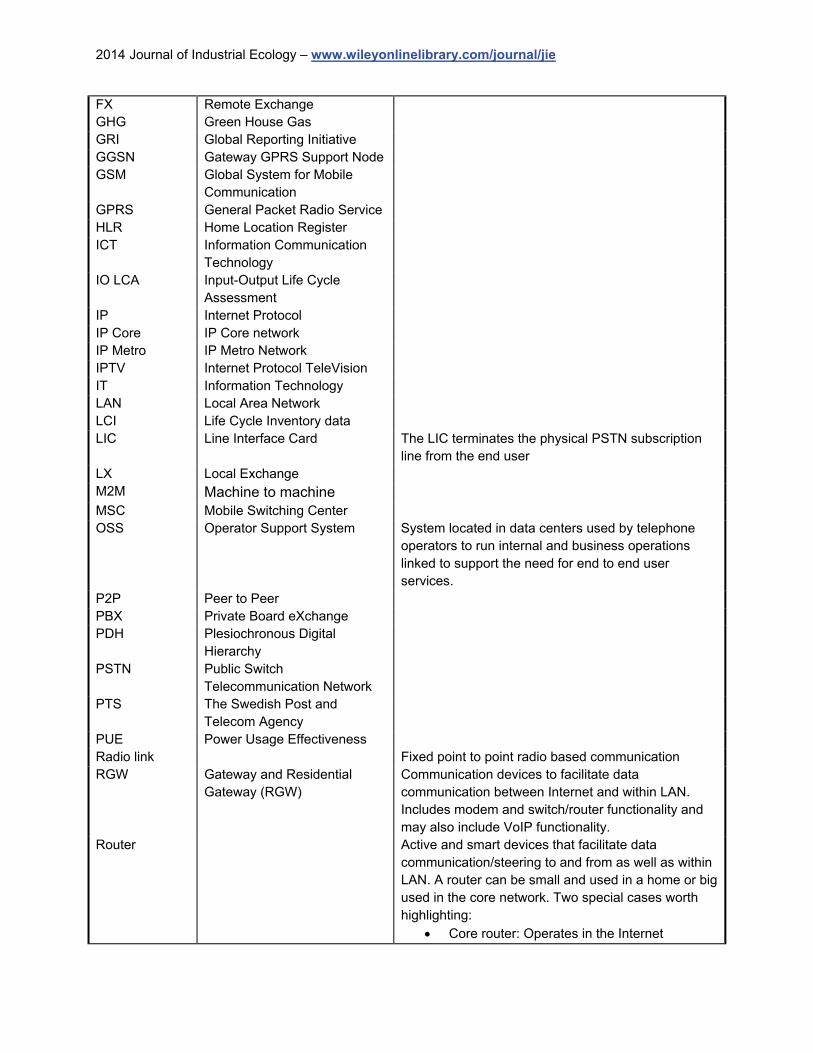
2014 Journal of Industrial Ecology – www.wileyonlinelibrary.com/journal/jie
FX Remote Exchange GHG Green House Gas GRI Global Reporting Initiative GGSN Gateway GPRS Support Node GSM Global System for Mobile
Communication
GPRS General Packet Radio Service HLR Home Location Register ICT Information Communication
Technology
IO LCA Input-Output Life Cycle Assessment
IP Internet Protocol IP Core IP Core network IP Metro IP Metro Network IPTV Internet Protocol TeleVision IT Information Technology LAN Local Area Network LCI Life Cycle Inventory data LIC Line Interface Card The LIC terminates the physical PSTN subscription
line from the end user LX Local Exchange M2M Machine to machine
MSC Mobile Switching Center OSS Operator Support System System located in data centers used by telephone
operators to run internal and business operations linked to support the need for end to end user services.
P2P Peer to Peer PBX Private Board eXchange PDH Plesiochronous Digital
Hierarchy
PSTN Public Switch Telecommunication Network
PTS The Swedish Post and Telecom Agency
PUE Power Usage Effectiveness Radio link Fixed point to point radio based communication RGW Gateway and Residential
Gateway (RGW) Communication devices to facilitate data communication between Internet and within LAN. Includes modem and switch/router functionality and may also include VoIP functionality.
Router Active and smart devices that facilitate data communication/steering to and from as well as within LAN. A router can be small and used in a home or big used in the core network. Two special cases worth highlighting:
Core router: Operates in the Internet
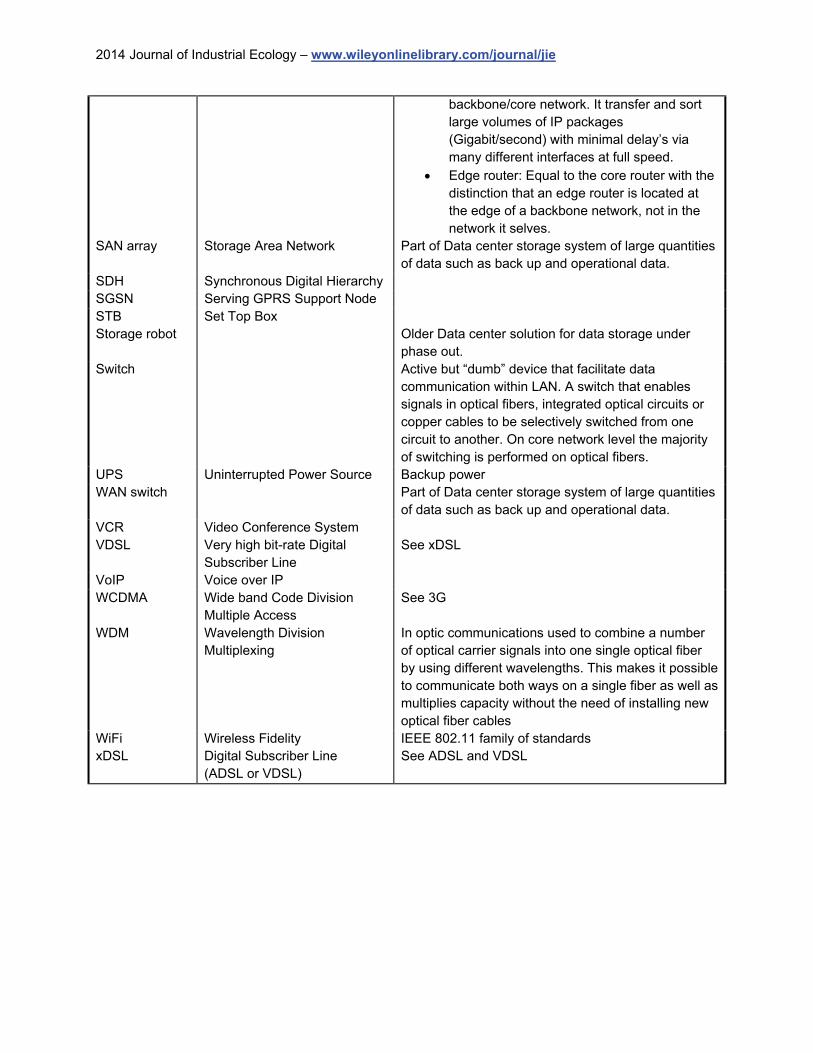
2014 Journal of Industrial Ecology – www.wileyonlinelibrary.com/journal/jie
backbone/core network. It transfer and sort large volumes of IP packages (Gigabit/second) with minimal delay’s via many different interfaces at full speed.
Edge router: Equal to the core router with the distinction that an edge router is located at the edge of a backbone network, not in the network it selves.
SAN array Storage Area Network Part of Data center storage system of large quantities of data such as back up and operational data.
SDH Synchronous Digital Hierarchy SGSN Serving GPRS Support Node STB Set Top Box Storage robot Older Data center solution for data storage under
phase out. Switch Active but “dumb” device that facilitate data
communication within LAN. A switch that enables signals in optical fibers, integrated optical circuits or copper cables to be selectively switched from one circuit to another. On core network level the majority of switching is performed on optical fibers.
UPS Uninterrupted Power Source Backup power WAN switch Part of Data center storage system of large quantities
of data such as back up and operational data. VCR Video Conference System VDSL Very high bit-rate Digital
Subscriber Line See xDSL
VoIP Voice over IP WCDMA Wide band Code Division
Multiple Access See 3G
WDM Wavelength Division Multiplexing
In optic communications used to combine a number of optical carrier signals into one single optical fiber by using different wavelengths. This makes it possible to communicate both ways on a single fiber as well as multiplies capacity without the need of installing new optical fiber cables
WiFi Wireless Fidelity IEEE 802.11 family of standards xDSL Digital Subscriber Line
(ADSL or VDSL) See ADSL and VDSL
2014 Journal of Industrial Ecology – www.wileyonlinelibrary.com/journal/jie
References in Supporting Information Accenture. 2010. Cloud Computing and Sustainability: The Environmental Benefits of Moving to
the Cloud. Alcatel, 2008. Life cycle assessment of GPON and DSL technologies for broadband access,
RDC environment report, September 2008. Apple. 2008-2012. LCA studies of PCs, monitors and mobile phones verified by The Fraunhofer
Institute, Germany. http://www.apple.com/environment/resources/environmentalperformance.html.
Apple. 2009. Mac sales projected to grow 26% in 2010, outpacing PC market. Apple Insider:
http://appleinsider.com/articles/09/12/03/mac_sales_projected_to_grow_26_in_2010_outpacing_pc_market
Atlantic consulting and IPU. 1998. LCA study of the product group personal computers in the
EU ecolabel scheme. Baliga et al 2009, Energy Consumption in Optical IP Networks. IEEE. Journal of Lightwave
Technology. Volume 27, issue 13: http://ieeexplore.ieee.org/xpl/login.jsp?tp=&arnumber=4815495&url=http%3A%2F%2Fieeexplore.ieee.org%2Fiel5%2F50%2F5133707%2F04815495.pdf%3Farnumber%3D4815495
Bergelin, F. 2008. Life cycle assessment of a mobile phone - a model on manufacturing, using
and recycling. MSc thesis, Ericsson Research and Uppsala University. ISSN: 14-5773, UPTEC Q08014. 2008
Coroama, V., L. Hilty, E. Heiri, F. Horn. 2013. The direct Energy Demand of Internet Data
Flows. Journal of Industrial Ecology 17(5):680-688. Dell. 2010a. Carbon Footprint of a Typical Business Laptop From Dell
http://i.dell.com/sites/content/corporate/corp-comm/en/Documents/dell-laptop-carbon-footprint-whitepaper.pdf. Accessed in September 2010
Dell. 2010b. Carbon Footprint of a Typical Business Desktop From Dell:
http://i.dell.com/sites/doccontent/corporate/corp-comm/en/Documents/dell-desktop-carbon-footprint-whitepaper.pdf. Accessed in September 2010
Della Croce F. and O. Jolliet. 2001. Energy consumption and environmental impacts of the
Internet in the US. Ecole polytechnique federale de Lausanne. Donovan, C. 2009. Twenty tousend leagues under the sea: A Life cycle assessment of fibre
optic submarine cable systems. MSc Thesis. Degree project SoM Ex 2009:40. Department of urban planning and environment, Royal institute of technology, Stockholm.

2014 Journal of Industrial Ecology – www.wileyonlinelibrary.com/journal/jie
Duan H., M. Eugster, R. Hischier, M. Streicher-Porte, J. Li. 2009. Life cycle assessment study of
a Chinese desktop personal computer. Science of the total environment. 407:1755-1764. Ecoinvent Centre, Extension database to GaBi 4 Professional or stand-alone with GaBi 4
software. Copyright, Ecoinvent EMPA Ueberlandstrasse 129 CH-8600 Duebendorf, Switzerland, www.ecoinvent.org.
Ericsson. 2002. Life cycle assessment of a 3G system (final report), Ericsson technical report,
2002. Externally verified (ISO 14 04x). Includes LCA data and results from earlier LCA studies (-2002).
Ericsson. 2010. Life cycle assessment of Ericsson mobile communication systems. Ericsson
technical report, 2010. Externally verified (ISO 14 04x). Includes LCA data and results from earlier LCA studies (2005-2010).
EU. 2011. EU Code of Conduct on energy consumption of Broadband Equipment. Version 4.
Also available at: http://iet.jrc.ec.europa.eu/energyefficiency/ict-codes-conduct/energy-consumption-broadband-communication-equipment
Fraunhofer IZM and PE Europe. 2007. EuP Preparatory Studies “Televisions” (Lot 5). Final
Report on Task 5 “Definition of Base Cases”. Report for Tender No. TREN/D1/40 lot 5-2005. Berlin
FTTH, 2008. Developing a generic approach for FTTH solutions using LCA methodology.
[Report prepared for FTTH Council] February 2008 e.d. Ecobilan S.A. GeSI. 2008. Smart 2020: Enabling the low carbon economy in the information age. A report by
The Climate Group on behalf of the Global eSustainability Initiative (GeSI) Google. 2011. Google carbon footprint 2010 available at: http://www.google.com/green/the-big-
picture.html Hermann. C. 2008. Environmental Footprint of ICT Equipment in Manufacture, Use and End of
Life. Presentation made at ECOC in Brussels 23rd September 2008. Hishier and Baudin, 2010. LCA study of plasma television device. International Journal of Life
Cycle Assessment. Volume 15, Number 5. Page 428-438. Hochschorner E., György D., Moberg Å. 2011. LCA of movie distribution, using Internet a
screening study. Presentation at the 3rd NorLCA symposium in Helsinki 15-16 September 2011.
Inge M. 2009. “De 10 värsta strömtjuvarna” (In Swedish, measurements of consumer
electronics power consumption over time with professional equipment) M3 Digital, August 2009.
2014 Journal of Industrial Ecology – www.wileyonlinelibrary.com/journal/jie
IVF. 2007. Lot 3. Personal Computers (desktops and laptops) and Computer Monitors. Final Report (Task 1-8). IVF Report 07004. ISSN 1404-191X.
Koomey. J.2011. Growth in Data center electricity use 2005 to2010. Oakland, CA: Analytics
Press. August 1. Also available at: http://www.analyticspress.com/datacenters.html Lange et al, Energy Consumption of Telecommunication Network and Related Improvement
Options. IEEE Journal of selected topics in quantum Electronics. Vol 17 no 2. March/April 2011
Lindroth, M. 1999a. Life cycle assessment of radio relay systems. MSc Thesis. TRITA-KET-IM
1999:30, ISSN 1402-7615. Industrial Ecology, Royal institute of technology, Stockholm. Lindroth, M. 1999b. Livscykelanalys av telefoniabonnemang (In English: Life cycle assessment
of fixed telephone subscription services). TeliaSonera internal report, externally verified by IVL 2000. Stockholm.
Loerincik, Y. 2006. Environmental impacts and benefits of information and communication
technology infrastructure and services, using process and input-output life cycle assessment. These no 3540. École Polytechnique Fédérale de Lausanne (EPFL).
Malmodin et al. 2010a. Greenhouse gas emissions and operational electricity use in the ICT
and entertainment & media sector. Journal of Industrial Ecology 14, 770-790. Malmodin, J., D. Lundén, and N. Lövehagen. 2010b. Methodology for life cycle based
assessments of the CO2 reduction potential of ICT services. IEEE International Symposium on Sustainable Systems and Technology (ISSST). Washington May 16-19 2010. Available at: http://ieeexplore.ieee.org/xpls/abs_all.jsp?arnumber=5507738.
Malmodin et al. 2012. LCA of data transmission and IP core networks. Conference paper.
Electronics Goes Green 2012+ (EGG). Also available at: http://ieeexplore.ieee.org/xpl/articleDetails.jsp?tp=&arnumber=6360437&contentType=Conference+Publications&sortType%3Dasc_p_Sequence%26filter%3DAND%28p_IS_Number%3A6360408%29%26rowsPerPage%3D75
MCC. 1993. Environmental consciousness: A strategic competitiveness issue for the electronic
and computer industry. Austin, TX: Microelectronics and Computer Technology Corporation.
Nokia. 2005. Integrated Product Policy Pilot Project. Stage I Report. Part of European
Commission’s Integrated Product Policy (IPP) project. NTT. 2003. Dynamic model for analysing environmental impacts caused by the ICT
infrastructure in Japan. Presented by NTT at the conference Environmental Assessment in the Information Society, 3-4 Dec 2003, Lausanne, Switzerland
2014 Journal of Industrial Ecology – www.wileyonlinelibrary.com/journal/jie
PTS. 2008. The Swedish Post and Telecom Agency. The Swedish Telecommunications Market 2007 - PTS-ER-2008:15. Also available at http://www.statistics.pts.se/start_en/
PTS. 2009. The Swedish Post and Telecom Agency. The Swedish Telecommunications Market
2008 - PTS-ER-2009:21. Also available at http://www.statistics.pts.se/start_en/ PTS. 2010. The Swedish Post and Telecom Agency. The Swedish Telecommunications Market
2009 - PTS-ER-2010:13. Also available at http://www.statistics.pts.se/start_en/ PTS. 2011. The Swedish Post and Telecom Agency. The Swedish Telecommunications Market
2010 - PTS-ER-2011:15. Also available at http://www.statistics.pts.se/start_en/ Roth, K.W. and K. McKenney. 2007. Energy consumption by Consumer Electronics in U.S.
Residences. TIAX LLC Socolof, M. L., J.G. Overlay and J.R Geibig. 2005. Environmental life-cycle impacts of CRT and
LCD desktop computer displays. Journal of Cleaner Production 13(13-14):1281-1294 Taeko, A., T. Michiyasu, Y. Matsuoka and N. Shikata. 2003. Case Study for Calculation of
Factor X (Eco-Efficiency) – Comparing CRT TV, PDP TV and LCD TV. In Proceedings of EcoDesign2003: Third International Symposium on Environmentally Conscious Design and Inverse Manufacturing, Tokyo, Japan, December 8-11, 2003.
Tekawa, M. 1999. NEC Environmental report 1999. NEC corporation. Tingstorp, S. 1998 (Reviewed by Lindroth, M. 1999). Livscykelanalys för anläggning av
telekabel. (In English: Life cycle assessment of construction and excavation for telephone cable services). MSc Thesis. 1998:280 CIV, ISSN:1402-1617, ISRN:LTU-EX-98/280-SE. Institutionen för Samhällsbyggnadsteknik, Luleå tekniska Universitet. Luleå.
Weber, C. 2010a. Uncertainty and Variability in Carbon Footprinting for Electronics - Case
Study of an IBM Rack-mount Server. Executive Summary. Carnegie Mellon University 2010.
Weber et al. 2010b. The Energy and Climate Change Impacts of Different Music Delivery
Methods. The Journal of Industrial Ecology. vol. 14, no. 5. October. pp. 754–769. Available at: http://dx.doi.org/10.1111/j.1530-9290.2010.00269.x
Williams, E. 2004. Energy intensity of computer manufacturing: hybrid analysis combining
process and economic input-output methods. Environmental Science and Technology 38(22): 6166-6174.
Zimmermann, J. P. 2009. End-use metering campaign in 400 households in Sweden.
Assessment of the potential of electricity savings. Enertech. Eskilstuna: Swedish Energy Agency.
Related Documents