5 th Australian Conference on Life Cycle Assessment Achieving business benefits from managing life cycle impacts Melbourne, 22-24 November 2006 1 LIFE CYCLE ASSESSMENT OF GREENHOUSE GAS EMISSIONS FROM IRRIGATED MAIZE Tim Grant 1,2 and Tom Beer 2 1 RMIT Centre for Design 2 CSIRO Marine and Atmospheric Research The life cycle assessment (LCA) of this multi-institutional project concentrated on determining the greenhouse gas emissions involved in pre-farm, on-farm and post-farm activities involved in the use of maize for the manufacture of corn chips. When the emissions are all expressed in terms of CO 2 equivalents (CO 2 -e), pre-farm emissions comprise about 6% of the life cycle emissions, on-farm activities comprise about 36%, and post-farm activities account for about 58% of life cycle greenhouse gas emissions. We have used one 400 g packet of corn chips delivered to retail as the functional unit for the study. The single largest source of greenhouse emissions is the emission of nitrous oxide on the farm as a result of application of fertiliser. This accounts for 0.126 kg CO 2 -e per packet of corn chips. The next largest source is the electricity used during the manufacture of the corn chips (0.086 kg CO 2 -e per packet). The oil for frying the corn chips is the third largest source of greenhouse gas emissions (0.048 kg CO 2 -e per packet). The greenhouse gas emissions from fertiliser application are primarily nitrous oxide (N 2 O), which has a global warming potential of 310 kg CO 2 -e/kg N 2 O. In typical irrigated farm systems, these emissions, when converted to CO 2 -e, are almost three times more than the greenhouse gas emissions that result from energy used to pump water. However, pumping irrigation water from deep bores currently produces greenhouse gas emissions that are almost three times those from irrigation using surface waters. Greenhouse gas emissions from the use of tractors on typical farms are about one-third of the emissions from pumping water. The pre-farm and on-farm operations add $0.4 value per kg of CO 2- -e greenhouse gas emitted. The post-farm processing adds $2 value per kg of CO 2 -e greenhouse gas emitted. Keywords: life cycle assessment, irrigated maize, maize, greenhouse gas emissions

Welcome message from author
This document is posted to help you gain knowledge. Please leave a comment to let me know what you think about it! Share it to your friends and learn new things together.
Transcript

5th Australian Conference on Life Cycle Assessment Achieving business benefits from managing life cycle impacts Melbourne, 22-24 November 2006 1
LIFE CYCLE ASSESSMENT OF GREENHOUSE GAS EMISSIONS FROM IRRIGATED MAIZE
Tim Grant1,2 and Tom Beer2 1RMIT Centre for Design
2CSIRO Marine and Atmospheric Research
The life cycle assessment (LCA) of this multi-institutional project concentrated on determining the greenhouse gas emissions involved in pre-farm, on-farm and post-farm activities involved in the use of maize for the manufacture of corn chips.
When the emissions are all expressed in terms of CO2 equivalents (CO2-e), pre-farm emissions comprise about 6% of the life cycle emissions, on-farm activities comprise about 36%, and post-farm activities account for about 58% of life cycle greenhouse gas emissions.
We have used one 400 g packet of corn chips delivered to retail as the functional unit for the study. The single largest source of greenhouse emissions is the emission of nitrous oxide on the farm as a result of application of fertiliser. This accounts for 0.126 kg CO2-e per packet of corn chips. The next largest source is the electricity used during the manufacture of the corn chips (0.086 kg CO2-e per packet). The oil for frying the corn chips is the third largest source of greenhouse gas emissions (0.048 kg CO2-e per packet).
The greenhouse gas emissions from fertiliser application are primarily nitrous oxide (N2O), which has a global warming potential of 310 kg CO2-e/kg N2O. In typical irrigated farm systems, these emissions, when converted to CO2-e, are almost three times more than the greenhouse gas emissions that result from energy used to pump water. However, pumping irrigation water from deep bores currently produces greenhouse gas emissions that are almost three times those from irrigation using surface waters. Greenhouse gas emissions from the use of tractors on typical farms are about one-third of the emissions from pumping water.
The pre-farm and on-farm operations add $0.4 value per kg of CO2--e greenhouse gas emitted. The post-farm processing adds $2 value per kg of CO2-e greenhouse gas emitted.
Keywords: life cycle assessment, irrigated maize, maize, greenhouse gas emissions

1. INTRODUCTION
The Grains Research and Development Corporation and the Australian Greenhouse Office contracted CSIRO, the CRC for Greenhouse Accounting and the University of Melbourne to undertake a study to examine the ‘cradle to grave’ emissions of greenhouse gas from irrigated maize. This study started in November 2003 and was completed in December 2005.
The project team consisted of:
Dr Tom Beer, Dr Mick Meyer and Mr Tim Grant from CSIRO Marine and Atmospheric Research; Mr Kim Russell from PEAQ Management; Mr Clive Kirkby, Ms Alison Fattore and Mr David Smith from CSIRO Land and Water; and Dr Deli Chen and Dr Robert Edis from the University of Melbourne.
Agricultural industries comprise a supply chain extending from pre-farm inputs to post-farm processed products. While the production of the crop is often the most visible aspect of the production chain, it may not be the major component in terms of requirements for energy and fuel. Neither is it necessarily the major source of unwanted by-products such as environmental pollutants. Increasingly, greenhouse gases are emerging as by-products of major concern.
Current practice is to assess the components of the production chain, sector by sector, and to identify the greenhouse gas emissions in each sector in isolation. A more cost-effective approach may be to identify the major emission sources that are amenable to greenhouse gas mitigation regardless of where they lie in the chain. This is the province of life cycle assessment.
Within the farm sector, irrigated summer cropping has been identified as a potentially strong emitter of greenhouse gases, particularly of nitrous oxide (N2O) because the use of fertiliser emits N2O, which is a strong greenhouse gas with a global warming potential of 310 kg N2O/kg CO2. The maize industry uses high rates of fertiliser inputs and crop production occurs at times of the year that favour high rates of N2O production from soils. Despite the high global warming potential associated with fertiliser emissions, however, it is not clear whether crop production is the dominant greenhouse gas emissions source in the whole supply chain; there may be larger emission sources in the energy-intensive, post-farm processing stages of the supply chain.
The irrigated maize industry provides an excellent test case for examining the utility of life cycle assessment for identifying and ranking emission sources, and assessing which of these sources are suitable candidates for practical emission reduction strategies.
2. SCOPE AND AIM OF THIS PROJECT
Australian maize is used to make corn chips, corn flakes and starch while sweet corn is sent to market with little further processing. This project has concentrated on the supply chain associated with corn chip manufacture. Maize production for corn chips, the most energy intensive of the product streams, comprises 5-7% of the Australian maize industry. Much of this production comes from farms that are irrigated and intensively managed and therefore less subject to climatic variability than rain-fed cropping systems. Therefore, irrigated farms were considered to provide a more reliable testing ground for the on-farm emissions research undertaken over just one season.
The project comprised:
• Life cycle assessment of pre-farm, on-farm and post-farm activities taking account of greenhouse gas emissions, including carbon dioxide, methane, nitrous oxide and carbon sequestration;
• Prioritisation and assessment of the LCA results in terms of ranked emission sources; • On-farm measurements of nitrous oxide and carbon dioxide emissions from fertiliser applications and
different crop management options; and

• Laboratory and field measurements conducted by the University of Melbourne designed to determine the amount of nitrogen that remains in the soil as opposed to nitrogen taken up by the plant.
A technical report [1] on the complete project details the methods used and all the results obtained. Analogous projects examining grains [2] and cotton [11] were also conducted by other Australian research groups.
3. LIFE CYCLE ASSESSMENT DESIGN
The purpose of the LCA is to understand how different activities in the various stages of the life cycle contribute to the cumulative greenhouse results for products and services we consume.[3] To do this the production of corn chips is broken up into many individual processes and activities, from tractor operations on farms, through to the packaging and distribution of corn chips. A summary of the processes included in the study are shown in Figure 1. All the processes within the system boundary shown in Figure 1 are included in the study, while the processes on the outside of the boundary are excluded because their impact is either small or irrelevant to the study.
Figure 1 - System boundary for life cycle assessment for corn chip production
4. DATA REQUIREMENTS
The study is concerned with global warming impacts arising from substances with quantifiable global warming potentials: the gases carbon dioxide (CO2), methane (CH4) and nitrous oxide N2O. This boundary simplified the collection of data. Data sources used for the study were acquired using primary data collection and from previously published local studies and overseas data, with the greatest emphasis on activities which make significant contributions to overall greenhouse emissions.
Farmestablishment
Field preparation Agriculturalmachinery
production and operation
Infrastructure andminor services,
ancillary materials
Energy and ancillary materials
Corn grainseparation Crop growing and
harvesting
Plowing stubble back into field, or burning
Grain Transport toproduct
manufacture
Disposal ofpackaging
Processing grainto corn chips
Packaging anddelivery
Consumption ofcornchips
Landfill
System boundary for LCA
Planting fertilising and pesticideapplication
Fertiliser and pesticide
production
Across life cycle

For many data sources, generic emission factors can be used, but soil emission rates vary widely on a regional basis so that we cannot use overseas data with confidence and apply them to Australian conditions and farming practice. Table 1 outlines the major data sources used in the study.
The project team was in Griffith in February 2004 to initiate the project, inspect the farm and visit the Bendigo factory of the corn chip manufacturer so as to obtain relevant energy-use data.
Table 1 - Activities and Corresponding Data Sources
Activity
Data Source
Emissions from field through planting, fertilising, growing and field preparation
On-farm measurement program
Fuel use, fertiliser use, pesticide use, water use Survey of farmers, Department of Agriculture reports
Fertiliser production Centre for Design LCA database based on European fertiliser manufacturers’ data or local data where available
Pesticide and herbicide production Adapted from EcoInvent data for production, localised to Australian situtation.
Electricity and fuel production Centre for Design LCA database based on [4], and [5]
Agricultural machinery impacts Input-output environmental impact model based on Australian National Accounts
Transport emissions and energy use [6] and [4]
Corn chip manufacture Data provided by Rositas in Bendigo
Canola oil From [7]
Salt Adapted from EcoInvent [8] data for production, localised to Australian situtation.
Packaging material and landfill disposal Centre for Design LCA database based on [9]
Starch Production Directly from Penfords Starch
Ethanol production data Ethanol production is typical process data from [7] with ethanol yield data from OECD [10]
5. ON-FARM MEASUREMENTS
On-farm measurements of N2O emissions from nitrogen fertiliser applied to maize crops and CO2 associated with soil organic matter were conducted at Commins Brothers property at Whitton, NSW (34.5oS 146.2oE), as shown in Figure 2. The measurements were conducted on a site already established for five years to investigate the interactions between nitrogen and stubble retention on soil carbon dynamics. The fluxes of N2O and CO2 were measured on three of the established treatments:
• Zero N fertiliser application, stubble removed by burning; • 300 kg N ha-1, stubble removed by burning; and • 300 kg N ha-1, stubble mulched and incorporated into the soil.
Construction of six measurement chambers and the three controllers for them was commenced as soon as approval was given for the study. These were deployed in Griffith on 29-31 March 2004. The fallow period measurements commenced in mid-June 2004, seven weeks after the stubble treatments were imposed.

Figure 3 shows the chamber located in the maize. In total there were six chambers, two for each of the three treatments. A chamber was moved between two alternative sites to avoid the soil being affected by the enclosed chamber. The measurement period was two days (48 hours). Separate day-time and night-time flux measurements were made.
The chambers and controllers were deployed after harvest, mulching and stubble incorporation carried out in April 2004. Data were obtained from 18 June 2004. The field collection and analysis protocol required the gas samples to be collected three times per week (Monday, Wednesday and Friday) in 15-litre tedlar bags, forwarded to Melbourne for analysis in 200-ml sub-samples.
Figure 2 – Experimental maize plots at the Commins farm in Whitton. The arrows mark points along the irrigation channel that comprise the boundary of the plot.
Figure 3 - Gas measurement chamber (disassembled) in the maize field
Irrigation channel
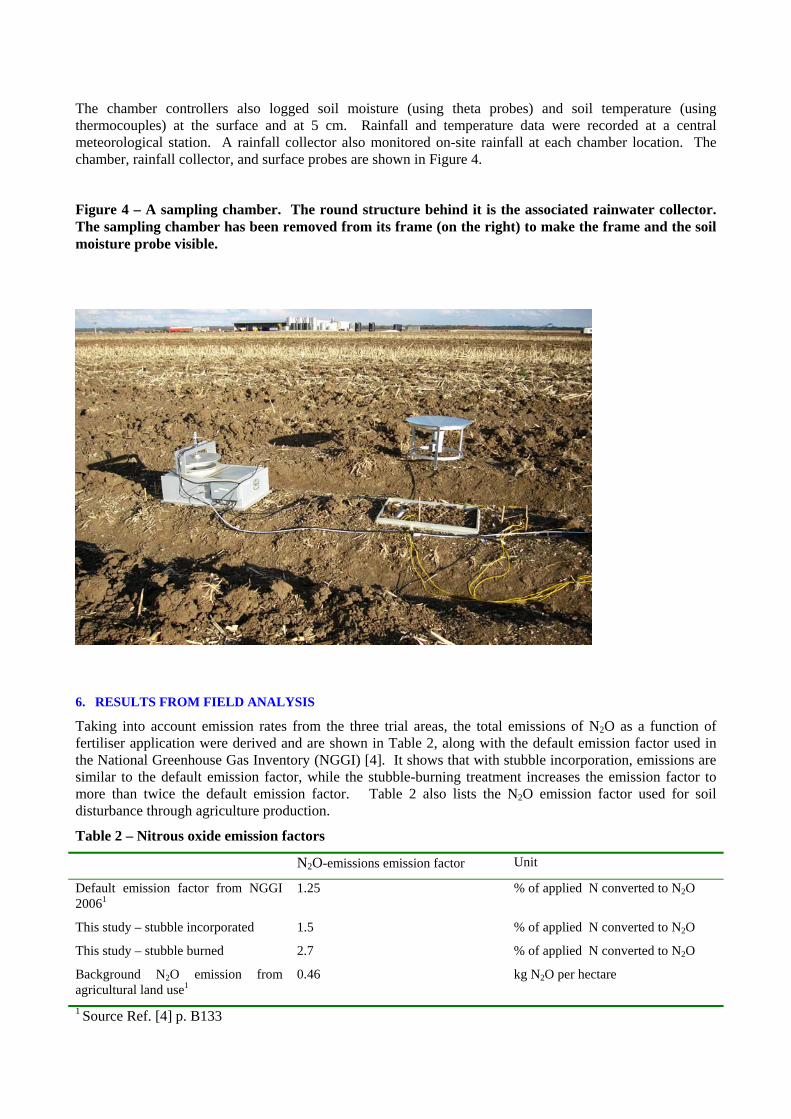
The chamber controllers also logged soil moisture (using theta probes) and soil temperature (using thermocouples) at the surface and at 5 cm. Rainfall and temperature data were recorded at a central meteorological station. A rainfall collector also monitored on-site rainfall at each chamber location. The chamber, rainfall collector, and surface probes are shown in Figure 4.
Figure 4 – A sampling chamber. The round structure behind it is the associated rainwater collector. The sampling chamber has been removed from its frame (on the right) to make the frame and the soil moisture probe visible.
6. RESULTS FROM FIELD ANALYSIS
Taking into account emission rates from the three trial areas, the total emissions of N2O as a function of fertiliser application were derived and are shown in Table 2, along with the default emission factor used in the National Greenhouse Gas Inventory (NGGI) [4]. It shows that with stubble incorporation, emissions are similar to the default emission factor, while the stubble-burning treatment increases the emission factor to more than twice the default emission factor. Table 2 also lists the N2O emission factor used for soil disturbance through agriculture production.
Table 2 – Nitrous oxide emission factors
N2O-emissions emission factor Unit
Default emission factor from NGGI 20061
1.25 % of applied N converted to N2O
This study – stubble incorporated 1.5 % of applied N converted to N2O
This study – stubble burned 2.7 % of applied N converted to N2O
Background N2O emission from agricultural land use1
0.46 kg N2O per hectare
1 Source Ref. [4] p. B133

Stubble burning is 2.7% of the applied nitrogen. When stubble is retained and incorporated into the beds by mulching, this loss rate declines to 1.5% of applied nitrogen. The emissions occur largely in the furrows where there is low porosity and more water.
Emissions from the burning of agricultural residues were also included in the study. These were taken from the default emission factors from [4] and are 1.96 g methane and 0.072 g N2O per kg of dry matter burnt. CO2 emissions from this combustion are not included as they are biogenic emissions.
7. STAKEHOLDER SURVEYS
On 9 and 10 February 2005, the project team travelled to Griffith to demonstrate the system to growers and to request information from the growers as to their own operations (Figure 5). This was necessary to determine how representative were the operations on the Commins farm, and through analysis of the responses received it was possible to quantify the typical range of values associate with on-farm inputs. The results of the stakeholder consultation were used to estimate typical farm inputs, as shown in Table 3.
Stubble incorporated fields required half the tractor power of stubble burned fields. Therefore it was assumed that tractor fuel usage would be reduced by one-third between stubble incorporated and stubble burned fields. No additional tractor passes were modelled for stubble mulching as this is incorporated into plowing and bed formation.
Figure 5 - Stakeholder forum held (a) at Darlington Point Club and (b) in the field, during which growers answered questions about their own energy use, water use, fertiliser application and farming methods.
(a)
(b)
8. RESULTS OF THE LIFE CYCLE ASSESSMENT
The basic LCA was conducted for irrigated maize supplied to corn chip producers. It was assumed that:
(1) approximately 50% of the crop is produced by conventional cultivation (i.e. with stubble burned) and 50% with stubble incorporated; and
(2) that irrigation water was derived from bores (65%) or by gravity feed from irrigation channels (35%), and that the bores had an average depth of 50 m.
The unit in which emissions are reported is kg CO2-e per packet of corn chips.
With these assumptions in mind, it was found that for the corn chip production chain the total net emissions per 400 g packet of corn chips reaching the domestic market were 0.53kg CO2-e. This comprised 68% CO2,

30% N2O and 4% CH4 and -2% from carbon sequestration in landfill. By sector, 6% of emissions were pre-farm, 36% were on-farm and 58% were post-farm.
Looking at the entire supply chain, the major sources are shown in Figure 6. Nitrogen fertiliser application is the largest single contributor, although post-farm activities are more significant in aggregate to the on-farm and pre-farm inputs. In order of rank, the main emission sources were N2O from fertiliser application (25%), electricity for chip production (17%), canola oil (9%), transport of chips to market (8%), production of the box for transporting the corn chips (8%), water pumping (7%), natural gas for chip processing (6%), and the corn chip packet (4%).
Table 3 Farming inputs from stakeholder survey
Farm inputs Unit Typical value low value high value
Water
Total water per Ha Ml 9 7.5 12.5
% from bore % 35% 30% 40%
% from surface waters % 65% 60% 70%
Depth of bores m 50 20 100
% electric pumps % 25% 20% 30%
% diesel pumps % 75% 60% 80%
Runoff to tail dams % of total applied 20% 15% 25%
Fertiliser inputs
Total N kg/ha 300 250 400
Total P kg/ha 50 30 60
Total K kg/ha 10 0 10
Zinc kg/ha 3 0 5
Pesticides
Primextra l/ha 3.2 2.5 4
Glyphosate l/ha 0.8 0.5 2
Tractors
Tractors (diesel) l/ha 92 70 110
One of the purposes of this LCA was to identify areas in which cost-effective strategies to control and reduce greenhouse gas production could be applied. Reductions may result from new technologies applied to the identified areas or improved efficiencies of production using current technologies. In our study of the corn chip industry, stubble management emerged as a key issue. Though typically farm emissions are 36% of life cycle greenhouse gas emissions, if those farms that currently burn stubble are able to shift to stubble incorporation they will achieve a 30% reduction in emissions from cradle-to-farm-gate (Figure 7). If the non-fossil carbon dioxide is also included then our measurements [1, 12] indicate that greenhouse gas emissions from maize farms that incorporate stubble are 56% lower than emissions from farms that burn stubble, when the soil carbon changes are included.
Among post-farm processes, the packaging and transport components of corn chip production were substantial sources of greenhouse gases, comprising 24% of total life cycle emissions. Surprisingly, packaging (i.e. the box for transporting the corn chips and the corn chip packet) was the third largest emission source, but only marginally greater than the transport of grain from farm to factory and the transport of product to market. The potential to improve efficiencies in these areas should be investigated in the development of industry-wide mitigation strategies.

Figure 8 provides a graphical representation of the cumulative greenhouse gas emissions at each stage of corn chip manufacture, along with an estimate of the appropriate value that is added at each step of the chain. The pre-farm and on-farm operations add $0.4 value per kg of CO2-e greenhouse gas emitted. Value, in this analysis, has been quantified on the basis of incremental costs on-farm and the production costs post-farm. The post-farm processing adds $2 value per kg of CO2-e greenhouse gas emitted.
Figure 6 - Contributions to greenhouse gas emissions from different stages of the life cycle of corn chips. The functional unit is a 400 g packet of corn chips.
9. DISCUSSION AND CONCLUSIONS Pumping water represents a significant energy use and consequent greenhouse contribution, particularly if the water is drawn from deep bores. With reduced water availability, water may be drawn from further down in the water table increasing greenhouse emissions associated with water supply. In addition, the extra infrastructure required on-farm for water treatment and water storages can be substantial. From our analysis, pumping irrigation water from deep bores currently produces greenhouse gas emissions that are almost three times those from irrigation using surface waters.
The LCA and supporting measurements show that on-farm emissions arising from nitrogen fertiliser application to irrigated crops is the major single emission source. Overall, post-farm emissions associated
-0.05 0.00 0.05 0.10 0.15
Fertiliser production
Pesticide production
Herbicide production
Fuel production
Water pumping
N2O from fertiliser applied
N2O from land disturbance
Tractor emissions
Pesticide and herbicide degradation
Drying maize
Transport to factory
Electricity in corn-chip processing
Natural gas use in corn-chip processing
Oil for frying
Seasoning
Bag for 400g of corn-chips
Box (for transporting corn-chip packets)
Transport to corn-chips to market
Re-cycling (bag & box)
Carbon dioxide equivalents kg CO2
Post-farm
On-farm
Pre-farm

with production (energy and oil), packaging and transport account for most of the greenhouse gas production. There appears to be considerable potential to reduce emissions on-farm through stubble incorporation. The substantial post-farm emissions indicate that there is also scope to explore practical
mitigation options for transport and packaging.
Figure 7: Comparison of lifecycle emissions of greenhouse gases (from cradle-to-farm-gate) between
different types of crop management regimes on a per hectare basis. Only fossil carbon dioxide is included. Methane is inferred from [4].
Figure 8: Cumulative greenhouse gas emissions and cost estimates for a 400 g packet of corn chips

Figure 9 shows the uncertainties associated with each of the greenhouse gas contributions, derived from a Monte Carlo analysis of the LCA model with input data uncertainty estimated in both the background LCA data for fuel and materials production and foreground data on farming practice and on-farm emissions. It shows a high level of uncertainty for N2O emissions with the 95% confidence limits being 33% higher and lower than the median value, dominated by uncertainty from N2O emissions from fertiliser application. The uncertainty for CO2 emissions are approximately plus or minus 10%. The uncertainties of the remaining emissions are not significant in the results of the study.
The relative importance of on-farm emissions to total lifecycle emissions depends strongly on the production chain into which the product is being directed. For example, another market for maize is starch production. This industry requires less energy (per kg maize) than corn chip production and has lower post-farm emissions of greenhouse gases. As a result, the relative contribution of on-farm emissions to the complete lifecycle is substantially greater for starch production (58%) compared to corn chips (36%) and ethanol production from maize (51%). This is illustrated in Figure 10 and shows that from the industry perspective, implementing greenhouse gas mitigation options on-farm is a worthwhile greenhouse gas reduction measure for all products, especially starch and ethanol production. Figure 10 also shows the quantities produced from a hectare of irrigated maize in terms of corn chips, starch and ethanol.
Figure 9 – Uncertainty associated with greenhouse gas emission for maize to corn chips lifecycle.

10. ACKNOWLEDGEMENTS
We acknowledge the financial support of the Australian Greenhouse Office, The Grains Research and Development Corporation and the CRC for Greenhouse Accounting.
Figure 10 - Comparison of lifecycle emissions of greenhouse gases for different uses of 1 hectare of maize.

11. REFERENCES
1. Beer, T., Meyer, M., Grant, T., Russell, K., Kirkby, C., Chen, D., Edis, R., Lawson, S., Weeks, I., Galbally, I., Fattore, A., Smith, D., Li Y., Wang, G., Park, K.D., Turner, D. and Thacker, J. , Life cycle Assessment Of Greenhouse Gas Emissions From Agriculture In Relation To Marketing And Regional Development - Irrigated maize: From maize field to grocery store, Final Report HQ06A/6/F3.5. 2005, CSIRO Division of Marine and Atmospheric Research.: Aspendale.
2. Narayanaswamy, V., van Berkel, R., Altham, J. and McGregor, M. Narayanaswamy, V., van Berkel, R., Altham, J. and McGregor, M. Application of life cycle assessment to enhance eco-efficiency of grains supply chaiuns, in Proc. 4th. Australian LCA Conference. 2005. Sydney.
3. van Berkel, R. The Application of Life Cycle Assessment for Improving the Eco-Efficiency of Supply Chains. in Muresk 75th anniversary Conference. 2002.
4. Australian Greenhouse Office. and National Greenhouse Gas Inventory Committee., National greenhouse gas inventory 2003. 2005, Canberra: Australian Greenhouse Office. 1 v. (various pagings).
5. Australian Bureau of Agricultural Research Economics. ACS Petroleum Tables,. 2002 [cited. 6. Apelbaum Consulting Group, Australian Transport Facts, 2001:Tables in Excel Format. 2001: Blackburn,
Victoria. 7. Beer, T., et al., Comparison of Transport Fuels - Final Report to the Australian Greenhouse Office on the
Stage 2 study of Life cycle Emissions Analysis of Alternative Fuels for Heavy Vehicles. 2001, CSIRO: Aspendale.
8. ETH domain and Swiss Federal Offices. Ecoinvent data v1.01. 2003 [cited. 9. Grant, T., K. James, and H. Partl, Life Cycle Assessment of Waste and Resource Recovery Options (including
energy from waste) - Final Report for EcoRecycle Victoria. 2003, Centre for Design at RMIT University (www.cfd.rmit.edu.au): Melbourne, Victoria.
10. Organisation for Economic Co-operation and Development, Agricultural Market Impacts of Future Growth in the Production of Biofuels. 2006, Directorate for Food, Agriculture and Fisheries Committee for Agriculture, Working Party on Agricultural Policies and Markets.
11. Eckard, R., Are there win-win strategies for minimising greenhouse gas emissions from agriculture? Proc. OUTLOOK 2006, 2006, Australian Bureau of Agricultural and Resource Economics (ABARE), Canberra.
12. Kirkby, C., Fattore, A., Smith D. and Meyer, M. Life cycle assessment of greenhouse gas emissions from irrigated maize stubble treatments and plant/soil responses, in Water to Gold. Proc. 6th. Triennial Conf. Maize Assoc. Australia., 177-184. 2006. Darlington Point NSW.
Related Documents