On behalf of Textile Exchange Life Cycle Assessment (LCA) of Organic Cotton A global average

Welcome message from author
This document is posted to help you gain knowledge. Please leave a comment to let me know what you think about it! Share it to your friends and learn new things together.
Transcript

1
On behalf of
Textile Exchange
Life Cycle Assessment (LCA) of Organic Cotton A global average

2
Title of the Study:
Life Cycle Assessment (LCA) of Organic Cotton – A global average
On behalf of:
Textile Exchange
November 2014
Contact:
Daniel Thylmann
Flora D’Souza
Angela Schindler
Sabine Deimling
PE INTERNATIONAL AG
Hauptstraße 111 – 113 70771 Leinfelden – Echterdingen Germany
Phone +49 711 341817 – 0 Fax +49 711 341817 – 25
E-Mail [email protected]
Internet www.pe-international.com
Cover photo: © Jörg Böthling, provided by Remei AG

3
Version history
Version Date
Draft 1.0 for PE-internal QC 2014-08-31
Final Draft 1 for critical review 2014-09-03
Final Draft 2 revision for critical review 2014-10-07
Final Draft 3 revision for critical review 2014-10-17
Final Report including critical review statement (this report) 2014-11-05

4
Table of Contents
List of figures .............................................................................................................. 6
List of tables................................................................................................................ 7
Acronyms 8
Executive Summary .................................................................................................. 10
1 Introduction ............................................................................................ 12
2 Goal and scope ...................................................................................... 14
2.1 Goal of the study .................................................................................... 14
2.1.1 The reasons for carrying out the study ................................................... 14
2.1.2 Intended application ............................................................................... 14
2.1.3 Intended Audience ................................................................................. 14
2.2 Scope of the study ................................................................................. 15
2.2.1 System description ................................................................................. 15
2.2.2 System boundaries ................................................................................ 15
2.2.3 Inclusion, exclusion and cut-off criteria .................................................. 16
2.2.4 Function and Functional unit .................................................................. 18
2.2.5 Data collection ........................................................................................ 18
2.2.6 Technological and geographical reference ............................................ 19
2.2.7 Time reference ....................................................................................... 20
2.2.8 Background data .................................................................................... 20
2.2.9 Assessment of data quality .................................................................... 21
2.2.10 Allocation ................................................................................................ 22
2.2.11 LCIA methodology and types of impacts ................................................ 23
2.2.12 Software and database .......................................................................... 23
2.3 Critical Review ....................................................................................... 24
2.3.1 The critical review process ..................................................................... 24
2.3.2 The critical review panel ......................................................................... 24
3 Life cycle inventory (LCI) analysis .......................................................... 26
3.1 Agricultural Model .................................................................................. 26
3.2 Nutrient Modelling .................................................................................. 26
3.3 Carbon Modelling ................................................................................... 28
3.4 Soil data and soil erosion ....................................................................... 29
3.5 Ginning ................................................................................................... 31
4 Life cycle impact assessment (LCIA) ..................................................... 32
4.1 Introduction to the impact assessment ................................................... 32
4.2 Categories of contribution ...................................................................... 34
4.3 Impact assessment results ..................................................................... 36
4.3.1 Global Warming Potential – Climate change ......................................... 36
4.3.2 Acidification Potential ............................................................................. 38
4.3.3 Eutrophication Potential ......................................................................... 39
4.3.4 Water use and consumption .................................................................. 40
4.3.5 Primary Energy Demand ........................................................................ 42

5
5 Interpretation .......................................................................................... 43
5.1 Scenarios ............................................................................................... 43
5.1.1 Provision of organic fertilizer .................................................................. 43
5.1.2 Animal draught ....................................................................................... 45
5.1.3 Composting of field residues .................................................................. 46
5.1.4 Allocation ................................................................................................ 47
5.1.5 Soil protection ........................................................................................ 49
5.1.6 Nitrous oxide emissions from agricultural soils ...................................... 49
5.1.7 Machinery transportation and certification trips ...................................... 50
5.2 The environmental footprint of organic cotton – Putting it into perspective ............................................................................................. 52
5.2.1 Climate change (GWP) .......................................................................... 52
5.2.2 Acidification ............................................................................................ 53
5.2.3 Eutrophication ........................................................................................ 53
5.2.4 Water use ............................................................................................... 54
5.2.5 Primary Energy Demand (non-renewable) ............................................. 54
5.3 Limitations .............................................................................................. 54
6 Conclusion ............................................................................................. 57
7 References ............................................................................................. 58
8 Supplement / Annex ............................................................................... 65
8.1 Toxicity Screening .................................................................................. 65
8.2 Life Cycle Inventory Data – Organic Cotton Cultivation ......................... 68
8.3 Description of result parameters ............................................................ 77
8.4 Critical Review Statement ...................................................................... 81

6
List of figures
Figure 2-1: System boundaries considered in this study .......................................... 16
Figure 3-1: Nitrogen system flows; the figure shows sinks (black arrows) and
sources (blue arrows) of the nitrogen cycle. .......................................... 27
Figure 3-2: Implementation of soil protection measures among organic cotton
farmers ................................................................................................... 30
Figure 4-1: Global warming potential of the global average organic cotton fibre
shown for 1000 kg of product at gin gate. .............................................. 36
Figure 4-2: Acidification potential of the global average organic cotton fibre
shown for 1000 kg of product at gin gate. .............................................. 38
Figure 4-3: Eutrophication potential of the global average organic cotton fibre
shown for 1000kg of product at gin gate. ............................................... 39
Figure 4-4: Water use of the global average organic cotton fibre shown for
1000kg of product at gin gate. Upstream processes include the
manufacturing of fertilizer, fuels and other ancillaries. ........................... 40
Figure 4-5: Primary energy demand (net calorific value) from non-renewable
resources of the global average organic cotton fibre shown for
1000 kg of product at gin gate. .............................................................. 42
Figure 5-1: Global warming potential under different allocation scenarios ............... 48
Figure 5-2: Eutrophication potential under different soil erosion scenarios .............. 49
Figure 8-1: USEtox results of the global average organic cotton fibre shown for
1000 kg of product at gin gate ............................................................... 66
Figure 8-2: Greenhouse effect ................................................................................. 78
Figure 8-3: Acidification Potential ............................................................................. 78
Figure 8-4: Eutrophication Potential ......................................................................... 79

7
List of tables
Table 2-1 System elements included within and excluded from the system
boundaries ............................................................................................. 17
Table 2-2: Top organic cotton producing countries worldwide ................................ 19
Table 2-3: Geographical and time reference in data collection ............................... 20
Table 2-4: Allocation at the gin – inputs, outputs and allocation factor
(example India) ...................................................................................... 22
Table 3-1: Soil erosion reduction potential of different soil protection
measures ............................................................................................... 31
Table 4-1: Environmental indicators for the assessment ........................................ 34
Table 4-2: Water use and consumption per 1000 kg organic cotton fibre
(global average). .................................................................................... 40
Table 5-1: Results of different scenarios for organic fertilizer provision .................. 44
Table 5-2: Parameter used in the animal draught scenario .................................... 45
Table 5-3: Nutrient content of cotton stalks ............................................................. 46
Table 5-4: Emission factors for nutrient loss during composting ............................. 46
Table 5-5: Results of different scenarios for composting of field residues .............. 47
Table 5-6: Prices for seed and lint and resulting allocation ..................................... 48
Table 5-7: Global warming potential of the global average organic cotton fibre
shown for 1000 kg of product at gin gate under different scenarios
for nitrous oxide emission factors .......................................................... 50
Table 5-8: Impact of machinery transportation and certification on global seed
cotton production ................................................................................... 51
Table 5-9: Mean and standard deviation for impact measures (per 1000 kg of
cotton fibre) ............................................................................................ 55
Table 8-1: Agricultural Activity – Organic Cotton Cultivation ................................... 68
Table 8-2: Regionally specific background data used in the agricultural model ..... 70
Table 8-3: Machinery Use ....................................................................................... 71
Table 8-4: Irrigation ................................................................................................. 72
Table 8-5: Gin foreground data ............................................................................... 73
Table 8-6: Inventory parameter summary table ...................................................... 74
Table 8-7: Background datasets used .................................................................... 75
Table 8-8: Summary of Life cycle Inventory ............................................................ 76

8
Acronyms
AP Acidification Potential
CmiA Cotton made in Africa
CML Centre of Environmental Science at Leiden
CTUe Comparative Toxic Unit for Ecosystems
CTUh Comparative Toxic Unit for Humans
DQR Data quality rating
EoL End of Life
EP Eutrophication Potential
ETP Eco-toxicity potential
FAO Food and Agriculture Organization of the United Nations
fm Fresh matter
FU Functional unit
FYM Farm Yard Manure
GHG Greenhouse Gas
GMO Genetically Modified Organism
GOTS Global Organic Textile Standard
GWP Global Warming Potential
HTP Human toxicity potential
IFOAM International Federation of Organic Agriculture Movements
ILCD International Life Cycle Data System
ISO International Organization for Standardization
LBP Lehrstuhl für Bauphysik – Chair of Building Physics, University of
Stuttgart
LCA Life Cycle Assessment
LCI Life Cycle Inventory
LCIA Life Cycle Impact Assessment
NOP National Organic Program
PAF Potentially affected fraction
PE PE INTERNATIONAL AG
PED Primary Energy Demand
PEF Product environmental footprint

9
SOC Soil organic carbon
TE Textile Exchange
UNEP-SETAC United Nations Environmental Program (UNEP) – Society of En-
vironmental Toxicology and Chemistry (SETAC)
WSI Water stress index

10
Executive Summary
The main goal of this study is to build an up-to-date and well-documented Life Cycle Inven-
tory (LCI) for organic cotton fibre (ginned and baled), representative of the worldwide
(global) production. In addition, the study provides a Life Cycle Impact Assessment (LCIA)
of organic cotton fibre (comprising cultivation and ginning operations) and identifies envi-
ronmental hotspots.
The study followed the general rules of the ISO standards 14040 and 14044 (verified by the
accompanying review process). A cotton specific standard (e.g. product category rules
(PCR)) could not be followed as such a document does not exist so far. However, an in-
depth and peer-reviewed study has been published recently about the environmental profile
of conventional cotton, from farming to textile manufacturing as well as exemplary product
life cycles (COTTON INC. 2012). Named study (COTTON INC. 2012) is considered as reference
document for the present one, as it is publicly available, has been critically reviewed and
covers 67% of global cotton production. According to COTTON INC. 2012, their study provides
reliable LCI data representing the cotton industry. This is why this study aims to align its
methodological assumptions (e.g. system boundaries, functional unit etc.) and modelling
approaches to the mentioned study.
This current study is based on primary data from producer groups from the top five countries
of organic cotton cultivation (India, Turkey, China, USA, and Tanzania). The Life Cycle As-
sessment (LCA) model was set up using the GaBi 6.3 Software system (GABI 6.3 2013), the
functional unit being 1000 kilograms (kg) of lint cotton at the gin gate. In order to carry out
an LCIA, the following impact categories were investigated (using the CML impact assess-
ment methodology framework): climate change, eutrophication, acidification and primary
energy demand (non-renewable). Additionally, water use and water consumption were in-
vestigated.
Field emissions – encompassing the emissions from nutrient transformation processes tak-
ing place in the soil - stand out in several impact categories. They dominate the impact on
climate change due to nitrous oxide emissions and are an important contributor to acidifi-
cation potential via ammonia release. Apart from field emissions, the relevance of other
impact categories is determined by the use of fossil fuels. Most notably, ginning, machinery
and irrigation contribute to several impact categories.
Eutrophication is mainly caused by nutrient leaching and soil erosion, both successfully
reduced in organic farming via soil protection measures. With regards to water use, con-
sumption of blue water should be the focus of water use assessments. Water consumption
benefits from the climatic settings of areas where organic cotton is grown, but soil fertility
and protection measures are also likely to contribute to preserving soil moisture content
available for plant uptake.
Data quality can be considered good and results have a solid foundation. It should, however
be noted that there is need for consideration of modelling approaches that can affect the
outcomes significantly; the assumption of burden-free provision of organic fertilizer and the
assumption not to consider soil carbon sequestration are two important examples. Repre-
sentativeness of data could be improved by systematic data collection in order to cover
several cultivation periods and to have the same reference time period in all regions under
study.

11
The study’s goals can be considered successfully achieved opening new perspectives for
further analyses to complement Life Cycle Assessment towards an even more holistic pic-
ture of sustainability.

12
1 Introduction
Several initiatives in the cotton sector are trying to reduce the negative impacts of cotton
production on the environment and the producers. Although the thematic or geographical
focus of the different initiatives may vary, they all can influence the way cotton is produced
and seek to reduce the environmental and social burdens associated with the production of
cotton fibre.
One of those initiatives is the production of organic textiles, which originate from fibre grown
within an organic agricultural system and certified to one of the following farm standards:
Council Regulation (EC) No 834/2007 (EC 834/2007),
NOP regulations (NOP) or
any (other) standard approved in the IFOAM Family of Standards (IFOAM 2012).
Organic agriculture has been defined by the International Federation of Organic Agriculture
Movements (IFOAM), and internationally accepted as "[…] a production system that sus-
tains the health of soils, ecosystems and people. It relies on ecological processes, biodiver-
sity and cycles adapted to local conditions, rather than the use of inputs with adverse ef-
fects. Organic Agriculture combines tradition, innovation and science to benefit the shared
environment and promote fair relationships and a good quality of life for all involved." (IFOAM
2012)
The Organic Content Standard (OCS 2013) provides third-party to verify the chain of custody
of organic inputs, and ensure that the final product contains the accurate amount of a given
organically grown material. The Global Organic Textile Standard (GOTS) further addresses
the processing of textiles made from organic fibres. It defines environmental criteria along
the entire organic textiles supply chain and requires compliance with social criteria as well.
The focus of this standard is the processing from harvesting of raw materials through to
manufacturing and labelling.
Life Cycle Assessment (LCA) is a recognized tool to measure and quantify the environmen-
tal burdens of production systems or products and to discover improvement potentials. The
method allows objective and scientific evaluation of the resource requirements of a product
and its potential impact on the environment during every phase of its production, use, and
disposal.
The LCA approach was recently applied in a large-scale study undertaken by the cotton
industry to evaluate the environmental impact of conventional cotton farming practices and
textile production systems (COTTON INC. 2012). The named study has provided a solid base-
line with up-to-date Life Cycle Inventory (LCI) data for evaluating conventional cotton prod-
ucts and has sparked interest among stakeholders along the entire textile supply chain in
investigation of environmental performance of their supply chains.
Additionally, Indian organic cotton fibre production has been investigated by an LCA study
commissioned by PUMA supported by Textile Exchange (TE) resulting in a Master thesis
(SLOTYUK 2013) that is the pre-cursor and basis for the current study. The thesis is based on
agricultural data from four different growing regions in India, assessed the environmental
impact of cotton cultivation (not including the gin) and investigated impact contributions in
detail.

13
In order to deepen and broaden the understanding of environmental impacts of organic
cotton fibre production, Textile Exchange commissioned PE INTERNATIONAL to perform
a Life Cycle Assessment according to the principles of the ISO 14040 series (ISO 14040,
ISO 14044) and to document the study results in an ISO-compliant report (present docu-
ment). The study’s goal is to analyse impact categories known to be highly relevant for
agricultural products, in particular for cotton production on a global basis.

14
2 Goal and scope
2.1 Goal of the study
The goals of this study are to
1. build an up-to-date and well-documented Life Cycle Inventory (LCI) for organic cotton
fibre (ginned and baled), representative of the worldwide (global) production. The en-
vironmental profile shall be presented for 1000 kg of cotton fibre (ginned) as per the
ILCD entry level quality requirements (ILCD 2011).
2. provide a comprehensive Life Cycle Impact Assessment (LCIA) of organic cotton fibre
(comprising cultivation and ginning operations) and identify the environmental
hotspots over a range of impact categories.
To the effect of achieving these goals the relevant ISO standards ISO 14040 and ISO 14044
shall be followed (to be verified by the accompanying review process).
2.1.1 The reasons for carrying out the study
The current study is meant to establish a holistic picture of the environmental profile of the
worldwide production of organic cotton fibre. As the apparel industry has become more and
more active in sustainability initiatives along their supply chains, cotton – one of the primary
raw materials – has gained a lot of attention. Recently, an in-depth and peer-reviewed study
has been published about the environmental profile of conventional cotton, from farming to
textile manufacturing as well as exemplary product life cycles (COTTON INC. 2012). The study
publishes the life cycle inventory of conventional cotton fibre, representative of global pro-
duction. Having a reliable inventory and impact assessment for conventional cotton on
hand, the textile community has requested a similar study to provide data on organic cotton
farming practises.
2.1.2 Intended application
The results of this study are to be applied as a reference value for organic cotton production
worldwide and shall be used with confidence in any further LCA studies e.g. along the value
chain of the apparel industry. The Critical Review Report is intended to be communicated
to the public along with the final version of the study report itself. The data represent an
aggregated average Life Cycle Inventory of global organic cotton fibre production. This
study does not intend to compare different countries producing organic cotton or different
regions within countries. This study does also not intend to conduct a comparative assertion
as defined in the relevant ISO standards (ISO 14040, ISO 14044). Available published data
is used to set the results of the presented study into perspective, for discussion and inter-
pretation.
2.1.3 Intended Audience
The study is intended to be published. The intended audience comprises both, internal and
external stakeholders. The internal stakeholders include those involved in operations (with
the goal of process improvement) and marketing and communications. The external stake-
holders include customers/consumers, the LCA community, and other members of the tex-
tile supply chain as well as the general public. The electronic data (ILCD dataset) shall be
made available upon request. It is not yet planned to directly link the data file to websites or
publish it in LCI databases.
15
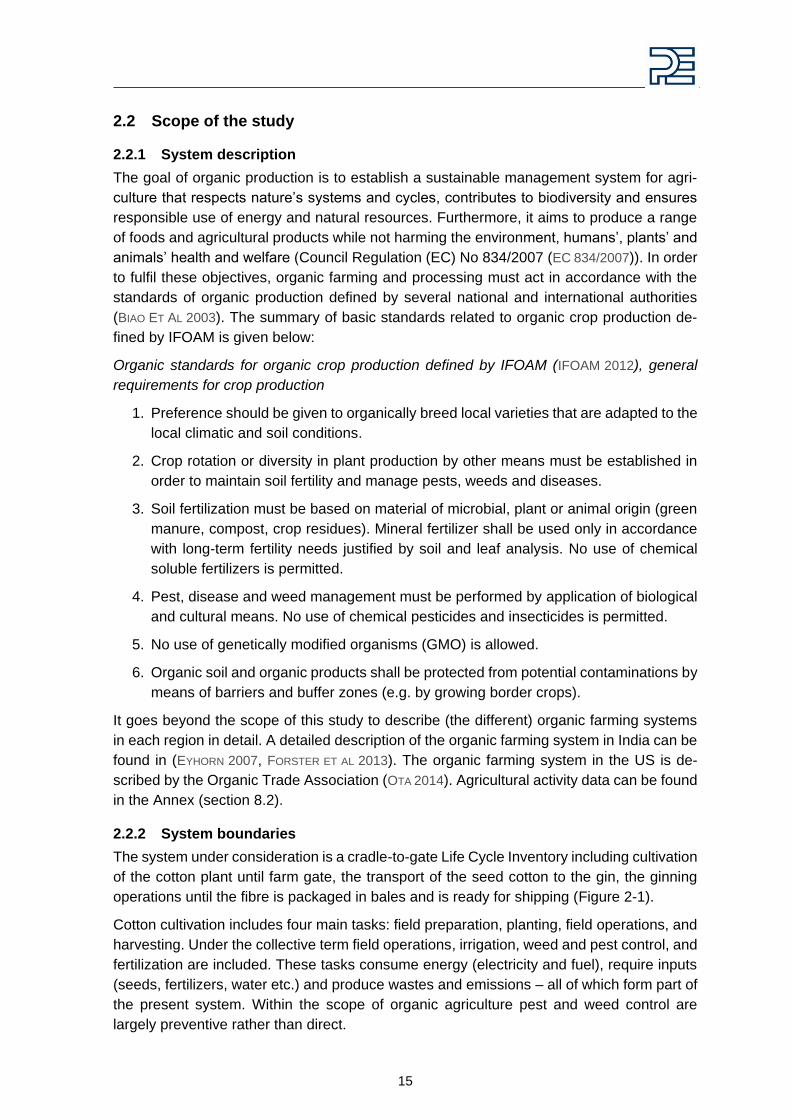
2.2 Scope of the study
2.2.1 System description
The goal of organic production is to establish a sustainable management system for agri-
culture that respects nature’s systems and cycles, contributes to biodiversity and ensures
responsible use of energy and natural resources. Furthermore, it aims to produce a range
of foods and agricultural products while not harming the environment, humans’, plants’ and
animals’ health and welfare (Council Regulation (EC) No 834/2007 (EC 834/2007)). In order
to fulfil these objectives, organic farming and processing must act in accordance with the
standards of organic production defined by several national and international authorities
(BIAO ET AL 2003). The summary of basic standards related to organic crop production de-
fined by IFOAM is given below:
Organic standards for organic crop production defined by IFOAM (IFOAM 2012), general
requirements for crop production
1. Preference should be given to organically breed local varieties that are adapted to the
local climatic and soil conditions.
2. Crop rotation or diversity in plant production by other means must be established in
order to maintain soil fertility and manage pests, weeds and diseases.
3. Soil fertilization must be based on material of microbial, plant or animal origin (green
manure, compost, crop residues). Mineral fertilizer shall be used only in accordance
with long-term fertility needs justified by soil and leaf analysis. No use of chemical
soluble fertilizers is permitted.
4. Pest, disease and weed management must be performed by application of biological
and cultural means. No use of chemical pesticides and insecticides is permitted.
5. No use of genetically modified organisms (GMO) is allowed.
6. Organic soil and organic products shall be protected from potential contaminations by
means of barriers and buffer zones (e.g. by growing border crops).
It goes beyond the scope of this study to describe (the different) organic farming systems
in each region in detail. A detailed description of the organic farming system in India can be
found in (EYHORN 2007, FORSTER ET AL 2013). The organic farming system in the US is de-
scribed by the Organic Trade Association (OTA 2014). Agricultural activity data can be found
in the Annex (section 8.2).
2.2.2 System boundaries
The system under consideration is a cradle-to-gate Life Cycle Inventory including cultivation
of the cotton plant until farm gate, the transport of the seed cotton to the gin, the ginning
operations until the fibre is packaged in bales and is ready for shipping (Figure 2-1).
Cotton cultivation includes four main tasks: field preparation, planting, field operations, and
harvesting. Under the collective term field operations, irrigation, weed and pest control, and
fertilization are included. These tasks consume energy (electricity and fuel), require inputs
(seeds, fertilizers, water etc.) and produce wastes and emissions – all of which form part of
the present system. Within the scope of organic agriculture pest and weed control are
largely preventive rather than direct.

16
Figure 2-1: System boundaries considered in this study
Examples of preventive measures constitute the selection of suitable varieties, balanced
plant nutrition, enhancement of the soil organic matter, intercropping, promoting natural en-
emies, etc. Direct measures are applied when pests and diseases surpass the economic
threshold. In this case pests are discouraged by germs (e.g. Trichogramma, Bacillus thu-
ringensis) (EYHORN 2007), plant extracts (garlic, neem) animal products (buttermilk, cow
urine) or pheromone traps.
Organic fertilizers are most commonly farmyard manure, compost and cow dung. Some-
times mineral derived organic fertilizers such as rock phosphate and bio-fertilizers contain-
ing microorganisms such as rhizobium spp and acetobacter are also applied (SLOTYUK 2013).
While rock phosphate is a marketed product, organic fertilizers are treated as wastes of
another system and are therefore inputs without environmental burdens. Section 5.1 pro-
vides alternative scenarios on provision of organic fertilizer including an allocation of the
environmental impact of the livestock system to the manure.
The agricultural activities (“cradle-to-farm gate”, marked with a blue box in Figure 2-1) are
summarized and treated as a unit process (smallest element considered in the life cycle
inventory analysis for which input and output data are quantified, ISO 14044). Machinery use
and irrigation are assessed separately as unit processes. Transport to the gin and the gin
itself are also assessed as unit processes. Section 3 provides further information about the
agricultural model set up, while section 8.2 provides the foreground data used to set up the
unit process inventories.
2.2.3 Inclusion, exclusion and cut-off criteria
At present, no product category rule exists for cotton fibre LCAs. This is why there is no
generally accepted document to refer to for justification of inclusions and exclusions. The
study COTTON INC. 2012 is considered as reference document for this study, as it is publically
available, has been critically reviewed and covers 67% of global cotton production. Accord-
ing to COTTON INC. 2012, their study provides reliable LCI data representing the cotton indus-
try. This is why the present study aims to align its system boundaries and modelling ap-
proaches to the mentioned study.

17
Items were included or excluded from the study based on their expected environmental
relevance (contribution of >2% to one of the selected impact categories). However, the en-
vironmental relevance of some of the excluded cases is hard to determine, because data
availability is limited and approximations depend heavily on the assumptions made. This is
why chapter 5.1 provides scenarios to estimate the possible environmental impact of some
of the excluded cases, though with large uncertainty.
Table 2-1 provides an overview of excluded and included cases.
Table 2-1 System elements included within and excluded from the system bounda-ries
Included items Excluded items
Seed production Human labour (out of system boundary)
Cultivation of cotton Animal labour (scenario provided)
Production of operating materials Transport of agricultural equipment (sce-nario provided)
Energy production and utilization Certification; extension, farm visits (Sce-nario provided)
Fuel production and utilization Production and transport of packaging ma-terials (expected to be below 2% cut-off criteria)
Water supply, use and consumption Construction of capital equipment (ex-pected to be below 2% cut-off criteria)
Transportation of operating materials and product
Included in the study are all material and energy flows required for the two phases of pro-
duction (cultivation and ginning), as well as all associated wastes and emissions. This in-
cludes but is not limited to: seed production, fertilizer and pesticide production as well as
field emissions (e.g. N2O), electricity for ginning and all transports (fertilizer to the field, seed
cotton to gin).
Excluded from the study are the environmental impacts associated with draught animals.
Draught animals are only used on some farms in India and Tanzania (according to data
from Textile exchange, in 94% of the producer groups farmers own cattle, but only 6% of
those are used for farm work, the respective number for buffalo are 88% and 13%). When
draught animals are used, they are not only used for cotton cultivation but also for various
other crops and for other works such as transports. This multipurpose use makes an allo-
cation of the impact of animal keeping to cotton difficult and justifies the assumption that its
contribution to the environmental impact of cotton cultivation will be marginal. This approach
was also followed by COTTON INC. 2012. However, a scenario provided in chapter 5.1.2 shows
the impact of animal draught under different impact allocation scenarios.
Furthermore, the End of Life of gin waste is excluded, leaving the system burden-free and
without any benefits to the main product. Gin waste consists of broken seeds, fibres and
plant remains (residues). In the worst case, its storage and processing could be associated

18
with additional environmental impacts. On the other hand, it is occasionally returned back
to the land as organic fertilizer. Therefore, attributing no burdens to the gin waste is a neutral
approach, neglecting a small potential environmental impact and also annulling a similarly
small environmental benefit (fertilizer use). This approach was also followed by COTTON INC.
2012.
The provision of infrastructure is also not included. FRISCHKNECHT 2007 showed that infra-
structure in agricultural supply chains can be relevant in certain impact categories (PED,
toxicity). However, the assessment is based on European conditions, i.e. the assumption
that large machinery is used (e.g. combined harvester). The environmental impact of provid-
ing such a machine can only be allocated to a relatively short period of use, resulting in
comparatively high impacts per hour the machine is used. Primary data collected in this
study shows that harvesters are only used in the US, in all other regions machinery use is
low and cotton is typically harvested by hand. The impact of provision of other capital goods
such as buildings is also expected to be low, as for example storage takes place at producer
groups, so that the scaling effect will result in very low impacts per kg final product. These
considerations in relation to the relatively large effort in data collection required to assess
the impact capital goods in the different production regions justify the exclusion of infra-
structure. Additionally, infrastructure was also not included in COTTON INC. 2012.
In the case of human labour, social issues were outside the scope of this study, and were
therefore excluded.
2.2.4 Function and Functional unit
The function of the product is cotton fibre for further processing in the textile industry. The
functional unit is 1000 kilograms (kg) of cotton fibre at the gin gate. System boundaries are
shown in Figure 2-1. Please note that differences in fibre quality are not considered in this
study.
2.2.5 Data collection
Primary data for organic cotton cultivation was co-ordinated directly by the producer groups
or external data collectors under facilitation of Textile Exchange. Specifically adapted ques-
tionnaires to collect inventory data for agricultural systems are used. These questionnaires
were filled out by local consultants or directly by representatives of producer groups. Upon
return to PE, these data are subjected to quality/plausibility checks and benchmarking
against literature, internal datasets, the FAO STAT database (FAOSTAT) and other primary
cultivation data to ensure reliable results. No major deviations were detected. However, no
independent on-site verification was performed. Technological-, geographical- and time ref-
erence as well as an assessment of data quality are described in the following paragraphs.
Transportation to the gin also derived from primary data collection. Ginning can be ade-
quately described with the electricity consumption used for the process and the ratio of by-
products (seed and fibre) and waste.
Most relevant agricultural input data is summarized in Table 8-1 (per region) and Table 8-6
(weighted average).

19
2.2.6 Technological and geographical reference
Organic cotton farming worldwide produced around 110,000 t of fibre in the most recent
survey of Textile Exchange in 2012-2013, grown in 18 countries around the globe, of which
the top five countries make up over 95% and India alone close to 75% (see Table 2-2).
Indian organic cotton production has been investigated by an in-depth LCA study resulting
in a Master thesis (SLOTYUK 2013) that is the pre-cursor of the current study. In India, nine
producer groups provided data, representing five of the six Indian states where organic
cotton is produced. In the current study, a further four countries are surveyed to receive
primary data of cultivation in order to complement the geographical representativeness of
the present work. These are: Turkey, China, Tanzania and USA. For Turkey, two sub-re-
gions are differentiated: Aegean and South East Anatolia. For the US, irrigated and rain-fed
cultivation are assessed separately.
Since the number and size of organic cotton producer groups vary worldwide, the repre-
sentativeness for each region is achieved either by a sufficiently large surveyed area or a
sufficiently high number of farmers participating. The geographic coverage achieved in data
collection is shown in Table 2-2.
Table 2-2: Top organic cotton producing countries worldwide (Source: TE, Farm and Fibre Report 2012-13 (TE 2012-13))
Country Fibre Production
(t)
Fibre Production
(% of total)
India 80 794 73.6%
China 10 269 9.4%
Turkey 7 105 6.5%
Tanzania 6 504 5.9%
US 1 930 1.8%
Burkina Faso 565 0.5%
Egypt 563 0.5%
Mali 531 0.5%
Uganda 456 0.4%
Peru 368 0.3%
Kyrgyzstan 260 0.2%
Benin 228 0.2%
Paraguay 75 0.1%
Nicaragua 68 0.1%
Tajikistan 50 0.0%
Israel 30 0.0%
Senegal 21 0.0%
Brazil 10 0.0%
GRAND TOTAL 109 826 100.0%

20
2.2.7 Time reference
Agricultural activity data is influenced by climatic conditions and thus large variations can
occur between different seasons. It is therefore recommended to use averages of several
cultivation periods to compensate these variations. However, this recommendation could
not always be met in the current study due to budget and time restriction in data collection.
The time reference of data collection differs regarding the considered regions. Time refer-
ence for India in general is 2011/2012, with some producer groups providing average data
of several years. Data for the other countries refers to 2012/2013, China provides a five
years average. A summary of time reference can be found in Table 2-3.
Table 2-3: Geographical and time reference in data collection
*Different time periods in different regions/ producer groups
2.2.8 Background data
Necessary life cycle inventories for upstream processes (e.g. fuel production, provision of
electricity) are available in the GaBi 6.3 database (GABI 6.3 2013). The last update of the
database was in 2013. A list of the most relevant GaBi datasets used are listed in Table
8-7.
Country India Turkey China Tanzania USA
Sub-Region Madhya Pradesh MP), Maharashtra (MH),
Odisha (OR), Andhra Pradesh (AP),
Rajasthan (RJ),
Aegean and South East
Anatolia
Hutubi, Xingjang
Meatu and Mwasa District
Lubbuck irrigated,
non-irrigated
Country share (produced mass) in global production (2013)
74% 6% 9% 6% 2%
Sub-Region share as % of country to-tal production
98% 100% 95% 72% 89%
% of area repre-sented by produc-tion groups
14% 85% 26% 34% 89%
% of production (lint) represented by production groups
18% 83% 35% 46% 89%
Number of farmers represented
14 000 210 767 2 202 30
Time frame 2008 – 2012* 2012/2013
2009-2012/ 2013
2012/2013 2012/2013

21
2.2.9 Assessment of data quality
Representativeness
Technological: All primary and secondary data are modelled to be specific to the technolo-
gies or technology mixes under study. Technological representativeness with regard to the
goal and scope of this study is considered to be good.
Geographical: For each region, a large share of the regions cultivating organic cotton is
represented by the collected data (Table 2-3). All primary and secondary data are collected
specific to the countries / regions under study. Where country specific data for background
processes are unavailable, proxy data are used. Models are built separately for each coun-
try. At the same time, the primary data used are aggregated in order to represent variability
within each country adequately. Geographical representativeness with regard to the goal
and scope of this study is considered to be very good to good.
Temporal: Time reference for primary data collected differs (2011/2012 – 2012/2013). Av-
erage over several cultivation periods is not available for every region. All secondary data
come from the GaBi 2013 databases and are representative for the years 2009-2013 (GABI
6.3 2013). Temporal representativeness with regard to the goal and scope of this study is
considered to be fair.
Completeness
All relevant process steps are considered and modelled to represent each specific situation.
The process chain is considered sufficiently complete with regard to the goal and scope of
this study. Excluded material and energy flows are described in chapter 2.2.3.
Reliability
Primary data are collected using a specifically adapted spreadsheet for agrarian systems.
Cross-checks concerning the plausibility of mass and energy flows are carried out on the
data received. Similar checks are made on the software model developed during the study.
Inventory data and their implementation into the agricultural model have been critically re-
viewed (see 2.3). The agricultural model itself is part of the GaBi 2013 databases (GABI 6.3
2013) which have been recently reviewed by an external auditing company (DEKRA). Over-
all the data quality with regard to the goal and scope of this study can be described as good.
Consistency
To ensure consistency, all primary data are collected with the same level of detail, while all
background data were sourced from the GaBi databases (GABI 6.3 2013). Allocation and
other methodological choices are made consistently throughout the model.
The assessment of data quality is based on the semi-quantitative assessment described in
the ILCD handbook (ILCD 20100), Annex 12. The criterion for good data quality is defined
as follows (ibid, Table 6, p331): “meets the criterion to a high degree, having little yet sig-
nificant need for improvement. This is to be judged in view of the criterion's contribution to
the data set's potential overall environmental impact and in comparison to a hypothetical
ideal data quality." Please refer to the ILCD handbook for further details on data quality
indicators. The overall data quality using the data quality rating (DQR) suggested by ILCD
20100, would result in an overall data quality indicator of good (2.4), giving a score of good
to geographical representativeness, to methodological appropriateness and consistency.

22
2.2.10 Allocation
Allocation in the foreground data
When a system yields more than one valuable output, as it is the case for cotton production,
environmental burden is allocated, i.e. split between the co-products. During cotton produc-
tion, two valuable co-products are produced, cotton fibre (main product) and cottonseed
(further used for oil extraction, the cake used as animal feed); thus the environmental bur-
den is allocated to both the fibre and the seed. Several allocation methods are used in LCA
studies: mass-based (the heavier product is assigned more burden), substitution (subtract-
ing off the environmental impact of a product that is replaced by the co-product, for example,
accounting for the amount of soybeans replaced by cottonseed), and economic (splitting
the burden based on monetary values). It is determined that economic allocation is the most
suitable method to use for this study. In the baseline scenario, the allocation method applied
in the COTTON INC. 2012 study is followed in order to align with that study. There, market value
is chosen as the method of allocation as it describes best the demand that drives production
of both products. Based on a global survey of market prices, an average allocation factor of
84:16 for fibre and seed was calculated, respectively (COTTON INC. 2012).
The principle of allocation is illustrated in Table 2-4. The table shows the inputs and outputs
at the gin and different allocation factors. The values are given exemplary for India. Please
refer to Table 8-5 for foreground data for the gin for other regions.
Table 2-4: Allocation at the gin – inputs, outputs and allocation factor (example India)
Inputs
Electricity MJ/kg lint 0.57
Seed cotton kg/kg lint 2.8
Allocation of environmental burden of inputs (electricity and seed cotton) to outputs
Outputs by mass economic (price) no allocation
Gin waste 0.3 kg/kg lint 11% 0% 0%
Seed 1.5 kg/kg lint 53% 16% 0%
Lint 1.0 kg/kg lint 36% 84% 100%
The disadvantage of an economic allocation is the fact that the prices for the main product
and the co-product can vary widely, both regionally and temporally. Additionally, market
distortions such as subsidies might further influence the results. This is why a sensitivity
analysis in section 5.1.4 investigates the result deviation of the system to the price variation
within existing ranges using primary data and a best and worst case (no allocation, all bur-
den attributed to the main product) analysis.
As discussed in chapter 3.4 many farmers practice intercropping (i.e. the agricultural prac-
tice of cultivating two or more crops in the same space at the same time). Often the intercrop
is not harvested but used as green manure. Even if the intercrop is sold, the total average
revenue is negligible compared to revenues from cotton (approx. 0.5%, EYHORN 2007). Thus,
no allocation was made to share burdens between intercrop and cotton.

23
Allocation of upstream data
For all refinery products, allocation by mass and net calorific value has been applied. The
specific manufacturing route of every refinery product is modelled and so the impacts as-
sociated with the production of these products are calculated individually. Two allocation
rules are applied:
1. The raw material (crude oil) consumption of the respective stages, which is necessary
for the production of a product or an intermediate product, is allocated by energy
(mass of the product * calorific value of the product); and
2. The energy consumption (thermal energy, steam, electricity) of a process, e.g. atmos-
pheric distillation, being required by a product or an intermediate product, are charged
on the product according to the share of the throughput of the stage (mass allocation).
Materials and chemicals needed used in the manufacturing process are modelled using the
allocation rule most suitable for the respective product. For further information on a specific
product see the online documentation of the GaBi Databases (GABI 6.3 2013).
In addition to the above mentioned allocation methods for refinery products and materials,
inventories for electricity and thermal energy generation also include allocation by eco-
nomic value for some by-products (e.g. gypsum, boiler ash and fly ash). In case of plants
for the co-generation of heat and power, allocation by exergy is applied.
Recycling
Recycling does not take place in the system under investigation.
2.2.11 LCIA methodology and types of impacts
A detailed description of the chosen LCIA methodology and types of impacts assessed is
given in chapter 4.1.
2.2.12 Software and database
The LCA model is created using the GaBi 6.3 Software system for life cycle engineering,
developed by PE INTERNATIONAL AG. The GaBi LCI database (GABI 6.3 2013) provides
the life cycle inventory data for several of the raw and process materials obtained from the
background system. The most recent update of the database was in 2013.
24
2.3 Critical Review
2.3.1 The critical review process
The critical review process shall ensure that:
Methods used to carry out the LCA are consistent with ISO 14040 and ISO 14044;
Methods used to carry out the LCA are scientifically and technically valid;
Data used are appropriate and reasonable in relation to the goal of the study;
Interpretations reflect the limitations identified and the goal of the study; and
The study report is transparent and consistent.
The critical review is performed in concurrence with the study. The milestones at which the
reviewer(s) may submit comments and recommendations are:
1. The goal and scope definition;
2. Mid-term review: inventory analysis, including data collection and modelling; impact
assessment and life cycle interpretation;
3. Review of the draft final report.
A critical review report documenting the critical review process and findings, including de-
tailed comments from the critical review panel, as well as corresponding responses from
the practitioner and a critical review statement (document aggregating the conclusions from
the reviewers regarding the LCA study, and stating unambiguously whether the LCA study
is in conformance with ISO 14040 and ISO 14044) will be issued for the final version of the
LCA report. The review statement can be found in section 8.4.
2.3.2 The critical review panel
The Critical review is performed by a panel composed of:
Paolo Masoni, Head of LCA and Ecodesign Laboratory at ENEA, President of Italian Net-
work of LCA, Italy – acting as chair of the panel
Paolo Masoni is Research Director at ENEA where he is head of the LCA and Ecodesign
Laboratory with overall 20 full time researchers, grant holders and PhD students. He coor-
dinated several European projects on LCA and related topics. He is president of the Italian
LCA Network (www.reteitalianalca.it) and was President of SETAC Europe
(www.setac.org). Presently, he is the Italian representative in the Technical Advisory Board
of PEF/OEF c/o European Commission. He was appointed as Expert in National (UNI) and
International (ISO) Standardisation Bodies. He is member of the editorial board of Clean
Technologies and Environmental Policy (Springer) and of Journal of Environmental Ac-
counting and Management (L&H) and works as peer reviewer for several international jour-
nals (IJLCA, JCP, PIE, Ecological Indicators, etc.).
He was appointed as evaluator of project proposals for the FP7 program, as reviewer of the
ELCD database and as responsible for the analysis of the effort required to make commer-
cial LCI databases compliant with the ILCD and PEF quality requirements.
Paolo Masoni acted as reviewer of many LCA studies and data sets covering a broad spec-
trum of technologies and processes. He performs evaluation of innovation & research pro-
jects for the Italian Ministry of Industry, the Italian Ministry of Research, the Czech Republic

25
government, other international research funding bodies and for regional government pro-
grams.
Paolo Masoni published more than 100 papers and reports.
Christian Schader, Department of Socio-Economic Sciences, Coordinator sustainability,
Research Institute of Organic Agriculture (FiBL), Switzerland
Christian Schader is leading sustainability assessment activities at the Research Institute
of Organic Agriculture (FiBL) in Switzerland. He has studied agricultural sciences at the
University of Bonn and completed his PhD at the University of Wales, Aberystwyth, in agri-
environmental policy evaluation using life cycle assessment.
Christian’s work encompasses evaluations of environmental, economic and social aspects
of food production and consumption. This includes the development and application of
methods, models and tools (life cycle assessment, economic-environmental modelling, in-
dicator-based approaches) for analysing different environmental, economic and social as-
pects of food supply chains, farms and at national or global level.
Christian was also a co-author of the SAFA Guidelines (Sustainability Assessment of Food
and Agriculture Systems) published by the FAO. He has developed the SOL-Model which
allows analysing impacts of fundamental changes in the food sector on food availability,
human diets and the environment.
Niels Jungbluth, Chief Executive Officer of ESU-services Ltd., Switzerland
Dr. Niels Jungbluth studied environmental engineering at the Technical University of Berlin.
He made his diploma thesis during a six month stay at the TATA Energy Research Institute
in New Delhi, where he prepared a life cycle inventory for cooking fuels in India. Between
1996 and 2000 he worked on a Ph.D. Project at the Swiss Federal Institute of Technology
(ETH) in Zurich at the chair of Natural and Social Science Interface. His Ph. D. thesis on
the environmental consequences of food consumption has been awarded with the Green-
hirn Price 2000 by the German Öko-Institut. In this thesis he investigated food consumption
patterns by means of life cycle assessment.
He started working with ESU-service in 2000. Between 2006 and 2012 he was managing
partner together with Rolf Frischknecht. Since 2012 he acts as a chief executive officer. His
main working areas are food, biomass, energy systems, input-output-analysis and sustain-
able consumption. He is responsible for the SimaPro centre and the data-on-demand ser-
vice of ESU.
Dr. Niels Jungbluth is in the editorial board of the “Int. Journal of LCA” and works as reviewer
for several other scientific journals. He works as a special expert for several organisations
as e.g. Deutsche Bundesstiftung Umwelt, United Nations Framework Convention on Cli-
mate Change UNFCCC, CEN TC 383 standard (GHG accounting on biofuels), UNEP-
SETAC life cycle initiative, Swiss law on tax exemption for biofuels.

26
3 Life cycle inventory (LCI) analysis
3.1 Agricultural Model
Agrarian systems belong to the most complex production systems within LCA due to their
dependence on environmental conditions that are variable in time (e.g. within a year, from
year to year) and in space (e.g. varies by country, region, site conditions). The following
factors contribute to the complexity of agricultural modelling:
The variety of different locations,
High variability of soil characteristics within small scale,
The large number and diversity of farms,
The variety of agricultural management practices applied,
No determined border to the environment,
Complex and indirect dependence of the output (harvest, emissions) from the input (fertilizers, location conditions etc.),
Variable weather conditions within and between different years,
Variable pest populations (insects, weeds, disease pathogens, etc.)
Different crop rotations
The difficulty to directly measure emissions from agricultural soils due to the time and resource intensity of such measurements
Due to the inherent complications characterizing an agricultural system, a nonlinear agrar-
ian calculation model is applied displaying plant production (developed by the LBP of the
University of Stuttgart and PE INTERNATIONAL); this software model covers a multitude
of input data, emission factors and parameters. The GaBi model is used for cradle-to-gate
(seed-to-bale) environmental impact assessment associated with planting, growing, har-
vesting, processing, handling, and distribution of cotton. For annual crops, a cultivation pe-
riod starts immediately after the harvest of the preceding crop and ends after harvest of the
respective crop.
3.2 Nutrient Modelling
Nitrogen plays a fundamental role for agricultural productivity and is also a major driver for
the environmental performance of an agricultural production system. For these reasons it
is essential to evaluate all relevant nitrogen flows within, to and from the agricultural system.
The agricultural model accounts for the nitrogen cycle in agricultural systems. Atmospheric
deposition of nitrogen is considered as an input into the system based on the values pro-
vided in GALLOWAY ET AL. 2004. The model includes emissions of nitrate (NO3-) in water and
nitrous oxide (N2O), nitrogen oxide (NOx) and ammonia (NH3) into air. The model ensures
that emissions from erosion, the reference system (comparable non-cultivated land area)
and nutrient transfers within crop rotations are modelled consistently.

27
Figure 3-1: Nitrogen system flows; the figure shows sinks (black arrows) and sources (blue arrows) of the nitrogen cycle. Source: PE INTERNATIONAL AG, 2011.
The different N-based emissions are calculated as follows:
NH3 emissions to air from organic fertilizers are adapted from the model of BRENTRUP ET AL. 2000 and modelled specifically for the cropping system dependent on the fertilizer-NH4
+ content, the soil-pH, rainfall and temperature. As no mineral nitrogen fertilizer are used in the system under study, the selection of specific NH3 emission factors for different mineral fertilizers does not apply.
NO is an intermediate product of denitrification. Denitrification is a process of mi-crobial nitrate reduction that ultimately produces molecular nitrogen (N2) through a series of intermediate gaseous nitrogen oxide products. NO emissions are calcu-lated as 0.43% of the N-fertilizer input specific for the cultivation system as NO according to BOUWMAN ET AL. 2002.
N2O is another intermediate product of denitrification, with a large global warming potential. According to IPCC 2006, N2O emissions are calculated as 1% of all avail-able nitrogen including nitrogen applied with fertilizers, atmospheric deposition, mi-crobial nitrogen fixation, nitrogen available from previous crop cultivation and indi-rect emissions.
NO3- emission to groundwater is calculated based on available nitrogen derived
from a nitrogen balance (N not lost in gaseous form or taken up by the plant, stored in litter, storage in soil, etc). Depending on the leaching water quantity and soil type, a fraction of this available nitrogen is calculated to be leached as nitrate. Water available for leaching is estimated as Potential leaching = Precipitation + Irrigation – Evapotranspiration – Runoff, where evapotranspiration is estimated us-ing the formula described in THORNTHWAITE 1948. The actual amount of water leached depends on the water retention capacity of the soil.
Norg and NO3–emissions to water occur due to erosive surface run-off. Please see
chapter 3.4 below for a description of soil erosion modelling.

28
The nitrogen balance in the model is closed: Ninput = Noutput for the examined cultivation crop.
If any cultivation processes are to yield a net nitrogen reduction or accumulation in the soil,
this difference would be balanced by additional/reduced external fertilizer demand. The ni-
trogen balance is calculated as net nitrogen surplus or deficit after accounting for leaching
and mineralization. Therefore, the amount of N being fixed in humus in the long run is as-
sumed constant. This adjustment addresses the long-term effects of cultivation systems
without fertilizer application which tend to reduce the nutrient pool in soil, thereby reducing
the growth potential of the site. Compared to a pure N-balance model, this approach allows
the consideration of nutrient deficits in case of low N-fertilization. In the case of high N-
fertilization (e.g. intensive farming systems), the models correspond with the total N-balance
approach.
A specific feature of the agricultural model is its consideration of temporal differences in the
leaching potential of nutrients. The cultivation period is divided into two phases, defined by
the point in time where the nutrient uptake by the main crop will significantly reduce the
availability (and therefore leaching potential) of nutrients in the soil (typically when at least
10% of the biomass of the final plant is established). The leaching potential is assessed for
both phases separately. The temporal differentiation also allows considering the impact of
cover crops (temporal storage and prevention of leaching of nutrients before main crop is
established).
Besides nitrogen-based emissions to water and air, phosphorus emissions are taken into
consideration in the model. Phosphorous emissions are typically dominated by surface run-
off of soil to surface water, causing eutrophication of water bodies, thus they are directly
related to soil erosion. Please see chapter 3.4 below for a description of soil erosion mod-
elling.
Cattle manure and compost are considered to be waste products from another production
system (animal keeping) and enter the system burden free (see also 2.2.3 and 5.1). Their
contribution to nutrient availability is considered.
3.3 Carbon Modelling
Carbon-based emissions such as CH4, CO, CO2 are considered in foreground and back-
ground datasets. Background datasets include emissions resulting from production of ferti-
lizer, pesticides, electricity, and diesel while foreground datasets contain emissions such as
CO2 due to combustion of fossil fuels by the tractor or irrigation engines and application and
decomposition of urea fertilizer in the soil.
Soil carbon is another potential source or sink of carbon dioxide. Soil carbon balances are
used to describe any increase or decrease in soil organic carbon (SOC) content caused by
a change in land management, with the implication that increased/decreased soil carbon
(C) storage mitigates or increases climate change. A recent study by GATTINGER ET AL. 2012
has reviewed 74 studies from pairwise comparisons of organic vs. nonorganic farming sys-
tems to identify differences in soil organic carbon (SOC) accumulation. GATTINGER ET AL. 2012
conclude that organic farming has the potential to accumulate soil carbon. However, the
authors also clearly communicate the many uncertainties in quantifying the amount of car-
bon stored. As an example, the assessed positive difference in SOC concentrations and C
sequestration rates between organic and nonorganic systems does not reveal whether this
change goes along with a net carbon gain due to conversion from conventional to organic

29
farming or whether it rather reflects a reduced carbon loss if compared with the nonorganic
treatment (GATTINGER ET AL. 2012). Furthermore, the meta-analysis confirms that carbon se-
questration follows sink saturation dynamics, i.e. that C sequestration rates are not constant
and could approach zero if assessed over a longer time period. Such uncertainties led to
the approach commonly practiced in LCAs of agricultural products to not to consider soil
carbon sequestration, also followed by COTTON INC. 2012 and the present study.
Natural soils can also act as greenhouse gas sinks, related predominantly to the methane
depression function of natural soils due to their oxidizing and microbial transformation of
methane (SCHMÄDEKE 1998). Differences between cultivated and natural soils in their me-
thane depression function are considered. Data for methane oxidation in cultivation systems
are taken from various sources e.g. (SCHMÄDEKE 1998, LE MER AND ROGER 2001, POWLSON ET
AL. 2011).
The biogenic CO2 sequestered in the cotton fibre is directly accounted for in the inventory
as an input or uptake of carbon dioxide, which is treated as a negative emission of carbon
dioxide to air. However, the carbon uptake in the cotton fibre is not considered in impact
assessments as it is only temporally stored in the product and will be released at the End
of Life of the product.
3.4 Soil data and soil erosion
The agricultural model uses data on soil texture to estimate the leaching potential. Where
soil types are not specified in primary data collection, they are specified using the World
Soil Database v 1.2 (IIASA 2012). As mentioned above, soil erosion is an important potential
contributor to eutrophication. However, it is very difficult to generalize erosion rates and
deposition rates, as they are highly dependent on regional conditions such as climate, relief,
soil type, crop cultivated and vegetation. The default soil erosion rates are estimated based
on USDA data on vulnerability to soil erosion (USDA 2003) and soil erosion rates reported
by Wurbs and Steiniger (WURBS & STEINIGER 2011). For India, more specific erosion rates
were reported by Kothyari (KOTHYARI 1996). It is assumed that 10% of the eroded soil ac-
cesses the waters, based on evaluation of different literature sources (FUCHS AND SCHWARZ
2007, HILLENBRAND ET AL. 2005, HELBIG ET AL. 2009, NEARING ET AL. 2005), while the rest accumu-
lates to colluviums on other surfaces and is assumed irrelevant in the life cycle assessment.
The nutrient content of the soil entering surface water with soil erosion was assumed to be
0.05% for phosphor, 0.6% for nitrogen (organic bound) and 0.4% for nitrate – representing
values from literature independent from soil management practices.
Organic agriculture promotes several soil protection measures that prevent soil erosion. A
recent survey conducted by Textile Exchange revealed that such protection measures are
implemented by a large majority of farmers (see Figure 3-2).

30
Figure 3-2: Implementation of soil protection measures among organic cotton farm-ers (Source: Textile Exchange 2013, unpublished)

31
For details on how these measures help to protect the soil and reduce soil erosion please
refer to the publication by Blanco-Canqui (BLANCO-CANQUI 2008). The following soil erosion
reduction potentials are assumed in this study:
Table 3-1: Soil erosion reduction potential of different soil protection measures (own compilation based on the publication by Blanc-Canqui (Blanco-Canqui 2008))
Measure against soil erosion Approx. soil erosion reduction potential
Crop rotation (instead of monoculture) 30%
Crop rotation with non-row crops (e.g. grass) 90%
No-tillage 90%
Filter stripes (field barriers) 70%
Cover Crops 90%
Application of organic fertilizer (increased SOM content) 80-95%
Crop residues remaining on the field 85-98%
Intercropping >90%
In conclusion, a 90% reduction of soil erosion is assumed for organic farming, i.e. only 10%
of the estimated default erosion rates (described above) are considered in this study.
3.5 Ginning
The ginning process comprises electricity used to prepare the seed cotton into the cotton
fibre ready for shipping to the spinning mills. The impact of electricity provision depends on
the country-specific grid mix, i.e. on the share of fossil and non-fossil resources used for
energy provision. In this process two valuable by-products, seed and fibre, are separated
from each other and from the waste. The allocation of environmental impacts takes place
at this point: based on the market place calculated during the Cotton Inc. study (COTTON INC.
2012), 84% of impacts are allocated to the cotton fibre and the remaining 16% are allocated
to the seed (see 2.2.10). The gin waste (broken seeds, fibres and plant residues) leaves
the system burden free (see 2.2.3). The foreground data used in the gin model are given in
Table 8-5.

32
4 Life cycle impact assessment (LCIA)
4.1 Introduction to the impact assessment
The software model described above enables the calculation of various environmental im-
pact categories. The impact categories describe potential effects of the production process
on the environment. Environmental impact categories are calculated from “elementary” ma-
terial and energy flows (a summary of relevant input and output elementary flows can be
found in Table 8-8. Elementary flows describe both the origin of resources from the envi-
ronment as basis for the manufacturing of the pre-products and generating energy, and
emissions into the environment, which are caused by a product system.
As different resources and emissions are summed up per impact category the impacts are
normalised to a specific emission and reported in “equivalents”, e.g. greenhouse gas emis-
sions are reported in kg CO2 equivalents. This step requires the use of characterization
factors, of which different are published and in use. In order to align with the Cotton Inc.
study to the highest possible degree, it has been decided to follow the CML methodology
published by the Institute of Environmental Sciences, University of Leiden. The CML char-
acterization factors are widely used and respected within the LCA community. The most
recently published list of characterisation factors “CML 2001 – Apr. 2013” has been applied.1
In the following a summary of the chosen impact categories and characterization models as
well as reasons for selecting these impact categories is given. Please refer to section 8.3
for detailed information.
Climate change is chosen as impact category as climate change is deemed to be one of
the most pressing environmental issues of our times and there is a large public and institu-
tional interest in the subject. The category indicator results are kg of CO2 equivalents per
functional unit. Please note that the carbon uptake in the cotton fibre is not considered as it
is only temporally stored in the product and will be released at the End of Life of the product.
The displayed GWP considers the fossil emissions only.
Acidification, causing e.g. acid rain, and eutrophication, also known as over fertilization, are
chosen because they are closely connected to air, soil, and water quality and are relevant
and discussed environmental aspects of agricultural systems. The category indicator results
are kg SO2 (acidification) or PO43- (eutrophication) equivalents per functional unit.
The importance of water use in agricultural systems is evident. This is why an environmental
assessment of water use is specifically important in assessment of agricultural products. In
this study, methods and terminology as defined by the UNEP/SETAC working group on
water and in the new ISO standard are used (BAYART ET AL. 2010, PFISTER ET AL. 2009, ISO
14046). According to these publications, the following terms are used:
1 The Product Environmental Footprint initiative of the European Commission - including its suggested methodologies, im-
pact assessment methods and indicators - are currently drawing a lot of attention. The indicators which are recommended for a Product Environmental Footprint are under scientific discussion (FINKBEINER 2013) and are most likely due to changes within this initiative as the Product Environmental Footprint pilot phases are ongoing while this study was per-formed. The selection of LCIA methods of the Product Environmental Footprint are based on ILCD recommendations and took place in in 2010. Only methods in place in 2009 were considered. The calculation method for the indicator GWP is similar for CML and according to PEF recommendations. All this said it should be stated that other impact assessments methods than CML could be applied with the existing models in a possible future updates of the dataset.

33
Water use: use of water by human activity: Use includes, but is not limited to, any
water withdrawal, water release or other human activities within the drainage basin
impacting water flows and quality.
Water consumption: water removed from, but not returned to the same drainage
basin. Water consumption can be because of evaporation, transpiration, product
integration or release into a different drainage basin or the sea. Evaporation from
reservoirs is considered water consumption.
Surface water: water in overland flow and storage, such as rivers and lakes, exclud-
ing seawater.
Groundwater: water which is being held in, and can be recovered from, an under-
ground formation.
Green water refers to the precipitation on land that does not run off or recharges the
groundwater but is stored in the soil or temporarily stays on top of the soil or vege-
tation. Eventually, this part of precipitation evaporates or transpires through plants.
Green water can be made productive for crop growth.
Blue water refers to water withdrawn from ground water or surface water bodies.
The blue water inventory of a process includes all freshwater inputs but excludes
rainwater.
Please refer to section 8.3 for details.
Non-renewable primary energy demand were chosen because of its relevance to energy
and resource efficiency and its interconnection with climate change, which are all of public
and institutional interest.
Two additional impact categories, eco-toxicity potential (ETP) and human toxicity potential
(HTP) are included in the LCA. The UNEP SETAC USEtox® characterization model is used
for both ETP and HTP assessment (ROSENBAUM ET AL. 2008ROSENBAUM ET AL. 2008). Human
effect factors relate to the quantity taken into the potential risk of cancerous and non-can-
cerous effects expressing cases per kg of chemical emitted. The final unit is comparative
toxic units (CTUh). Effect factors for freshwater ecosystems are based on species-specific
data of concentration at which 50% of a population displays an effect, expressed as an
estimate of the potentially affected fraction of species (PAF) integrated over time and vol-
ume per unit mass of a chemical emitted (PAF m3-day/ kg). The final unit is comparative
toxic units (CTUe).
Pesticides are known to be the major contributor to toxicity in agricultural products (see also
COTTON INC. 2012). As no conventional pesticides are used in organic farming (see page 15
for allowed substances functioning as pesticides), toxicity is not expected to be of im-
portance in organic cotton cultivation. The impact category is included to provide information
for possible further studies or comparisons, in order to capture the possible advantage of
organic cotton in this impact category.
It should be noted that the precision of the current USEtox® characterization factors is less
robust than for all other impact categories. For this reason, the USEtox® assessment con-
ducted in this study should only be considered as a screening assessment. This is why the

34
USEtox® assessment is not included in the regular impact assessment but shown sepa-
rately in section 8.1. For the same reason, no values are given for the USEtox® impact
category in the recent LCA of cotton fibre and fabric by Cotton Inc. (COTTON INC. 2012).
In the following table the considered environmental impacts are summarized:
Table 4-1: Environmental indicators for the assessment
Indicators Unit Reference
Environmental Impact Categories
Global Warming Potential (GWP) [kg CO2 eq] GUINÉE ET AL. 2001
Acidification Potential (AP) [kg SO2 eq] GUINÉE ET AL. 2001
Eutrophication Potential (EP) [kg Phosphate eq] GUINÉE ET AL. 2001
Additional Environmental In-dicators
Water use and consumption [m3] BAYART ET AL. 2010
Primary Energy Demand of fossil energy resources (Fossil Energy)
[MJ net calorific] N/A - Inventory level indicator
Screening Assess-ment of toxicity potential (USEtox)
Human Toxicity Potential (HTP) [CTUh] ROSENBAUM ET AL. 2008
Eco-toxicity Potential (ETP) [CTUe] ROSENBAUM ET AL. 2008
It shall be noted that the term potential in the characterisation of environmental impacts
indicates that the impacts could occur if the emitted molecules would (a) actually follow the
underlying impact pathway and (b) meet certain conditions in the receiving environment
while doing so. LCIA results are therefore relative expressions only and do not predict actual
impacts, the exceeding of thresholds, safety margins, or risks.
4.2 Categories of contribution
Field emissions
Emissions released from metabolic processes taking place in the soil being released into
air, water and soil, and emissions to water from soil erosion (see 3.1- 3.4).
Fertilizer
Includes resource use and emissions associated with the production of fertilizer (as de-
scribed in chapter 2.2.2, organic fertilizer are assumed to enter the system burden free;
impacts associated with this category are mineral fertilizer such as rock phosphate that are
used in organic farming systems).
Machinery
Includes the resource use and emissions associated with the running of vehicles and ma-
chines used for cultivation. This includes the production and combustion of fuels (diesel).
Irrigation
Similarly to machinery, this category refers to energy (diesel or electricity) used to run the
irrigation pumps.

35
Transport to the gin
Transport to the gin refers to the resource use and emissions associated with the production
and combustion of fuels (diesel) during the transportation of the seed cotton to the gin.
Ginning
Includes resource use and emissions associated with the ginning process (separation of
fibre and seeds, see 3.5).

36
4.3 Impact assessment results
4.3.1 Global Warming Potential – Climate change
The greenhouse gases for the production of 1000 kg organic cotton (global average) sum
up to about 1000 kg CO2 equivalents.
As shown in Figure 4-1 field emissions dominate this impact category with over 50% share.
Field emissions refer to gases emitted from soils due to agricultural activity. Essentially,
these emissions derive from microbial nutrient transformation processes in the soil. As a
result of such transformation processes, a fraction of the available total nitrogen becomes
inorganic nitrous oxide, also known as laughing gas, with a global warming potential almost
300 times higher than carbon dioxide. This gas is responsible for the largest share of GWP
within field emissions. Section 5.1.6 provides a scenario for the nitrous oxide emissions
assuming different emissions factors.
Figure 4-1: Global warming potential of the global average organic cotton fibre shown for 1000 kg of product at gin gate. First column in grey shows the total, whereas coloured bars show the absolute contribution of each process within the production chain. Relative contributions are shown in the pie chart inserted in the top right corner with colours matching the colours of the bars.
The contributions in the other aspects of cotton fibre production largely depend on the fossil
fuel combustion in each of the processes. Ginning is highly relevant (18%) because elec-
tricity provision in many countries has a high share of coal and other fossil fuels. Machinery
use is also significant (16%) as the combustion of fossil fuels releases carbon dioxide and
other greenhouse gases. Irrigation and transport to the gin contribute smaller amounts in
relation to the amount of fossil fuels they combust. The impact of fertilizer is almost negligi-
ble due to the fact that very little mineral fertilizer is applied and organic fertilizer is modelled
burden-free (see 2.2.3). A sensitivity analysis (section 5.1) shows the response of the re-
sults to a simplified calculation of environmental impacts associated with the provision of
manure.

37
Please note that the results shown here do not account for the (temporal) uptake of CO2 in
the fibre. Assuming a carbon content of 42% in the fibre (COTTON INC. 2012), 1540 kg CO2
are stored in the product. As cotton is a short-lived consumer good, this carbon dioxide is
released later at the end-of-life in the product, so that it is only temporarily stored. This is
why the carbon uptake is not considered in the impact assessment in this study. If it was
considered, the GWP for organic cotton would be negative, i.e. -562 kg CO2-equiv. per 1000
kg lint cotton. The GWP impact method used in this study refers to a time frame of 100
years (GUINÉE ET AL. 2001). Assuming a lifetime of the fibre of 10 years (highly uncertain value
because of the different use patterns of textiles), 10% of the carbon stored in the product
could be credited as a reduction in global warming potential. That is a potential reduction in
GWP of 154kg, or 15%. However, given the large uncertainty of the expected lifetime of the
final product, as a conservative approach the temporal storage of CO2 in the product is not
considered in the results shown below.

38
4.3.2 Acidification Potential
Evaluating the global average organic cotton fibre production has resulted in an acidification
potential (AP) of ca. 6 kg SO2-equivalents for 1 metric ton of fibre. At a first glance, the
contribution analysis paints a similar picture to that of Global Warming: Field emissions
contribute the most followed by ginning and machinery. However, all three of the mentioned
contributors have very similar shares between ca. 20 and 30%. The similarity is due to the
fact that both AP and GWP are influenced by fossil fuel combustion processes. While CO2
emissions contribute to GWP, the parallel releases of SO2 and nitrogen oxides increase AP.
In addition to mentioned gases, ammonia is an important contributor to acidification with an
AP 1.6 times higher than SO2.
The impact of field emissions is dominated by ammonia (in dependence of the amount of
nitrogen applied) whereas nitrogen oxides and sulphur dioxide emissions influence other
processes within the production chain of organic cotton fibre. Sulphur dioxide production is
dependent on the type of fossil fuel used and nitrogen oxides depend on conditions of the
combustion process, therefore the amount and type of fuels used determine the order of
importance in the other categories (ginning, machinery, irrigation and transport to the gin).
Figure 4-2: Acidification potential of the global average organic cotton fibre shown for 1000 kg of product at gin gate. First column in grey shows the total, whereas coloured bars show the absolute contribution of each process within the production chain. Relative contributions are shown in the pie chart inserted in the top right corner with colours matching the colours of the bars.

39
4.3.3 Eutrophication Potential
Global average organic cotton fibre production has an eutrophication potential (EP) of close
to 3 kg PO43–equivalents. Figure 4-3 shows that EP is dominated by field emissions (80%)
and also influenced by machinery (11%), while all other processes of the production chain
combined contribute less than 10%. Eutrophication in agriculture can be significantly influ-
enced by soil erosion. Through soil erosion, nutrients are removed from the cultivated sys-
tem via water and soil and lead to the fertilization of neighbouring water bodies and soil
systems. EP is measured in phosphate-equivalents and is influenced mainly by P- and N-
containing compounds.
As described in chapter 3.4 soil erosion rates can be drastically reduced by soil protection
measures that are widely used among organic cotton farmers. Based on data used in this
study, low soil erosion rates could be assumed leading to relatively low EP. Due to the large
variability in soil erosion worldwide and the immense impact of protection measures, a sen-
sitivity analysis is shown in section 5.1. In addition to field emissions, machinery is worth
mentioning, since the fossil fuel-combusting engines release NOx emissions that also con-
tribute to EP.
Figure 4-3: Eutrophication potential of the global average organic cotton fibre shown for 1000kg of product at gin gate. First column in grey shows the total, whereas coloured bars show the absolute contribution of each process within the production chain. Relative contributions are shown in the pie chart inserted in the top right corner with colours matching the colours of the bars.

40
4.3.4 Water use and consumption
The global average total water use while producing 1000kg of organic cotton fibre is
15,000 m3. Table 4-2 compiles all water use and consumption data.
Table 4-2: Water use and consumption per 1000 kg organic cotton fibre (global aver-age). Uses in agriculture (irrigation) and in upstream processes (produc-tion of ancillary materials, fuels and electricity) are shown separately.
Upstream Agriculture
Blue water consumption [m3] < 1 181
Blue water use [m3] 12 704
Total water consumption [m3] < 1 14 072
Total water use [m3] 12 14 595
While total water use and consumption are almost the same implying that almost all water
used is consumed; 95% of water used is green water (rainwater and moisture stored in soil
and used for plant growth). About 97% of water use takes place in agricultural processes
(irrigation), and 3% derives from upstream processes (production of ancillary materials,
fuels and electricity). In summary, water is almost exclusively used in agriculture and almost
all of the water used is green water (Figure 4-4).
Figure 4-4: Water use of the global average organic cotton fibre shown for 1000kg of product at gin gate. Upstream processes include the manufacturing of fer-tilizer, fuels and other ancillaries.

41
Water use and consumption are much discussed aspects of sustainability assessments
within and beyond LCA. Much confusion has arisen from different usage of terminology,
thus it is not always clear what a “water footprint” actually means. Water use values are
only of limited informative value with regard to the environmental relevance of the water
withdrawal. Of much more interest is the water lost to the watershed, i.e. water consump-
tion, and hereby only the values for consumption of blue water (surface and ground water),
as it is assumed that precipitation would follow the natural hydrologic cycle regardless of
the land use type and therefore has no environmental burden from a LCA perspective (see
also section 8.3).

42
4.3.5 Primary Energy Demand
The global average organic cotton fibre has a primary energy demand (PED) from non-
renewable resources of ca. 5800 MJ, per 1 ton of product at gin gate. Non-renewable PED
is an indicator of the dependence on fossil resources. The contributor analysis (Figure 4-5)
shows that machinery (39%) and ginning (33%) are equally significant contributors. Unlike
in other fossil fuel combustion-determined categories such as GWP or AP, ginning plays a
slightly less important role than machinery, because of use of a variety of fossils. Electricity
relies on coal to a large degree in many of the studied regions. Diesel, on the other hand,
is used in running vehicles (machinery) and pumps (irrigation) and has a higher energy-to-
emission ratio than coal, for example.
PED represents an indicator for fossil resources. Only resource consuming process steps
influence this indicator (field emissions = 0). Other fuel uses such as irrigation and transport
to the gin are also relevant.
Figure 4-5: Primary energy demand (net calorific value) from non-renewable re-sources of the global average organic cotton fibre shown for 1000 kg of product at gin gate. First column in grey shows the total, whereas col-oured bars show the absolute contribution of each process within the pro-duction chain. Relative contributions are shown in the pie chart inserted in the top right corner with colours matching the colours of the bars.

43
5 Interpretation
5.1 Scenarios
In the following, the influence of important assumptions with regard to system boundaries
and modelling approaches on the final results are investigated by means of scenario anal-
ysis.
5.1.1 Provision of organic fertilizer
Manure management is an important contributor to the environmental impact of livestock
systems (see e.g. FAO 2010). Eventually, the manure is used as organic fertilizer in crop
systems. A common approach in LCA studies (independent if they are assessing crop sys-
tems, livestock systems or mixed systems) is to allocate the emission from manure man-
agement to the livestock system and the emissions of application to the crop systems (ISO
14044, IDF 2010). The rationale behind this approach in the LCA context is to consider ma-
nure as a waste product rather than a valuable co-product of the livestock system. This is
a pragmatic approach avoiding a highly uncertain and variable allocation (e.g. based on the
economic value) of the environmental burden of the livestock system to the manure. How-
ever, it is also obvious that manure can be considered as a valuable product in many differ-
ent production systems over the globe. As an example with specific relevance for this study,
(BIRADAR ET AL 2013) assessed contribution of livestock to the livelihood of farmers in India
(Maharashtra). Manure ranked second in a list of reasons to keep livestock after milk to sell.
7% of surveyed farmers even ranked manure as the main reason to keep animals.
The following scenario should assess to what extent the results of this study will change if
the assumption of burden-free provision of organic fertilizer is changed. Two different sce-
narios are generated:
A generic livestock model on extensive cattle raising (feedlot), from the GaBi 6.3 database
is used, to estimate the environmental impacts of a complete livestock system. 5% and 10%
of these impacts are allocated to the manure, representing the assumption that manure
represents 5% or 10% of the economic value of the outputs of that livestock system.
Regional specific emissions for manure management are modelled based on the IPCC Tier
1 approach (IPCC 2006), and completely allocated to the manure. This scenario represents
a change in the system boundaries, where the management and storage of the manure is
included in its provision. The usage of regionally specific emission factors from IPCC (IPCC
2006) allows capturing at least partially some of the regional differences in livestock keeping
in the different regions under investigation in this study. Different shares of dairy cows and
other cattle in different countries are also considered (based on data from FAOSTAT). The
results are given in the following table:

44
Table 5-1: Results of different scenarios for organic fertilizer provision
Indicator Unit Base- line
Livestock 5%
Livestock 10%
IPCC manage-
ment 100%
Acidification Potential (AP)
[kg SO2-Equiv.] 5.7 7.6 9.5 212.7
Eutrophication Potential (EP)
[kg PO43—Equiv.] 2.8 4.3 5.8 49.5
Global Warming Potential (GWP)
[kg CO2-Equiv.] 978 1 723 2 467 3 725
Primary energy from non-renewable resources
[MJ] 5 759 7 509 9 259 5 759
Blue water consumption
[m³] 182 199 216 182
It should be noted that the values given here should only be considered as a first screening
with high uncertainty. The generic livestock dataset might not be very well representing the
different livestock systems in the different regions under consideration. While the IPCC fac-
tors (IPCC 2006) are more specific with regard to livestock system and region, all of them
have a large uncertainty (+/- 30% for methane emissions, +/- 50% for nitrogen excretion,
factor 2 for N2O emissions and NH3 emissions; IPCC 2006). Both scenarios require estimat-
ing the amount of farm yard manure (FYM) produced per animal in a year, which is also a
very variable and thus uncertain factor.
Nevertheless, it can be seen that allocating an environmental burden from the livestock
system to the manure has considerable impact on the results for all environmental indica-
tors. If manure is assumed to represent 5% of the economic value in a livestock system
(thus carrying 5% of its burden), the global warming potential of the cotton production sys-
tem could almost double. To allocate all emissions occurring during manure management
to the manure is particularly unfavourable for the plant production system, because NH3
emissions, that almost exclusively occur in the manure management phase of livestock
production, are completely allocated to the manure, resulting in a disproportional increase
in acidification and eutrophication potential.
It might help to understand the results to do the following very rough calculation: if 10 t/ha
of manure are applied, and if a cow in India provides roughly 1 t of FYM per year (BIRADAR
ET AL 2013), 10 cows are needed to provide manure for one ha. If 10% of livestock burden is
allocated to the manure, then the impact of keeping one cow is added to each ha of cotton
cultivation.
In conclusion: the assumption of not allocating environmental burden to the provision of
organic fertilizer in LCA studies of plant production systems is rarely questioned, despite
the significant impact a deviation from this assumption can have. It is hoped that more stud-
ies will investigate the issue and will suggest a suitable and approach in the future.

45
5.1.2 Animal draught
Some farmers in India and Tanzania still use animal draught for soil cultivation. As stated
above, if draught animals are used, they are not only used for cotton cultivation but also for
various other crops and for other works such as transportation. This multipurpose use
makes an allocation of the impact of animal keeping to cotton difficult. This scenario should
investigate the change in results in case animal draught is included in the system bounda-
ries. The following calculations are a brief screening only based on estimates and second-
ary data, to assess if further investigation would be recommended. Table 5-2 summarizes
the estimates for the animal draught scenario.
Table 5-2: Parameter used in the animal draught scenario
Parameter Estimate Unit Source
GaBi GHG emission 14.6 kg CO2eq./
kg live weight animal* GABI 6.3 2013
Animal density* India average 0.4 animals per ha net sawn area
DIKSHIT AND BIRTHAL 2010
Animal density* Africa average 0.5 animals per ha net sawn area
SYSTAIN 2013
Use rate draught animals (cattle) 6% - Textile Exchange (India)
Use rate draught animals (buffalo) 13% - Textile Exchange (India)
Working hrs per ha (best case) 0.5 days PHANIRAJA AND PAN-
CHASARA 2009
Working hrs per ha (worst case) 1 days PHANIRAJA AND PAN-
CHASARA 2009
Liveweight cattle India 110 kg IPCC 2006
Liveweight buffalo 295 kg IPCC 2006
Liveweight cattle Africa 173 kg IPCC 2006
* Animals potentially used for draught, i.e. male cattle and buffalo
Two scenarios are investigated to allocate environmental burden of livestock keeping to the
draught power:
1. Allocation by use rate. Density of animals potentially used for draught times use rate
of animal draught reported by Textile Exchange
2. Allocation by time. The animal is used for draught work one day out of 365/ha.
For both scenarios global warming potential is taken as an indicator impact category.
Under scenario 1 animal draught would add 53kg of CO2 eq./1000kg to the GWP of organic
cotton fibre, i.e. 5%. Under scenario 2 it is 1.6kg CO2 eq./1000kg, increasing the GWP
results by 0.2%. Scenario 1 can be considered as a worst case scenario, because every
animal that is used for draught receives the full environmental impact of the livestock hus-
bandry system. It should be noted that according to BIRADAR ET AL 2013 the use of draught
power ranked second last out of six reasons to keep livestock (see also 5.1.1). However,
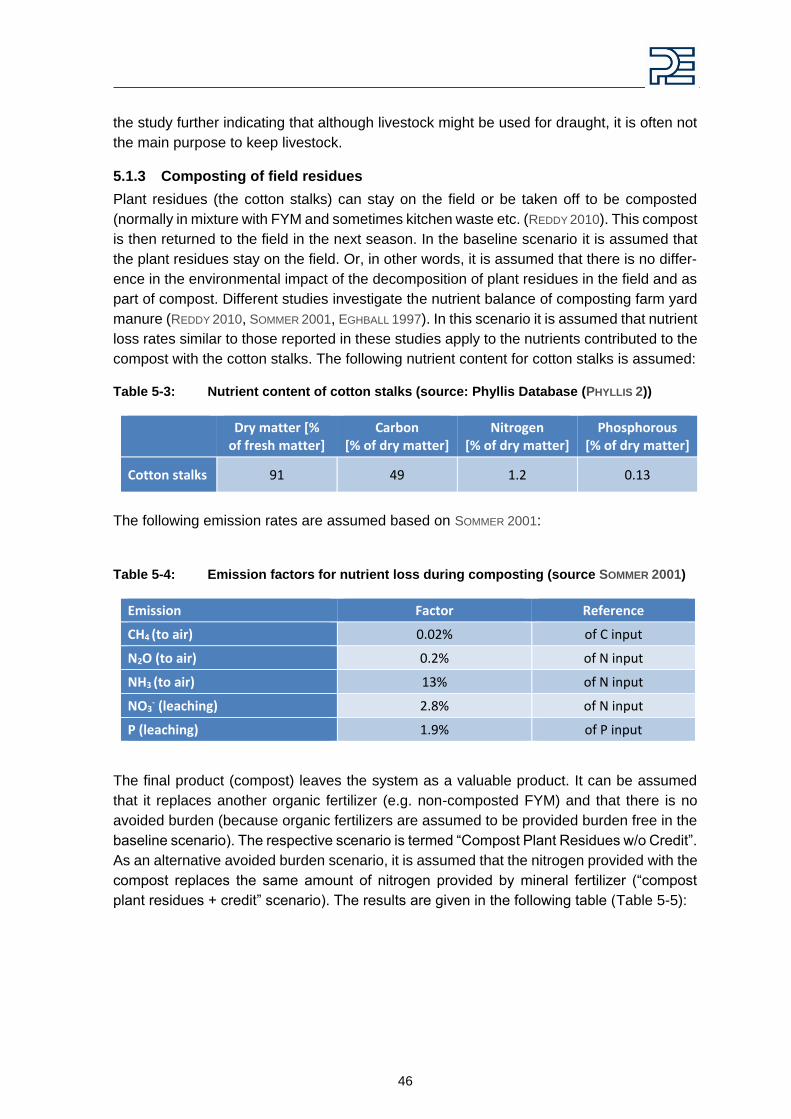
46
the study further indicating that although livestock might be used for draught, it is often not
the main purpose to keep livestock.
5.1.3 Composting of field residues
Plant residues (the cotton stalks) can stay on the field or be taken off to be composted
(normally in mixture with FYM and sometimes kitchen waste etc. (REDDY 2010). This compost
is then returned to the field in the next season. In the baseline scenario it is assumed that
the plant residues stay on the field. Or, in other words, it is assumed that there is no differ-
ence in the environmental impact of the decomposition of plant residues in the field and as
part of compost. Different studies investigate the nutrient balance of composting farm yard
manure (REDDY 2010, SOMMER 2001, EGHBALL 1997). In this scenario it is assumed that nutrient
loss rates similar to those reported in these studies apply to the nutrients contributed to the
compost with the cotton stalks. The following nutrient content for cotton stalks is assumed:
Table 5-3: Nutrient content of cotton stalks (source: Phyllis Database (PHYLLIS 2))
Dry matter [% of fresh matter]
Carbon [% of dry matter]
Nitrogen [% of dry matter]
Phosphorous [% of dry matter]
Cotton stalks 91 49 1.2 0.13
The following emission rates are assumed based on SOMMER 2001:
Table 5-4: Emission factors for nutrient loss during composting (source SOMMER 2001)
The final product (compost) leaves the system as a valuable product. It can be assumed
that it replaces another organic fertilizer (e.g. non-composted FYM) and that there is no
avoided burden (because organic fertilizers are assumed to be provided burden free in the
baseline scenario). The respective scenario is termed “Compost Plant Residues w/o Credit”.
As an alternative avoided burden scenario, it is assumed that the nitrogen provided with the
compost replaces the same amount of nitrogen provided by mineral fertilizer (“compost
plant residues + credit” scenario). The results are given in the following table (Table 5-5):
Emission Factor Reference
CH4 (to air) 0.02% of C input
N2O (to air) 0.2% of N input
NH3 (to air) 13% of N input
NO3- (leaching) 2.8% of N input
P (leaching) 1.9% of P input

47
Table 5-5: Results of different scenarios for composting of field residues
Indicator Unit Baseline Compost Plant Residues w/o
Credit
Compost Plant Residues with
Credit
Acidification Potential (AP)
[kg SO2-Equiv.] 5.7 24.5 24.3
Eutrophication Potential (EP)
[kg PO43—Equiv.] 2.8 8.4 8.3
Global Warming Potential (GWP)
[kg CO2-Equiv.] 978 1 105 927
Primary energy from non-renewable resources
[MJ] 5 759 5 759 4 140
Blue water consumption
[m³] 182 182 181
It can be seen that the assumption with regard to composting the plant residues has only
limited impact on the global warming potential. However, due to the large ammonia emis-
sions (13% of total nitrogen input with the cotton stalks) the acidification potential is in-
creased significantly, as well as the eutrophication potential.
Again, it should be noted that the values given here should only be considered as a first
screening with high uncertainty. To assume that the nitrogen organically bound in the stalks
is as susceptible to volatilization during composting as the much more easily available ni-
trogen compounds in FYM can be considered as a worst case assumption.
5.1.4 Allocation
Prices for lint cotton and seeds can vary widely, both regionally and temporally. Additionally,
market distortions such as subsidies might further influence the results. In order not to dis-
tort results by these variations, it makes sense to assume a fixed allocation ratio based on
the average prices in different regions and over time. In the LCA study on conventional
cotton, the allocation ratio was set to 84% for lint cotton and 16% for fibre. The same ratio
is used in this study (see 2.2.10). In the following section prices reported in primary data
collection (at gin gate) are investigated with regard to allocation. Please note that for the
LCA results, the relative relation of the prices for main product and co-product is important
and note the absolute value. A best case and worst-case for the allocation ratio is estab-
lished (AF_best, AF_worst), and the relative change in the results assuming one of these
cases is given. Additionally, the results are also recalculated for a “no allocation” scenario,
i.e. if the environmental burden is not shared between seeds and lint but is allocated to the
lint alone (an approach chosen by SYSTAIN 2013). The available prices and the resulting al-
location are given in the table below (Table 5-6).

48
Table 5-6: Prices for seed and lint and resulting allocation
Price (US$/kg) Allocation
Scenario Seed Lint Seed Lint
India (price for lint cotton high) Worst case 0.2 3.0 10% 90%
India (price for lint cotton low) 0.2 2.1 13% 87%
United States (primary data) Best case 0.7 2.8 25% 75%
Tanzania (primary data) 0.2 2.0 16% 84%
Mean value (unweighted) Base line 0.3 2.5 16% 84%
It can be seen that the allocation ratio chosen in the baseline scenario (used for this study)
does represent the average allocation ratio quite well. In the best case (Allocation Factor
best) only 75% of the overall environmental impacts are allocated to lint cotton (when prices
for cotton seeds are high); the allocation ratio does not exceed 90% for lint cotton in the
worst case (Allocation Factor worst). The following figure shows changes in the results for
GWP under the different allocation scenarios.
Figure 5-1: Global warming potential under different allocation scenarios
In the best case allocation scenario, the results are 11% lower than in the base line scenario.
In the worst case scenario the results would be 7% higher. If no allocation is applied, the
results would be 19% higher (the relative changes under the different allocation scenarios
in results apply to all impact categories, thus only GWP is shown as an example).

49
5.1.5 Soil protection
Eutrophication is typically influenced by leaching and soil erosion (see chapter 4.3.3). As
described in chapter 3.4, organic farming typically has soil protection measures imple-
mented, that also prevent soil erosion. To illustrate the benefit of these measures, the re-
sults for eutrophication potential under a scenario with full soil erosion are calculated (as
described in chapter 3.4, the baseline scenario assumes 90% reduction in soil erosion due
to these measures). Additionally, the results are also recalculated for a no-soil erosion sce-
nario, i.e. assuming that the soil protection measures in organic farming would prevent soil
erosion completely. The results are given in Figure 5-2.
Figure 5-2: Eutrophication potential under different soil erosion scenarios
It can be seen that soil protection measures limit the eutrophication to 23% of its full poten-
tial, i.e. to about a quarter of what it would be without any soil protection measures. Please
note that soil erosion data refer to area and are not influenced by yield. That means that the
lower the yield per ha, the higher the soil erosion per kg final product. This is why without
soil protection, the eutrophication potential in an extensive system could exceed the one of
an intensive system on a per kg basis (see also chapter 5.2.3).
5.1.6 Nitrous oxide emissions from agricultural soils
One important characteristic of agricultural systems is the difficulty to directly measure field
emissions. Field emissions can vary widely through atmospheric and site specific conditions
such as soil water content, soil texture, aeration, nutrient availability and pH value (SKINNER
ET AL 2014). Nevertheless, agricultural LCA models typically use the IPCC default emission
factors (IPCC 2006). Nitrous oxide emissions are specifically relevant with regard to global
warming potential, typically assessed with a 1% standard factor for direct emissions and a
calculation and parameter setting for indirect emissions (from volatilization and leaching)
from nitrogen inputs to field (IPCC 2006). The IPCC defines the uncertainty of the direct
emission factor as +/- a factor of three (i.e. 0.3% and 3%). A recent study by SKINNER ET AL
2014 provides a meta-analysis of studies that directly measured greenhouse gas fluxes from

50
agricultural soils under organic and non-organic management. The study found out that the
average emission rate for both, organically and non-organically managed soils are higher
than the IPCC 2006 default (2.84% and 2.19%, respectively). The study also found that the
emission factors for organic management were mostly beyond the range provided by the
IPCC, ranging up to 36%. The following table shows the change in the results for global
warming potential under the best case and worst case assumption for N2O emission factors,
both from IPCC 2006 and SKINNER ET AL 2014.
Table 5-7: Global warming potential of the global average organic cotton fibre shown for 1000 kg of product at gin gate under different scenarios for nitrous oxide emission factors
Emission factor (%)
GWP (kg CO2-Equiv./1000 kg fibre)
IPCC 2006 default (baseline) 1.0 978
IPCC 2006 (best case) 0.3 777
IPCC 2006 (worst case) 3.0 1 555
SKINNER ET AL 2014 (best case) 0.3 777
SKINNER ET AL 2014 (average) 2.8 1 509
SKINNER ET AL 2014 (median) 3.3 1 641
SKINNER ET AL 2014 (worst case) 36 11 066
It can be seen that the assumed emission factor for nitrous oxides has a large impact on
the final results. However, it should be noted that the uncertainty of default emission factors
is known and not specific to this study. It should also be noted that SKINNER ET AL 2014 them-
selves state that their data still is based on a limited amount of studies (N=20) due to the
fact that direct measurement of GHG fluxes in soils is time demanding and requires sophis-
ticated analytical skills. The results could also be interpreted as a call for refined modelling
approaches in agricultural LCAs with regard to the usage of default emission factors. The
global nitrous oxides emission calculator2 from the Joint Research Centre of the European
Commission can be considered as a step into that direction.
5.1.7 Machinery transportation and certification trips
As stated in section 2.2.3, transportation of machinery from machinery hirer to the field/farm,
extension and certification are not considered in the baseline scenario for this study. How-
ever, this scenario explicitly investigates the potential environmental relevance of these
contributors, as:
2 The Global Nitrous Oxide Calculator (GNOC) online tool has been developed in the context of the “Assessment of GHG
default emissions from biofuels in EU legislation” (EDWARDS ET AL 2013). The tool facilitates the calculation soil N2O
emissions from biofuel crop calculation for each location globally. The online calculations are consistent with the method applied in the assessment of GHG default emissions. The user is provided with default environmental and management data which are required for the calculations at the selected location. However, the user might change these parameters if local data is available

51
1. Organic cotton systems in countries like India are mainly based on manual work so
that in case of machinery use the machine first has to be transported to the farm
and
2. Certifications at least when it comes to the verification of organic agricultural stand-
ards, does not take place in conventional systems.
To test the impact of these two aspects three virtual scenarios were created. The estimated
impact was related to the average global yield of 1,800 kg/ha and set in relation to the GWP
and Primary Energy Demand (PED) of the calculated global average seed cotton dataset.
Data on the environmental performance of fuel production and transportation processes
(tractor, car, and plane) were taken from the GaBi database. To be sure that the impact is
not underestimated worst case assumptions as far as possible were made.
For the estimation of the impact from machinery transportation to the field it was assumed
that an average tractor with an average diesel consumption of 12.5 l/h is used twice a year
for soil treatment and mechanical weeding. The distance to the farm was estimated to be
20km. At the farm or at surrounding farms the tractor is used to operate on five hectares.
Return to the machinery hirer with the tractor is also considered to the current scenario.
The onsite validation of agricultural practices needs to be checked regularly. One certifica-
tion per year was assumed, done by one person for 20 ha, at several farms, in the same
region. Round trip is assumed done by well motorized petrol driven passenger car (2 liters
engine) over a distance of 100 km one way (scenario 2) or including even a plane trip of
500 km one way (scenario 3).
Results in Table 5-8 show, that the impact for both machinery transportation and certifica-
tion from a GWP perspective is below 1% of the overall GWP and therefore negligible. PED
is of higher importance but still not changing the overall picture of the performance of or-
ganic cotton. PED can be up to 2.4% of the total energy consumption of the system under
the given assumptions. For both aspects tractor provision is of higher relevance than the
travel for certification. It has to be noted that the assumptions (transportation distances,
vehicles, certification cycles, number of transported certifiers etc.) are highly uncertain and
can vary to a large extent. However, it also has to be noted that the made assumptions are
already worst case assumptions from an environmental perspective but also from econom-
ical perspective transportation expenditures has to be reasonable and must fit into the given
economic conditions of the farmers. To be absolutely sure about the real impact of machin-
ery transportation and certification, on-site date need to be collected in future projects.
Table 5-8: Impact of machinery transportation and certification on global seed cotton production
Scenario Increase in
GWP Increase in
Primary Energy Demand
Machinery transportation (Scenario 1) 1.0% 2.4%
Certification by car (Scenario 2) 0.2% 0.4%
Certification by plane (Scenario 3) 0.6% 1.4%

52
5.2 The environmental footprint of organic cotton – Putting it into perspec-tive
The LCIA results are difficult to interpret as standalone indicators. Only if they are put into
perspective to published data and scientific literature, conclusions on the environmental
performance of organic cotton can be drawn. The following paragraphs intend to cite se-
lected literature in order to better understand the value of the results calculated in the pre-
sent study.
It should be noted here that given the limitations denoted in chapter 5.3 it is not the intention
of the study to make comparative assertions as defined in the ISO 14044 standard. If the
values provided in this study and the related dataset are used in further LCA studies – e.g.
along the value chain of the apparel industry, or in comparison to other materials – attention
needs to be paid to the definition of system boundaries and methodological assumptions.
As demonstrated above, these have an influence on the outcomes, as is often the case in
LCA studies. Absolute numbers from LCA studies should therefore always be interpreted
with care and reference to the system under consideration. Stand-alone indicators for sim-
plified statements or decision making are discouraged by the LCA community in general.
5.2.1 Climate change (GWP)
As mentioned above, a detailed LCA study on conventionally grown cotton has been re-
cently published (COTTON INC. 2012), which represents an industry standard and was used
as reference document in this study. The impact on climate change of the global average
of conventionally grown cotton is calculated to be 1808 kg of CO2-equiv. per 1000 kg of
cotton fibre produced3. This study has arrived at 978 kg of CO2-equiv. per 1000 kg of cotton
fibre grown under the extensive cultivation system of organic agriculture. The difference in
results can be attributed to the lower agricultural inputs as required by the principles of
organic agriculture, namely of mineral fertilizer, pesticides, tractor operations and irrigation.
Field emissions per kg fibre (not per ha) do not differ significantly between the two systems,
as every system has an optimum where additional application of fertilizer will lead to an
increase in emissions but also to a (larger) increase in yield, so that the emissions per kg
final product are decreasing.
It should be noted though, that uncertainties associated with definition of system boundaries
remain. As explored in section 5.1, organic fertilizer (farm yard manure, FYM) carried no
environmental burdens in the baseline system, similar to the study on conventional cotton
(COTTON INC. 2012). The impact results could double if only 5% of livestock farming is allo-
cated to the manure (assuming 5% of animal value is its manure) and even more drastic
increases are calculated for scenarios where manure management is completely allocated
to the manure and therefore the cotton cultivation system applying it (see section 5.1). While
it has been the intention from the onset of the present study to maintain system boundaries
as close to those of the conventional cultivation system as possible, present authors feel
the need for further discussion and guidelines on this topic. At the same time some of the
potential benefits of organic cultivation with regard to climate change are not captured due
3 The values given in COTTON INC. 2012 are considering the carbon uptake in the product (1540 kg CO2 per 1000kg, result-
ing in a value of 268 kg CO2-equiv. per 1000 kg of lint cotton). As cotton is a short-lived consumer good, this carbon diox-ide is released later at the end-of-life in the product, so that it is only temporarily stored. This is why the carbon uptake is not considered in the impact assessment and is not declared in this study. If it was considered, the GWP for organic cotton would be negative, i.e. -562 kg CO2-equiv. per 1000 kg lint cotton.

53
to the exclusion of the (potential) soil carbon sequestration from the impact assessment
(see chapter 3.3).
Another recent study (BABU AND SELVADASS 2013), has investigated the environmental impact
of cultivation of conventional and organic seed lint cottons in India. The article lacks a clear
description of system boundaries and modelling approaches used. The results given for
“the LCA analysis for cultivation of 1 kg ‘Conventional seed cotton cultivation’ and ‘Organic
seed cotton cultivation’” are given with 1.32 kg CO2-equiv./kg and 1.08 CO2-equiv./kg re-
spectively. To all appearance these values refer to seed cotton (fibres and seed) at field
edge. Although these results need to be interpreted with care, this study supports the find-
ings of BABU AND SELVADASS 2013 with regard to the environmental performance of organic
cotton.
SYSTAIN 2013 has investigated the impact on climate change of cotton produced under the
requirements of the Cotton made in Africa (CmiA) certification scheme. Farmers participat-
ing in the CmiA initiative are mostly small scale farmers, growing cotton in rotation with other
cash and food crops, exclusively under rain-fed conditions. Thus, CmiA can also be classi-
fied as an extensive “non-conventional” cotton cultivation system. The conventional cotton
cultivation system was also assessed in this study. The study found that the conventional
cotton growing had a higher (4600 kg CO2-equiv. per 1000 kg product) impact on climate
change than CmiA (1900 kg CO2-equiv. per 1000 kg product). However, it should be noted
that these results cannot be directly compared to the results given in the present study as
different system boundaries, modelling approaches and allocation rules were applied.
5.2.2 Acidification
The acidification potential reported for conventional cotton (COTTON INC. 2012) is 18.7 kg SO2-
eq./1000 kg lint cotton (value assessed in this study for organic cotton: 5.7 SO2-eq.) Again,
the difference is driven by reduced or avoided agricultural inputs in the organic cotton sys-
tems, i.e. fertilizer and pesticide production, irrigation pumps and tractor operations. The
difference is also caused by differences in field emissions due to the different amounts of
nutrients applied. As mentioned in section 4.3.2, ammonia is released as a result of nitrogen
conversion processes in the soil following the application of N-compounds in the fertilizer.
In all other processes, combustion gases NOx and SO2 are emitted in proportion to the
amount and type of fossil fuel used.
5.2.3 Eutrophication
Eutrophication potential per unit area is generally known to be lower in organic systems
than in conventional systems due to lower nutrient inputs. However, they are often higher
per product unit due to lower crop yields as compared to conventional systems (TUOMISTO
ET AL 2012).
While soil erosion rates are often difficult to specify, the present study is built on evidence
of strong soil protection measures applied in the organically cultivated systems capable of
preventing 90% of the soil erosion that would otherwise enable the washing off of nutrients
into the neighbouring water and soil bodies. Cultivation of catch crops (fast-growing crops
that are grown between successive plantings of a main crop) and intercropping contribute
to the reduction of losses of nutrients due to leaching. Considering these effects, eutrophi-
cation of the organic cotton fibre is calculated to be 2.8 kg PO43–equiv. per 1000 kg fibre.
COTTON INC. 2012 calculated 3.8 kg PO43–equiv. for the same amount of conventional fibre.

54
Results for the eutrophication potential of organic cotton under different assumptions on soil
erosion are given in section 5.1.
5.2.4 Water use
In the regions under study, organically cultivated cotton receives relatively little irrigation in
addition to naturally occurring rainfall. The irrigation water requirement of a crop is obviously
mainly determined by climatic conditions although the actual usage is also influenced by
irrigation techniques. This is why low irrigation rates cannot be attributed exclusively to the
organic cultivation scheme. However, soil conservation measures are also known to help
to store water in the soil and thus potentially contribute to lower the irrigation water require-
ment in arid areas (BLANCO-CANQUI 2008).
All regions under investigation in COTTON INC. 2012 are at least partially irrigated. As a con-
sequence, blue water consumption – the impact category with a high environmental rele-
vance – of conventional cotton is reported to be 2120 m³/1000 kg cotton fibre (results of this
study 182 m³/1000 kg lint cotton fibre). Cotton made in Africa (SYSTAIN 2013) is exclusively
rain fed, resulting in no blue water consumption.
Methods for further impact assessment of water use exist (see PFISTER ET AL. 2009, BAYART
ET AL. 2010 and the “water use in LCA” – working group of the UNEP-SETAC). In the as-
sessment of water consumption it is crucial where the water consumption takes place. In
water abundant areas the impacts of water consumption will be low, while in dry areas the
impact will be large. This difference is addressed by applying the water stress index (WSI)
developed by PFISTER ET AL. 2009. The water stress index is used to weight water consump-
tion according to regional availability. The resulting figure is called “water scarcity footprint”.
Both, the present study and COTTON INC. 2012 have not conducted this further impact as-
sessment of blue water consumption that would allow a deeper understanding of the actual
environmental severity of blue water consumption.
5.2.5 Primary Energy Demand (non-renewable)
The PED for conventional cotton (COTTON INC. 2012) is ca. 15000 MJ/1000 kg lint cotton
(value assessed in this study for organic cotton: ca. 5800 MJ). Very similar to the case of
GWP, avoiding the use of mineral fertilizer reduces the use of non-renewable fossil energy,
since mineral fertilizers are petroleum-derived and carry a high PED.
5.3 Limitations
This study provides LCA inventory data of good overall quality on lint cotton produced under
the organic scheme. However, there are some limitations that need to be considered in
interpretation of the results.
On inventory level, it has to be stated that time representativeness of inventory could be
improved by a systematic collection of data to cover several cultivation periods and to cover
the same time span. It should also be noted here again, that this study is based on primary
data that underwent plausibility checks but was not independently verified (see 2.2.5).
The agricultural model used in this study is constantly updated and improved, thus claiming
to cover all relevant emissions and to allow a comprehensive LCI setup and LCIA of agri-
cultural systems. However, for many relevant aspects (such as soil types, nutrient content
of soils, soil erosion) primary data is very hard to obtain, so that default values are to be

55
applied. These default values do not necessarily represent local conditions. To aggregate
data into regional averages is additionally challenging and can potentially lead to distortions
in a model trying to represent a realistic cultivation system.
This study does not intend to compare different countries producing organic cotton or dif-
ferent regions within countries. However, the aggregation into a global average hides the
regional variability of the results. As a measure of that variability, the standard deviation of
country averages compared to the global mean value of the results for ginned cotton is
provided in Table 5-9.
Table 5-9: Mean and standard deviation for impact measures (per 1000 kg of cotton fi-bre)
Indicators Unit
(per 1000 kg of cotton fibre)
Mean Standard deviation
Standard deviation
(% of mean)
Global warming potential (GWP) [kg CO2-Equiv.] 978 282 29%
Acidification potential (AP) [kg SO2-Equiv.] 5.7 0.5 9%
Eutrophication Potential (EP) [kg PO43--Equiv.] 2.8 2.4 87%
Blue water consumption [m³] 182 215 119%
PED (non-ren) [MJ] 5 759 4 052 70%
*functional unit (FU) = 1000 kg of cotton fibre
These variations do not necessarily mean that the data quality is compromised. To highlight
the most obvious example, blue water consumption is expected to vary widely if irrigated
and non-irrigated systems are included in the average. Still, it can be seen that the results
do not allow drawing conclusions on the environmental performance of individual sites.
Maybe even more important, agricultural systems are complex, and methodological deci-
sions as well as the choice of modelling approaches and assumptions can influence the
results significantly, very visibly illustrated by different scenarios shown in section 5.1. It
should therefore be repeated here, that absolute numbers should be interpreted with care
and not be used as stand-alone indicators for simplified statements or unfounded decision
making.
It should also be noted that the impact categories represent potential impacts; in other
words, they are approximations of environmental impacts that could occur if the emitted
molecules would actually follow the underlying impact pathway and meet certain conditions
in the receiving environment while doing so. LCIA results are therefore relative expressions
only and do not predict actual impacts, the exceeding of thresholds, safety margins, or risks.
In addition, water use and water consumption are reported as environmental indicators only
and no further impact methodology was applied.
This study uses published literature to set its results into perspective. It should be stressed
again, that an ISO consistent comparison of two product systems would require additional
effort in assessment of the precision, completeness and representativeness of data used;
description of the equivalence of the systems being compared, uncertainty and sensitivity
analyses and evaluation of the significance of the differences found.

56
There are some additional limitations related to the LCA methodology that should be men-
tioned here. In this study, Life Cycle Assessment is used as a standardized tool for quanti-
tative evaluation of potential environmental impacts on product basis. Thereby the method-
ology focuses on resource use efficiency (functional unit 1000 kg output) rather than on
overall impacts of entire production systems. It also does not allow drawing conclusions on
the capacity of the concerned ecological systems to cope with these impacts. Additionally,
some environmental aspects such as impact on biodiversity cannot be accessed within the
LCA methodology so far, despite being considered of high relevance. Hence, some of the
environmental benefits that organic cotton potentially has are omitted from the analysis.
All this said, and not even yet mentioned social and socio-economic dimensions of sustain-
ability, it becomes clear that further aspects than those investigated in this study need to be
considered for a holistic assessment of sustainability of a production systems or a compar-
ison with another production system.

57
6 Conclusion
The key findings of this study can be summarized as follows:
This study provides LCA inventory data of good overall quality on organic lint cotton.
The results of this study can be applied as a reference value for organic cotton pro-
duction worldwide and shall be used with confidence in any further LCA studies e.g.
along the value chain of the apparel industry.
Field emissions dominate the impact on climate change (nitrous oxide) and are an
important contributor to acidification potential (ammonia).
Eutrophication is caused by leaching and soil erosion, both successfully reduced in
organic farming.
Blue water consumption should lay in the focus of water use assessments and is
only relevant where cotton is irrigated.
Decisions as well as the choice of modelling approaches and assumptions can in-
fluence the results significantly (specifically the assumption of burden free provision
of organic fertilizers).
Representativeness of data could be improved by systematic data collection, indi-
cating a field for future updates and improvements of this study
Some of the potential environmental benefits of organic cotton such as the impact
on biodiversity are not assessed in this study due to limitations in the LCA method-
ology with this regard.
Life Cycle Assessment is a powerful standardized tool for quantitative evaluation of
potential environmental impacts on product basis; however, given the social and
socio-economic dimensions of sustainability, further aspects than those investigated
in this study need to be considered for a holistic assessment of sustainability of a
production systems or a comparison with another production system.

58
7 References
BABU AND SEL-
VADASS 2013 Murugesh Babu., and Selvadass, M. (2013) Life Cycle Assessment for Cul-tivation of Conventional and Organic Seed Cotton fibres, International Jour-nal of Research in Environmental Science and Technology 3(1): 39-45
BAYART ET AL. 2010
Bayart, J.B.; Bulle, C.; Koehler, A.; Margni, M.; Pfister, S.; Vince, F.; Deschenes, L. (2010) A framework for assessing off-stream freshwater use in LCA, Int J Life Cycle Assess 15, 439–453
BERTHOUD ET AL
2011 Berthoud A, Maupu P, Huet C, Poupart A. (2011): Assessing freshwater ecotoxicity of agricultural products in life cycle assessment (LCA): a case study of wheat using French agricultural practices databases and USEtox model. International Journal of Life Cycle Assessment;16(8):841–847
BIAO ET AL 2003 Biao, Xie; Xiaorong, Wang; Zhuhong, Ding; Yaping, Yang (2003): Critical Impact Assessment of Organic Agriculture. In Journal of Agricultural and Environmental Ethics 16, pp. 297–311
BIRADAR ET AL
2013 Biradar, N. (2013): Assessing Contribution of Livestock to the Livelihood of Farmers of Western Maharashtra, J Hum Ecol,41(2): 107-112
BIRKVED AND
HAUSCHILD 2006 Birkved, M., and Hauschild, M. (2006) PestLCI – A model for estimating field emissions of pesticides in agricultural LCA. Ecological Modelling 198, ( 3-4), 433-451.
BLANCO-CANQUI
2008 Blanco-Canqui, H. (2008). Principles of soil conservation and management. Springer.
BOUWMAN ET AL. 2002
Bouwman AF, Boumans LJM and Batjes NH (2002) Emissions of N2O and NO emissions from fertilized fields: Summary of available measurement data. In: Global Biogeochemical Cycles. 16(4), 1058
BRENTRUP ET AL. 2000
Brentrup, F. et al. (2000) Methods to estimate on-field nitrogen emissions from crop production as an input to LCA studies in the Agricultural Sector. The International Journal of Life Cycle Assessment. 5(6), 349-357.
BUSER 2001 Buser, M. (2001) Extruding Cotton Gin Byproducts to Reduce Chemical Residues. The Journal of Cotton Science 5:92-102, 2001.
CAUSARANO ET
AL. 2006 Causarano, H.J., Franzluebbers, A.J., Reeves, D.W., Shaw, J.N. (2006) Soil organic carbon sequestration in cotton production systems of the southeastern United States: A review Journal of Environmental Quality, 35 (4), pp. 1374-1383.
COTTON INC. 2012
Cotton Inc. (2012) Life Cycle Assessment of Cotton Fibre and Fabric. Pre-pared for VISION 21, a project of The Cotton Foundation and managed by Cotton Incorporated, Cotton Council International and The National Cotton Council. The research was conducted by Cotton Incorporated and PE Inter-national; available online (after registration): http://cottontoday.cot-toninc.com/Life-Cycle-Assessment/.
DIKSHIT AND
BIRTHAL 2010 Dikshit A.K. and Pratap S. Birthal (2010) Environmental Value of Draught Animals: Saving of Fossil-fuel and Prevention of Greenhouse Gas Emis-sion. Agricultural Economics Research Review Vol. 23, July-December 2010 pp 227-232

59
EC 834/2007 Council Regulation (EC) No 834/2007 of 28 June 2007, The council of the European Union; Regulation on organic production and labelling of organic products and repealing Regulation (EEC) No 2092/91
EDWARDS ET AL
2013 Edwards, R., et al. (2013) Assessing GHG default emissions from biofuels in EU legislation. Review of input database to calculate “Default GHG emis-sions”, following expert consultation 22-23 November 2011, Ispra (Italy). JRC Scientific and Policy Reports. EUR 25595 EN. European Commission Joint Research Centre Institute for Energy and Transport. doi:10.2788/66442
EGHBALL 1997 Eghball, B., Power, J.F., Gilley, J.E., Doran, J.W., (1997): Nutrient, carbon, and mass loss during composting of beef cattle feedlot manure. J. Environ. Qual. 26, 189–193.
EYHORN 2007 Eyhorn, Frank (2007): Organic farming for sustainable livelihoods in devel-oping countries? The case of cotton in India, Inauguraldissertation der Philosophisch-naturwissenschaftlichen Fakultät der Universität Bern Zürich, Singen: Vdf-Hochschulverlag
EYHORN ET AL. 2005
Frank Eyhorn, Saro G. Ratter, Mahesh Ramakrishnan (2205) Organic Cot-ton Crop Guide, 1.st edition; Researcj Institute of Organic Agriculture FiBl, Frick, Switzerland
FAO 2010 FAO (2010): Greenhouse gas emissions from the dairy sector – A life cycle assessment, by Gerber, P., Opio, C., Vellinga, T., Herderson, B. & Steinfeld, H. FAO. Rome
FAO 2012 FAO (2012): Soil Organic Carbon Accumulation and Greenhouse Gas Emission Reductions from Conservation Agriculture: A literature review. In-tegrated Crop Management Vol.16 (2012)
FAOSTAT Statistical Database of the FOOD AND AGRICULTURE ORGANIZATION OF THE UNITED NATIONS (FAO) http://faostat.fao.org/site/291/de-fault.aspx Last accessed on 04 November 2014.
FINKBEINER
2013 Finkbeiner, M (2013) “Product environmental footprint-breakthrough or breakdown for policy implementation of life cycle assessment?” Int J Life Cycle Assess 19:266-271, dx.doi.org/10.1007/s11367-013-0678-x.
FORSTER ET AL
2013 Forster D, Andres C, Verma R, Zundel C, Messmer MM, et al. (2013) Yield and Economic Performance of Organic and Conventional Cotton-Based Farming Systems – Results from a Field Trial in India. PloS ONE 8(12).
FRISCHKNECHT
2007 Frischknecht R et al. (2007) The Environmental Relevance of Capital Goods in Life Cycle Assessments of Products and Services. Int J LCA, DOI: http://dx.doi.org/10.1065/lca2007.02.308
FUCHS AND
SCHWARZ 2007 Fuchs, S., and Schwarz, M. (2007) Ableitung naturraumtypischer Anreicherungsfaktoren zur Bestimmung des Phosphor- und Schwermetalleintrages in Oberflächengewässer durch Erosion. Universität Karlsruhe (TH), Institut für Wasser- und Gewässerentwicklung (IWG).
GABI 6.3 2013 GaBi 6.3 dataset documentation for the software-system and databases, LBP, University of Stuttgart and PE INTERNATIONAL AG, Leinfelden-Echt-erdingen, 2013 (http://documentation.gabi-software.com/).

60
GALLOWAY ET
AL. 2004 Galloway, J.N. Dentener, F.J. Capone, D.G. Boyer, E.W. Howarth, R.W. Seitzinger, S.P. Asner, G.P. Cleveland, C.C. Green, P.A. Holland, E.A. Karl, D.M. Michaels, A.F. Porter, J.H. Townsend, A.R. Vöosmarty, C.J. (2004): Ni-trogen Cycles: Past, Present, and Future; Biogeochemistry, 70, 2; page 153-226
GATTINGER ET
AL. 2012 Andreas Gattinger, Adrian Muller, Matthias Haeni, Colin Skinner, Andreas Fliessbach, Nina Buchmann, Paul Mäder, Matthias Stolze, Pete Smith, Na-dia El-Hage Scialabba, and Urs Niggli (2012): Enhanced top soil carbon stocks under organic farming PNAS 2012 109 (44) 18226-18231; published ahead of print October 15, 2012
GHG PROTOCOL World Resource Institute, wbcsd, Product Life Cycle Accounting and Re-porting Standard. September 2011; http://www.ghgprotocol.org/stand-ards/product-standard. Accessed 20 May 2014.
GOTS Global Organic Textile Standard, Global Organic Textile Standard Interna-tional Working Group; http://www.global-standard.org/de/.
GREEN 1987 Green, M.B. (1987) Energy in pesticide manufacture, distribution and use. In: HelseL, Z.R., (Ed.): Energy in Plant Nutrition and Pest Control. Amster-dam, Elsevier, pp. 165-177.
GUINÉE ET AL. 2001
Guinée, J.B.; Gorrée, M.; Heijungs, R.; Huppes, G.; Kleijn, R.; Koning, A. de; Oers, L. van; Wegener Sleeswijk, A.; Suh, S.; Udo de Haes, H.A.; Bruijn, H. de; Duin, R. van; Huijbregts, M.A.J. Handbook on life cycle as-sessment. Operational guide to the ISO standards. I: LCA in perspective. IIa: Guide. IIb: Operational annex. III: Scientific background. Kluwer Aca-demic Publishers, ISBN 1-4020-0228-9, Dordrecht, 2002, 692 pp..
HARDIN 2012 Hardin IV, R.G. and P.A. Funk. Energy Monitoring in Gins - 2012 Prelimi-nary Results. Proceedings of Beltwide Cotton Prod. Res. Conf., National Cotton Council, pp 972-977
HAUSCHILD 2000 Hauschild, M.Z. (2000) Estimating pesticide emissions for LCA of agricul-tural products. Conference paper. University of Denmark.
HELBIG ET AL. 2009
Helbig, H., Möller, M., and Schmidt, G. (2009) Bodenerosion durch Wasser in Sachsen-Anhalt – Ausmaß, Wirkungen und Vermeidungsstrategien. Erich Schmidt Verlag.
HILLENBRAND ET
AL. 2005 Hillenbrand T. et al. (2005) Einträge von Kupfer, Zink und Blei in Gewässer und Böden – Analyse der Emissionspfade und möglicher Emissionsminderungsmaßnahmen. Umweltbundesamt. ISSN 0722-186X.
HOESKTRA ET
AL. 2009 Hoesktra et al. (2009) Water Footprint Manual. Water Footpint Network. Available at http://doc.utwente.nl/77211/1/Hoekstra09WaterFootprintMan-ual.pdf. Accessed 20 May 2014.
IDF 2010 International Dairy Federation. (2010). Bulletin of the International Dairy Federation 445/2010. A common carbon footprint approach for dairy The IDF guide to standard lifecycle assessment methodology for the dairy sec-tor. Retrieved from: http://www.idf-lca-guide.org/Files/media/Docu-ments/445-2010-A-common-carbon-footprint-approach-for-dairy.pdf
IFOAM 2012 IFOAM International Federation of Organic Agriculture Movements (2012) The IFOAM Norms for Organic Production and Processing; http://www.ifoam.org/sites/default/files/page/files/ifoam_norms_version_au-gust_2012_with_cover.pdf. Accessed 02 September 2014.

61
IIASA 2012 FAO/IIASA/ISRIC/ISSCAS/JRC, (2012): Harmonized World Soil Database (version 1.2). FAO, Rome, Italy and IIASA, Laxenburg, Austria
ILCD 2010 European Commission - Joint Research Centre - Institute for Environment and Sustainability: International Reference Life Cycle Data System (ILCD) Handbook - General guide for Life Cycle Assessment - Detailed guidance. First edition March 2010. EUR 24708 EN. Luxembourg. Publications Office of the European Union; 2010
ILCD 2011 European Commission-Joint Research Centre – Institute for Environment and Sustainability (2011): International Reference Life Cycle Data System (ILCD) Handbook- Recommendations for Life Cycle Impact Assessment in the European context. First edition November 2011. EUR 24571 EN. Lux-emburg. Publications Office of the European Union
IPCC 2006 2006 IPCC Guidelines for National Greenhouse Gas Inventories. Available at http://www.ipcc-nggip.iges.or.jp/public/2006gl/ Accessed 06 October 2014.
ISO 14040 EN ISO 14040:2009-11 Environmental management – Life cycle assess-ment – Principles and framework.
ISO 14044 EN ISO 14044:2006-10 Environmental management – Life cycle assess-ment – Requirements and guidelines.
ISO 14046 EN ISO 14046:2014 Environmental management – Water footprint – Princi-ples, requirements and guidelines.
KOTHYARI 1996 Kothyari, U.C (Ed.) (1996): Erosion and sedimentation problems in India. Erosion and Sediment Yield: Global and Regional Perspectives. Exeter Symposium., July 1996. Roorkee, India.
KREISSIG AND
KÜMMEL 1999 Kreißig, J., and J. Kümmel (1999) Baustoff-Ökobilanzen. Wirkungsabschätzung und Auswertung in der Steine-Erden-Industrie. Pub-lished by Bundesverband Baustoffe Steine + Erden e.V.
LE MER AND
ROGER 2001 Le Mer, J., and Roger, P. (2001) Production, oxidation, emission and con-sumption of methane by soils: A review Eur. J. Soil Biol. 37, 25−50, 2001.
LUPASCU ET AL
2009 Naliana Lupascu, Elisabeta Chirila And Marilena Munteanu (2009): Heavy metal contaminants in organic fertilizers, Ovidius University Annals of Chemistry Volume 20, Number 2, pp. 232-234
NEARING ET AL. 2005
Nearing, M.A., Kimoto, A., and Nichols, M.H. (2005) Spatial patterns of soil erosion and deposition in two small, semiarid watersheds. Journal of Geo-physical Research, Vol. 110, F04020, 2005.
NICHOLSON ET
AL 2003 F.A. Nicholson, S.R. Smith, B.J. Alloway, C. Carlton-Smith, B.J. Chambers (2003): An inventory of heavy metals inputs to agricultural soils in England and Wales, Science of The Total Environment, Volume 311, Issues 1–3, 20 July, Pages 205-219
NOP National Organic Program, United States Department of Agriculture, Agri-cultural Marketing Service; http://www.ams.usda.gov/AMSv1.0/nop. Ac-cessed 02 September 2014.
OCS 2013 Organic Content Standard (2013); Textile Exchange; http://tex-tileexchange.org/sites/default/files/te_pdfs/integrity/Organic%20Con-tent%20Standard%20v1.pdf Accessed 26.10.2014.

62
OTA 2014 Organic trade association (OTA) (2014): 2012 and Preliminary 2013 U.S. Organic Cotton Production & Marketing Trends.
OWSIANIAK ET AL
2013 Mikołaj Owsianiak, Ralph K. Rosenbaum, Mark A. J. Huijbregts, and Mi-chael Z. Hauschild (2013): Addressing Geographic Variability in the Com-parative Toxicity Potential of Copper and Nickel in Soils, Environmental Sci-ence & Technology 47 (7), 3241-3250.
PATIL ET AL. 2007
Patil et al. 2007 | Patil, et al. (2007). Improving ling quality using modified double roller gins in India. Proceedings World Cotton Research Conference—4
PFISTER ET AL. 2009
Pfister, S.; Koehler, A.; Hellweg, S. (2009) Assessing the environmental im-pact of freshwater consumption in LCA. Environ Sci Technol 43(11), 4098–4104.
PHANIRAJA AND
PANCHASARA
2009
Phaniraja KL, Panchasara HH. (2009) Indian draught animals power. Vet World. 2009; 2(10): 404-407
PHYLLIS 2 Phyllis2, database for biomass and waste, https://www.ecn.nl/phyllis2, En-ergy research Centre of the Netherland.
PIZZOL ET AL
2011 Pizzol M, Christensen P, Schmidt J, Thomsen M. (2011): Impacts of “met-als” on human health: a comparison between nine different methodologies for Life Cycle Impact Assessment (LCIA) Journal of Cleaner Produc-tion;19(6-7):646–65.
POWLSON ET AL. 2011
Powlson, D.S., Whitmore, K.W., Goulding, W.T. (2011) Soil carbon seques-tration to mitigate climate change: a critical re-examination to identify the true and the false. European Journal of Soil Science, 62, 42–55, February 2011.
REDDY 2010 Reddy, K.S. et al (2010): Leaching losses of nutrients from farmyard ma-nure pits in Central India, 9th World Congress of Soil Science, Soil Solutions for a Changing World 1 – 6 August 2010, Brisbane, Australia.
ROSENBAUM ET
AL. 2008 Rosenbaum et al. (2008) USEtox—the UNEP-SETAC toxicity model: rec-ommended characterisation factors for human toxicity and freshwater eco-toxicity in life cycle impact assessment, International Journal of Life Cycle Assessment 13:532–546, 2008.
SCHEFFER &
SCHACHTSCHA-BEL 2010
Scheffer, F., Schachtschabel, P. (2010). Lehrbuch der Bodenkunde. Spektrum, Heidelberg
SCHMÄDEKE
1998 Schmädeke, P. (1998) Lachgas- und Methanflüsse eines Gley-Auenbodens unter dem Einfluß einer Rapsfruchtfolge und in Abhängigkeit von der N-Düngung. Dissertation der Fakultät für Agrarwissenschaften der Georg-August-Universität Göttingen. http://webdoc.sub.gwdg.de/diss/1999/schmaede/inhalt.htm#inhalt. Accessed 20 May 2014.
SKINNER ET AL
2014 Skinner Colin, Andreas Gattinger, Adrian Muller, Paul Mäder, Andreas Flieβbach, Matthias Stolze, Reiner Ruser, Urs Niggli (2006): Greenhouse gas fluxes from agricultural soils under organic and non-organic manage-ment — A global meta-analysis, Science of The Total Environment, Vol-umes 468–469, 15 January 2014, Pages 553-563

63
SLOTYUK 2013 Slotyuk, L. (2013) Life Cycle Assessment of Organic Cotton Cultivation in India. MSc Thesis. Universität Hohenheim.
SOMMER 2001 Sommer, S.G. (2001): Effect of composting on nutrient loss and nitrogen availability of cattle deep litter, European Journal of Agronomy 14 (2001) 123–133.
SYSTAIN 2013 Nill, M., and Wick, K. (2013) The Carbon and Water Footprint of Cotton made in Africa. Systain commissioned by Aid by Trade Foundation. http://www.cotton-made-in-africa.com/fileadmin/cmia_abtf/press/docu-ments/e-CmiA_eco-footprint_study_version_2_january_2013.pdf. Accessed 20 May 2014.
TE 2012-13 Textile Exchange (2012) Farm & Fibre Report 2012-13. http://farmhub.tex-tileexchange.org/farm-library/farm-fibre-reports.
THORNTHWAITE
1948 Thornthwaite, C.W. (1948) An approach toward a rational classification of climate. - The Geogr. Rev. 38 (1): 55-94.; equation available online http://www.hydroskript.de/html/_index.html?page=/html/hykp0505.html . Ac-cessed 20 May 2014.
TUOMISTO ET AL
2012 H.L. Tuomisto, I.D. Hodge, P. Riordan, D.W. Macdonald, (2012): Does or-ganic farming reduce environmental impacts? – A meta-analysis of Euro-pean research, Journal of Environmental Management, Volume 112, Pages 309-320.
ULLMANNS 2011 John Wiley & Sons, Inc., ULLMANN'S Encyclopedia of Industrial Chemistry, Hoboken / USA, 2011.
USDA 2003 U.S. Department of Agriculture (2003) 2001 annual NRI–soil erosion. U.S. Department of Agriculture, Natural Resources Conservation Service, Na-tional Resources Inventory.
VAN CLEEMPUT
O 1998 Van Cleemput O (1998) Subsoils: chemo- and biological denitrification, N2O and N2 emissions. Nutrient Cycling Agroecosystems 52, 187-194.
VAN OERS ET AL. 2002
van Oers et al. (2002) Abiotic resource depletion in LCA: Improving charac-terisation factors abiotic resource depletion as recommended in the new Dutch LCA handbook, 2002, http://www.leidenuniv.nl/cml/ssp/pro-jects/lca2/report_abiotic_depletion_web.pdf. Accessed 20 May 2014.
WEST AND MAR-
LAND 2002 West, T,O., and Marland, G. (2002) A Synthesis of Carbon Sequestration, Carbon Emissions, and Net carbon Flux in Agriculture: Comparing Tillage Practices in the United States. Agriculture, Ecosystems and Environment. 91, 217–232.
WILDE ET AL. 2010
Curtis Wilde, Jeff Johnson, Michael Farmer (2010): Inventory of Cotton Gin Trash on the Texas High Plains and Bio-Energy Feedstock Potentials, The Texas Journal of Agriculture and Natural Resource, 23:42, 49
WILLIAMS ET AL. 2006
Williams, A.G., Audsley, E., and Sandars, D.L. (2006) Determining the envi-ronmental burdens and resource use in the production of agricultural and horticultural commodities. Main Report. Defra Research Project ISO205. Bedford: Cranfield University and Defra.
WILLIAMS ET AL. 2009
Williams, A.G., Audsley, E., Stacey, K., and Parsons, D.J. (2009) Estimation of the greenhouse gas emissions from agricultural pesticide manufacture and use. Bedford: Cranfield University and Defra.

64
WRI 2013 WRI, (2013) 'Eutrophication & Hypoxia Map Data Set | World Resources In-stitute', http://www.wri.org/resources/data-sets/eutrophication-hypoxia-map-data-set. Accessed April 2014.
WURBS & STEI-
NIGER 2011 Wurbs, D., Steininger, M. (2011): Wirkungen der Klimaänderungen auf die Böden , Untersuchungen zu Auswirkungen des Klimawandels auf die Bodenerosion durch Wasser, Texte, 16/2011, Umweltbundesamt.

65
8 Supplement / Annex
8.1 Toxicity Screening
Assessment of the toxicological effects of a chemical emitted into the environment implies
a cause–effect chain that links emissions to impacts through three steps: environmental
fate, exposure, and effects. In this LCA, environmental fate and exposure were taken into
account by the application of the emission factors to soil, plant, water, and air, while the
environmental effects were considered in the United Nations Environmental Program
(UNEP) – Society of Environmental Toxicology and Chemistry (SETAC) toxicity model,
USEtox™. This model recommended characterization factors for more than 1,000 chemi-
cals for both Human Toxicity and Eco-toxicity. The main objective of the USEtox™ model
was to develop a scientific consensus model for use in life cycle impact assessments but
USEtox™ has known limitations, specifically in representing agricultural systems (ROSEN-
BAUM ET AL. 2008). Despite these weaknesses (when applied to agricultural systems) the
USEtox™ model is a result of significant scientific cooperation and consensus and does
build on a combination of established LCA models. Background information about the USE-
tox™ consortium, the model structure, and the general methodology of modelling life cycle
impacts of toxins on humans and ecosystems can be found on the USEtox™.
The focus in using the USEtox methodology in LCAs of agricultural systems laid on pesti-
cide use, as pesticides are known to be the major contributor to toxicity in agricultural prod-
ucts (see also COTTON INC. 2012, BERTHOUD ET AL 2011). As stated above (chapter 2.2.1) no
pesticides are used in organic farming, toxicity is not expected to be of high importance in
organic cotton cultivation. The impact category was included to provide information for pos-
sible further studies or comparisons, in order to capture the possible advantage of organic
cotton in this impact category. The results are shown in Figure 8-1.

66
Figure 8-1: USEtox results of the global average organic cotton fibre shown for 1000 kg of product at gin gate
67
The toxicity emissions are dominated by field emissions. Field emissions in this regard refer
to the emission of heavy metals contained in the soil into water through soil erosion. Default
average heavy metal concentrations in the soil are used in this study (SCHEFFER &
SCHACHTSCHA-BEL 2010). There is no evidence, that soils under organic cultivation will have
lower heavy metal concentration than conventional soils, as typical input routes for heavy
metals, e.g. via air deposition (NICHOLSON ET AL 2003) or through organic fertilizer (LUPASCU ET
AL 2009) and with rock phosphate also apply for organic systems.
All this said, it has to be stated that the toxicity assessment of heavy metal emissions in
particularly uncertain, as metals can exist in many forms with different behaviour and toxicity
in terrestrial environments, depending on the ambient conditions (e.g. pH value) (OWSIANIAK
ET AL 2013, see also PIZZOL ET AL 2011). Thus, conclusions should only be drawn with utmost
care from the results shown above.
Reference values to set the results shown above are very hard to obtain, and as stated
above, comparison of USEtox impacts of different products can only be made with limited
informative value given the large range of values and uncertainty of the USEtox character-
ization (values in the GaBi database for processed agricultural products vary from 8 -
>30000 CTUe per t for Eco-toxicity, from 5E-08 to 1.3E-04 for Human toxicity, cancer and
from 2.2E-06 to 4.2E-02 for Human toxicity, non-cancer).
Given the findings that pesticide use typically dominate USEtox profiles of agricultural prod-
ucts (BERTHOUD ET AL 2011, COTTON INC. 2012), it is expected that that the USEtox profile of
organic cotton would well withstand comparison with other cultivation systems in this impact
category.

68
8.2 Life Cycle Inventory Data – Organic Cotton Cultivation
Table 8-1: Agricultural Activity – Organic Cotton Cultivation
Country
India (IN)
India (IN)
India (IN)
India (IN)
India (IN)
United States (US)
China (CN)
Turkey (TR)
Tansania (TZ)
Region
Region Madhya Pradesh
(MP)
Andhra Pradesh
(AP)
Odisha (OR)
Rajasthan (RJ)
Maha- rashtra (MH)
South Plains Lubbock
irrigated/ rain fed
Hutubi, Xinjiang
Aegean / South east
Anatolia
Meatu and
Mwasa District
Planting Unit
Field preparation Included in total diesel consumption, see Table 8-6
Seed Input kg/ha 2 2 2 2 2 13 35 35 10
Organic Fertilizer Input
Farm yard manure kg/ha 10 500 11 250 10 000 17 000 5 000 - 2 000 5 000/2 500 18 (only 2% of all farms apply FYM)
Nitrogen content of FYM % in fm 0.41)
Compost kg/ha 125 - - n.a. - -
2 x 3 000kg Cottonseed meal (30%);
compost (20%); diges-
tate (50%)
Green ma-nure (vetch + barley, catch crop)/ com-mercial or-ganic ferti-
lizer (compost) 100kg/1 000kg
Nitrogen content of compost
% in fm 0.7 1.5
(estimate)

69
Cow dung kg/ha 1 000 - - - 900
8 955/2 240 (composted cattle ma-
nure)
- - -
Nitrogen content of cow dung
% in fm 0.91) 0.91) 0.9 1)
Rock phosphate kg/ha 91 - - 250 - - - -
Neem cake kg/ha 40
Nitrogen content of Neem cake
% in fm 5
Muriate of Potash kg/ha 0.22
Application Included in total diesel consumption, see Table 8-6
Harvest
Yield seed-cotton kg/ha 1 000 1 000 1 200 950 1 500 2 950/800 6000 5 000/4 500 650
Plant Residues taken off from field
kg/ha 3 500 n.a. 5 000 n.a. 3 500 985/270
(dried burs leaves, trash)
n.a. n.a. n.a.
(animal grazing)
N – content seed cotton % in fm 2.8
Machinery use Included in total diesel consumption, see Table 8-6
Pest and weed control
Months August- October
August- September
August- September
Times 2 3 2
Neem oil kg/ha - 15 n.a. -
Neem kernel kg/ha 15 12 - 0.05
Tricoderma kg/ha 2 - - 0.02
Leaves extract + cow dung and urine
kg/ha 0.115
1) Primary data was not available for all regions. To ensure consistency a default value based on EYHORN ET AL. 2005 is assumed.
2) fm = fresh matter,

70
Table 8-2: Regionally specific background data used in the agricultural model
Country
India (IN)
India (IN)
India (IN)
India (IN)
India (IN)
United States (US)
China (CN)
Turkey (TR)
Tansania (TZ)
Region Madhya Pradesh
(MP)
Andhra Pradesh
(AP)
Odisha (OR)
Rajasthan (RJ)
Maha- rashtra (MH)
South Plains Lubbock
irrigated/ rain fed
Hutubi, Xinjiang
Aegean / South east
Anatolia
Meatu and
Mwasa District
Cultivation period Unit
Sowing date (average) 15-Jun 15-Jun 15-Jun 10-Jun 15-Jun 20-May 1-Apr 1-May 1-Nov
Harvest date (average) 20-Nov 30-Dec 1-Dec 2-Oct 15-Dec 30-nov 20-sep 15 Oct 1-Jul
Vegetation period days 156 199 175 125 182 194 173 168 242
Soil
Soil type (dominant) Tl Lt Lt Tl Tu3 Lts Lt4 (default) Lts Lt4 (default)
Precipitation
Jan mm 9 4 9 7 10 10 13 123/93 111
Feb mm 6 5 29 2 8 18 17 104/82 105
Mar mm 9 8 33 5 9 23 23 77/75 145
Apr mm 4 17 31 1 4 25 40 55/63 128
May mm 11 36 58 7 10 61 52 39/37 45
Jun mm 136 105 202 60 132 71 29 18/6 4
Jul mm 306 173 309 299 222 61 52 7/2 1
Aug mm 296 167 351 289 204 64 48 6/1 2
Sep mm 178 169 231 139 117 66 33 16/4 7
Oct mm 37 139 109 21 49 48 24 47/31 34
Nov mm 17 71 30 3 16 20 23 87/59 97
Dec mm 11 18 7 2 15 12 20 145/91 142
total mm 1 018 912 1 397 835 796 480 373 726/546 821
N deposition
Atmospheric N-deposition
GALLOWAY ET AL. 2004 kg/year 20 20 20 20 20 20 20 7.5 2.5
Soil erosion
Emission of soil into surface water (chapter 3.4)
kg/ha 105 70 120 70 85 128 100 100 100

71
Table 8-3: Machinery Use
Country
India (IN)
India (IN)
India (IN)
India (IN)
India (IN)
United States (US)
China (CN)
Turkey (TR)
Tansania (TZ)
Region Madhya Pradesh
(MP)
Andhra Pradesh
(AP)
Odisha (OR)
Rajasthan (RJ)
Maha- rashtra (MH)
South Plains Lubbock irrigated/ rain fed
Hutubi, Xinjiang
Aegean / South east
Anatolia
Meatu and
Mwasa District
Unit
Diesel demand (machinery use, not incl. irrigation) l/ha 19.8 38 36 2.0 - 3.0 51
84 +28*/65+19*
(*gasoline)
4 +3 (gaso-line)
60 0
(no machin-ery use)
Universal Tractor: Diesel consumption
l/hour 10 1)
Processing time hour/ha 1.5 1)
Nominal power use [%] 0.5 1)
1) Error! Reference source not found. – see also Table 8-7

72
Table 8-4: Irrigation
Country
India (IN)
India (IN)
India (IN)
India (IN)
India (IN)
United States (US)
China (CN)
Turkey (TR)
Tansania (TZ)
Region Madhya Pradesh
(MP)
Andhra Pradesh
(AP)
Odisha (OR)
Rajasthan (RJ)
Maha- rashtra (MH)
South Plains Lubbock
irrigated/ rain fed
Hutubi, Xinjiang
Aegean / South east
Anatolia
Meatu and
Mwasa District
Unit
Irrigation water use (aver-age of all farms of region under consideration)
m³/ha 131 0
(rain-fed) 0
(rain-fed) 54 500 3 048/0 150 11-12/13-14
0 (rain-fed)
Water source
70% Ground;
30% River n.a. n.a.
Ground water
Ground- and surface water
Ground water
Ground- and surface water
n.a.
Irrigation pump
machine pump and
submersible pump
n.a. n.a. submersible
pump Well and
farm ponds electricity Diesel n.a.
Delivery height m 161 n.a. n.a. 166 20 30 (Lit)1) 30 (default) 30 (default) n.a.
Diesel use (irrigation)2) kg/m³ 0.06 n.a. n.a. n.a. 0.03 n.a. 0.05 0.05 n.a.
Electricity use (irrigation)2) MJ/m³ 0.81 n.a. n.a. 2.7 0.12 0.6 n.a. n.a. n.a.
1) Texas water development board (http://www.twdb.state.tx.us/groundwater/data/)
2) Modelled (Error! Reference source not found.)

73
Table 8-5: Gin foreground data
Unit India (IN)
United States (US)
China (CN)
Turkey (TR)
Tanzania (TZ)
Transport distance to the gin
km 90 30 100 30 300
Input
Electricity1) MJ/kg lint 0.57 0.57 0.57 0.57 0.57
Seed cotton kg/kg lint 2.8 2.7 2.8 2.8 3.1
Output
Gin waste2) kg/kg lint 0.3 0.3 0.3 0.3 0.3
Seed
(Seed to lint ratio) kg/kg lint 1.5 1.4 1.5 1.53 1.8
Lint kg/kg lint 1 1 1 1 1
1) Primary data was not available for all regions; to ensure consistency a default value based on HARDIN 2012 is
assumed; verified by available primary data
2) Default value based on WILDE ET AL. 2010

74
The following table summarizes main parameter from Table 8-1 as weighted average.
Please note that each region was modelled separately, the average values as such were
not used in the respective models.
Table 8-6: Inventory parameter summary table
Weighted average over all regions
Unit Amount
Precipitation
Total annual rainfall mm 868
Cultivation
Yield seed-cotton kg/ha 1 835
Diesel demand (machinery use, not incl. irrigation) l/ha 29
Organic Fertilizer
Farm yard manure kg/ha 7 817
Nitrogen content of FYM % in fm 0.4
Compost kg/ha 868
Nitrogen content of compost % in fm 1.1
Cow dung kg/ha 635
Nitrogen content of cow dung % in fm 0.9
Rock phosphat kg/ha 56
Neem cake kg/ha 15
Nitrogen content of Neem cake % in fm 5.0
Total nitrogen applied as organic fertilizer kg/ha 44
Irrigation
Irrigation water use (average over all farms) m³/ha 187
Weighted average Diesel consumption kg/m³ 0.04
Weighted average Electricity consumption MJ/m³ 0.57
Simple average Diesel consumption (only farms that irrigate) kg/m³ 0.05
Simple average Electricty consumption (only farms that irrigate) MJ/m³ 1.06
Gin
Transport distance to the gin km 93
Electricity MJ/kg lint 0.6
Seed cotton input kg/kg lint 2.8
Gin waste output kg/kg lint 0.3
Seed output kg/kg lint 1.5
Lint output kg/kg lint 1

75
Table 8-7: Background datasets used
Background data GaBi 6.3. dataset used Documentation
Machinery and transport vehicles
Field operations Universal Tractor; diesel driven; production mix
http://gabi-documentation-2013.gabi-soft-ware.com/xml-data/processes/32775673-a2ad-46f8-a16e-9adff55297ea.xml
Transport Truck-trailer (truck fleet, long-dist.)
http://gabi-documentation-2013.gabi-soft-ware.com/xml-data/processes/571edba0-43a6-40fd-a3ab-19f4745fbd7b.xml
Diesel
China CN: Diesel mix http://gabi-documentation-2013.gabi-soft-ware.com/xml-data/processes/d4895001-c3e1-4f58-afd0-8cb464868508.xml
Turkey TR: Diesel mix http://gabi-documentation-2013.gabi-soft-ware.com/xml-data/processes/244524ed-7b85-4548-b345-f58dc5cf9dac.xml
India IN: Diesel mix http://gabi-documentation-2013.gabi-soft-ware.com/xml-data/processes/39649fef-cee0-4f51-8cf0-e4f256251430.xml
US US: Diesel mix http://gabi-documentation-2013.gabi-soft-ware.com/xml-data/processes/452a3926-2850-47db-809d-753095ed7dac.xml
Mineral-derived organic fertilizer
Rock Phosphate GLO: Rock phosphate mix (32.4 % P2O5) PE
http://gabi-documentation-2013.gabi-soft-ware.com/xml-data/processes/a9a40f47-b00c-48d9-9f96-ce44e6b7e6f7.xml
Electricity
China CN electricity grid mix http://gabi-documentation-2013.gabi-soft-ware.com/xml-data/processes/124e9246-9e84-4352-86b5-c08837e8cf92.xml
Turkey TR electricity grid mix http://gabi-documentation-2013.gabi-soft-ware.com/xml-data/processes/86c2ab55-7307-418c-bd11-b50166206ce9.xml
India IN electricity grid mix http://gabi-documentation-2013.gabi-soft-ware.com/xml-data/processes/b9f24581-2fe8-4393-810c-4789a92b9c3b.xml
Tanzania ZA electricity grid mix http://gabi-documentation-2013.gabi-soft-ware.com/xml-data/processes/12711ded-b092-4264-acfe-c65984b33b89.xml
USA US electricity grid mix http://gabi-documentation-2013.gabi-soft-ware.com/xml-data/processes/12711ded-b092-4264-acfe-c65984b33b89.xml
Approximations
Muriate of Potash Potassium chloride (agrarian); technology mix; production mix, at producer
http://gabi-6-lci-documentation.gabi-soft-ware.com/xml-data/processes/6ba336fd-3bf4-42e0-bc1b-88a6ab47d310.xml
Seed production Hemp seeds; technology mix; production mix, at producer
http://gabi-documentation-2013.gabi-soft-ware.com/xml-data/processes/4888cf22-8ff9-4166-a1b7-3fb817b31886.xml
Livestock system (1 kg liveweight)
US: Beef cattle (feedlot farm, 1kg live-weight) PE
Documentation available on request
Neem cake Linseed meal (economic allo-cation)
Documentation available on request
Diesel Tanzania US: Diesel mix http://gabi-documentation-2013.gabi-soft-ware.com/xml-data/processes/452a3926-2850-47db-809d-753095ed7dac.xml

76
Table 8-8: Summary of Life cycle Inventory (Flows contributing >1% to one of the con-sidered impact categories)
Flow Quantity Amount Unit
Input
Carbon dioxide [Renewable resources] Mass 1550 kg
Water (ground water) [Water] Mass 127270 kg
Water (lake water) [Water] Mass 17924 kg
Water (rain water) [Water] Mass 13890404 kg
Water (river water) [Water] Mass 571425 kg
Output
Cotton fibre (ginned) [Materials from ren. raw materials] Mass 1000 kg
Ammonia [Inorganic emissions to air] Mass 1.0 kg
Arsenic (+V) [Heavy metals to fresh water] Mass 0.00013 kg
Cadmium (+II) [Heavy metals to fresh water] Mass 0.00009 kg
Carbon dioxide [Inorganic emissions to air] Mass 435 kg
Carbon dioxide (biotic) [Inorganic emissions to air] Mass 10 kg
Carbon monoxide [Inorganic emissions to air] Mass 1.0 kg
Chromium (+III) [Heavy metals to fresh water] Mass 0.0006 kg
Copper (+II) [Heavy metals to fresh water] Mass 0.0005 kg
Methane [Organic emissions to air (group VOC)] Mass 10.2 kg
Nickel (+II) [Heavy metals to fresh water] Mass 0.0026 kg
Nitrate [Inorganic emissions to fresh water] Mass 6.6 kg
Nitrogen dioxide [Inorganic emissions to air] Mass 0.017 kg
Nitrogen monoxide [Inorganic emissions to air] Mass 0.6 kg
Nitrogen organic bounded [Inorganic emissions to fresh water]
Mass 1.3 kg
Nitrogen oxides [Inorganic emissions to air] Mass 3.9 kg
Nitrous oxide (laughing gas) [Inorganic emissions to air] Mass 1.0 kg
Sulphur dioxide [Inorganic emissions to air] Mass 1.4 kg
Water (evapotranspiration) [Inorganic emissions to air] Mass 14070551 kg
Water (river water from technosphere, cooling water) [Other emissions to fresh water]
Mass 6290 kg
Water (river water from technosphere, turbined) [Other emissions to fresh water]
Mass 528289 kg
Water (river water from technosphere, waste water) [Other emissions to fresh water]
Mass 144 kg
Zinc (+II) [Heavy metals to air] Mass 0.0005 kg
Zinc (+II) [Heavy metals to fresh water] Mass 0.0013 kg

77
8.3 Description of result parameters
Primary energy consumption
Primary energy demand is often difficult to determine due to the various types of energy
source. Primary energy demand is the quantity of energy directly withdrawn from the hydro-
sphere, atmosphere or geosphere or energy source without any anthropogenic change. For
fossil fuels and uranium, this would be the amount of resource withdrawn expressed in its
energy equivalent (i.e. the energy content of the raw material). For renewable resources,
the energy-characterised amount of biomass consumed would be described. For hydro-
power, it would be based on the amount of energy that is gained from the change in the
potential energy of the water (i.e. from the height difference). As aggregated values, the
following primary energies are designated:
The total “Primary energy consumption non-renewable”, given in MJ, essentially char-
acterises the gain from the energy sources natural gas, crude oil, lignite, coal and uranium.
Natural gas and crude oil will be used both for energy production and as material constitu-
ents e.g. in plastics. Coal will primarily be used for energy production. Uranium will only be
used for electricity production in nuclear power stations.
The total “Primary energy consumption renewable”, given in MJ, is generally accounted
separately and comprises hydropower, wind power, solar energy and biomass.
It is important that the end energy (e.g. 1 kWh of electricity) and the primary energy used
are not miscalculated with each other; otherwise the efficiency for production or supply of
the end energy will not be accounted for.
The energy content of the manufactured products will be considered as feedstock energy
content. It will be characterised by the net calorific value of the product. It represents the
still usable energy content.
Global Warming Potential (GWP)
The mechanism of the greenhouse effect can be observed on a small scale, as the name
suggests, in a greenhouse. These effects are also occurring on a global scale. The occur-
ring short-wave radiation from the sun comes into contact with the earth’s surface and is
partly absorbed (leading to direct warming) and partly reflected as infrared radiation. The
reflected part is absorbed by so-called greenhouse gases in the troposphere and is re-
radiated in all directions, including back to earth. This results in a warming effect at the
earth’s surface.
In addition to the natural mechanism, the greenhouse effect is enhanced by human activi-
ties. Greenhouse gases that are considered to be caused, or increased, anthropogenically
are, for example, carbon dioxide, methane and CFCs. Figure 8-2 shows the main processes
of the anthropogenic greenhouse effect. An analysis of the greenhouse effect should con-
sider the possible long term global effects.
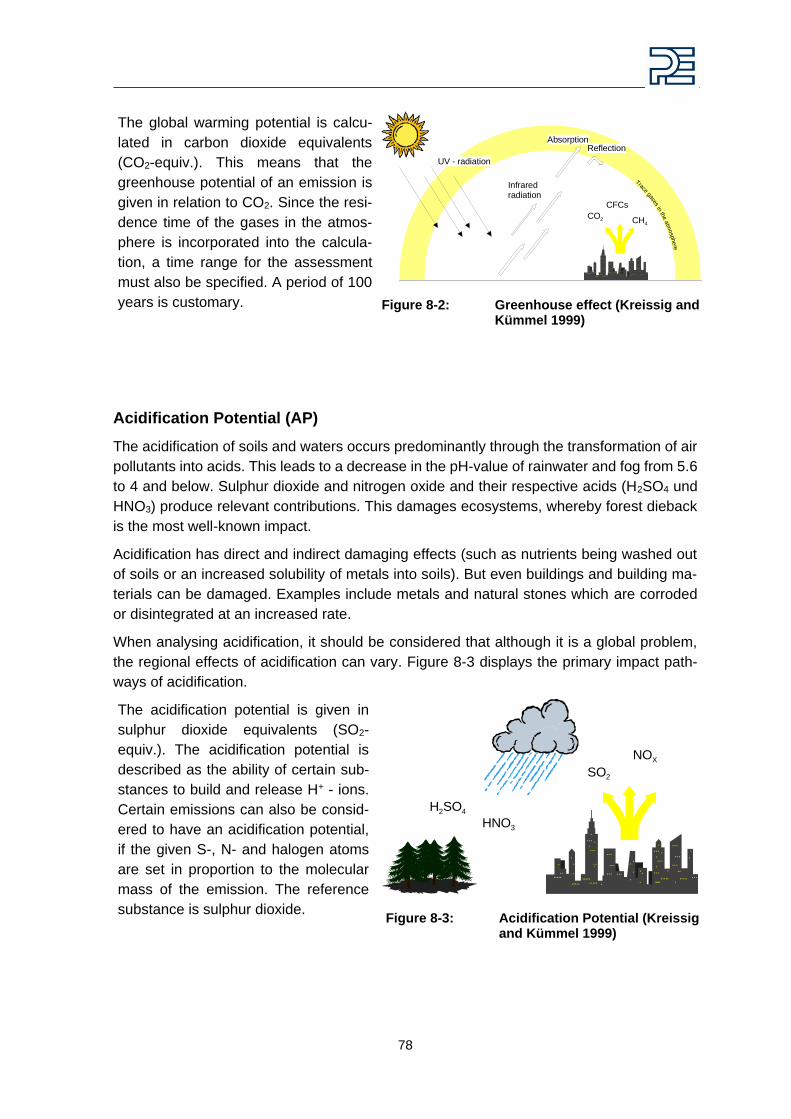
78
The global warming potential is calcu-
lated in carbon dioxide equivalents
(CO2-equiv.). This means that the
greenhouse potential of an emission is
given in relation to CO2. Since the resi-
dence time of the gases in the atmos-
phere is incorporated into the calcula-
tion, a time range for the assessment
must also be specified. A period of 100
years is customary.
Figure 8-2: Greenhouse effect (Kreissig and Kümmel 1999)
Acidification Potential (AP)
The acidification of soils and waters occurs predominantly through the transformation of air
pollutants into acids. This leads to a decrease in the pH-value of rainwater and fog from 5.6
to 4 and below. Sulphur dioxide and nitrogen oxide and their respective acids (H2SO4 und
HNO3) produce relevant contributions. This damages ecosystems, whereby forest dieback
is the most well-known impact.
Acidification has direct and indirect damaging effects (such as nutrients being washed out
of soils or an increased solubility of metals into soils). But even buildings and building ma-
terials can be damaged. Examples include metals and natural stones which are corroded
or disintegrated at an increased rate.
When analysing acidification, it should be considered that although it is a global problem,
the regional effects of acidification can vary. Figure 8-3 displays the primary impact path-
ways of acidification.
The acidification potential is given in
sulphur dioxide equivalents (SO2-
equiv.). The acidification potential is
described as the ability of certain sub-
stances to build and release H+ - ions.
Certain emissions can also be consid-
ered to have an acidification potential,
if the given S-, N- and halogen atoms
are set in proportion to the molecular
mass of the emission. The reference
substance is sulphur dioxide.
Figure 8-3: Acidification Potential (Kreissig and Kümmel 1999)
CO2 CH4
CFCs
UV - radiation
AbsorptionReflection
Infraredradiation
Trace gases in the a
tmosphe
re
SO2
NOX
H2SO44
HNO3

79
Eutrophication Potential (EP)
Eutrophication is the enrichment of nutrients in a certain place. Eutrophication can be
aquatic or terrestrial. Air pollutants, waste water and fertilization in agriculture all contribute
to eutrophication.
The result in water is an accelerated algae growth, which in turn, prevents sunlight from
reaching the lower depths. This leads to a decrease in photosynthesis and less oxygen
production. In addition, oxygen is needed for the decomposition of dead algae. Both effects
cause a decreased oxygen concentration in the water, which can eventually lead to fish
dying and to anaerobic decomposition (decomposition without the presence of oxygen).
Hydrogen sulphide and methane are thereby produced. This can lead, among others, to the
destruction of the eco-system.
On eutrophicated soils, an increased susceptibility of plants to diseases and pests is often
observed, as is a degradation of plant stability. If the nutrification level exceeds the amounts
of nitrogen necessary for a maximum harvest, it can lead to an enrichment of nitrate. This
can cause, by means of leaching, increased nitrate content in groundwater. Nitrate also
ends up in drinking water.
Nitrate at low levels is harmless from a
toxicological point of view. However, ni-
trite, a reaction product of nitrate, is
toxic to humans. The causes of eu-
trophication are displayed in Figure
8-4. The eutrophication potential is cal-
culated in phosphate equivalents
(PO4-equiv.). As with acidification po-
tential, it’s important to remember that
the effects of eutrophication potential
differ regionally.
Figure 8-4: Eutrophication Potential (Kreissig and Kümmel 1999)
Water use and water consumption
Water use is understood as an umbrella term for all types of anthropogenic water uses. On
an inventory level, water use equals the measured water input into a product system or
process. In most cases water use is determined by total water withdrawal (water abstrac-
tion).
Consumptive and degradative use
Freshwater use is generally differentiated into consumptive water use (= water consump-
tion) and degradative water use, the latter denoting water pollution:
Waste water
Air pollution
Fertilisation
PO4-3
NO3-
NH4+
NOXN2O
NH3
Waste water
Air pollution
Fertilisation
PO4-3
NO3-
NH4+
NOXN2O
NH3

80
Freshwater consumption (consumptive freshwater use) describes all freshwater losses on
a watershed level which are caused by evaporation, evapotranspiration from plants4, fresh-
water integration into products, and release of freshwater into sea (e.g. from wastewater
treatment plants located on the coast line). Therefore, freshwater consumption is defined in
a hydrological context and should not be interpreted from an economic perspective, so it
does not equal the total water use (total water withdrawal), but rather the associated losses
during water use. Note that only the consumptive use of freshwater, not sea water, is rele-
vant from an impact assessment perspective because freshwater is a limited natural re-
source.
Degradative water use, in contrast, denotes the use of water with associated quality altera-
tions and describes the pollution of water (e.g. if tap water is transformed to wastewater
during use). These alterations in quality are not considered to be water consumption.
The watershed level is regarded as the appropriate geographical resolution to define fresh-
water consumption (hydrological perspective). If groundwater is withdrawn for drinking wa-
ter supply and the treated wastewater is released back to a surface water body (river or
lake), then this is not considered freshwater consumption if the release takes place within
the same watershed; it is degradative water use.
The difference between freshwater use and freshwater consumption is highly crucial to cor-
rectly quantify freshwater consumption, in order to interpret the meaning of the resulting
values and for calculating water footprints (ISO 14046).
The water footprint of a system is a set of different calculations and should be used as an
umbrella term rather than to communicate a single number. According to ISO 14046 (in
progress; (ISO 14046)) a water footprint consists of two parts: a water stress footprint caused
by consumptive use and a water stress footprint caused by degradative water use.
Degradative use causes environmental impacts due to the pollutants released to nature.
Yet, quality alterations during degradative use, e.g. release of chemicals, are normally cov-
ered in other impact categories of an LCA, such as eutrophication and eco-toxicity. Methods
to assess additional stress to water resources caused by reduced availability of water (due
to reduced quality) are under development, but not addressed in this study. So far, water
footprinting focuses on the water lost to the watershed, i.e. water consumption. Water con-
sumption is considered to have a direct impact on the environment (e.g. freshwater deple-
tion and impacts to biodiversity).
4 Note: Typically, only water from irrigation is considered in the assessment of agricultural processes and the
consumption of rain water is neglected. The rationale behind this approach is the assumption that there is no environmental impact of green water (i.e. rain water) consumption. Such an effect would only exist if crop cultivation results in alterations in water evapotranspiration, runoff and infiltration compared to natural vege-tation. Additionally it remains arguable whether or not such changes (if they occur) should be covered by as-sessment of land use changes rather than in water inventories. However, rain water use is sometimes as-sessed in different methodological approaches or can be used for specific analyses. The GaBi software al-lows assessment of both water use including rain water (“Total fresh water use”, “total freshwater consump-tion”) and without rainwater (“Blue water use” and “blue water consumption”).
81
8.4 Critical Review Statement
Final statement from the critical review panel of the LCA study
“Life Cycle Assessment (LCA) of Organic Cotton”
Dear Mr. Thylmann,
The review panel has read the final version of your LCA study (Final Draft 3 revision for critical review,
dated 17 October 2014) and we are glad that you were able to address almost all the elements that
we have pointed out in our review.
With the modifications you have done to your report, the panel review considers this LCA study to
be compliant with ISO 14044. In particular, the methods used to carry out the LCA are scientifically
and technically valid, the foreground data used are appropriate and reasonable in relation to the goal
of the study, the interpretations in the report reflect the limitations identified and the goal of the study,
and the study report is transparent and consistent and suitable for publication with the inclusion of
the Review Report.
Moreover, we would like to point out that the review process was conducted in a very open and
cooperative relation with you. However, the constraints in available resources and time put some
pressure on our review work, considering that some important information concerning the life cycle
inventory was shared just shortly before the finalization.
Considering the complexity of the study, we would like to highlight that the verification of each dataset
was not possible; in particular, primary data for different countries were checked on their plausibility
but were not verified at data source. The foreground data used for the global average including emis-
sions from inputs of nutrients were checked for the global average data provided in the Annexes. It
was not possible for the reviewers to validate the full model which is implemented in Gabi for calcu-
lating emissions based on the entry of primary data due to certain limitations on time and budget.
As in any agricultural LCA study, the variation of single data is high. Furthermore there are some
modelling choices which have an important influence on the final results. We highly appreciate that
this has been addressed in several scenarios in the report. This aspect has been made clear in the
report and it should also be considered while using the electronic data (LCI dataset), especially in
making comparisons with other cotton life cycle inventories.
According to the goal and scope of the study it was not foreseen to make comparative assertions
e.g. between different countries or with conventional cotton. Thus, the review panel does not make
any statement concerning the suitability of comparing the results of this study with the results in other
publications.
On behalf of the review panel I’d like to congratulate you for the interesting study that we consider
an important contribution for understanding and quantifying the environmental aspects of organic
cotton production.
Oct. 29th, 2014 Paolo Masoni
for the critical review panel composed by:
Paolo Masoni (ENEA, Italy)
Christian Schader, PhD (FiBL, Switzerland)
Niels Jungbluth, PhD (ESU-service, Switzerland)
Annex: summary of the Review Report

82
SUMMARY OF THE REVIEW REPORT
Goal and scope of the review
The critical review was performed by a Panel composed by:
Paolo Masoni (ENEA, Italy), PM
Christian Schader, PhD (FiBL, Switzerland), CS
Niels Jungbluth, PhD (ESU-service, Switzerland), NJ
The critical review process shall ensure that:
the methods used to carry out the LCA are consistent with ISO 14040 and ISO
14044;
the methods used to carry out the LCA are scientifically and technically valid;
the data used are appropriate and reasonable in relation to the goal of the study;
the interpretations reflect the limitations identified and the goal of the study; and
the study report is transparent and consistent.
The Critical Review was performed during the LCA study.
The key moments when the panel issued an interim report with detailed comments are:
1) the goal and scope definition
2) the model set up and inventory calculation
3) inventory and impact assessment analysis
4) draft LCA report.
This Summary Critical Review Report, documenting the Critical Review process and find-
ings and a Critical Review Statement shall be part of the final LCA report and is intended to
be communicated to the public.
Method
The review was conducted during the LCA study in different steps.
Firstly, the Goal and Scope of the study was presented during a conference call among the
Commissioner, the Practitioner and the Review Panel and documented in a draft report that
was been commented, in particular with respect to the applicable standards, quality require-
ments, and methodological aspects.
The second step was the check of inventory data collected on farms and the illustration to
the panel chair of the agricultural model implemented in GaBi by the Practitioner, with its
characteristics, model principles and input parameters. A plausibility check was performed
against literature data. Following the agricultural model presentation, additional sensitivity
scenarios were recommended, to check the influence on the final results of some assump-
tions adopted in the agricultural model.

83
Third step was the review of the inventory data, modelling and impact assessment. That
step highlighted a number of comments, mainly related to questions like the transparency
of the study, interpretation of the results, and comparability issues with the conventional
cotton study.
Lastly, the final version of the report was presented in a conference call with the participation
of the Commissioner and the Practitioner and reviewed in order to deliver the present Re-
view Statement. The review included also the dataset prepared on the LCA results in ILCD
format. The review was conducted on its documentation according to the ILCD Entry Level
quality requirements.
Conference calls among the reviewers and with the Practitioners were organised anytime it
was considered necessary either to find a consensus within the Panel or to clarify specific
technical aspects of the study.
In each of the above four mentioned steps, the Review Panel drafted a review report detail-
ing all the comments and the responses from the practitioner. The Review Report was made
available to the Commissioner of the study.
Results
The organic Cotton LCA study presents a great complexity due to its nature:
- Global scope: the results are the average of many countries, with a very large vari-
ability in cultural techniques and local conditions. We had a good vision of the geo-
graphical differences with respect to some foreground data (e.g. yield differences).
- Agricultural processes are very difficult to model because of the complexity of rela-
tion among input (soil, fertilizers, water, weather, etc) and output (crop).
- Many emissions cannot be measured on field but must be estimated using models
Because of that great complexity, the final numerical results may be affected by the model-
ling choices and by different assumptions. The study is based on a reference model, where
the sound assumptions are adopted, and is supplemented with a number of sensitivity anal-
yses, where the effect of the variation of data and assumptions are measured.
During the review process, because of the complexity of the study, many comments have
been raised, with specific focus on key aspects as methodological choices, transparency of
the report, comparability and assertions in the interpretation.
Almost all the comments has been accepted and implemented in the final report.
Conclusions
The panel review considers the LCA study of Organic Cotton to be compliant with ISO
14044. In particular, the methods used to carry out the LCA are scientifically and technically
valid, the data used are appropriate and reasonable in relation to the goal of the study, the
interpretations reflect the limitations identified and the goal of the study, and the study report
is transparent and consistent and suitable for publication with the inclusion of the Review
Report.
Related Documents