LIFE Programme LIFE: CONTRIBUTING TO EMPLOYMENT AND ECONOMIC GROWTH FINAL REPORT Duration Personnel Budget Infrastruc. Budget Prototype budget Innovation # of Partners Region Sector EU12 SUSTAINABILITY REPLICABILITY October 2016

Welcome message from author
This document is posted to help you gain knowledge. Please leave a comment to let me know what you think about it! Share it to your friends and learn new things together.
Transcript
LIFE Programme
LIFE: CONTRIBUTING TO EMPLOYMENT AND ECONOMIC GROWTH
F I N A L R E P O R T
Duration Personnel Budget
Infrastruc.Budget
Prototypebudget
Innovation
# of Partners
Region Sector EU12
SUSTAINABILITY REPLICABILITY
October 2016

2
3
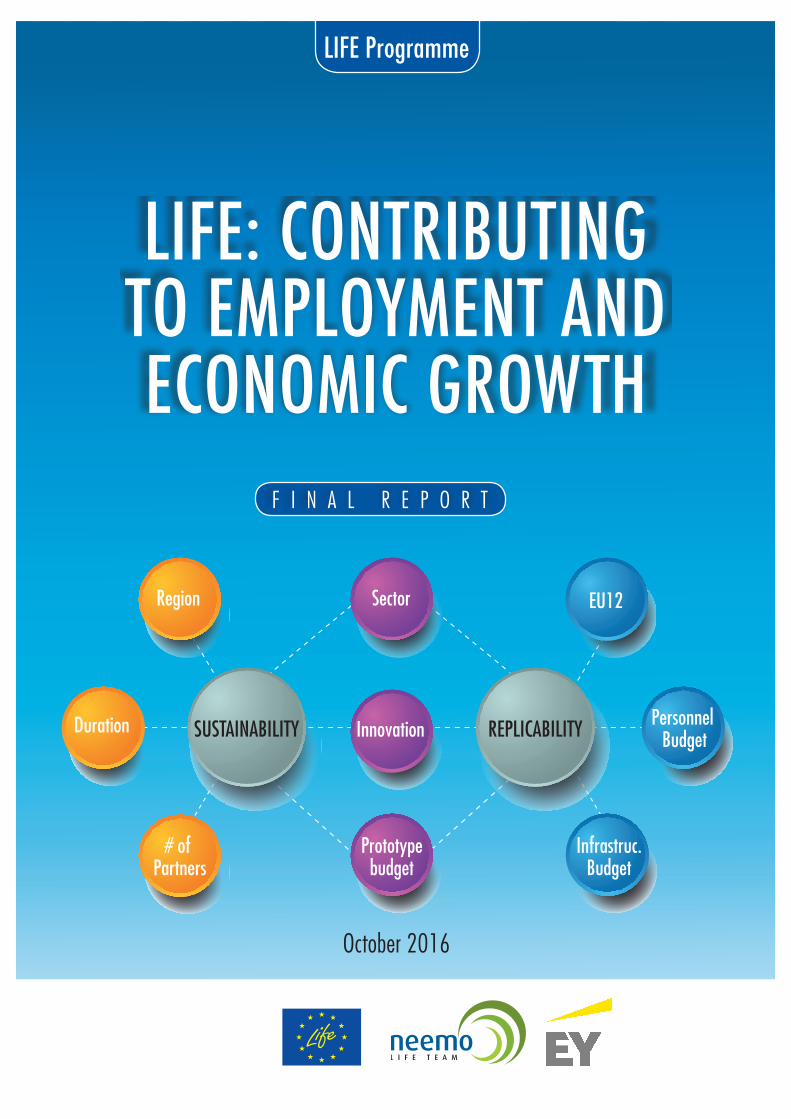
Methods and Resources: an Overview

4
! 5!
Executive)Summary!!Structure'of'the'Study'!This!report!(the!“Study”)!was!prepared!as!the!deliverable!of!Task!9.3!“LIFE!past,!present!and!future!contributions!to!employment!and!economic!growth”!and!Task!9.4!“LIFE!effectiveness!and!replicability”.!The!Study!has!been!developed!by!a!group!of!17#Neemo#and#Ernst#&#Young#(Prague)#experts,!who!prepared!the!four!main!parts!of!the!Study:!Lida!Ampatzi,!Richard!Bobek,!Svetoslav!Danchev,!Pavlos!Doikos,!Francisco!Greño,!Ondrej!Hartman,!Dominik!Herman,!Bent!Jepsen,!Sira!JiménezUCaballero,!Petr!Krucky,!Zornitza!Marinova,!Chryssanthi!Pegka,!Tomas!Schwardy,!Romana!Smetankova,!Andreas!Troumbis,!and!Tomas!Vakrman.!The!general!coordination,!structuring,!and!checking!of!the!study!was!carried!out!by!Christos!Kissas.!!This!Study!is!divided!into!four!parts,!complementing!each!other,!and!several!annexes.!!Part#I!is!focused!on!the!statistical!and!econometric!analysis!of!LIFE!projects,!their!sustainability!and!their!replicability!potential.!The!methodology!used!in!this!part!is!centred!on!extracting!raw!data,!turning!data!into!variables,!categorising!qualitative!data,!selecting!the!appropriate!statistical!tools!and!methods,!setting!the!main!equations!between!variables,!and!performing!standard!econometric!analysis!with!the!use!of!sophisticated!models,!such!as!probit!and!logit!regression.!In!addition!to!econometric!models,!surveys!as!well!as!qualitative!and!cluster!analyses!have!been!performed.!!The!data!on!which!the!above!analysis!was!based!varies!with!the!type!of!method!applied.!A!complete!database!of!over!4.000!LIFE!projects!covering!the!25Uyear!period!from!1991!to!2016!was!used!in!order!to!study!the!projects!main!characteristics:!categorisation,!geographical!and!temporal!distribution,!etc.!A!subset!of!835!projects,!for!which!sufficient!data!were!available,!was!then!used!to!map!out!sustainability!and!replicability!potential.!The!main!determinants!of!these!two!fundamental!variables!were!extracted!via!stateUofUtheUart!data!mining!procedures!from!Neemo’s!LIFEtrack!Dory!database.!After!a!thorough!analysis!of!the!data!mining!results,!a!set!of!around!100!variables!were!tested!econometrically!as!determinants!of!sustainability!and!replicability!potential.!As!an!additional!quality!control!check,!the!robustness!of!results!was!tested!by!comparing!the!output!of!four!different!methods!of!regression!analysis.!Finally,!a!clustering!of!projects!was!constructed!and!an!examination!of!projects!representing!each!cluster!was!performed,!in!order!to!confirm!the!results!obtained!by!the!econometric!analysis.!The!methodology!used!is!thus!based!on!the!best!available!scientific!techniques,!in!order!to!obtain!credible!results!and!to!minimise!subjectivity!and!biases.!!Part#II!examines!the!economic!impact!of!selected!LIFE!projects!under!different!replication!scenarios.!The!purpose!of!this!part!is!to!analyse!the!potential!of!LIFE!projects!that!are!considered!as!the!most!likely!to!be!replicable!and!sustainable!for!job!creation!and!for!their!contribution!to!economic!growth!in!the!context!of!competitive!market!economy.!As!forecasting!the!economy!is!inherently!uncertain,!it!was!chosen!to!formulate!three!alternative!scenarios!(a!baseline,!a!low!growth,!and!high!growth),!as!a!more!realistic!approach.!The!assumptions!behind!these!scenarios!for!each!project!are!clearly!determined!and!stated,!and!the!overall!methodology!is!thoroughly!explained.!For!each!project,!specific!growth!drivers!were!established!and!estimated!under!the!three!scenarios.!Assumptions!on!the!rate!of!diffusion!of!the!projects!output!were!made,!where!possible,!and!projections!were!established!by!multiplying!such!rates!with!the!total!area!of!potential!use!of!the!projects!technology.!
6
Part III deals with the specificity of LIFE Nature projects’ replication. It is widely known that
Nature projects apart from their direct contribution to growth and employment also create
considerable value that is not registered through market mechanisms. In order to capture and
estimate this non-market value, a sample of 25 carefully selected and largely representative
LIFE Nature and Biodiversity projects, funded during the 2004-2010 period, was used. For
these projects the analysis has been structured around three major pillars: a) the pairing of
conservation or restoration activities and actions undertaken with a strict definition of
ecosystem services provided; b) the monetary valuation of these services, according to the
best estimates available worldwide; and c) the construction of empirical "rules" governing the
relationship between LIFE funding and the creation of qualified employment and transfers to
specific sectors of the local/national economy.
Besides technical and methodological aspects that are addressed in the Study, two important
traits of the LIFE funding process are highlighted: a) regarding effectiveness, the hidden
economic potential of LIFE Nature projects through monetary valuation of ecosystem services
appears in some cases extremely important, although a high degree of uncertainty still
persists; monetary valuation of ecosystem/biodiversity services might be used as a
prerequisite for future funding; b) regarding replicability, alternative approaches to future
project selection strategies are presented, in light of which a new LIFE proposal evaluation
framework might be welcome in order to take the lessons learned in the earlier phases of this
funding mechanism into account.
Part IV is a special report which presents an overview of the relatively new and not yet fully
known field of Green Finance, highlighting its potential for financing the replication of LIFE
projects. Innovative products, such as green bonds and instruments developed by
experimental organisations such as the Global Innovation Lab are discussed. Similarly, green
loans, funds, yieldcos, and specific initiatives by international development institutions are
presented. Yet, this Part is only an introduction to the vast and extremely complex sphere of
financing the green economic revolution. A more in depth analysis of tailor-made instruments
for financing LIFE replication should probably be the object of an upcoming study.
Key messages
Readily available data on LIFE projects mainly takes the form of reports. There are several
thousands of documents, such as mission reports as well as evaluations of inception reports,
mid-term reports, final reports, and monitoring files accessible online in Neemo’s database
“LIFEtrack Dory.” However, a striking feature of this documentation is that these reports are
mostly “flat” word documents, with few structured data that can be used directly for analytic
purposes. As a consequence, it takes a huge effort to extract economic and other pertinent
variables from this documentation in order to conduct a quantitative study. Thus, the need for
reliable indicators on LIFE projects is one of the most important aspects that should be
developed, and recent work done by the EC with help from Neemo is critical for future
analyses and assessments of the Programme.
Among the results of the statistical analysis (presented in Annex 1 of Part I), the distribution of
projects between the two major categories, Environment and Nature, across countries leads to
the idea of “clustering”. It seems that certain countries tend to specialise in ENV and others in NAT projects. It may be interesting to take a closer look at these “specialisations”, in relation to the type of beneficiaries, and evaluate the desirability of such specialisation.
7
Also, the distribution of the average and aggregate EC contribution per country reveals
another pattern of clustering: recipient countries tend to be in an either “low average/high aggregate contribution”, or in a “high average/low aggregate contribution” category, or in
other words, more projects with lower contribution vs. less projects with higher contribution.
There is also a high concentration of projects on certain economic sectors of high economic
importance and “recognised markets,” such as waste management, waste water, and
protection (air, soil), which account for roughly 70% of all projects.
Among the major determinants of Sustainability and Replicability are: the level of innovation,
personnel and infrastructure budgets, the amounts spent on prototypes, the number of
beneficiaries, and to a certain degree the economic sector.
Interestingly enough, several variables display a non-linear (U-shaped or a Hump-shaped)
relation with sustainability and replicability, which means that there seems to be an optimal
region of values that maximises the variable’s influence on the projects’ potential to be
sustainable and replicable. The most interesting of these effects concerns the level of
innovation; innovative projects tend to be more sustainable and replicable, but the effect
levels off for those projects that could be considered as “too innovative.” In a scale of
innovation of 0 to 9, the peak influence is obtained around a value of 7.4. This finding is
important management information for LIFE projects, as it can be interpreted as an indication
that innovative LIFE projects are highly desirable, i.e. being more financially sustainable and
replicable under real life/ market conditions. On the other hand, projects focused mainly on
innovation (“too innovative”) might be better suited to other EU funding Programmes that do not target wide replication and sustainability, (thus acting as direct catalysts for change), but
rather focus on scientific/technological excellence that eventually (in a time span of some
years) can enter the market. This finding determines a key project characteristic: potential to
deliver change over time.
Similar results were obtained for the variable “prototype budget”, where a middle value gives
the highest positive influence on both sustainability and replicability, which corroborates the
previous finding.
Another conclusion drawn from the econometric analysis is that a higher number of
(associated) partners has a significantly negative impact on sustainability, as it probably
complicates the management of the project after the grant period. Therefore, smaller and
easier to manage partnerships have more chances of successful replication.
As expected, sustainability and replicability are highly correlated and share several common
determinants.
The impact of LIFE on employment is far from being negligible. On a large sample of projects,
findings show that during the grant period, the average project created 31 person-years in full
time equivalent (FTE) jobs, both directly and indirectly. If we consider only direct job creation
(estimated only from personnel costs), an average project attains 21 person-years. Projection of theses figures to a typical population of 1 000 projects corresponding to an entire programming period equivalent to LIFE+, leads to a total jobs creation of 31 000 FTE equivalents person-years for the implementation period, (21 000 if only direct jobs creation is
considered).
8
Scenario-based analysis performed on a sample of high-potential projects leads to impressive
conclusions on the of LIFE projects’ ability to both boost employment and induce economic
growth. For the same as above 1 000 project population and by using the most conservative figures, we obtain within a five year period from the start of replication approximately 43 500 FTE person-years, and an estimated contribution to economic growth of € 9,3 billion.
Nature projects’ replication through market mechanisms is not yet common. Still the non-
market value created by Nature and Biodiversity projects, as measured by monetisation of the
associated ecosystems services is considerable, and in some cases extremely high. This value
creation potential should be systematically calculated, reported and communicated to decision
makers, stakeholders and the public and taken into consideration in decision-making on
financing such projects. The field of financial instruments/market transactions for ecosystem
services is currently under development and is expected to grow significantly over the next
decade.
Projections made on the basis of a sample of representative (though not random) Nature projects, by using internationally accepted valuation databases and by adopting the most conservative figures, estimate the value created by LIFE during a programming period in Nature projects at € 43 billion.
The results obtained regarding the types of Nature projects and replicability may be interesting
to be taken into account when defining the selection criteria for evaluating LIFE project
proposals (or similar development initiatives by national/regional funding authorities or other
international funding bodies). A good start might be to require an estimation of ecosystem
services valuation to be included in the proposal, in order to be taken into account in the
selection procedure.
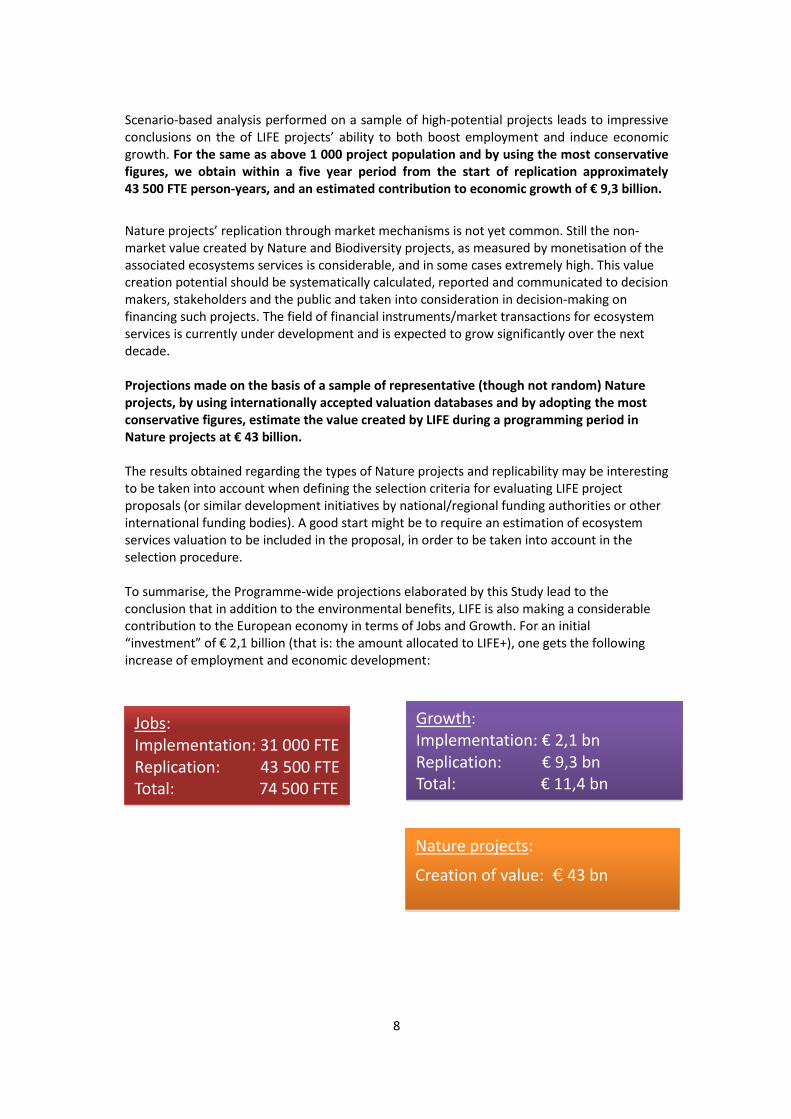
To summarise, the Programme-wide projections elaborated by this Study lead to the
conclusion that in addition to the environmental benefits, LIFE is also making a considerable
contribution to the European economy in terms of Jobs and Growth. For an initial
“investment” of € 2,1 billion (that is: the amount allocated to LIFE+), one gets the following
increase of employment and economic development:
Jobs: Implementation: 31 000 FTE Replication: 43 500 FTE Total: 74 500 FTE
Growth:
Implementation: € 2,1 bn
Replication: € 9,3 bn
Total: € 11,4 bn
Nature projects:
Creation of value: € 43 bn
9
The way forward
However, replication through market mechanisms pre-supposes readily available finance. And
it is generally accepted that in the current situation of financial markets and economic context,
there is a financing gap, especially for new ventures, start-ups, and innovative projects.
Though a glimmer of hope may come from the emerging world of green finance, where at
least one type of financial product is becoming mainstream: the so-called green bonds. These
instruments show exponential growth over the last few years and cover all areas of
environmental investments. Lately, a strong effort of standardisation and certification has
produced notable results, by bringing confidence among investors and financial institutions.
The next big step, currently in the process, is to develop the green bonds market, from a niche
market to a mainstream one, a process finance professionals call “going from billions to
trillions”. In this landscape, there is certainly a business opportunity for the LIFE community to specifically design and promote the appropriate mechanisms for financing LIFE projects’ replication. The creation of a specific LIFE replication instrument, probably based on a type of
green bond could be the way forward in this area.
10
Table of Contents
Executive Summary .................................................................................................................................................... 5
Table of Contents ..................................................................................................................................................... 10
PART I: Statistical Analysis and Modelling ................................................................................................................ 13
List of Figures ............................................................................................................................................................ 14
List of Tables ............................................................................................................................................................. 15
Abbreviations ........................................................................................................................................................... 16
Introduction .............................................................................................................................................................. 17
Chapter 1: Methodology of the study ...................................................................................................................... 20
1.1 Available data .............................................................................................................................................. 20
1.2 General approach of the study .................................................................................................................... 20
1.3 Data mining .................................................................................................................................................. 21
1.4 Survey .......................................................................................................................................................... 23
1.5 Econometric analysis and modelling ........................................................................................................... 23
1.6 Cluster analysis ............................................................................................................................................ 26
Chapter 2: Likelihood of sustainability and replicability of the selected projects .................................................... 28
2.1 Distribution of projects per sustainability ................................................................................................... 32
2.2 Distribution of projects per replicability ...................................................................................................... 35
2.3 Distribution of projects per sector ............................................................................................................... 39
Chapter 3: The key determinants of sustainability and replicability of the selected projects ................................. 45
3.1 Sustainability................................................................................................................................................ 48
3.2 Replicability.................................................................................................................................................. 52
3.3 Qualitative analysis ...................................................................................................................................... 56
Internal factors ........................................................................................................................................................... 56
External factors ........................................................................................................................................................... 60
3.4 Robustness checks ....................................................................................................................................... 62
Chapter 4: Cluster analysis ....................................................................................................................................... 66
1. Asbestos denaturing with innovative ovensystems (ADIOS) / LIFE09 ENV / NL / 000424 ............................. 69
2. Environmental TRY for Innovative Dynamic Environmental and energetic Analyses (ET IDEA ) /
LIFE09 ENV/IT/000124 ....................................................................................................................................... 70
3. The impact of geological environment on health status of residents of the Slovak Republic
(GEOHEALTH)/ LIFE10 ENV/SK/000086 ............................................................................................................. 71
4. Nanoremediation of water from small waste water treatment plants and reuse of water and solid
remains for local needs (LIFE RusaLCA) / LIFE12 ENV/SI/000443 ...................................................................... 72
5. Integrated coastal area Management Application implementing GMES, INspire and sEis data
policies (LIFE + IMAGINE) / LIFE12 ENV/IT/001054 ........................................................................................... 74
6. Innovative Methods of Monitoring of Diesel Engine Exhaust Toxicity in Real Urban Traffic
(MEDETEOX) / LIFE10 ENV/CZ/000651 .............................................................................................................. 75
11
7. Microwaves ecofriendly alternative for a safe treatment of medical waste (MEDWASTE)/ LIFE10
ENV/RO/000731 ................................................................................................................................................ 77
8. Mobile demonstration line for generation of Renewable ENERGY from micronized biomass
(MORENERGY)/ LIFE11 ENV/PL/00044 .............................................................................................................. 78
9. ROADTIRE - Integration of end-of-life tires in the life cycle of road construction / LIFE09
ENV/GR/000304 ................................................................................................................................................ 79
10. Recovery of dredged SEDIments of the PORT of Ravenna and SILicon extraction (SEDI.PORT.SIL)
/ LIFE09 ENV/IT/000158 .................................................................................................................................... 81
11. Development and demonstration of a waste prevention support tool for local authorities
(WASP Tool) / LIFE10 ENV/GR/000622 .............................................................................................................. 82
12. Zero Emission Firing strategies for ceramic tiles by oxy-fuel burners and CO2 sequestration with
recycling of byproducts (LIFE ZEF-tile)/ LIFE12 ENV/IT/000424 ........................................................................ 84
Chapter 5: Direct jobs creation by LIFE projects ...................................................................................................... 86
5.1 Impact on employment during the implementation phase ........................................................................ 86
5.2 Impact on employment during the post-implementation phase ................................................................ 87
References ................................................................................................................................................................ 90
PART II: Scenario-based impact on Jobs & Growth .................................................................................................. 91
List of Tables & Figures ............................................................................................................................................. 92
1. Methodology ................................................................................................................................................. 94
2. Case studies ................................................................................................................................................... 97
Green Deserts - Tree cultivation in desert environments ................................................................................. 97
SOL-BRINE – Treatment of brine from desalination plants ............................................................................... 99
EDEA-RENOV - Energy Renovation, Innovation and ICTs in Buildings ............................................................. 101
GREENWOOLF – Hydrolysis conversion of wool wastes into organic nitrogen fertiliser ................................ 105
Green Sinks – Manufacturing of composite sinks from recovered waste ....................................................... 107
IRRIGESTLIFE – Telemanagement network for an optimised irrigation .......................................................... 109
DYEMOND SOLAR – Low Cost Production of Energy Efficient Dye-Sensitized Solar Cells ............................... 110
DOMOTIC - Optimisation of Technologies for Intelligent Construction .......................................................... 113
RECYCHIP - Dismantling and decontamination of out-of-use ships................................................................. 115
ELINA – Management of a waste stream in Shipping ...................................................................................... 117
3. Conclusions and Projections ........................................................................................................................ 120
References .............................................................................................................................................................. 122
PART III: Evaluation of LIFE Projects from the perspective of Ecosystem Services ................................................ 125
List of Figures .......................................................................................................................................................... 126
List of Tables ........................................................................................................................................................... 127
Introduction and Objectives ................................................................................................................................... 128
Chapter 1: Methodology ........................................................................................................................................ 130
Step 1. Selection of LIFE NAT projects ............................................................................................................. 132
Step 2. Baseline definition ............................................................................................................................... 137
Step 3. Selection of the conservation measures to be analysed in monetary terms ...................................... 139
12
Step 4. Affected surface area on which impacts occur .................................................................................... 139
Step 5. Economic valuation of changes in ES ................................................................................................... 140
Step 6. Assessment of the overall projects’ impact on ecosystem services .................................................... 143
Step 7. Assessment of the direct economic impact of the 25 projects ........................................................... 144
Step 8. Effectiveness and replicability ............................................................................................................. 146
Chapter 2: Results .................................................................................................................................................. 147
Monetary valuation overall results .................................................................................................................. 147
Overall indirect economic impact of the 25 selected LIFE projects ................................................................. 153
Chapter 3: Replicability and effectiveness overall results ...................................................................................... 166
Chapter 4: Conclusions and Projections ................................................................................................................. 170
References .............................................................................................................................................................. 172
PART IV: Special Report – Financing LIFE projects replication ............................................................................... 174
Introduction ............................................................................................................................................................ 175
1. The Global Landscape of Green Finance ............................................................................................................ 176
2. Green Bonds ....................................................................................................................................................... 178
3. The Green Lab – Global Innovation Lab for Green Finance ................................................................................ 181
2014-2015 A Cycle Instruments ....................................................................................................................... 181
2015 – 2016 B Cycle Instruments .................................................................................................................... 182
4. Green Loans ........................................................................................................................................................ 183
European Investment Bank Green Loans (InnovFin EU Finance for Innovators) ............................................. 183
The UK Green Investment Bank ....................................................................................................................... 184
5. Green Funds ....................................................................................................................................................... 185
European Investment Bank Equity Funds ........................................................................................................ 185
European Investment Bank Layered Risk Funds .............................................................................................. 186
Green Climate Fund ......................................................................................................................................... 187
Climate Investment Fund................................................................................................................................. 187
6. Yieldco’s .............................................................................................................................................................. 188
7. Initiatives ............................................................................................................................................................ 189
European Investment Bank Initiatives ............................................................................................................. 189
United Nations Finance Initiative (UNEP FI) .................................................................................................... 190

13
PART I: Statistical Analysis and Modelling
14
List of Figures
Figure 1: Approach of the evaluation team during the development of the study
Figure 2: Number of Projects per Sustainability category
Figure 3: Average of EC Contribution per Sustainability category
Figure 4: Average of Duration per Sustainability category
Figure 5: Number of Projects per Sustainability per Region
Figure 6: Number of Projects per Sustainability per Country
Figure 7: Number of Projects per Replicability category
Figure 8: Average of EC Contribution per Replicability category
Figure 9: Average of Duration per Replicability category
Figure 10: Number of Projects per Replicability per Region
Figure 11: Number of Projects per Replicability per Country
Figure 12: Number of Projects per Sector (Economic Activity)
Figure 13: Number of Projects per Sector (Environmental Activity)
Figure 14: Aggregate EC Contribution per Sector (Economic Activity)
Figure 15: Aggregate EC Contribution per Sector (Environmental Activity)
Figure 16: Average of EC Contribution per Sector (Economic Activity)
Figure 17: Average of EC Contribution per Sector (Environmental Activity)
Figure 18: Dependent variables and significant factors influencing them
Figure 19: Sustainability and statistically significant factors influencing it
Figure 20: List of the projects influencing Sustainability
Figure 21: Replicability and significant factors influencing it
Figure 22: List of the projects influencing Replicability
Figure 23: Lifecycle of a LIFE project
15!!
List!of!Tables!Table!1.!Key!determinants!of!Sustainability!and!Replicability!
Table!2:!Sectors!by!economic!and!environmental!activities!
Table!3:!Indication!of!the!figures!
Table!4:!Percentage!of!match!between!the!level!of!Sustainability!and!Replicability!
Table!5:!Categories!of!Sustainability!
Table!6:!Categories!of!Replicability!
Table!7:!Econometric!results!on!Sustainability!
Table!8:!Econometric!results!on!Replicability!
Table!9:!Robustness!checks!on!econometric!modelling!(Sustainability)!
Table!10:!Robustness!checks!on!econometric!modelling!(Replicability)!
Table!11:!Alternative!model!specification!
Table!12:!List!of!sampled!and!conducted!case!studies!
Table!13:!Impact!on!employment!during!the!implementation!phase!
Table!14:!Low!Impact,!reference,!and!high!impact!scenario!in!post\implementation!phase!
!
!
! !
16
Abbreviations
AB Associated Beneficiary
BIO Biodiversity
CA Climate Action
CAWI Survey Computer-Assisted Web Interviewing Survey
CB Coordinating Beneficiary
EC European Commission
ENV Environment
EU European Union
EU12 EU of 12 member states: BE, DN, ES, FR, GE, GR, IT, LU,
NE, IR, PT, UK
HICP Harmonized Index of Consumer Prices
INF/GI Governance and Information
NAT Nature
NGO Non-Governmental Organization
No. Number
OLS Ordinary Least Squares
R&D Research and Development
TCY LIFE-Third Countries Programme
TMO Technical Monitoring Officer
17
Introduction
The main aim of Part I is to analyse key determinants and their impact on the sustainability and replicability of LIFE financed projects. The sustainability is perceived as the ability to
continue or follow up on the activities performed (outputs achieved) during the project’s life;
i.e. it is the viability of the project after the end of LIFE financing – the continuation or follow-
up is ensured by the beneficiary itself, its partners or successors. Replicability is considered to
be the probability of utilization of the projects´ outputs (best practices, guidelines, know-how,
patents, software etc.) by an entity other than or successor to the beneficiary or its partners,
especially in a competitive market environment.
The evaluation team focused primarily on projects from the Environment type, where there is
a higher potential for replicability via market mechanisms and these concepts are viewed as
crucial for the success of the projects. Therefore, the detailed analysis of LIFE projects is based
on factual data related to a selected subset of 835 projects covering the seven-year period
2009 – 2015 (from 1 January 2009 to 1 January 2016) and corresponding to LIFE+ Programme
and LIFE14/15 calls. Within the frame of the analysis, the impact of selected determinants of
sustainability and replicability was examined through a combination of quantitative and
qualitative methods. For the purposes of the study, the following approaches were employed
to gather, tailor and interpret the data:
► Data mining from LIFETRACK DORY database including text mining
► Approximately 200 individual web surveys among technical monitors on sustainability,
replicability and the level of innovation of LIFE projects
► Econometric modelling
► Cluster analysis with case studies of 12 randomly selected projects
► Consultations with stakeholders (technical monitors of the projects, NEEMO
representatives, local authorities etc.)
► Desk research of external factors affecting LIFE projects
► Development of a scoring model predicting the sustainability and replicability of a
potential LIFE project.
In addition to the above mentioned activities, which were envisaged within the Task 9c, a
statistical analysis of the basic characteristics of the projects co-financed by the LIFE
Programme was conducted, covering 4 262 projects within the 25-year period 1991-2016. The
results of this additional analysis are also presented within this study (Annex 1 of Part I).
Part I of the study is divided into the following four fundamental chapters: ► Chapter 1: Methodology of the study
► Chapter 2: Likelihood of sustainability and replicability of the selected projects
► Chapter 3: Key determinants of sustainability and replicability of the selected projects
► Chapter 4: Cluster analysis
Main findings
The econometric model revealed that there are six main determinants out of more than 100 variables that were examined (factors potentially affecting the sustainability and replicability
of LIFE projects) which are significantly affecting the sustainability and replicability of LIFE
projects. Three of these characteristics were identified as significantly influencing both the
sustainability and replicability of the projects.
18
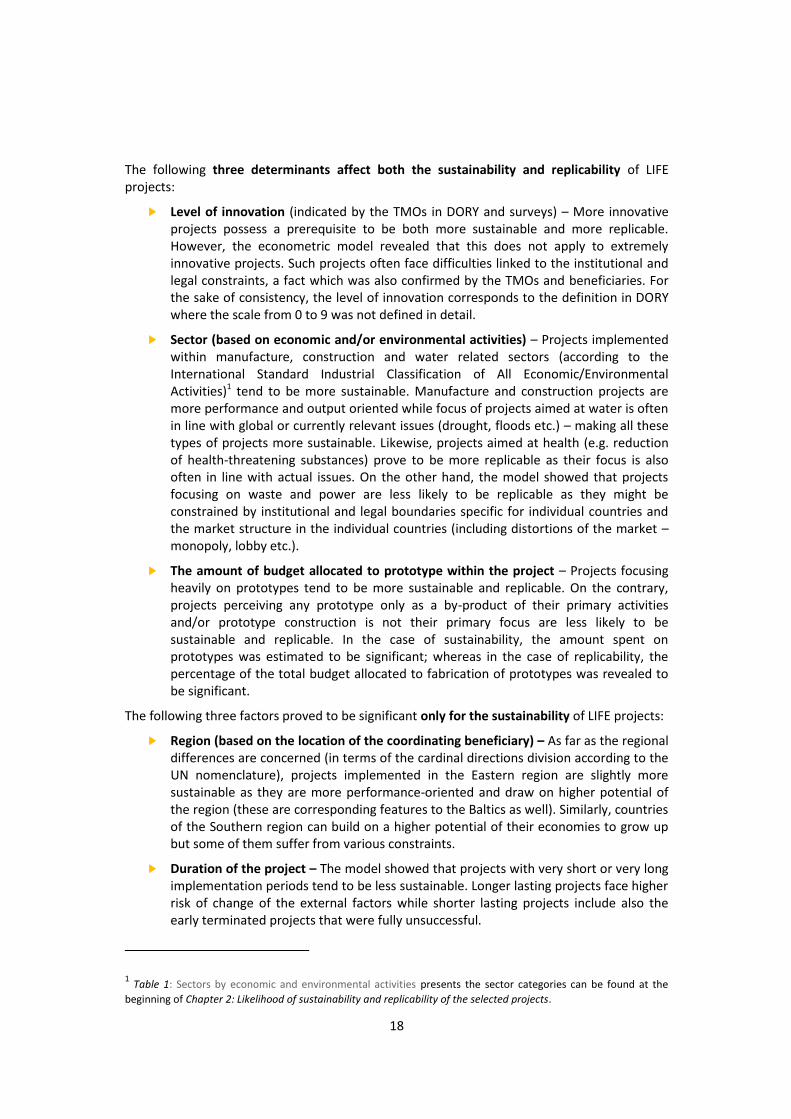
The following three determinants affect both the sustainability and replicability of LIFE
projects:
► Level of innovation (indicated by the TMOs in DORY and surveys) – More innovative
projects possess a prerequisite to be both more sustainable and more replicable.
However, the econometric model revealed that this does not apply to extremely
innovative projects. Such projects often face difficulties linked to the institutional and
legal constraints, a fact which was also confirmed by the TMOs and beneficiaries. For
the sake of consistency, the level of innovation corresponds to the definition in DORY
where the scale from 0 to 9 was not defined in detail.
► Sector (based on economic and/or environmental activities) – Projects implemented
within manufacture, construction and water related sectors (according to the
International Standard Industrial Classification of All Economic/Environmental
Activities)1 tend to be more sustainable. Manufacture and construction projects are
more performance and output oriented while focus of projects aimed at water is often
in line with global or currently relevant issues (drought, floods etc.) – making all these
types of projects more sustainable. Likewise, projects aimed at health (e.g. reduction
of health-threatening substances) prove to be more replicable as their focus is also
often in line with actual issues. On the other hand, the model showed that projects
focusing on waste and power are less likely to be replicable as they might be
constrained by institutional and legal boundaries specific for individual countries and
the market structure in the individual countries (including distortions of the market –
monopoly, lobby etc.).
► The amount of budget allocated to prototype within the project – Projects focusing
heavily on prototypes tend to be more sustainable and replicable. On the contrary,
projects perceiving any prototype only as a by-product of their primary activities
and/or prototype construction is not their primary focus are less likely to be
sustainable and replicable. In the case of sustainability, the amount spent on
prototypes was estimated to be significant; whereas in the case of replicability, the
percentage of the total budget allocated to fabrication of prototypes was revealed to
be significant.
The following three factors proved to be significant only for the sustainability of LIFE projects:
► Region (based on the location of the coordinating beneficiary) – As far as the regional
differences are concerned (in terms of the cardinal directions division according to the
UN nomenclature), projects implemented in the Eastern region are slightly more
sustainable as they are more performance-oriented and draw on higher potential of
the region (these are corresponding features to the Baltics as well). Similarly, countries
of the Southern region can build on a higher potential of their economies to grow up
but some of them suffer from various constraints.
► Duration of the project – The model showed that projects with very short or very long
implementation periods tend to be less sustainable. Longer lasting projects face higher
risk of change of the external factors while shorter lasting projects include also the
early terminated projects that were fully unsuccessful.
1 Table 1: Sectors by economic and environmental activities presents the sector categories can be found at the
beginning of Chapter 2: Likelihood of sustainability and replicability of the selected projects.
19
► Number of associated beneficiaries – A higher number of partners has a significantly
negative impact on sustainability of projects. Based on the qualitative data gathered
within the study, the higher the number of partners the more complex is the
coordination of these partners. Moreover, a higher number of partners increases the
risk of conflict related to the ownership of the project results after the end of the
project. The achieved outputs are also fragmented among the group of partners.
The following three factors proved to be significant only for the replicability of LIFE projects:
► Personnel budget (as % of the total budget) – Projects in which personnel costs are
close to 50% of the overall budget are on average more replicable. However, the
model revealed that projects reliant on the personnel budget either too much or too
little tend to be less replicable.
► Infrastructure budget (as % of the total budget) – Projects with higher relative
infrastructure budgets demonstrate higher level of replicability. Projects with no or
low infrastructure costs might assume a specific infrastructure which is already present
– decreasing their potential for replication as the specific infrastructure might be
absent elsewhere. Furthermore, projects aimed at methodologies and guidelines
which do not need any infrastructure budget are in some reliant on preceding data
collection etc. which makes them less replicable.
Furthermore, although it was not included in the preferred model specification, the
implementation within the Eurozone was estimated as well. The estimation suggests that the
projects implemented within the Eurozone tend to be more replicable.
Based on the econometric model, the evaluation team identified several key characteristics of
a potential LIFE project which can either increase or decrease the probability of sustainability
and replicability of the projects. The key determinants of Sustainability and Replicability of the
projects are summarized in the Table 1.
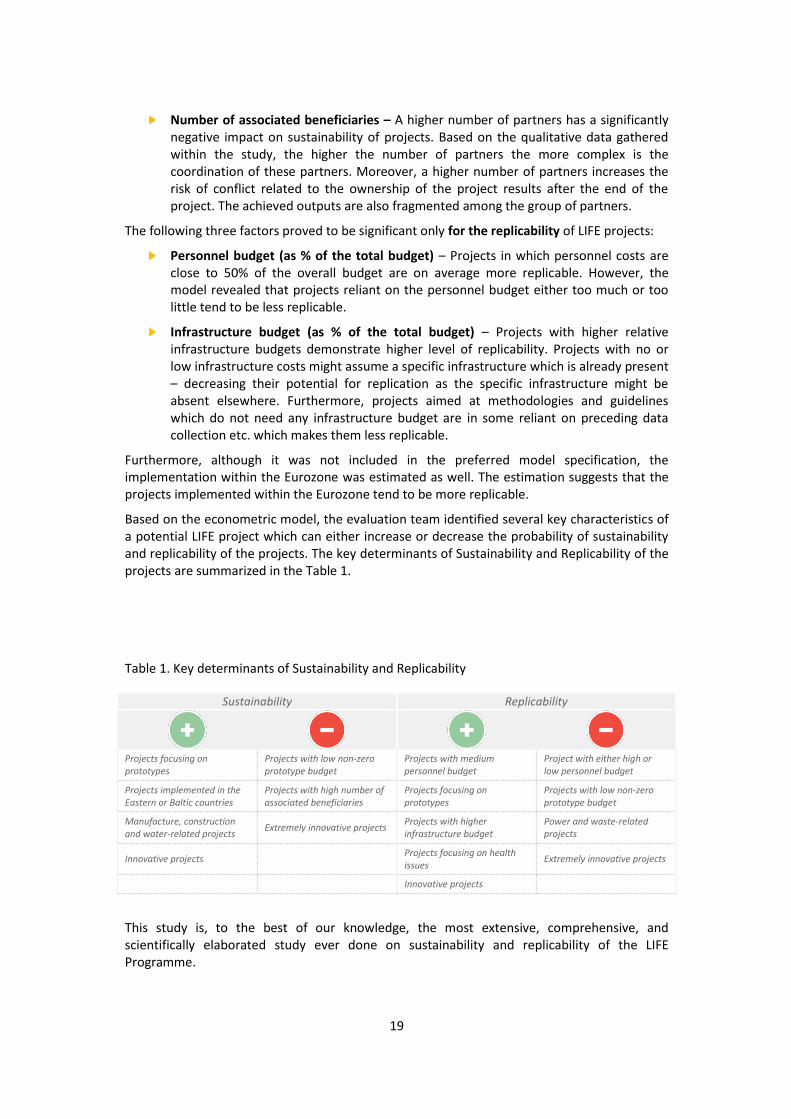
Table 1. Key determinants of Sustainability and Replicability
Sustainability Replicability
Projects focusing on prototypes
Projects with low non-zero prototype budget
Projects with medium personnel budget
Project with either high or low personnel budget
Projects implemented in the Eastern or Baltic countries
Projects with high number of associated beneficiaries
Projects focusing on prototypes
Projects with low non-zero prototype budget
Manufacture, construction and water-related projects
Extremely innovative projects Projects with higher infrastructure budget
Power and waste-related projects
Innovative projects Projects focusing on health issues
Extremely innovative projects
Innovative projects
This study is, to the best of our knowledge, the most extensive, comprehensive, and
scientifically elaborated study ever done on sustainability and replicability of the LIFE
Programme.
20
Chapter 1: Methodology of the study
1.1 Available data
For the purpose of the study, two key sources of information were available:
► Monitoring database of the LIFE Programme – LIFETrack DORY
► Data obtained from the technical monitors of individual projects.
The primary source of information was the monitoring database of LIFE projects – LIFETrack
DORY (further referred to as “DORY”).
1.2 General approach of the study
To focus the scope of the study in accordance with the requirements of the project sponsor we
created individual parts of the main research as follows:
1. Basic characteristics of LIFE projects
2. Likelihood of sustainability and replicability of the selected projects
3. The key determinants of sustainability and replicability of the selected projects
4. Cluster analysis
In order to elaborate the above-stated parts of the main research, a specific study
design/methodology was developed. We employed both quantitative and qualitative methods
and used a wide range of data sources. The study was divided into four main areas:
► Data mining
► Modelling
► Survey analysis
► Interpretation of gathered data.
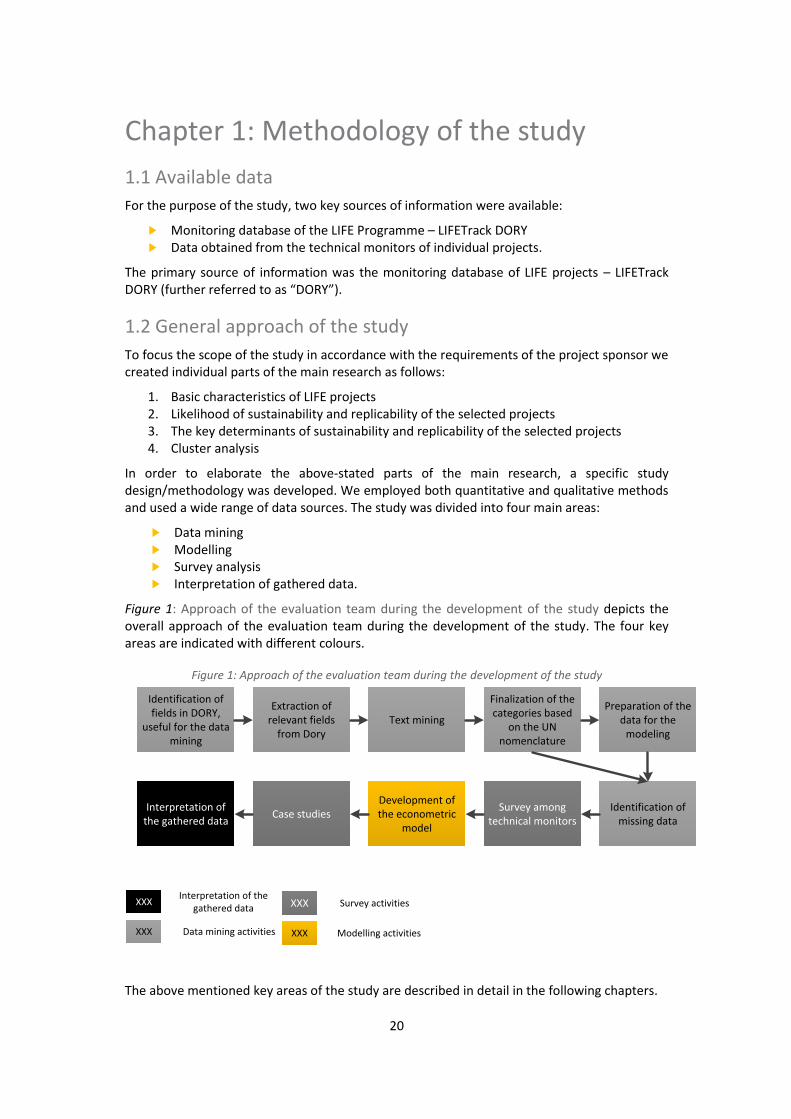
Figure 1: Approach of the evaluation team during the development of the study depicts the
overall approach of the evaluation team during the development of the study. The four key
areas are indicated with different colours.
Figure 1: Approach of the evaluation team during the development of the study
XXX
XXX
XXXData mining activities
Survey activities
Modelling activities
Identification of
fields in DORY,
useful for the data
mining
Extraction of
relevant fields
from Dory
Text mining
Finalization of the
categories based
on the UN
nomenclature
Preparation of the
data for the
modeling
Identification of
missing data
Survey among
technical monitorsCase studies
Interpretation of
the gathered data
XXXInterpretation of the
gathered data
Development of
the econometric
model
The above mentioned key areas of the study are described in detail in the following chapters.
21
1.3 Data mining
The primary goal of data mining was to gather pertinent data on all projects and to select the
most relevant projects for further analysis. Out of the full set of all LIFE projects we selected
those types of projects having an adequate probability of sustainable and replicable outcomes.
After a desk research of the data, (i) majority of Nature projects was assessed to be inherently
not market-oriented and not generating any substantial direct economic values; (ii) projects
beginning before 2008 were excluded as the full set of desired information would not be
accessible due to excessive time distance. The key source of information for the evaluation
purpose was the DORY database. The runtime environment for DORY is completely provided
by IBM Notes – the application provides both front-end user interface for the TMOs and also
the back-end.
DORY is a monitoring tool used by NEEMO to coordinate the monitoring of LIFE projects, assign
workflows and tasks to particular monitors and allow traceability of the whole monitoring
process. It is a database of monitoring reports (mission reports, progress reports, mid-term
reports and final reports) and the collection of project monitoring files. Consequently, it
provides information about the projects, reports and project visits.
The first step in data mining was to identify relevant fields in the DORY database which can
serve as a source of information. A detailed analysis of data stored in DORY was performed
and key fields containing relevant information were determined.
DORY is a IBM Notes application. That means the data in DORY are not stored in a traditional
relational database (like Oracle or MS SQL), which is required for modelling. Therefore, no
direct processing of DORY data was possible and, before the actual modelling, the data had to be extracted from DORY and prepared for modelling. We extracted key information of the
database included in the various reports of the database (mission reports, mid-term reports,
final reports…) and in the project monitoring files.
We identified in DORY three types of data in individual fields:
► Structured data – basic information, i.e. categories, dates, overall project measures
(e.g. budget, duration, beneficiary, total cost).
► Semi-structured data – part of rich text fields and contain further details mainly in a
table format in pre-defined structure (e.g. financial expenditure table).
► Unstructured data – free text in full sentences or without any structure. The texts
entered in these fields have descriptive character and their length & structure is based
only on the author.
The identified structured and semi-structured fields were extracted directly to our SQL
database. We created view for respective fields for projects, reports and missions in Lotus
Domino and through ODBC (Open Database Connectivity) we extracted them to SQL database.
Semi-structured and unstructured data were extracted through a developed Lotus Script. To
prepare the fields for analysis, we needed to correct evident inconsistencies (e.g. inconsistent
using of the decimal delimiter, thousands delimiter, inconsistent categories etc.).
Unstructured data (rich text) were extracted from the Word files, as there was no other
suitable way to extract long texts from IBM Notes. Unstructured data were processed by a set of text mining tools. Text mining is a machine learning discipline that automates the
understanding of text without the necessity of reading it. In mathematical language, a text
mining algorithm is a tool that extracts structured information (e.g. topic discussed within the
text or sentiment of the text – for example negative/neutral/positive assessment) from the
unstructured text. The main goal of text mining activities was to identify the sector/focus of all
projects in the database because we expected the sector to play a significant part in the level
of sustainability / replicability.
22
Firstly, we needed to separate the units of text including desired information from the
surrounding text in the exported MS Word files. For this purpose, we defined unique keywords
delimiting parts of the text, which were of our interest. For example, the text describing the
background of the project always starts with the word “1. Background” and ends with the word “2. Project objectives” (which is the starting text of the next field). These keywords had
to be identified manually. Software SPSS was utilized for parsing (i.e. conducting a syntactic
analysis) from MS Word documents.
The identified units of text including desired information were processed through a text mining
tool in order to identify concepts (keywords). For this purpose, we used Natural language
processing. This process started with tagging parts of speech where nouns, pronouns, verbs
and adjectives were identified (e.g. in sentence “The project is aimed at minimizing the high
water pollution” the tool identifies words “Project, water, pollution” as nouns, “high” as adjective, “aimed” as verb etc. and matches the adjectives to corresponding nouns based on internal logic and internal English dictionary).
Subsequently, the text mining tool (incorporated into the SPSS software) analysed all nouns
and related pronouns, verbs and adjectives and sorted them by their frequencies. As a result, it
created a list of words and word combinations we refer to as “concepts”. Apart from
frequency, the most important criterion we set was the “matching algorithm” used by the SPSS
Text Analytics for extraction. In our case, we set the match in order to select the keywords
independently of their surroundings (match type “no compound”) to maximize the probability
of identification of the topics in the text.
In the next step, the concepts were assigned to categories. A category represents already quite
specific information about the text belonging to one or other area known from real-life (e.g.
whether the project is related to “waste water management” or not). The category is defined either by a simple list of concepts or a rule based on multiple concepts combined with logical
operators. The categories were derived automatically by the SPSS Text mining module using
WordNet semantic network (words organized into synonymous sets, with each representing
one underlying lexical concept). However, the results using the WordNet semantic network
could not have been fully used as final result due to the fact that this semantic network is a
general library and in some cases it does not fit the topic of the LIFE projects. The network
sometimes contained misleading concepts from our perspective (e.g. the concept “resources management” was in category called “universities”). Therefore, further tailoring of the categories was essential. For this reason we manually organized the concepts into categories using the UN nomenclature.
2
Additionally, useful keywords from our projects database were gathered by the team to
enhance the categories and concepts. As a result, we created categories respecting more
precisely the scope of LIFE projects. To validate the results of text mining we employed a
second unsupervised approach in which we enabled the algorithm to create the background
categories clusters based on the word frequencies in background through latent “Dirichlet allocation” (i.e. statistical model for topic mining), which means we developed a model which uses statistical allocation for clustering projects based on the frequencies of words in the
relevant document. Then, we manually identified the sector of the projects in all the clusters
and compared it with the previous text mining method.
2 Available at:
http://unstats.un.org/unsd/cr/registry/regcst.asp?Cl=27&Lg=1 and
http://unstats.un.org/unsd/class/intercop/expertgroup/2011/AC234-29.PDF
23
Through this approach, a set of inputs for the modelling phase was gathered and adapted for
the next steps of the evaluation.
As anticipated, DORY did not contain sufficient data, especially regarding the assessment of
the possible future sustainability and replicability of LIFE projects. We identified missing data
(i.e. the data for which any fields in DORY are not defined, fields in DORY are not filled in, or
fields in DORY are not filled in with an adequate level of reliability) necessary for the modelling
phase and sought different sources of information containing these data. The Butler database
was one source, CAWI (Computer-Assisted Web Interviewing) survey was the other (see
below).
1.4 Survey
As mentioned above, the DORY database did not contain enough relevant information for the
purpose of the modelling phase. The key missing information was an assessment of the level of
sustainability and replicability of the projects. For this purpose, a survey in the form of computer assisted web interview3
was conducted among 107 TMOs, covering 835 projects.
The TMOs evaluated the possibility of further use of projects´ outcomes after the end of LIFE
financing on all assigned projects. The response rate of the survey was 78% and we gathered
information on replicability and sustainability for 764 projects from the selected sample of 835
projects. The TMOs not only classified projects on a four-grade scale (from 1 to 4) but some of
them provided particular reasons/causes of such classification. The survey proved to be an
invaluable source of information as it provided us both with inputs for the modelling phase
and with description of main factors behind sustainability and replicability.
Besides the econometric analysis, the qualitative analysis (Section 3.3 Qualitative analysis) and
cluster analysis (Chapter 4: Cluster analysis) consisting of individual case studies was
conducted based on the information gathered through the survey.
1.5 Econometric analysis and modelling
Detailed econometric analysis was conducted in order to assess (i) the sustainability and (ii)
the replicability of LIFE projects. Output of the analysis further leads to evaluation of the
probability that a given project falls into a particular sustainability/replicability category. For
this purpose, two econometric models were developed – one regressing the level of
sustainability on selected explanatory variables and one regressing the level of replicability on
selected explanatory variables.
The econometric analysis examines statistical relationships among different variables of the
data series. It quantifies an explanatory power of the explanatory variables.4 In our case,
sustainability (or replicability in the second case) of the projects is the dependent variable
while the explanatory variables consist of its possible determinants (such as economic activity,
environmental activity, scope, region etc.). Results of the analysis are further tested for
statistical significance. If the coefficients obtained are statistically significant, they are
interpreted (after a transformation) as impact of the explanatory variables on the probability
of reaching a particular sustainability/replicability level. For example, a higher level of
innovation suggests a higher level of sustainability while higher number of associated
beneficiaries suggests a lower level of sustainability.
3 https://emeia2.ey-vx.com/survey/TakeSurvey.asp?EID=52MB69ML8B8LJB864lll6B029B0p6L1B64K
4 In particular, an econometric analysis quantifies a magnitude of explanation of variation in the dependent variable
by variation in the explanatory variables.
24
Data employed for the econometric analysis were collected from the DORY database and from
the TMOs via a questionnaire. Data from DORY consist of both structured and unstructured
data. We assessed correctness and completeness of the structured data; we especially
controlled for outliers present among the structured data.5 As explained above, robust text
mining was employed to obtain the unstructured data6 – the procedure was key for
categorization of the projects (based on the type of (i) economic and (ii) environmental
activity).7
The model employed is a discrete ordinal dependent variable model. In particular, we ran an
Ordered Probit non-linear regression. The selected type of model is the same for both
sustainability and replicability analysis (i.e. the following applies to both cases). The model
employed best fits the character of the dependent variables. Both dependent variables are so
called ordinal variables. An ordinal variable is a variable that is categorical and ordered. This is
the case of our dependent variables as they are the categorical variables8 taking value from 1
to 4 where 1 is the lowest value assigned and 4 is the highest. Therefore, the dependent
variables are non-negative, discrete and ordinal. Ordered Probit provides a transformation to
ensure that the fitted values of the model lie within the range of observed values of the
dependent variable.
The core methodology employs an Ordered Probit model with explanatory variables
comprising project key characteristics. The boundary values between each sustainability (or
replicability) score are then estimated along with the model parameters:
Yi* = Xiβ + εi with: Yi = 1 if Yi
* <= κ1,
Yi = 2 if κ1 < Yi* <= κ2,
Yi = 3 if κ2 < Yi* <= κ3,
Yi = 4 if Yi* > κ3,
where: Yi are the observed sustainability/replicability scores (from 1 to 4),
Yi* is the unobservable true sustainability/replicability score,
Xi is a vector of variables explaining the variation in
sustainability/replicability scores,
β is a vector of coefficients,
κi are the threshold parameters (cutpoints) to be estimated,
κ0 is taken as -∞, and κI is taken as +∞, εi is a disturbance term, which is assumed to be normally distributed.
No intercept9 appears in the parameterization as the effect is absorbed into the cutpoints. The
coefficients and cutpoints are estimated using maximum likelihood estimation. Through a
specification of the model, we also allow for observations to be independent across the
regional clusters but not necessarily independent within those clusters. In other words, we
take into account the possibility of certain systemic patterns within the clusters, which are
based on the projects´ region of implementation.
5 Outliers are data taking extreme or unusual values.
6 For more information on the method used, please see Section 1.3 Data mining
7 UN Economic and Environmental Activities Nomenclature were used for the categorization of the projects.
8 They consist of categories such as: project is fully replicable, project is hardly sustainable, etc.
9 Intercept is a constant which corresponds to the expected mean value of Y (the dependent variable) when all X=0
(the explanatory variables are equal to zero).
25
The coefficients obtained show the sign and the statistical significance of the impact of the
project characteristics on the probability that a project reaches a certain
sustainability/replicability level. Nevertheless, the coefficients cannot be interpreted directly,
as for example elasticities or marginal effects. However, the coefficients can be
mathematically transformed in order to estimate how the probability of a project reaching a
given sustainability/replicability level varies when value of the observed explanatory variable is
varying (the one corresponding to the particular coefficient) ceteris paribus (i.e. keeping all the
remaining explanatory variables constant).
In Ordered Probit Model, an underlying score is estimated as a linear function of the
explanatory variables and a set of cutpoints. The estimated cutpoints tell us how to interpret
the score. The probability of observing outcome i corresponds to the probability that the
estimated linear function, plus random error (uj), is within the range of the cutpoints
estimated for the outcome:
Pr(outcomej = i) = Pr(κi-1 < β1x1j + β2x2j + . . . + βkxkj + uj <= κi) = Φ(κi - Xjβ) - Φ(κi-1 - Xjβ),
where Φ(.) is the standard normal cumulative distribution function, uj is assumed to be
normally distributed, β1, β2, . . . , βk are the estimated coefficients, κ1, κ2, . . . , κI-1 are the
estimated cutpoints (where I is the number of possible outcomes), κ0 is taken as -∞, and κI is
taken as +∞.
Through this, it is possible to estimate the probabilities of each event. If we estimate the
probabilities without specifying the values of all variables, we can for example get probabilities
for each category (the level of sustainability / replicability) when all independent values are set
to their mean values. However, it is possible to estimate probabilities for an entirely particular
profile as well.
The decision on relevance of the possible explanatory variables is made on the basis of both
manual and automated stepwise regression and economic reasoning. The automated
backward stepwise regression follows the logic: (i) fit the full model on all explanatory
variables which are taken into account, (ii) while the least-significant term is insignificant
(based on a significance level set beforehand), remove it and re-estimate the reduced model.
This procedure is complemented with a manual (both forward and backward) stepwise
regression in order to preserve robustness of the model and to incorporate the economic
reasoning. Thus, omitted-variable bias are avoided.
The preferred model specifications are further assessed by an auxiliary goodness of fit
measure. As any standardized measure of the goodness of fit of a model (such as the
coefficient of determination, its modifications or similar indicators) is not available for the
Ordered Probit modelling, the percentage of correct predictions is employed as the main
appraisal of the model’s precision. We also employ various robustness checks to ensure that
the model results are correct and reliable. The robustness checks should confirm the
estimated coefficients’ signs and the statistical significance.
Besides an obligatory variation of the explanatory variables’ list (via both manual and
automated stepwise regression) and a basic Ordinary Least Squares (OLS) estimation as a
benchmark, we employed the Ordered Logit Model and the Poisson Regression as well.
The Ordered Logit model works principally in the same way as the Ordered Probit10 with the
exception of assuming the standard logistic distribution instead of the standard normal
10
Both approaches provide a transformation to ensure that fitted values of the model lie within the range of values
of the dependent variable. “For the majority of the applications, the logit and probit models will give very similar characterisations of the data because the densities are very similar [...] That is, the fitted regression plots will be
26
distribution. The standard normal distribution is a default distribution assumed in economics,
so the Ordered Probit model is of our primary interest.11
Furthermore, we employed the
Poisson Regression, which assumes a non-negative Poisson distribution and the cardinal data.
Based on the character of the gathered data, at first we interpreted the results of the
econometric model and then we used the information from qualitative research for validation
of the results from the econometric model.
1.6 Cluster analysis
Cluster analysis, consisting of individual case studies conducted after the CAWI survey, served
as another source of qualitative information validating the results obtained from the
econometric analysis. In order to select appropriate projects, the cluster analysis was
employed to create groups of projects with similar characteristics, and subsequently, 20
projects were randomly sampled out of these clusters.
Clusters were primarily distinguished by different project categories (UN classification of
economic activities and environmental activities) and further classified by the EC contribution
scope (four clusters in EUR 500 000 intervals).12
We took into account other categories which
could possibly enter the clustering process such as regions, duration, indication whether the
beneficiary is inexperienced etc. Nevertheless, any other classification splits the clusters into
insufficiently small groups. Moreover, some of them (such as the regional clusters which are
composed primarily by South cluster) are not meaningfully distributed. As the project
categorization (in term of economic and environmental activities) and the EC contribution
scope are of our primary interest, we employed the clustering based on these two
characteristics.
Based on the above mentioned, we first obtained 16 basic clusters according to the
classification of economic and environmental activities (further referred to as “sector clusters”). In the case of 14 of them, it was not reasonable to further select a sample for each
EC contribution cluster. Therefore, we employed only the EC contribution clusters, which
covered a majority of the projects’ distribution among the individual selected sector cluster.
For example, if the sector cluster composed by projects relevant for the Transport and storage
economic activities and the Protection of air and climate activities can be further split into the
EC contribution clusters containing the following number of projects: 3, 13, 3 and 5, we
randomly sampled one project out of the 13 projects relevant for the sector cluster and From EUR 500 000 to 1 000 000 EC contribution cluster as it covers a huge portion of this sector
cluster (13 out of 24).
In the case of the Wastewater management and Waste management sectors, we split the
sector clusters further by the EC contribution classification as these two sector clusters
contained a sufficiently huge amount of projects. We sampled out of two additional EC
contribution clusters within the Wastewater management cluster and out of four additional EC
contribution clusters within the Waste management cluster.
virtually indistinguishable, and the implied relationships between the explanatory variables and […] will also be very similar.” (Brooks 2013)
11 Stock and Watson (2006) suggest that the logistic approach was traditionally preferred since the function does
not require the evaluation of an integral and thus the model parameters could be estimated faster. “However, this argument is no longer relevant given the computational speeds now achievable and the choice of one specification rather than the other is now usually arbitrary.” (Brooks 2013)
12 EUR 0 to 500 000; EUR 500 000 to 1 000 000; EUR 1 000 000 to 1 500 000; and above EUR 1 500 000.

27
In conclusion, we drew up 20 clusters (14 + 2 + 4) representing all of the main groups of
projects within the LIFE Programme. Out of these 20 clusters, we randomly sampled one
project for each cluster as a case study. For the purpose of case studies, we used semi-
structured interviews with individual beneficiaries (see Chapter 4: Cluster analysis). The goal of
the case studies was to gather information on factors, which (from the beneficiary´s point of
view) impact the sustainability and replicability and to identify the best practise and lessons
learned.
Due to various reasons causing some of the projects to be unavailable for the case studies, the
final number of conducted case studies dropped to 12. Some of the projects are already
terminated without any relevant contact person left.
28
Chapter 2: Likelihood of sustainability and
replicability of the selected projects
The goal of the second part of the main research presented in Chapter 2: Likelihood of
sustainability and replicability of the selected projects is to analyse the statistical distribution
of projects in the selected sample of 835 projects according to the assessment of
sustainability and replicability performed by the TMOs.
The chapter builds directly on the data gathered via questionnaires filled in by the TMOs and
data collected through text mining from the DORY database. It summarizes the actual level of
sustainability and replicability of LIFE projects according to the TMOs answers. As a result, an
extensive mapping of LIFE projects’ sustainability and replicability since 2009 to 2016 is
presented. In total, 835 projects were identified as relevant for the analysis while 764 of them
were effectively examinable as a full set of relevant data was gathered.
The selected sample of 835 projects consists of the types of projects having an adequate
probability of sustainable and replicable outcomes. (The focus here are of course ENV projects,
for which sustainability and replicability is evaluated through market mechanisms; for NAT
projects, see Part III of this Study). After carrying out the desk research, (i) majority of Nature
projects was assessed to be inherently not market-oriented and not generating any substantial
direct economic values; (ii) projects beginning before 2008 were excluded as the full set of
required information would not be accessible due to excessive time distance.
The following categories of Sustainability and Replicability have been defined (for a more
detailed analysis, see Chapter 3, Tables 5 and 6):
Categories of Sustainability:
1: Project is not sustainable
2: Project is hardly sustainable
3: Project is likely to be sustainable
4: Project is highly/fully sustainable
Categories of Replicability:
1: Project is not replicable
2: Project is hardly replicable
3: Project is likely to be replicable
4: Project is highly/fully replicable
The assessment of likelihood of sustainability and replicability presented in this chapter is only
based on the statistical relationships. The actual key determinants of the level of sustainability
and replicability observed are investigated in detail in Chapter 3: The key determinants of sustainability and replicability of the selected projects.
In the second part of the main research, the LIFE projects are analysed from the following
perspectives:
► Selected 835 projects – detailed statistical data on selected LIFE projects with
potential of creating jobs and economic growth after the end of LIFE financing. The
parameters used for the statistical analysis are:
► Sustainability and replicability of the project
► Country/region of the project beneficiary
► Budget/EC contribution
29
► Duration of the project
► Number of partners
► Start time of the project
► Sector of the project
► Country of partners
► Level of innovation.
The statistical analysis is performed mainly on the data from the DORY database. The
additional source of information is the Butler database and results of the CAWI survey.
Findings
About 17% of the projects in the sample are classified as fully sustainable. Conversely, about 10% of the projects are evaluated as not sustainable at all. The rest of the projects (73%) are
either conditionally sustainable or sustainable to a limited extent.
As expected, the least sustainable projects gain by far the highest average EC contribution in
comparison to the remaining (positive) classes of sustainability. On average, the projects
classified as not sustainable at all get about EUR 1.5 million, whereas the average EC
contribution of all other sustainability classes is close to EUR 1 mil.
On the other hand, there is virtually no difference in the average duration of the projects
among the different classes of sustainability.
Projects implemented in the Western region are to the largest extent (almost 80% of them)
classified decisively (i.e. classified as either fully sustainable or not sustainable at all). Projects
implemented in the Eastern region are the least evaluated as unsustainable (only about 17% of
them are not sustainable or hardly sustainable).
About 17% of the projects in the sample are evaluated as fully replicable while 7% of them fail to demonstrate any level of replicability. Additionally, the remaining 76% of the projects
are either conditionally replicable or replicable to a limited extent.
Curiously enough, it seems that on average the less replicable a project in the sample, the
higher is the EC contribution it gets. Projects classified as not sustainable at all gain the
average EC contribution of about EUR 1.3 million whereas the likely replicable projects and
fully replicable projects gain about EUR 0.95 million and EUR 1.05 million of the average EC
contribution, respectively. This finding might be explained by the project’s size, that is: the higher the contribution, the more expensive is the projects, thus the more difficult will be to
gather the money for replication without LIFE finance.
Projects which are classified as not replicable at all last on average up to six months less than
the others (the average duration of the not replicable projects is 3.5 years), which should be
related to the early termination of unsuccessful projects.
With regard to the correlation between sustainability and replicability, it surprisingly turns out
that the level of replication is a prerequisite for the level of sustainability rather than vice
versa. However, it is crucial to keep in mind that the assessment of likelihood of sustainability
and replicability is based on mere statistical relationships. A detailed investigation of actual
determinants of the level of sustainability and replicability is presented in Chapter 3: The key determinants of sustainability and replicability of the selected projects. In any case, this means
that projects which are not sustainable might still be replicable – including cases where a
project is sustainable in theory but financially unsustainable due to external factors specific for
the project in question (in other words, the same project replicated in more suitable
conditions might be effectively sustainable elsewhere).
30
As far as the regional categorization is concerned, the level of replicability follows the same
pattern as the level of sustainability. Likewise, projects implemented in the Western region are
to the largest extent (38%) classified decisively (either fully replicable or not replicable at all)
whilst projects implemented in the Eastern region are the least unsustainable (less than 20% of
them). All countries that joined the EU after 2004 exhibit a substantially higher level of
replicability.
Generally speaking, the EC contribution allocation corresponds to the distribution of projects
among individual sectors.
(i) Two leading sectors with respect to economic activities, Water supply, sewerage, waste management and Agriculture, forestry and fishing, account for almost a half
(49%) of all projects. Similarly, about 47% of the total EC contribution is allocated to
these two sectors. Five sixths (83%) of the total EC contribution is then allocated only
to five sectors.
(ii) Likewise, about 46% of all projects are classified as part of two leading sectors with
respect to environmental activities – these are Waste Management and Protection of Air & Climate. Correspondingly, the aggregate EC contribution allocated to these
sectors accounts for 45% of the total EC contribution. In comparison to sectors with
respect to economic activities, allocation of the EC contribution is distributed more
equally among the sectors with respect to environmental activities.
Nevertheless, there are evident differences when focusing on the average EC contribution
allocation among individual sectors.
(iii) Sectors of Power (Electricity, gas, steam and air conditioning supply), Science
(Professional, scientific and technical activities) and Information (Information and communication) gain the highest average EC contribution while the sector of Arts, entertainment and recreation has significantly lower average EC contribution than
any other sector with respect to economic activities.
(iv) As far as environmental activities are concerned, Management of Natural Forest Resources gain the highest average EC contribution with a significant margin ahead of
the following sectors of Management of fossil energy, Use of fossil energy, Use of wild flora and fauna and Use of natural forest resources. The remaining sectors with
respect to environmental activities receive quite similar average EC contributions.
Detailed statistics depicted below in this chapter consist of various combinations of variables,
such as the level of both sustainability and replicability, financial indicators (total and average
EC contribution), regional classification and sector categorization (based on both economic
and environmental activities). Additional figures describing the structure of the sample in
detail are presented in Annex 1.
In general, the figures refer to the selected sample of LIFE projects covering the period from
2008 to 2016 (which accounts for 835 projects in total) accessible in the DORY as of February
9, 2016.
Sector categorization corresponds to the UN nomenclature of (i) economic and (ii)
environmental activities. A list of abbreviated names of the sectors (referred to in the text) is
depicted in Table 1: Sectors by economic and environmental activities.
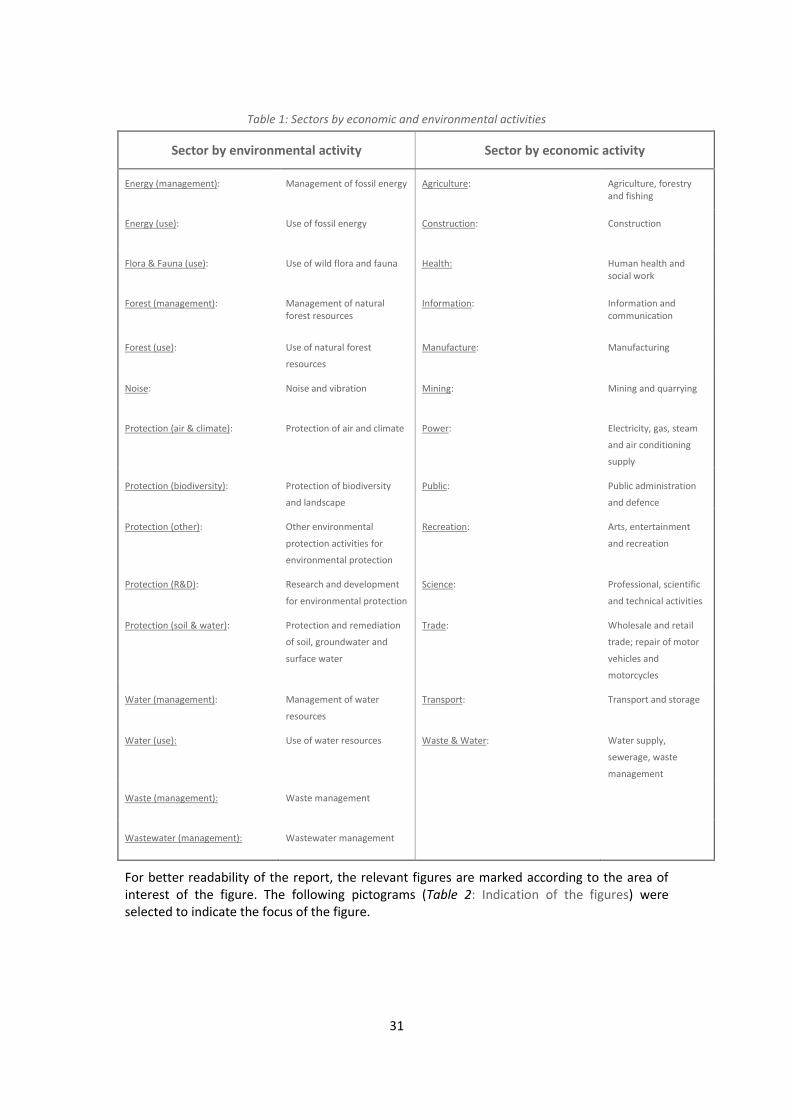
31
Table 1: Sectors by economic and environmental activities
Sector by environmental activity Sector by economic activity
Energy (management): Management of fossil energy Agriculture: Agriculture, forestry
and fishing
Energy (use): Use of fossil energy Construction: Construction
Flora & Fauna (use): Use of wild flora and fauna Health: Human health and
social work
Forest (management): Management of natural
forest resources
Information: Information and
communication
Forest (use): Use of natural forest
resources
Manufacture: Manufacturing
Noise: Noise and vibration Mining: Mining and quarrying
Protection (air & climate): Protection of air and climate Power: Electricity, gas, steam
and air conditioning
supply
Protection (biodiversity): Protection of biodiversity
and landscape
Public: Public administration
and defence
Protection (other): Other environmental
protection activities for
environmental protection
Recreation: Arts, entertainment
and recreation
Protection (R&D): Research and development
for environmental protection
Science: Professional, scientific
and technical activities
Protection (soil & water): Protection and remediation
of soil, groundwater and
surface water
Trade: Wholesale and retail
trade; repair of motor
vehicles and
motorcycles
Water (management): Management of water
resources
Transport: Transport and storage
Water (use): Use of water resources Waste & Water: Water supply,
sewerage, waste
management
Waste (management): Waste management
Wastewater (management): Wastewater management
For better readability of the report, the relevant figures are marked according to the area of
interest of the figure. The following pictograms (Table 2: Indication of the figures) were
selected to indicate the focus of the figure.
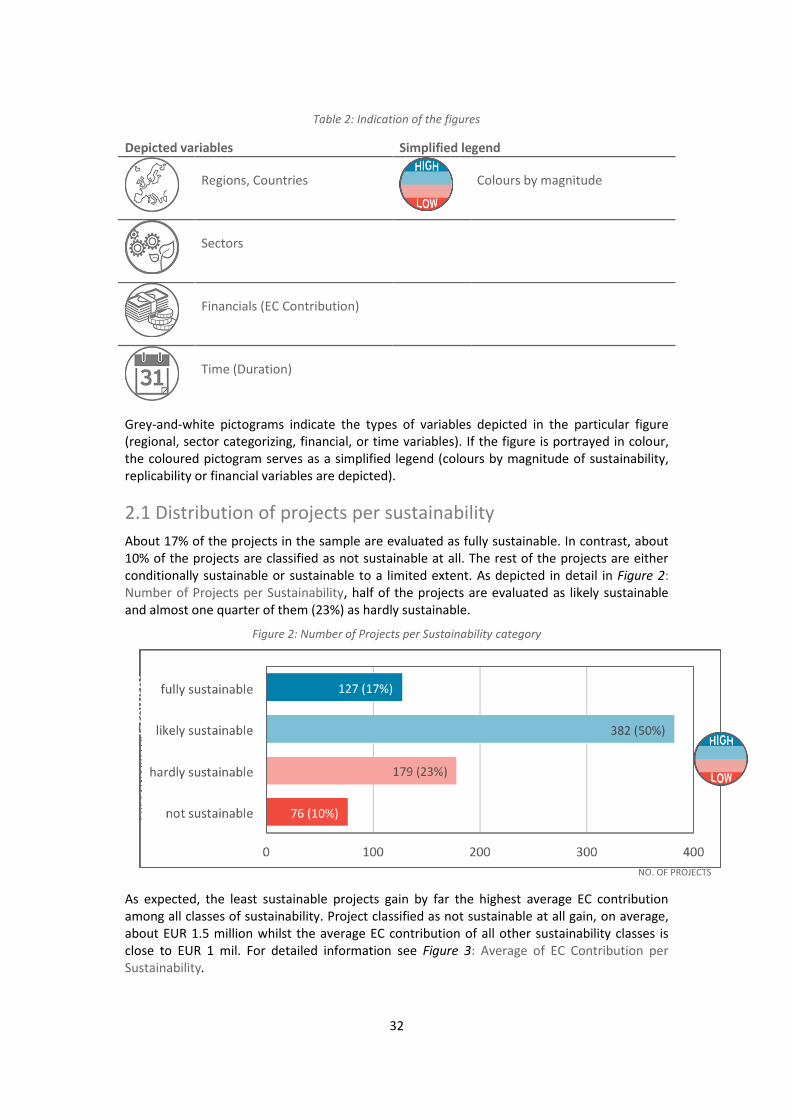
32
Table 2: Indication of the figures
Depicted variables Simplified legend
Regions, Countries
Colours by magnitude
Sectors
Financials (EC Contribution)
Time (Duration)
Grey-and-white pictograms indicate the types of variables depicted in the particular figure
(regional, sector categorizing, financial, or time variables). If the figure is portrayed in colour,
the coloured pictogram serves as a simplified legend (colours by magnitude of sustainability,
replicability or financial variables are depicted).
2.1 Distribution of projects per sustainability
About 17% of the projects in the sample are evaluated as fully sustainable. In contrast, about
10% of the projects are classified as not sustainable at all. The rest of the projects are either
conditionally sustainable or sustainable to a limited extent. As depicted in detail in Figure 2:
Number of Projects per Sustainability, half of the projects are evaluated as likely sustainable
and almost one quarter of them (23%) as hardly sustainable.
Figure 2: Number of Projects per Sustainability category
As expected, the least sustainable projects gain by far the highest average EC contribution
among all classes of sustainability. Project classified as not sustainable at all gain, on average,
about EUR 1.5 million whilst the average EC contribution of all other sustainability classes is
close to EUR 1 mil. For detailed information see Figure 3: Average of EC Contribution per
Sustainability.
SU
ST
AIN
AB
ILIT
YG
row
th:
Imp
lem
en
tati
on
: €
2,1
bn
Re
pli
cati
on
:
€
9,3
bn
Tota
l:
€
11
,4 b
n
NO. OF PROJECTS
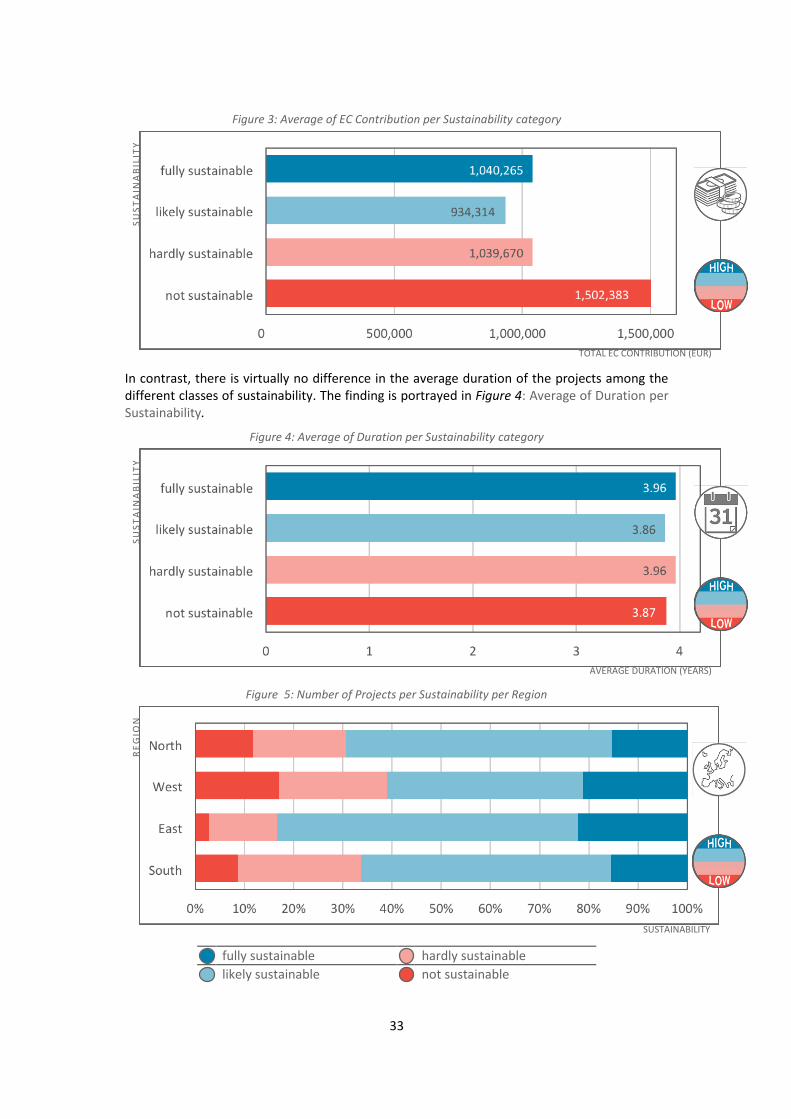
33
Figure 3: Average of EC Contribution per Sustainability category
In contrast, there is virtually no difference in the average duration of the projects among the
different classes of sustainability. The finding is portrayed in Figure 4: Average of Duration per
Sustainability.
Figure 4: Average of Duration per Sustainability category
Figure 5: Number of Projects per Sustainability per Region
fully sustainable hardly sustainable
likely sustainable not sustainable
RE
GIO
N
SUSTAINABILITY
SU
ST
AIN
AB
ILIT
Y
AVERAGE DURATION (YEARS)
TOTAL EC CONTRIBUTION (EUR)
SU
ST
AIN
AB
ILIT
Y
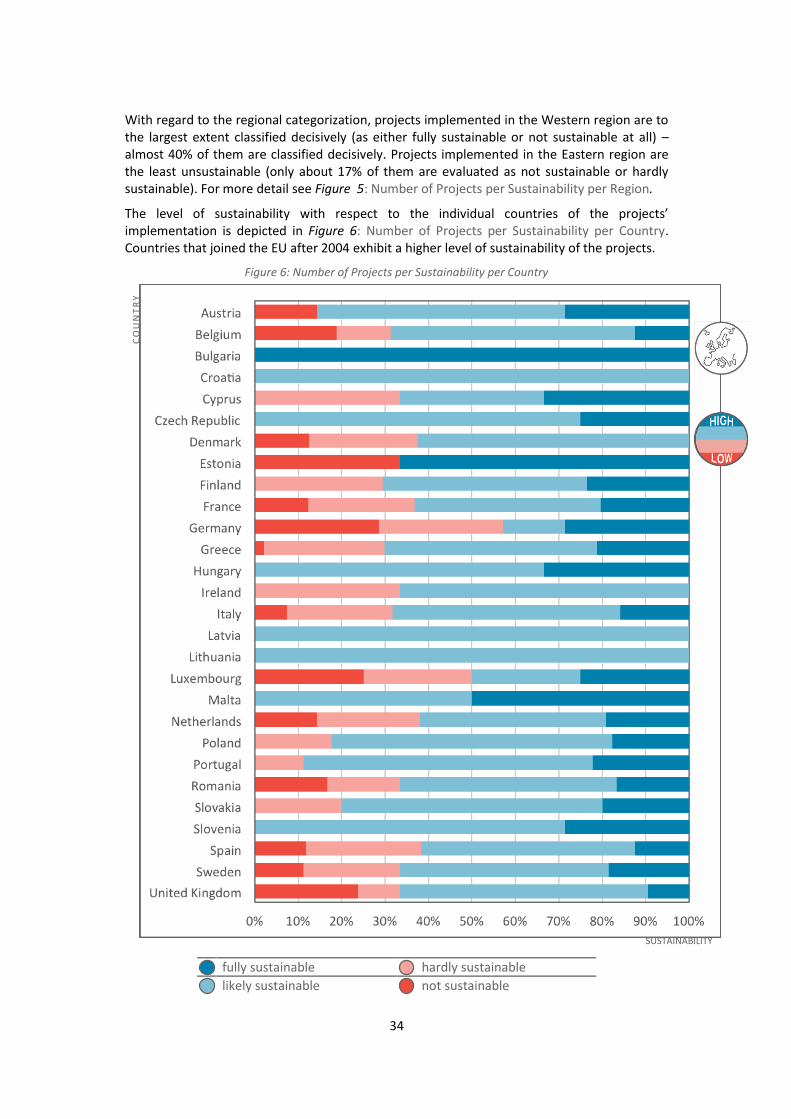
34
With regard to the regional categorization, projects implemented in the Western region are to
the largest extent classified decisively (as either fully sustainable or not sustainable at all) –
almost 40% of them are classified decisively. Projects implemented in the Eastern region are
the least unsustainable (only about 17% of them are evaluated as not sustainable or hardly
sustainable). For more detail see Figure 5: Number of Projects per Sustainability per Region.
The level of sustainability with respect to the individual countries of the projects’ implementation is depicted in Figure 6: Number of Projects per Sustainability per Country.
Countries that joined the EU after 2004 exhibit a higher level of sustainability of the projects.
Figure 6: Number of Projects per Sustainability per Country
fully sustainable hardly sustainable
likely sustainable not sustainable
CO
UN
TR
Y
SUSTAINABILITY
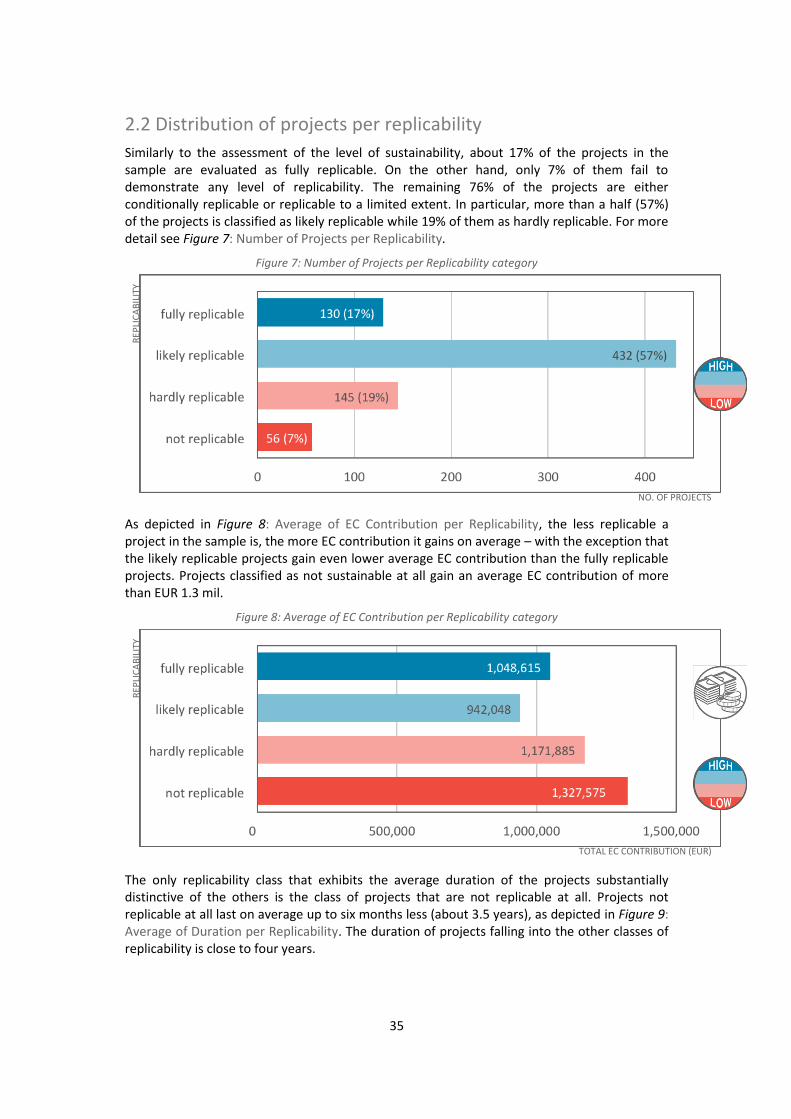
35
2.2 Distribution of projects per replicability
Similarly to the assessment of the level of sustainability, about 17% of the projects in the
sample are evaluated as fully replicable. On the other hand, only 7% of them fail to
demonstrate any level of replicability. The remaining 76% of the projects are either
conditionally replicable or replicable to a limited extent. In particular, more than a half (57%)
of the projects is classified as likely replicable while 19% of them as hardly replicable. For more
detail see Figure 7: Number of Projects per Replicability.
Figure 7: Number of Projects per Replicability category
As depicted in Figure 8: Average of EC Contribution per Replicability, the less replicable a
project in the sample is, the more EC contribution it gains on average – with the exception that
the likely replicable projects gain even lower average EC contribution than the fully replicable
projects. Projects classified as not sustainable at all gain an average EC contribution of more
than EUR 1.3 mil.
Figure 8: Average of EC Contribution per Replicability category
The only replicability class that exhibits the average duration of the projects substantially
distinctive of the others is the class of projects that are not replicable at all. Projects not
replicable at all last on average up to six months less (about 3.5 years), as depicted in Figure 9:
Average of Duration per Replicability. The duration of projects falling into the other classes of
replicability is close to four years.
TOTAL EC CONTRIBUTION (EUR)
RE
PLI
CA
BIL
ITY
RE
PLI
CA
BIL
ITY
NO. OF PROJECTS
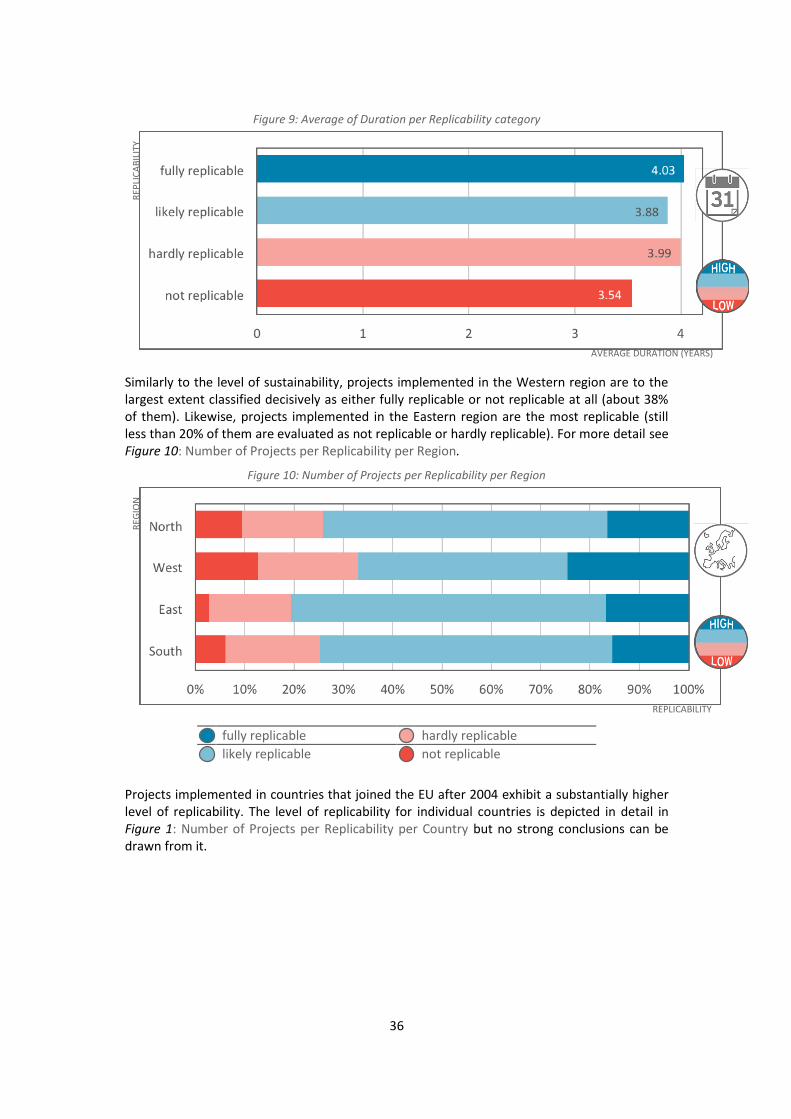
36
Figure 9: Average of Duration per Replicability category
Similarly to the level of sustainability, projects implemented in the Western region are to the
largest extent classified decisively as either fully replicable or not replicable at all (about 38%
of them). Likewise, projects implemented in the Eastern region are the most replicable (still
less than 20% of them are evaluated as not replicable or hardly replicable). For more detail see
Figure 10: Number of Projects per Replicability per Region.
Figure 10: Number of Projects per Replicability per Region
fully replicable hardly replicable
likely replicable not replicable
Projects implemented in countries that joined the EU after 2004 exhibit a substantially higher
level of replicability. The level of replicability for individual countries is depicted in detail in
Figure 1: Number of Projects per Replicability per Country but no strong conclusions can be
drawn from it.
RE
GIO
N
REPLICABILITY
RE
PLI
CA
BIL
ITY
AVERAGE DURATION (YEARS)
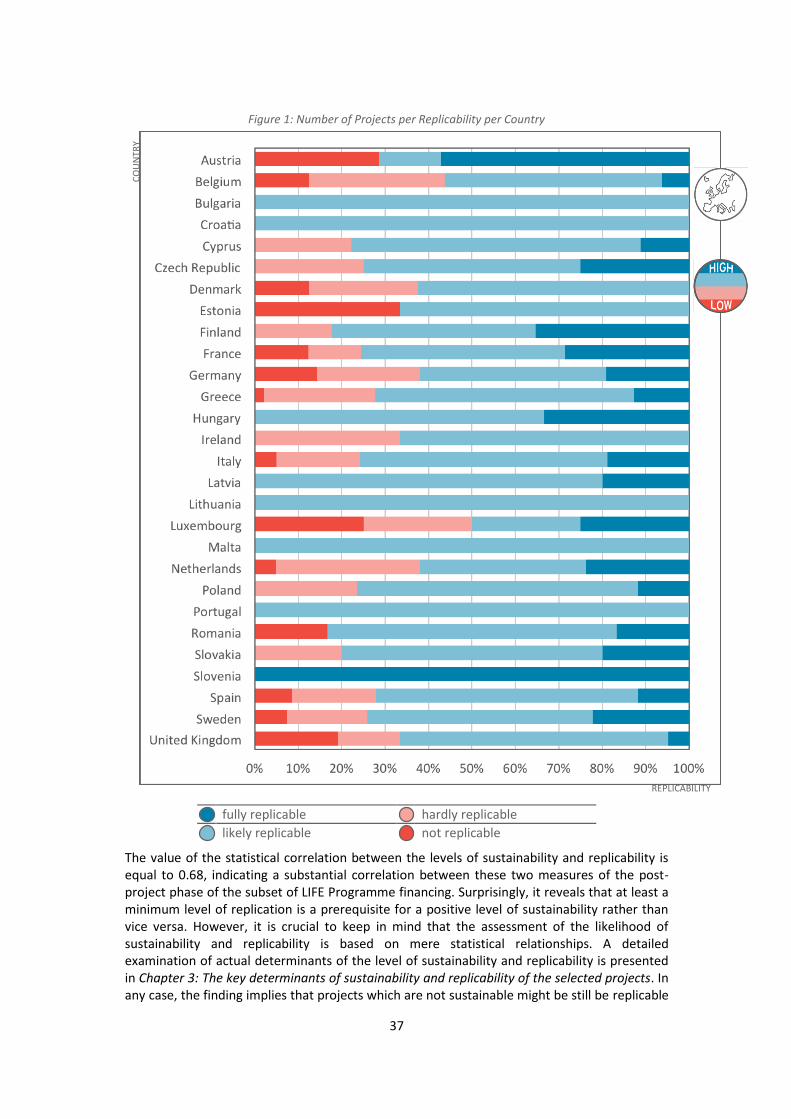
37
Figure 1: Number of Projects per Replicability per Country
fully replicable hardly replicable
likely replicable not replicable
The value of the statistical correlation between the levels of sustainability and replicability is
equal to 0.68, indicating a substantial correlation between these two measures of the post-
project phase of the subset of LIFE Programme financing. Surprisingly, it reveals that at least a
minimum level of replication is a prerequisite for a positive level of sustainability rather than
vice versa. However, it is crucial to keep in mind that the assessment of the likelihood of
sustainability and replicability is based on mere statistical relationships. A detailed
examination of actual determinants of the level of sustainability and replicability is presented
in Chapter 3: The key determinants of sustainability and replicability of the selected projects. In
any case, the finding implies that projects which are not sustainable might be still be replicable
CO
UN
TR
Y
REPLICABILITY
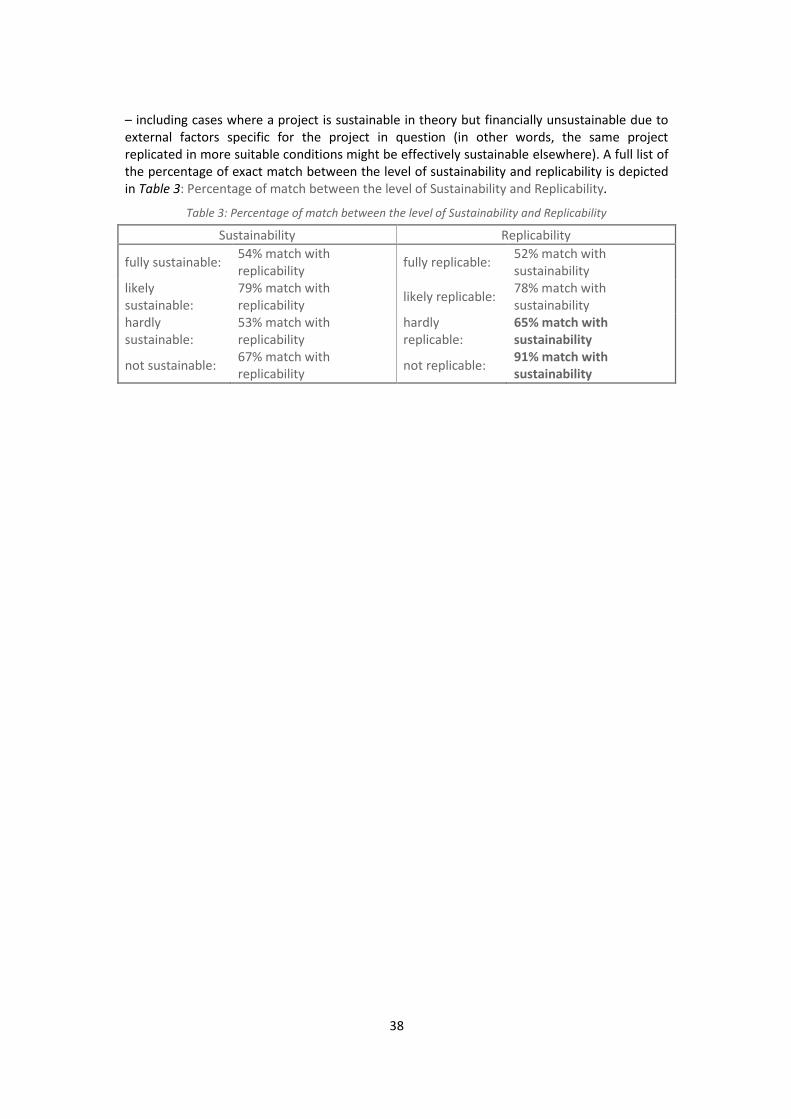
38
– including cases where a project is sustainable in theory but financially unsustainable due to
external factors specific for the project in question (in other words, the same project
replicated in more suitable conditions might be effectively sustainable elsewhere). A full list of
the percentage of exact match between the level of sustainability and replicability is depicted
in Table 3: Percentage of match between the level of Sustainability and Replicability.
Table 3: Percentage of match between the level of Sustainability and Replicability
Sustainability Replicability
fully sustainable: 54% match with
replicability fully replicable:
52% match with
sustainability likely
sustainable:
79% match with
replicability likely replicable:
78% match with
sustainability hardly
sustainable:
53% match with
replicability
hardly
replicable:
65% match with sustainability
not sustainable: 67% match with
replicability not replicable:
91% match with sustainability
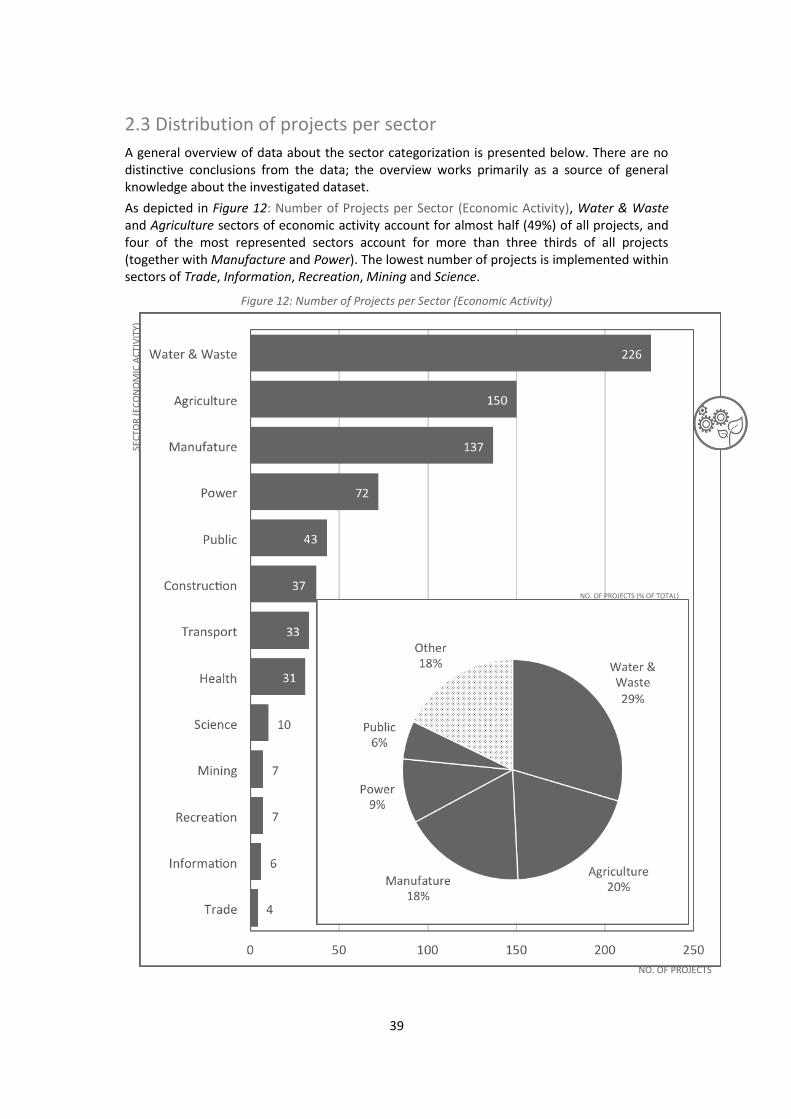
39
2.3 Distribution of projects per sector
A general overview of data about the sector categorization is presented below. There are no
distinctive conclusions from the data; the overview works primarily as a source of general
knowledge about the investigated dataset.
As depicted in Figure 12: Number of Projects per Sector (Economic Activity), Water & Waste
and Agriculture sectors of economic activity account for almost half (49%) of all projects, and
four of the most represented sectors account for more than three thirds of all projects
(together with Manufacture and Power). The lowest number of projects is implemented within
sectors of Trade, Information, Recreation, Mining and Science.
Figure 12: Number of Projects per Sector (Economic Activity)
SE
CT
OR
(E
CO
NO
MIC
AC
TIV
ITY
)
NO. OF PROJECTS (% OF TOTAL)
NO. OF PROJECTS
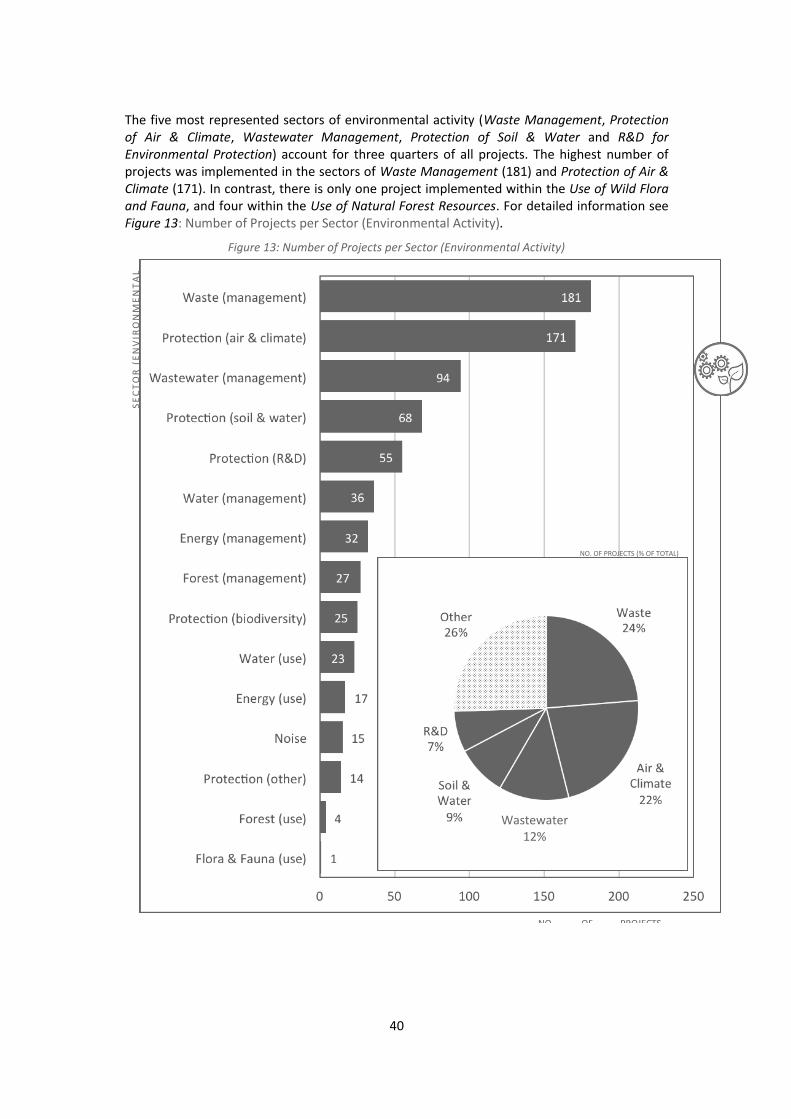
40
The five most represented sectors of environmental activity (Waste Management, Protection of Air & Climate, Wastewater Management, Protection of Soil & Water and R&D for Environmental Protection) account for three quarters of all projects. The highest number of
projects was implemented in the sectors of Waste Management (181) and Protection of Air & Climate (171). In contrast, there is only one project implemented within the Use of Wild Flora and Fauna, and four within the Use of Natural Forest Resources. For detailed information see
Figure 13: Number of Projects per Sector (Environmental Activity).
Figure 13: Number of Projects per Sector (Environmental Activity)
SE
CT
OR
(E
NV
IRO
NM
EN
TA
L
AC
TIV
ITY
)
NO. OF PROJECTS (% OF TOTAL)
NO. OF PROJECTSNature
projects: Creation of value: € 43
bn
Wastewater 12%
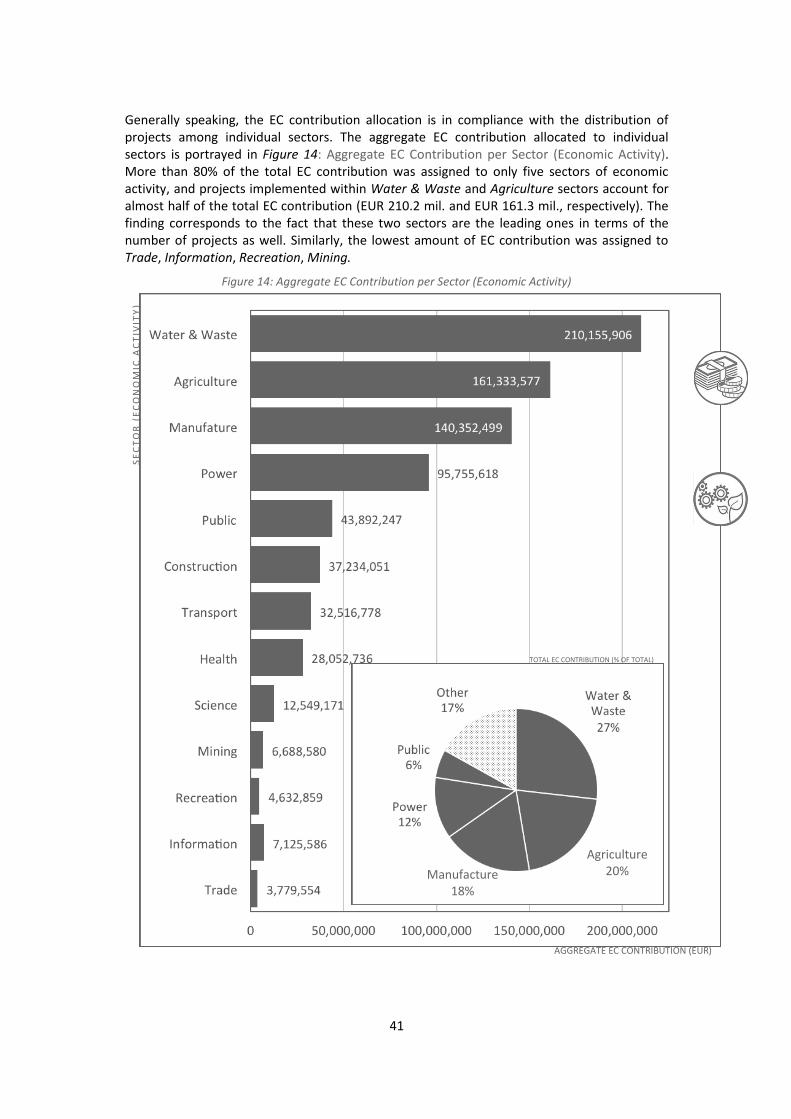
41
Generally speaking, the EC contribution allocation is in compliance with the distribution of
projects among individual sectors. The aggregate EC contribution allocated to individual
sectors is portrayed in Figure 14: Aggregate EC Contribution per Sector (Economic Activity).
More than 80% of the total EC contribution was assigned to only five sectors of economic
activity, and projects implemented within Water & Waste and Agriculture sectors account for
almost half of the total EC contribution (EUR 210.2 mil. and EUR 161.3 mil., respectively). The
finding corresponds to the fact that these two sectors are the leading ones in terms of the
number of projects as well. Similarly, the lowest amount of EC contribution was assigned to
Trade, Information, Recreation, Mining.
Figure 14: Aggregate EC Contribution per Sector (Economic Activity)
SE
CT
OR
(E
CO
NO
MIC
AC
TIV
ITY
)
TOTAL EC CONTRIBUTION (% OF TOTAL)
AGGREGATE EC CONTRIBUTION (EUR)
Manufacture 18%
Agriculture 20%
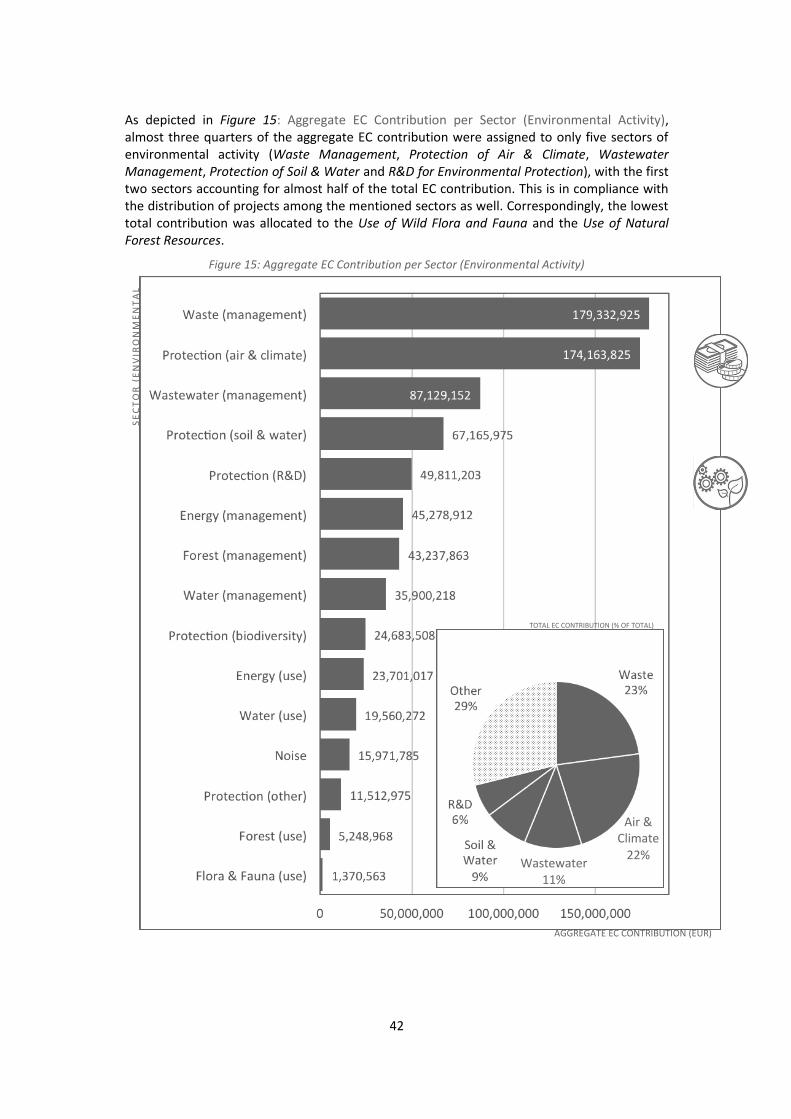
42
As depicted in Figure 15: Aggregate EC Contribution per Sector (Environmental Activity),
almost three quarters of the aggregate EC contribution were assigned to only five sectors of
environmental activity (Waste Management, Protection of Air & Climate, Wastewater Management, Protection of Soil & Water and R&D for Environmental Protection), with the first
two sectors accounting for almost half of the total EC contribution. This is in compliance with
the distribution of projects among the mentioned sectors as well. Correspondingly, the lowest
total contribution was allocated to the Use of Wild Flora and Fauna and the Use of Natural Forest Resources.
Figure 15: Aggregate EC Contribution per Sector (Environmental Activity)
SE
CT
OR
(E
NV
IRO
NM
EN
TA
L
AC
TIV
ITY
)
TOTAL EC CONTRIBUTION (% OF TOTAL)
AGGREGATE EC CONTRIBUTION (EUR)
Wastewater 11%
Air & Climate
22%
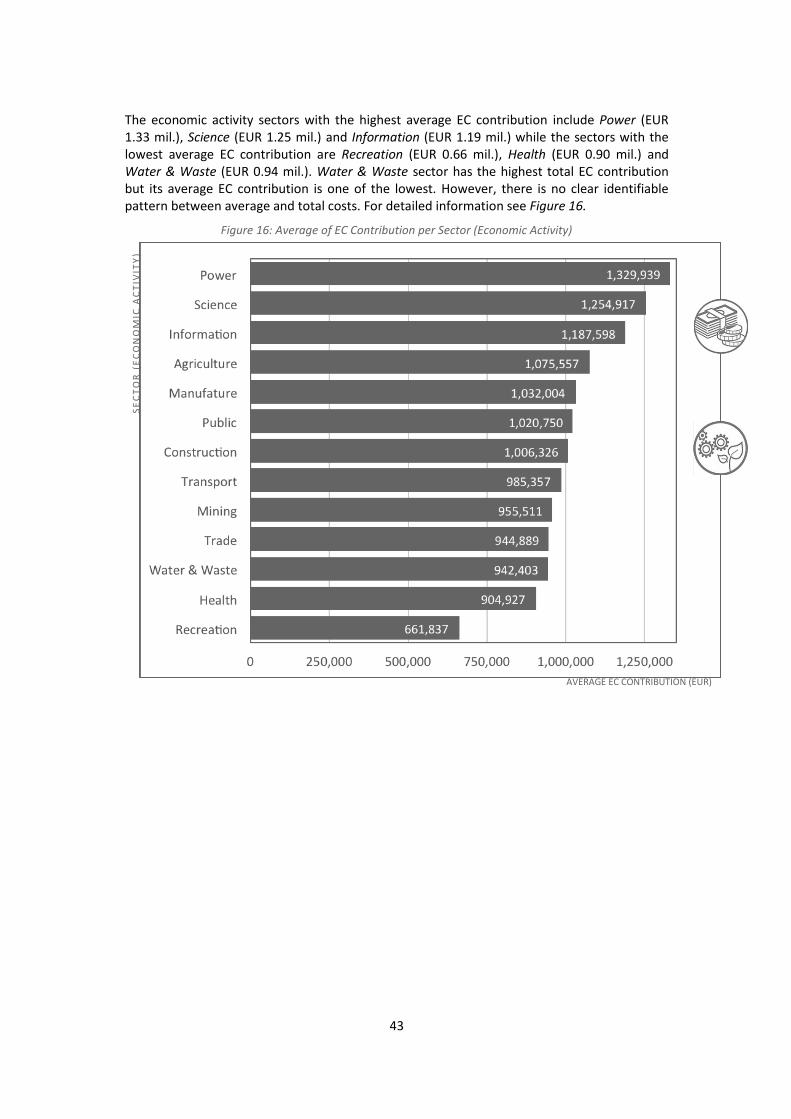
43
The economic activity sectors with the highest average EC contribution include Power (EUR
1.33 mil.), Science (EUR 1.25 mil.) and Information (EUR 1.19 mil.) while the sectors with the
lowest average EC contribution are Recreation (EUR 0.66 mil.), Health (EUR 0.90 mil.) and
Water & Waste (EUR 0.94 mil.). Water & Waste sector has the highest total EC contribution
but its average EC contribution is one of the lowest. However, there is no clear identifiable
pattern between average and total costs. For detailed information see Figure 16.
Figure 16: Average of EC Contribution per Sector (Economic Activity)
SE
CT
OR
(E
CO
NO
MIC
AC
TIV
ITY
)
AVERAGE EC CONTRIBUTION (EUR)
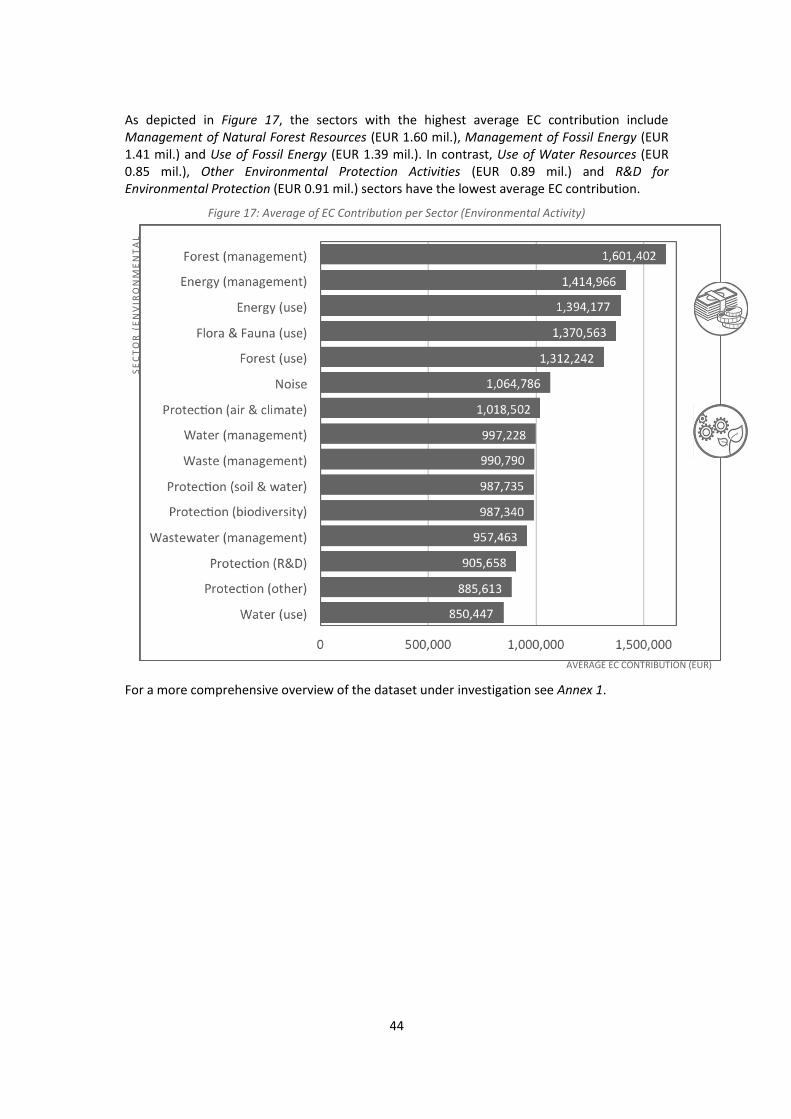
44
As depicted in Figure 17, the sectors with the highest average EC contribution include
Management of Natural Forest Resources (EUR 1.60 mil.), Management of Fossil Energy (EUR
1.41 mil.) and Use of Fossil Energy (EUR 1.39 mil.). In contrast, Use of Water Resources (EUR
0.85 mil.), Other Environmental Protection Activities (EUR 0.89 mil.) and R&D for Environmental Protection (EUR 0.91 mil.) sectors have the lowest average EC contribution.
Figure 17: Average of EC Contribution per Sector (Environmental Activity)
For a more comprehensive overview of the dataset under investigation see Annex 1.
SE
CT
OR
(E
NV
IRO
NM
EN
TA
L
AC
TIV
ITY
)
AVERAGE EC CONTRIBUTION (EUR)
45
Chapter 3: The key determinants of
sustainability and replicability of the
selected projects
The goal of the third part of the main research presented in Chapter 3: The key determinants
of sustainability and replicability of the selected projects is to identify the key determinants of
the level of sustainability and replicability of the projects. For this purpose, a detailed
econometric analysis was conducted. In particular, two econometric models were developed
– the one regressing the level of sustainability on selected explanatory variables and the one
regressing the level of replicability on selected explanatory variables. Both models employed
are the discrete ordinal dependent variable models (in particular, the Ordered Probit non-
linear regressions). Further information relating to the methodology is presented in Section 1.5 Econometric analysis and modelling. Additionally, multiple robustness checks
13 as well as some
of the non-preferred14
specifications of the model can be found in Section 3.4 Robustness checks.
The econometric analysis was conducted on the selected sample of 764 projects. In total, 835
projects were identified as relevant for the analysis but only 764 of them were effectively
examinable as a full set of relevant data was gathered. Individual regressions could be
conducted on even lower number of observations according to the amount of missing data in a
particular case (depending on which explanatory variables are included). This information is
always reported in the econometric tables.
The selected sample under investigation is the same sample as in Chapter 2: Likelihood of
sustainability and replicability of the selected projects. Therefore, the econometric analysis
builds directly on the data gathered via questionnaires filled in by the TMOs and data collected
through text mining from the DORY database. We asked the TMOs to respond to
questionnaires because of the lack of data in the database. In particular, the information about
the level of sustainability, replicability and innovation of the projects were not available. All
required information was completely obtained for 764 projects. The selected sample under
investigation contains only those types of projects, which have an adequate probability of
sustainable and replicable outcomes. After carrying out the desk research, (i) majority of
Nature projects was assessed to be inherently not market-oriented and not generating any
substantial direct economic values; (ii) projects beginning before 2008 were excluded as the
full set of required information would not be accessible due to excessive time distance.
Sustainability
Based on the results of the survey conducted among 107 TMOs (for more information see
Section 1.2.2. 1.4 Survey), the probability of sustainability of 764 selected projects was
examined. The sustainability is related to the sector of the project, region and country of the
beneficiary, budget of the project, duration of the project etc.
For the purpose of the study, four groups / categories of projects were created based on the
probability of their sustainability as listed in Table 4: Categories of Sustainability.
13
Using methodologically different types of model.
14 Either simplified or alternative models.
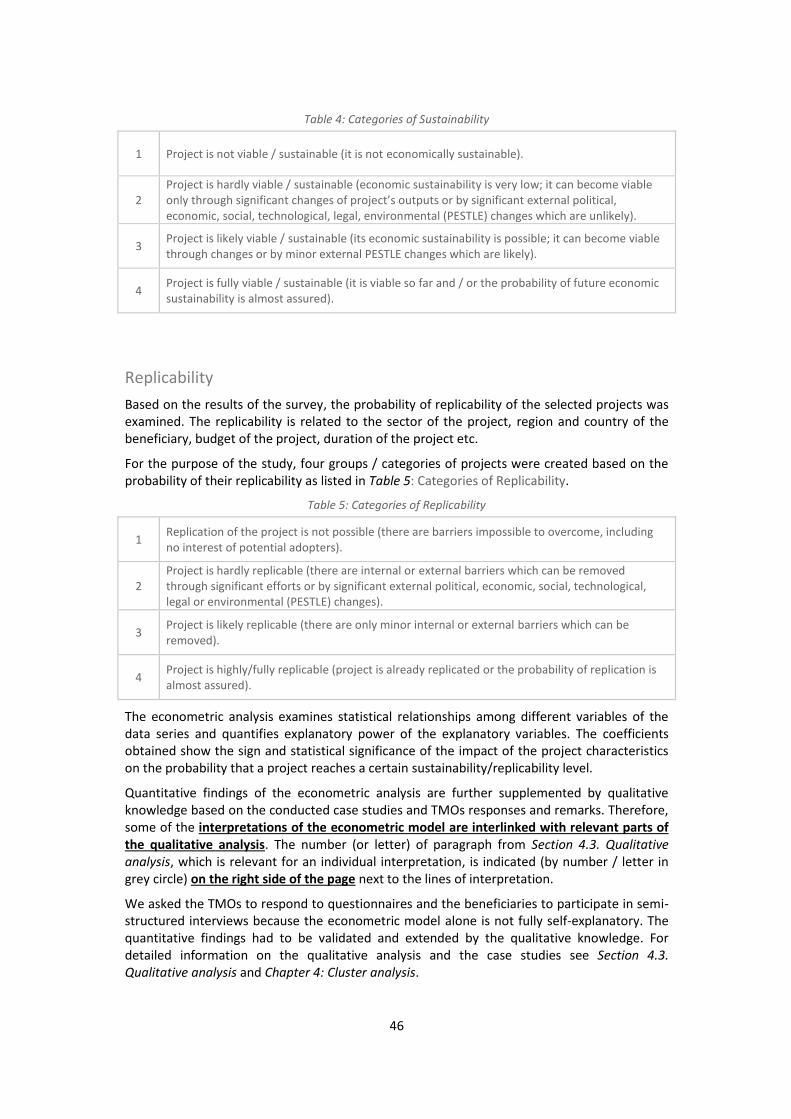
46
Table 4: Categories of Sustainability
1 Project is not viable / sustainable (it is not economically sustainable).
2
Project is hardly viable / sustainable (economic sustainability is very low; it can become viable
only through significant changes of project’s outputs or by significant external political, economic, social, technological, legal, environmental (PESTLE) changes which are unlikely).
3 Project is likely viable / sustainable (its economic sustainability is possible; it can become viable
through changes or by minor external PESTLE changes which are likely).
4 Project is fully viable / sustainable (it is viable so far and / or the probability of future economic
sustainability is almost assured).
Replicability
Based on the results of the survey, the probability of replicability of the selected projects was
examined. The replicability is related to the sector of the project, region and country of the
beneficiary, budget of the project, duration of the project etc.
For the purpose of the study, four groups / categories of projects were created based on the
probability of their replicability as listed in Table 5: Categories of Replicability.
Table 5: Categories of Replicability
1 Replication of the project is not possible (there are barriers impossible to overcome, including
no interest of potential adopters).
2
Project is hardly replicable (there are internal or external barriers which can be removed
through significant efforts or by significant external political, economic, social, technological,
legal or environmental (PESTLE) changes).
3 Project is likely replicable (there are only minor internal or external barriers which can be
removed).
4 Project is highly/fully replicable (project is already replicated or the probability of replication is
almost assured).
The econometric analysis examines statistical relationships among different variables of the
data series and quantifies explanatory power of the explanatory variables. The coefficients
obtained show the sign and statistical significance of the impact of the project characteristics
on the probability that a project reaches a certain sustainability/replicability level.
Quantitative findings of the econometric analysis are further supplemented by qualitative
knowledge based on the conducted case studies and TMOs responses and remarks. Therefore,
some of the interpretations of the econometric model are interlinked with relevant parts of the qualitative analysis. The number (or letter) of paragraph from Section 4.3. Qualitative analysis, which is relevant for an individual interpretation, is indicated (by number / letter in
grey circle) on the right side of the page next to the lines of interpretation.
We asked the TMOs to respond to questionnaires and the beneficiaries to participate in semi-
structured interviews because the econometric model alone is not fully self-explanatory. The
quantitative findings had to be validated and extended by the qualitative knowledge. For
detailed information on the qualitative analysis and the case studies see Section 4.3. Qualitative analysis and Chapter 4: Cluster analysis.
47
Findings
As explained in detail in Section 1.5 Econometric analysis and modelling, coefficients estimated
by the models cannot be interpreted directly, as for example elasticities or marginal effects,
because the coefficients only show the sign and statistical significance of the impact of the
project characteristics on the probability that a project reaches a certain level of
sustainability/replicability. Three different characteristics were identified as significantly
influencing both the sustainability and replicability of the projects.
1. Level of innovation: more innovative projects tend, on average, to be both more
sustainable as well as more replicable, while extremely innovative projects tend to
level off in terms of sustainability, which might be explained by the difficulties linked
to institutional or legal constraints of very innovative solutions.
2. The amount of prototype budget allocated within the projects: projects that either
do not focus on prototypes at all, or focus on them heavily, tend to be both more
sustainable and more replicable. Projects that focus on prototypes heavily are the
most sustainable and replicable. On the contrary, projects perceiving any prototype
only as a by-product of their primary activities or prototype construction is not their
primary point of focus are the most likely to be less sustainable and replicable.
3. The sector categorisation of the projects: projects oriented at manufacturing,
construction and water are, on average, more sustainable. Similarly, projects oriented
at health are, on average, more replicable. Only two sector categories tend to exhibit
a significantly negative influence – these are projects oriented at waste and power.
Waste and power oriented projects are less likely to be replicable. The sector
categorization is stated in Chapter 2: Likelihood of sustainability and replicability of the selected projects in Table 1: Sectors by economic and environmental activities.
Furthermore, there are three other characteristics of the projects identified by our
econometric analysis of sustainability as having significant influence. Region of implementation
of the projects, their duration and the number of partners (i.e. associated beneficiaries) are
estimated to affect the level of sustainability.
Likewise, there are three other characteristics of the projects identified as having significant
influence on replicability. Country origin with respect to the period of accession to the
European Union (in particular, a difference between EU12 vs. other countries), and the
amounts of personnel and infrastructure budgets are estimated to affect the level of
replicability.
Further analysis on significant factors and reasoning behind the findings is presented in
Sections 3.1. Sustainability and 3.2. Replicability. A visual summary of the dependent variables
(sustainability and replicability of the projects) and significant factors influencing them is
depicted in Figure 18: Dependent variables and significant factors influencing them.
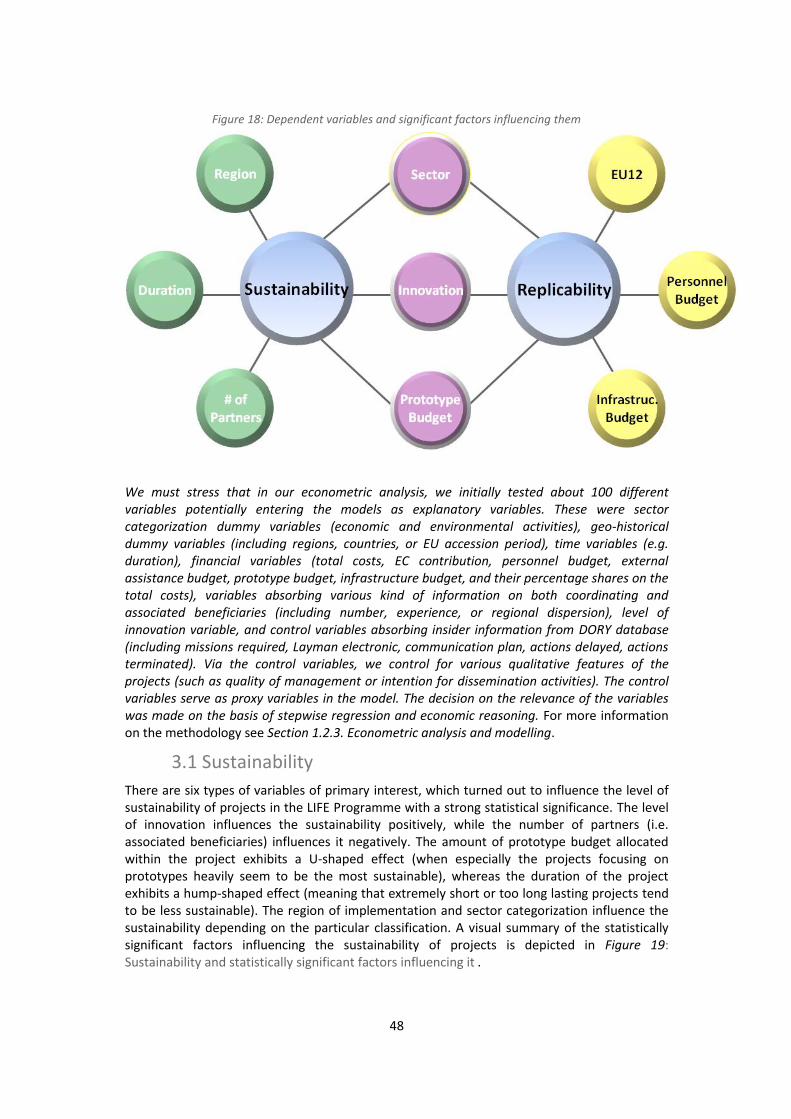
48
Figure 18: Dependent variables and significant factors influencing them
We must stress that in our econometric analysis, we initially tested about 100 different variables potentially entering the models as explanatory variables. These were sector categorization dummy variables (economic and environmental activities), geo-historical dummy variables (including regions, countries, or EU accession period), time variables (e.g. duration), financial variables (total costs, EC contribution, personnel budget, external assistance budget, prototype budget, infrastructure budget, and their percentage shares on the total costs), variables absorbing various kind of information on both coordinating and associated beneficiaries (including number, experience, or regional dispersion), level of innovation variable, and control variables absorbing insider information from DORY database (including missions required, Layman electronic, communication plan, actions delayed, actions terminated). Via the control variables, we control for various qualitative features of the projects (such as quality of management or intention for dissemination activities). The control variables serve as proxy variables in the model. The decision on the relevance of the variables was made on the basis of stepwise regression and economic reasoning. For more information
on the methodology see Section 1.2.3. Econometric analysis and modelling.
2. 43.1 Sustainability
There are six types of variables of primary interest, which turned out to influence the level of
sustainability of projects in the LIFE Programme with a strong statistical significance. The level
of innovation influences the sustainability positively, while the number of partners (i.e.
associated beneficiaries) influences it negatively. The amount of prototype budget allocated
within the project exhibits a U-shaped effect (when especially the projects focusing on
prototypes heavily seem to be the most sustainable), whereas the duration of the project
exhibits a hump-shaped effect (meaning that extremely short or too long lasting projects tend
to be less sustainable). The region of implementation and sector categorization influence the
sustainability depending on the particular classification. A visual summary of the statistically
significant factors influencing the sustainability of projects is depicted in Figure 19:
Sustainability and statistically significant factors influencing it .
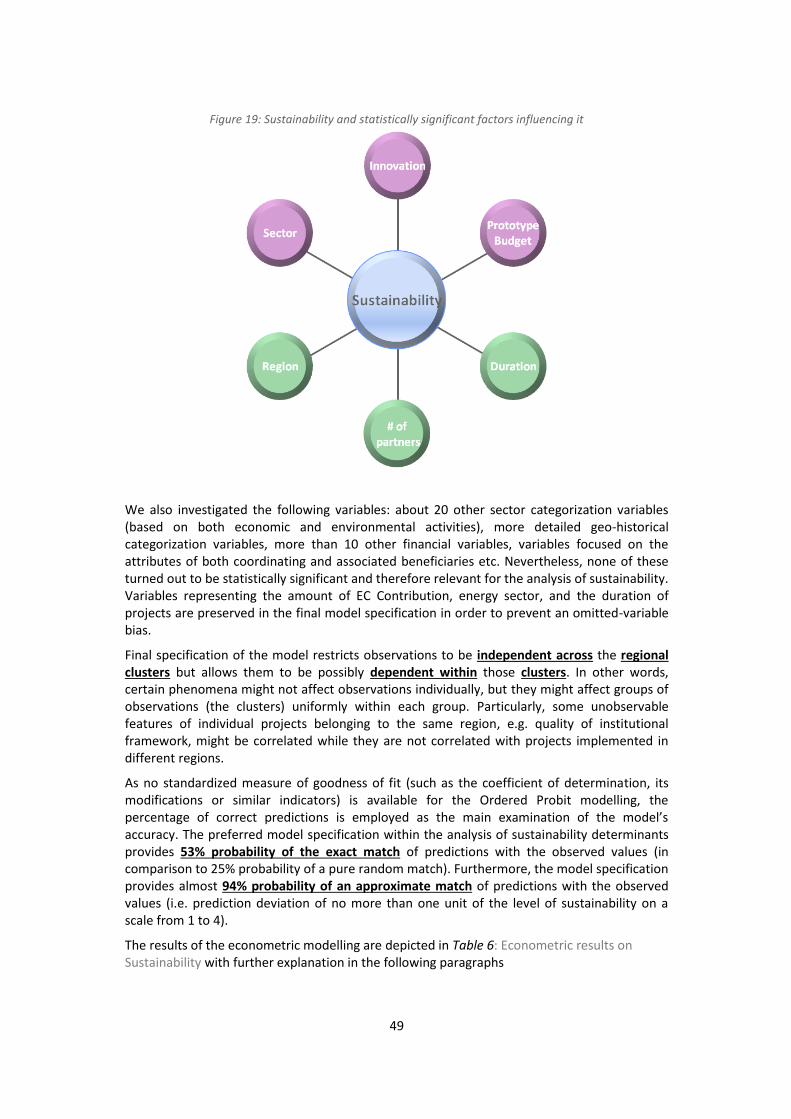
49
Figure 19: Sustainability and statistically significant factors influencing it
We also investigated the following variables: about 20 other sector categorization variables
(based on both economic and environmental activities), more detailed geo-historical
categorization variables, more than 10 other financial variables, variables focused on the
attributes of both coordinating and associated beneficiaries etc. Nevertheless, none of these
turned out to be statistically significant and therefore relevant for the analysis of sustainability.
Variables representing the amount of EC Contribution, energy sector, and the duration of
projects are preserved in the final model specification in order to prevent an omitted-variable
bias.
Final specification of the model restricts observations to be independent across the regional clusters but allows them to be possibly dependent within those clusters. In other words,
certain phenomena might not affect observations individually, but they might affect groups of
observations (the clusters) uniformly within each group. Particularly, some unobservable
features of individual projects belonging to the same region, e.g. quality of institutional
framework, might be correlated while they are not correlated with projects implemented in
different regions.
As no standardized measure of goodness of fit (such as the coefficient of determination, its
modifications or similar indicators) is available for the Ordered Probit modelling, the
percentage of correct predictions is employed as the main examination of the model’s accuracy. The preferred model specification within the analysis of sustainability determinants
provides 53% probability of the exact match of predictions with the observed values (in
comparison to 25% probability of a pure random match). Furthermore, the model specification
provides almost 94% probability of an approximate match of predictions with the observed
values (i.e. prediction deviation of no more than one unit of the level of sustainability on a
scale from 1 to 4).
The results of the econometric modelling are depicted in Table 6: Econometric results on
Sustainability with further explanation in the following paragraphs
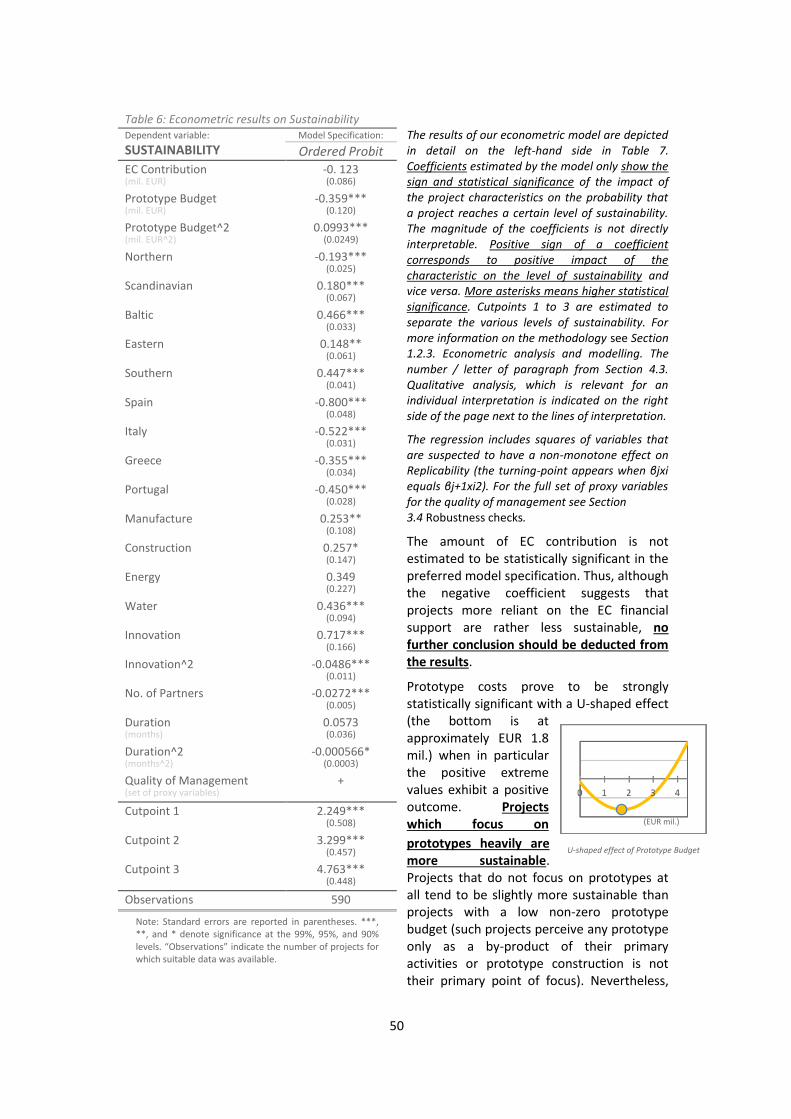
50
Table 6: Econometric results on Sustainability The results of our econometric model are depicted in detail on the left-hand side in Table 7. Coefficients estimated by the model only show the sign and statistical significance of the impact of the project characteristics on the probability that a project reaches a certain level of sustainability. The magnitude of the coefficients is not directly interpretable. Positive sign of a coefficient corresponds to positive impact of the characteristic on the level of sustainability and vice versa. More asterisks means higher statistical significance. Cutpoints 1 to 3 are estimated to separate the various levels of sustainability. For more information on the methodology see Section 1.2.3. Econometric analysis and modelling. The number / letter of paragraph from Section 4.3. Qualitative analysis, which is relevant for an individual interpretation is indicated on the right side of the page next to the lines of interpretation.
The regression includes squares of variables that are suspected to have a non-monotone effect on Replicability (the turning-point appears when βjxi equals βj+1xi2). For the full set of proxy variables for the quality of management see Section 3.4 Robustness checks.
The amount of EC contribution is not
estimated to be statistically significant in the
preferred model specification. Thus, although
the negative coefficient suggests that
projects more reliant on the EC financial
support are rather less sustainable, no further conclusion should be deducted from the results.
Prototype costs prove to be strongly
statistically significant with a U-shaped effect
(the bottom is at
approximately EUR 1.8
mil.) when in particular
the positive extreme
values exhibit a positive
outcome. Projects which focus on prototypes heavily are more sustainable.
Projects that do not focus on prototypes at
all tend to be slightly more sustainable than
projects with a low non-zero prototype
budget (such projects perceive any prototype
only as a by-product of their primary
activities or prototype construction is not
their primary point of focus). Nevertheless,
Dependent variable:
SUSTAINABILITY
Model Specification:
Ordered Probit EC Contribution (mil. EUR)
-0. 123 (0.086)
Prototype Budget (mil. EUR)
-0.359*** (0.120)
Prototype Budget^2 (mil. EUR^2)
0.0993*** (0.0249)
Northern -0.193*** (0.025)
Scandinavian 0.180*** (0.067)
Baltic 0.466*** (0.033)
Eastern 0.148** (0.061)
Southern 0.447*** (0.041)
Spain -0.800*** (0.048)
Italy -0.522*** (0.031)
Greece -0.355*** (0.034)
Portugal -0.450*** (0.028)
Manufacture 0.253** (0.108)
Construction 0.257* (0.147)
Energy 0.349 (0.227)
Water 0.436*** (0.094)
Innovation 0.717*** (0.166)
Innovation^2 -0.0486*** (0.011)
No. of Partners -0.0272*** (0.005)
Duration (months)
0.0573 (0.036)
Duration^2 (months^2)
-0.000566* (0.0003)
Quality of Management (set of proxy variables)
+
Cutpoint 1 2.249*** (0.508)
Cutpoint 2 3.299*** (0.457)
Cutpoint 3 4.763*** (0.448)
Observations 590
Note: Standard errors are reported in parentheses. ***,
**, and * denote significance at the 99%, 95%, and 90%
levels. “Observations” indicate the number of projects for
which suitable data was available.
(EUR mil.)
U-shaped effect of Prototype Budget
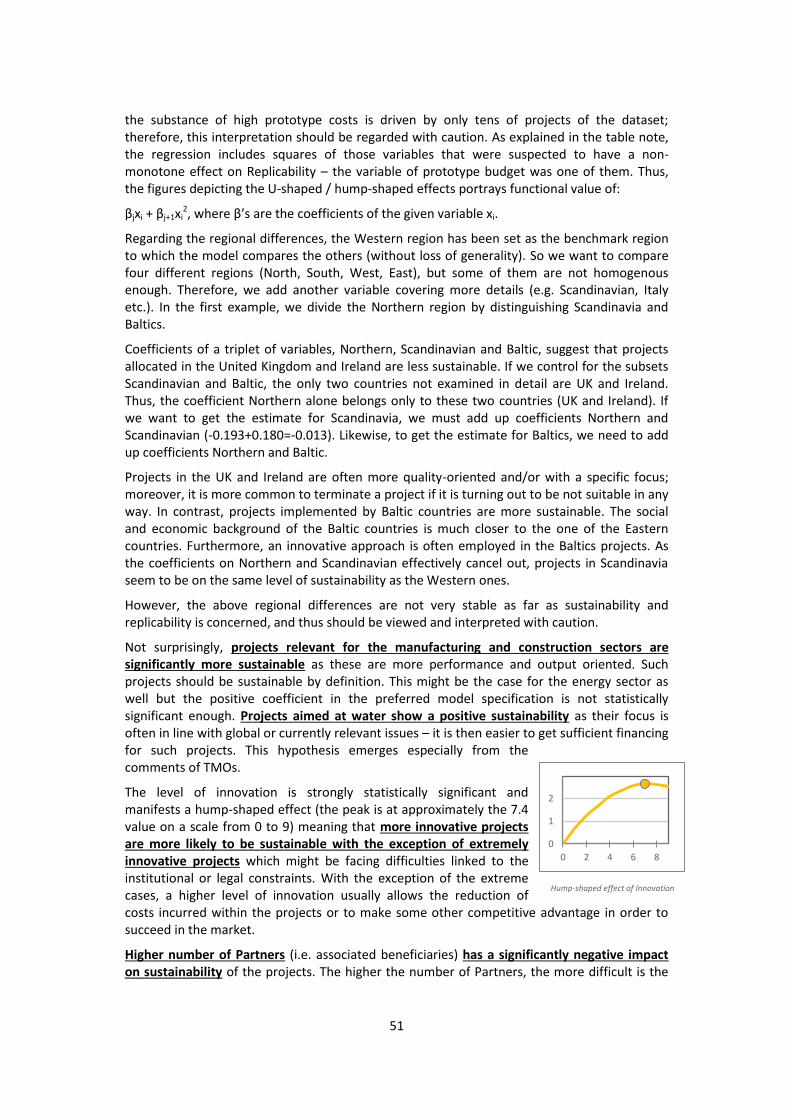
51
the substance of high prototype costs is driven by only tens of projects of the dataset;
therefore, this interpretation should be regarded with caution. As explained in the table note,
the regression includes squares of those variables that were suspected to have a non-
monotone effect on Replicability – the variable of prototype budget was one of them. Thus,
the figures depicting the U-shaped / hump-shaped effects portrays functional value of:
βjxi + βj+1xi2, where β’s are the coefficients of the given variable xi.
Regarding the regional differences, the Western region has been set as the benchmark region
to which the model compares the others (without loss of generality). So we want to compare
four different regions (North, South, West, East), but some of them are not homogenous
enough. Therefore, we add another variable covering more details (e.g. Scandinavian, Italy
etc.). In the first example, we divide the Northern region by distinguishing Scandinavia and
Baltics.
Coefficients of a triplet of variables, Northern, Scandinavian and Baltic, suggest that projects
allocated in the United Kingdom and Ireland are less sustainable. If we control for the subsets
Scandinavian and Baltic, the only two countries not examined in detail are UK and Ireland.
Thus, the coefficient Northern alone belongs only to these two countries (UK and Ireland). If
we want to get the estimate for Scandinavia, we must add up coefficients Northern and
Scandinavian (-0.193+0.180=-0.013). Likewise, to get the estimate for Baltics, we need to add
up coefficients Northern and Baltic.
Projects in the UK and Ireland are often more quality-oriented and/or with a specific focus;
moreover, it is more common to terminate a project if it is turning out to be not suitable in any
way. In contrast, projects implemented by Baltic countries are more sustainable. The social
and economic background of the Baltic countries is much closer to the one of the Eastern
countries. Furthermore, an innovative approach is often employed in the Baltics projects. As
the coefficients on Northern and Scandinavian effectively cancel out, projects in Scandinavia
seem to be on the same level of sustainability as the Western ones.
However, the above regional differences are not very stable as far as sustainability and
replicability is concerned, and thus should be viewed and interpreted with caution.
Not surprisingly, projects relevant for the manufacturing and construction sectors are significantly more sustainable as these are more performance and output oriented. Such
projects should be sustainable by definition. This might be the case for the energy sector as
well but the positive coefficient in the preferred model specification is not statistically
significant enough. Projects aimed at water show a positive sustainability as their focus is
often in line with global or currently relevant issues – it is then easier to get sufficient financing
for such projects. This hypothesis emerges especially from the
comments of TMOs.
The level of innovation is strongly statistically significant and
manifests a hump-shaped effect (the peak is at approximately the 7.4
value on a scale from 0 to 9) meaning that more innovative projects are more likely to be sustainable with the exception of extremely innovative projects which might be facing difficulties linked to the
institutional or legal constraints. With the exception of the extreme
cases, a higher level of innovation usually allows the reduction of
costs incurred within the projects or to make some other competitive advantage in order to
succeed in the market.
Higher number of Partners (i.e. associated beneficiaries) has a significantly negative impact on sustainability of the projects. The higher the number of Partners, the more difficult is the
Hump-shaped effect of Innovation
0
1
2
0 2 4 6 8
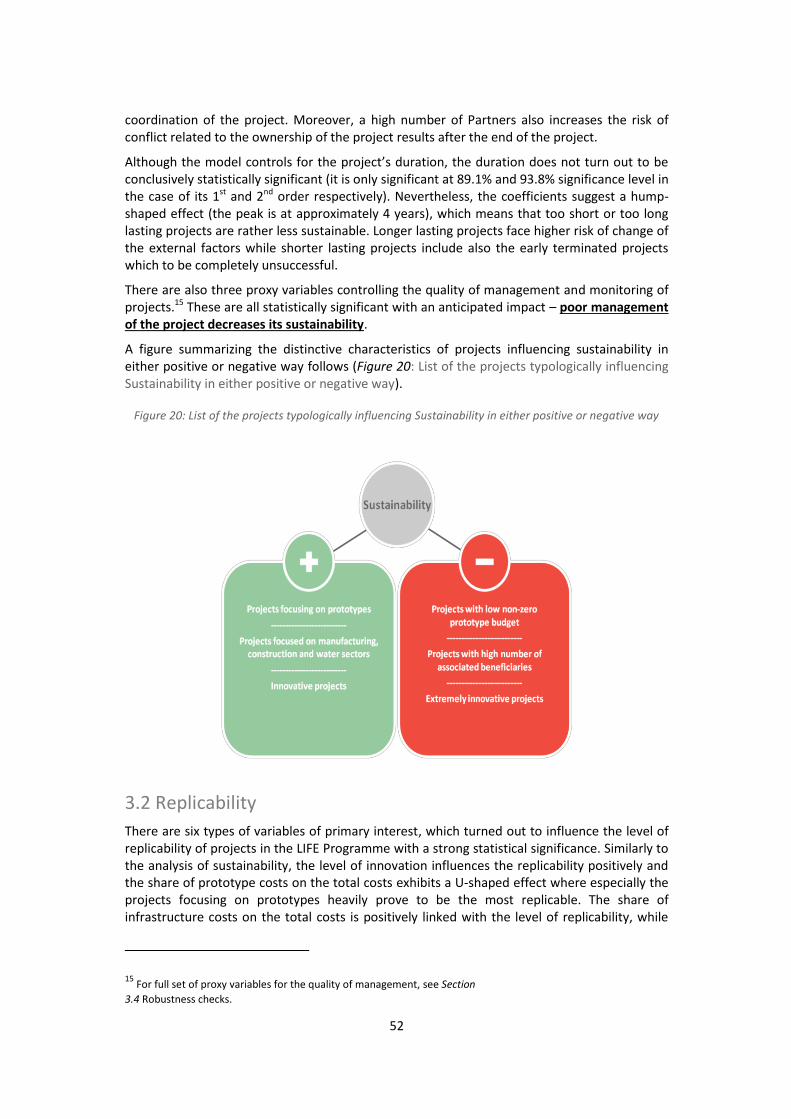
52
coordination of the project. Moreover, a high number of Partners also increases the risk of
conflict related to the ownership of the project results after the end of the project.
Although the model controls for the project’s duration, the duration does not turn out to be conclusively statistically significant (it is only significant at 89.1% and 93.8% significance level in
the case of its 1st
and 2nd
order respectively). Nevertheless, the coefficients suggest a hump-
shaped effect (the peak is at approximately 4 years), which means that too short or too long
lasting projects are rather less sustainable. Longer lasting projects face higher risk of change of
the external factors while shorter lasting projects include also the early terminated projects
which to be completely unsuccessful.
There are also three proxy variables controlling the quality of management and monitoring of
projects.15
These are all statistically significant with an anticipated impact – poor management of the project decreases its sustainability.
A figure summarizing the distinctive characteristics of projects influencing sustainability in
either positive or negative way follows (Figure 20: List of the projects typologically influencing
Sustainability in either positive or negative way).
Figure 20: List of the projects typologically influencing Sustainability in either positive or negative way
3.2 Replicability
There are six types of variables of primary interest, which turned out to influence the level of
replicability of projects in the LIFE Programme with a strong statistical significance. Similarly to
the analysis of sustainability, the level of innovation influences the replicability positively and
the share of prototype costs on the total costs exhibits a U-shaped effect where especially the
projects focusing on prototypes heavily prove to be the most replicable. The share of
infrastructure costs on the total costs is positively linked with the level of replicability, while
15
For full set of proxy variables for the quality of management, see Section 3.4 Robustness checks.
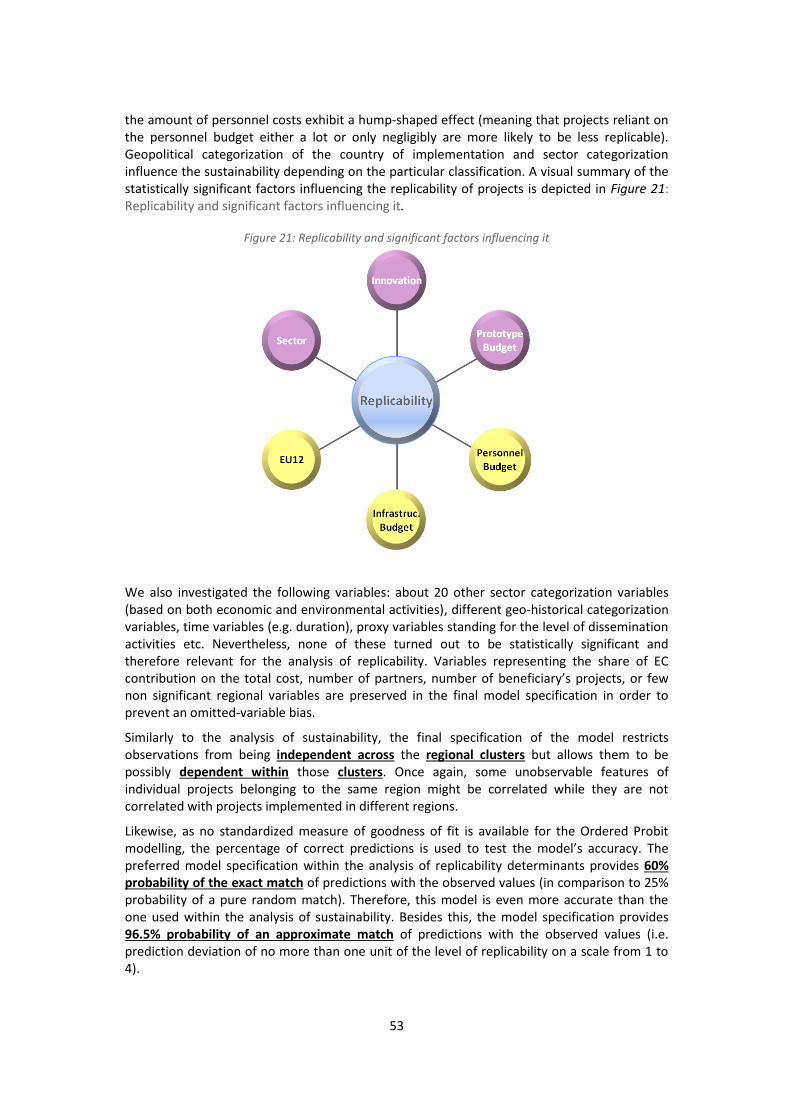
53
the amount of personnel costs exhibit a hump-shaped effect (meaning that projects reliant on
the personnel budget either a lot or only negligibly are more likely to be less replicable).
Geopolitical categorization of the country of implementation and sector categorization
influence the sustainability depending on the particular classification. A visual summary of the
statistically significant factors influencing the replicability of projects is depicted in Figure 21:
Replicability and significant factors influencing it.
Figure 21: Replicability and significant factors influencing it
We also investigated the following variables: about 20 other sector categorization variables
(based on both economic and environmental activities), different geo-historical categorization
variables, time variables (e.g. duration), proxy variables standing for the level of dissemination
activities etc. Nevertheless, none of these turned out to be statistically significant and
therefore relevant for the analysis of replicability. Variables representing the share of EC
contribution on the total cost, number of partners, number of beneficiary’s projects, or few non significant regional variables are preserved in the final model specification in order to
prevent an omitted-variable bias.
Similarly to the analysis of sustainability, the final specification of the model restricts
observations from being independent across the regional clusters but allows them to be
possibly dependent within those clusters. Once again, some unobservable features of
individual projects belonging to the same region might be correlated while they are not
correlated with projects implemented in different regions.
Likewise, as no standardized measure of goodness of fit is available for the Ordered Probit
modelling, the percentage of correct predictions is used to test the model’s accuracy. The preferred model specification within the analysis of replicability determinants provides 60% probability of the exact match of predictions with the observed values (in comparison to 25%
probability of a pure random match). Therefore, this model is even more accurate than the
one used within the analysis of sustainability. Besides this, the model specification provides
96.5% probability of an approximate match of predictions with the observed values (i.e.
prediction deviation of no more than one unit of the level of replicability on a scale from 1 to
4).
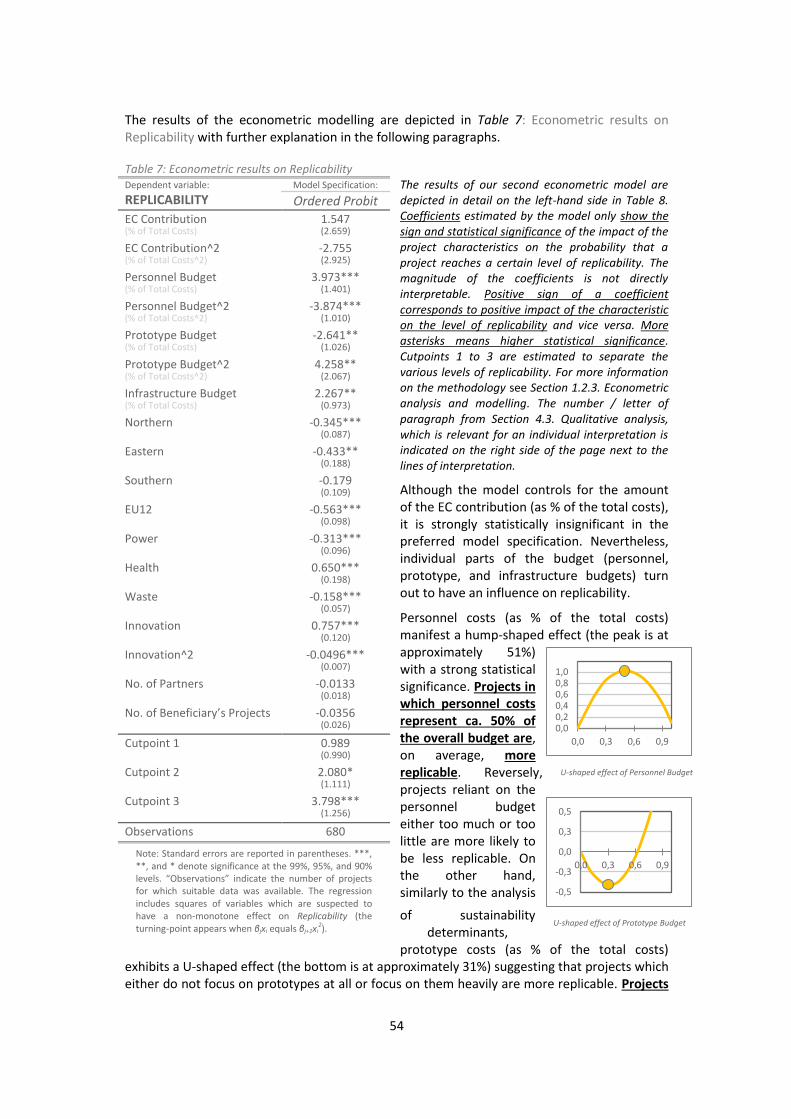
54
The results of the econometric modelling are depicted in Table 7: Econometric results on
Replicability with further explanation in the following paragraphs.
Table 7: Econometric results on Replicability The results of our second econometric model are depicted in detail on the left-hand side in Table 8. Coefficients estimated by the model only show the sign and statistical significance of the impact of the project characteristics on the probability that a project reaches a certain level of replicability. The magnitude of the coefficients is not directly interpretable. Positive sign of a coefficient corresponds to positive impact of the characteristic on the level of replicability and vice versa. More asterisks means higher statistical significance. Cutpoints 1 to 3 are estimated to separate the various levels of replicability. For more information on the methodology see Section 1.2.3. Econometric analysis and modelling. The number / letter of paragraph from Section 4.3. Qualitative analysis, which is relevant for an individual interpretation is indicated on the right side of the page next to the lines of interpretation.
Although the model controls for the amount
of the EC contribution (as % of the total costs),
it is strongly statistically insignificant in the
preferred model specification. Nevertheless,
individual parts of the budget (personnel,
prototype, and infrastructure budgets) turn
out to have an influence on replicability.
Personnel costs (as % of the total costs)
manifest a hump-shaped effect (the peak is at
approximately 51%)
with a strong statistical
significance. Projects in which personnel costs represent ca. 50% of the overall budget are,
on average, more replicable. Reversely,
projects reliant on the
personnel budget
either too much or too
little are more likely to
be less replicable. On
the other hand,
similarly to the analysis
of sustainability
determinants,
prototype costs (as % of the total costs)
exhibits a U-shaped effect (the bottom is at approximately 31%) suggesting that projects which
either do not focus on prototypes at all or focus on them heavily are more replicable. Projects
Dependent variable:
REPLICABILITY
Model Specification:
Ordered Probit EC Contribution (% of Total Costs)
1.547 (2.659)
EC Contribution^2 (% of Total Costs^2)
-2.755 (2.925)
Personnel Budget (% of Total Costs)
3.973*** (1.401)
Personnel Budget^2 (% of Total Costs^2)
-3.874*** (1.010)
Prototype Budget (% of Total Costs)
-2.641** (1.026)
Prototype Budget^2 (% of Total Costs^2)
4.258** (2.067)
Infrastructure Budget (% of Total Costs)
2.267** (0.973)
Northern -0.345*** (0.087)
Eastern -0.433** (0.188)
Southern -0.179 (0.109)
EU12 -0.563*** (0.098)
Power -0.313*** (0.096)
Health 0.650*** (0.198)
Waste -0.158*** (0.057)
Innovation 0.757*** (0.120)
Innovation^2 -0.0496*** (0.007)
No. of Partners -0.0133 (0.018)
No. of Beneficiary’s Projects -0.0356 (0.026)
Cutpoint 1 0.989 (0.990)
Cutpoint 2 2.080* (1.111)
Cutpoint 3 3.798*** (1.256)
Observations 680
Note: Standard errors are reported in parentheses. ***,
**, and * denote significance at the 99%, 95%, and 90%
levels. “Observations” indicate the number of projects
for which suitable data was available. The regression
includes squares of variables which are suspected to
have a non-monotone effect on Replicability (the
turning-point appears when βjxi equals βj+1xi2).
0,00,20,40,60,81,0
0,0 0,3 0,6 0,9
U-shaped effect of Personnel Budget
-0,5
-0,3
0,0
0,3
0,5
0,0 0,3 0,6 0,9
U-shaped effect of Prototype Budget
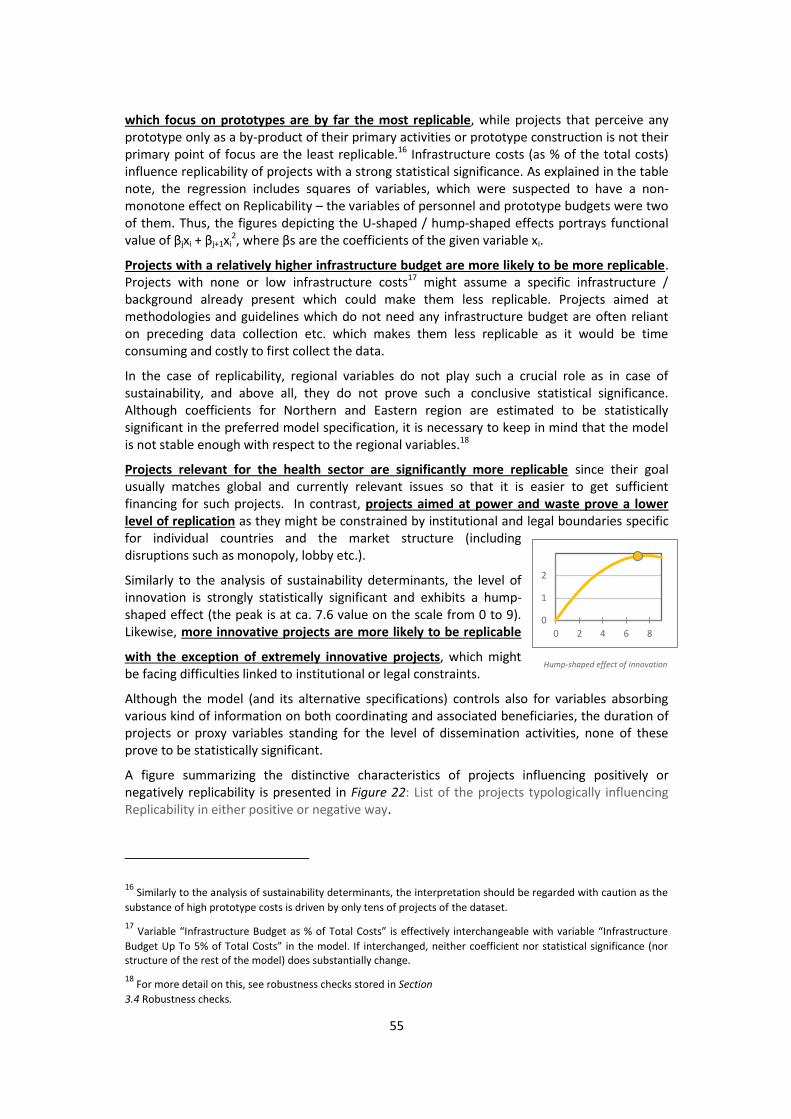
55
which focus on prototypes are by far the most replicable, while projects that perceive any
prototype only as a by-product of their primary activities or prototype construction is not their
primary point of focus are the least replicable.16
Infrastructure costs (as % of the total costs)
influence replicability of projects with a strong statistical significance. As explained in the table
note, the regression includes squares of variables, which were suspected to have a non-
monotone effect on Replicability – the variables of personnel and prototype budgets were two
of them. Thus, the figures depicting the U-shaped / hump-shaped effects portrays functional
value of βjxi + βj+1xi2, where βs are the coefficients of the given variable xi.
Projects with a relatively higher infrastructure budget are more likely to be more replicable.
Projects with none or low infrastructure costs17
might assume a specific infrastructure /
background already present which could make them less replicable. Projects aimed at
methodologies and guidelines which do not need any infrastructure budget are often reliant
on preceding data collection etc. which makes them less replicable as it would be time
consuming and costly to first collect the data.
In the case of replicability, regional variables do not play such a crucial role as in case of
sustainability, and above all, they do not prove such a conclusive statistical significance.
Although coefficients for Northern and Eastern region are estimated to be statistically
significant in the preferred model specification, it is necessary to keep in mind that the model
is not stable enough with respect to the regional variables.18
Projects relevant for the health sector are significantly more replicable since their goal
usually matches global and currently relevant issues so that it is easier to get sufficient
financing for such projects. In contrast, projects aimed at power and waste prove a lower level of replication as they might be constrained by institutional and legal boundaries specific
for individual countries and the market structure (including
disruptions such as monopoly, lobby etc.).
Similarly to the analysis of sustainability determinants, the level of
innovation is strongly statistically significant and exhibits a hump-
shaped effect (the peak is at ca. 7.6 value on the scale from 0 to 9).
Likewise, more innovative projects are more likely to be replicable
with the exception of extremely innovative projects, which might
be facing difficulties linked to institutional or legal constraints.
Although the model (and its alternative specifications) controls also for variables absorbing
various kind of information on both coordinating and associated beneficiaries, the duration of
projects or proxy variables standing for the level of dissemination activities, none of these
prove to be statistically significant.
A figure summarizing the distinctive characteristics of projects influencing positively or
negatively replicability is presented in Figure 22: List of the projects typologically influencing
Replicability in either positive or negative way.
16
Similarly to the analysis of sustainability determinants, the interpretation should be regarded with caution as the
substance of high prototype costs is driven by only tens of projects of the dataset.
17 Variable “Infrastructure Budget as % of Total Costs” is effectively interchangeable with variable “Infrastructure
Budget Up To 5% of Total Costs” in the model. If interchanged, neither coefficient nor statistical significance (nor structure of the rest of the model) does substantially change.
18 For more detail on this, see robustness checks stored in Section
3.4 Robustness checks.
0
1
2
0 2 4 6 8
Hump-shaped effect of Innovation
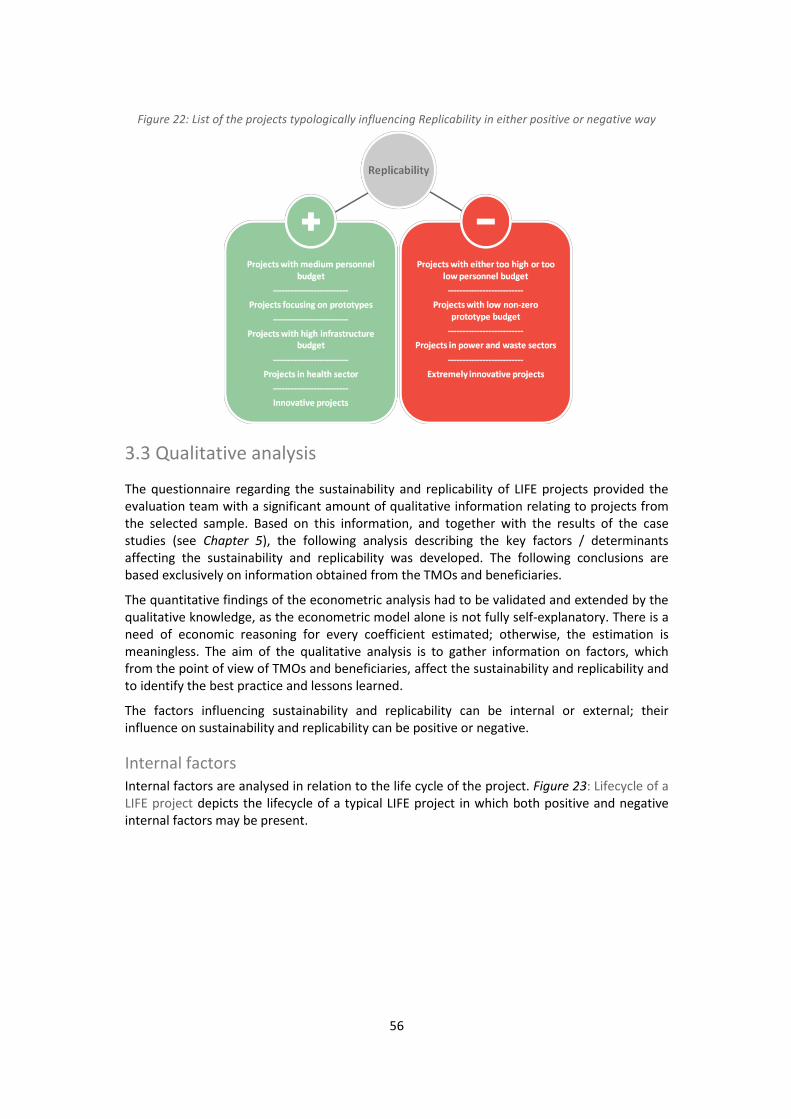
56
Figure 22: List of the projects typologically influencing Replicability in either positive or negative way
3.3 Qualitative analysis
The questionnaire regarding the sustainability and replicability of LIFE projects provided the
evaluation team with a significant amount of qualitative information relating to projects from
the selected sample. Based on this information, and together with the results of the case
studies (see Chapter 5), the following analysis describing the key factors / determinants
affecting the sustainability and replicability was developed. The following conclusions are
based exclusively on information obtained from the TMOs and beneficiaries.
The quantitative findings of the econometric analysis had to be validated and extended by the
qualitative knowledge, as the econometric model alone is not fully self-explanatory. There is a
need of economic reasoning for every coefficient estimated; otherwise, the estimation is
meaningless. The aim of the qualitative analysis is to gather information on factors, which
from the point of view of TMOs and beneficiaries, affect the sustainability and replicability and
to identify the best practice and lessons learned.
The factors influencing sustainability and replicability can be internal or external; their
influence on sustainability and replicability can be positive or negative.
Internal factors
Internal factors are analysed in relation to the life cycle of the project. Figure 23: Lifecycle of a
LIFE project depicts the lifecycle of a typical LIFE project in which both positive and negative
internal factors may be present.
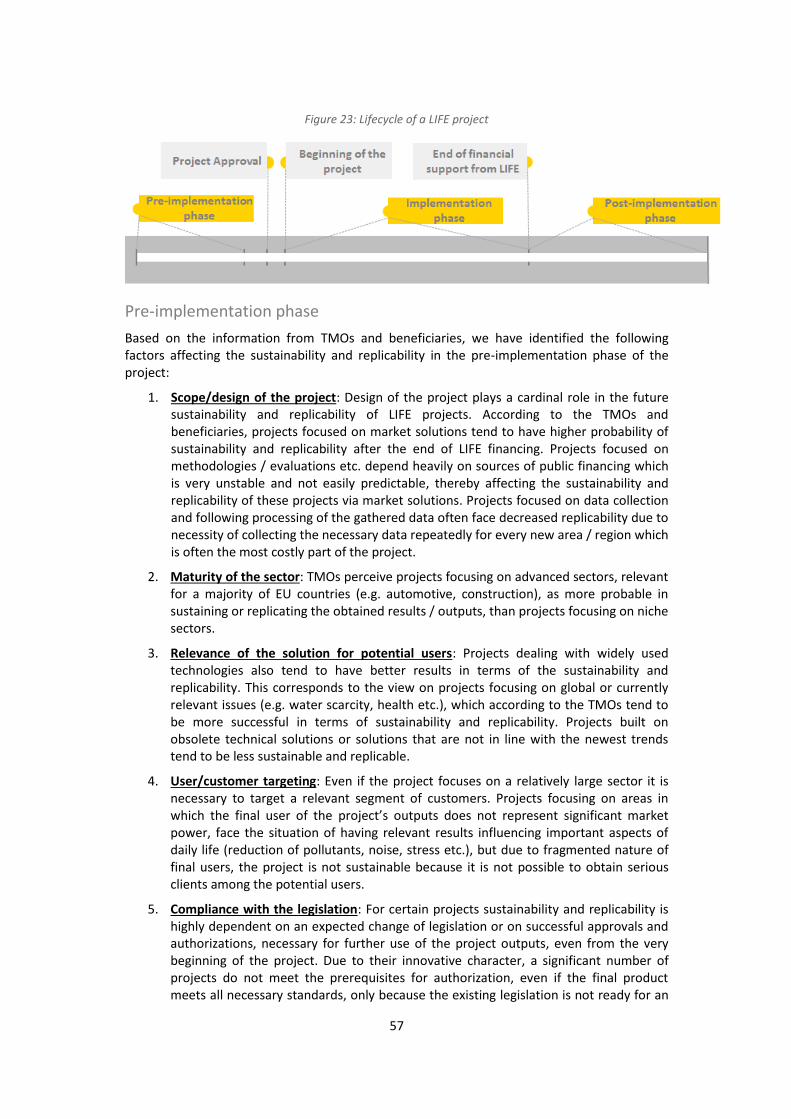
57
Figure 23: Lifecycle of a LIFE project
Pre-implementation phase
Based on the information from TMOs and beneficiaries, we have identified the following
factors affecting the sustainability and replicability in the pre-implementation phase of the
project:
1. Scope/design of the project: Design of the project plays a cardinal role in the future
sustainability and replicability of LIFE projects. According to the TMOs and
beneficiaries, projects focused on market solutions tend to have higher probability of
sustainability and replicability after the end of LIFE financing. Projects focused on
methodologies / evaluations etc. depend heavily on sources of public financing which
is very unstable and not easily predictable, thereby affecting the sustainability and
replicability of these projects via market solutions. Projects focused on data collection
and following processing of the gathered data often face decreased replicability due to
necessity of collecting the necessary data repeatedly for every new area / region which
is often the most costly part of the project.
2. Maturity of the sector: TMOs perceive projects focusing on advanced sectors, relevant
for a majority of EU countries (e.g. automotive, construction), as more probable in
sustaining or replicating the obtained results / outputs, than projects focusing on niche
sectors.
3. Relevance of the solution for potential users: Projects dealing with widely used
technologies also tend to have better results in terms of the sustainability and
replicability. This corresponds to the view on projects focusing on global or currently
relevant issues (e.g. water scarcity, health etc.), which according to the TMOs tend to
be more successful in terms of sustainability and replicability. Projects built on
obsolete technical solutions or solutions that are not in line with the newest trends
tend to be less sustainable and replicable.
4. User/customer targeting: Even if the project focuses on a relatively large sector it is
necessary to target a relevant segment of customers. Projects focusing on areas in
which the final user of the project’s outputs does not represent significant market
power, face the situation of having relevant results influencing important aspects of
daily life (reduction of pollutants, noise, stress etc.), but due to fragmented nature of
final users, the project is not sustainable because it is not possible to obtain serious
clients among the potential users.
5. Compliance with the legislation: For certain projects sustainability and replicability is
highly dependent on an expected change of legislation or on successful approvals and
authorizations, necessary for further use of the project outputs, even from the very
beginning of the project. Due to their innovative character, a significant number of
projects do not meet the prerequisites for authorization, even if the final product
meets all necessary standards, only because the existing legislation is not ready for an
58
innovative solution. Assessing the probability of changing existing authorization
standards seems to be a vital starting point of innovative projects, primarily in the
Southern region.
6. Stakeholder analysis: Detailed stakeholder analysis even before the start of the
projects can prevent later failure of the project. Identification of possible suppliers of
inputs/complements necessary for the implementation and further development of
the project solution was not performed for every relevant project. In a number of
cases, the beneficiary identified too late that for the commercialization of the project
outputs a reliable network of suppliers must be in place in order to bring the solution
to the market. In such cases, even promising projects lost their ability to survive after
the end of LIFE financing. For projects focusing on public issues (health, environment,
traffic, energy etc.), it is vital to incorporate the key public authorities into the project
from the beginning (i.e. development of the proposal) to ensure the long-term support
of relevant national or regional public bodies.
7. Structure of the project team: The implementation structure of the project team,
especially the allocation of tasks between beneficiary and its partners, was identified
by both the TMOs and the beneficiaries as another very important factor. From the
TMOs perspective, appropriately defined competencies and responsibilities of the
coordinating beneficiaries (CB) and associated beneficiaries (AB) and ex ante
agreement on the ownership and further utilization of projects outputs have positive
impact on future sustainability or replicability of the project.
8. Market position: The TMOs highlighted the market position of the CB or AB as a
significant factor in the replicability and sustainability of the project after the end of
LIFE financing. The TMOs expresses their opinion that market leaders tend to have
better results with the commercialization of the project outputs than small entities
with low share in the respective market. Strong partners often play a significant role in
transferring the “laboratory results” into real production conditions.
9. Financial analysis: Financial analysis carried out at the beginning of the project can
provide the beneficiary and its partners with an overview on possible sustainability of
the project after the end of LIFE financing. According to the TMOs, in many cases the
financial analysis does not provide the user with enough reliable data and if conducted
properly, it would definitely discourage the beneficiary from applying for financing
within the LIFE Programme. A properly executed financial analysis of the project is
considered highly relevant and crucial, especially in cases in which the potential
market of the expected outputs is distorted (monopoly, strong lobby, dumping prices
etc.).
Implementation phase
Based on the information from TMOs and beneficiaries, we have identified the following
factors affecting the sustainability and replicability in the implementation phase of the project:
10. Capacity and competencies of the beneficiary: During the implementation phase,
stability of the beneficiary and its partners and their ability (capacities and
competencies) to deliver the project in line with the formal requirements of the LIFE
Programme and stated goals is the first key factor of success. Internal financial
difficulties may cause premature end in a significant number of projects. In many
cases, the key partner (private subject) of the project responsible for co-financing of
the project ceased to exist leading to premature ending of the project. Several
beneficiaries (both AB and CB) proved not to be able to implement a LIFE project due
to their weak management skills, internal financial problems or lack of capacity or due
59
to inability to satisfy formal requirements of the LIFE Programme. Even projects with
promising “technical” results faced serious difficulties because of poor administration of the grant. Because a number of the project teams include a relatively high number
of partners, coordination of these partners proved to be an indicator of managerial
abilities of the project management team. A high number of partners also increases
the risk of conflicts related to the ownership of the project results after the end of the
project.
11. Motivation of the beneficiary: Capacity and skills of the project team comes in hand
with motivation of the beneficiary to develop a solution that is both sustainable and
replicable. In some cases, especially when co-financing from external public sources is
ensured, the motivation to bring a really sustainable and replicable solution cannot be
satisfactory.
12. Dissemination of results: Continuous dissemination of achieved or planned outputs of
the project proved to support the future sustainability and viability of the projects.
Postponing the dissemination activities to the end, or after the end of the LIFE project
raises the risk of a limited range of these activities due to the end of financial support
and thus limited capacities of the beneficiary. Especially it seems useful to utilize a
final user of the project outputs (usually a member of the project team AB or CB) to
spread information among potential adopters of the project results, as the user shares
similar characteristics as the potential adopters. As a typical example, a municipality
acting as an associated beneficiary adopts a new approach to treat communal waste
water, and then shares its experience with similar municipalities through established
communication channels. According to the TMOs and beneficiaries, dissemination of
the achieved project results in this way is very successful in comparison with standard
dissemination activities (conferences, websites etc.).
13. Stakeholder management: Involvement of a relevant stakeholder in the project is
crucial for its further sustainability and replicability. Especially in projects in which a
public body is the final user of the project outputs it is very important to grip their
attention and initiate mutual cooperation. Lack of cooperation / motivation for a
further use of the project outputs by a public body was one of the most frequent
causes for limited sustainability of LIFE projects during and after the end of financial
support.
14. Confidentiality: During the project, especially when the project is implemented by a
private company, confidentiality of specific data related to the company is one of the
most important factors limiting the replicability. It is the reason why the company does
not provide all of the necessary data for the potential adopter to assess the
attractiveness of the project.
15. Testing: Replicability of the project outputs depends heavily on the availability of
relevant tests, preferably in real conditions. A number of the analysed projects focused
on prototypes / technical solutions terminated even before relevant tests had been
completed, or the majority of tests were performed only in “laboratory conditions.”
Post-implementation phase
Based on the information from TMOs and beneficiaries, we identified the following factors
affecting the sustainability and replicability in the post- implementation phase of the project:
16. Available financial resources: Availability of both internal and external financial
sources is the crucial factor in ensuring the sustainability of the project outputs.
Beneficiaries from a public sector, NGOs, academic sector etc. depend to a large
60
extent on external financial sources mostly from the EU / national / regional subsidy
programmes. In this case, it is crucial to identify multiple possible sources of further
financial support and not be over-reliant on only one source / programme. The TMOs
reported that in many cases beneficiaries relied on the approval of follow-up projects
from the LIFE Programme but in fact their projects were not recommended for further
support. In these cases, the beneficiary usually terminated all activities related to the
project and sustainability of the project rapidly dropped to zero. The key reason for
termination of after LIFE activities is that the beneficiary is not able to sustain the team
necessary for continuation of the project activities due to lack of available financial
resources required for relatively high wages of the project team members.
17. Commercialization skills: In many cases (especially in the academic sphere), the
beneficiary and its partners do not intend to commercialize the final outputs from the
beginning even if there is a strong potential to do so because there is not such a strong
pressure on value for money as in the case of private companies. Especially in eastern
countries (but according to several beneficiaries and TMOs this applies for all EU
countries), commercialization of applied research is still not optimal in the academic
sector. Therefore, several promising projects are not sustainable or replicated into the
market.
External factors
External factors may affect the sustainability and replicability of a project across all its phases
(preparation, implementation and post-project). Based on the information from TMOs and
beneficiaries, we have identified the following external factors affecting the sustainability and
replicability of the projects:
A. Economic cycles: The economic crisis that affected almost all sectors was the key
global external factor, very frequently mentioned by the TMOs and beneficiaries. From
the TMOs perspective, the sustainability and replicability of projects was negatively
influenced especially in the sectors heavily affected by the crisis (e.g. construction).
Private investors usually decreased their willingness to finance new projects whilst
banks rethought their stance on providing loans. According to the respondents, the
negative impact of the crisis was very strong especially in the countries affected most
by the crisis (Southern region). On the other hand, several global factors played in
favour of selected projects. The project focused on currently relevant issues (water
scarcity, extreme weather – floods, drought etc.) became more sustainable /
replicable. A number of projects have very good results regarding the efficiency and
effectiveness of a current production process but replicability of the project results is
limited due to stagnating character of the selected economic sector. This proved to be
the key barrier to replicability in the textile industry.
B. Political and legal environment: The most frequent factors affecting the sustainability
and replicability of projects, both positively and negatively, are political and legal
issues. Many projects depend heavily on political will to adopt or further replicate the
project results (e.g. projects in water management, soil protection, waste
management, pollution sectors). As already stated before, involvement of relevant
public bodies into the preparation and implementation of the project is crucial. In a
number of cases, even if the right people from the relevant authorities were engaged
in the project from the very beginning, the project lost the support of the public body
due to a change of political establishment and subsequent change of the
political/strategic priorities of the relevant public body. In this case, it is necessary to
link the project to the EU strategies which tend to be more stable from the long-term
perspective rather than to the local/national strategies which are often subject to a
61
change. Changes in legislation were frequently cited by TMOs as a very important
factor. A number of projects reacted to planned changes of legislation (e.g. stricter
limits for water discharging, higher obligatory recycling quotas, reduction of emissions
etc.). Due to the complex character of the legislative process these changes are very
often not adopted in practice within the foreseen date. In this case project relying on
the legislative change have lover probability of sustainability and replicability (one of
the most frequent comment of TMOs was that the project can become
sustainable/replicable after the announced/planned legislation enters into force). Even
if the relevant legislation is in place and the project aims at enabling compliance with
this legislation, the lack of will/competencies to enforce the existing laws sometimes
favours cheaper solutions, which are not in line with the valid legislation. Sudden
changes in legislation can have devastating effect for implemented projects in cases in
which the proposed / developed solution was no longer in line with the new legislation
and the project lost its potential for sustainability.
C. Public procurement: Obligation of public entities to use the institute of public
procurement to acquire new technologies/approach/methodology etc. limits the
ability of a public entity to choose the preferred solution developed within the LIFE
Programme. Especially in eastern EU countries, it is problematic to choose a preferable
solution because the price is the key selection criterion used in public tenders (e.g. in
the Czech Republic, it is obligatory to use the price criterion for selected tenders
carried out by the Ministry of Environment with a minimal weight of 70%).
D. Market: In economy sectors in which market disruptions can be clearly identified
(strong negative lobby, monopoly etc.), efficiency and effectiveness of a project
solution do not necessarily ensure high probability of sustainability and replicability of
a project. Changes in both local as well as global markets can significantly affect the
sustainability and replicability of LIFE projects. TMOs and beneficiaries most often
cited a change in costs of the inputs / complements of the developed solution (energy
costs, raw material costs such as nickel etc.) as a significant factor. Due to the limited
information value of predictions of the inputs’ costs, negative impacts of this factor can be only partially eliminated. Another very frequent factor is the change of price of
the substitutes. A number of projects have very good results regarding the efficiency
and effectiveness of a current production process but replicability of the project
results is limited due to stagnating character of the selected economic sector. This
proved to be the key barrier to replicability in the textile industry.
E. Final user/customer: The final users play a significant role in the sustainability and
replicability of selected LIFE projects. A shift in the customer perception of individual
products is a crucial factor of competitiveness of the LIFE project outputs. The LIFE
projects often come up with innovative products (or innovative processes of
production) which are very often more costly than available substituents and the
added value lies in reduction of negative environmental impacts of the production. In
this case, it is crucial that a sufficient number of potential customers are willing to pay
an increased cost for the environment friendly approach of the producer. As the
length of the project usually exceeds 3.5 years, a significant risk of customer habits
change limits the predictability of competitiveness of LIFE projects outputs.
62
3.4 Robustness checks
As the first step to preserve robustness of the model, the decision on relevance of the possible
explanatory variables was made on the basis of both manual and automated stepwise
regression and economic reasoning. As the second step, further robustness checks were
employed to ensure that the model results are correct and reliable. The robustness checks
should confirm the estimated coefficients’ signs and the statistical significance.
Besides the variation of the explanatory variables’ list (via stepwise regression), a basic
Ordinary Least Squares regression (OLS) was estimated as a benchmark, and the Ordered Logit Model and the Poisson Regression were employed as well.
The Ordered Logit model works effectively in the same way as the Ordered Probit. The only
difference lies in the assumption of different type of distribution. The Ordered Logit assumes
the standard logistic distribution instead of the standard normal distribution, which is assumed
by the Ordered Probit model. Furthermore, we employed the Poisson Regression which
involves a non-negative Poisson distribution and the cardinal data. For detailed information on
the methodology see Section 1.5 Econometric analysis and modelling.
Although the robustness checks consist of various non-preferred model specifications (based
on the methodological reasoning), potential substantially different results obtained would
suggest an inconsistency and require further investigation. Nevertheless, this is not the case as
all additional estimations confirm the output of the preferred model specification as presented
in Tables 9, 10 and 11. There is no substantial inconsistency between the coefficients and their
statistical significance estimated by the different models.
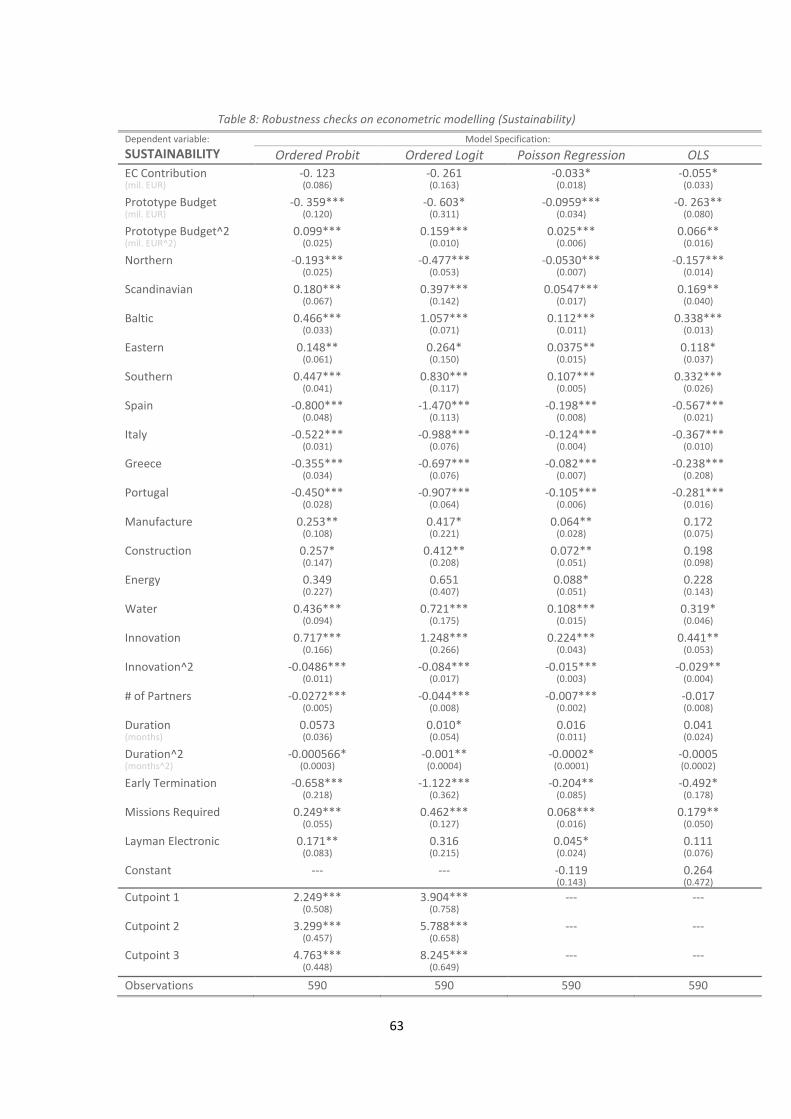
63
Table 8: Robustness checks on econometric modelling (Sustainability)
Dependent variable:
SUSTAINABILITY
Model Specification:
Ordered Probit Ordered Logit Poisson Regression OLS EC Contribution (mil. EUR)
-0. 123 (0.086)
-0. 261 (0.163)
-0.033* (0.018)
-0.055* (0.033)
Prototype Budget (mil. EUR)
-0. 359*** (0.120)
-0. 603* (0.311)
-0.0959*** (0.034)
-0. 263** (0.080)
Prototype Budget^2 (mil. EUR^2)
0.099*** (0.025)
0.159*** (0.010)
0.025*** (0.006)
0.066** (0.016)
Northern -0.193*** (0.025)
-0.477*** (0.053)
-0.0530*** (0.007)
-0.157*** (0.014)
Scandinavian 0.180*** (0.067)
0.397*** (0.142)
0.0547*** (0.017)
0.169** (0.040)
Baltic 0.466*** (0.033)
1.057*** (0.071)
0.112*** (0.011)
0.338*** (0.013)
Eastern 0.148** (0.061)
0.264* (0.150)
0.0375** (0.015)
0.118* (0.037)
Southern 0.447*** (0.041)
0.830*** (0.117)
0.107*** (0.005)
0.332*** (0.026)
Spain -0.800*** (0.048)
-1.470*** (0.113)
-0.198*** (0.008)
-0.567*** (0.021)
Italy -0.522*** (0.031)
-0.988*** (0.076)
-0.124*** (0.004)
-0.367*** (0.010)
Greece -0.355*** (0.034)
-0.697*** (0.076)
-0.082*** (0.007)
-0.238*** (0.208)
Portugal -0.450*** (0.028)
-0.907*** (0.064)
-0.105*** (0.006)
-0.281*** (0.016)
Manufacture 0.253** (0.108)
0.417* (0.221)
0.064** (0.028)
0.172 (0.075)
Construction 0.257* (0.147)
0.412** (0.208)
0.072** (0.051)
0.198 (0.098)
Energy 0.349 (0.227)
0.651 (0.407)
0.088* (0.051)
0.228 (0.143)
Water 0.436*** (0.094)
0.721*** (0.175)
0.108*** (0.015)
0.319* (0.046)
Innovation 0.717*** (0.166)
1.248*** (0.266)
0.224*** (0.043)
0.441** (0.053)
Innovation^2 -0.0486*** (0.011)
-0.084*** (0.017)
-0.015*** (0.003)
-0.029** (0.004)
# of Partners -0.0272*** (0.005)
-0.044*** (0.008)
-0.007*** (0.002)
-0.017 (0.008)
Duration (months)
0.0573 (0.036)
0.010* (0.054)
0.016 (0.011)
0.041 (0.024)
Duration^2 (months^2)
-0.000566* (0.0003)
-0.001** (0.0004)
-0.0002* (0.0001)
-0.0005 (0.0002)
Early Termination -0.658*** (0.218)
-1.122*** (0.362)
-0.204** (0.085)
-0.492* (0.178)
Missions Required 0.249*** (0.055)
0.462*** (0.127)
0.068*** (0.016)
0.179** (0.050)
Layman Electronic 0.171** (0.083)
0.316 (0.215)
0.045* (0.024)
0.111 (0.076)
Constant --- --- -0.119 (0.143)
0.264 (0.472)
Cutpoint 1 2.249*** (0.508)
3.904*** (0.758)
--- ---
Cutpoint 2 3.299*** (0.457)
5.788*** (0.658)
--- ---
Cutpoint 3 4.763*** (0.448)
8.245*** (0.649)
--- ---
Observations 590 590 590 590
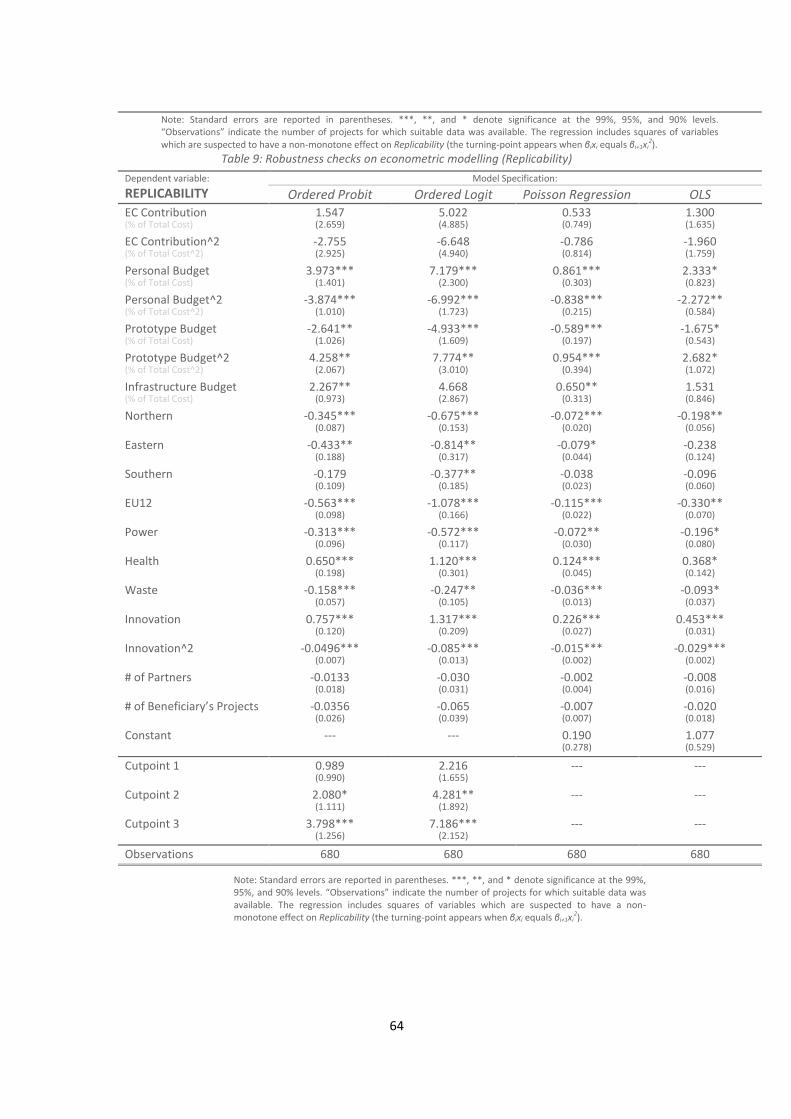
64
Note: Standard errors are reported in parentheses. ***, **, and * denote significance at the 99%, 95%, and 90% levels.
“Observations” indicate the number of projects for which suitable data was available. The regression includes squares of variables
which are suspected to have a non-monotone effect on Replicability (the turning-point appears when βixi equals βi+1xi2).
Table 9: Robustness checks on econometric modelling (Replicability)
Dependent variable:
REPLICABILITY
Model Specification:
Ordered Probit Ordered Logit Poisson Regression OLS EC Contribution (% of Total Cost)
1.547 (2.659)
5.022 (4.885)
0.533 (0.749)
1.300 (1.635)
EC Contribution^2 (% of Total Cost^2)
-2.755 (2.925)
-6.648 (4.940)
-0.786 (0.814)
-1.960 (1.759)
Personal Budget (% of Total Cost)
3.973*** (1.401)
7.179*** (2.300)
0.861*** (0.303)
2.333* (0.823)
Personal Budget^2 (% of Total Cost^2)
-3.874*** (1.010)
-6.992*** (1.723)
-0.838*** (0.215)
-2.272** (0.584)
Prototype Budget (% of Total Cost)
-2.641** (1.026)
-4.933*** (1.609)
-0.589*** (0.197)
-1.675* (0.543)
Prototype Budget^2 (% of Total Cost^2)
4.258** (2.067)
7.774** (3.010)
0.954*** (0.394)
2.682* (1.072)
Infrastructure Budget (% of Total Cost)
2.267** (0.973)
4.668 (2.867)
0.650** (0.313)
1.531 (0.846)
Northern -0.345*** (0.087)
-0.675*** (0.153)
-0.072*** (0.020)
-0.198** (0.056)
Eastern -0.433** (0.188)
-0.814** (0.317)
-0.079* (0.044)
-0.238 (0.124)
Southern -0.179 (0.109)
-0.377** (0.185)
-0.038 (0.023)
-0.096 (0.060)
EU12 -0.563*** (0.098)
-1.078*** (0.166)
-0.115*** (0.022)
-0.330** (0.070)
Power -0.313*** (0.096)
-0.572*** (0.117)
-0.072** (0.030)
-0.196* (0.080)
Health 0.650*** (0.198)
1.120*** (0.301)
0.124*** (0.045)
0.368* (0.142)
Waste -0.158*** (0.057)
-0.247** (0.105)
-0.036*** (0.013)
-0.093* (0.037)
Innovation 0.757*** (0.120)
1.317*** (0.209)
0.226*** (0.027)
0.453*** (0.031)
Innovation^2 -0.0496*** (0.007)
-0.085*** (0.013)
-0.015*** (0.002)
-0.029*** (0.002)
# of Partners -0.0133 (0.018)
-0.030 (0.031)
-0.002 (0.004)
-0.008 (0.016)
# of Beneficiary’s Projects -0.0356 (0.026)
-0.065 (0.039)
-0.007 (0.007)
-0.020 (0.018)
Constant --- --- 0.190 (0.278)
1.077 (0.529)
Cutpoint 1 0.989 (0.990)
2.216 (1.655)
--- ---
Cutpoint 2 2.080* (1.111)
4.281** (1.892)
--- ---
Cutpoint 3 3.798*** (1.256)
7.186*** (2.152)
--- ---
Observations 680 680 680 680
Note: Standard errors are reported in parentheses. ***, **, and * denote significance at the 99%,
95%, and 90% levels. “Observations” indicate the number of projects for which suitable data was
available. The regression includes squares of variables which are suspected to have a non-
monotone effect on Replicability (the turning-point appears when βixi equals βi+1xi2).
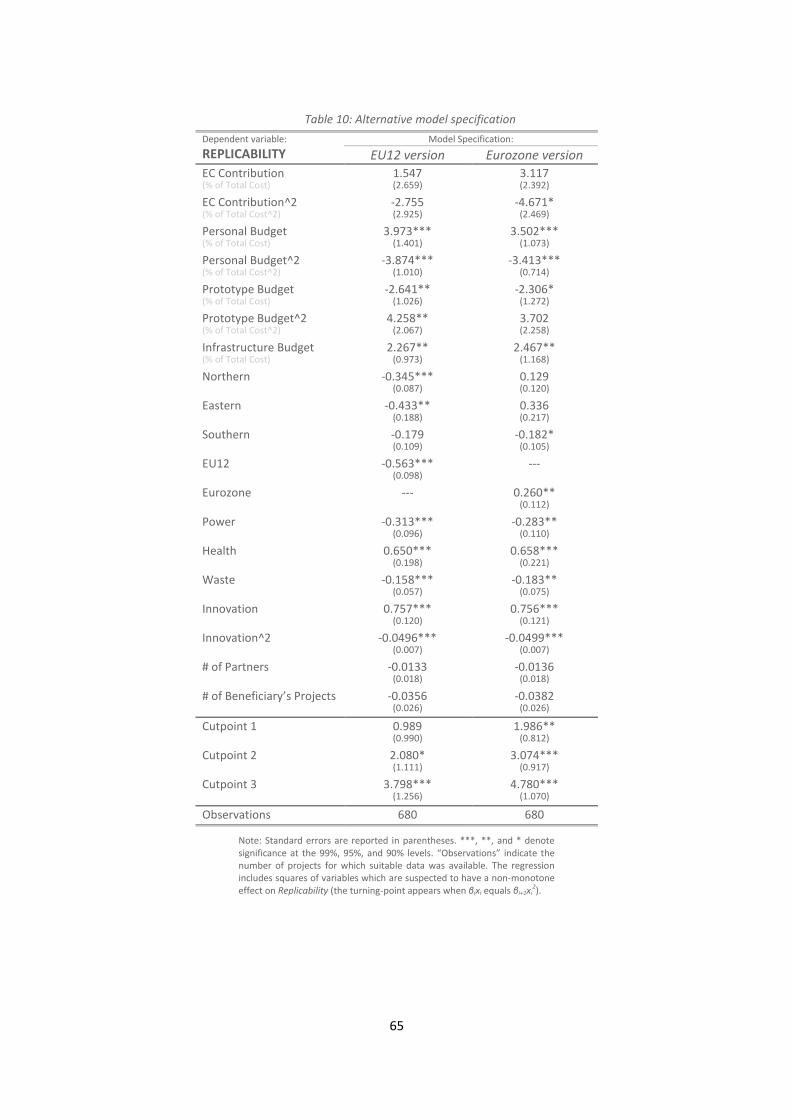
65
Table 10: Alternative model specification
Dependent variable:
REPLICABILITY
Model Specification:
EU12 version Eurozone version EC Contribution (% of Total Cost)
1.547 (2.659)
3.117 (2.392)
EC Contribution^2 (% of Total Cost^2)
-2.755 (2.925)
-4.671* (2.469)
Personal Budget (% of Total Cost)
3.973*** (1.401)
3.502*** (1.073)
Personal Budget^2 (% of Total Cost^2)
-3.874*** (1.010)
-3.413*** (0.714)
Prototype Budget (% of Total Cost)
-2.641** (1.026)
-2.306* (1.272)
Prototype Budget^2 (% of Total Cost^2)
4.258** (2.067)
3.702 (2.258)
Infrastructure Budget (% of Total Cost)
2.267** (0.973)
2.467** (1.168)
Northern -0.345*** (0.087)
0.129 (0.120)
Eastern -0.433** (0.188)
0.336 (0.217)
Southern -0.179 (0.109)
-0.182* (0.105)
EU12 -0.563*** (0.098)
---
Eurozone --- 0.260** (0.112)
Power -0.313*** (0.096)
-0.283** (0.110)
Health 0.650*** (0.198)
0.658*** (0.221)
Waste -0.158*** (0.057)
-0.183** (0.075)
Innovation 0.757*** (0.120)
0.756*** (0.121)
Innovation^2 -0.0496*** (0.007)
-0.0499*** (0.007)
# of Partners -0.0133 (0.018)
-0.0136 (0.018)
# of Beneficiary’s Projects -0.0356 (0.026)
-0.0382 (0.026)
Cutpoint 1 0.989 (0.990)
1.986** (0.812)
Cutpoint 2 2.080* (1.111)
3.074*** (0.917)
Cutpoint 3 3.798*** (1.256)
4.780*** (1.070)
Observations 680 680
Note: Standard errors are reported in parentheses. ***, **, and * denote
significance at the 99%, 95%, and 90% levels. “Observations” indicate the
number of projects for which suitable data was available. The regression
includes squares of variables which are suspected to have a non-monotone
effect on Replicability (the turning-point appears when βixi equals βi+1xi2).
66
Chapter 4: Cluster analysis
Cluster analysis consisting of individual case studies was conducted based on the information
gathered through the semi-structured interviews with individual beneficiaries. It serves as a
source of qualitative information validating the results obtained from the econometric
analysis.
In order to select appropriate projects, the cluster analysis was employed to create groups of
projects with similar characteristics. Subsequently, 20 projects representing the main groups of projects within the LIFE Programme were randomly sampled out of the clusters (one
project for each cluster). For more information on the methodology see Section 1.2.4. Cluster analysis. The goal of the case studies was to gather information on factors which (from the
beneficiary´s point of view) impact the sustainability and replicability and to identify the best
practice and lessons learned.
As explained in the Methodology chapter, clusters were distinguished by different project
categories (UN classification of economic activities and environmental activities) and
potentially further classified by the EC contribution scope (4 intervals by EUR 500 000).19
Other categories were also taken into account, which could possibly enter the clustering
process such as regions, duration, indication whether the beneficiary is inexperienced etc.
Nevertheless, any other classification splits the clusters into insufficiently small groups.
Moreover, some of them (such as the regional clusters which are composed primarily by South
cluster) are not meaningfully distributed. As the project categorization (in term of economic
and environmental activities) and the EC contribution scope are of our primary interest, we
employed the clustering based on these two characteristics.
Only the Wastewater management and Waste management sectors were further divided
based on the EC contribution classification as these two sector clusters contained a sufficiently
significant number of projects. We sampled out of two additional EC contribution clusters
within the Wastewater management cluster and out of four additional EC contribution clusters
within the Waste management cluster.
Unavailability of some of the projects for the case studies brought the final number of conducted case studies to 12. Some of the projects were already terminated without any
relevant and available contact information. The initial list of sampled case studies and the final
list of conducted case studies is portrayed in Table 11: List of sampled and conducted case
studies.
The cluster analysis served the evaluation team primarily to confirm the results of the econometric study. Furthermore, the outputs of the cluster analysis provided a qualitative complement to the quantitative part of the study (the why behind what). Together with the interviews, the results of the cluster analysis/case studies were a key source of information for the qualitative study in Section 4.3.
19
From EUR 0 to 500 000, from EUR 500 000 to 1 000 000, from EUR 1 000 000 to 1 500 000, and from EUR
1 500 000 and more.
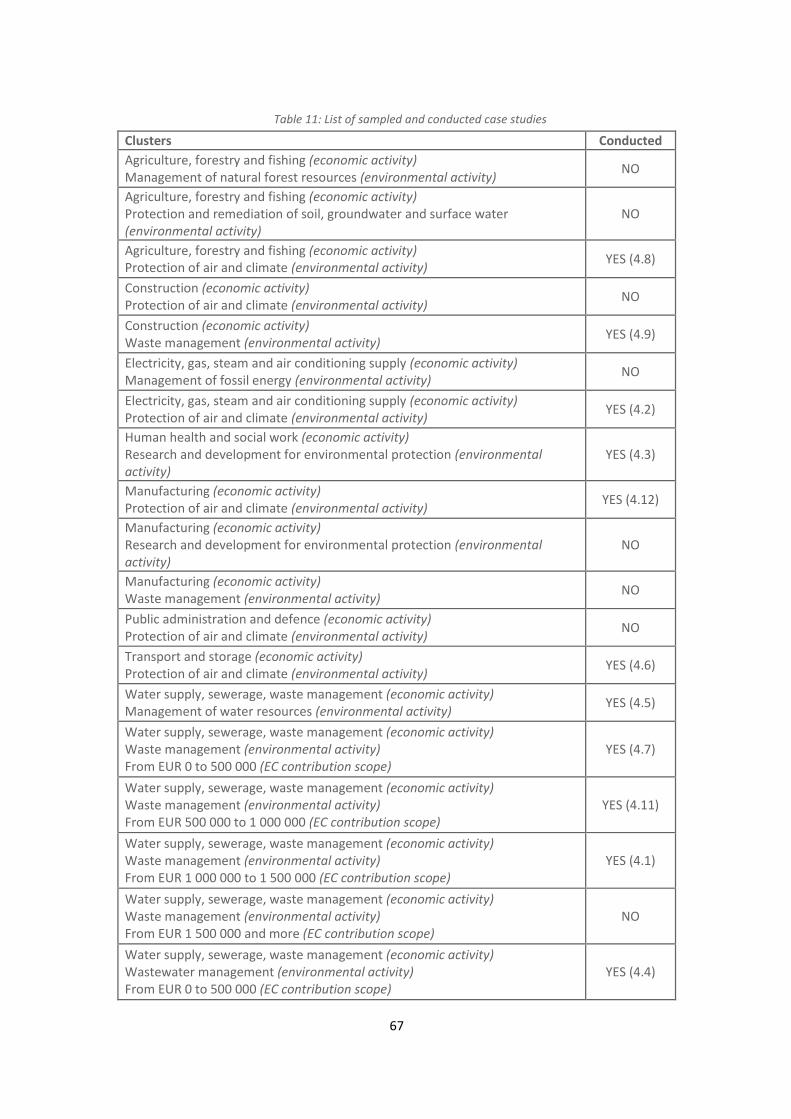
67
Table 11: List of sampled and conducted case studies
Clusters Conducted Agriculture, forestry and fishing (economic activity) Management of natural forest resources (environmental activity)
NO
Agriculture, forestry and fishing (economic activity) Protection and remediation of soil, groundwater and surface water (environmental activity)
NO
Agriculture, forestry and fishing (economic activity) Protection of air and climate (environmental activity)
YES (4.8)
Construction (economic activity) Protection of air and climate (environmental activity)
NO
Construction (economic activity) Waste management (environmental activity)
YES (4.9)
Electricity, gas, steam and air conditioning supply (economic activity) Management of fossil energy (environmental activity)
NO
Electricity, gas, steam and air conditioning supply (economic activity) Protection of air and climate (environmental activity)
YES (4.2)
Human health and social work (economic activity) Research and development for environmental protection (environmental activity)
YES (4.3)
Manufacturing (economic activity) Protection of air and climate (environmental activity)
YES (4.12)
Manufacturing (economic activity) Research and development for environmental protection (environmental activity)
NO
Manufacturing (economic activity) Waste management (environmental activity)
NO
Public administration and defence (economic activity) Protection of air and climate (environmental activity)
NO
Transport and storage (economic activity) Protection of air and climate (environmental activity)
YES (4.6)
Water supply, sewerage, waste management (economic activity) Management of water resources (environmental activity)
YES (4.5)
Water supply, sewerage, waste management (economic activity) Waste management (environmental activity) From EUR 0 to 500 000 (EC contribution scope)
YES (4.7)
Water supply, sewerage, waste management (economic activity) Waste management (environmental activity) From EUR 500 000 to 1 000 000 (EC contribution scope)
YES (4.11)
Water supply, sewerage, waste management (economic activity) Waste management (environmental activity) From EUR 1 000 000 to 1 500 000 (EC contribution scope)
YES (4.1)
Water supply, sewerage, waste management (economic activity) Waste management (environmental activity) From EUR 1 500 000 and more (EC contribution scope)
NO
Water supply, sewerage, waste management (economic activity) Wastewater management (environmental activity) From EUR 0 to 500 000 (EC contribution scope)
YES (4.4)

68
Water supply, sewerage, waste management (economic activity) Wastewater management (environmental activity) From EUR 500 000 to 1 000 000 (EC contribution scope)
YES (4.10)
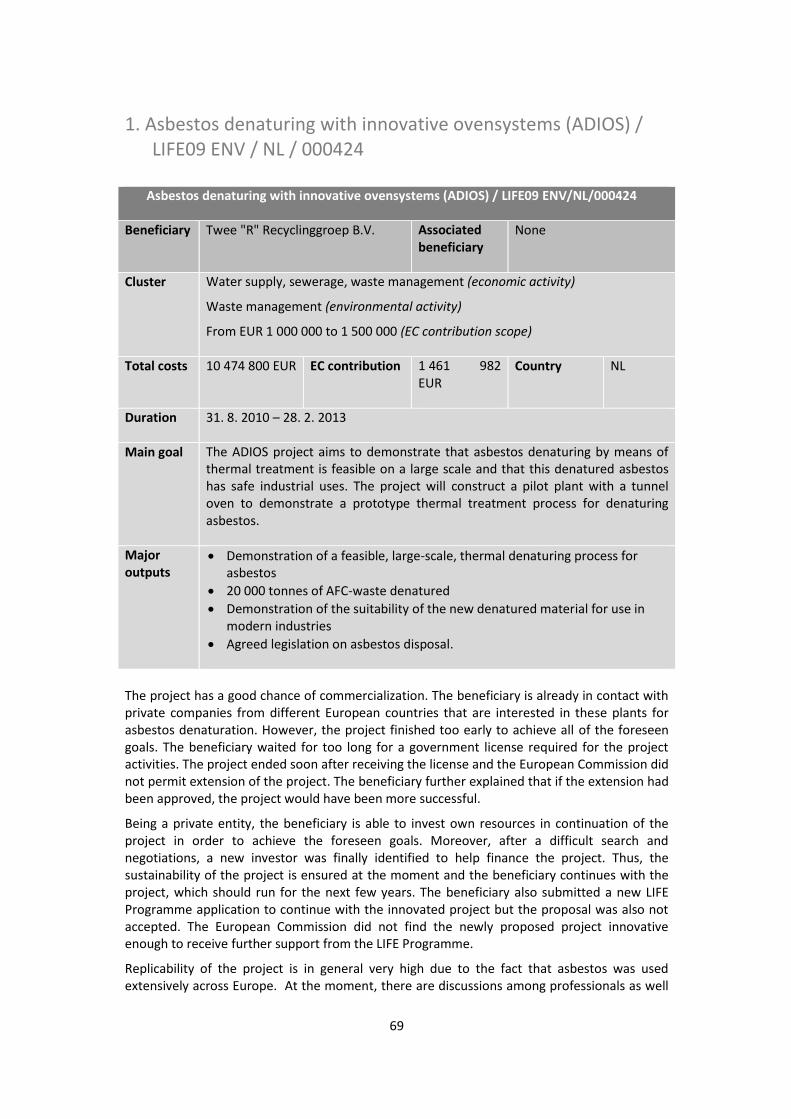
69
1. Asbestos denaturing with innovative ovensystems (ADIOS) /
LIFE09 ENV / NL / 000424
Asbestos denaturing with innovative ovensystems (ADIOS) / LIFE09 ENV/NL/000424
Beneficiary Twee "R" Recyclinggroep B.V. Associated beneficiary
None
Cluster Water supply, sewerage, waste management (economic activity)
Waste management (environmental activity)
From EUR 1 000 000 to 1 500 000 (EC contribution scope)
Total costs 10 474 800 EUR EC contribution 1 461 982
EUR
Country NL
Duration 31. 8. 2010 – 28. 2. 2013
Main goal The ADIOS project aims to demonstrate that asbestos denaturing by means of
thermal treatment is feasible on a large scale and that this denatured asbestos
has safe industrial uses. The project will construct a pilot plant with a tunnel
oven to demonstrate a prototype thermal treatment process for denaturing
asbestos.
Major outputs
x Demonstration of a feasible, large-scale, thermal denaturing process for
asbestos
x 20 000 tonnes of AFC-waste denatured
x Demonstration of the suitability of the new denatured material for use in
modern industries
x Agreed legislation on asbestos disposal.
The project has a good chance of commercialization. The beneficiary is already in contact with
private companies from different European countries that are interested in these plants for
asbestos denaturation. However, the project finished too early to achieve all of the foreseen
goals. The beneficiary waited for too long for a government license required for the project
activities. The project ended soon after receiving the license and the European Commission did
not permit extension of the project. The beneficiary further explained that if the extension had
been approved, the project would have been more successful.
Being a private entity, the beneficiary is able to invest own resources in continuation of the
project in order to achieve the foreseen goals. Moreover, after a difficult search and
negotiations, a new investor was finally identified to help finance the project. Thus, the
sustainability of the project is ensured at the moment and the beneficiary continues with the
project, which should run for the next few years. The beneficiary also submitted a new LIFE
Programme application to continue with the innovated project but the proposal was also not
accepted. The European Commission did not find the newly proposed project innovative
enough to receive further support from the LIFE Programme.
Replicability of the project is in general very high due to the fact that asbestos was used
extensively across Europe. At the moment, there are discussions among professionals as well
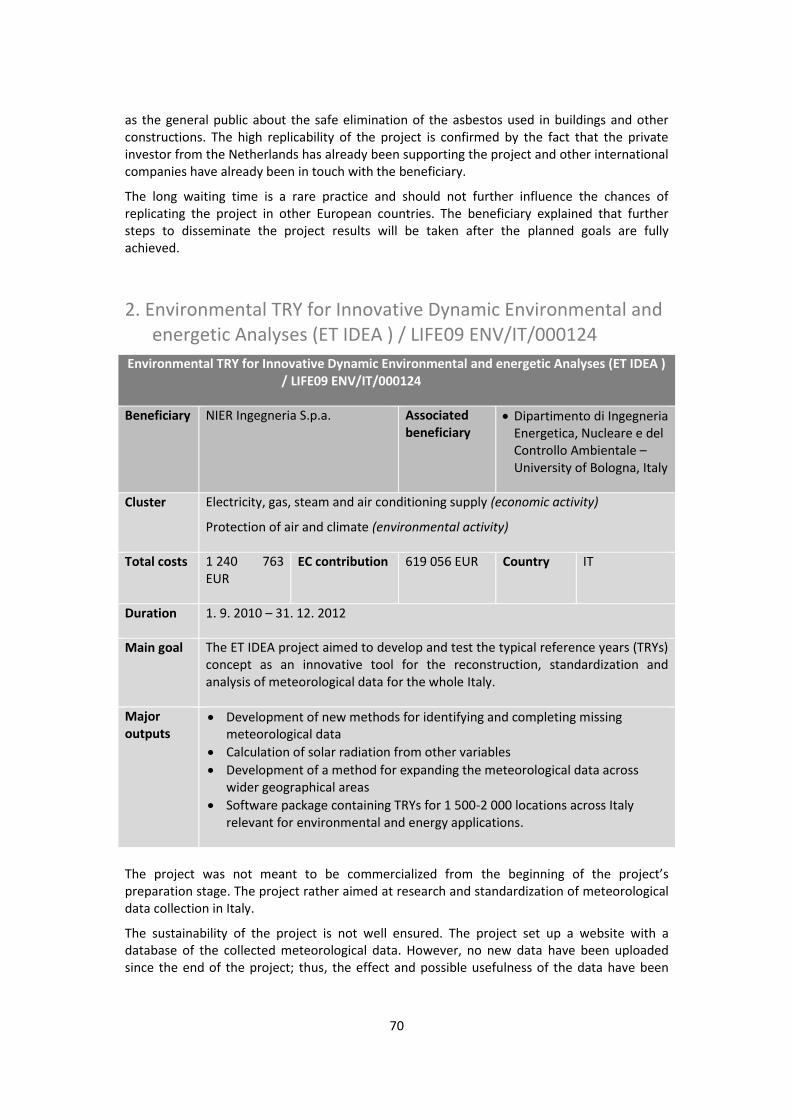
70
as the general public about the safe elimination of the asbestos used in buildings and other
constructions. The high replicability of the project is confirmed by the fact that the private
investor from the Netherlands has already been supporting the project and other international
companies have already been in touch with the beneficiary.
The long waiting time is a rare practice and should not further influence the chances of
replicating the project in other European countries. The beneficiary explained that further
steps to disseminate the project results will be taken after the planned goals are fully
achieved.
2. Environmental TRY for Innovative Dynamic Environmental and
energetic Analyses (ET IDEA ) / LIFE09 ENV/IT/000124
Environmental TRY for Innovative Dynamic Environmental and energetic Analyses (ET IDEA ) / LIFE09 ENV/IT/000124
Beneficiary NIER Ingegneria S.p.a. Associated beneficiary
x Dipartimento di Ingegneria
Energetica, Nucleare e del
Controllo Ambientale –
University of Bologna, Italy
Cluster Electricity, gas, steam and air conditioning supply (economic activity)
Protection of air and climate (environmental activity)
Total costs 1 240 763
EUR
EC contribution 619 056 EUR Country IT
Duration 1. 9. 2010 – 31. 12. 2012
Main goal The ET IDEA project aimed to develop and test the typical reference years (TRYs)
concept as an innovative tool for the reconstruction, standardization and
analysis of meteorological data for the whole Italy.
Major outputs
x Development of new methods for identifying and completing missing
meteorological data
x Calculation of solar radiation from other variables
x Development of a method for expanding the meteorological data across
wider geographical areas
x Software package containing TRYs for 1 500-2 000 locations across Italy
relevant for environmental and energy applications.
The project was not meant to be commercialized from the beginning of the project’s preparation stage. The project rather aimed at research and standardization of meteorological
data collection in Italy.
The sustainability of the project is not well ensured. The project set up a website with a
database of the collected meteorological data. However, no new data have been uploaded
since the end of the project; thus, the effect and possible usefulness of the data have been
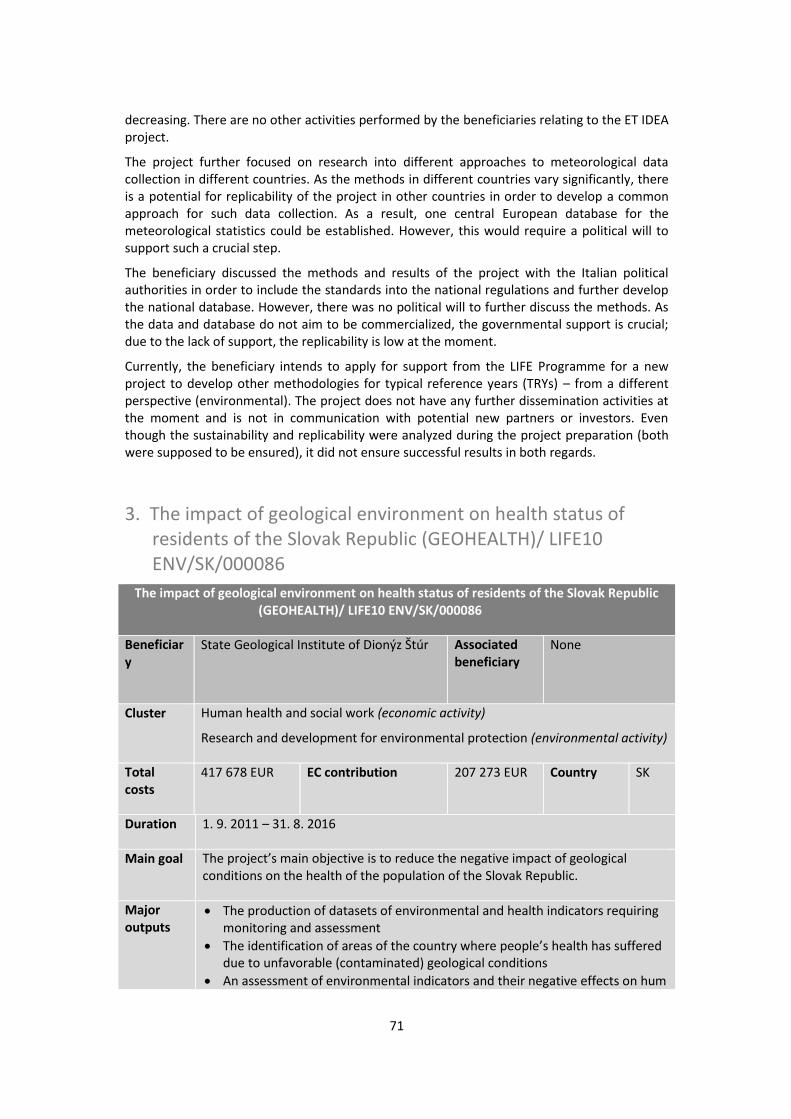
71
decreasing. There are no other activities performed by the beneficiaries relating to the ET IDEA
project.
The project further focused on research into different approaches to meteorological data
collection in different countries. As the methods in different countries vary significantly, there
is a potential for replicability of the project in other countries in order to develop a common
approach for such data collection. As a result, one central European database for the
meteorological statistics could be established. However, this would require a political will to
support such a crucial step.
The beneficiary discussed the methods and results of the project with the Italian political
authorities in order to include the standards into the national regulations and further develop
the national database. However, there was no political will to further discuss the methods. As
the data and database do not aim to be commercialized, the governmental support is crucial;
due to the lack of support, the replicability is low at the moment.
Currently, the beneficiary intends to apply for support from the LIFE Programme for a new
project to develop other methodologies for typical reference years (TRYs) – from a different
perspective (environmental). The project does not have any further dissemination activities at
the moment and is not in communication with potential new partners or investors. Even
though the sustainability and replicability were analyzed during the project preparation (both
were supposed to be ensured), it did not ensure successful results in both regards.
3. The impact of geological environment on health status of
residents of the Slovak Republic (GEOHEALTH)/ LIFE10
ENV/SK/000086
The impact of geological environment on health status of residents of the Slovak Republic (GEOHEALTH)/ LIFE10 ENV/SK/000086
Beneficiary
State Geological Institute of Dionýz Štúr
Associated beneficiary
None
Cluster Human health and social work (economic activity)
Research and development for environmental protection (environmental activity)
Total costs
417 678 EUR EC contribution 207 273 EUR Country SK
Duration 1. 9. 2011 – 31. 8. 2016
Main goal The project’s main objective is to reduce the negative impact of geological
conditions on the health of the population of the Slovak Republic.
Major outputs
x The production of datasets of environmental and health indicators requiring
monitoring and assessment
x The identification of areas of the country where people’s health has suffered
due to unfavorable (contaminated) geological conditions
x An assessment of environmental indicators and their negative effects on hum
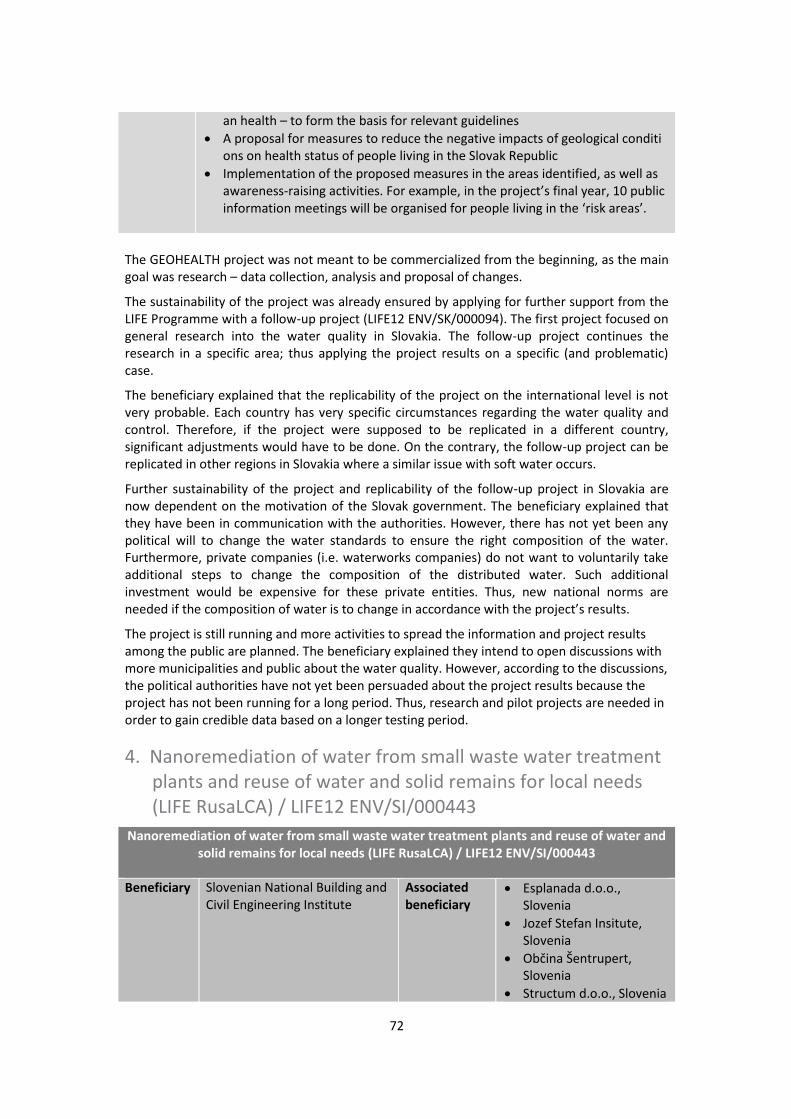
72
an health – to form the basis for relevant guidelines
x A proposal for measures to reduce the negative impacts of geological conditi
ons on health status of people living in the Slovak Republic
x Implementation of the proposed measures in the areas identified, as well as
awareness-raising activities. For example, in the project’s final year, 10 public
information meetings will be organised for people living in the ‘risk areas’.
The GEOHEALTH project was not meant to be commercialized from the beginning, as the main
goal was research – data collection, analysis and proposal of changes.
The sustainability of the project was already ensured by applying for further support from the
LIFE Programme with a follow-up project (LIFE12 ENV/SK/000094). The first project focused on
general research into the water quality in Slovakia. The follow-up project continues the
research in a specific area; thus applying the project results on a specific (and problematic)
case.
The beneficiary explained that the replicability of the project on the international level is not
very probable. Each country has very specific circumstances regarding the water quality and
control. Therefore, if the project were supposed to be replicated in a different country,
significant adjustments would have to be done. On the contrary, the follow-up project can be
replicated in other regions in Slovakia where a similar issue with soft water occurs.
Further sustainability of the project and replicability of the follow-up project in Slovakia are
now dependent on the motivation of the Slovak government. The beneficiary explained that
they have been in communication with the authorities. However, there has not yet been any
political will to change the water standards to ensure the right composition of the water.
Furthermore, private companies (i.e. waterworks companies) do not want to voluntarily take
additional steps to change the composition of the distributed water. Such additional
investment would be expensive for these private entities. Thus, new national norms are
needed if the composition of water is to change in accordance with the project’s results.
The project is still running and more activities to spread the information and project results
among the public are planned. The beneficiary explained they intend to open discussions with
more municipalities and public about the water quality. However, according to the discussions,
the political authorities have not yet been persuaded about the project results because the
project has not been running for a long period. Thus, research and pilot projects are needed in
order to gain credible data based on a longer testing period.
4. Nanoremediation of water from small waste water treatment
plants and reuse of water and solid remains for local needs
(LIFE RusaLCA) / LIFE12 ENV/SI/000443
Nanoremediation of water from small waste water treatment plants and reuse of water and solid remains for local needs (LIFE RusaLCA) / LIFE12 ENV/SI/000443
Beneficiary Slovenian National Building and
Civil Engineering Institute
Associated beneficiary
x Esplanada d.o.o.,
Slovenia
x Jozef Stefan Insitute,
Slovenia
x Občina Šentrupert, Slovenia
x Structum d.o.o., Slovenia
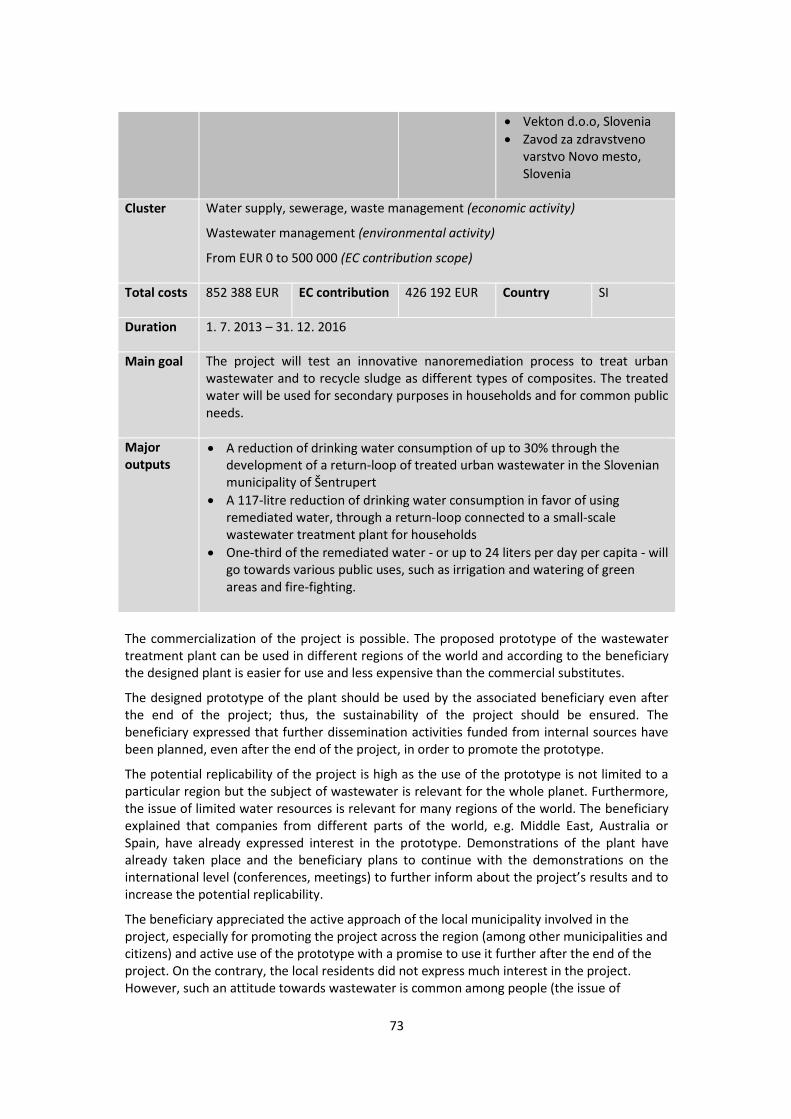
73
x Vekton d.o.o, Slovenia
x Zavod za zdravstveno
varstvo Novo mesto,
Slovenia
Cluster Water supply, sewerage, waste management (economic activity)
Wastewater management (environmental activity)
From EUR 0 to 500 000 (EC contribution scope)
Total costs 852 388 EUR EC contribution 426 192 EUR Country SI
Duration 1. 7. 2013 – 31. 12. 2016
Main goal The project will test an innovative nanoremediation process to treat urban
wastewater and to recycle sludge as different types of composites. The treated
water will be used for secondary purposes in households and for common public
needs.
Major outputs
x A reduction of drinking water consumption of up to 30% through the
development of a return-loop of treated urban wastewater in the Slovenian
municipality of Šentrupert x A 117-litre reduction of drinking water consumption in favor of using
remediated water, through a return-loop connected to a small-scale
wastewater treatment plant for households
x One-third of the remediated water - or up to 24 liters per day per capita - will
go towards various public uses, such as irrigation and watering of green
areas and fire-fighting.
The commercialization of the project is possible. The proposed prototype of the wastewater
treatment plant can be used in different regions of the world and according to the beneficiary
the designed plant is easier for use and less expensive than the commercial substitutes.
The designed prototype of the plant should be used by the associated beneficiary even after
the end of the project; thus, the sustainability of the project should be ensured. The
beneficiary expressed that further dissemination activities funded from internal sources have
been planned, even after the end of the project, in order to promote the prototype.
The potential replicability of the project is high as the use of the prototype is not limited to a
particular region but the subject of wastewater is relevant for the whole planet. Furthermore,
the issue of limited water resources is relevant for many regions of the world. The beneficiary
explained that companies from different parts of the world, e.g. Middle East, Australia or
Spain, have already expressed interest in the prototype. Demonstrations of the plant have
already taken place and the beneficiary plans to continue with the demonstrations on the
international level (conferences, meetings) to further inform about the project’s results and to increase the potential replicability.
The beneficiary appreciated the active approach of the local municipality involved in the
project, especially for promoting the project across the region (among other municipalities and
citizens) and active use of the prototype with a promise to use it further after the end of the
project. On the contrary, the local residents did not express much interest in the project.
However, such an attitude towards wastewater is common among people (the issue of
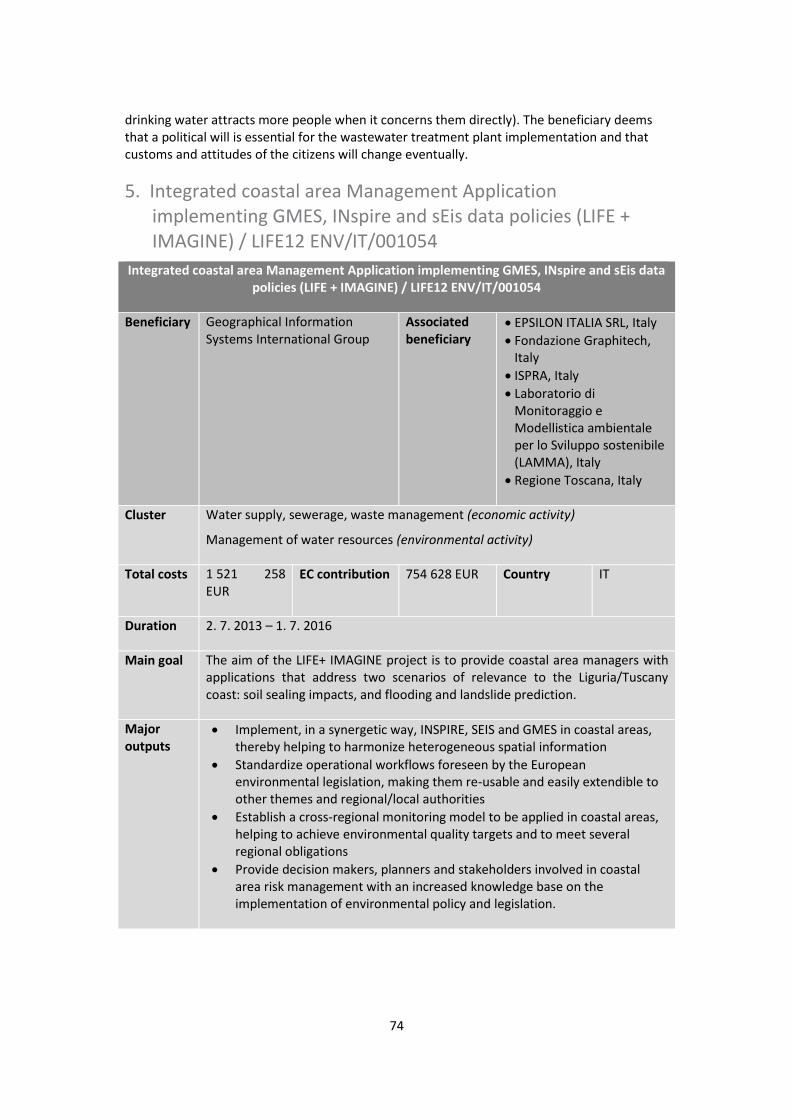
74
drinking water attracts more people when it concerns them directly). The beneficiary deems
that a political will is essential for the wastewater treatment plant implementation and that
customs and attitudes of the citizens will change eventually.
5. Integrated coastal area Management Application
implementing GMES, INspire and sEis data policies (LIFE +
IMAGINE) / LIFE12 ENV/IT/001054
Integrated coastal area Management Application implementing GMES, INspire and sEis data policies (LIFE + IMAGINE) / LIFE12 ENV/IT/001054
Beneficiary Geographical Information
Systems International Group
Associated beneficiary
x EPSILON ITALIA SRL, Italy
x Fondazione Graphitech,
Italy
x ISPRA, Italy
x Laboratorio di
Monitoraggio e
Modellistica ambientale
per lo Sviluppo sostenibile
(LAMMA), Italy
x Regione Toscana, Italy
Cluster Water supply, sewerage, waste management (economic activity)
Management of water resources (environmental activity)
Total costs 1 521 258
EUR
EC contribution 754 628 EUR Country IT
Duration 2. 7. 2013 – 1. 7. 2016
Main goal The aim of the LIFE+ IMAGINE project is to provide coastal area managers with
applications that address two scenarios of relevance to the Liguria/Tuscany
coast: soil sealing impacts, and flooding and landslide prediction.
Major outputs
x Implement, in a synergetic way, INSPIRE, SEIS and GMES in coastal areas,
thereby helping to harmonize heterogeneous spatial information
x Standardize operational workflows foreseen by the European
environmental legislation, making them re-usable and easily extendible to
other themes and regional/local authorities
x Establish a cross-regional monitoring model to be applied in coastal areas,
helping to achieve environmental quality targets and to meet several
regional obligations
x Provide decision makers, planners and stakeholders involved in coastal
area risk management with an increased knowledge base on the
implementation of environmental policy and legislation.
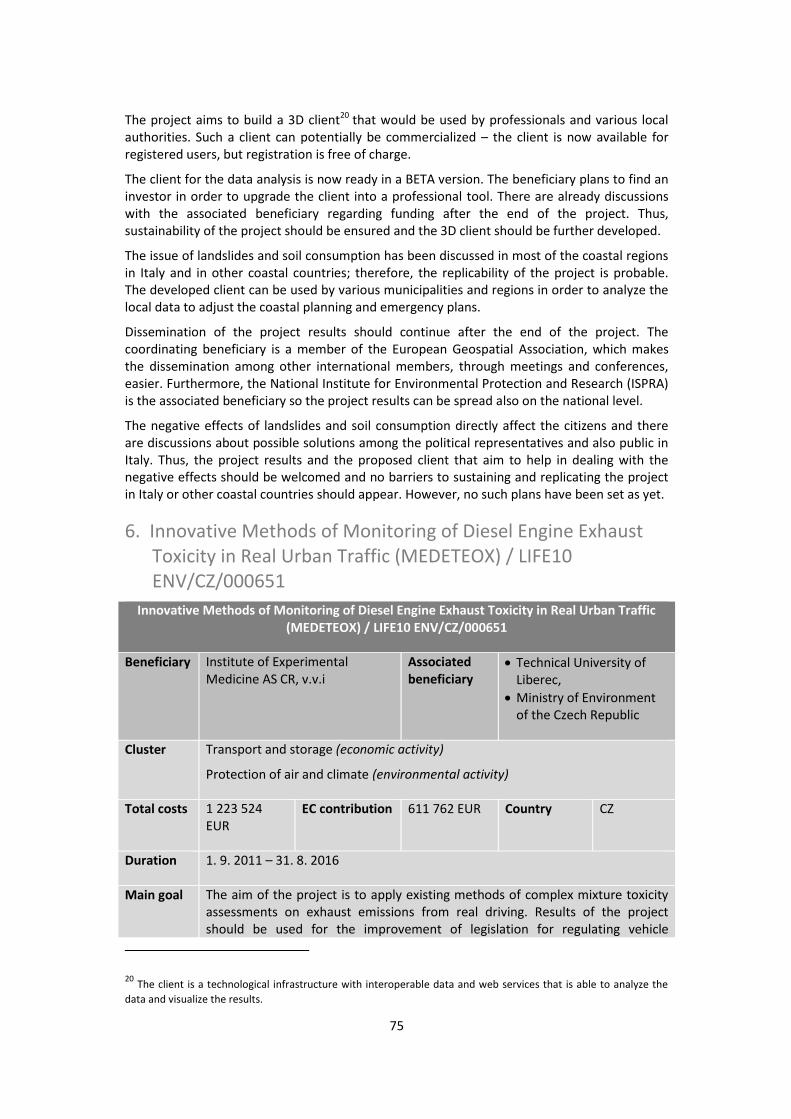
75
The project aims to build a 3D client20
that would be used by professionals and various local
authorities. Such a client can potentially be commercialized – the client is now available for
registered users, but registration is free of charge.
The client for the data analysis is now ready in a BETA version. The beneficiary plans to find an
investor in order to upgrade the client into a professional tool. There are already discussions
with the associated beneficiary regarding funding after the end of the project. Thus,
sustainability of the project should be ensured and the 3D client should be further developed.
The issue of landslides and soil consumption has been discussed in most of the coastal regions
in Italy and in other coastal countries; therefore, the replicability of the project is probable.
The developed client can be used by various municipalities and regions in order to analyze the
local data to adjust the coastal planning and emergency plans.
Dissemination of the project results should continue after the end of the project. The
coordinating beneficiary is a member of the European Geospatial Association, which makes
the dissemination among other international members, through meetings and conferences,
easier. Furthermore, the National Institute for Environmental Protection and Research (ISPRA)
is the associated beneficiary so the project results can be spread also on the national level.
The negative effects of landslides and soil consumption directly affect the citizens and there
are discussions about possible solutions among the political representatives and also public in
Italy. Thus, the project results and the proposed client that aim to help in dealing with the
negative effects should be welcomed and no barriers to sustaining and replicating the project
in Italy or other coastal countries should appear. However, no such plans have been set as yet.
6. Innovative Methods of Monitoring of Diesel Engine Exhaust
Toxicity in Real Urban Traffic (MEDETEOX) / LIFE10
ENV/CZ/000651
Innovative Methods of Monitoring of Diesel Engine Exhaust Toxicity in Real Urban Traffic (MEDETEOX) / LIFE10 ENV/CZ/000651
Beneficiary Institute of Experimental
Medicine AS CR, v.v.i
Associated beneficiary
x Technical University of
Liberec,
x Ministry of Environment
of the Czech Republic
Cluster Transport and storage (economic activity)
Protection of air and climate (environmental activity)
Total costs 1 223 524
EUR
EC contribution 611 762 EUR Country CZ
Duration 1. 9. 2011 – 31. 8. 2016
Main goal The aim of the project is to apply existing methods of complex mixture toxicity
assessments on exhaust emissions from real driving. Results of the project
should be used for the improvement of legislation for regulating vehicle
20
The client is a technological infrastructure with interoperable data and web services that is able to analyze the
data and visualize the results.
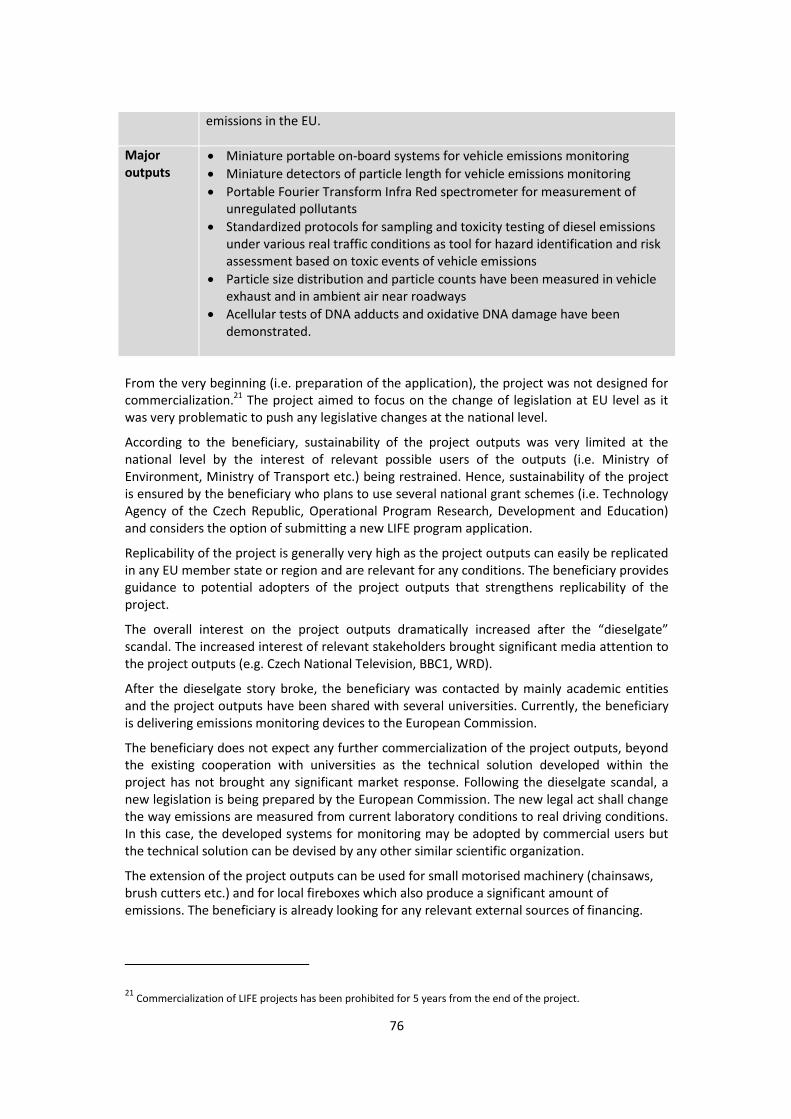
76
emissions in the EU.
Major outputs
x Miniature portable on-board systems for vehicle emissions monitoring
x Miniature detectors of particle length for vehicle emissions monitoring
x Portable Fourier Transform Infra Red spectrometer for measurement of
unregulated pollutants
x Standardized protocols for sampling and toxicity testing of diesel emissions
under various real traffic conditions as tool for hazard identification and risk
assessment based on toxic events of vehicle emissions
x Particle size distribution and particle counts have been measured in vehicle
exhaust and in ambient air near roadways
x Acellular tests of DNA adducts and oxidative DNA damage have been
demonstrated.
From the very beginning (i.e. preparation of the application), the project was not designed for
commercialization.21
The project aimed to focus on the change of legislation at EU level as it
was very problematic to push any legislative changes at the national level.
According to the beneficiary, sustainability of the project outputs was very limited at the
national level by the interest of relevant possible users of the outputs (i.e. Ministry of
Environment, Ministry of Transport etc.) being restrained. Hence, sustainability of the project
is ensured by the beneficiary who plans to use several national grant schemes (i.e. Technology
Agency of the Czech Republic, Operational Program Research, Development and Education)
and considers the option of submitting a new LIFE program application.
Replicability of the project is generally very high as the project outputs can easily be replicated
in any EU member state or region and are relevant for any conditions. The beneficiary provides
guidance to potential adopters of the project outputs that strengthens replicability of the
project.
The overall interest on the project outputs dramatically increased after the “dieselgate” scandal. The increased interest of relevant stakeholders brought significant media attention to
the project outputs (e.g. Czech National Television, BBC1, WRD).
After the dieselgate story broke, the beneficiary was contacted by mainly academic entities
and the project outputs have been shared with several universities. Currently, the beneficiary
is delivering emissions monitoring devices to the European Commission.
The beneficiary does not expect any further commercialization of the project outputs, beyond
the existing cooperation with universities as the technical solution developed within the
project has not brought any significant market response. Following the dieselgate scandal, a
new legislation is being prepared by the European Commission. The new legal act shall change
the way emissions are measured from current laboratory conditions to real driving conditions.
In this case, the developed systems for monitoring may be adopted by commercial users but
the technical solution can be devised by any other similar scientific organization.
The extension of the project outputs can be used for small motorised machinery (chainsaws,
brush cutters etc.) and for local fireboxes which also produce a significant amount of
emissions. The beneficiary is already looking for any relevant external sources of financing.
21
Commercialization of LIFE projects has been prohibited for 5 years from the end of the project.
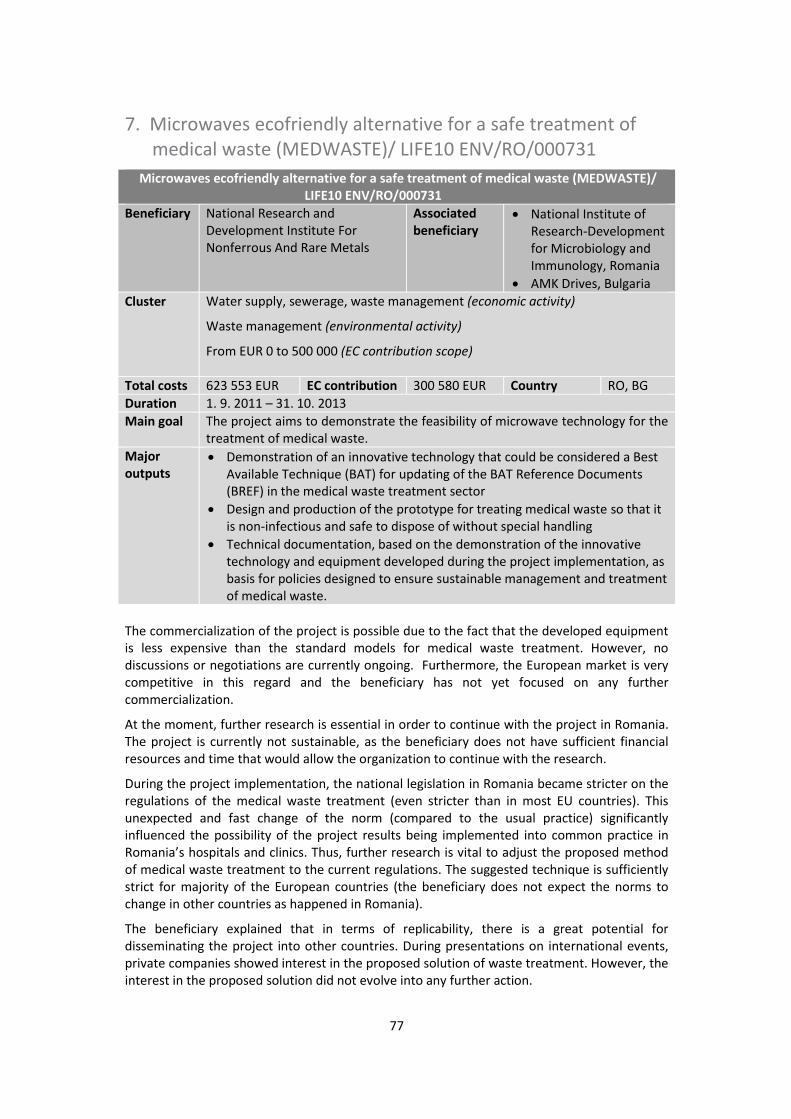
77
7. Microwaves ecofriendly alternative for a safe treatment of
medical waste (MEDWASTE)/ LIFE10 ENV/RO/000731
Microwaves ecofriendly alternative for a safe treatment of medical waste (MEDWASTE)/ LIFE10 ENV/RO/000731
Beneficiary National Research and
Development Institute For
Nonferrous And Rare Metals
Associated beneficiary
x National Institute of
Research-Development
for Microbiology and
Immunology, Romania
x AMK Drives, Bulgaria
Cluster Water supply, sewerage, waste management (economic activity)
Waste management (environmental activity)
From EUR 0 to 500 000 (EC contribution scope)
Total costs 623 553 EUR EC contribution 300 580 EUR Country RO, BG
Duration 1. 9. 2011 – 31. 10. 2013
Main goal The project aims to demonstrate the feasibility of microwave technology for the
treatment of medical waste.
Major outputs
x Demonstration of an innovative technology that could be considered a Best
Available Technique (BAT) for updating of the BAT Reference Documents
(BREF) in the medical waste treatment sector
x Design and production of the prototype for treating medical waste so that it
is non-infectious and safe to dispose of without special handling
x Technical documentation, based on the demonstration of the innovative
technology and equipment developed during the project implementation, as
basis for policies designed to ensure sustainable management and treatment
of medical waste.
The commercialization of the project is possible due to the fact that the developed equipment
is less expensive than the standard models for medical waste treatment. However, no
discussions or negotiations are currently ongoing. Furthermore, the European market is very
competitive in this regard and the beneficiary has not yet focused on any further
commercialization.
At the moment, further research is essential in order to continue with the project in Romania.
The project is currently not sustainable, as the beneficiary does not have sufficient financial
resources and time that would allow the organization to continue with the research.
During the project implementation, the national legislation in Romania became stricter on the
regulations of the medical waste treatment (even stricter than in most EU countries). This
unexpected and fast change of the norm (compared to the usual practice) significantly
influenced the possibility of the project results being implemented into common practice in
Romania’s hospitals and clinics. Thus, further research is vital to adjust the proposed method of medical waste treatment to the current regulations. The suggested technique is sufficiently
strict for majority of the European countries (the beneficiary does not expect the norms to
change in other countries as happened in Romania).
The beneficiary explained that in terms of replicability, there is a great potential for
disseminating the project into other countries. During presentations on international events,
private companies showed interest in the proposed solution of waste treatment. However, the
interest in the proposed solution did not evolve into any further action.
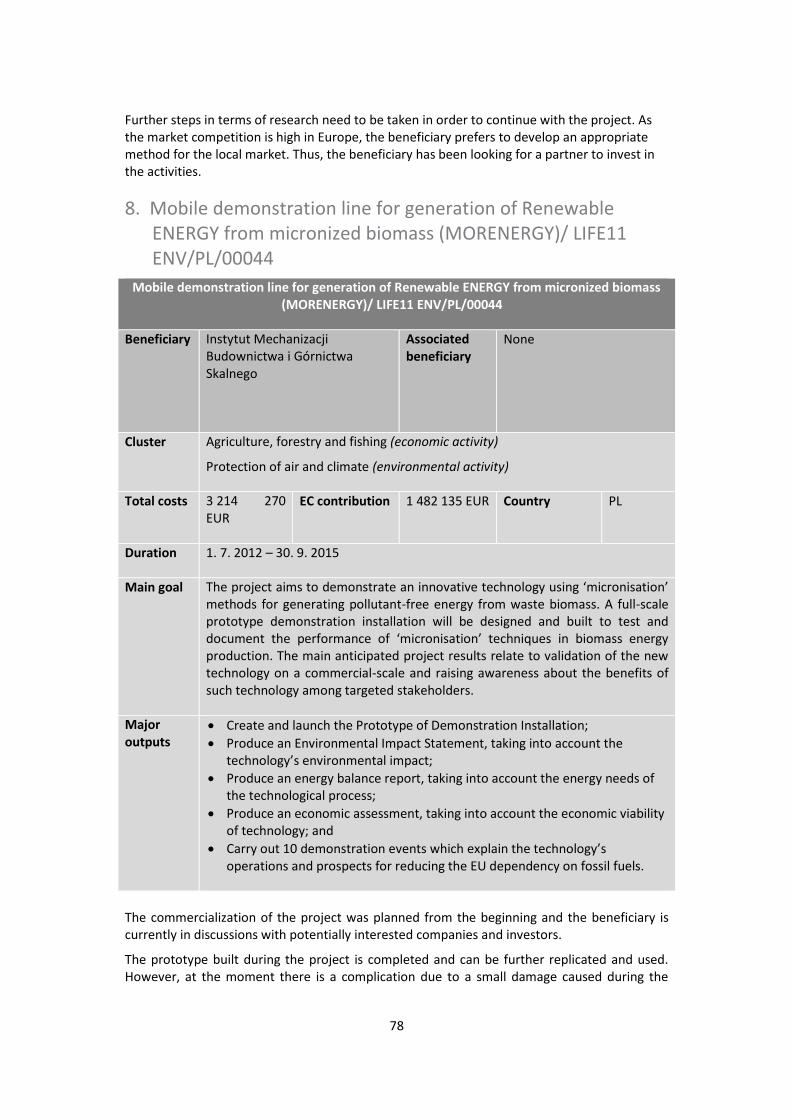
78
Further steps in terms of research need to be taken in order to continue with the project. As
the market competition is high in Europe, the beneficiary prefers to develop an appropriate
method for the local market. Thus, the beneficiary has been looking for a partner to invest in
the activities.
8. Mobile demonstration line for generation of Renewable
ENERGY from micronized biomass (MORENERGY)/ LIFE11
ENV/PL/00044
Mobile demonstration line for generation of Renewable ENERGY from micronized biomass (MORENERGY)/ LIFE11 ENV/PL/00044
Beneficiary Instytut Mechanizacji
Budownictwa i Górnictwa
Skalnego
Associated beneficiary
None
Cluster Agriculture, forestry and fishing (economic activity)
Protection of air and climate (environmental activity)
Total costs 3 214 270
EUR
EC contribution 1 482 135 EUR Country PL
Duration 1. 7. 2012 – 30. 9. 2015
Main goal The project aims to demonstrate an innovative technology using ‘micronisation’ methods for generating pollutant-free energy from waste biomass. A full-scale
prototype demonstration installation will be designed and built to test and
document the performance of ‘micronisation’ techniques in biomass energy production. The main anticipated project results relate to validation of the new
technology on a commercial-scale and raising awareness about the benefits of
such technology among targeted stakeholders.
Major outputs
x Create and launch the Prototype of Demonstration Installation;
x Produce an Environmental Impact Statement, taking into account the
technology’s environmental impact;
x Produce an energy balance report, taking into account the energy needs of
the technological process;
x Produce an economic assessment, taking into account the economic viability
of technology; and
x Carry out 10 demonstration events which explain the technology’s operations and prospects for reducing the EU dependency on fossil fuels.
The commercialization of the project was planned from the beginning and the beneficiary is
currently in discussions with potentially interested companies and investors.
The prototype built during the project is completed and can be further replicated and used.
However, at the moment there is a complication due to a small damage caused during the
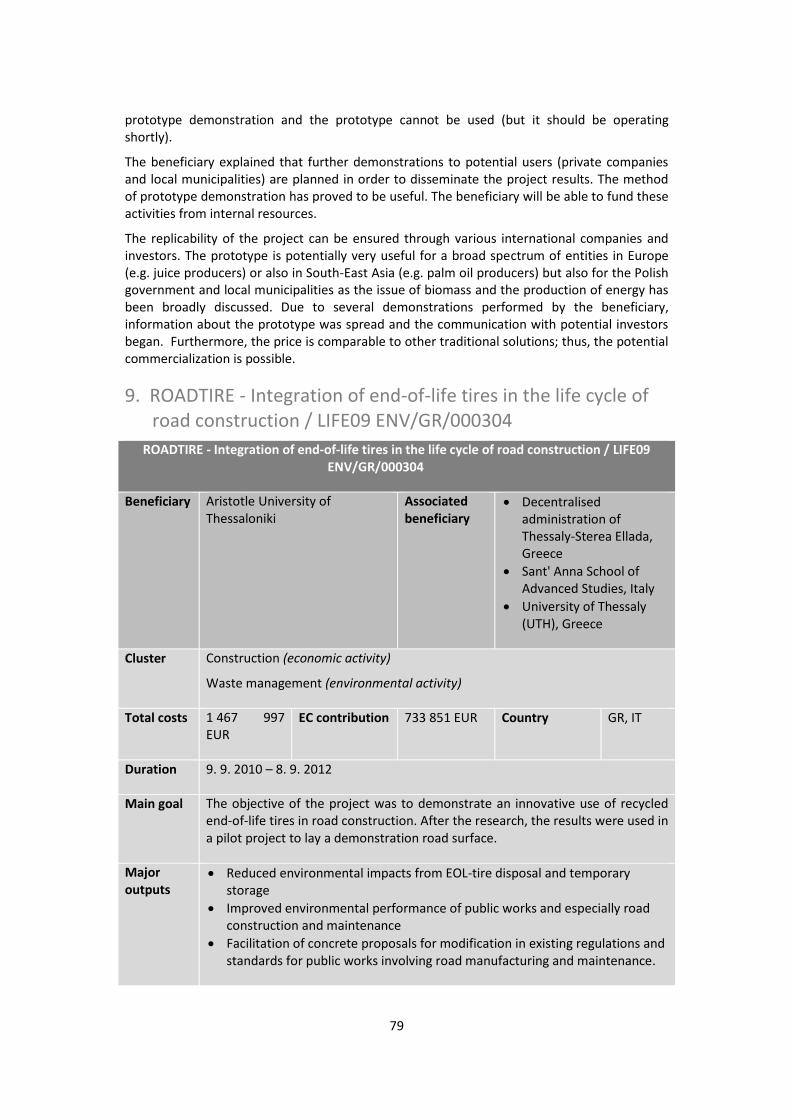
79
prototype demonstration and the prototype cannot be used (but it should be operating
shortly).
The beneficiary explained that further demonstrations to potential users (private companies
and local municipalities) are planned in order to disseminate the project results. The method
of prototype demonstration has proved to be useful. The beneficiary will be able to fund these
activities from internal resources.
The replicability of the project can be ensured through various international companies and
investors. The prototype is potentially very useful for a broad spectrum of entities in Europe
(e.g. juice producers) or also in South-East Asia (e.g. palm oil producers) but also for the Polish
government and local municipalities as the issue of biomass and the production of energy has
been broadly discussed. Due to several demonstrations performed by the beneficiary,
information about the prototype was spread and the communication with potential investors
began. Furthermore, the price is comparable to other traditional solutions; thus, the potential
commercialization is possible.
9. ROADTIRE - Integration of end-of-life tires in the life cycle of
road construction / LIFE09 ENV/GR/000304
ROADTIRE - Integration of end-of-life tires in the life cycle of road construction / LIFE09 ENV/GR/000304
Beneficiary Aristotle University of
Thessaloniki
Associated beneficiary
x Decentralised
administration of
Thessaly-Sterea Ellada,
Greece
x Sant' Anna School of
Advanced Studies, Italy
x University of Thessaly
(UTH), Greece
Cluster Construction (economic activity)
Waste management (environmental activity)
Total costs 1 467 997
EUR
EC contribution 733 851 EUR Country GR, IT
Duration 9. 9. 2010 – 8. 9. 2012
Main goal The objective of the project was to demonstrate an innovative use of recycled
end-of-life tires in road construction. After the research, the results were used in
a pilot project to lay a demonstration road surface.
Major outputs
x Reduced environmental impacts from EOL-tire disposal and temporary
storage
x Improved environmental performance of public works and especially road
construction and maintenance
x Facilitation of concrete proposals for modification in existing regulations and
standards for public works involving road manufacturing and maintenance.
80
The project did not aim primarily for the commercialization of the results as the main goal was
the research and development of the road mixture and its testing in a pilot project on two
local roads. The project further aimed to encourage the government to adopt measures to
include the use of old tires in road construction.
The project is sustainable as a topic of research of the coordinating beneficiary, i.e. the
university. The beneficiary explained that the project was a milestone for the laboratory where
the research continues. Since the project was implemented by the university, the results were
spread among students and the wider public. However, the viability of the project in the sense
of building new roads with the mixture is not yet real. The fact that construction of road from
old tires is more expensive than regular road mixtures is crucial in the current political and
economic situation in Greece.
Replicability of the project ROADTIRE is potentially high due to the final outcome, i.e. “the recipe” for a road mixture that is ready for use and already received a positive feedback from
the road users. The report was provided to the Greek authorities. Unfortunately, they did not
follow up with any real actions. Even though the government expressed an interest, the need
for longer research and testing was requested. Furthermore, after the end of the project the
beneficiary has not been able to further promote the project and persuade the authorities to
further action nor communicate the result to the international public due to insufficient funds
available at the university. On the other hand, many results, including certifications for the
road mixture were presented to the expert public at conferences and in expert journals.
Several crucial barriers occurred during the project implementation, which could not have
been avoided. The political crisis in Greece between 2010 and 2012 influenced the
communication of the results to political authorities (frequent changes of the political
representatives prevented deeper discussion and long-term cooperation was not possible).
Furthermore, the economic crisis led to lower government spending and diminished any
political will to change regulations in order to promote environmental benefits compared to
the regular practice.
The beneficiary expressed their intention to apply for further research funds from the LIFE
Programme or other financial sources within the EU in order to further test the mixture and
put the authorities under pressure to consider legislative changes. Moreover, the beneficiary
pointed out that the influence of the LIFE representatives / EU would have a positive impact on
presenting the project results on the national level (government, ministries) and their
willingness to accept the proposed changes.
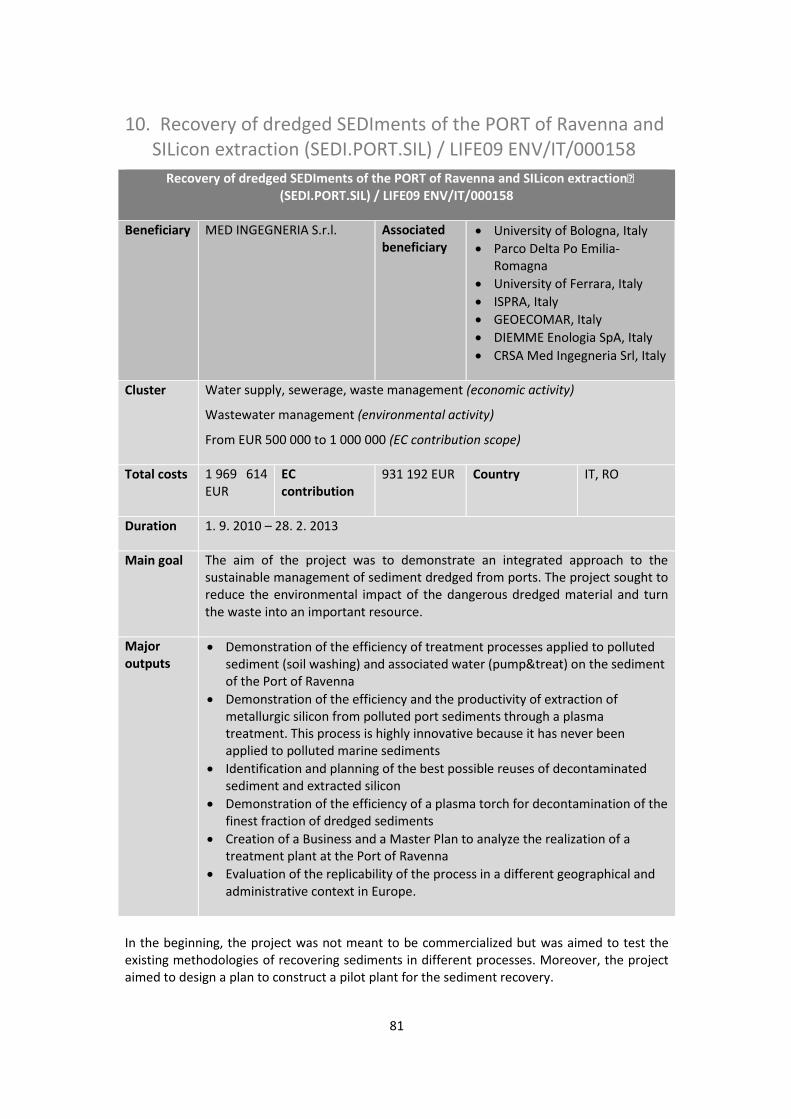
81
10. Recovery of dredged SEDIments of the PORT of Ravenna and
SILicon extraction (SEDI.PORT.SIL) / LIFE09 ENV/IT/000158
Recovery of dredged SEDIments of the PORT of Ravenna and SILicon extraction� (SEDI.PORT.SIL) / LIFE09 ENV/IT/000158
Beneficiary MED INGEGNERIA S.r.l.
Associated beneficiary
x University of Bologna, Italy
x Parco Delta Po Emilia-
Romagna
x University of Ferrara, Italy
x ISPRA, Italy
x GEOECOMAR, Italy
x DIEMME Enologia SpA, Italy
x CRSA Med Ingegneria Srl, Italy
Cluster Water supply, sewerage, waste management (economic activity)
Wastewater management (environmental activity)
From EUR 500 000 to 1 000 000 (EC contribution scope)
Total costs 1 969 614
EUR
EC contribution
931 192 EUR Country IT, RO
Duration 1. 9. 2010 – 28. 2. 2013
Main goal The aim of the project was to demonstrate an integrated approach to the
sustainable management of sediment dredged from ports. The project sought to
reduce the environmental impact of the dangerous dredged material and turn
the waste into an important resource.
Major outputs
x Demonstration of the efficiency of treatment processes applied to polluted
sediment (soil washing) and associated water (pump&treat) on the sediment
of the Port of Ravenna
x Demonstration of the efficiency and the productivity of extraction of
metallurgic silicon from polluted port sediments through a plasma
treatment. This process is highly innovative because it has never been
applied to polluted marine sediments
x Identification and planning of the best possible reuses of decontaminated
sediment and extracted silicon
x Demonstration of the efficiency of a plasma torch for decontamination of the
finest fraction of dredged sediments
x Creation of a Business and a Master Plan to analyze the realization of a
treatment plant at the Port of Ravenna
x Evaluation of the replicability of the process in a different geographical and
administrative context in Europe.
In the beginning, the project was not meant to be commercialized but was aimed to test the
existing methodologies of recovering sediments in different processes. Moreover, the project
aimed to design a plan to construct a pilot plant for the sediment recovery.
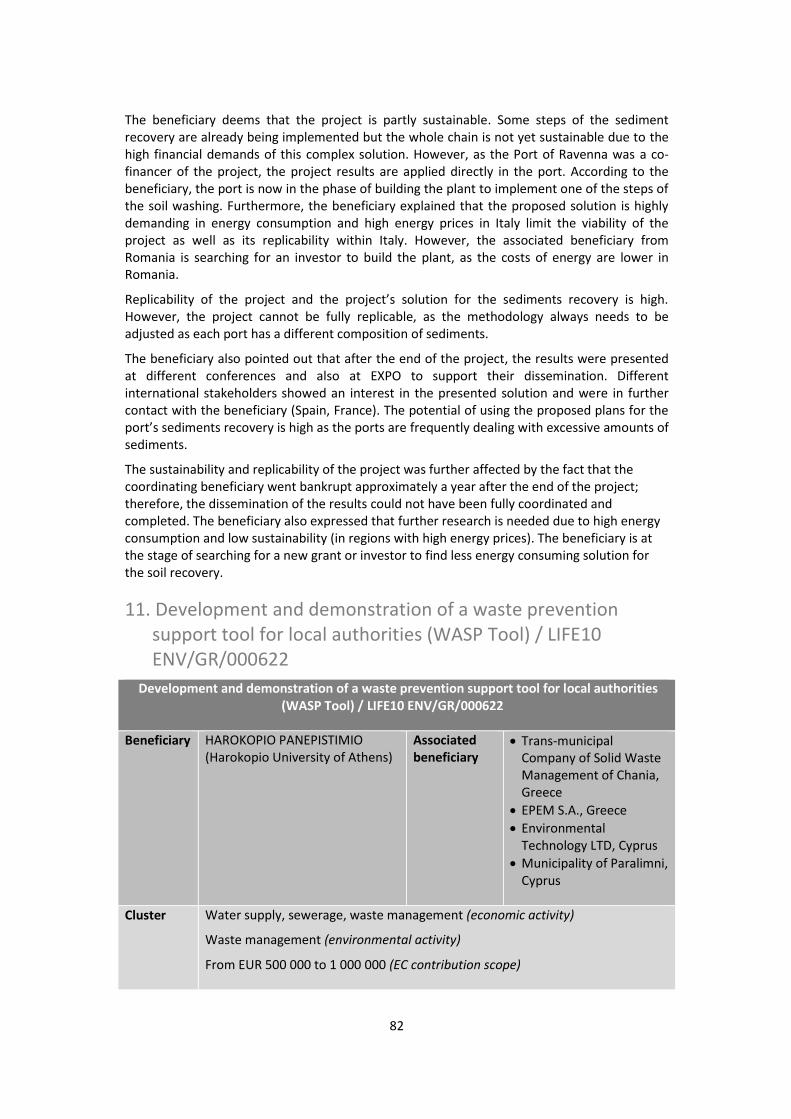
82
The beneficiary deems that the project is partly sustainable. Some steps of the sediment
recovery are already being implemented but the whole chain is not yet sustainable due to the
high financial demands of this complex solution. However, as the Port of Ravenna was a co-
financer of the project, the project results are applied directly in the port. According to the
beneficiary, the port is now in the phase of building the plant to implement one of the steps of
the soil washing. Furthermore, the beneficiary explained that the proposed solution is highly
demanding in energy consumption and high energy prices in Italy limit the viability of the
project as well as its replicability within Italy. However, the associated beneficiary from
Romania is searching for an investor to build the plant, as the costs of energy are lower in
Romania.
Replicability of the project and the project’s solution for the sediments recovery is high. However, the project cannot be fully replicable, as the methodology always needs to be
adjusted as each port has a different composition of sediments.
The beneficiary also pointed out that after the end of the project, the results were presented
at different conferences and also at EXPO to support their dissemination. Different
international stakeholders showed an interest in the presented solution and were in further
contact with the beneficiary (Spain, France). The potential of using the proposed plans for the
port’s sediments recovery is high as the ports are frequently dealing with excessive amounts of
sediments.
The sustainability and replicability of the project was further affected by the fact that the
coordinating beneficiary went bankrupt approximately a year after the end of the project;
therefore, the dissemination of the results could not have been fully coordinated and
completed. The beneficiary also expressed that further research is needed due to high energy
consumption and low sustainability (in regions with high energy prices). The beneficiary is at
the stage of searching for a new grant or investor to find less energy consuming solution for
the soil recovery.
11. Development and demonstration of a waste prevention
support tool for local authorities (WASP Tool) / LIFE10
ENV/GR/000622
Development and demonstration of a waste prevention support tool for local authorities (WASP Tool) / LIFE10 ENV/GR/000622
Beneficiary HAROKOPIO PANEPISTIMIO
(Harokopio University of Athens)
Associated beneficiary
x Trans-municipal
Company of Solid Waste
Management of Chania,
Greece
x EPEM S.A., Greece
x Environmental
Technology LTD, Cyprus
x Municipality of Paralimni,
Cyprus
Cluster Water supply, sewerage, waste management (economic activity)
Waste management (environmental activity)
From EUR 500 000 to 1 000 000 (EC contribution scope)
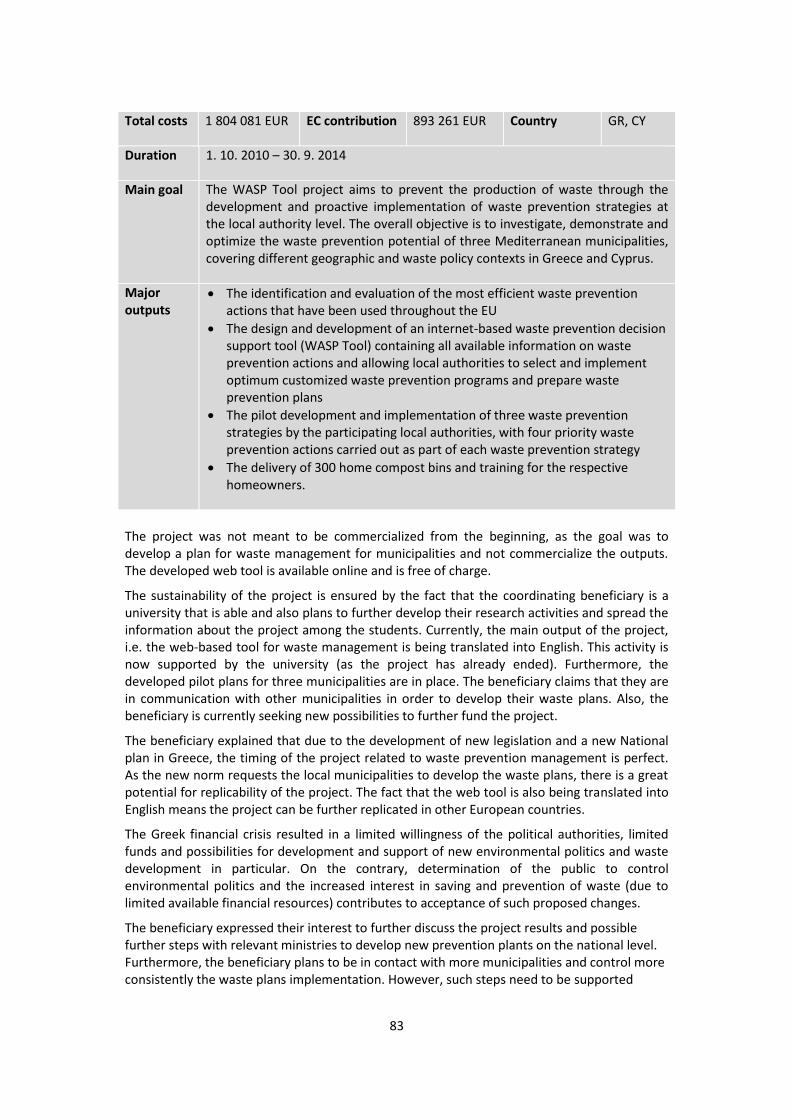
83
Total costs 1 804 081 EUR EC contribution 893 261 EUR Country GR, CY
Duration 1. 10. 2010 – 30. 9. 2014
Main goal The WASP Tool project aims to prevent the production of waste through the
development and proactive implementation of waste prevention strategies at
the local authority level. The overall objective is to investigate, demonstrate and
optimize the waste prevention potential of three Mediterranean municipalities,
covering different geographic and waste policy contexts in Greece and Cyprus.
Major outputs
x The identification and evaluation of the most efficient waste prevention
actions that have been used throughout the EU
x The design and development of an internet-based waste prevention decision
support tool (WASP Tool) containing all available information on waste
prevention actions and allowing local authorities to select and implement
optimum customized waste prevention programs and prepare waste
prevention plans
x The pilot development and implementation of three waste prevention
strategies by the participating local authorities, with four priority waste
prevention actions carried out as part of each waste prevention strategy
x The delivery of 300 home compost bins and training for the respective
homeowners.
The project was not meant to be commercialized from the beginning, as the goal was to
develop a plan for waste management for municipalities and not commercialize the outputs.
The developed web tool is available online and is free of charge.
The sustainability of the project is ensured by the fact that the coordinating beneficiary is a
university that is able and also plans to further develop their research activities and spread the
information about the project among the students. Currently, the main output of the project,
i.e. the web-based tool for waste management is being translated into English. This activity is
now supported by the university (as the project has already ended). Furthermore, the
developed pilot plans for three municipalities are in place. The beneficiary claims that they are
in communication with other municipalities in order to develop their waste plans. Also, the
beneficiary is currently seeking new possibilities to further fund the project.
The beneficiary explained that due to the development of new legislation and a new National
plan in Greece, the timing of the project related to waste prevention management is perfect.
As the new norm requests the local municipalities to develop the waste plans, there is a great
potential for replicability of the project. The fact that the web tool is also being translated into
English means the project can be further replicated in other European countries.
The Greek financial crisis resulted in a limited willingness of the political authorities, limited
funds and possibilities for development and support of new environmental politics and waste
development in particular. On the contrary, determination of the public to control
environmental politics and the increased interest in saving and prevention of waste (due to
limited available financial resources) contributes to acceptance of such proposed changes.
The beneficiary expressed their interest to further discuss the project results and possible
further steps with relevant ministries to develop new prevention plants on the national level.
Furthermore, the beneficiary plans to be in contact with more municipalities and control more
consistently the waste plans implementation. However, such steps need to be supported
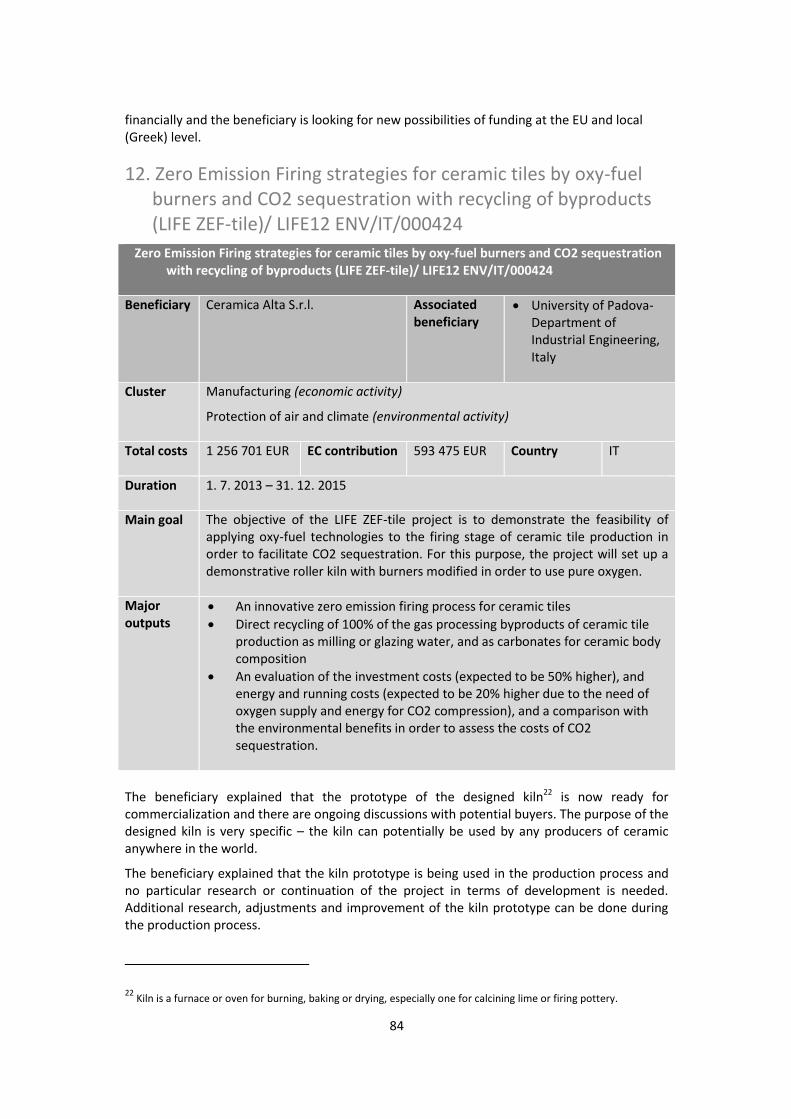
84
financially and the beneficiary is looking for new possibilities of funding at the EU and local
(Greek) level.
12. Zero Emission Firing strategies for ceramic tiles by oxy-fuel
burners and CO2 sequestration with recycling of byproducts
(LIFE ZEF-tile)/ LIFE12 ENV/IT/000424
Zero Emission Firing strategies for ceramic tiles by oxy-fuel burners and CO2 sequestration with recycling of byproducts (LIFE ZEF-tile)/ LIFE12 ENV/IT/000424
Beneficiary Ceramica Alta S.r.l. Associated beneficiary
x University of Padova-
Department of
Industrial Engineering,
Italy
Cluster Manufacturing (economic activity)
Protection of air and climate (environmental activity)
Total costs 1 256 701 EUR EC contribution 593 475 EUR Country IT
Duration 1. 7. 2013 – 31. 12. 2015
Main goal The objective of the LIFE ZEF-tile project is to demonstrate the feasibility of
applying oxy-fuel technologies to the firing stage of ceramic tile production in
order to facilitate CO2 sequestration. For this purpose, the project will set up a
demonstrative roller kiln with burners modified in order to use pure oxygen.
Major outputs
x An innovative zero emission firing process for ceramic tiles
x Direct recycling of 100% of the gas processing byproducts of ceramic tile
production as milling or glazing water, and as carbonates for ceramic body
composition
x An evaluation of the investment costs (expected to be 50% higher), and
energy and running costs (expected to be 20% higher due to the need of
oxygen supply and energy for CO2 compression), and a comparison with
the environmental benefits in order to assess the costs of CO2
sequestration.
The beneficiary explained that the prototype of the designed kiln22
is now ready for
commercialization and there are ongoing discussions with potential buyers. The purpose of the
designed kiln is very specific – the kiln can potentially be used by any producers of ceramic
anywhere in the world.
The beneficiary explained that the kiln prototype is being used in the production process and
no particular research or continuation of the project in terms of development is needed.
Additional research, adjustments and improvement of the kiln prototype can be done during
the production process.
22
Kiln is a furnace or oven for burning, baking or drying, especially one for calcining lime or firing pottery.
85
The beneficiary believes that the replicability of the project is very high. The main
environmental issues regarding ceramic production are high CO2 emissions and the low energy
efficiency of the kilns and both of these aspects are addressed by the presented kiln. However,
there are no particular environmental norms that would require decreasing the emissions
during the ceramic production.
Private companies were contacted through various meetings, information materials and
through the project website. The beneficiary expressed that further demonstrations of the
prototype are planned to demonstrate the designed kiln and to attract new investors.
The beneficiary confirmed that the cooperation between the private company (the
coordinating beneficiary) and the university (associated beneficiary) was very beneficial as the
university brought in highly skilled people crucial for the project’s implementation. In addition,
the beneficiary expressed that cooperation with the relevant political authorities would be
valuable in order to influence creation of a new environmental norm for lower emissions from
ceramic production.
86
Chapter 5: Direct jobs creation by LIFE
projects
In this chapter, we will examine the impact of LIFE projects (projects of the LIFE+ Programme
and LIFE14/15 calls in particular) on employment during their implementation and post-implementation phase. The impact during the implementation phase is measured in person-
years which represent a full-time individual’s working time for a year, i.e. 2 person-years
correspond to either two individuals working full-time for a year, or one individual working
full-time for two years. The impact during the post-implementation phase is also measured in
FTEs (full-time equivalents) per year, i.e. the workload of a full-time individual for a year. A
sensitivity analysis consisting of various scenarios (low impact, reference and high impact) is
presented in order to offer the reliable estimates.
The estimation of the impact is based on a sample of 1 464 projects with start dates from 1 January 2009 to 1 January 2016. The results of the study on jobs creation are primarily based
on the data obtained from the DORY database and also from information collected from the
TMOs via questionnaires. The approach was determined by the availability and reliability of
the data in the database. Interpretation of the results should always be perceived in the
context of the employed data.
Information about the start dates of the projects was available for 4 221 projects (out of the
total of 4 262 projects accessible in the DORY database on 9 February 2016). Information
about the amount of personnel budget was available for 2 341 projects of the previous subset
(4 221 projects). Comprehensive information required for the study was available for 1 464
projects of the previous subset (2 341 projects). Projects beginning before 2008 were excluded
as the full set of required information would not be accessible due to excessive time distance.
Therefore, the final dataset of 1 464 projects consists of projects of LIFE+ Programme and
LIFE14/15 calls.
The analysis examines only the direct impact of the projects – further indirect impacts are not
estimated due to lack of required data. There is no multiplication effect taken into account,
nor changes in Gross Value Added or in Gross Domestic Product on the supply side of the
economy which should be all influenced by the increase in the labour income and amount of
external assistance. Furthermore, the amount spent on infrastructure, prototypes and
equipment which increases investments (on the demand side of the economy) was not the
object of the study.
5.1 Impact on employment during the implementation phase
Methodology
Data which were processed included information about the personnel budget, amount of EC
contribution, start date and duration of the projects in the sample. Furthermore, number of
person-years corresponding on average to the personnel costs was calculated based on the
data of hourly wages used within the financial evaluations of LIFE projects conducted by EY
(which accounts for 206 projects from all EU countries with the exception of Croatia and Czech
Republic).
All financial data were discounted by HICP (Harmonized Index of Consumer Prices) of each
single country in order to obtain figures in real terms with 2015 as the reference year. This
ensured consistency in calculating the number of person-years generated on average by the
personnel costs over time. The amount of personnel costs was divided by median hourly wage
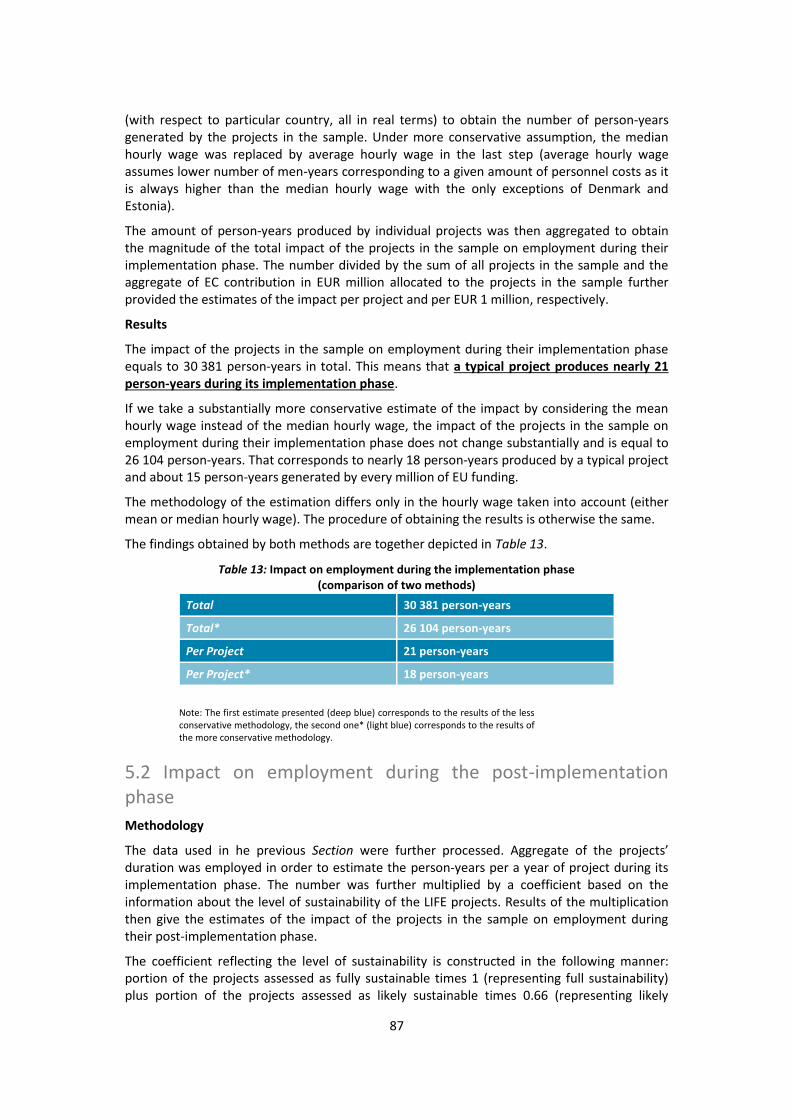
87
(with respect to particular country, all in real terms) to obtain the number of person-years
generated by the projects in the sample. Under more conservative assumption, the median
hourly wage was replaced by average hourly wage in the last step (average hourly wage
assumes lower number of men-years corresponding to a given amount of personnel costs as it
is always higher than the median hourly wage with the only exceptions of Denmark and
Estonia).
The amount of person-years produced by individual projects was then aggregated to obtain
the magnitude of the total impact of the projects in the sample on employment during their
implementation phase. The number divided by the sum of all projects in the sample and the
aggregate of EC contribution in EUR million allocated to the projects in the sample further
provided the estimates of the impact per project and per EUR 1 million, respectively.
Results
The impact of the projects in the sample on employment during their implementation phase
equals to 30 381 person-years in total. This means that a typical project produces nearly 21 person-years during its implementation phase.
If we take a substantially more conservative estimate of the impact by considering the mean
hourly wage instead of the median hourly wage, the impact of the projects in the sample on
employment during their implementation phase does not change substantially and is equal to
26 104 person-years. That corresponds to nearly 18 person-years produced by a typical project
and about 15 person-years generated by every million of EU funding.
The methodology of the estimation differs only in the hourly wage taken into account (either
mean or median hourly wage). The procedure of obtaining the results is otherwise the same.
The findings obtained by both methods are together depicted in Table 13.
Table 13: Impact on employment during the implementation phase (comparison of two methods)
Total 30 381 person-years
Total* 26 104 person-years
Per Project 21 person-years
Per Project* 18 person-years
Note: The first estimate presented (deep blue) corresponds to the results of the less
conservative methodology, the second one* (light blue) corresponds to the results of
the more conservative methodology.
5.2 Impact on employment during the post-implementation
phase
Methodology
The data used in he previous Section were further processed. Aggregate of the projects’ duration was employed in order to estimate the person-years per a year of project during its
implementation phase. The number was further multiplied by a coefficient based on the
information about the level of sustainability of the LIFE projects. Results of the multiplication
then give the estimates of the impact of the projects in the sample on employment during
their post-implementation phase.
The coefficient reflecting the level of sustainability is constructed in the following manner:
portion of the projects assessed as fully sustainable times 1 (representing full sustainability)
plus portion of the projects assessed as likely sustainable times 0.66 (representing likely
88
sustainability) plus portion of the projects assessed as hardly sustainable times 0.33
(representing hardly sustainability) plus zero, i.e. c = 0.17*1 + 0.5*0.66 + 0.23*0.33 + 0.1*0 = 0.576. The portions of the projects by their level of sustainability are depicted in detail in
Figure 40: Number of Projects per Sustainability category. We assume the distribution of the
level of sustainability to be the same for both samples under investigation. For more detailed
information see Chapter 2: Likelihood of sustainability and replicability of the selected projects.
Different scenarios are further distinguished by reference, pessimistic and optimistic
assumptions about the manifested level of sustainability. The reference scenario assumes the
distribution of the level of sustainability to fully correspond to the TMOs answers. In contrast,
the lower impact scenario assumes the distribution to be pessimistic by 20% while the higher
impact scenario assumes the distribution to be optimistic by 20%. This means that the
coefficient c = 0.576 is further multiplied by either 0.8 or 1.2 coefficients.
Results
In order to forecast the impact on employment during the post-implementation phase, it was
necessary to normalize the measured impact during the implementation phase. For this sake,
the amount of person-years generated per year of project was calculated. Consequently, the
impact during the post-implementation phase is measured in FTEs per year.
The impact of the projects in the sample on employment during their implementation phase
equals to approximately 5.2 person-years per a year of project.
Based on the data about sustainability of the LIFE projects gathered via questionnaires filled in
by the TMOs (the data corresponds to the selected sample of 835 projects, for more detailed
information see Chapter 2: Likelihood of sustainability and replicability of the selected projects), the impact on employment during the post-implementation phase is estimated.
Reference scenario
The impact of the projects in the sample on employment during their post-implementation phase might amount to 4 375 FTEs per year in the reference scenario. This means that, on
average, one project might produce 3 FTEs per year during its post-implementation phase.23
In
consequence, every million of EU funding might generate about 2.5 FTEs per year even after
the end of the EU funding.
Low impact scenario
The impact of the projects in the sample on employment during their post-implementation
phase might amount to 3 500 FTEs per year in the high impact scenario. This means that, on
average, one project might produce about 2.4 FTEs per year during its post-implementation
phase. In consequence, every million of EU funding might generate nearly 2 FTEs per year even
after the end of the EU funding.
High impact scenario
The impact of the projects in the sample on employment during their post-implementation
phase might amount to 5 250 FTEs per year in the high impact scenario. This means that, on
average, one project might produce about 3.6 FTEs per year during its post-implementation
23
Effectively, there would be certain portion of terminated projects producing no FTEs at all while the sustained
projects would generate higher that the average number of FTEs.
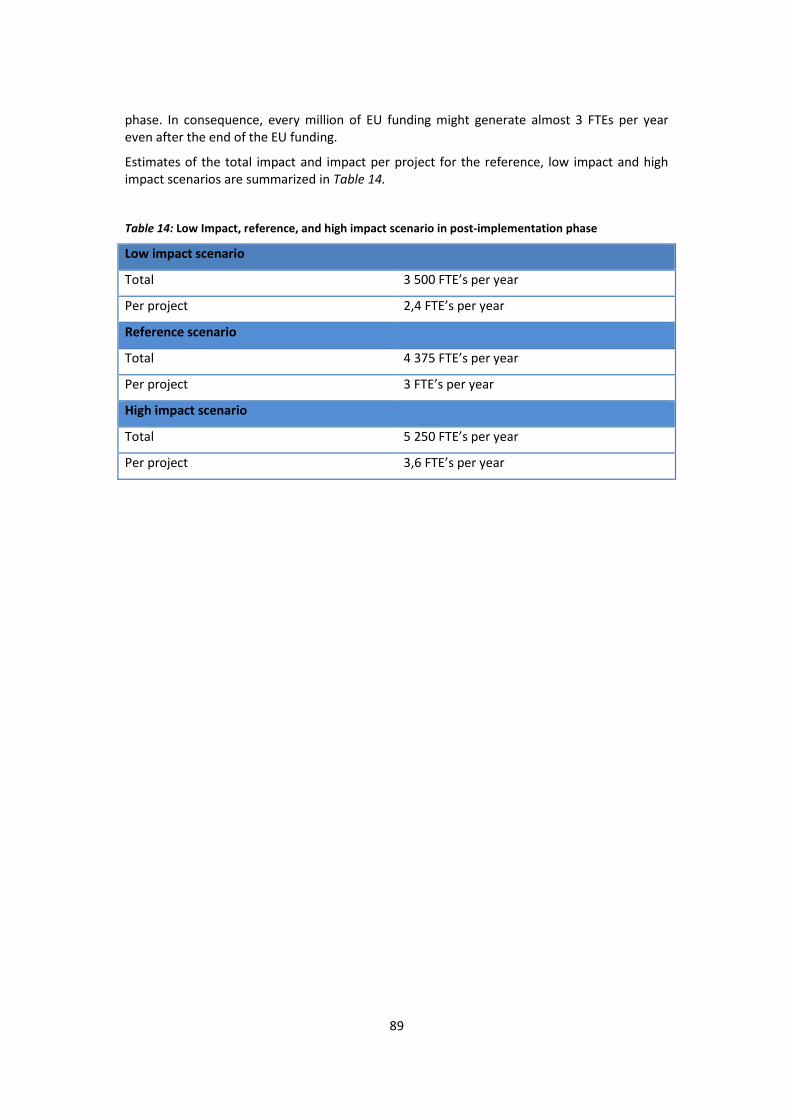
89
phase. In consequence, every million of EU funding might generate almost 3 FTEs per year
even after the end of the EU funding.
Estimates of the total impact and impact per project for the reference, low impact and high
impact scenarios are summarized in Table 14.
Table 14: Low Impact, reference, and high impact scenario in post-implementation phase
Low impact scenario
Total 3 500 FTE’s per year
Per project 2,4 FTE’s per year
Reference scenario
Total 4 375 FTE’s per year
Per project 3 FTE’s per year
High impact scenario
Total 5 250 FTE’s per year
Per project 3,6 FTE’s per year
90
References
Brant, R. (1990). Assessing proportionality in the proportional odds model for ordinal logistic
regression. Biometrics, 1171-1178.
Brooks, C. (2014). Introductory econometrics for finance. Cambridge university press.
Clarke, K. A. (2005). The phantom menace: Omitted variable bias in econometric research.
Conflict Management and Peace Science, 22(4), 341-352.
Dranove, D. (2012). Practical Regression: Discrete Dependent Variables. Kellogg Case Publishing, Case Number 7-112-009.
Gertler, P. J., Martinez, S., Premand, P., Rawlings, L. B., & Vermeersch, C. M. (2011). Impact
evaluation in practice. World Bank Publications.
Khandker, S. R., Koolwal, G. B., & Samad, H. A. (2010). Handbook on impact evaluation:
quantitative methods and practices. World Bank Publications.
Long, J. S., & Freese, J. (2006). Regression models for categorical dependent variables using Stata. Stata press.
Scholz, F. W. (1985). Maximum likelihood estimation. Encyclopedia of Statistical Sciences.
Stock, J. H., & Watson, M. W. (2006). Forecasting with many predictors. Handbook of economic forecasting, 1, 515-554.
Wauters, B. (2012). Community of Practice on Results Based Management. Sourcebook on results based management in the European structural funds.
Williams, R. (2005). Gologit2: A Program for Generalized Logistic Regression / Partial
Proportional Odds Models for Ordinal Dependent Variables. University of Notre Dame.
Williams, R. (2016). Models for Count Outcomes. University of Notre Dame.
91
PART II: Scenario-based impact on Jobs &
Growth
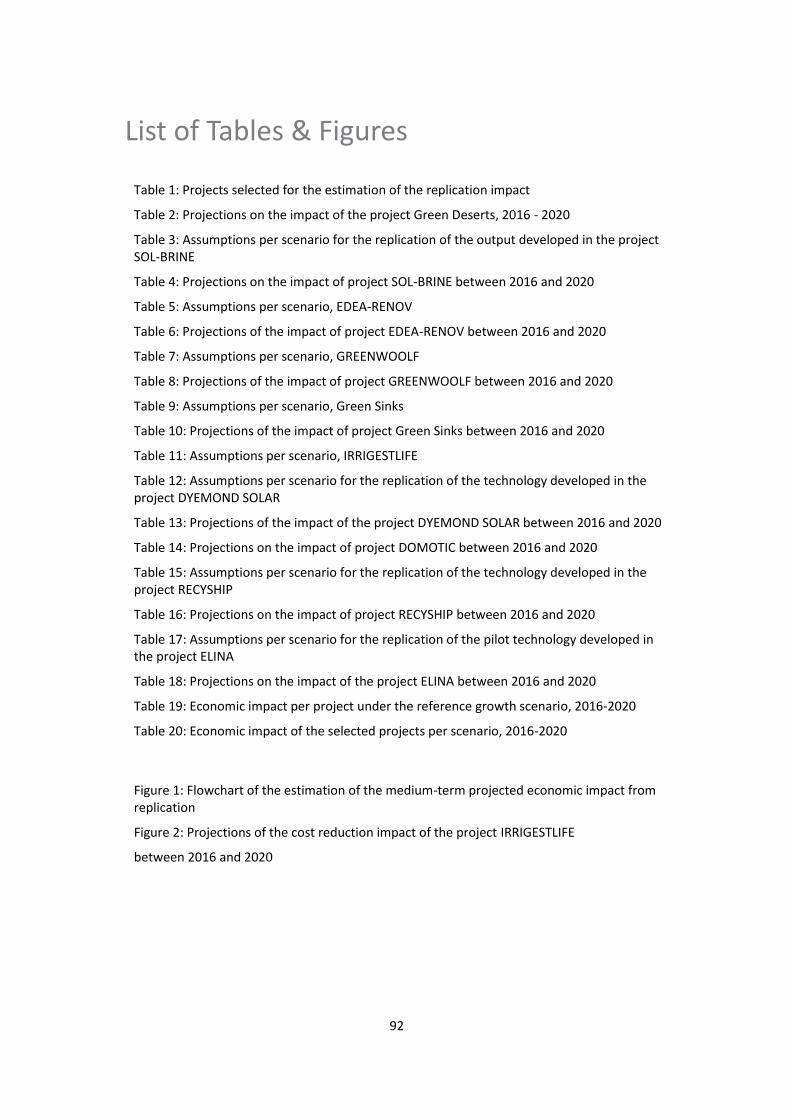
92
List of Tables & Figures
Table 1: Projects selected for the estimation of the replication impact
Table 2: Projections on the impact of the project Green Deserts, 2016 - 2020
Table 3: Assumptions per scenario for the replication of the output developed in the project
SOL-BRINE
Table 4: Projections on the impact of project SOL-BRINE between 2016 and 2020
Table 5: Assumptions per scenario, EDEA-RENOV
Table 6: Projections of the impact of project EDEA-RENOV between 2016 and 2020
Table 7: Assumptions per scenario, GREENWOOLF
Table 8: Projections of the impact of project GREENWOOLF between 2016 and 2020
Table 9: Assumptions per scenario, Green Sinks
Table 10: Projections of the impact of project Green Sinks between 2016 and 2020
Table 11: Assumptions per scenario, IRRIGESTLIFE
Table 12: Assumptions per scenario for the replication of the technology developed in the
project DYEMOND SOLAR
Table 13: Projections of the impact of the project DYEMOND SOLAR between 2016 and 2020
Table 14: Projections on the impact of project DOMOTIC between 2016 and 2020
Table 15: Assumptions per scenario for the replication of the technology developed in the
project RECYSHIP
Table 16: Projections on the impact of project RECYSHIP between 2016 and 2020
Table 17: Assumptions per scenario for the replication of the pilot technology developed in
the project ELINA
Table 18: Projections on the impact of the project ELINA between 2016 and 2020
Table 19: Economic impact per project under the reference growth scenario, 2016-2020
Table 20: Economic impact of the selected projects per scenario, 2016-2020
Figure 1: Flowchart of the estimation of the medium-term projected economic impact from
replication
Figure 2: Projections of the cost reduction impact of the project IRRIGESTLIFE
between 2016 and 2020
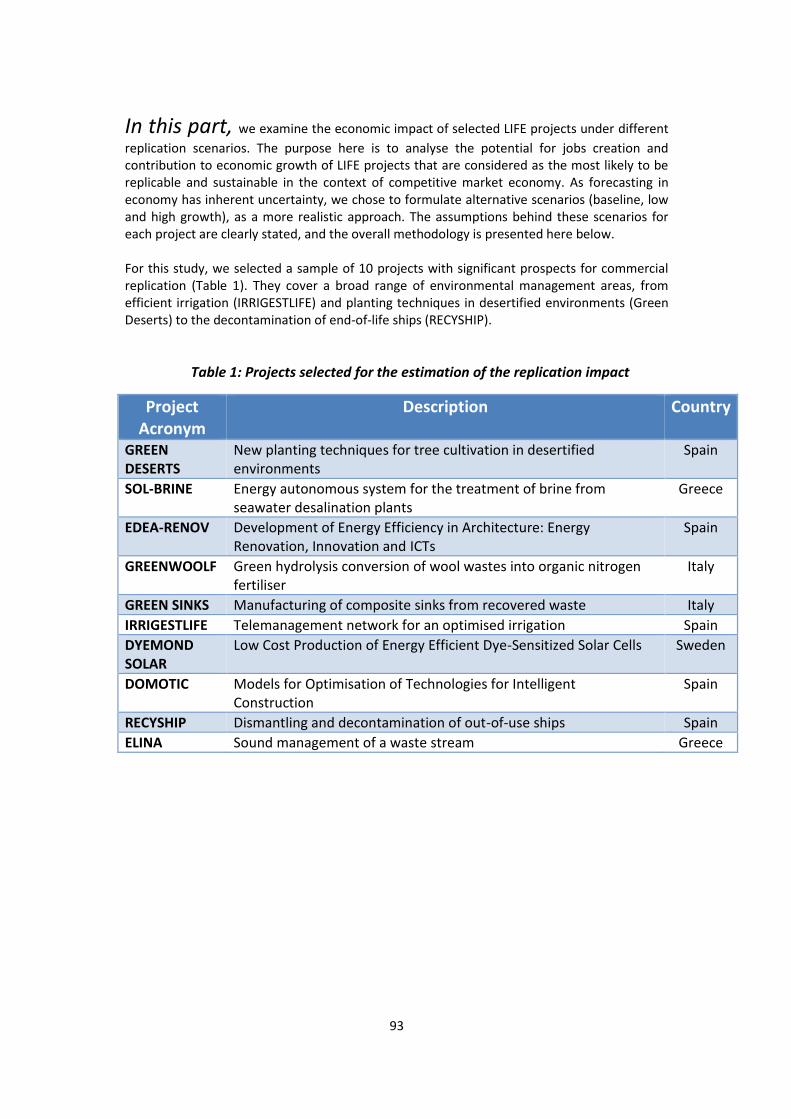
93
In this part, we examine the economic impact of selected LIFE projects under different
replication scenarios. The purpose here is to analyse the potential for jobs creation and
contribution to economic growth of LIFE projects that are considered as the most likely to be
replicable and sustainable in the context of competitive market economy. As forecasting in
economy has inherent uncertainty, we chose to formulate alternative scenarios (baseline, low
and high growth), as a more realistic approach. The assumptions behind these scenarios for
each project are clearly stated, and the overall methodology is presented here below.
For this study, we selected a sample of 10 projects with significant prospects for commercial
replication (Table 1). They cover a broad range of environmental management areas, from
efficient irrigation (IRRIGESTLIFE) and planting techniques in desertified environments (Green
Deserts) to the decontamination of end-of-life ships (RECYSHIP).
Table 1: Projects selected for the estimation of the replication impact
Project Acronym
Description Country
GREEN DESERTS
New planting techniques for tree cultivation in desertified
environments
Spain
SOL-BRINE Energy autonomous system for the treatment of brine from
seawater desalination plants
Greece
EDEA-RENOV Development of Energy Efficiency in Architecture: Energy
Renovation, Innovation and ICTs
Spain
GREENWOOLF Green hydrolysis conversion of wool wastes into organic nitrogen
fertiliser
Italy
GREEN SINKS Manufacturing of composite sinks from recovered waste Italy
IRRIGESTLIFE Telemanagement network for an optimised irrigation Spain
DYEMOND SOLAR
Low Cost Production of Energy Efficient Dye-Sensitized Solar Cells Sweden
DOMOTIC Models for Optimisation of Technologies for Intelligent
Construction
Spain
RECYSHIP Dismantling and decontamination of out-of-use ships Spain
ELINA Sound management of a waste stream Greece
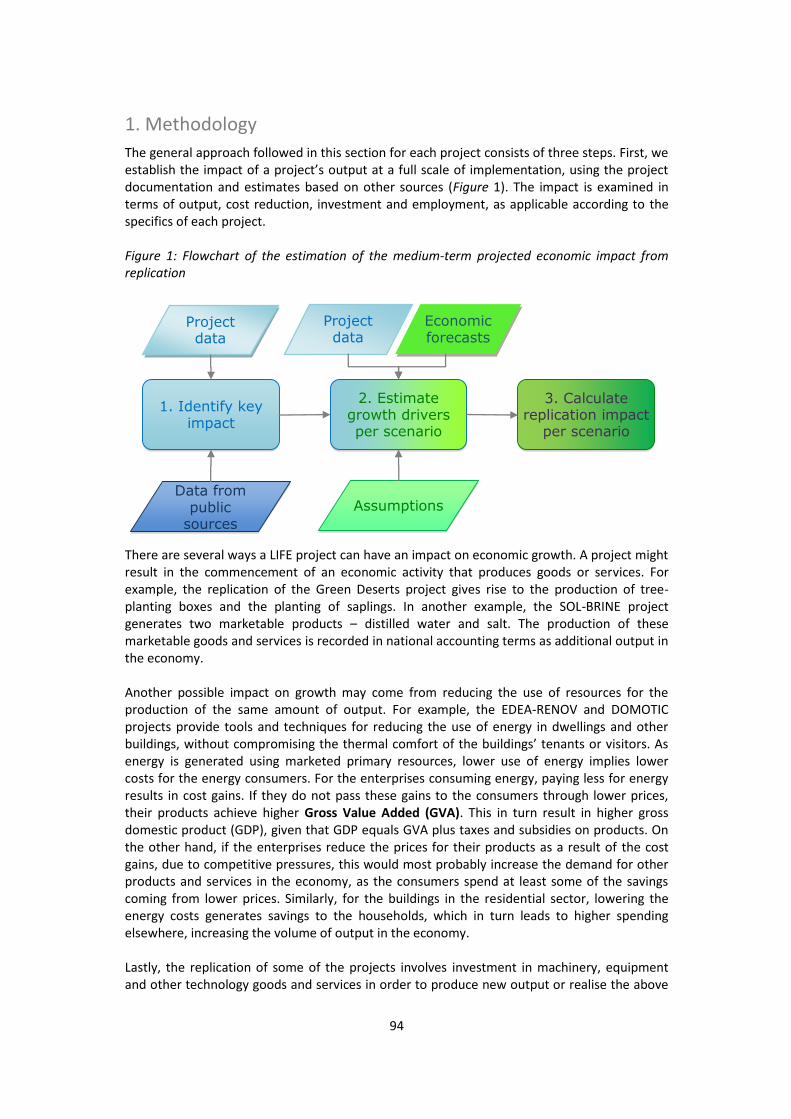
94
1. Methodology
The general approach followed in this section for each project consists of three steps. First, we
establish the impact of a project’s output at a full scale of implementation, using the project documentation and estimates based on other sources (Figure 1). The impact is examined in
terms of output, cost reduction, investment and employment, as applicable according to the
specifics of each project.
Figure 1: Flowchart of the estimation of the medium-term projected economic impact from replication
There are several ways a LIFE project can have an impact on economic growth. A project might
result in the commencement of an economic activity that produces goods or services. For
example, the replication of the Green Deserts project gives rise to the production of tree-
planting boxes and the planting of saplings. In another example, the SOL-BRINE project
generates two marketable products – distilled water and salt. The production of these
marketable goods and services is recorded in national accounting terms as additional output in
the economy.
Another possible impact on growth may come from reducing the use of resources for the
production of the same amount of output. For example, the EDEA-RENOV and DOMOTIC
projects provide tools and techniques for reducing the use of energy in dwellings and other
buildings, without compromising the thermal comfort of the buildings’ tenants or visitors. As energy is generated using marketed primary resources, lower use of energy implies lower
costs for the energy consumers. For the enterprises consuming energy, paying less for energy
results in cost gains. If they do not pass these gains to the consumers through lower prices,
their products achieve higher Gross Value Added (GVA). This in turn result in higher gross
domestic product (GDP), given that GDP equals GVA plus taxes and subsidies on products. On
the other hand, if the enterprises reduce the prices for their products as a result of the cost
gains, due to competitive pressures, this would most probably increase the demand for other
products and services in the economy, as the consumers spend at least some of the savings
coming from lower prices. Similarly, for the buildings in the residential sector, lowering the
energy costs generates savings to the households, which in turn leads to higher spending
elsewhere, increasing the volume of output in the economy.
Lastly, the replication of some of the projects involves investment in machinery, equipment
and other technology goods and services in order to produce new output or realise the above
1. Identify key impact
Project data
2. Estimate growth drivers per scenario
Economic forecasts
Project data
Assumptions
3. Calculate replication impact
per scenario
Data from public
sources
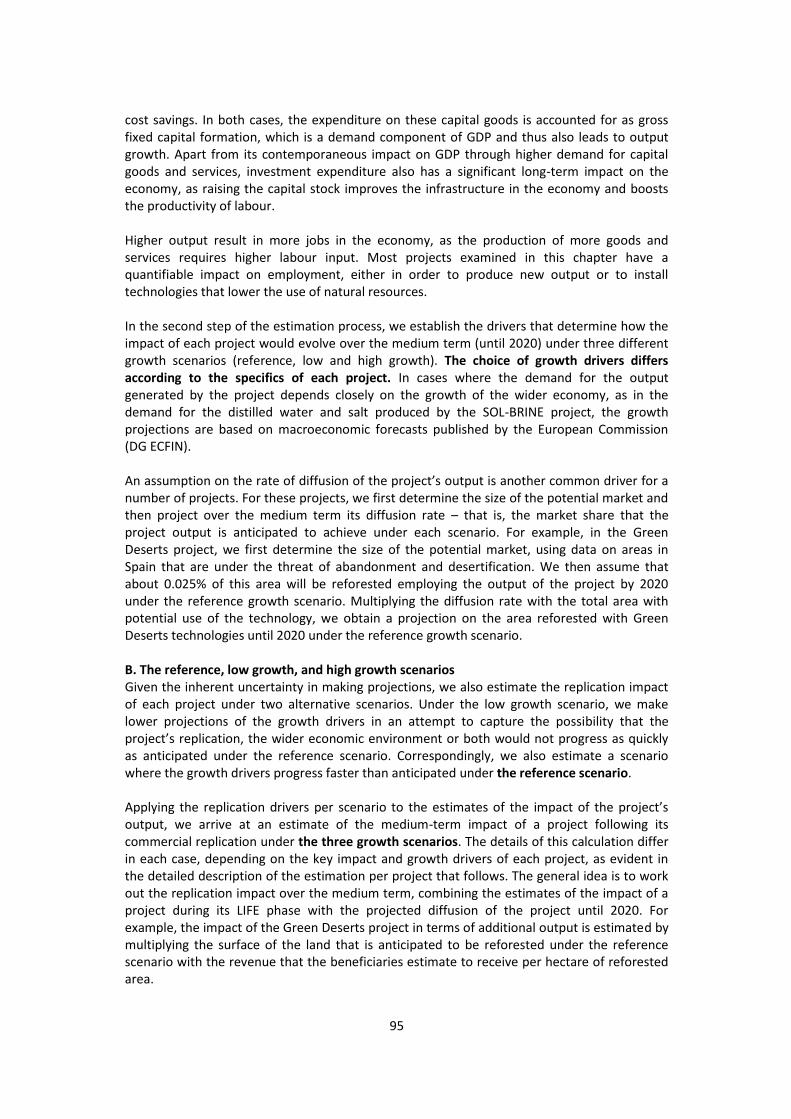
95
cost savings. In both cases, the expenditure on these capital goods is accounted for as gross
fixed capital formation, which is a demand component of GDP and thus also leads to output
growth. Apart from its contemporaneous impact on GDP through higher demand for capital
goods and services, investment expenditure also has a significant long-term impact on the
economy, as raising the capital stock improves the infrastructure in the economy and boosts
the productivity of labour.
Higher output result in more jobs in the economy, as the production of more goods and
services requires higher labour input. Most projects examined in this chapter have a
quantifiable impact on employment, either in order to produce new output or to install
technologies that lower the use of natural resources.
In the second step of the estimation process, we establish the drivers that determine how the
impact of each project would evolve over the medium term (until 2020) under three different
growth scenarios (reference, low and high growth). The choice of growth drivers differs according to the specifics of each project. In cases where the demand for the output
generated by the project depends closely on the growth of the wider economy, as in the
demand for the distilled water and salt produced by the SOL-BRINE project, the growth
projections are based on macroeconomic forecasts published by the European Commission
(DG ECFIN).
An assumption on the rate of diffusion of the project’s output is another common driver for a number of projects. For these projects, we first determine the size of the potential market and
then project over the medium term its diffusion rate – that is, the market share that the
project output is anticipated to achieve under each scenario. For example, in the Green
Deserts project, we first determine the size of the potential market, using data on areas in
Spain that are under the threat of abandonment and desertification. We then assume that
about 0.025% of this area will be reforested employing the output of the project by 2020
under the reference growth scenario. Multiplying the diffusion rate with the total area with
potential use of the technology, we obtain a projection on the area reforested with Green
Deserts technologies until 2020 under the reference growth scenario.
B. The reference, low growth, and high growth scenarios Given the inherent uncertainty in making projections, we also estimate the replication impact
of each project under two alternative scenarios. Under the low growth scenario, we make
lower projections of the growth drivers in an attempt to capture the possibility that the
project’s replication, the wider economic environment or both would not progress as quickly as anticipated under the reference scenario. Correspondingly, we also estimate a scenario
where the growth drivers progress faster than anticipated under the reference scenario.
Applying the replication drivers per scenario to the estimates of the impact of the project’s output, we arrive at an estimate of the medium-term impact of a project following its
commercial replication under the three growth scenarios. The details of this calculation differ
in each case, depending on the key impact and growth drivers of each project, as evident in
the detailed description of the estimation per project that follows. The general idea is to work
out the replication impact over the medium term, combining the estimates of the impact of a
project during its LIFE phase with the projected diffusion of the project until 2020. For
example, the impact of the Green Deserts project in terms of additional output is estimated by
multiplying the surface of the land that is anticipated to be reforested under the reference
scenario with the revenue that the beneficiaries estimate to receive per hectare of reforested
area.

96
In the remaining sections of this chapter, we present in detail the assumptions, the
calculations and the resulting estimates of the anticipated medium-term economic impact of
each project under the three growth scenarios. We conclude this chapter with a summary of
the estimated impact for the sample of projects.
97
2. Case studies
Green Deserts - Tree cultivation in desert environments
The aim of the project Green Deserts was to demonstrate the feasibility and effectiveness of
an innovative planting technology (water box), applied to restore the sponge function of
degraded soils and to support plant life. The technology improves the level of plant survival,
making planting economically feasible in areas of unfavourable physical characteristics, such as
desertified and dry mountainous areas.
The key economic impact of the project comes from the additional economic activity of
producing water boxes and planting saplings in forest restoration and other planting projects.
This activity transpires both in additional output and in employment. The use of this
technology for planting trees can also save water and energy resources, but the resource
saving effects are not quantified here, not only because of lack of suitable data, but also based
on the consideration that the technology is used primarily in terrains with unfavourable
physical conditions where no tree planting would have been the most likely counterfactual
scenario. Lastly, the use of this technology might also involve investment expenditure, over
and above the spending on planting trees, stemming from the potential need to upgrade the
production capacity of the manufacturing facility that produces the water boxes.
The key factor that would determine the size of the impact over time is the extent to which
the technology will be used to reforest desert areas in Spain and potentially over a longer term
in other suitable areas. In the Scenario of Reference Growth (SRG), we assume that the
technology is used to reforest 0.025% of the land in Spain that is under the threat of
abandonment and desertification (10 million hectares), deducting the national share of land
used for permanent crops or as arable land (about 37% of the total land area of the country) as
a proxy for the area where traditional reforestation methods might be more cost-effective.
This implies that by 2020 more than 1,500 hectares are planted using the technology
developed by the project (10 million hectares * 0.025% diffusion rate * 63% non-arable land).
On an annual basis, the surface of the land used for planting with water boxes increases from
157 hectares in 2016 to 564 hectares in 2020. As a result, the turnover of the activity to
manufacture water boxes and use them for planting saplings in 2020 reaches about €843,000 (564 hectares * 1660 USD per hectare planting expenditure, as reported by the project
beneficiaries * 0.9 EUR/USD exchange rate). Overall between 2016 and 2020, the total output
in this scenario equals €2.4 million.
Table 2: Projections on the impact of the project Green Deserts, 2016 - 2020
Impact 2016-2020 SLG SRG SHG Additional employment (person-years) 165 351 658
Additional output (€ million) 0.9 2.4 4.7
Investment (€ million) 0.2 0.7 1.2
Next, in order to calculate the employment and investment impact, we calculate the number
of trees and thus boxes that ought to be produced in order to plant the areas calculated
above. First, we assume that the space between the trees planted in these areas, large enough
to enable the development of their root system without cutting redundant saplings in a future
point of time, equals 8 metres on average. This implies that the area that each tree occupies is
16 m2 ((8 metre distance / 2 trees) ^2). As a result, the tree density of the planted areas stands
at 625 trees per hectare (1/16 m2 per tree * 10,000 m
2 in a hectare). Thus, about 353,000 trees
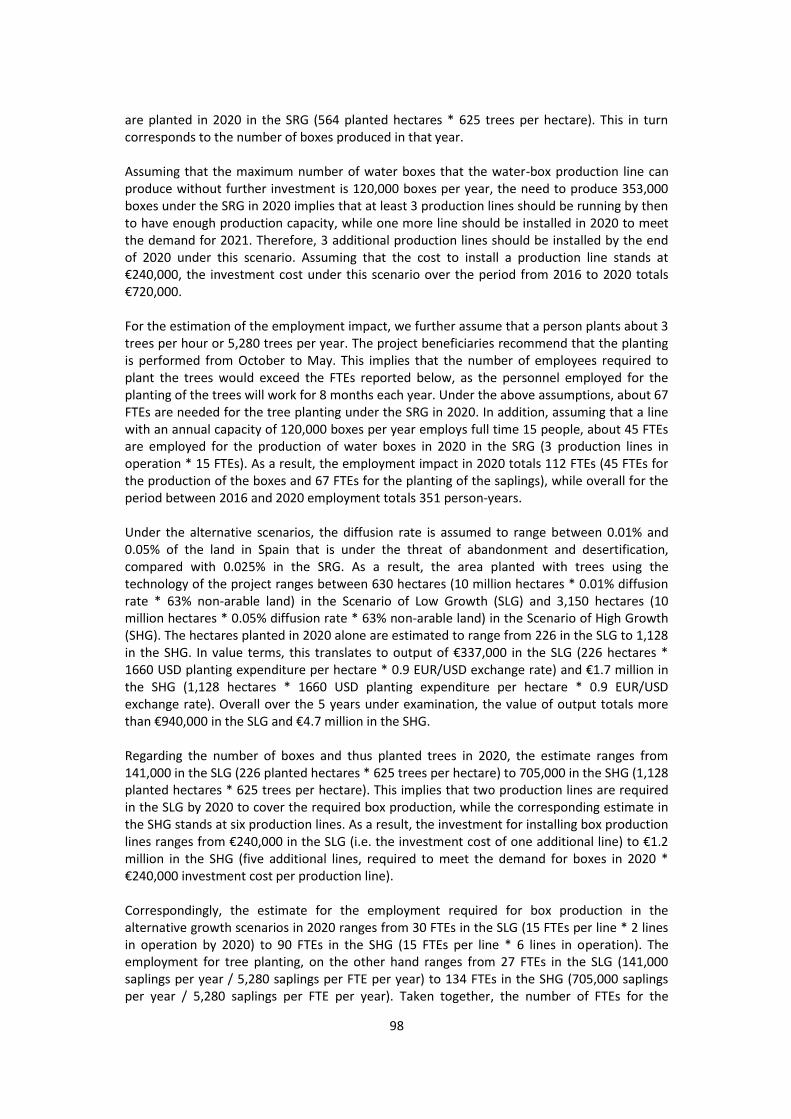
98
are planted in 2020 in the SRG (564 planted hectares * 625 trees per hectare). This in turn
corresponds to the number of boxes produced in that year.
Assuming that the maximum number of water boxes that the water-box production line can
produce without further investment is 120,000 boxes per year, the need to produce 353,000
boxes under the SRG in 2020 implies that at least 3 production lines should be running by then
to have enough production capacity, while one more line should be installed in 2020 to meet
the demand for 2021. Therefore, 3 additional production lines should be installed by the end
of 2020 under this scenario. Assuming that the cost to install a production line stands at
€240,000, the investment cost under this scenario over the period from 2016 to 2020 totals
€720,000.
For the estimation of the employment impact, we further assume that a person plants about 3
trees per hour or 5,280 trees per year. The project beneficiaries recommend that the planting
is performed from October to May. This implies that the number of employees required to
plant the trees would exceed the FTEs reported below, as the personnel employed for the
planting of the trees will work for 8 months each year. Under the above assumptions, about 67
FTEs are needed for the tree planting under the SRG in 2020. In addition, assuming that a line
with an annual capacity of 120,000 boxes per year employs full time 15 people, about 45 FTEs
are employed for the production of water boxes in 2020 in the SRG (3 production lines in
operation * 15 FTEs). As a result, the employment impact in 2020 totals 112 FTEs (45 FTEs for
the production of the boxes and 67 FTEs for the planting of the saplings), while overall for the
period between 2016 and 2020 employment totals 351 person-years.
Under the alternative scenarios, the diffusion rate is assumed to range between 0.01% and
0.05% of the land in Spain that is under the threat of abandonment and desertification,
compared with 0.025% in the SRG. As a result, the area planted with trees using the
technology of the project ranges between 630 hectares (10 million hectares * 0.01% diffusion
rate * 63% non-arable land) in the Scenario of Low Growth (SLG) and 3,150 hectares (10
million hectares * 0.05% diffusion rate * 63% non-arable land) in the Scenario of High Growth
(SHG). The hectares planted in 2020 alone are estimated to range from 226 in the SLG to 1,128
in the SHG. In value terms, this translates to output of €337,000 in the SLG (226 hectares * 1660 USD planting expenditure per hectare * 0.9 EUR/USD exchange rate) and €1.7 million in the SHG (1,128 hectares * 1660 USD planting expenditure per hectare * 0.9 EUR/USD
exchange rate). Overall over the 5 years under examination, the value of output totals more
than €940,000 in the SLG and €4.7 million in the SHG.
Regarding the number of boxes and thus planted trees in 2020, the estimate ranges from
141,000 in the SLG (226 planted hectares * 625 trees per hectare) to 705,000 in the SHG (1,128
planted hectares * 625 trees per hectare). This implies that two production lines are required
in the SLG by 2020 to cover the required box production, while the corresponding estimate in
the SHG stands at six production lines. As a result, the investment for installing box production
lines ranges from €240,000 in the SLG (i.e. the investment cost of one additional line) to €1.2 million in the SHG (five additional lines, required to meet the demand for boxes in 2020 *
€240,000 investment cost per production line).
Correspondingly, the estimate for the employment required for box production in the
alternative growth scenarios in 2020 ranges from 30 FTEs in the SLG (15 FTEs per line * 2 lines
in operation by 2020) to 90 FTEs in the SHG (15 FTEs per line * 6 lines in operation). The
employment for tree planting, on the other hand ranges from 27 FTEs in the SLG (141,000
saplings per year / 5,280 saplings per FTE per year) to 134 FTEs in the SHG (705,000 saplings
per year / 5,280 saplings per FTE per year). Taken together, the number of FTEs for the
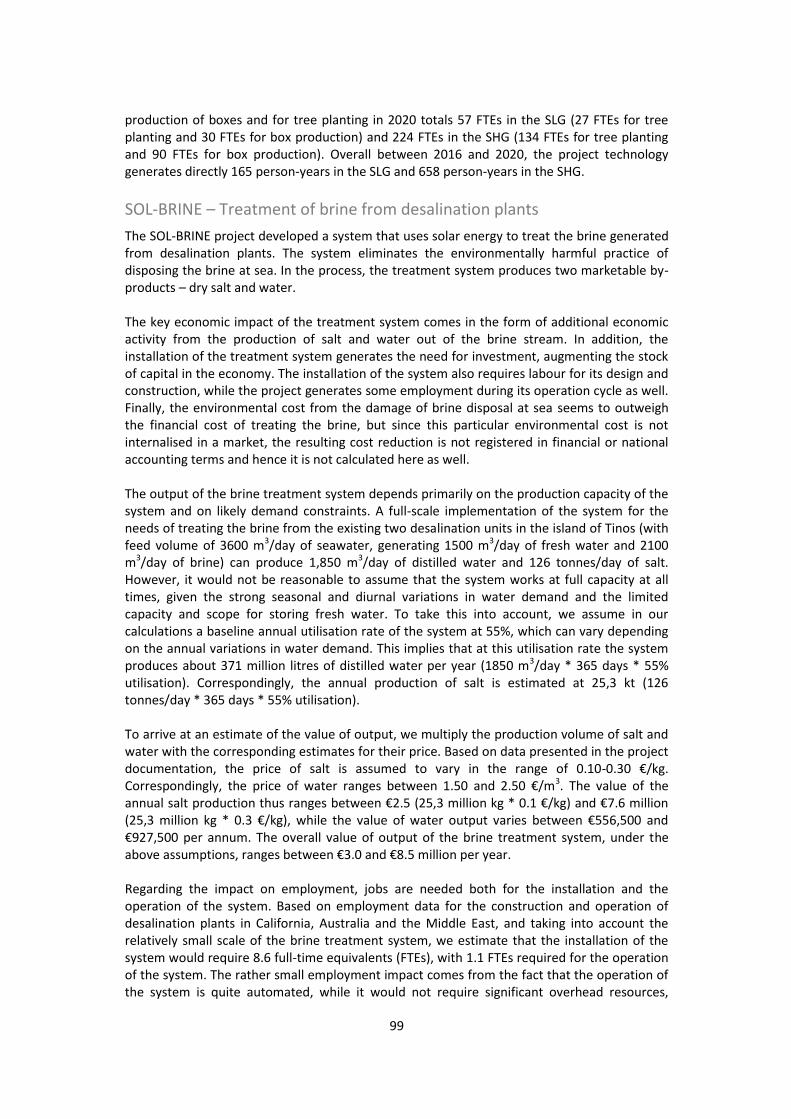
99
production of boxes and for tree planting in 2020 totals 57 FTEs in the SLG (27 FTEs for tree
planting and 30 FTEs for box production) and 224 FTEs in the SHG (134 FTEs for tree planting
and 90 FTEs for box production). Overall between 2016 and 2020, the project technology
generates directly 165 person-years in the SLG and 658 person-years in the SHG.
SOL-BRINE – Treatment of brine from desalination plants
The SOL-BRINE project developed a system that uses solar energy to treat the brine generated
from desalination plants. The system eliminates the environmentally harmful practice of
disposing the brine at sea. In the process, the treatment system produces two marketable by-
products – dry salt and water.
The key economic impact of the treatment system comes in the form of additional economic
activity from the production of salt and water out of the brine stream. In addition, the
installation of the treatment system generates the need for investment, augmenting the stock
of capital in the economy. The installation of the system also requires labour for its design and
construction, while the project generates some employment during its operation cycle as well.
Finally, the environmental cost from the damage of brine disposal at sea seems to outweigh
the financial cost of treating the brine, but since this particular environmental cost is not
internalised in a market, the resulting cost reduction is not registered in financial or national
accounting terms and hence it is not calculated here as well.
The output of the brine treatment system depends primarily on the production capacity of the
system and on likely demand constraints. A full-scale implementation of the system for the
needs of treating the brine from the existing two desalination units in the island of Tinos (with
feed volume of 3600 m3/day of seawater, generating 1500 m
3/day of fresh water and 2100
m3/day of brine) can produce 1,850 m
3/day of distilled water and 126 tonnes/day of salt.
However, it would not be reasonable to assume that the system works at full capacity at all
times, given the strong seasonal and diurnal variations in water demand and the limited
capacity and scope for storing fresh water. To take this into account, we assume in our
calculations a baseline annual utilisation rate of the system at 55%, which can vary depending
on the annual variations in water demand. This implies that at this utilisation rate the system
produces about 371 million litres of distilled water per year (1850 m3/day * 365 days * 55%
utilisation). Correspondingly, the annual production of salt is estimated at 25,3 kt (126
tonnes/day * 365 days * 55% utilisation).
To arrive at an estimate of the value of output, we multiply the production volume of salt and
water with the corresponding estimates for their price. Based on data presented in the project
documentation, the price of salt is assumed to vary in the range of 0.10-0.30 €/kg. Correspondingly, the price of water ranges between 1.50 and 2.50 €/m3
. The value of the
annual salt production thus ranges between €2.5 (25,3 million kg * 0.1 €/kg) and €7.6 million (25,3 million kg * 0.3 €/kg), while the value of water output varies between €556,500 and €927,500 per annum. The overall value of output of the brine treatment system, under the
above assumptions, ranges between €3.0 and €8.5 million per year.
Regarding the impact on employment, jobs are needed both for the installation and the
operation of the system. Based on employment data for the construction and operation of
desalination plants in California, Australia and the Middle East, and taking into account the
relatively small scale of the brine treatment system, we estimate that the installation of the
system would require 8.6 full-time equivalents (FTEs), with 1.1 FTEs required for the operation
of the system. The rather small employment impact comes from the fact that the operation of
the system is quite automated, while it would not require significant overhead resources,
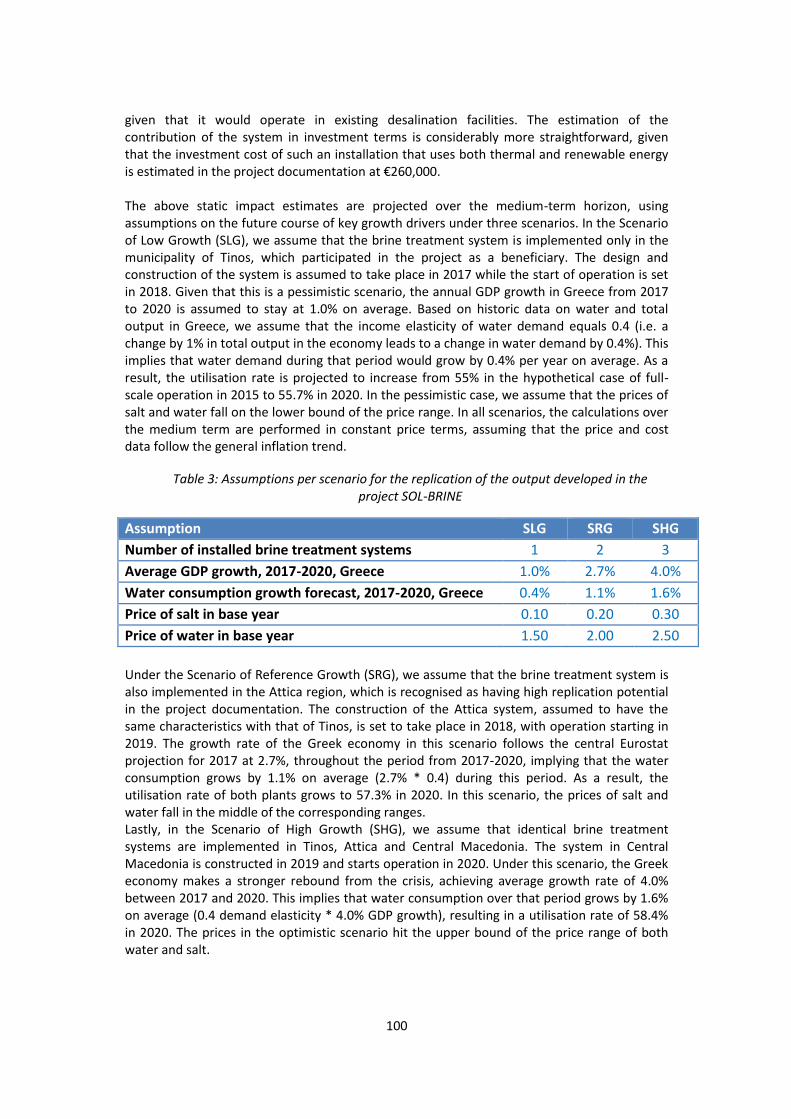
100
given that it would operate in existing desalination facilities. The estimation of the
contribution of the system in investment terms is considerably more straightforward, given
that the investment cost of such an installation that uses both thermal and renewable energy
is estimated in the project documentation at €260,000.
The above static impact estimates are projected over the medium-term horizon, using
assumptions on the future course of key growth drivers under three scenarios. In the Scenario
of Low Growth (SLG), we assume that the brine treatment system is implemented only in the
municipality of Tinos, which participated in the project as a beneficiary. The design and
construction of the system is assumed to take place in 2017 while the start of operation is set
in 2018. Given that this is a pessimistic scenario, the annual GDP growth in Greece from 2017
to 2020 is assumed to stay at 1.0% on average. Based on historic data on water and total
output in Greece, we assume that the income elasticity of water demand equals 0.4 (i.e. a
change by 1% in total output in the economy leads to a change in water demand by 0.4%). This
implies that water demand during that period would grow by 0.4% per year on average. As a
result, the utilisation rate is projected to increase from 55% in the hypothetical case of full-
scale operation in 2015 to 55.7% in 2020. In the pessimistic case, we assume that the prices of
salt and water fall on the lower bound of the price range. In all scenarios, the calculations over
the medium term are performed in constant price terms, assuming that the price and cost
data follow the general inflation trend.
Table 3: Assumptions per scenario for the replication of the output developed in the project SOL-BRINE
Assumption SLG SRG SHG Number of installed brine treatment systems 1 2 3
Average GDP growth, 2017-2020, Greece 1.0% 2.7% 4.0%
Water consumption growth forecast, 2017-2020, Greece 0.4% 1.1% 1.6%
Price of salt in base year 0.10 0.20 0.30
Price of water in base year 1.50 2.00 2.50
Under the Scenario of Reference Growth (SRG), we assume that the brine treatment system is
also implemented in the Attica region, which is recognised as having high replication potential
in the project documentation. The construction of the Attica system, assumed to have the
same characteristics with that of Tinos, is set to take place in 2018, with operation starting in
2019. The growth rate of the Greek economy in this scenario follows the central Eurostat
projection for 2017 at 2.7%, throughout the period from 2017-2020, implying that the water
consumption grows by 1.1% on average (2.7% * 0.4) during this period. As a result, the
utilisation rate of both plants grows to 57.3% in 2020. In this scenario, the prices of salt and
water fall in the middle of the corresponding ranges.
Lastly, in the Scenario of High Growth (SHG), we assume that identical brine treatment
systems are implemented in Tinos, Attica and Central Macedonia. The system in Central
Macedonia is constructed in 2019 and starts operation in 2020. Under this scenario, the Greek
economy makes a stronger rebound from the crisis, achieving average growth rate of 4.0%
between 2017 and 2020. This implies that water consumption over that period grows by 1.6%
on average (0.4 demand elasticity * 4.0% GDP growth), resulting in a utilisation rate of 58.4%
in 2020. The prices in the optimistic scenario hit the upper bound of the price range of both
water and salt.
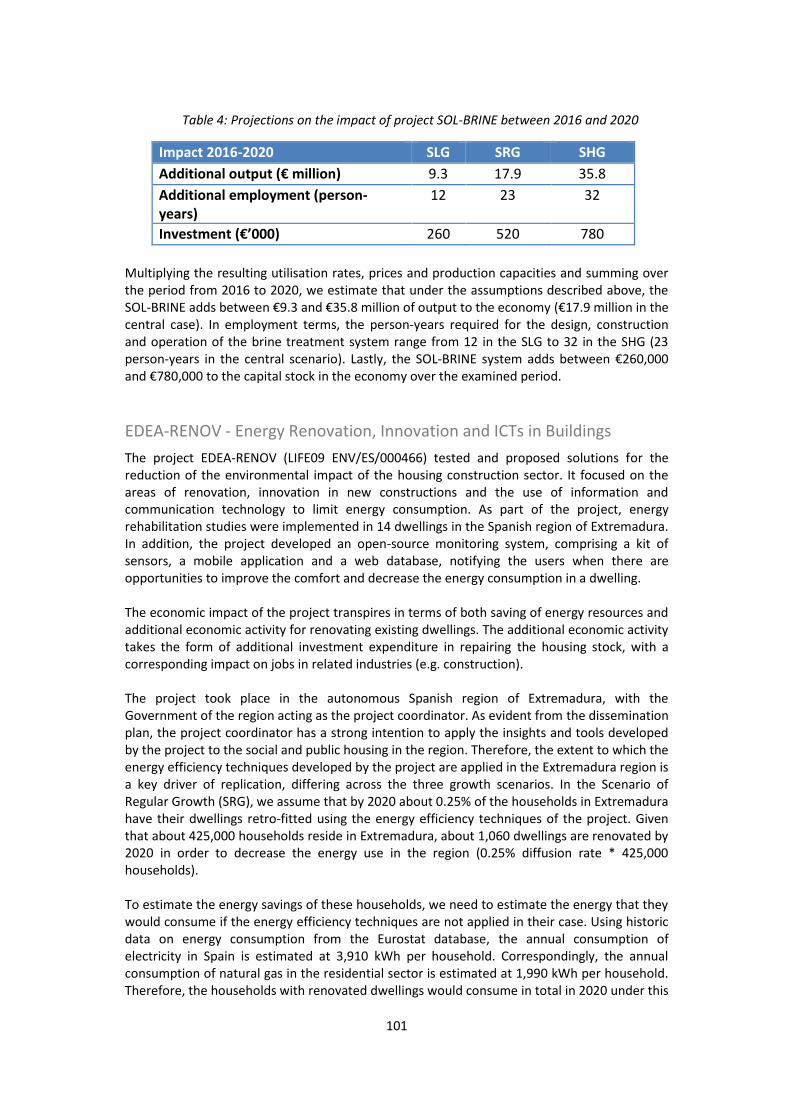
101
Table 4: Projections on the impact of project SOL-BRINE between 2016 and 2020
Impact 2016-2020 SLG SRG SHG Additional output (€ million) 9.3 17.9 35.8
Additional employment (person-years)
12 23 32
Investment (€’000) 260 520 780
Multiplying the resulting utilisation rates, prices and production capacities and summing over
the period from 2016 to 2020, we estimate that under the assumptions described above, the
SOL-BRINE adds between €9.3 and €35.8 million of output to the economy (€17.9 million in the central case). In employment terms, the person-years required for the design, construction
and operation of the brine treatment system range from 12 in the SLG to 32 in the SHG (23
person-years in the central scenario). Lastly, the SOL-BRINE system adds between €260,000 and €780,000 to the capital stock in the economy over the examined period.
EDEA-RENOV - Energy Renovation, Innovation and ICTs in Buildings
The project EDEA-RENOV (LIFE09 ENV/ES/000466) tested and proposed solutions for the
reduction of the environmental impact of the housing construction sector. It focused on the
areas of renovation, innovation in new constructions and the use of information and
communication technology to limit energy consumption. As part of the project, energy
rehabilitation studies were implemented in 14 dwellings in the Spanish region of Extremadura.
In addition, the project developed an open-source monitoring system, comprising a kit of
sensors, a mobile application and a web database, notifying the users when there are
opportunities to improve the comfort and decrease the energy consumption in a dwelling.
The economic impact of the project transpires in terms of both saving of energy resources and
additional economic activity for renovating existing dwellings. The additional economic activity
takes the form of additional investment expenditure in repairing the housing stock, with a
corresponding impact on jobs in related industries (e.g. construction).
The project took place in the autonomous Spanish region of Extremadura, with the
Government of the region acting as the project coordinator. As evident from the dissemination
plan, the project coordinator has a strong intention to apply the insights and tools developed
by the project to the social and public housing in the region. Therefore, the extent to which the
energy efficiency techniques developed by the project are applied in the Extremadura region is
a key driver of replication, differing across the three growth scenarios. In the Scenario of
Regular Growth (SRG), we assume that by 2020 about 0.25% of the households in Extremadura
have their dwellings retro-fitted using the energy efficiency techniques of the project. Given
that about 425,000 households reside in Extremadura, about 1,060 dwellings are renovated by
2020 in order to decrease the energy use in the region (0.25% diffusion rate * 425,000
households).
To estimate the energy savings of these households, we need to estimate the energy that they
would consume if the energy efficiency techniques are not applied in their case. Using historic
data on energy consumption from the Eurostat database, the annual consumption of
electricity in Spain is estimated at 3,910 kWh per household. Correspondingly, the annual
consumption of natural gas in the residential sector is estimated at 1,990 kWh per household.
Therefore, the households with renovated dwellings would consume in total in 2020 under this
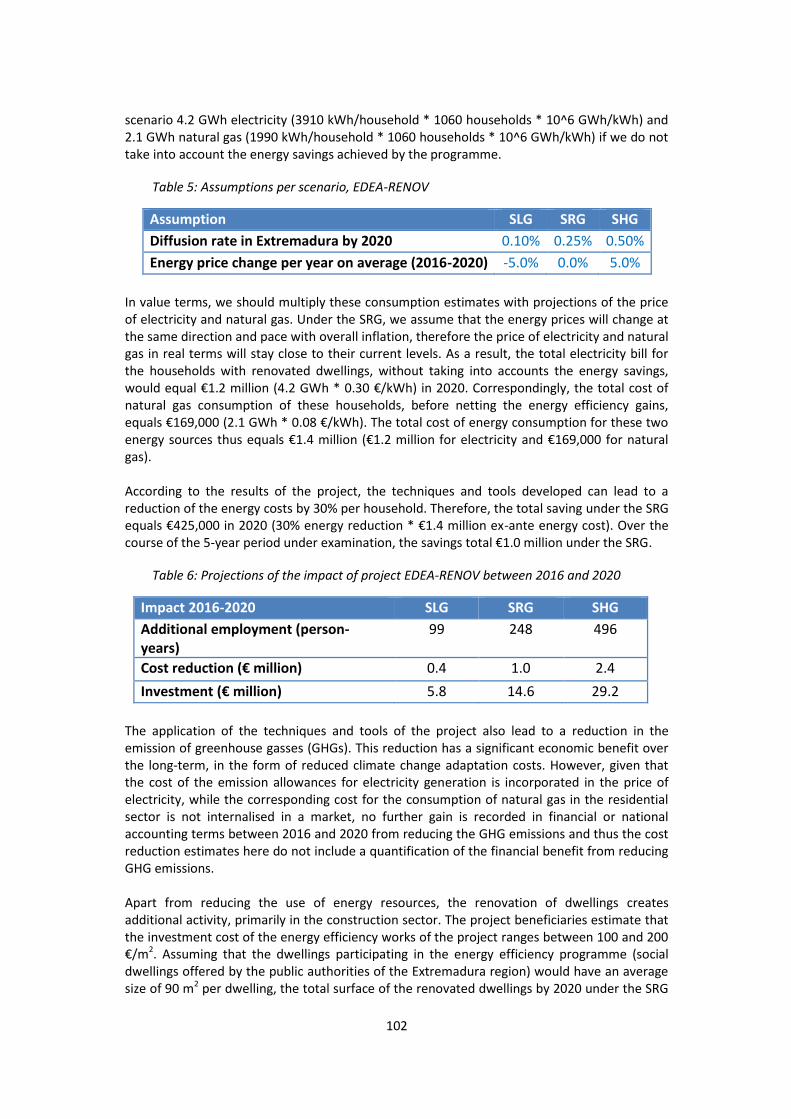
102
scenario 4.2 GWh electricity (3910 kWh/household * 1060 households * 10^6 GWh/kWh) and
2.1 GWh natural gas (1990 kWh/household * 1060 households * 10^6 GWh/kWh) if we do not
take into account the energy savings achieved by the programme.
Table 5: Assumptions per scenario, EDEA-RENOV
Assumption SLG SRG SHG Diffusion rate in Extremadura by 2020 0.10% 0.25% 0.50%
Energy price change per year on average (2016-2020) -5.0% 0.0% 5.0%
In value terms, we should multiply these consumption estimates with projections of the price
of electricity and natural gas. Under the SRG, we assume that the energy prices will change at
the same direction and pace with overall inflation, therefore the price of electricity and natural
gas in real terms will stay close to their current levels. As a result, the total electricity bill for
the households with renovated dwellings, without taking into accounts the energy savings,
would equal €1.2 million (4.2 GWh * 0.30 €/kWh) in 2020. Correspondingly, the total cost of natural gas consumption of these households, before netting the energy efficiency gains,
equals €169,000 (2.1 GWh * 0.08 €/kWh). The total cost of energy consumption for these two energy sources thus equals €1.4 million (€1.2 million for electricity and €169,000 for natural gas).
According to the results of the project, the techniques and tools developed can lead to a
reduction of the energy costs by 30% per household. Therefore, the total saving under the SRG
equals €425,000 in 2020 (30% energy reduction * €1.4 million ex-ante energy cost). Over the
course of the 5-year period under examination, the savings total €1.0 million under the SRG.
Table 6: Projections of the impact of project EDEA-RENOV between 2016 and 2020
Impact 2016-2020 SLG SRG SHG Additional employment (person-years)
99 248 496
Cost reduction (€ million) 0.4 1.0 2.4
Investment (€ million) 5.8 14.6 29.2
The application of the techniques and tools of the project also lead to a reduction in the
emission of greenhouse gasses (GHGs). This reduction has a significant economic benefit over
the long-term, in the form of reduced climate change adaptation costs. However, given that
the cost of the emission allowances for electricity generation is incorporated in the price of
electricity, while the corresponding cost for the consumption of natural gas in the residential
sector is not internalised in a market, no further gain is recorded in financial or national
accounting terms between 2016 and 2020 from reducing the GHG emissions and thus the cost
reduction estimates here do not include a quantification of the financial benefit from reducing
GHG emissions.
Apart from reducing the use of energy resources, the renovation of dwellings creates
additional activity, primarily in the construction sector. The project beneficiaries estimate that
the investment cost of the energy efficiency works of the project ranges between 100 and 200
€/m2. Assuming that the dwellings participating in the energy efficiency programme (social
dwellings offered by the public authorities of the Extremadura region) would have an average
size of 90 m2 per dwelling, the total surface of the renovated dwellings by 2020 under the SRG
103
stands at about 96,000 m2. On an annual basis, the surface renovated each year increases from
9,600 m2
in 2016 to 31,000 m2
in 2020. As a result, the expenditure on energy efficiency
interventions is estimated at €4.7 million in 2020 for this scenario (31,000 m2 * 150 €/m2
on
average).
In addition to the construction works, the dwellings are fitted with a monitoring system, with a
cost of 150 – 300 € per dwelling, depending on the size of the dwelling and other characteristics. Given that the number of dwelling innovated each year is assumed to increase
from 106 in 2016 to 345 in 2020, the total cost of the monitoring system for 2020 under the
SRG equals about €78,000 (345 households * 225 €/household on average). Therefore, the application of the tools and techniques of the project to a number of Extremadura households
by 2020 generates €4.7 million investment. Over the 5-year period from 2016 to 2020, the
investment generated by the project totals €14.6 million under the SRG.
Renovating houses in order to increase their energy efficiency is a labour-intensive activity.
According to estimates quoted in a recent study by Cambridge Econometrics, about 17 full-
time jobs are created per €1 million of investment in renovating residential dwellings, out of which 10 jobs are created in the construction industry, 6 jobs in manufacturing of materials
used in the renovation and 1 job in services.24
Using that estimate, we can expect about 81
jobs in 2020 under the SRG (17 FTEs/€ million of investment * €4.7 million investment) to be created by applying the techniques of the programme. Summing up the employment impact
between 2016 and 2020, the project is expected to generate about 248 person-years between
2016 and 2020 in the SRG.
Under the alternative growth scenarios, the diffusion rate ranges from 0.1% to 0.5%. This
implies that the number of households participating in an energy efficiency programme that
utilises the insights of the project by 2020 varies from 425 in the Scenario of Low Growth (0.1%
diffusion rate * 425,000 households) to 2,125 in the Scenario of High Growth (0.5% diffusion
rate * 425,000 households). As a result, the electricity consumption of these households,
without taking into account the energy savings, equals 1.7 GWh in the SLG (3,910
kWh/household * 425 households * 10^6 GWh/kWh) and 8.3 GWh in the SHG (3,910
kWh/household * 2,125 households * 10^6 GWh/kWh). The corresponding consumption of
natural gas varies between 846 MWh in the SLG (1,990 kWh/household * 425 households *
10^3 MWh/kWh) and 4.2 GWh in the SHG (1,990 kWh/household * 2,125 households * 10^6
GWh/kWh).
We assume that the energy prices vary across the growth scenarios. In the low growth
scenario, where the extent of energy efficiency interventions is limited, primarily due to
subdued economic performance and therefore lack of public funding for such interventions,
we assume that the economic conditions are adverse at global level, resulting in energy prices
falling behind the pace of inflation by 5 percentage points each year. In contrast, the economic
situation is assumed to be buoyant in the SHG, with the energy prices outrunning the course of
inflation by 5 percentage points on average each year.
Under these price assumptions, the gross cost of electricity for the households participating in
the energy efficiency programmes in Extremadura (without netting the energy savings) totals
about €406,000 in the SLG (1.7 GWh * 0.24 €/kWh) and €3.0 million in the SHG (8.3 GWh * 0.36 €/kWh) in 2020. Correspondingly for natural gas, the cost varies between €55,000 in the
24
Pikas et al. (2015) in Cambridge Econometrics (2015), Assessing the Employment and Social Impact of Energy
Efficiency.
104
SLG (846 MWh * 0.07 €/kWh) and €411,000 in the SHG (4.2 GWh * 0.10 €/kWh). Therefore, the total gross cost of energy in 2020 equals €461,000 in the SLG (€406,000 cost of electricity
and €55,000 cost of natural gas) and €3.4 million in the SHG (€3.0 million from electricity and
€411,000 from natural gas). Applying the expected energy saving rate of 30% to the above gross cost of energy consumption results in expected savings of between €138,000 in the SLG and €1.0 million in the SHG. Overall between 2016 and 2020, the value of energy savings from
the interventions of the project replication ranges from €367,000 in the SLG to €2,5 million in the SHG.
The associated investment cost for the construction works depends on the number and total
surface of the renovated dwellings. On an annual basis, the number of dwellings participating
in the programme increases in the SLG from 42 in 2016 to 138 in 2020, while in the SHG the
number of households grows from 212 in 2016 to 691 in 2020. Correspondingly, the surface of
the dwelling renovated in 2020 ranges from 12,000 m2
in the SLG (138 households * 90 m2 per
household) to 62,000 m2
in the SHG (691 households * 90 m2 per household).
As a result, the investment in renovation works in 2020 equals €1.9 million in the SLG (12,000
m2 * 150 €/m2) and €9.3 million in the SHG (62,000 m2
* 150 €/m2). Correspondingly, the
investment in the monitoring system ranges from €31,000 in the SLG (138 households * 225 €/household) to €155,000 in the SHG (691 households * 225 €/household). The total investment cost thus sums up to €1.9 million in the SLG and €9.5 million in the SHG. Overall between 2016 and 2020, the investment cost totals €5.8 million in the SLG and €29.2 million in the SHG.
Regarding the employment impact under the alternative scenarios, the replication of the
techniques and tools of the project is expected to provide full-time employment to about 32
people in the SLG (17 FTEs/€ million of investment * €1.9 million investment) in 2020. Correspondingly, about 161 FTEs are expected in the SHG in 2020 (17 FTEs/€ million of investment * €9.5 million investment). Over the 5-year period, the employment impact sums
up to 99 person-years in the SLG and 496 person-years in the SHG.
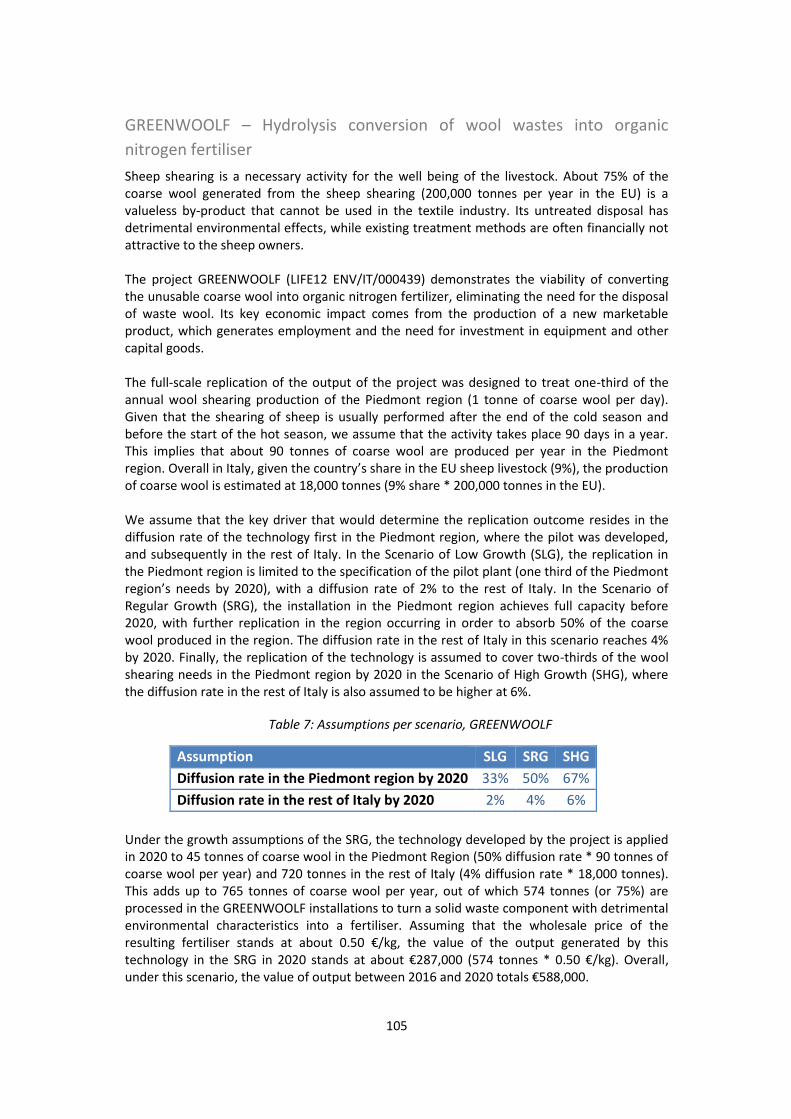
105
GREENWOOLF – Hydrolysis conversion of wool wastes into organic
nitrogen fertiliser
Sheep shearing is a necessary activity for the well being of the livestock. About 75% of the
coarse wool generated from the sheep shearing (200,000 tonnes per year in the EU) is a
valueless by-product that cannot be used in the textile industry. Its untreated disposal has
detrimental environmental effects, while existing treatment methods are often financially not
attractive to the sheep owners.
The project GREENWOOLF (LIFE12 ENV/IT/000439) demonstrates the viability of converting
the unusable coarse wool into organic nitrogen fertilizer, eliminating the need for the disposal
of waste wool. Its key economic impact comes from the production of a new marketable
product, which generates employment and the need for investment in equipment and other
capital goods.
The full-scale replication of the output of the project was designed to treat one-third of the
annual wool shearing production of the Piedmont region (1 tonne of coarse wool per day).
Given that the shearing of sheep is usually performed after the end of the cold season and
before the start of the hot season, we assume that the activity takes place 90 days in a year.
This implies that about 90 tonnes of coarse wool are produced per year in the Piedmont
region. Overall in Italy, given the country’s share in the EU sheep livestock (9%), the production of coarse wool is estimated at 18,000 tonnes (9% share * 200,000 tonnes in the EU).
We assume that the key driver that would determine the replication outcome resides in the
diffusion rate of the technology first in the Piedmont region, where the pilot was developed,
and subsequently in the rest of Italy. In the Scenario of Low Growth (SLG), the replication in
the Piedmont region is limited to the specification of the pilot plant (one third of the Piedmont
region’s needs by 2020), with a diffusion rate of 2% to the rest of Italy. In the Scenario of Regular Growth (SRG), the installation in the Piedmont region achieves full capacity before
2020, with further replication in the region occurring in order to absorb 50% of the coarse
wool produced in the region. The diffusion rate in the rest of Italy in this scenario reaches 4%
by 2020. Finally, the replication of the technology is assumed to cover two-thirds of the wool
shearing needs in the Piedmont region by 2020 in the Scenario of High Growth (SHG), where
the diffusion rate in the rest of Italy is also assumed to be higher at 6%.
Table 7: Assumptions per scenario, GREENWOOLF
Assumption SLG SRG SHG Diffusion rate in the Piedmont region by 2020 33% 50% 67%
Diffusion rate in the rest of Italy by 2020 2% 4% 6%
Under the growth assumptions of the SRG, the technology developed by the project is applied
in 2020 to 45 tonnes of coarse wool in the Piedmont Region (50% diffusion rate * 90 tonnes of
coarse wool per year) and 720 tonnes in the rest of Italy (4% diffusion rate * 18,000 tonnes).
This adds up to 765 tonnes of coarse wool per year, out of which 574 tonnes (or 75%) are
processed in the GREENWOOLF installations to turn a solid waste component with detrimental
environmental characteristics into a fertiliser. Assuming that the wholesale price of the
resulting fertiliser stands at about 0.50 €/kg, the value of the output generated by this technology in the SRG in 2020 stands at about €287,000 (574 tonnes * 0.50 €/kg). Overall, under this scenario, the value of output between 2016 and 2020 totals €588,000.
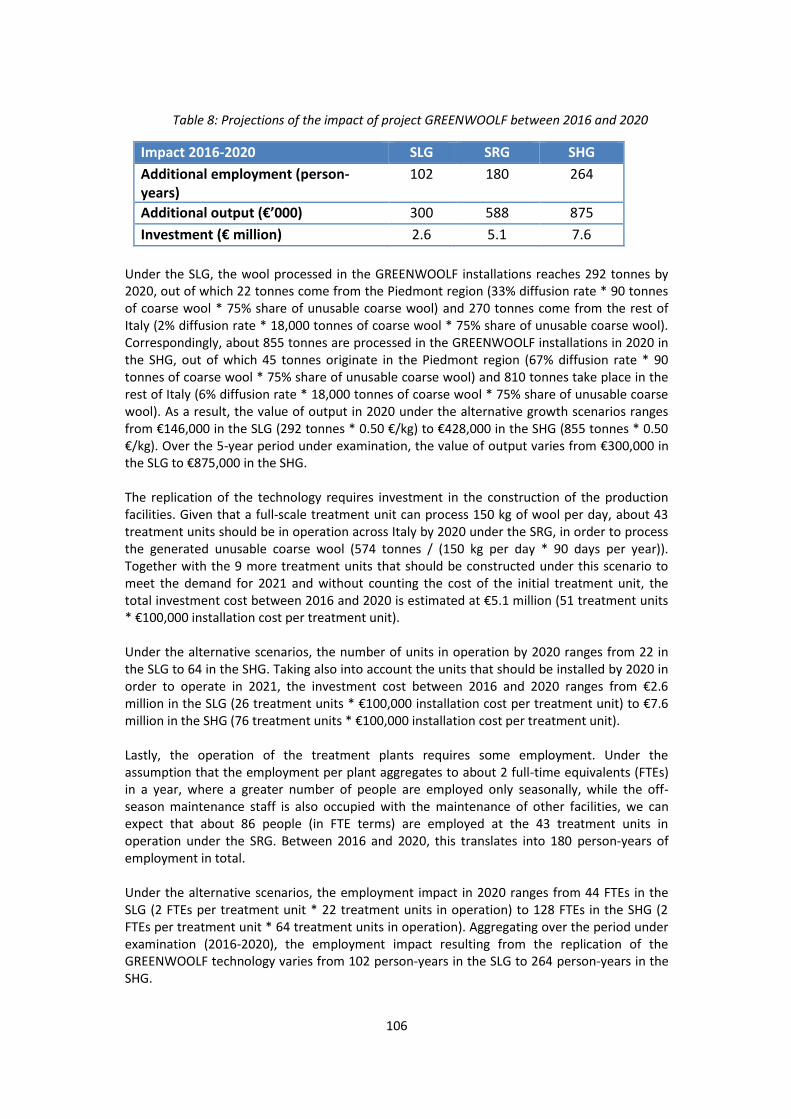
106
Table 8: Projections of the impact of project GREENWOOLF between 2016 and 2020
Impact 2016-2020 SLG SRG SHG Additional employment (person-years)
102 180 264
Additional output (€’000) 300 588 875
Investment (€ million) 2.6 5.1 7.6
Under the SLG, the wool processed in the GREENWOOLF installations reaches 292 tonnes by
2020, out of which 22 tonnes come from the Piedmont region (33% diffusion rate * 90 tonnes
of coarse wool * 75% share of unusable coarse wool) and 270 tonnes come from the rest of
Italy (2% diffusion rate * 18,000 tonnes of coarse wool * 75% share of unusable coarse wool).
Correspondingly, about 855 tonnes are processed in the GREENWOOLF installations in 2020 in
the SHG, out of which 45 tonnes originate in the Piedmont region (67% diffusion rate * 90
tonnes of coarse wool * 75% share of unusable coarse wool) and 810 tonnes take place in the
rest of Italy (6% diffusion rate * 18,000 tonnes of coarse wool * 75% share of unusable coarse
wool). As a result, the value of output in 2020 under the alternative growth scenarios ranges
from €146,000 in the SLG (292 tonnes * 0.50 €/kg) to €428,000 in the SHG (855 tonnes * 0.50 €/kg). Over the 5-year period under examination, the value of output varies from €300,000 in
the SLG to €875,000 in the SHG.
The replication of the technology requires investment in the construction of the production
facilities. Given that a full-scale treatment unit can process 150 kg of wool per day, about 43
treatment units should be in operation across Italy by 2020 under the SRG, in order to process
the generated unusable coarse wool (574 tonnes / (150 kg per day * 90 days per year)).
Together with the 9 more treatment units that should be constructed under this scenario to
meet the demand for 2021 and without counting the cost of the initial treatment unit, the
total investment cost between 2016 and 2020 is estimated at €5.1 million (51 treatment units * €100,000 installation cost per treatment unit).
Under the alternative scenarios, the number of units in operation by 2020 ranges from 22 in
the SLG to 64 in the SHG. Taking also into account the units that should be installed by 2020 in
order to operate in 2021, the investment cost between 2016 and 2020 ranges from €2.6 million in the SLG (26 treatment units * €100,000 installation cost per treatment unit) to €7.6 million in the SHG (76 treatment units * €100,000 installation cost per treatment unit).
Lastly, the operation of the treatment plants requires some employment. Under the
assumption that the employment per plant aggregates to about 2 full-time equivalents (FTEs)
in a year, where a greater number of people are employed only seasonally, while the off-
season maintenance staff is also occupied with the maintenance of other facilities, we can
expect that about 86 people (in FTE terms) are employed at the 43 treatment units in
operation under the SRG. Between 2016 and 2020, this translates into 180 person-years of
employment in total.
Under the alternative scenarios, the employment impact in 2020 ranges from 44 FTEs in the
SLG (2 FTEs per treatment unit * 22 treatment units in operation) to 128 FTEs in the SHG (2
FTEs per treatment unit * 64 treatment units in operation). Aggregating over the period under
examination (2016-2020), the employment impact resulting from the replication of the
GREENWOOLF technology varies from 102 person-years in the SLG to 264 person-years in the
SHG.
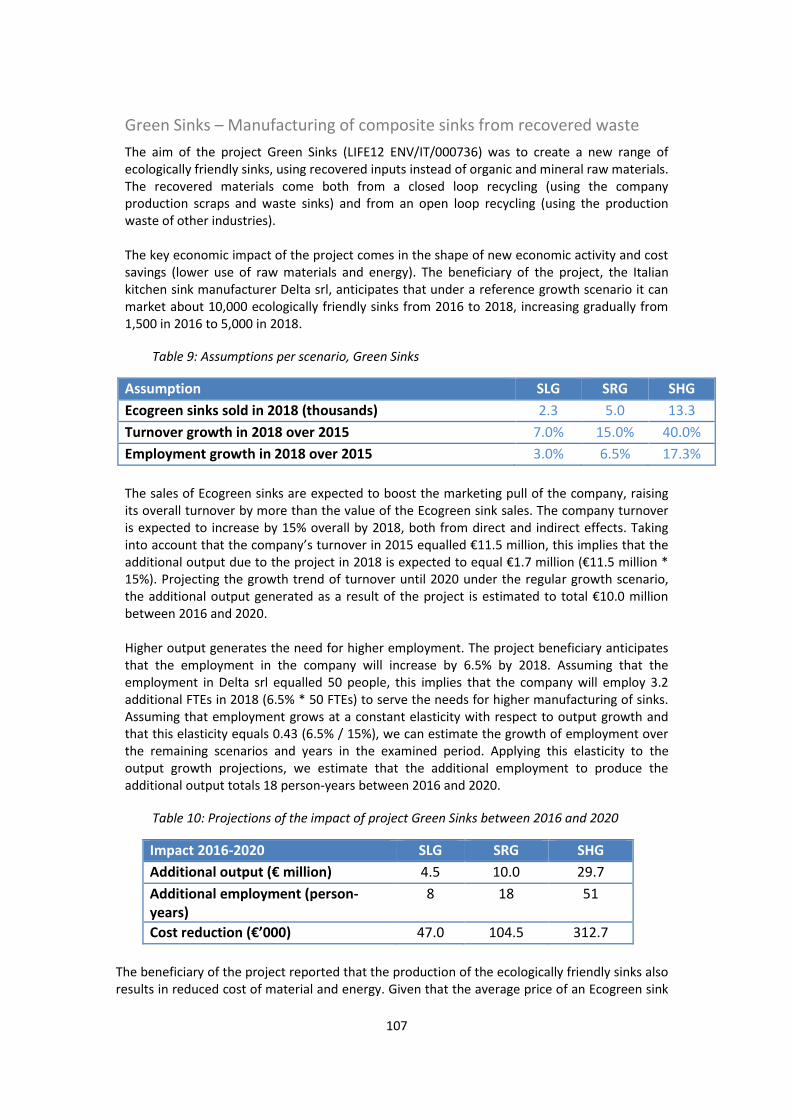
107
Green Sinks – Manufacturing of composite sinks from recovered waste
The aim of the project Green Sinks (LIFE12 ENV/IT/000736) was to create a new range of
ecologically friendly sinks, using recovered inputs instead of organic and mineral raw materials.
The recovered materials come both from a closed loop recycling (using the company
production scraps and waste sinks) and from an open loop recycling (using the production
waste of other industries).
The key economic impact of the project comes in the shape of new economic activity and cost
savings (lower use of raw materials and energy). The beneficiary of the project, the Italian
kitchen sink manufacturer Delta srl, anticipates that under a reference growth scenario it can
market about 10,000 ecologically friendly sinks from 2016 to 2018, increasing gradually from
1,500 in 2016 to 5,000 in 2018.
Table 9: Assumptions per scenario, Green Sinks
Assumption SLG SRG SHG Ecogreen sinks sold in 2018 (thousands) 2.3 5.0 13.3
Turnover growth in 2018 over 2015 7.0% 15.0% 40.0%
Employment growth in 2018 over 2015 3.0% 6.5% 17.3%
The sales of Ecogreen sinks are expected to boost the marketing pull of the company, raising
its overall turnover by more than the value of the Ecogreen sink sales. The company turnover
is expected to increase by 15% overall by 2018, both from direct and indirect effects. Taking
into account that the company’s turnover in 2015 equalled €11.5 million, this implies that the additional output due to the project in 2018 is expected to equal €1.7 million (€11.5 million * 15%). Projecting the growth trend of turnover until 2020 under the regular growth scenario,
the additional output generated as a result of the project is estimated to total €10.0 million between 2016 and 2020.
Higher output generates the need for higher employment. The project beneficiary anticipates
that the employment in the company will increase by 6.5% by 2018. Assuming that the
employment in Delta srl equalled 50 people, this implies that the company will employ 3.2
additional FTEs in 2018 (6.5% * 50 FTEs) to serve the needs for higher manufacturing of sinks.
Assuming that employment grows at a constant elasticity with respect to output growth and
that this elasticity equals 0.43 (6.5% / 15%), we can estimate the growth of employment over
the remaining scenarios and years in the examined period. Applying this elasticity to the
output growth projections, we estimate that the additional employment to produce the
additional output totals 18 person-years between 2016 and 2020.
Table 10: Projections of the impact of project Green Sinks between 2016 and 2020
Impact 2016-2020 SLG SRG SHG Additional output (€ million) 4.5 10.0 29.7
Additional employment (person-years)
8 18 51
Cost reduction (€’000) 47.0 104.5 312.7
The beneficiary of the project reported that the production of the ecologically friendly sinks also
results in reduced cost of material and energy. Given that the average price of an Ecogreen sink
108
stands at €85 and under the assumptions that the sink manufacturer operates at 35% gross
profit margin and that the cost of materials and energy takes up about half of the total cost of
goods sold, the cost of materials and energy is estimated at €27.6 per sink (€85 per sink * (1 -
35% gross profit margin) * 50% share of materials in total cost). The above price estimate
incorporates a saving in terms of a lower cost of materials and energy by 15%, which implies
that the cost of materials and energy for producing conventional sinks is higher by 17.6% (15% /
(1 – 15%). Therefore, the unit cost saving equals €4.86 per sink (€27.6 cost of materials per sink * 17.6% imputed cost saving). Given the expectations for selling 1,500 sinks in 2016, the cost
reduction achieved in that year in the reference growth scenario exceeds €7,300 in total (€4.86 cost savings per sink * 1,500 sinks). Overall between 2016 and 2020, the total cost saving from
the production of Ecogreen sinks is estimated at €104,500 in the reference growth scenario.
Significant additional investment is not anticipated between 2016 and 2020, given that the
replication presented here takes place in the facilities of the project beneficiary. It is reasonable
to expect that any new equipment and machinery is put in place before the start of the mass
production of Ecogreen sinks in 2016.
The project beneficiary has also estimated turnover growth under a low growth and high growth
scenarios. Under the low growth scenario, turnover is expected to increase by 7% until 2018,
while the corresponding cumulative growth in the high growth scenario stands at 40%.
Projecting these trends growth to 2020 results in an estimate for the additional output of sinks
between 2016 and 2020 at €4.5 million in the scenario of low growth and €29.7 million in the high growth scenario.
Applying the employment elasticity with respect to output to the output growth projections in
the alternative scenarios results in expectations for higher employment in 2018 by 3% in the low
growth scenario (0.43 elasticity of labour with respect to output * 7% output growth) and by
17% in the scenario of high growth (0.43 elasticity of labour with respect to output * 40% output
growth). As a result, the additional employment between 2016 and 2020 in the two alternative
scenarios equals 8 person-years in the SLG and 51 person-years in the SHG.
Regarding the cost reduction over the examined period under the two alternative scenarios, we
need to estimate the sales of Ecogreen sinks first and then apply the cost reduction parameters
to the alternative sales projections. Given that the turnover growth under the SLG is lower by
53% in 2018 compared to the reference scenario, we assume that about 2,300 sinks are sold in
2018 (5,000 sinks in the SRG * (1-53%)) in the low growth scenario. Correspondingly, the
number of sinks sold in 2018 under the high growth scenario is estimated at about 13,300 sinks
(5,000 sinks * 2.7 times higher output growth in the SHG than in the SRG). Applying the unit cost
saving estimate to these projections results in the anticipation of material cost saving by about
€11,400 (2,333 sinks * cost saving of €4.86 per sink) in the low growth scenario and €65,000 in the SHG (13,333 sinks * €4.86 per sink). Summing up the estimates over the projection period, the total cost reduction between 2016 and 2020 equals about €47,000 in the SLG and about
€313,000 in the high growth scenario.
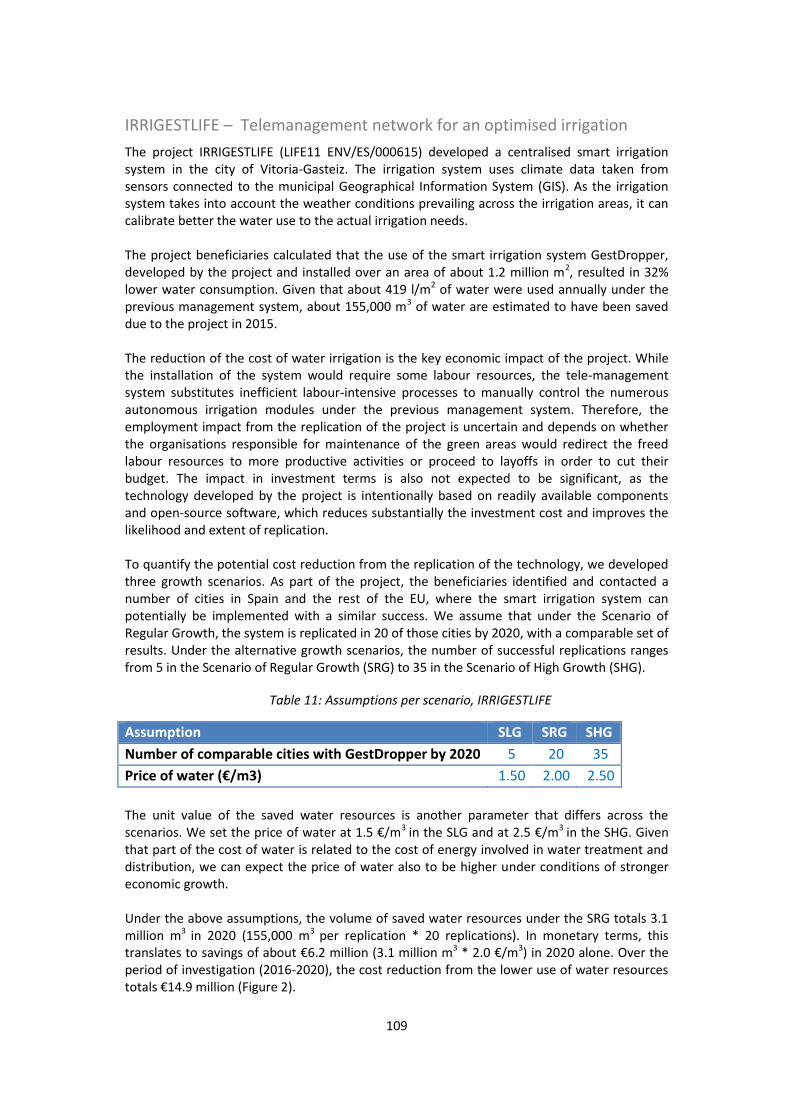
109
IRRIGESTLIFE – Telemanagement network for an optimised irrigation
The project IRRIGESTLIFE (LIFE11 ENV/ES/000615) developed a centralised smart irrigation
system in the city of Vitoria-Gasteiz. The irrigation system uses climate data taken from
sensors connected to the municipal Geographical Information System (GIS). As the irrigation
system takes into account the weather conditions prevailing across the irrigation areas, it can
calibrate better the water use to the actual irrigation needs.
The project beneficiaries calculated that the use of the smart irrigation system GestDropper,
developed by the project and installed over an area of about 1.2 million m2, resulted in 32%
lower water consumption. Given that about 419 l/m2 of water were used annually under the
previous management system, about 155,000 m3 of water are estimated to have been saved
due to the project in 2015.
The reduction of the cost of water irrigation is the key economic impact of the project. While
the installation of the system would require some labour resources, the tele-management
system substitutes inefficient labour-intensive processes to manually control the numerous
autonomous irrigation modules under the previous management system. Therefore, the
employment impact from the replication of the project is uncertain and depends on whether
the organisations responsible for maintenance of the green areas would redirect the freed
labour resources to more productive activities or proceed to layoffs in order to cut their
budget. The impact in investment terms is also not expected to be significant, as the
technology developed by the project is intentionally based on readily available components
and open-source software, which reduces substantially the investment cost and improves the
likelihood and extent of replication.
To quantify the potential cost reduction from the replication of the technology, we developed
three growth scenarios. As part of the project, the beneficiaries identified and contacted a
number of cities in Spain and the rest of the EU, where the smart irrigation system can
potentially be implemented with a similar success. We assume that under the Scenario of
Regular Growth, the system is replicated in 20 of those cities by 2020, with a comparable set of
results. Under the alternative growth scenarios, the number of successful replications ranges
from 5 in the Scenario of Regular Growth (SRG) to 35 in the Scenario of High Growth (SHG).
Table 11: Assumptions per scenario, IRRIGESTLIFE
Assumption SLG SRG SHG Number of comparable cities with GestDropper by 2020 5 20 35
Price of water (€/m3) 1.50 2.00 2.50
The unit value of the saved water resources is another parameter that differs across the
scenarios. We set the price of water at 1.5 €/m3 in the SLG and at 2.5 €/m3 in the SHG. Given
that part of the cost of water is related to the cost of energy involved in water treatment and
distribution, we can expect the price of water also to be higher under conditions of stronger
economic growth.
Under the above assumptions, the volume of saved water resources under the SRG totals 3.1
million m3
in 2020 (155,000 m3
per replication * 20 replications). In monetary terms, this
translates to savings of about €6.2 million (3.1 million m3 * 2.0 €/m3
) in 2020 alone. Over the
period of investigation (2016-2020), the cost reduction from the lower use of water resources
totals €14.9 million (Figure 2).
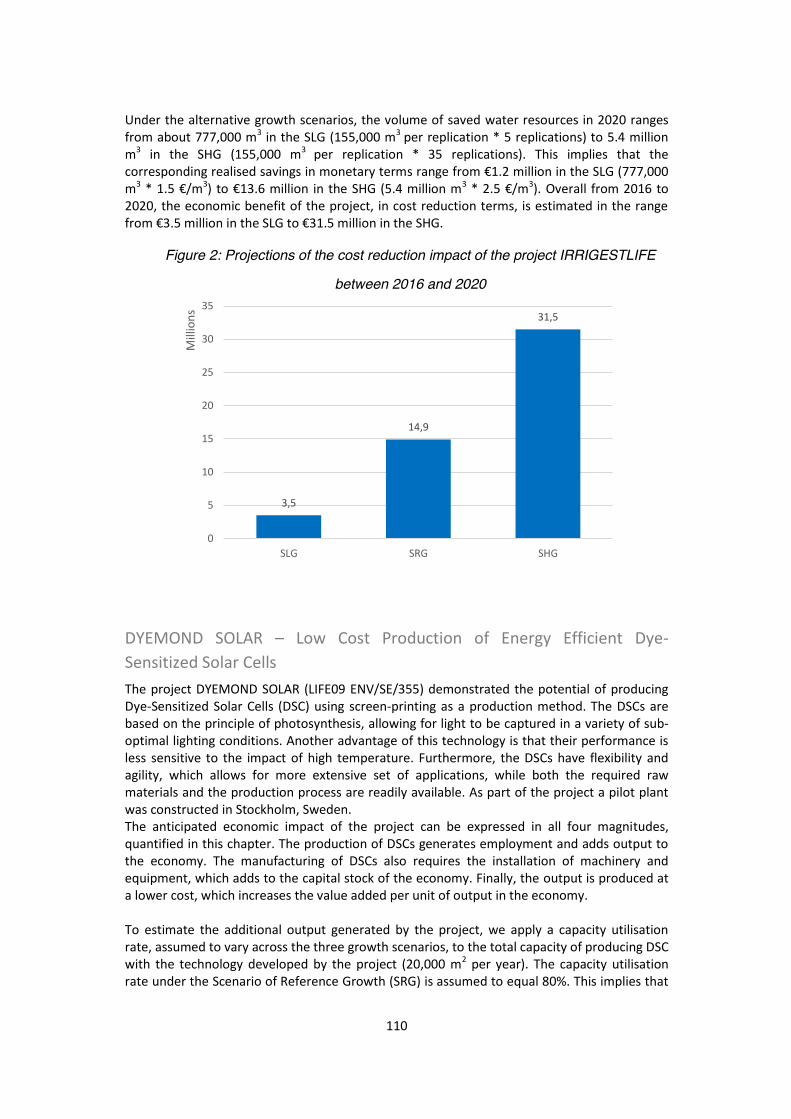
110
Under the alternative growth scenarios, the volume of saved water resources in 2020 ranges
from about 777,000 m3 in the SLG (155,000 m
3 per replication * 5 replications) to 5.4 million
m3 in the SHG (155,000 m
3 per replication * 35 replications). This implies that the
corresponding realised savings in monetary terms range from €1.2 million in the SLG (777,000 m
3 * 1.5 €/m3) to €13.6 million in the SHG (5.4 million m3
* 2.5 €/m3). Overall from 2016 to
2020, the economic benefit of the project, in cost reduction terms, is estimated in the range
from €3.5 million in the SLG to €31.5 million in the SHG.
Figure 2: Projections of the cost reduction impact of the project IRRIGESTLIFE
between 2016 and 2020
DYEMOND SOLAR – Low Cost Production of Energy Efficient Dye-
Sensitized Solar Cells
The project DYEMOND SOLAR (LIFE09 ENV/SE/355) demonstrated the potential of producing
Dye-Sensitized Solar Cells (DSC) using screen-printing as a production method. The DSCs are
based on the principle of photosynthesis, allowing for light to be captured in a variety of sub-
optimal lighting conditions. Another advantage of this technology is that their performance is
less sensitive to the impact of high temperature. Furthermore, the DSCs have flexibility and
agility, which allows for more extensive set of applications, while both the required raw
materials and the production process are readily available. As part of the project a pilot plant
was constructed in Stockholm, Sweden.
The anticipated economic impact of the project can be expressed in all four magnitudes,
quantified in this chapter. The production of DSCs generates employment and adds output to
the economy. The manufacturing of DSCs also requires the installation of machinery and
equipment, which adds to the capital stock of the economy. Finally, the output is produced at
a lower cost, which increases the value added per unit of output in the economy.
To estimate the additional output generated by the project, we apply a capacity utilisation
rate, assumed to vary across the three growth scenarios, to the total capacity of producing DSC
with the technology developed by the project (20,000 m2 per year). The capacity utilisation
rate under the Scenario of Reference Growth (SRG) is assumed to equal 80%. This implies that
3,5
14,9
31,5
0
5
10
15
20
25
30
35
SLG SRG SHG
Mil
lio
ns
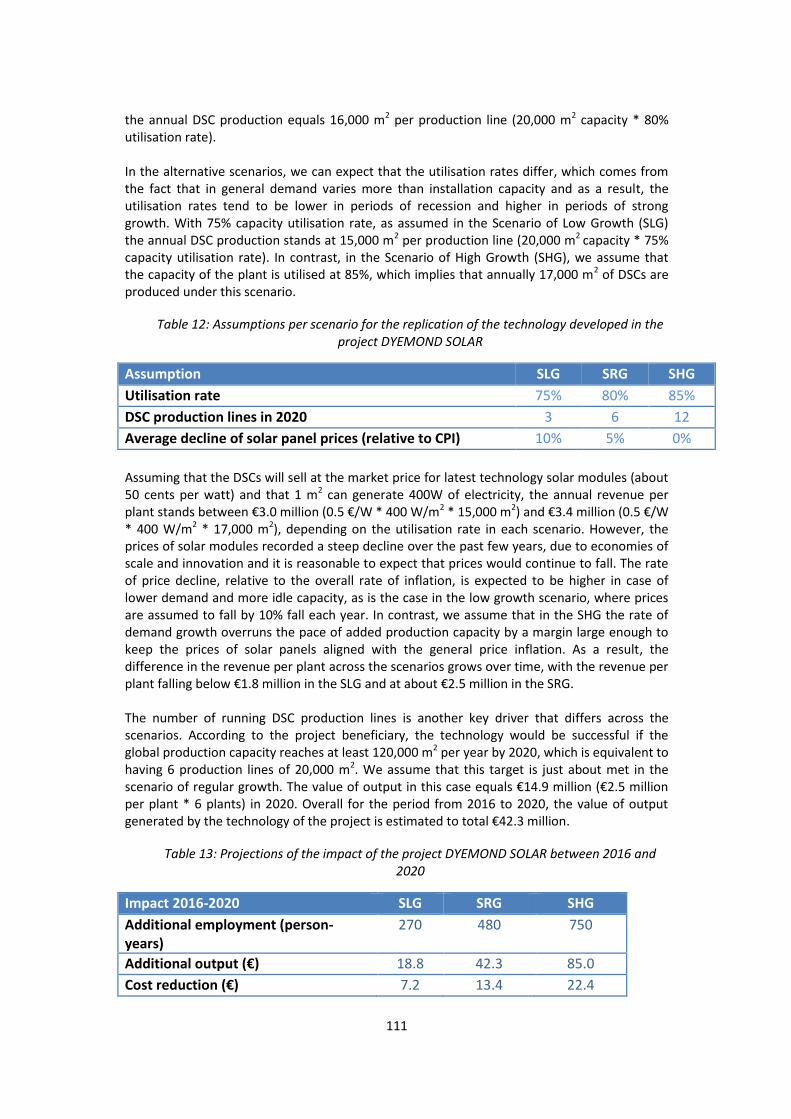
111
the annual DSC production equals 16,000 m2 per production line (20,000 m
2 capacity * 80%
utilisation rate).
In the alternative scenarios, we can expect that the utilisation rates differ, which comes from
the fact that in general demand varies more than installation capacity and as a result, the
utilisation rates tend to be lower in periods of recession and higher in periods of strong
growth. With 75% capacity utilisation rate, as assumed in the Scenario of Low Growth (SLG)
the annual DSC production stands at 15,000 m2 per production line (20,000 m
2 capacity * 75%
capacity utilisation rate). In contrast, in the Scenario of High Growth (SHG), we assume that
the capacity of the plant is utilised at 85%, which implies that annually 17,000 m2 of DSCs are
produced under this scenario.
Table 12: Assumptions per scenario for the replication of the technology developed in the project DYEMOND SOLAR
Assumption SLG SRG SHG Utilisation rate 75% 80% 85%
DSC production lines in 2020 3 6 12
Average decline of solar panel prices (relative to CPI) 10% 5% 0%
Assuming that the DSCs will sell at the market price for latest technology solar modules (about
50 cents per watt) and that 1 m2 can generate 400W of electricity, the annual revenue per
plant stands between €3.0 million (0.5 €/W * 400 W/m2 * 15,000 m
2) and €3.4 million (0.5 €/W * 400 W/m
2 * 17,000 m
2), depending on the utilisation rate in each scenario. However, the
prices of solar modules recorded a steep decline over the past few years, due to economies of
scale and innovation and it is reasonable to expect that prices would continue to fall. The rate
of price decline, relative to the overall rate of inflation, is expected to be higher in case of
lower demand and more idle capacity, as is the case in the low growth scenario, where prices
are assumed to fall by 10% fall each year. In contrast, we assume that in the SHG the rate of
demand growth overruns the pace of added production capacity by a margin large enough to
keep the prices of solar panels aligned with the general price inflation. As a result, the
difference in the revenue per plant across the scenarios grows over time, with the revenue per
plant falling below €1.8 million in the SLG and at about €2.5 million in the SRG.
The number of running DSC production lines is another key driver that differs across the
scenarios. According to the project beneficiary, the technology would be successful if the
global production capacity reaches at least 120,000 m2 per year by 2020, which is equivalent to
having 6 production lines of 20,000 m2. We assume that this target is just about met in the
scenario of regular growth. The value of output in this case equals €14.9 million (€2.5 million per plant * 6 plants) in 2020. Overall for the period from 2016 to 2020, the value of output
generated by the technology of the project is estimated to total €42.3 million.
Table 13: Projections of the impact of the project DYEMOND SOLAR between 2016 and 2020
Impact 2016-2020 SLG SRG SHG Additional employment (person-years)
270 480 750
Additional output (€) 18.8 42.3 85.0
Cost reduction (€) 7.2 13.4 22.4
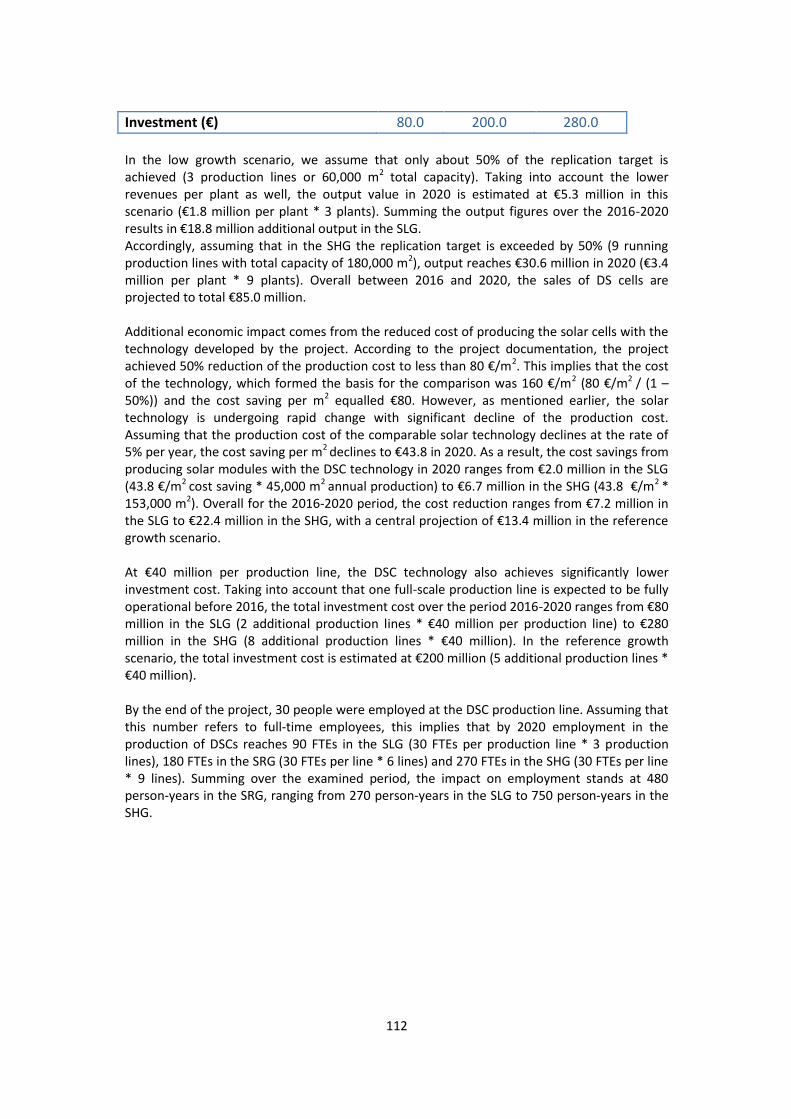
112
Investment (€) 80.0 200.0 280.0
In the low growth scenario, we assume that only about 50% of the replication target is
achieved (3 production lines or 60,000 m2 total capacity). Taking into account the lower
revenues per plant as well, the output value in 2020 is estimated at €5.3 million in this scenario (€1.8 million per plant * 3 plants). Summing the output figures over the 2016-2020
results in €18.8 million additional output in the SLG.
Accordingly, assuming that in the SHG the replication target is exceeded by 50% (9 running
production lines with total capacity of 180,000 m2), output reaches €30.6 million in 2020 (€3.4
million per plant * 9 plants). Overall between 2016 and 2020, the sales of DS cells are
projected to total €85.0 million.
Additional economic impact comes from the reduced cost of producing the solar cells with the
technology developed by the project. According to the project documentation, the project
achieved 50% reduction of the production cost to less than 80 €/m2. This implies that the cost
of the technology, which formed the basis for the comparison was 160 €/m2 (80 €/m2
/ (1 –
50%)) and the cost saving per m2 equalled €80. However, as mentioned earlier, the solar
technology is undergoing rapid change with significant decline of the production cost.
Assuming that the production cost of the comparable solar technology declines at the rate of
5% per year, the cost saving per m2 declines to €43.8 in 2020. As a result, the cost savings from
producing solar modules with the DSC technology in 2020 ranges from €2.0 million in the SLG (43.8 €/m2
cost saving * 45,000 m2 annual production) to €6.7 million in the SHG (43.8 €/m2
*
153,000 m2). Overall for the 2016-2020 period, the cost reduction ranges from €7.2 million in
the SLG to €22.4 million in the SHG, with a central projection of €13.4 million in the reference growth scenario.
At €40 million per production line, the DSC technology also achieves significantly lower
investment cost. Taking into account that one full-scale production line is expected to be fully
operational before 2016, the total investment cost over the period 2016-2020 ranges from €80 million in the SLG (2 additional production lines * €40 million per production line) to €280 million in the SHG (8 additional production lines * €40 million). In the reference growth
scenario, the total investment cost is estimated at €200 million (5 additional production lines * €40 million).
By the end of the project, 30 people were employed at the DSC production line. Assuming that
this number refers to full-time employees, this implies that by 2020 employment in the
production of DSCs reaches 90 FTEs in the SLG (30 FTEs per production line * 3 production
lines), 180 FTEs in the SRG (30 FTEs per line * 6 lines) and 270 FTEs in the SHG (30 FTEs per line
* 9 lines). Summing over the examined period, the impact on employment stands at 480
person-years in the SRG, ranging from 270 person-years in the SLG to 750 person-years in the
SHG.
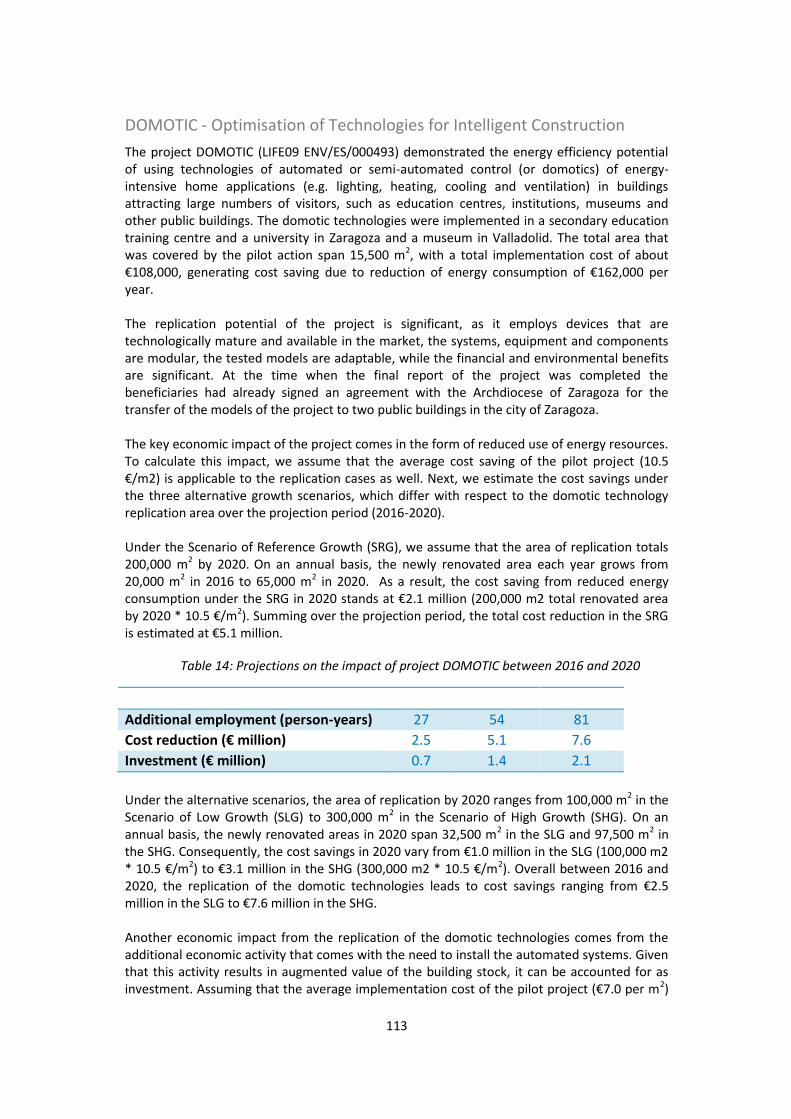
113
DOMOTIC - Optimisation of Technologies for Intelligent Construction
The project DOMOTIC (LIFE09 ENV/ES/000493) demonstrated the energy efficiency potential
of using technologies of automated or semi-automated control (or domotics) of energy-
intensive home applications (e.g. lighting, heating, cooling and ventilation) in buildings
attracting large numbers of visitors, such as education centres, institutions, museums and
other public buildings. The domotic technologies were implemented in a secondary education
training centre and a university in Zaragoza and a museum in Valladolid. The total area that
was covered by the pilot action span 15,500 m2, with a total implementation cost of about
€108,000, generating cost saving due to reduction of energy consumption of €162,000 per year.
The replication potential of the project is significant, as it employs devices that are
technologically mature and available in the market, the systems, equipment and components
are modular, the tested models are adaptable, while the financial and environmental benefits
are significant. At the time when the final report of the project was completed the
beneficiaries had already signed an agreement with the Archdiocese of Zaragoza for the
transfer of the models of the project to two public buildings in the city of Zaragoza.
The key economic impact of the project comes in the form of reduced use of energy resources.
To calculate this impact, we assume that the average cost saving of the pilot project (10.5
€/m2) is applicable to the replication cases as well. Next, we estimate the cost savings under the three alternative growth scenarios, which differ with respect to the domotic technology
replication area over the projection period (2016-2020).
Under the Scenario of Reference Growth (SRG), we assume that the area of replication totals
200,000 m2 by 2020.
On an annual basis, the newly renovated area each year grows from
20,000 m2 in 2016 to 65,000 m
2 in 2020. As a result, the cost saving from reduced energy
consumption under the SRG in 2020 stands at €2.1 million (200,000 m2 total renovated area by 2020 * 10.5 €/m2
). Summing over the projection period, the total cost reduction in the SRG
is estimated at €5.1 million.
Table 14: Projections on the impact of project DOMOTIC between 2016 and 2020
Impact 2016-2020 SLG SRG SHG Additional employment (person-years) 27 54 81
Cost reduction (€ million) 2.5 5.1 7.6
Investment (€ million) 0.7 1.4 2.1
Under the alternative scenarios, the area of replication by 2020 ranges from 100,000 m2 in the
Scenario of Low Growth (SLG) to 300,000 m2 in the Scenario of High Growth (SHG). On an
annual basis, the newly renovated areas in 2020 span 32,500 m2 in the SLG and 97,500 m
2 in
the SHG. Consequently, the cost savings in 2020 vary from €1.0 million in the SLG (100,000 m2 * 10.5 €/m2) to €3.1 million in the SHG (300,000 m2 * 10.5 €/m2
). Overall between 2016 and
2020, the replication of the domotic technologies leads to cost savings ranging from €2.5 million in the SLG to €7.6 million in the SHG.
Another economic impact from the replication of the domotic technologies comes from the
additional economic activity that comes with the need to install the automated systems. Given
that this activity results in augmented value of the building stock, it can be accounted for as
investment. Assuming that the average implementation cost of the pilot project (€7.0 per m2)
114
remains applicable in the replication phase, the investment cost in the SRG in 2020 totals
453,000 (65,000 m2 newly renovated area in 2020 * €7.0 per m2
average implementation cost).
Over the projection period, investment in the domotic technologies totals €1.4 million in the SRG. Under the alternative scenarios, investment in 2020 ranges from €227,000 in the SLG (32,500 m
2 * €7.0 per m2) to €680,000 in the SHG
(97,500 m2 * €7.0 per m2
). Overall from 2016
to 2020, investment totals €697,000 in the SLG and €2.1 million in the SHG.
Given that the project automates processes that lead to cost saving, its employment impact is
fairly limited. Using the estimate found in the literature that 17 jobs are created for each
million of expenditure on energy efficiency interventions on average,25
about 7.7 FTEs are
generated in 2020 under the SRG (€453,000 investment cost * 17 FTEs per million of investment). In addition, the automated system incurs annual maintenance cost of about
€27,000 per year, as reported by the project beneficiaries. Assuming that 90% of this cost is taken up by expenditure to cover the labour services of IT technicians and that the gross
labour earning of the needed personnel equals €25,000 per FTE, this implies that about one FTE is required for the maintenance of the technologies installed by the pilot. We next assume
that the ratio of employment per area of renovated building (1 FTE / 15,500 m2 = 0.06
FTEs/’000 m2) holds for the replication phase as well. As a result, we estimate that in 2020
about 12.6 FTEs would be required to maintain the installed automated systems (0.06 FTEs
/’000 m2 * 200,000 m
2 total renovated area). Therefore, about 20.3 FTEs are employed in 2020
for services related to the replication of the project in the SRG. Over the projection period, the
employment impact totals 54 person-years in the SRG.
In the alternative scenarios, the employment for the installation of the automated system in
2020 ranges from 4 FTEs in the SLG (€227,000 investment cost * 17 FTEs per million of investment) to 12 FTEs in the SHG (€680,000 investment cost * 17 FTEs per million of
investment). Correspondingly, about 6 FTEs are employed as maintenance staff in the SLG
(0.06 FTEs /’000 m2 * 100,000 m
2 total renovated area), while in the SHG the maintenance staff
for the same year numbers 19 FTEs (0.06 FTEs /’000 m2 * 300,000 m
2 total renovated area). In
total for 2020, about 10 FTEs in the SLG and about 30 FTEs in the SHG are employed either for
the installation or the maintenance of the domotic technologies. Overall between 2016 and
2020, the employment impact of the replication of the project ranges from 27 person-years in
the SLG to 81 person-years in the SHG.
25
Pikas et al. (2015) in Cambridge Econometrics (2015), Assessing the Employment and Social Impact of Energy
Efficiency.
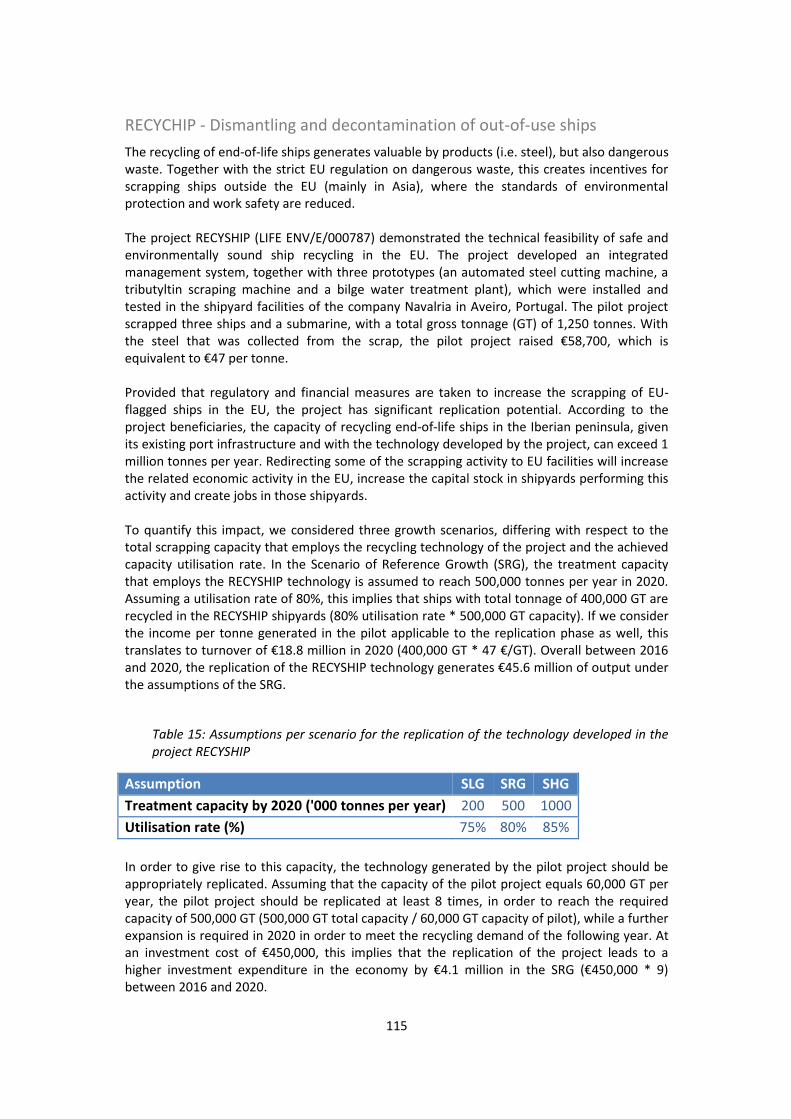
115
RECYCHIP - Dismantling and decontamination of out-of-use ships
The recycling of end-of-life ships generates valuable by products (i.e. steel), but also dangerous
waste. Together with the strict EU regulation on dangerous waste, this creates incentives for
scrapping ships outside the EU (mainly in Asia), where the standards of environmental
protection and work safety are reduced.
The project RECYSHIP (LIFE ENV/E/000787) demonstrated the technical feasibility of safe and
environmentally sound ship recycling in the EU. The project developed an integrated
management system, together with three prototypes (an automated steel cutting machine, a
tributyltin scraping machine and a bilge water treatment plant), which were installed and
tested in the shipyard facilities of the company Navalria in Aveiro, Portugal. The pilot project
scrapped three ships and a submarine, with a total gross tonnage (GT) of 1,250 tonnes. With
the steel that was collected from the scrap, the pilot project raised €58,700, which is equivalent to €47 per tonne.
Provided that regulatory and financial measures are taken to increase the scrapping of EU-
flagged ships in the EU, the project has significant replication potential. According to the
project beneficiaries, the capacity of recycling end-of-life ships in the Iberian peninsula, given
its existing port infrastructure and with the technology developed by the project, can exceed 1
million tonnes per year. Redirecting some of the scrapping activity to EU facilities will increase
the related economic activity in the EU, increase the capital stock in shipyards performing this
activity and create jobs in those shipyards.
To quantify this impact, we considered three growth scenarios, differing with respect to the
total scrapping capacity that employs the recycling technology of the project and the achieved
capacity utilisation rate. In the Scenario of Reference Growth (SRG), the treatment capacity
that employs the RECYSHIP technology is assumed to reach 500,000 tonnes per year in 2020.
Assuming a utilisation rate of 80%, this implies that ships with total tonnage of 400,000 GT are
recycled in the RECYSHIP shipyards (80% utilisation rate * 500,000 GT capacity). If we consider
the income per tonne generated in the pilot applicable to the replication phase as well, this
translates to turnover of €18.8 million in 2020 (400,000 GT * 47 €/GT). Overall between 2016 and 2020, the replication of the RECYSHIP technology generates €45.6 million of output under the assumptions of the SRG.
Table 15: Assumptions per scenario for the replication of the technology developed in the project RECYSHIP
Assumption SLG SRG SHG Treatment capacity by 2020 ('000 tonnes per year) 200 500 1000
Utilisation rate (%) 75% 80% 85%
In order to give rise to this capacity, the technology generated by the pilot project should be
appropriately replicated. Assuming that the capacity of the pilot project equals 60,000 GT per
year, the pilot project should be replicated at least 8 times, in order to reach the required
capacity of 500,000 GT (500,000 GT total capacity / 60,000 GT capacity of pilot), while a further
expansion is required in 2020 in order to meet the recycling demand of the following year. At
an investment cost of €450,000, this implies that the replication of the project leads to a higher investment expenditure in the economy by €4.1 million in the SRG (€450,000 * 9) between 2016 and 2020.
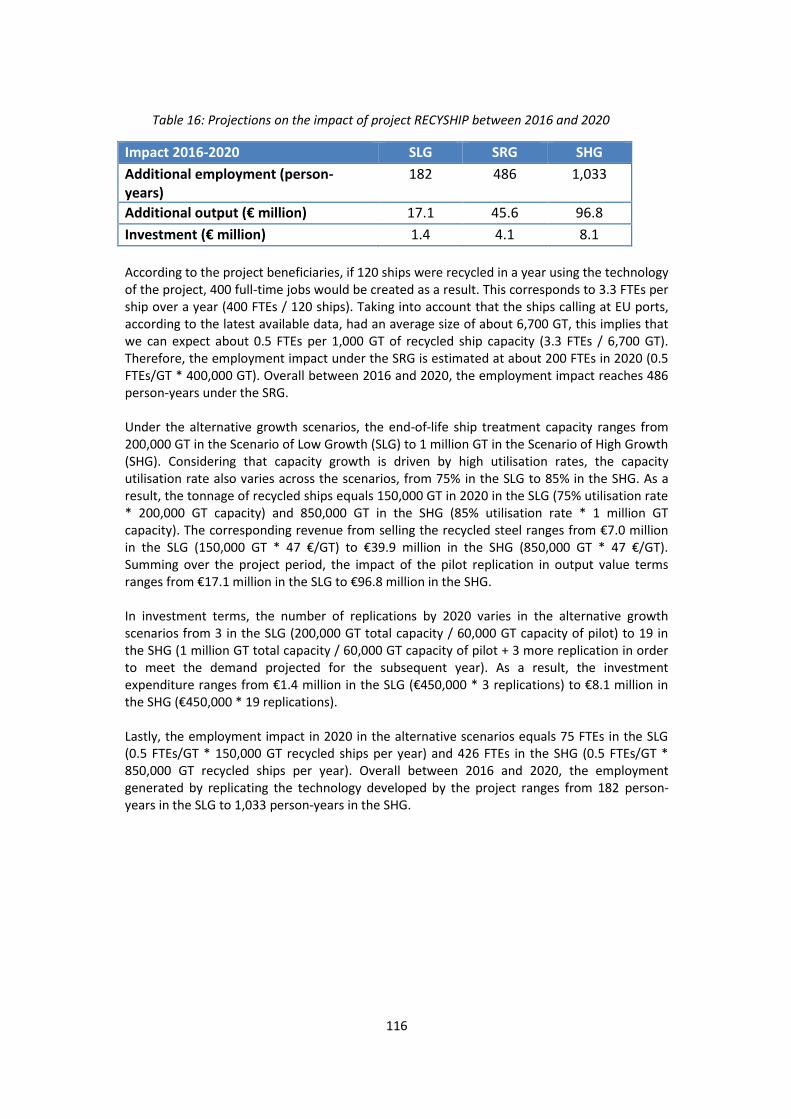
116
Table 16: Projections on the impact of project RECYSHIP between 2016 and 2020
Impact 2016-2020 SLG SRG SHG Additional employment (person-years)
182 486 1,033
Additional output (€ million) 17.1 45.6 96.8
Investment (€ million) 1.4 4.1 8.1
According to the project beneficiaries, if 120 ships were recycled in a year using the technology
of the project, 400 full-time jobs would be created as a result. This corresponds to 3.3 FTEs per
ship over a year (400 FTEs / 120 ships). Taking into account that the ships calling at EU ports,
according to the latest available data, had an average size of about 6,700 GT, this implies that
we can expect about 0.5 FTEs per 1,000 GT of recycled ship capacity (3.3 FTEs / 6,700 GT).
Therefore, the employment impact under the SRG is estimated at about 200 FTEs in 2020 (0.5
FTEs/GT * 400,000 GT). Overall between 2016 and 2020, the employment impact reaches 486
person-years under the SRG.
Under the alternative growth scenarios, the end-of-life ship treatment capacity ranges from
200,000 GT in the Scenario of Low Growth (SLG) to 1 million GT in the Scenario of High Growth
(SHG). Considering that capacity growth is driven by high utilisation rates, the capacity
utilisation rate also varies across the scenarios, from 75% in the SLG to 85% in the SHG. As a
result, the tonnage of recycled ships equals 150,000 GT in 2020 in the SLG (75% utilisation rate
* 200,000 GT capacity) and 850,000 GT in the SHG (85% utilisation rate * 1 million GT
capacity). The corresponding revenue from selling the recycled steel ranges from €7.0 million in the SLG (150,000 GT * 47 €/GT) to €39.9 million in the SHG (850,000 GT * 47 €/GT). Summing over the project period, the impact of the pilot replication in output value terms
ranges from €17.1 million in the SLG to €96.8 million in the SHG.
In investment terms, the number of replications by 2020 varies in the alternative growth
scenarios from 3 in the SLG (200,000 GT total capacity / 60,000 GT capacity of pilot) to 19 in
the SHG (1 million GT total capacity / 60,000 GT capacity of pilot + 3 more replication in order
to meet the demand projected for the subsequent year). As a result, the investment
expenditure ranges from €1.4 million in the SLG (€450,000 * 3 replications) to €8.1 million in the SHG (€450,000 * 19 replications).
Lastly, the employment impact in 2020 in the alternative scenarios equals 75 FTEs in the SLG
(0.5 FTEs/GT * 150,000 GT recycled ships per year) and 426 FTEs in the SHG (0.5 FTEs/GT *
850,000 GT recycled ships per year). Overall between 2016 and 2020, the employment
generated by replicating the technology developed by the project ranges from 182 person-
years in the SLG to 1,033 person-years in the SHG.
117
ELINA – Management of a waste stream in Shipping
The project ELINA (LIFE11 ENV/GR/000606) took place in Greece between September 2011
and February 2015. Its aim was to provide guidelines on the management of petroleum residues, commonly mixed with waste oils, generated in shipping and to demonstrate the possibility of on-shore collection and on-board separation of waste oils and petroleum residues. The guidelines identified a number of issues involved in the management of this waste streams
that should be integrated in the National Waste Management Strategy of Greece.
Furthermore, as part of its two pilot actions, the project team collected and analysed 7,236
tonnes from 487 on-shore plots, while the on-board mechanical adaptation of two passenger
vessels generated 70 m3 of separated waste until the project end date.
The ELINA project demonstrated the technical feasibility of separating at source the shipping waste oils and petroleum residues. Meanwhile, the separation at source of this waste stream has substantial economic benefits as well. Currently, the ship operators incur significant charges for the delivery of this waste stream.
They pay at least €450 per tonne for management of the waste within Greece. The cost could go up to €1000 for trans-boundary waste management.
The separation at source reduces the volume of the waste stream significantly (-80%), which generates significant savings to shipping companies. Under the conservative assumption that
all waste is disposed within Greece, incurring the lowest possible cost, the separation at source is estimated to generate savings to the shipping companies of €360 per tonne of mixed waste.
On the other hand, the waste management companies who collect and process the mixed waste lose revenue from the reduced waste volume. The lost net revenue that they incur,
however, is lower than the cost savings for the shipping companies, as the waste management
companies incur operating costs. The highest loss of revenue seems to incur to the waste management companies with the lowest operating cost - the producers of Refuse-Derived Fuel (RDF) with €100 per tonne. The RDF producers also pay for the disposal of the fuel to
cement producers who use it as a substitute of solid fuels in the production of clinker. The
price that they pay varies depending on the quality of RDF. Assuming that they pay €100 per tonne for RDF from the mixed waste stream and €80 per tonne for RDF from petroleum residues, the net revenue loss for the waste managers is estimated at €196 per tonne. Subtracting this figure from the cost saving of the ship owners results in net cost saving of €164 per tonne of mixed waste. In order to achieve the operating cost savings, the ship owners have to make adjustments to the vessels, incurring investment costs. From the perspective of national accounts, this translates into a positive impact in terms of fixed capital formation. The investment per vessel for the two pilot vessels equalled €16,625. The extent to which the cost savings and investment are realised depends on the replication of
the pilot technology. Already by the end of the projects, one of the project partners (ANEK
Lines), which operates passenger ships in Greece, declared its intention to implement the pilot
on two more of its vessels within 2015-2016. Given its participation in the project and the
considerable cost savings that it incurs, it is quite likely that by 2020 the technology is
replicated to the whole fleet of ANEK Lines (10 ships currently).
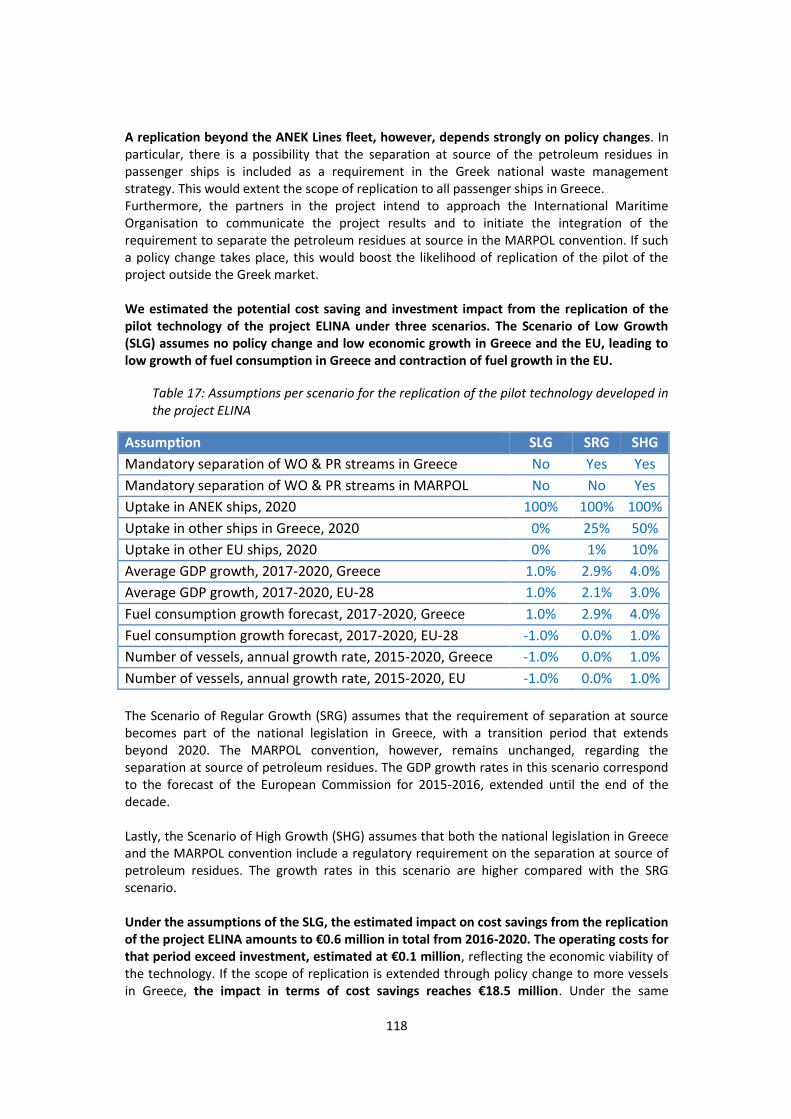
118
A replication beyond the ANEK Lines fleet, however, depends strongly on policy changes. In
particular, there is a possibility that the separation at source of the petroleum residues in
passenger ships is included as a requirement in the Greek national waste management
strategy. This would extent the scope of replication to all passenger ships in Greece.
Furthermore, the partners in the project intend to approach the International Maritime
Organisation to communicate the project results and to initiate the integration of the
requirement to separate the petroleum residues at source in the MARPOL convention. If such
a policy change takes place, this would boost the likelihood of replication of the pilot of the
project outside the Greek market.
We estimated the potential cost saving and investment impact from the replication of the pilot technology of the project ELINA under three scenarios. The Scenario of Low Growth (SLG) assumes no policy change and low economic growth in Greece and the EU, leading to low growth of fuel consumption in Greece and contraction of fuel growth in the EU.
Table 17: Assumptions per scenario for the replication of the pilot technology developed in the project ELINA
Assumption SLG SRG SHG Mandatory separation of WO & PR streams in Greece No Yes Yes
Mandatory separation of WO & PR streams in MARPOL No No Yes
Uptake in ANEK ships, 2020 100% 100% 100%
Uptake in other ships in Greece, 2020 0% 25% 50%
Uptake in other EU ships, 2020 0% 1% 10%
Average GDP growth, 2017-2020, Greece 1.0% 2.9% 4.0%
Average GDP growth, 2017-2020, EU-28 1.0% 2.1% 3.0%
Fuel consumption growth forecast, 2017-2020, Greece 1.0% 2.9% 4.0%
Fuel consumption growth forecast, 2017-2020, EU-28 -1.0% 0.0% 1.0%
Number of vessels, annual growth rate, 2015-2020, Greece -1.0% 0.0% 1.0%
Number of vessels, annual growth rate, 2015-2020, EU -1.0% 0.0% 1.0%
The Scenario of Regular Growth (SRG) assumes that the requirement of separation at source
becomes part of the national legislation in Greece, with a transition period that extends
beyond 2020. The MARPOL convention, however, remains unchanged, regarding the
separation at source of petroleum residues. The GDP growth rates in this scenario correspond
to the forecast of the European Commission for 2015-2016, extended until the end of the
decade.
Lastly, the Scenario of High Growth (SHG) assumes that both the national legislation in Greece
and the MARPOL convention include a regulatory requirement on the separation at source of
petroleum residues. The growth rates in this scenario are higher compared with the SRG
scenario.
Under the assumptions of the SLG, the estimated impact on cost savings from the replication of the project ELINA amounts to €0.6 million in total from 2016-2020. The operating costs for that period exceed investment, estimated at €0.1 million, reflecting the economic viability of
the technology. If the scope of replication is extended through policy change to more vessels
in Greece, the impact in terms of cost savings reaches €18.5 million. Under the same
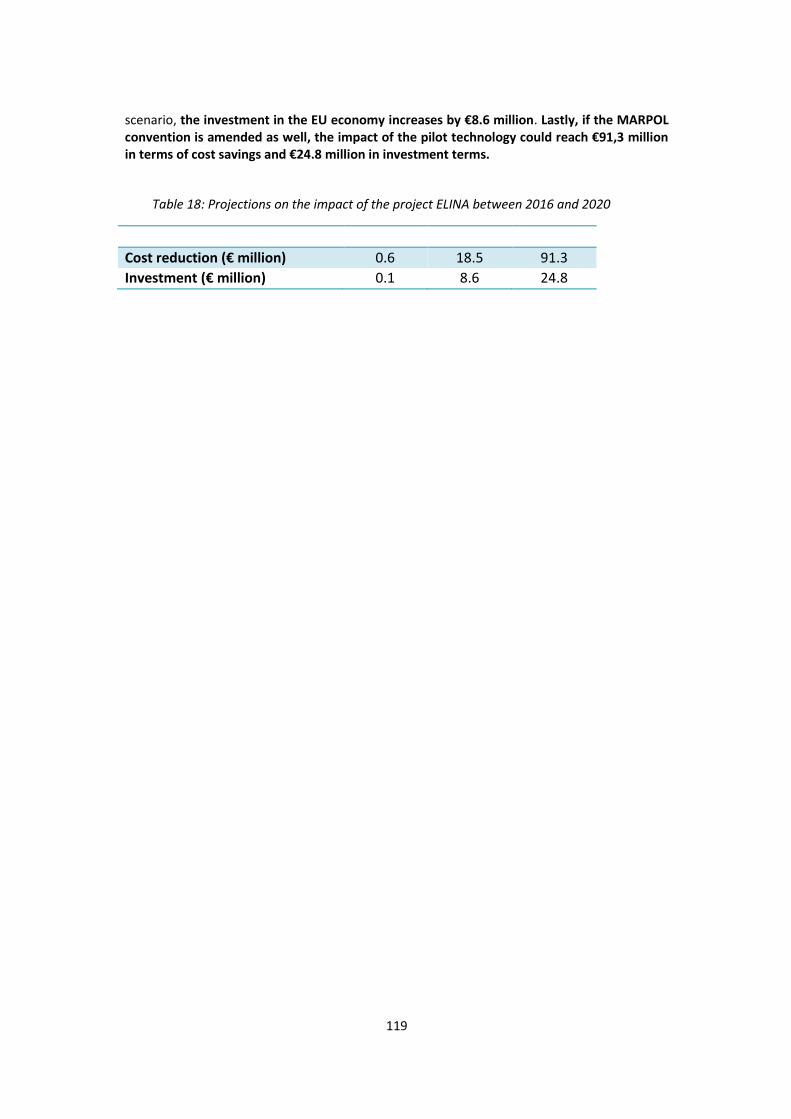
119
scenario, the investment in the EU economy increases by €8.6 million. Lastly, if the MARPOL convention is amended as well, the impact of the pilot technology could reach €91,3 million in terms of cost savings and €24.8 million in investment terms.
Table 18: Projections on the impact of the project ELINA between 2016 and 2020
Impact 2016-2020 SLG SRG SHG Cost reduction (€ million) 0.6 18.5 91.3
Investment (€ million) 0.1 8.6 24.8
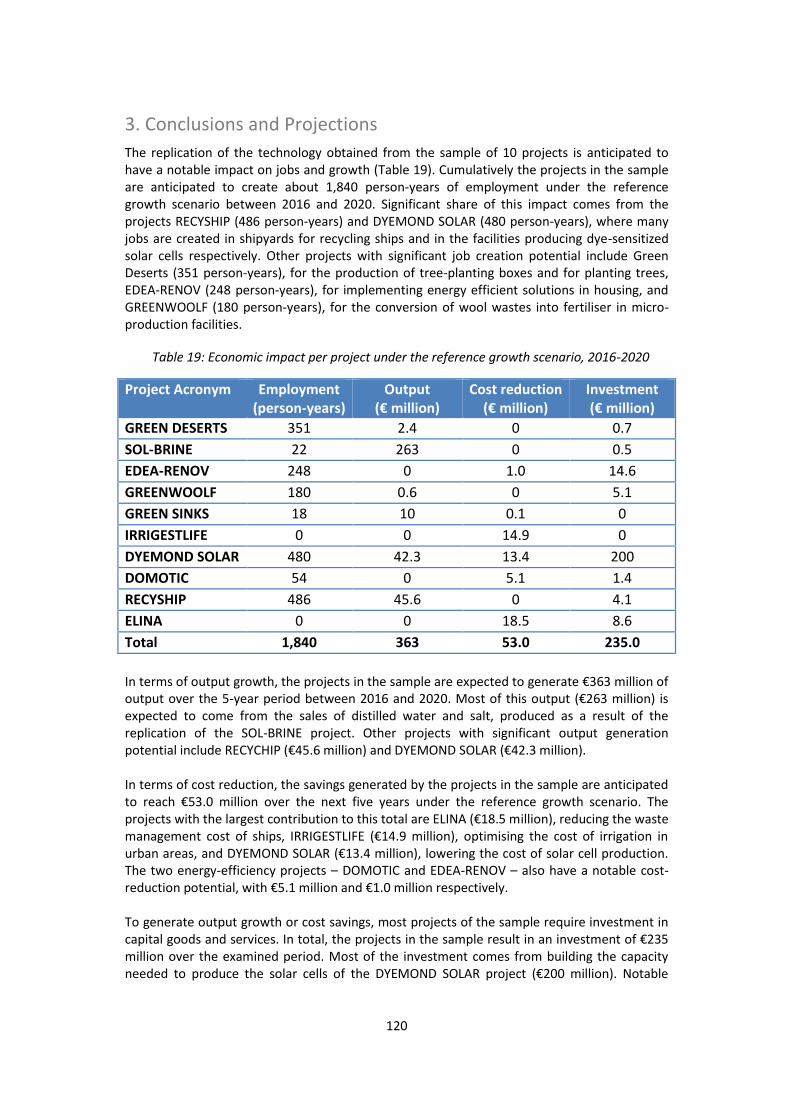
120
3. Conclusions and Projections
The replication of the technology obtained from the sample of 10 projects is anticipated to
have a notable impact on jobs and growth (Table 19). Cumulatively the projects in the sample
are anticipated to create about 1,840 person-years of employment under the reference
growth scenario between 2016 and 2020. Significant share of this impact comes from the
projects RECYSHIP (486 person-years) and DYEMOND SOLAR (480 person-years), where many
jobs are created in shipyards for recycling ships and in the facilities producing dye-sensitized
solar cells respectively. Other projects with significant job creation potential include Green
Deserts (351 person-years), for the production of tree-planting boxes and for planting trees,
EDEA-RENOV (248 person-years), for implementing energy efficient solutions in housing, and
GREENWOOLF (180 person-years), for the conversion of wool wastes into fertiliser in micro-
production facilities.
Table 19: Economic impact per project under the reference growth scenario, 2016-2020
Project Acronym Employment (person-years)
Output (€ million)
Cost reduction (€ million)
Investment (€ million)
GREEN DESERTS 351 2.4 0 0.7
SOL-BRINE 22 263 0 0.5
EDEA-RENOV 248 0 1.0 14.6
GREENWOOLF 180 0.6 0 5.1
GREEN SINKS 18 10 0.1 0
IRRIGESTLIFE 0 0 14.9 0
DYEMOND SOLAR 480 42.3 13.4 200
DOMOTIC 54 0 5.1 1.4
RECYSHIP 486 45.6 0 4.1
ELINA 0 0 18.5 8.6
Total 1,840 363 53.0 235.0
In terms of output growth, the projects in the sample are expected to generate €363 million of output over the 5-year period between 2016 and 2020. Most of this output (€263 million) is expected to come from the sales of distilled water and salt, produced as a result of the
replication of the SOL-BRINE project. Other projects with significant output generation
potential include RECYCHIP (€45.6 million) and DYEMOND SOLAR (€42.3 million).
In terms of cost reduction, the savings generated by the projects in the sample are anticipated
to reach €53.0 million over the next five years under the reference growth scenario. The projects with the largest contribution to this total are ELINA (€18.5 million), reducing the waste
management cost of ships, IRRIGESTLIFE (€14.9 million), optimising the cost of irrigation in urban areas, and DYEMOND SOLAR (€13.4 million), lowering the cost of solar cell production. The two energy-efficiency projects – DOMOTIC and EDEA-RENOV – also have a notable cost-
reduction potential, with €5.1 million and €1.0 million respectively.
To generate output growth or cost savings, most projects of the sample require investment in
capital goods and services. In total, the projects in the sample result in an investment of €235 million over the examined period. Most of the investment comes from building the capacity
needed to produce the solar cells of the DYEMOND SOLAR project (€200 million). Notable
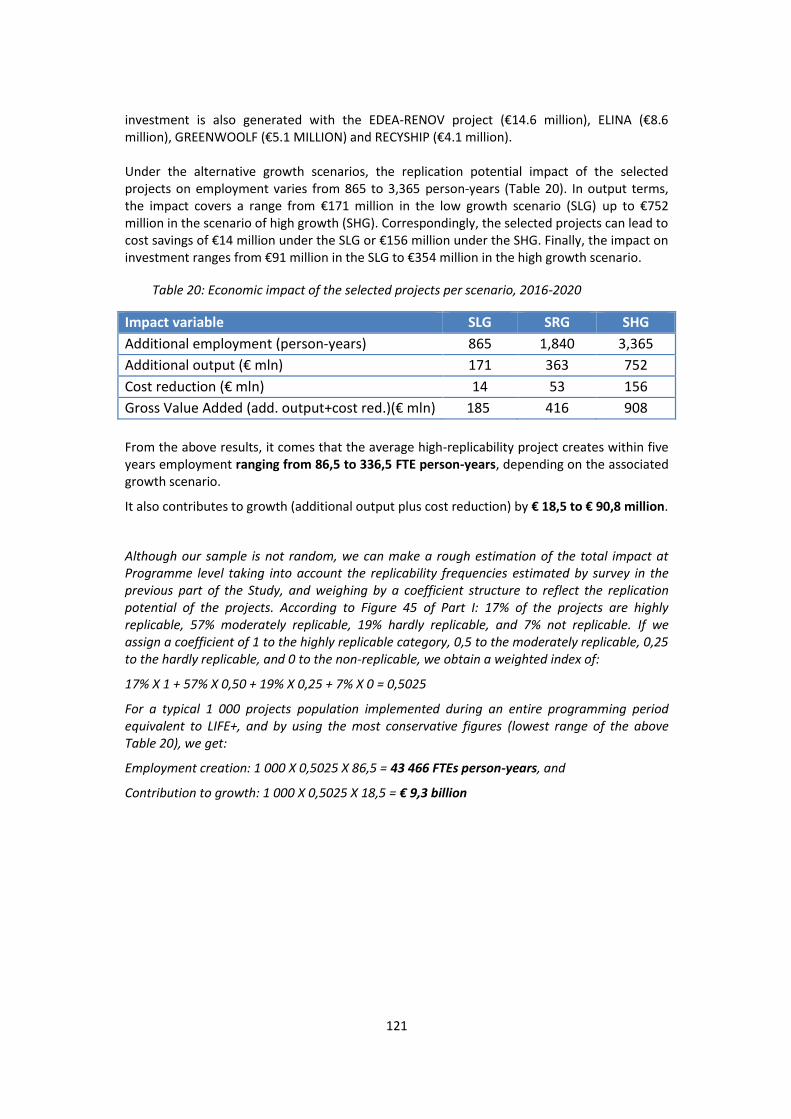
121
investment is also generated with the EDEA-RENOV project (€14.6 million), ELINA (€8.6 million), GREENWOOLF (€5.1 MILLION) and RECYSHIP (€4.1 million).
Under the alternative growth scenarios, the replication potential impact of the selected
projects on employment varies from 865 to 3,365 person-years (Table 20). In output terms,
the impact covers a range from €171 million in the low growth scenario (SLG) up to €752 million in the scenario of high growth (SHG). Correspondingly, the selected projects can lead to
cost savings of €14 million under the SLG or €156 million under the SHG. Finally, the impact on investment ranges from €91 million in the SLG to €354 million in the high growth scenario.
Table 20: Economic impact of the selected projects per scenario, 2016-2020
Impact variable SLG SRG SHG Additional employment (person-years) 865 1,840 3,365
Additional output (€ mln) 171 363 752
Cost reduction (€ mln) 14 53 156
Gross Value Added (add. output+cost red.)(€ mln) 185 416 908
From the above results, it comes that the average high-replicability project creates within five
years employment ranging from 86,5 to 336,5 FTE person-years, depending on the associated
growth scenario.
It also contributes to growth (additional output plus cost reduction) by € 18,5 to € 90,8 million.
Although our sample is not random, we can make a rough estimation of the total impact at Programme level taking into account the replicability frequencies estimated by survey in the previous part of the Study, and weighing by a coefficient structure to reflect the replication potential of the projects. According to Figure 45 of Part I: 17% of the projects are highly replicable, 57% moderately replicable, 19% hardly replicable, and 7% not replicable. If we assign a coefficient of 1 to the highly replicable category, 0,5 to the moderately replicable, 0,25 to the hardly replicable, and 0 to the non-replicable, we obtain a weighted index of:
17% X 1 + 57% X 0,50 + 19% X 0,25 + 7% X 0 = 0,5025
For a typical 1 000 projects population implemented during an entire programming period equivalent to LIFE+, and by using the most conservative figures (lowest range of the above Table 20), we get:
Employment creation: 1 000 X 0,5025 X 86,5 = 43 466 FTEs person-years, and
Contribution to growth: 1 000 X 0,5025 X 18,5 = € 9,3 billion
122
References
Ali, M. T., Fath, H. E. S., & Armstrong, P. R. (2011). A comprehensive techno-economical review
of indirect solar desalination. Renewable and Sustainable Energy Reviews, 15(8), 4187–4199.
Alvarez Sierra, C., & Alvarez Sierra, A. F. (2005). Model Dynamic of Evaluation of the
Environmental Impact of the Reforestation. Proceedings of the 23rd International Conference
of the System Dynamics Society.
Ayoub, G. M., & Malaeb, L. (2014). Economic feasibility of a solar still desalination system with
enhanced productivity. Desalination, 335(1), 27–32.
Benninga, S. (2014). Financial Modeling. Third Edition (Fourth). MIT Press.
Caldés, N., Varela, M., Santamaría, M., & Sáez, R. (2009). Economic impact of solar thermal
electricity deployment in Spain. Energy Policy, 37(5), 1628–1636.
Cambridge Econometrics. (2015). Assessing the employment and social impact of energy
efficiency: Final report (Vol. 1).
Choi, J. K., Kelley, D., Murphy, S., & Thangamani, D. (2016). Economic and environmental
perspectives of end-of-life ship management. Resources, Conservation and Recycling, 107, 82–91.
European Commission (2016). European Economic Forecast: Winter 2016. Luxembourg:
Publications Office of the European Union.
Garrido-Soriano, N., Rosas-Casals, M., Ivancic, A., & Álvarez-Del Castillo, M. D. (2012). Potential
energy savings and economic impact of residential buildings under national and regional
efficiency scenarios. A Catalan case study. Energy and Buildings, 49, 119–125.
Ghaffour, N., Missimer, T. M., & Amy, G. L. (2013). Technical review and evaluation of the
economics of water desalination: Current and future challenges for better water supply
sustainability. Desalination, 309, 197–207.
Kilic, A., & Tzannatos, E. (2014). Ship emissions and their externalities at the container terminal
of Piraeus, Greece. International Journal of Environmental Research, 8(4), 1329–1340.
Lorenz, P., Pinner, D., Seitz, T., Farrell, D., & Remes, J. K. (2008). The economics of solar power.
McKinsey Quarterly, 185(2), 66–78.
Namara, R. E., Nagar, R. K., & Upadhyay, B. (2007). Economics, adoption determinants, and
impacts of micro-irrigation technologies: Empirical results from India. Irrigation Science, 25(3),
283–297.
Niskanen, A., Saastamoinen, O., & Rantala, T. (1996). Economic impacts of carbon
sequestration in reforestation: Examples from boreal and moist tropical conditions. Silva
Fennica, 30(2–3), 269–278.
Olschewski, R., & Benítez, P. C. (2005). Secondary forests as temporary carbon sinks? The
economic impact of accounting methods on reforestation projects in the tropics. Ecological
Economics, 55(3), 380–394.
Oster, J. D., & Wichelns, D. (2003). Economic and agronomic strategies to achieve sustainable
irrigation. Irrigation Science.
Pikas, E., Kurnitski, J., Liias, R., & Thalfeldt, M. (2015). Quantification of economic benefits of
renovation of apartment buildings as a basis for cost optimal 2030 energy efficiency strategies.
Energy and Buildings, 86, 151–160.
123
Pikas, E., Thalfeldt, M., Kurnitski, J., & Liias, R. (2015). Extra cost analyses of two apartment
buildings for achieving nearly zero and low energy buildings. Energy, 84, 623–633.
Prando, D., Prada, A., Ochs, F., Gasparella, A., & Baratieri, M. (2015). Analysis of the energy and
economic impact of cost-optimal buildings refurbishment on district heating systems. Science
and Technology for the Built Environment, 21(6), 876–891.
Saffari, M., De Gracia, A., Ushak, S., & Cabeza, L. F. (2016). Economic impact of integrating PCM
as passive system in buildings using Fanger comfort model. Energy and Buildings, 112, 159–172.
Sambrailo, D., Ivić, J., & Krstulović, A. (2005). Economic evaluation of the first desalination
plant in Croatia. Desalination, 179(1–3 SPEC. ISS.), 339–344.
Schultz, M. P., Bendick, J. a, Holm, E. R., & Hertel, W. M. (2011). Economic impact of biofouling
on a naval surface ship. Biofouling, 27(1), 87–98.
Sonesson, U., Bjö Rklund, A., Carlsson, M., & Dalemo, M. (2000). Environmental and economic
analysis of management systems for biodegradable waste. Resources, Conservation and
Recycling, 28, 29–53.
Tjia, J. S. (2009). Building Financial Models. McGraw-Hill Finance & Investing
Walton, M. E. M. M., Samonte-Tan, G. P. B. B., Primavera, J. H., Edwards-Jones, G., & Le Vay, L.
(2006). Are mangroves worth replanting? The direct economic benefits of a community-based
reforestation project. Environmental Conservation, 33(4), 335.

124
125
PART III: Evaluation of LIFE Projects from
the perspective of Ecosystem Services
126
List of Figures
Figure 1: A comparison of temporal coincidence between the time extent of the years of
approval of the LIFE NAT sample of projects and the flourishing of scientific concepts and
techniques regarding "ecosystem services"
Figure 2: The 25-pool of projects ordinated along an South/East-North/West and a
South/West-North/East gradients
Figure 3: Pie chart for fund allocation among the 8 categories of expenditures. In this example:
LIFE 04 NAT IE 000125
Figure 4: Bar chart for fund allocation among the 8 categories of expenditures. In this example:
LIFE 04 NAT IE 000125
Figure 5: Definition of budget classes within the sampled LIFE NAT/BIO projects collection
Figure 6: Ordination of the sampled LIFE NAT/BIO projects in a 2D space "operational cost X
constitutional cost": two sub-groups are clearly identifiable
Figure 7: Linear relationship between duration and budget of a LIFE NAT/BIO project.
Figure 8: The two budget classes, low vs. high, differ significantly between them when data are
fitted by a linear relationship, as to their origin constant.
Figure 9: Best-fit relationships between operational cost of a LIFE NAT/BIO project and fund
allocation strategy [left panel] or monthly expenditure for salaries (a proxy for Jobs) across the
25 sampled projects.
Figure 10: Best-fit relationship between monthly salaries (as a proxy for Jobs) and the
equitability of fund allocation within a project, across the 25 LIFE NAT/BIO projects sample
Figure 11: Best-fit relationship between total LIFE fund transfers to the wider
community/economy and the equitability of fund allocation within a project, across the 25 LIFE
NAT/BIO projects
Figure 12: Relationship between LIFE NAT/BIO funds invested and minimum value of
ecosystem service(s).
Figure 13: Rough definition of 4 classes of LIFE NAT/BIO projects based on the combination of
"budget" and monetary "ecosystem service value"
Figure 14: A graphical depiction of the problem of selecting between projects based on the
criteria of budget and monetary value of ecosystem service(s).
127
List of Tables
Table 1: Number, title and acronym of the 25-pool of sampled LIFE NAT projects
Table 2: Project characteristics: initial conditions, problems targeted, objectives, selection of
conservation measures to be analysed more in depth
Table 3: Impact of the selected conservation measures on the ecosystem services
Table 4: General impact of the project on the ecosystem services
Table 5a: ecosystem services evaluation – minimum values
Table 5b: ecosystem services evaluation – maximum values
Table 6: Ecosystem services evaluation uncertainty
Table 7: Various diversity indexes calculated on data regarding the fund allocation strategy of a
LIFE NAT/BIO project
Table 8: Segment of the data set on the LIFE NAT/BIO descriptors
Table 9: Average (μ), Standard deviation (SD) and Coefficient Variation (CV) of the main
descriptors of 25 sampled LIFE NAT/BIO projects
128
Introduction and Objectives
The LIFE-Nature and Biodiversity funding mechanism produces economic impacts and social
effects at various organizational and territorial scales. This funding mechanism – along with its
institutional and procedural apparatus – does address the complexity of the fundamental
question "Can the EU afford to conserve biodiversity?" in its territory, according to its role and
engagement as a world champion in environmental-global change issues.
As a funding mechanism for nature and biodiversity, LIFE's rationale has evolved from purely
supportive of intrinsic value-led conservation – e.g. aesthetic, ethical or cultural values – to
science and economic rationalism arguments. This gradual evolution is significantly
represented in the "two-way" examination of dependency in the relationship between
conservation targets/results per se and economy, and vice versa. The actual scientific advances
in representing nature in units (e.g. species, habitats or landscapes) and the accumulation of
monetary valuation methods of- and data on- Goods and Services provided by Ecosystems do
create the opportunity to integrate social conservation aspiration and ecological science with
economics. Further, the EU support for conservation can be strengthened if arguments are
framed in terms consistent with economic development, by treating units of nature as
commodities and aligning nature conservation with the free-market delivery of public benefits.
Public benefits are of two different kinds. Those that emanate from direct impacts of LIFE
funds on the job market and local "GDP"; and, those that indirectly originate as ecosystem
services from the sustainable use of nature and biodiversity resources within the wider matrix
of EU land/resource-use allocation system, especially regarding areas designated for of
conservation, protection and/or restoration.
Political justification on conservation funding decisions tends therefore to rely more on
cost/efficiency or cost/effectiveness criteria than to often intractable problems that are raised
when different social groups hold different intrinsic values on nature.
The main objective of this work is to assess the indirect economic impact of a sample of 25
typical LIFE Nature and Biodiversity projects, from the perspective of the directly generated
ecosystem services; (there are also public benefits through ecosystem services where the
results of the projects are replicated elsewhere – but these are not covered by the present
study). Additionally, some aspects of the direct economic impact, effectiveness and
replicability of LIFE Nature and Biodiversity projects are also addressed (i.e. the core question
emanating from the general description and goals of Task 9.4/NEEMO Contracts 03/04).
To achieve these objectives, this report had to tackle methodological challenges and technical
issues related to the standardization and analysis of available information and data, in order to
address in a constructive way the inverted relationship between "economy metrics" as the
dependent variable and "conservation LIFE funds" as the independent driver. Some of these
metrics -e.g. those related to employment- are ex post straightforward as accountability.
Others, as those related to Ecosystem Goods and Services, are fraught with multiple
uncertainties as to their potential for materialization. In particular, there is significant
uncertainty on both the range of monetary values per class of ecosystem service (-s) -
129
especially in their local or regional version- and their interference as economic multiplier for
local "GDP".
This report espouses the idea that getting the maximum of public benefits from EU investment
to nature/biodiversity conservation seems one reasonable goal when relative funds are locked
to a given financial ceiling. The novelty of this report, if any, relates to uncovering important
features of the secondary economic effects of LIFE-Nature and Biodiversity projects [during the
period 2004-2015]. These effects are complex, as they are direct -i.e. support and influence
upon qualified employment and GDP, and indirect -i.e. their contribution to human welfare as
part of the economic value of EU nature, through their monetary value as
ecosystem/biodiversity services and goods.
The report is divided into three main sections: first, an explanation on the method used to
assess how the implementation of the 25 selected LIFE Nature projects affected the quality of
the ecosystem services, how these effects can be evaluated in monetary terms, their direct
economic impact and their replicability and effectiveness; second, a section including a brief
summary of the outcomes of these assessments26; finally, the report concludes on some key
messages and recommendations.
26
The report includes three annexes with a detailed analysis of the direct and indirect impact assessment of the 25
LIFE Nature projects.
130
Chapter 1: Methodology
As the European Commission highlights in the LIFE Programme website, “LIFE projects have helped to improve the regulation of ecosystem processes in order to better facilitate natural services like pollination, disease control and resource purification. Non-material benefits obtained from ecosystems have been another positive outcome from LIFE’s project activities and services covered here include aesthetic values connected with environmental ‘capital’ or cultural heritage”27
.
However, the benefit that LIFE projects provide in terms of ecosystem services has not always
been systematically assessed (particularly during the first programming periods), and has only
recently been explicitly integrated (see below – Step 1 – a temporal comparison between the
years of approval of the sample of the 25 LIFE Nature projects and the flourishing of relevant
scientific works on ecosystem services). In 2011 it was established for the first time that all LIFE
Nature and Biodiversity proposals containing concrete conservation measures must include
two separate actions aimed to assess the socio-economic impact of the project on the local
economy and population, and to assess the project's impact on the ecosystem functions. More
concretely, LIFE guidelines for applicants currently explain that: “(…) the direct linkages between the project measures and key ecosystem services provided, such as carbon sequestration, water purification, pollination, etc. should be clearly assessed. The impact of project actions aimed at restoring multi-functional ecosystems such as rivers, floodplains, forests, peatlands or mires should be assessed as far as possible in economic terms (monetary terms or if this is not possible there should be a qualitative estimation). All these should be consistent in so far as possible with the methodology on Mapping and Assessing Ecosystems and their Services (MAES) agreed at European level within action 5 of the Biodiversity Strategy”.
The new LIFE Regulation, approved in 201328
, gives an increased importance to the
socioeconomic impact of the projects. With the aim of reporting on the success of the LIFE
Programme in relation to the performance indicators established in Article 3 Paragraph 3 of
the LIFE Regulation, the multiannual work-programme for 2014-2017 defines a comprehensive
set of outcome indicators on which all LIFE projects must report, including some of societal
and economic character. In this respect, the recently elaborated LIFE indicator database29
will
undoubtedly constitute a valuable tool. This database already contains indicator data from
hundreds or projects (inputs are up to the present made on a voluntary basis, but the idea is to
progressively establish the database as a basic tool for systematic assessment).
The 25 typical LIFE Nature projects that are analysed in this report were approved for financing
during the period 2004-2010, when no specific data were required in order to assess the
projects’ impact on ecosystem services. Therefore, the evaluation undertaken in this report is
hindered by the lack of specific data. The information available (data contained in the ex post
27
http://ec.europa.eu/environment/life/features/2012/ecosystem.htm 28 Regulation (EU) no 1293/2013 of the European Parliament and of the Council of 11 December 2013 on the establishment of a Programme for the Environment and Climate Action (LIFE) and repealing Regulation (EC) No 614/2007. 29
http://ec.europa.eu/environment/life/toolkit/pmtools/life2014_2020/monitoring.htm
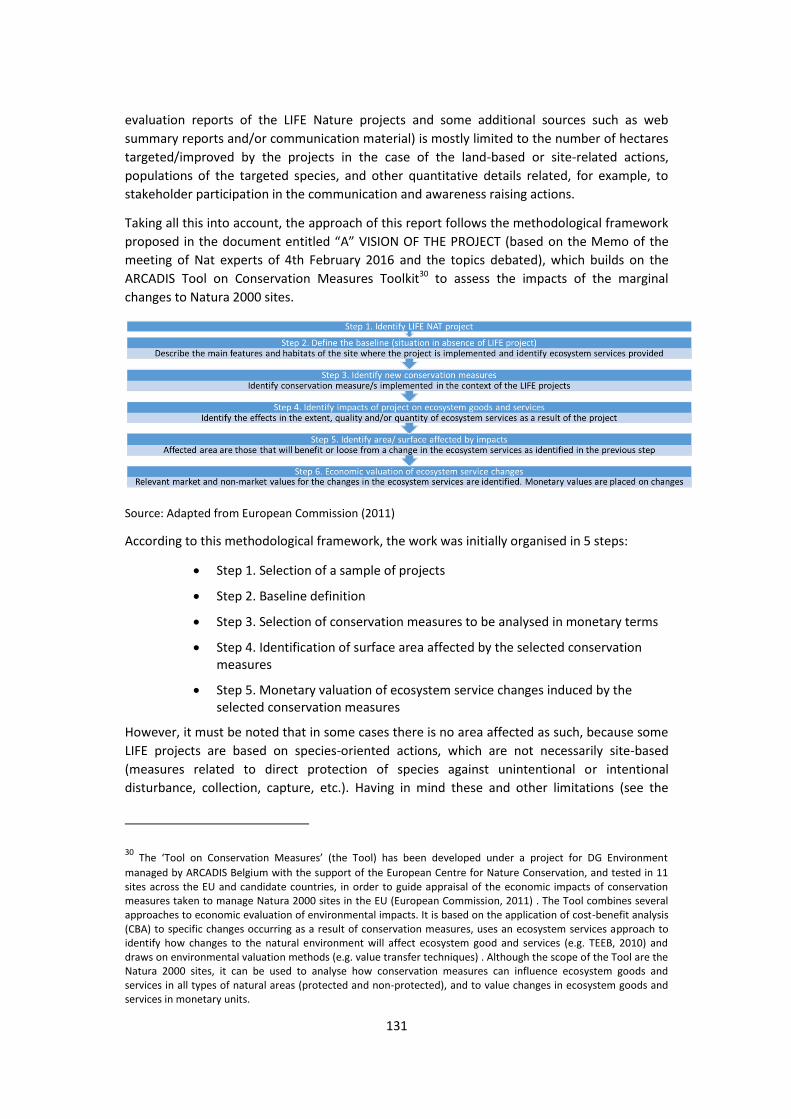
131
evaluation reports of the LIFE Nature projects and some additional sources such as web
summary reports and/or communication material) is mostly limited to the number of hectares
targeted/improved by the projects in the case of the land-based or site-related actions,
populations of the targeted species, and other quantitative details related, for example, to
stakeholder participation in the communication and awareness raising actions.
Taking all this into account, the approach of this report follows the methodological framework
proposed in the document entitled “A” VISION OF THE PROJECT (based on the Memo of the
meeting of Nat experts of 4th February 2016 and the topics debated), which builds on the
ARCADIS Tool on Conservation Measures Toolkit30
to assess the impacts of the marginal
changes to Natura 2000 sites.
Source: Adapted from European Commission (2011)
According to this methodological framework, the work was initially organised in 5 steps:
x Step 1. Selection of a sample of projects
x Step 2. Baseline definition
x Step 3. Selection of conservation measures to be analysed in monetary terms
x Step 4. Identification of surface area affected by the selected conservation
measures
x Step 5. Monetary valuation of ecosystem service changes induced by the
selected conservation measures
However, it must be noted that in some cases there is no area affected as such, because some
LIFE projects are based on species-oriented actions, which are not necessarily site-based
(measures related to direct protection of species against unintentional or intentional
disturbance, collection, capture, etc.). Having in mind these and other limitations (see the
30
The ‘Tool on Conservation Measures’ (the Tool) has been developed under a project for DG Environment managed by ARCADIS Belgium with the support of the European Centre for Nature Conservation, and tested in 11
sites across the EU and candidate countries, in order to guide appraisal of the economic impacts of conservation
measures taken to manage Natura 2000 sites in the EU (European Commission, 2011) . The Tool combines several
approaches to economic evaluation of environmental impacts. It is based on the application of cost-benefit analysis
(CBA) to specific changes occurring as a result of conservation measures, uses an ecosystem services approach to
identify how changes to the natural environment will affect ecosystem good and services (e.g. TEEB, 2010) and
draws on environmental valuation methods (e.g. value transfer techniques) . Although the scope of the Tool are the
Natura 2000 sites, it can be used to analyse how conservation measures can influence ecosystem goods and
services in all types of natural areas (protected and non-protected), and to value changes in ecosystem goods and
services in monetary units.
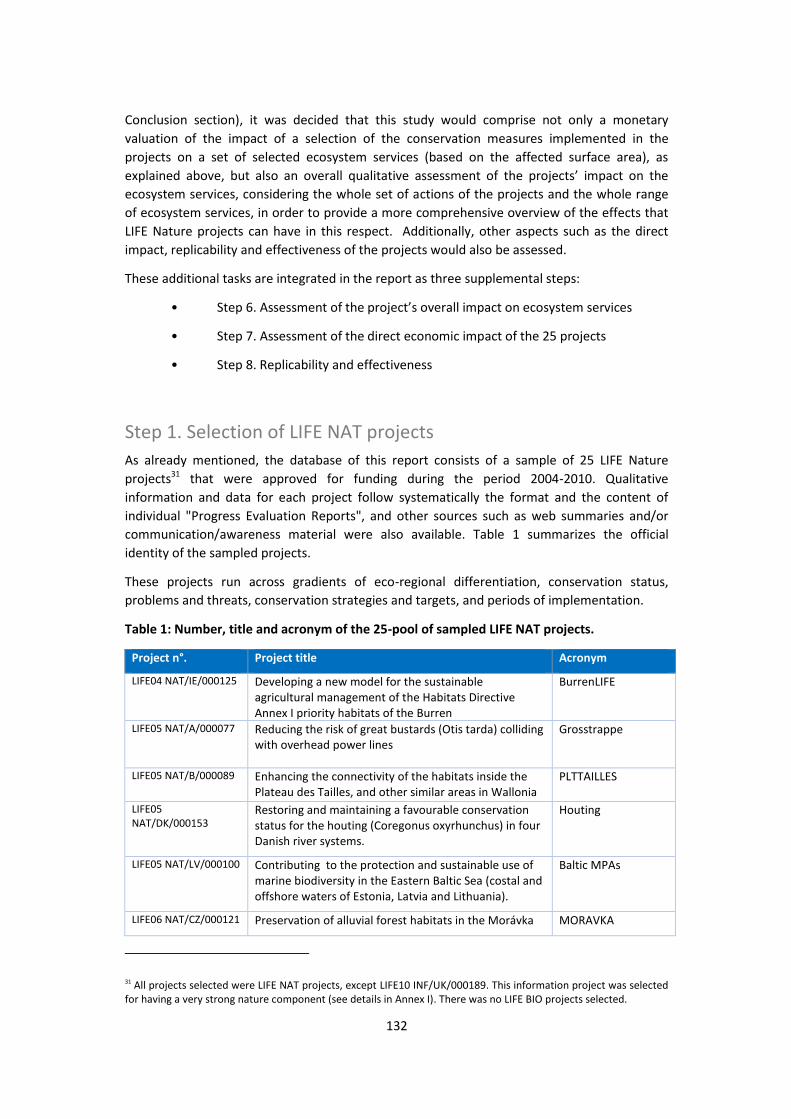
132
Conclusion section), it was decided that this study would comprise not only a monetary
valuation of the impact of a selection of the conservation measures implemented in the
projects on a set of selected ecosystem services (based on the affected surface area), as
explained above, but also an overall qualitative assessment of the projects’ impact on the ecosystem services, considering the whole set of actions of the projects and the whole range
of ecosystem services, in order to provide a more comprehensive overview of the effects that
LIFE Nature projects can have in this respect. Additionally, other aspects such as the direct
impact, replicability and effectiveness of the projects would also be assessed.
These additional tasks are integrated in the report as three supplemental steps:
• Step 6. Assessment of the project’s overall impact on ecosystem services
• Step 7. Assessment of the direct economic impact of the 25 projects
• Step 8. Replicability and effectiveness
Step 1. Selection of LIFE NAT projects
As already mentioned, the database of this report consists of a sample of 25 LIFE Nature
projects31
that were approved for funding during the period 2004-2010. Qualitative
information and data for each project follow systematically the format and the content of
individual "Progress Evaluation Reports", and other sources such as web summaries and/or
communication/awareness material were also available. Table 1 summarizes the official
identity of the sampled projects.
These projects run across gradients of eco-regional differentiation, conservation status,
problems and threats, conservation strategies and targets, and periods of implementation.
Table 1: Number, title and acronym of the 25-pool of sampled LIFE NAT projects.
Project n°. Project title Acronym
LIFE04 NAT/IE/000125
Developing a new model for the sustainable
agricultural management of the Habitats Directive
Annex I priority habitats of the Burren
BurrenLIFE
LIFE05 NAT/A/000077
Reducing the risk of great bustards (Otis tarda) colliding
with overhead power lines Grosstrappe
LIFE05 NAT/B/000089 Enhancing the connectivity of the habitats inside the
Plateau des Tailles, and other similar areas in Wallonia PLTTAILLES
LIFE05
NAT/DK/000153 Restoring and maintaining a favourable conservation
status for the houting (Coregonus oxyrhunchus) in four
Danish river systems.
Houting
LIFE05 NAT/LV/000100
Contributing to the protection and sustainable use of
marine biodiversity in the Eastern Baltic Sea (costal and
offshore waters of Estonia, Latvia and Lithuania).
Baltic MPAs
LIFE06 NAT/CZ/000121 Preservation of alluvial forest habitats in the Morávka MORAVKA
31
All projects selected were LIFE NAT projects, except LIFE10 INF/UK/000189. This information project was selected
for having a very strong nature component (see details in Annex I). There was no LIFE BIO projects selected.
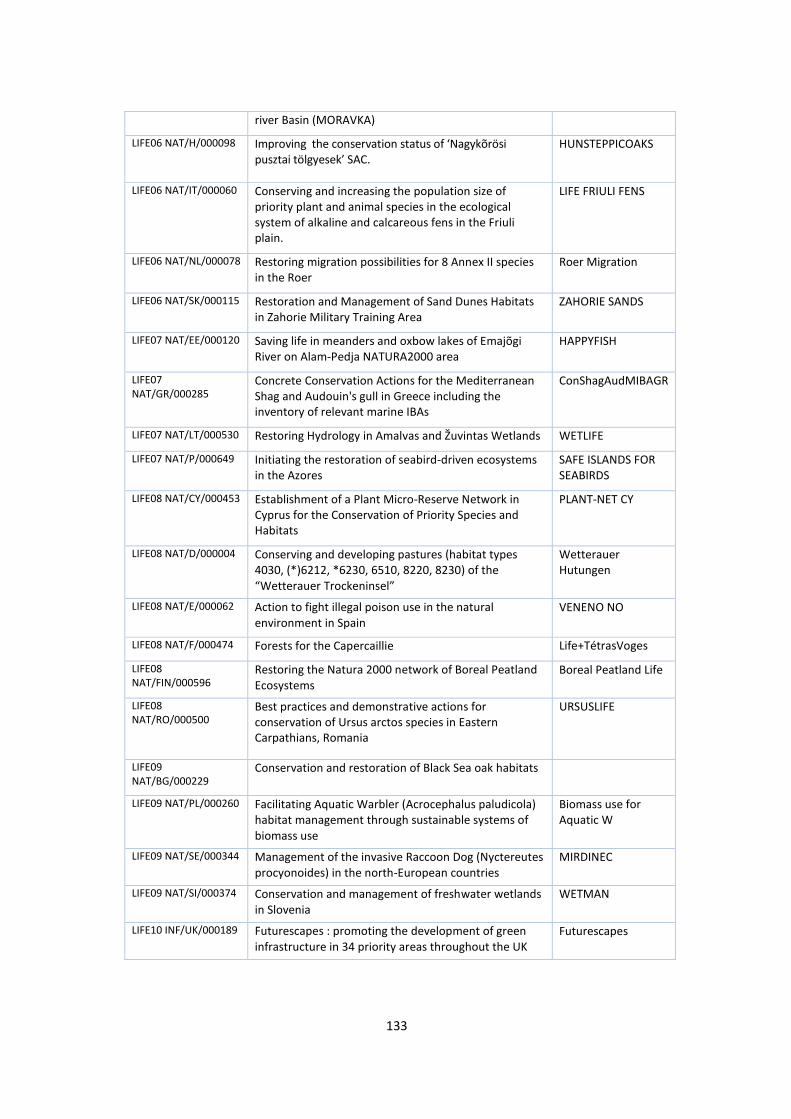
133
river Basin (MORAVKA)
LIFE06 NAT/H/000098
Improving the conservation status of ‘Nagykõrösi pusztai tölgyesek’ SAC.
HUNSTEPPICOAKS
LIFE06 NAT/IT/000060 Conserving and increasing the population size of
priority plant and animal species in the ecological
system of alkaline and calcareous fens in the Friuli
plain.
LIFE FRIULI FENS
LIFE06 NAT/NL/000078 Restoring migration possibilities for 8 Annex II species
in the Roer Roer Migration
LIFE06 NAT/SK/000115 Restoration and Management of Sand Dunes Habitats
in Zahorie Military Training Area ZAHORIE SANDS
LIFE07 NAT/EE/000120 Saving life in meanders and oxbow lakes of Emajõgi
River on Alam-Pedja NATURA2000 area HAPPYFISH
LIFE07
NAT/GR/000285 Concrete Conservation Actions for the Mediterranean
Shag and Audouin's gull in Greece including the
inventory of relevant marine IBAs
ConShagAudMIBAGR
LIFE07 NAT/LT/000530 Restoring Hydrology in Amalvas and Žuvintas Wetlands WETLIFE
LIFE07 NAT/P/000649 Initiating the restoration of seabird-driven ecosystems
in the Azores SAFE ISLANDS FOR
SEABIRDS
LIFE08 NAT/CY/000453 Establishment of a Plant Micro-Reserve Network in
Cyprus for the Conservation of Priority Species and
Habitats
PLANT-NET CY
LIFE08 NAT/D/000004 Conserving and developing pastures (habitat types
4030, (*)6212, *6230, 6510, 8220, 8230) of the
“Wetterauer Trockeninsel”
Wetterauer
Hutungen
LIFE08 NAT/E/000062 Action to fight illegal poison use in the natural
environment in Spain VENENO NO
LIFE08 NAT/F/000474 Forests for the Capercaillie Life+TétrasVoges
LIFE08
NAT/FIN/000596 Restoring the Natura 2000 network of Boreal Peatland
Ecosystems Boreal Peatland Life
LIFE08
NAT/RO/000500
Best practices and demonstrative actions for
conservation of Ursus arctos species in Eastern
Carpathians, Romania
URSUSLIFE
LIFE09
NAT/BG/000229 Conservation and restoration of Black Sea oak habitats
LIFE09 NAT/PL/000260 Facilitating Aquatic Warbler (Acrocephalus paludicola)
habitat management through sustainable systems of
biomass use
Biomass use for
Aquatic W
LIFE09 NAT/SE/000344 Management of the invasive Raccoon Dog (Nyctereutes
procyonoides) in the north-European countries
MIRDINEC
LIFE09 NAT/SI/000374 Conservation and management of freshwater wetlands
in Slovenia
WETMAN
LIFE10 INF/UK/000189 Futurescapes : promoting the development of green
infrastructure in 34 priority areas throughout the UK
Futurescapes
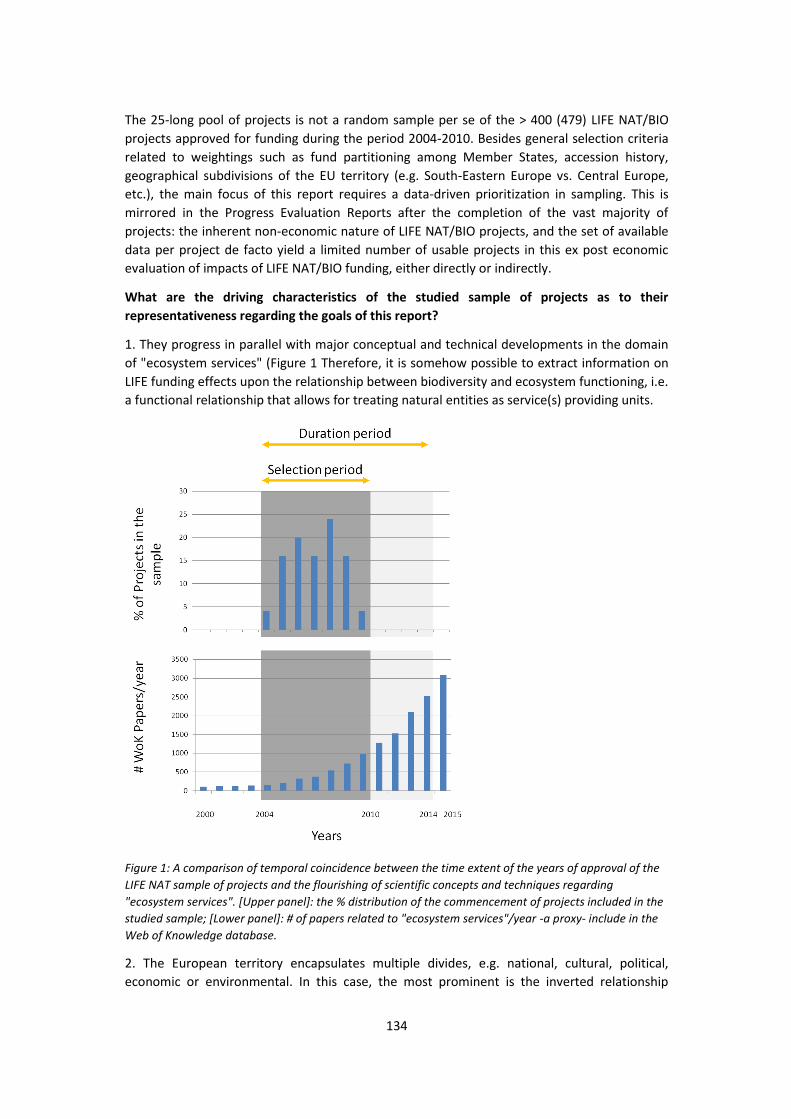
134
The 25-long pool of projects is not a random sample per se of the > 400 (479) LIFE NAT/BIO
projects approved for funding during the period 2004-2010. Besides general selection criteria
related to weightings such as fund partitioning among Member States, accession history,
geographical subdivisions of the EU territory (e.g. South-Eastern Europe vs. Central Europe,
etc.), the main focus of this report requires a data-driven prioritization in sampling. This is
mirrored in the Progress Evaluation Reports after the completion of the vast majority of
projects: the inherent non‐economic nature of LIFE NAT/BIO projects, and the set of available
data per project de facto yield a limited number of usable projects in this ex post economic
evaluation of impacts of LIFE NAT/BIO funding, either directly or indirectly.
What are the driving characteristics of the studied sample of projects as to their representativeness regarding the goals of this report?
1. They progress in parallel with major conceptual and technical developments in the domain
of "ecosystem services" (Figure 1 Therefore, it is somehow possible to extract information on
LIFE funding effects upon the relationship between biodiversity and ecosystem functioning, i.e.
a functional relationship that allows for treating natural entities as service(s) providing units.
Figure 1: A comparison of temporal coincidence between the time extent of the years of approval of the LIFE NAT sample of projects and the flourishing of scientific concepts and techniques regarding "ecosystem services". [Upper panel]: the % distribution of the commencement of projects included in the studied sample; [Lower panel]: # of papers related to "ecosystem services"/year -a proxy- include in the Web of Knowledge database.
2. The European territory encapsulates multiple divides, e.g. national, cultural, political,
economic or environmental. In this case, the most prominent is the inverted relationship
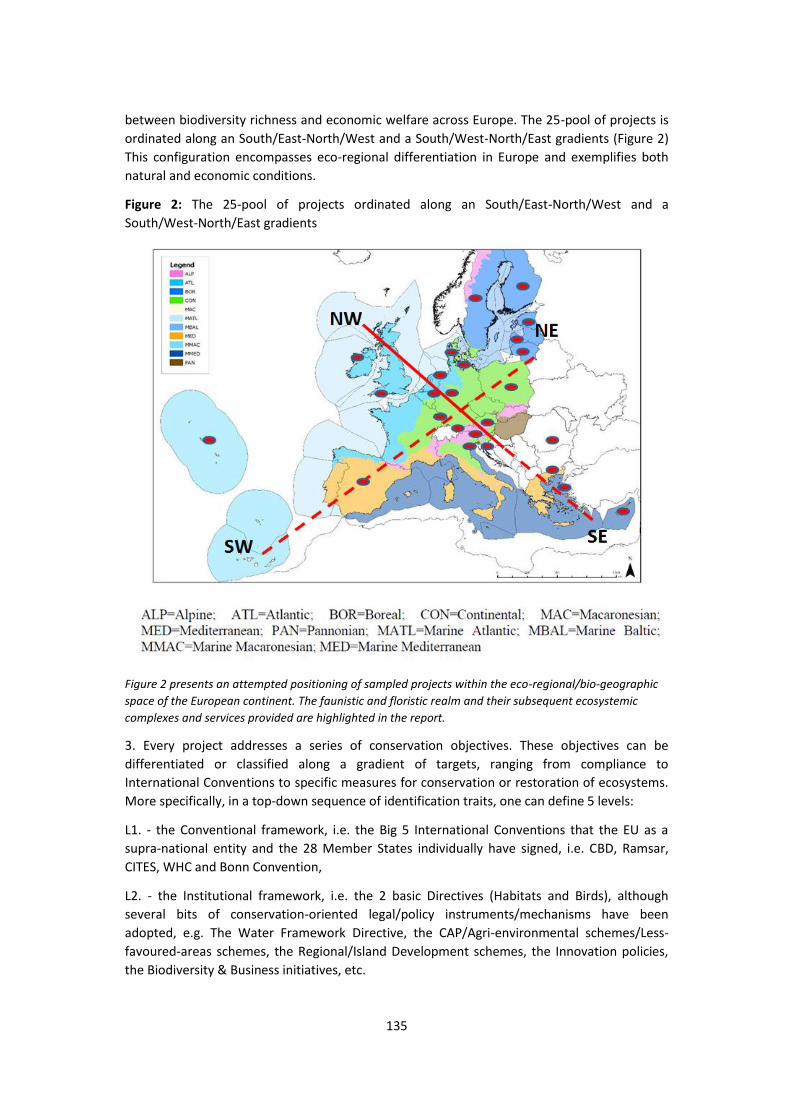
135
between biodiversity richness and economic welfare across Europe. The 25-pool of projects is
ordinated along an South/East-North/West and a South/West-North/East gradients (Figure 2)
This configuration encompasses eco-regional differentiation in Europe and exemplifies both
natural and economic conditions.
Figure 2: The 25-pool of projects ordinated along an South/East-North/West and a
South/West-North/East gradients
Figure 2 presents an attempted positioning of sampled projects within the eco-regional/bio-geographic space of the European continent. The faunistic and floristic realm and their subsequent ecosystemic complexes and services provided are highlighted in the report.
3. Every project addresses a series of conservation objectives. These objectives can be
differentiated or classified along a gradient of targets, ranging from compliance to
International Conventions to specific measures for conservation or restoration of ecosystems.
More specifically, in a top-down sequence of identification traits, one can define 5 levels:
L1. - the Conventional framework, i.e. the Big 5 International Conventions that the EU as a
supra-national entity and the 28 Member States individually have signed, i.e. CBD, Ramsar,
CITES, WHC and Bonn Convention,
L2. - the Institutional framework, i.e. the 2 basic Directives (Habitats and Birds), although
several bits of conservation-oriented legal/policy instruments/mechanisms have been
adopted, e.g. The Water Framework Directive, the CAP/Agri-environmental schemes/Less-
favoured-areas schemes, the Regional/Island Development schemes, the Innovation policies,
the Biodiversity & Business initiatives, etc.
136
L3. - the 2 classes of Action regarding NAT/BIO, i.e. Maintenance and Restoration actions.
According to EEA (report 11, 2007), in the period under evaluation these classes were defined
as follows:
Class 1: Actions to maintain and enhance biodiversity:
• designation of new territories as nature reserves for nature conservation;
• management of the territories designated for nature conservation;
• application/implementation of conservation measures to maintain natural diversity;
• protection of the diurnal or seasonal migration pathways for species;
• regulation of a land use, when the corresponding impacts are positive for the state
of biodiversity.
Class 2: Actions to protect and restore biodiversity:
• compensation for past disruption to the state of natural habitats (restore certain natural habitats and sites, e.g. wetlands, forest areas, etc.)
• reintroduction of species in habitats where their numbers have declined to establish a viable population or community
• restriction or forbid certain uses of biodiversity (this includes harvesting or capture of species. e.g. over fishing, deforestation, illegal trade of animal and plant species,
etc.)
• regulation of a land use, when the corresponding impacts would have been negative for the state of biodiversity; these include cross-compliance measures applied to
agricultural (and forestry) practices.
L4. - the 6 types of Measures, to meet the biodiversity targets, i.e.
1. Development and management of protected areas;
2. Species conservation;
3. Habitat conservation;
4. Capacity building;
5. Awareness raising/Education;
6. Research/monitoring.
L5. - the specific combination of Measures proposed/undertaken/funded per project. A
preliminary attempt to typify the rationale and the discourse of individual projects
allows for the following attempted definition (-s).
L5.1. Development and management of protected areas
137
It envisages all the measures and actions that are performed to designate new territories
under protection and the costs that are liaised with this measure -i.e. defining boundaries of
the new protected site, its delineation, etc.- or the preparation of the management plans for
protected areas.
L5.2. Species conservation It implies various measures directed towards protection and conservation of individual species.
It might include all the costs for reintroduction of species, ex-situ, in-situ conservation,
translocation, etc.
L5.3. Habitat/site conservation It implies any measures that are directed to protect a particular habitat or site -i.e. actions
against degradation of the habitat, such as deforestation, burning of vegetation, etc. In some
cases, restoration measures for severely degraded habitats are applied, e.g. restoration of
wetlands, afforestation, etc.
L5.4. Capacity building
A type of Measure regarded to be important in applied biodiversity conservation. Expenditures
made to capacity building may refer to funds spent on equipping of the staff with relevant
knowledge and/or technically in order to strengthen agencies or local institutions responsible
for the development of conservation measures.
L5.5. Awareness raising/Education It addresses activities/components for the successful conservation of nature/biodiversity/
natural heritage through targeted activities towards education and raising awareness of the
general public on biodiversity topics (by means of campaigns, publications, educational
programs or establishment of eco-clubs).
L5.6. Research/Monitoring It addresses the need for Research to evaluate the status of any species or habitat as a
significant prerequisite to biodiversity conservation; Monitoring intends to track changes at
species, population and habitat levels. LIFE funds allocated to research and monitoring might
also account for the evaluation and monitoring of the effectiveness of species/habitat action
plans or management of protected areas.
Step 2. Baseline definition
This step describes the main characteristics (habitats, species, land uses, conservation
problems, threats, etc.) of the sites/ areas where the LIFE Nature projects were implemented.
It must be noted however that a number of the selected projects (around 50% of the sample
of 25 projects) did not target a specific site, but a high number of them - for example LIFE08
NAT/D/000004- Wetterauer Hutungen, implemented in 21 SCIs, particularly when projects
were based on species-oriented actions, such as LIFE08 NAT/E/000062- VENENO NO,
conceived to fight the use of illegal poison in Spain (in 173 Natura 2000 sites).
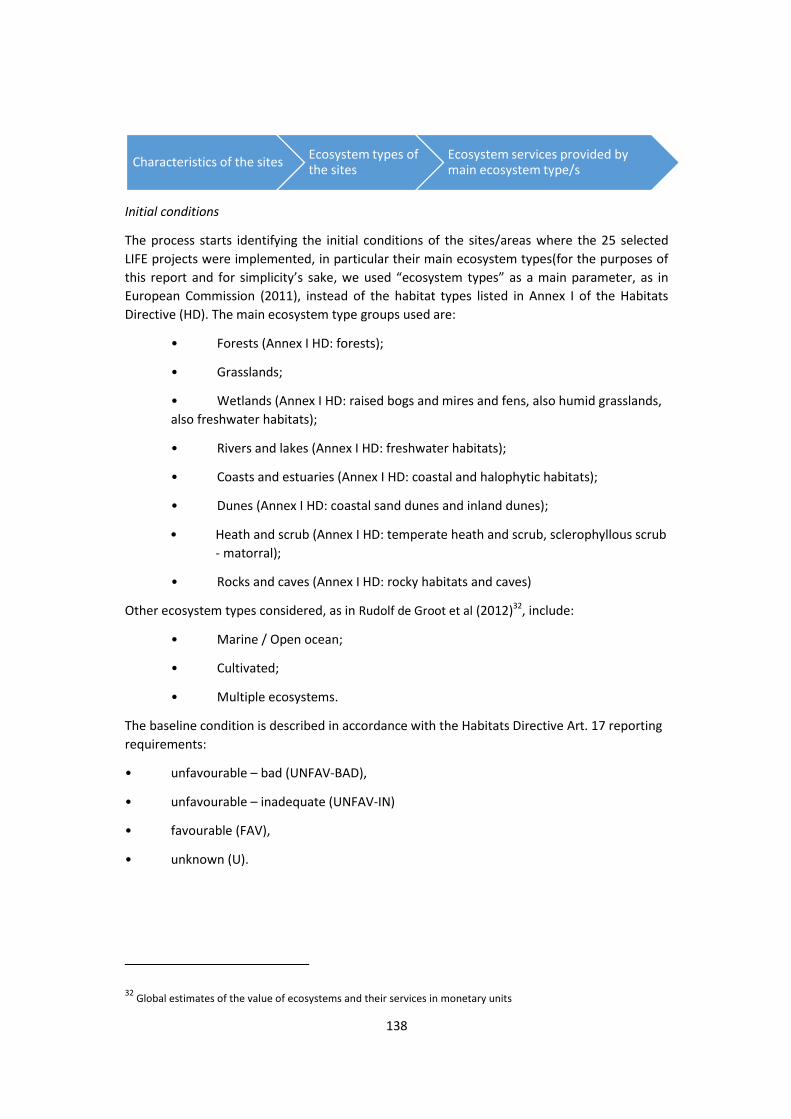
138
Initial conditions
The process starts identifying the initial conditions of the sites/areas where the 25 selected
LIFE projects were implemented, in particular their main ecosystem types(for the purposes of
this report and for simplicity’s sake, we used “ecosystem types” as a main parameter, as in European Commission (2011), instead of the habitat types listed in Annex I of the Habitats
Directive (HD). The main ecosystem type groups used are:
• Forests (Annex I HD: forests);
• Grasslands;
• Wetlands (Annex I HD: raised bogs and mires and fens, also humid grasslands,
also freshwater habitats);
• Rivers and lakes (Annex I HD: freshwater habitats);
• Coasts and estuaries (Annex I HD: coastal and halophytic habitats);
• Dunes (Annex I HD: coastal sand dunes and inland dunes);
• Heath and scrub (Annex I HD: temperate heath and scrub, sclerophyllous scrub
- matorral);
• Rocks and caves (Annex I HD: rocky habitats and caves)
Other ecosystem types considered, as in Rudolf de Groot et al (2012)32
, include:
• Marine / Open ocean;
• Cultivated;
• Multiple ecosystems.
The baseline condition is described in accordance with the Habitats Directive Art. 17 reporting
requirements:
• unfavourable – bad (UNFAV-BAD),
• unfavourable – inadequate (UNFAV-IN)
• favourable (FAV),
• unknown (U).
32
Global estimates of the value of ecosystems and their services in monetary units
Characteristics of the sites Ecosystem types of the sites
Ecosystem services provided by main ecosystem type/s
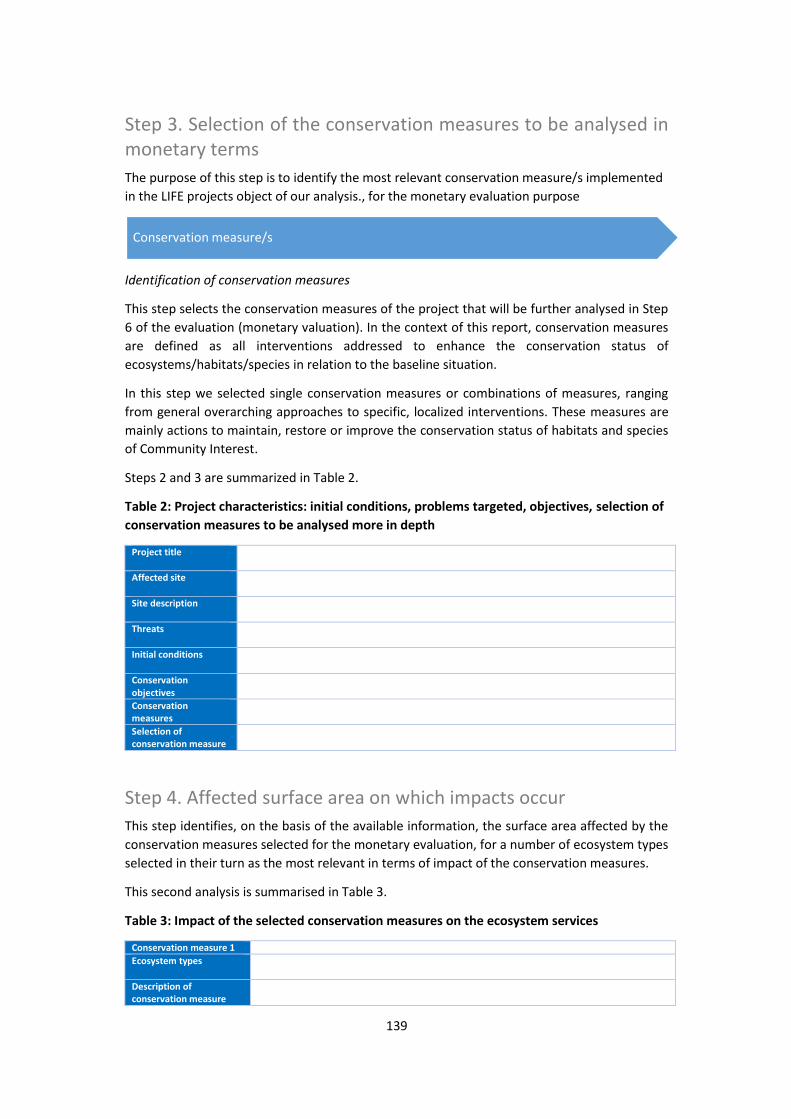
139
Step 3. Selection of the conservation measures to be analysed in
monetary terms
The purpose of this step is to identify the most relevant conservation measure/s implemented
in the LIFE projects object of our analysis., for the monetary evaluation purpose
Identification of conservation measures
This step selects the conservation measures of the project that will be further analysed in Step
6 of the evaluation (monetary valuation). In the context of this report, conservation measures
are defined as all interventions addressed to enhance the conservation status of
ecosystems/habitats/species in relation to the baseline situation.
In this step we selected single conservation measures or combinations of measures, ranging
from general overarching approaches to specific, localized interventions. These measures are
mainly actions to maintain, restore or improve the conservation status of habitats and species
of Community Interest.
Steps 2 and 3 are summarized in Table 2.
Table 2: Project characteristics: initial conditions, problems targeted, objectives, selection of conservation measures to be analysed more in depth
Project title
Affected site
Site description
Threats
Initial conditions
Conservation objectives
Conservation measures
Selection of conservation measure
Step 4. Affected surface area on which impacts occur
This step identifies, on the basis of the available information, the surface area affected by the
conservation measures selected for the monetary evaluation, for a number of ecosystem types
selected in their turn as the most relevant in terms of impact of the conservation measures.
This second analysis is summarised in Table 3.
Table 3: Impact of the selected conservation measures on the ecosystem services
Conservation measure 1
Ecosystem types
Description of conservation measure
Conservation measure/s
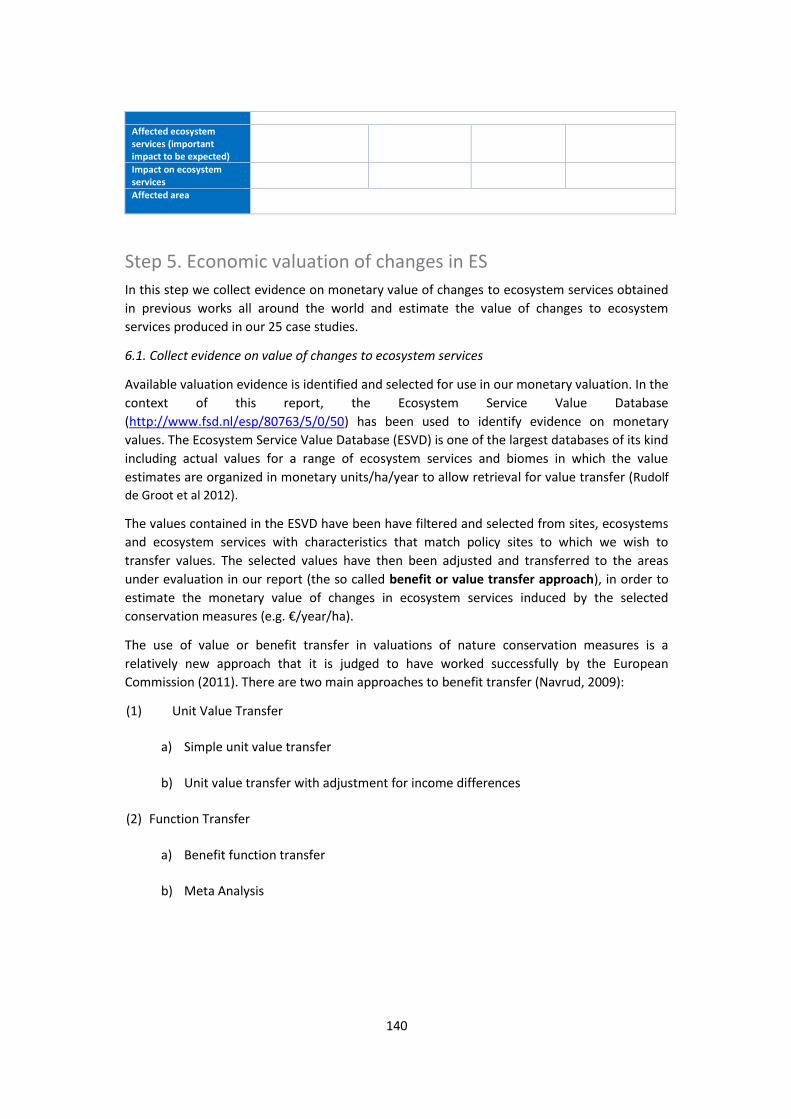
140
Affected ecosystem services (important impact to be expected)
Impact on ecosystem services
Affected area
Step 5. Economic valuation of changes in ES
In this step we collect evidence on monetary value of changes to ecosystem services obtained
in previous works all around the world and estimate the value of changes to ecosystem
services produced in our 25 case studies.
6.1. Collect evidence on value of changes to ecosystem services
Available valuation evidence is identified and selected for use in our monetary valuation. In the
context of this report, the Ecosystem Service Value Database
(http://www.fsd.nl/esp/80763/5/0/50) has been used to identify evidence on monetary
values. The Ecosystem Service Value Database (ESVD) is one of the largest databases of its kind
including actual values for a range of ecosystem services and biomes in which the value
estimates are organized in monetary units/ha/year to allow retrieval for value transfer (Rudolf
de Groot et al 2012).
The values contained in the ESVD have been have filtered and selected from sites, ecosystems
and ecosystem services with characteristics that match policy sites to which we wish to
transfer values. The selected values have then been adjusted and transferred to the areas
under evaluation in our report (the so called benefit or value transfer approach), in order to
estimate the monetary value of changes in ecosystem services induced by the selected
conservation measures (e.g. €/year/ha).
The use of value or benefit transfer in valuations of nature conservation measures is a
relatively new approach that it is judged to have worked successfully by the European
Commission (2011). There are two main approaches to benefit transfer (Navrud, 2009):
(1) Unit Value Transfer
a) Simple unit value transfer
b) Unit value transfer with adjustment for income differences
(2) Function Transfer
a) Benefit function transfer
b) Meta Analysis
141
In approach (1) the unit value at the study site (ST)33
is assumed to be representative for the
policy site (PS)34
; either without (a) or with (b) adjustment for differences in income levels
between the two sites (using Gross Domestic Product – GDP - per capita or Consumer Price
Index - CPI) and/or differences in the costs of living (using Purchase Power Parity (PPP)
indices). In approach (ii) a benefit function is estimated at the study site and transferred to the
policy site (a), or a benefit function is estimated from several study sites using meta-analysis
(b).
x Unit value transfer: this may involve either the transfer of unadjusted values, or the
transfer of adjusted values to estimate the value of the change in the provision of the
policy good:
o Unadjusted unit value transfer: unit value PS = unit value SS [e.g.
€/household/year for PS = €/household/year for SS] o Adjusted unit value transfer: unit value PS = adjustment factor × unit value SG [e.g.
€/household/year for PG = a €/household/year for SG]. Adjustments to transferred values are based on empirical evidence and control for differences between the
policy good context and the study good context that cause the unit value to differ
between the two contexts.
x Function transfer: The ‘value function’ estimated for the study good is used to estimate the value of the change in the provision of the policy good:
o Factors determining the value of PG = Factors determining the value of SG [e.g.
€/household/year for PG = f(XPG) = f (XSG)], where f is function and X is the set of factors (related to the good, the change, and the affected human population) that
are found to influence the value of the study good.
Simple unit transfer (1a) is the easiest approach to transferring benefit estimates from one
site to another. This approach assumes that the wellbeing experienced by an average
individual at the study site is the same as will be experienced by the average individual at the
policy site. Thus, we can directly transfer the benefit estimate from the study site to the policy
site. The selection of these unit values could be based on estimates from only one or a few
valuation studies considered to be close to the policy site (both geographically and in terms of
the good valued), or based on an average WTP estimate from literature reviews of many
studies (in terms of meta-analysis).
For transfer between countries with different income levels and costs of living, unit transfer with income adjustments (1b) needs to be applied. When we lack data on the income levels of
the affected populations at the policy and study sites, Purchasing Power Parities (PPPs) can be
used as proxies for income in international benefit transfers.
However, even if PPP adjusted GDP (or CPI) figures and exchange rates can be used to adjust
for differences in income and cost of living in different countries, it will not be able to correct
for differences in individual preferences, initial environmental quality, substitute sites and
goods, and cultural and institutional conditions between countries (or even within different
33
Study site: the site where the monetary valuation was undertaken in a certain database study 34
Reference site: the site where the LIFE NAT project has been carried out and for which we want to obtain
monetary values.
142
parts of a country). Transferring the entire benefit function (2a) is conceptually more
appealing than just transferring unit values because more information is effectively taken into
account in the transfer. The benefit relationship to be transferred from the study site(s) to the
policy site could be estimated using either revealed preference (RP) approaches like TC and HP
methods or stated preferences (SP) approaches like the CV method and Choice Experiments
(CE). The main problem with the benefit function approach is the need of information that is,
sometimes, not available.
Instead of transferring the benefit function from one selected valuation study, results from
several valuation studies could be combined in a meta-analysis (2b) to estimate one common
benefit function. Meta-analysis has been used to synthesize research findings and improve the
quality of literature reviews of valuation studies in order to come up with adjusted unit values.
Transfer method for spatial transfer: If the policy site is considered to be very close to the
study sites in all respects, unit value transfer can be used. If we have several equally suitable
study sites to transfer from, they should all be evaluated and the transferred values calculated
from a value range.
As already mentioned, for unit transfers between countries, differences in currency, income
and cost of living between countries can be corrected for by using Purchase Power Parity (PPP)
corrected exchange rates (see e.g. http://data.worldbank.org/indicator/PA.NUS.PPP). Within a
country we can also use unit value transfer with an adjustment for differences in income level,
and an income elasticity of WTP lower than 1.
Function transfer can be used when value functions have sufficient explanatory power and
contain variables for which data is readily available at the policy site.
NAVRUD (2009) recommends unit value transfer as the simplest and most transparent way of transfer both within and between countries. This transfer method has in general also been
found to be just as reliable as the more complex procedures of value function transfers and
meta-analysis. Generally speaking, error bounds of + 20-40 % should be used if the study and
policy sites are very similar (if the sites are very similar, or the primary study was designed with
transfer to sites similar to the policy site in mind, an error bound of + 20 % could be used). If
there is less similarity between study and policy sites (e.g. if the study and policy sites are not
quite close), error bounds of + 100 % should be used.
Transfer method for temporal transfer: The value estimate should be adjusted from the time
of data collection to current currency using the Consumer Price Index (CPI) for the policy site
country (NAVRUD, 2009). If we transfer values from a study site outside the policy site country,
we could first convert to local currency in the year of data-collection, using PPP (Purchase
Power Parity) corrected exchange rates in the year of data collection, and then use the local
CPI to update to current-currency values. Even though CPI is based on the preferences of
consumers, they could value environmental goods higher or lower over time than the basket
of goods which provide the basis for calculating CPI. However, CPI seems to be the best proxy
method available as there is no general rule for adjustments of preferences for health,
environmental goods or other public goods over time.
143
6.2. Estimate the value of changes to ecosystem services
Once impacts have been valued in monetary terms in sub-step 6.1 (Collect evidence on value of changes to ecosystem services), e.g. €/year/ha, monetary values for the change in ecosystem services can be calculated over the appropriate aggregation scale:
x Summing each impact over the appraisal time period. The present value of benefits is
calculated by applying discounting to make all benefits comparable in present value terms.
The time period used to consider the impacts on ecosystem services has been 20 years,
which is considered sufficient to capture significant impacts (all conservation measures
implemented in LIFE Nature and Biodiversity projects must be long-lasting and guarantees
must be provided that their results will be sustained in the long-term - at least 20 years).
x Summing the impacts of a measure across the types of benefits. This is done by summing
impacts from different ecosystem service categories.
Step 6. Assessment of the overall projects’ impact on ecosystem services
The purpose of this step is to identify and briefly describe the impact that the projects as a
whole (with all their conservation and communication actions) had on the whole range of
ecosystem services, according to the available information35
.
The qualitative overall assessment is summarised for each of the 25 selected LIFE Nature
project in the below Table 4. In this table, the “Ecosystem service” column lists different categories (provisioning, regulating, cultural & supporting) and types of ecosystem services,
according to the definitions included in Annex IV. The remaining columns indicate whether the
different types of ecosystem services were affected or not by the project, and how.
Considering that the information available was not exhaustive, the effects of the projects on
the ecosystem services was in some cases assumed by the authors of this report, even when
not mentioned in the consulted information sources, as in many cases these effects are well
known (for example, restoring bog habitats through removing draining infrastructures have a
direct positive impact on water regulation, and the restored bog habitats usually provide
benefits in terms of climate change mitigation).
The second column (“Ecosystem services affected) was filled-in using two type of symbols: +
and (+). The first symbol + was used when the concerned type of ecosystem services was
clearly affected by the project according to the available information; the second symbol (+)
was used when the information did not allow to assert that the concerned ecosystem service
was affected by the project but, considering the nature of the implemented measures it was
highly probable that it was at least potentially affected by them. The results of this assessment
for each project is contained in Annex I.
35
Annex IV briefly describes the ecosystem services provided by natural sites/areas where the LIFE Nature projects
are implemented. This annex is based on information in Kettunen, M. et. al. (2009) and TEEB (2010).
Conservation measure/s Impact on ecosystem services
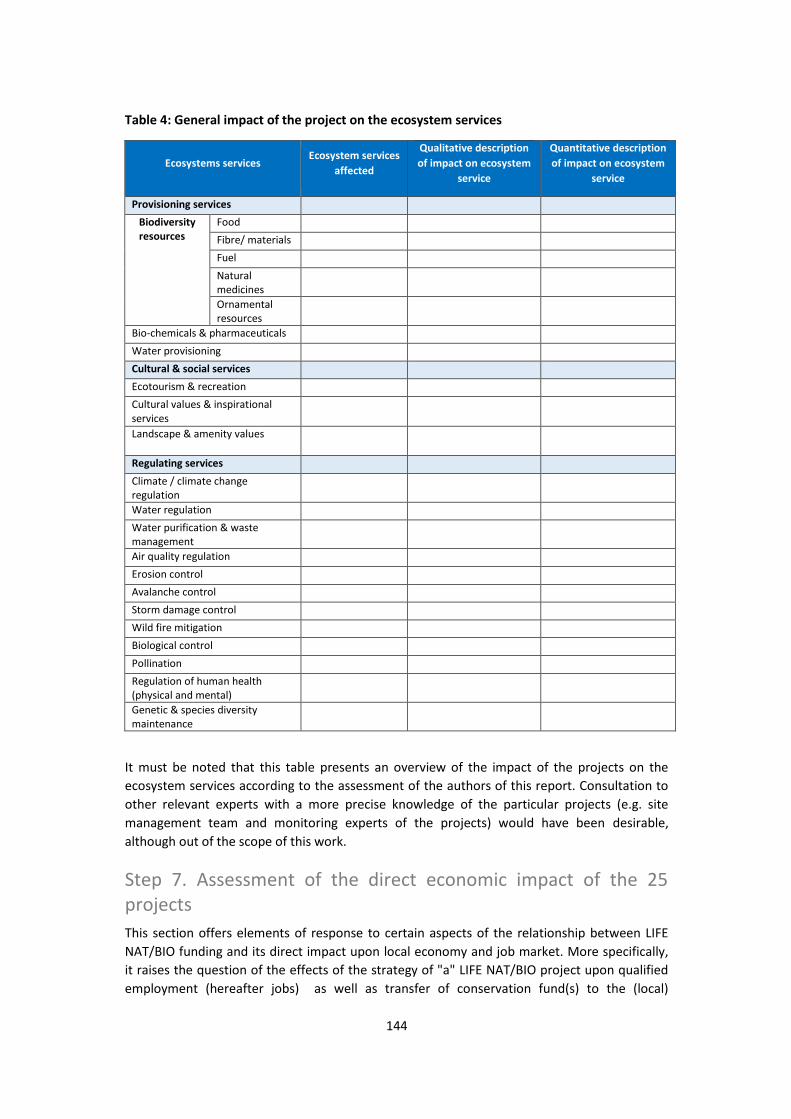
144
Table 4: General impact of the project on the ecosystem services
Ecosystems services Ecosystem services
affected
Qualitative description of impact on ecosystem
service
Quantitative description of impact on ecosystem
service
Provisioning services Biodiversity resources
Food Fibre/ materials Fuel Natural
medicines
Ornamental
resources
Bio-chemicals & pharmaceuticals Water provisioning Cultural & social services Ecotourism & recreation Cultural values & inspirational
services
Landscape & amenity values
Regulating services Climate / climate change
regulation
Water regulation Water purification & waste
management
Air quality regulation Erosion control Avalanche control Storm damage control Wild fire mitigation Biological control Pollination Regulation of human health
(physical and mental)
Genetic & species diversity
maintenance
It must be noted that this table presents an overview of the impact of the projects on the
ecosystem services according to the assessment of the authors of this report. Consultation to
other relevant experts with a more precise knowledge of the particular projects (e.g. site
management team and monitoring experts of the projects) would have been desirable,
although out of the scope of this work.
Step 7. Assessment of the direct economic impact of the 25
projects
This section offers elements of response to certain aspects of the relationship between LIFE
NAT/BIO funding and its direct impact upon local economy and job market. More specifically,
it raises the question of the effects of the strategy of "a" LIFE NAT/BIO project upon qualified
employment (hereafter jobs) as well as transfer of conservation fund(s) to the (local)
145
economy. In fact, this generic question treats "a" LIFE NAT/BIO project not as a list of
conservation-related themes -their expected results- but rather as an operational entity
identified by the fund allocation strategy and implementation procedures.
This question can be expanded to uncover certain structural traits that are specific to the
peculiarities of conservation projects. The prominent of them are:
x what is the structural/conceptual concept of "a" LIFE NAT/BIO project regarding fund
allocation? Is there a "consistent" similarity pattern in the rationale of conservation
projects selected/implemented? Or, is the LIFE NAT/BIO funding strategy a collection
of interesting per se local singularities?
x what is the primordial sink of funds within a project? Does it correspond to the
establishment of a local human/scientific/management capital? Does it promote
participatory mechanisms in nature conservation? Does it establish permanent or
recurring conservation activities? Does it create legal/innovative/adding value
adaptation under national/local policy-making conditions?
Methodologically, three descriptors/project were used as proxies to address the above
question(s), besides the country/region/conservation target/period of implementation:
x the total budget (K or M€), x the duration (in months), and
x the distribution of funds per standardized category of expenditures36
, i.e. (1)
Personnel, (2) Travel, (3) External assistance, (4) Durable goods, (5) Land/rights
purchase /lease, (6) Consumables, (7) Other costs and (8) Overheads. These 8
categories are uniform across all LIFE NAT/BIO projects.
A series of indicators representing the fund allocation or distribution pattern within each
project were calculated; the Shannon diversity or entropy index and the equitability index
were retained for further regression analysis against total budget, duration and fund allocation
to "Job- related" and "transfer-to-the-local economy-related" categories. The 8 categories can
be further grouped into 3 major classes of expenses:
- (1) Personnel Cost; and (2) Travel Cost: grouped into operational cost
- (3) External Assistance; and (4) Land-purchase/leasing/etc.: grouped into
constitutional cost
- (5) Durable equipment; (6) Consumables; (7) Other cost; and (8) Overheads: grouped
into project management cost.
Obviously, the sum of the percentage fund allocated to the three classes equals to 100% - or
add to 1 in relative frequencies. This uniform body of information has been treated statistically
and graphically in order to (1) create a potential indicator for future econometric models
relating the "economic profile" of a project and the Jobs & Growth dependent variables; and,
(2) to offer a robust method for comparing the projects as boundary objects/entities, between
conservation and economy.
36
Data on expenditures are provided in the official evaluation report of each project: it is the source of information
upon which the following sections are developed.
146
Finally, the combination of these three descriptors -i.e. budget, duration, diversity- reflects the
strategy of a project and allows for inferences on its direct impact(s) upon the relevant
economy metrics.
Step 8. Effectiveness and replicability
Although being the core financial instrument for implementation of nature/biodiversity
conservation policies of the EU [Habitats and Birds Directives], the LIFE-Nature and Biodiversity
funding mechanism proves to be besides a thorough investment to comply to Conventional
engagements and therefore a targeted sink of resources, a significant source of beneficial
impacts upon a niche job market -e.g. qualified conservation-related personnel- as well as
upon opportunities for sustainable growth and social capital construction at local and/or
regional scales.
Effectiveness is defined here as a measure of LIFE projects conservation achievement(s) per
cost; it differs from efficiency in that the later expresses the degree to which LIFE funding
(/average project) is either minimized for achieving a given set of policy targets or this set is
maximized for a given level of funding (Arponen et al. 2010). Replicability is examined as a
multi-criteria qualitative trait of the LIFE-Nature and Biodiversity family of projects that might
define future priorities for selecting and funding integrated conservation activities. It is
actually the operational mirroring of effectiveness when land availability, socio-political
opportunities, broader EU strategy and costs are confronted and/or ideally integrated with a
solid scientific planning framework for biodiversity conservation at a EU scale.
147
Chapter 2: Results
Monetary valuation overall results
In the literature, ecosystem service values have been reported in many different metrics and
currencies for different time periods and price levels (e.g., WTP per household per year,
capitalized value for a given time horizon, marginal value per acre, etc.). The ecosystem service
values contained in the ESVD are Values Estimated in Monetary units (VEM). These values are
estimated using a range of approaches, including market prices, cost-based approaches, stated
preference methods, revealed preference methods and production function approaches. They
generally represent marginal values for a specific ecosystem service provided by an individual
ecosystem (they are marginal values in the sense that they represent the change in value for a
small change in the overall provision of the specific ecosystem service). To aid direct comparison and aggregation, the values in the ESVD have been standardised to common spatial, temporal and currency units, namely 2014 Euro per hectare per year (€2014/ha/year). The values were first adjusted to 2014 values using the Consumer Price Index (CPI) for each
country, which reflects the effect of inflation, and then converted to euros using appropriate
Purchasing Power Parity (PPP) conversion factors relative to the year 2014. The World Bank
official exchange rates, CPI37
and PPP38
conversion factors were used for this purpose. For EU
member states which have not adopted the euro, adjusted values using the CPI were first
converted to the local currency using the PPP, and then converted into euros using the
European Central Bank reference exchange rates39
.
Of the original value points input into ESVD (over 1300), we only used those in per hectare per
year which could thus be converted into the standardized unit (i.e. €2014/ha/year). The
following tables give an overview of the minimum and maximum values of the selected
ecosystem services and present value of benefits for the 25 cases (more details can be found
in Annex II). The present value of benefits was estimated considering a 20-year lifetime for all
conservation measures and using a 5% discount rate. As already mentioned, a relatively long
timescale is considered because many of the impacts of the conservation measures of LIFE
projects are expected to have a long-lasting effect (e.g. at least 20years). Discounting is used in
order to compare the values of different impacts over time on a consistent basis. (See the box
of the next page for the method of calculation).
37
http://data.worldbank.org/indicator/FP.CPI.TOTL 38
http://data.worldbank.org/indicator/PA.NUS.PPP 39
http://sdw.ecb.europa.eu/browse.do?node=2018794
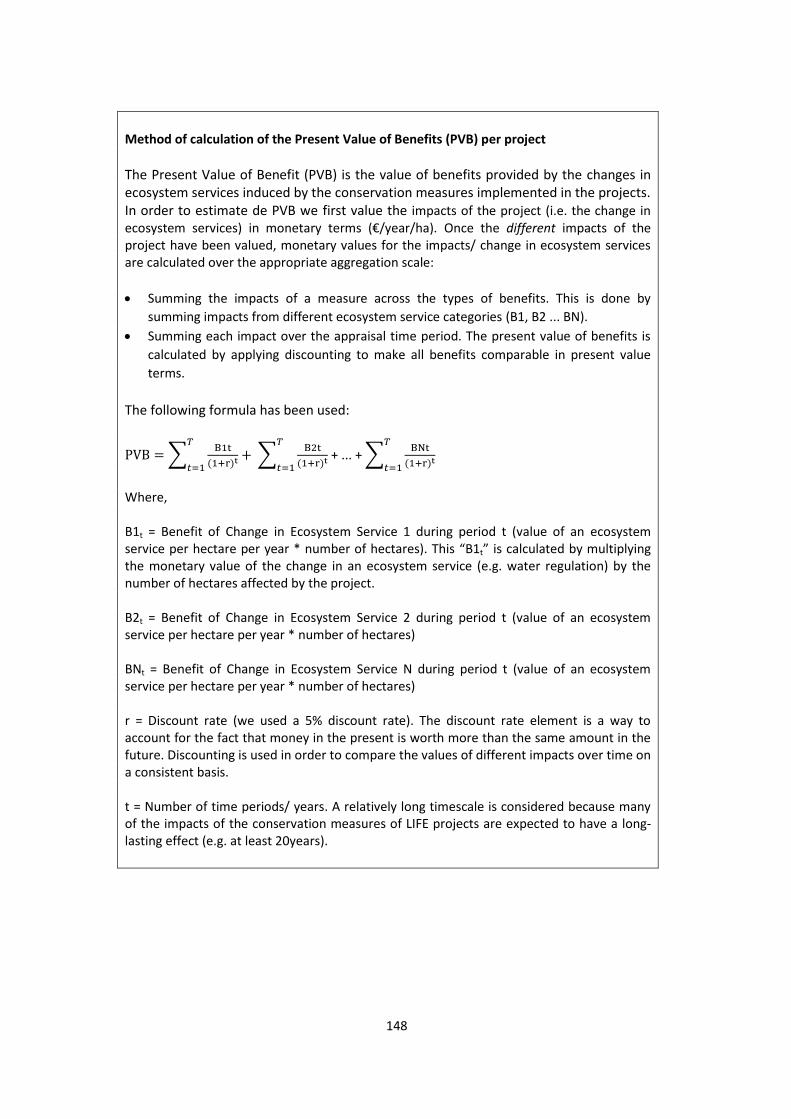
148
Method of calculation of the Present Value of Benefits (PVB) per project
The Present Value of Benefit (PVB) is the value of benefits provided by the changes in
ecosystem services induced by the conservation measures implemented in the projects.
In order to estimate de PVB we first value the impacts of the project (i.e. the change in
ecosystem services) in monetary terms (€/year/ha). Once the different impacts of the
project have been valued, monetary values for the impacts/ change in ecosystem services
are calculated over the appropriate aggregation scale:
x Summing the impacts of a measure across the types of benefits. This is done by
summing impacts from different ecosystem service categories (B1, B2 ... BN).
x Summing each impact over the appraisal time period. The present value of benefits is
calculated by applying discounting to make all benefits comparable in present value
terms.
The following formula has been used:
PVB = ∑ B1t(1+r)t
𝑇
𝑡=1+ ∑ B2t
(1+r)t
𝑇
𝑡=1 + ... + ∑ BNt
(1+r)t
𝑇
𝑡=1
Where,
B1t = Benefit of Change in Ecosystem Service 1 during period t (value of an ecosystem
service per hectare per year * number of hectares). This “B1t” is calculated by multiplying
the monetary value of the change in an ecosystem service (e.g. water regulation) by the
number of hectares affected by the project.
B2t = Benefit of Change in Ecosystem Service 2 during period t (value of an ecosystem
service per hectare per year * number of hectares)
BNt = Benefit of Change in Ecosystem Service N during period t (value of an ecosystem
service per hectare per year * number of hectares)
r = Discount rate (we used a 5% discount rate). The discount rate element is a way to
account for the fact that money in the present is worth more than the same amount in the
future. Discounting is used in order to compare the values of different impacts over time on
a consistent basis.
t = Number of time periods/ years. A relatively long timescale is considered because many
of the impacts of the conservation measures of LIFE projects are expected to have a long-
lasting effect (e.g. at least 20years).
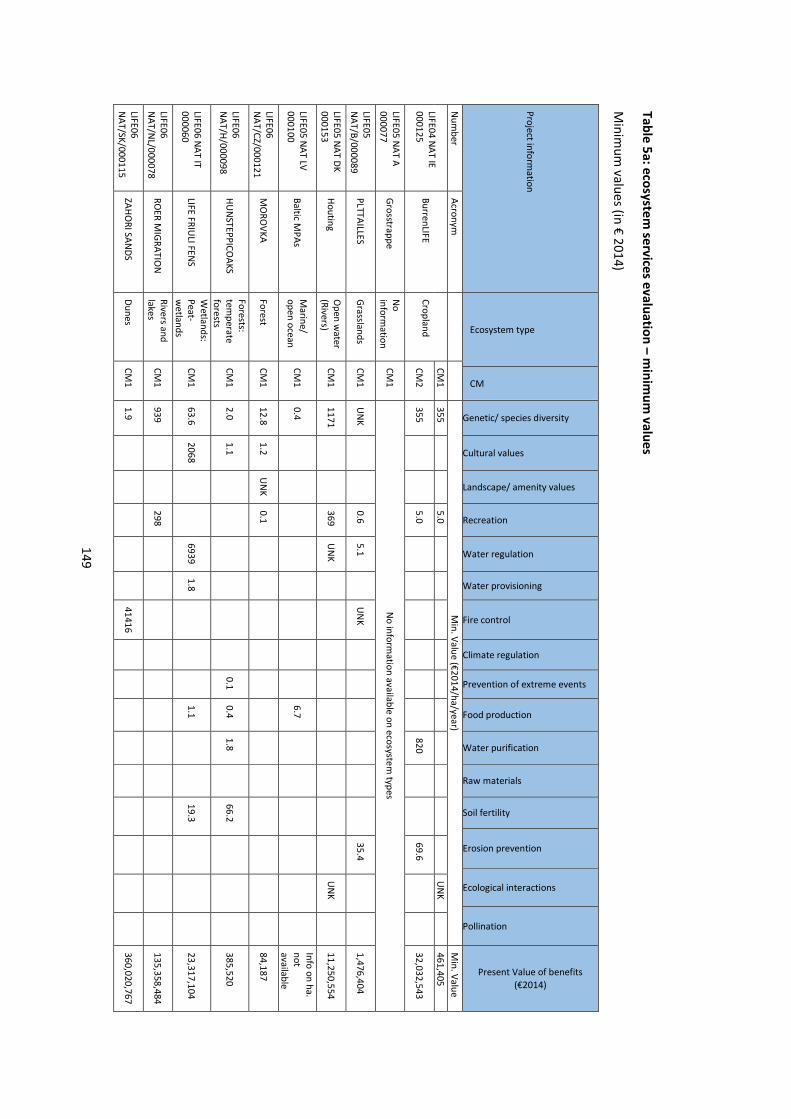
14
9
Table 5a: ecosystem services evaluation – m
inimum
values
Min
imu
m v
alu
es (in € 2014)
Pro
ject in
form
atio
n
Ecosystem type
CM
Genetic/ species diversity
Cultural values
Landscape/ amenity values
Recreation
Water regulation
Water provisioning
Fire control
Climate regulation
Prevention of extreme events
Food production
Water purification
Raw materials
Soil fertility
Erosion prevention
Ecological interactions
Pollination
Present Value of benefits
(€2014)
Nu
mb
er
Acro
nym
M
in. Value (€2014/ha/year) M
in. V
alu
e
LIFE
04
NA
T IE
00
01
25
B
urre
nLIF
E
Cro
pla
nd
CM
1
35
5
5.0
U
NK
46
1,4
05
CM
2
35
5
5.0
8
20
6
9.6
3
2,0
32
,54
3
LIFE
05
NA
T A
00
00
77
G
rosstra
pp
e
No
info
rma
tion
C
M1
N
o in
form
atio
n a
vaila
ble
on
eco
syste
m ty
pe
s
LIFE
05
NA
T/B
/00
00
89
P
LTT
AILLE
S
Gra
sslan
ds
CM
1
UN
K
0.6
5
.1
U
NK
3
5.4
1
,47
6,4
04
LIFE
05
NA
T D
K
00
01
53
H
ou
ting
O
pe
n w
ate
r
(Riv
ers)
CM
1
11
71
3
69
U
NK
UN
K
1
1,2
50
,55
4
LIFE
05
NA
T LV
00
01
00
B
altic M
PA
s M
arin
e/
op
en
oce
an
C
M1
0
.4
6.7
Info
on
ha
.
no
t
ava
ilab
le
LIFE
06
NA
T/C
Z/0
00
12
1
MO
RO
VK
A
Fo
rest
CM
1
12
.8
1.2
U
NK
0
.1
84
,18
7
LIFE
06
NA
T/H
/00
00
98
H
UN
ST
EP
PIC
OA
KS
Fo
rests:
tem
pe
rate
fore
sts
CM
1
2.0
1
.1
0.1
0
.4
1.8
66
.2
3
85
,52
0
LIFE
06
NA
T IT
00
00
60
LIF
E F
RIU
LI FE
NS
We
tlan
ds:
Pe
at-
we
tlan
ds
CM
1
63
.6
20
68
6
93
9
1.8
1.1
1
9.3
23
,31
7,1
04
LIFE
06
NA
T/N
L/00
00
78
R
OE
R M
IGR
AT
ION
R
ive
rs an
d
lake
s C
M1
9
39
2
98
1
35
,35
8,4
84
LIFE
06
NA
T/S
K/0
00
11
5
ZA
HO
RI S
AN
DS
Du
ne
s C
M1
1
.9
4
14
16
36
0,0
20
,76
7
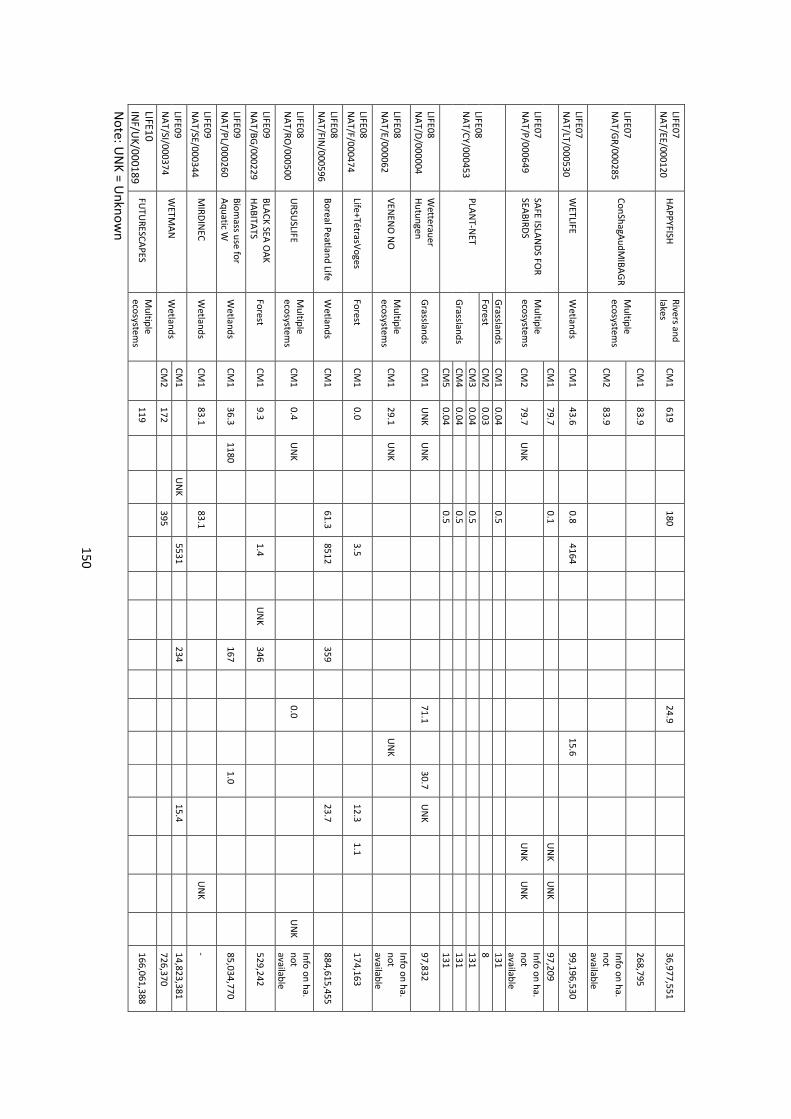
15
0
LIFE
07
NA
T/E
E/0
00
12
0
HA
PP
YF
ISH
R
ive
rs an
d
lake
s C
M1
6
19
1
80
24
.9
36
,97
7,5
51
LIFE
07
NA
T/G
R/0
00
28
5
Co
nS
ha
gA
ud
MIB
AG
R
Mu
ltiple
eco
system
s
CM
1
83
.9
2
68
,79
5
CM
2
83
.9
Info
on
ha
.
no
t
ava
ilab
le
LIFE
07
NA
T/LT
/00
05
30
W
ET
LIFE
W
etla
nd
s C
M1
4
3.6
0
.8
41
64
15
.6
9
9,1
96
,53
0
LIFE
07
NA
T/P
/00
06
49
SA
FE
ISLA
ND
S F
OR
SE
AB
IRD
S
Mu
ltiple
eco
system
s
CM
1
79
.7
0.1
UN
K
UN
K
9
7,2
09
CM
2
79
.7
UN
K
U
NK
U
NK
Info
on
ha
.
no
t
ava
ilab
le
LIFE
08
NA
T/C
Y/0
00
45
3
PLA
NT
-NE
T
Gra
sslan
ds
CM
1
0.0
4
0.5
1
31
Fo
rest
CM
2
0.0
3
8
Gra
sslan
ds
CM
3
0.0
4
0.5
1
31
CM
4
0.0
4
0.5
1
31
CM
5
0.0
4
0.5
1
31
LIFE
08
NA
T/D
/00
00
04
We
ttera
ue
r
Hu
tun
ge
n
Gra
sslan
ds
CM
1
UN
K
UN
K
7
1.1
30
.7
UN
K
9
7,8
32
LIFE
08
NA
T/E
/00
00
62
V
EN
EN
O N
O
Mu
ltiple
eco
system
s C
M1
2
9.1
U
NK
U
NK
Info
on
ha
.
no
t
ava
ilab
le
LIFE
08
NA
T/F
/00
04
74
Life
+T
étra
sVo
ge
s F
ore
st C
M1
0
.0
3
.5
1
2.3
1
.1
17
4,1
63
LIFE
08
NA
T/F
IN/0
00
59
6
Bo
rea
l Pe
atla
nd
Life
We
tlan
ds
CM
1
6
1.3
8
51
2
35
9
23
.7
8
84
,61
5,4
55
LIFE
08
NA
T/R
O/0
00
50
0
UR
SU
SLIF
E
Mu
ltiple
eco
system
s C
M1
0
.4
UN
K
0
.0
U
NK
Info
on
ha
.
no
t
ava
ilab
le
LIFE
09
NA
T/B
G/0
00
22
9
BLA
CK
SE
A O
AK
HA
BIT
AT
S
Fo
rest
CM
1
9.3
1.4
UN
K
34
6
52
9,2
42
LIFE
09
NA
T/P
L/00
02
60
Bio
ma
ss use
for
Aq
ua
tic W
We
tlan
ds
CM
1
36
.3
11
80
16
7
1
.0
85
,03
4,7
70
LIFE
09
NA
T/S
E/0
00
34
4
MIR
DIN
EC
W
etla
nd
s C
M1
8
3.1
8
3.1
U
NK
-
LIFE
09
NA
T/S
I/00
03
74
W
ET
MA
N
We
tlan
ds
CM
1
UN
K
5
53
1
23
4
15
.4
1
4,8
23
,38
1
CM
2
17
2
39
5
72
6,3
70
LIFE
10
INF
/UK
/00
01
89
F
UT
UR
ES
CA
PE
S
Mu
ltiple
eco
system
s
11
9
1
66
,06
1,3
88
No
te: U
NK
= U
nk
no
wn
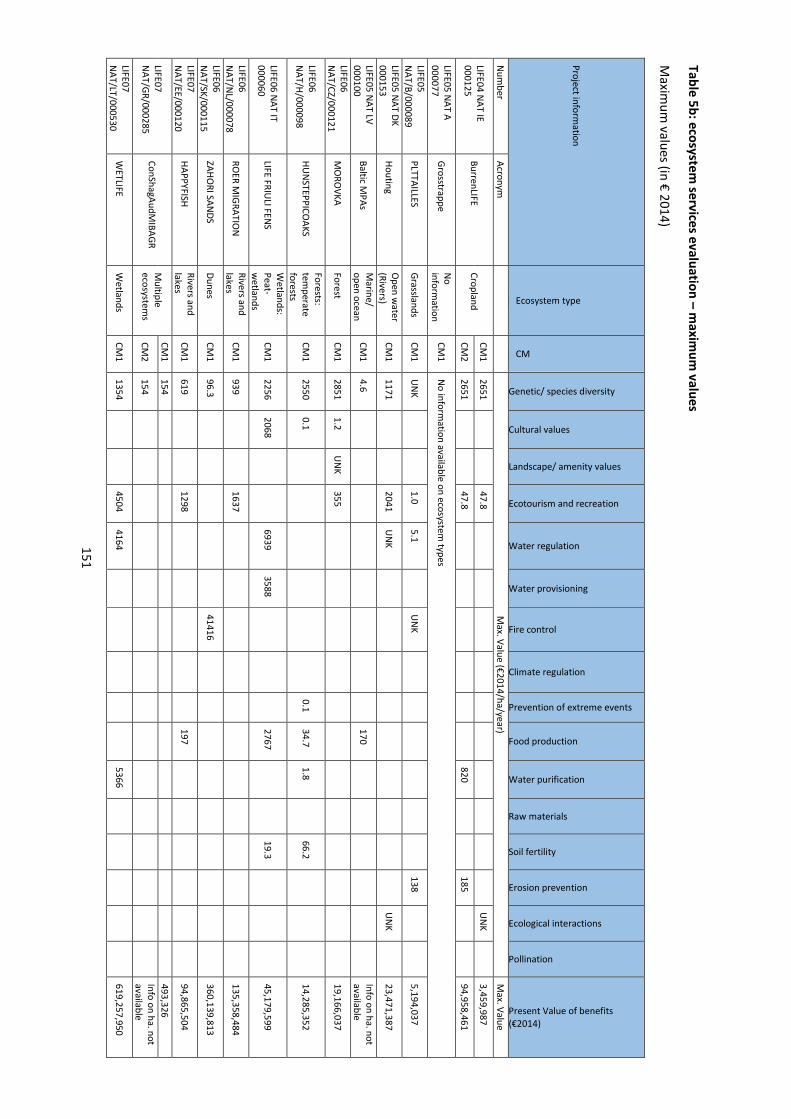
15
1
Table 5b: ecosystem services evaluation – m
aximum
values
Ma
ximu
m v
alu
es (in € 2014)
Pro
ject in
form
atio
n
Ecosystem type
CM
Genetic/ species diversity
Cultural values
Landscape/ amenity values
Ecotourism and recreation
Water regulation
Water provisioning
Fire control
Climate regulation
Prevention of extreme events
Food production
Water purification
Raw materials
Soil fertility
Erosion prevention
Ecological interactions
Pollination
Present Value of benefits
(€2014)
Nu
mb
er
Acro
nym
M
ax. Value (€2014/ha/year) M
ax. V
alu
e
LIFE
04
NA
T IE
00
01
25
B
urre
nLIF
E
Cro
pla
nd
C
M1
2
65
1
47
.8
UN
K
3
,45
9,9
87
CM
2
26
51
4
7.8
8
20
1
85
9
4,9
58
,46
1
LIFE
05
NA
T A
00
00
77
G
rosstra
pp
e
No
info
rma
tion
C
M1
N
o in
form
atio
n a
vaila
ble
on
eco
syste
m ty
pe
s
LIFE
05
NA
T/B
/00
00
89
P
LTT
AILLE
S
Gra
sslan
ds
CM
1
UN
K
1.0
5
.1
U
NK
1
38
5
,19
4,0
37
LIFE
05
NA
T D
K
00
01
53
H
ou
ting
O
pe
n w
ate
r
(Riv
ers)
CM
1
11
71
2
04
1
UN
K
U
NK
23
,47
1,3
87
LIFE
05
NA
T LV
00
01
00
B
altic M
PA
s M
arin
e/
op
en
oce
an
C
M1
4
.6
17
0
Info
on
ha
. no
t
ava
ilab
le
LIFE
06
NA
T/C
Z/0
00
12
1
MO
RO
VK
A
Fo
rest
CM
1
28
51
1
.2
UN
K
35
5
19
,16
6,0
37
LIFE
06
NA
T/H
/00
00
98
H
UN
ST
EP
PIC
OA
KS
Fo
rests:
tem
pe
rate
fore
sts
CM
1
25
50
0
.1
0.1
3
4.7
1
.8
6
6.2
14
,28
5,3
52
LIFE
06
NA
T IT
00
00
60
LIF
E F
RIU
LI FE
NS
We
tlan
ds:
Pe
at-
we
tlan
ds
CM
1
22
56
2
06
8
69
39
3
58
8
2
76
7
19
.3
4
5,1
79
,59
9
LIFE
06
NA
T/N
L/00
00
78
R
OE
R M
IGR
AT
ION
R
ive
rs an
d
lake
s C
M1
9
39
1
63
7
13
5,3
58
,48
4
LIFE
06
NA
T/S
K/0
00
11
5
ZA
HO
RI S
AN
DS
Du
ne
s C
M1
9
6.3
41
41
6
3
60
,13
9,8
13
LIFE
07
NA
T/E
E/0
00
12
0
HA
PP
YF
ISH
R
ive
rs an
d
lake
s C
M1
6
19
1
29
8
1
97
9
4,8
65
,50
4
LIFE
07
NA
T/G
R/0
00
28
5
Co
nS
ha
gA
ud
MIB
AG
R
Mu
ltiple
eco
system
s
CM
1
15
4
4
93
,32
6
CM
2
15
4
In
fo o
n h
a. n
ot
ava
ilab
le
LIFE
07
NA
T/LT
/00
05
30
W
ET
LIFE
W
etla
nd
s C
M1
1
35
4
45
04
4
16
4
5
36
6
6
19
,25
7,9
50
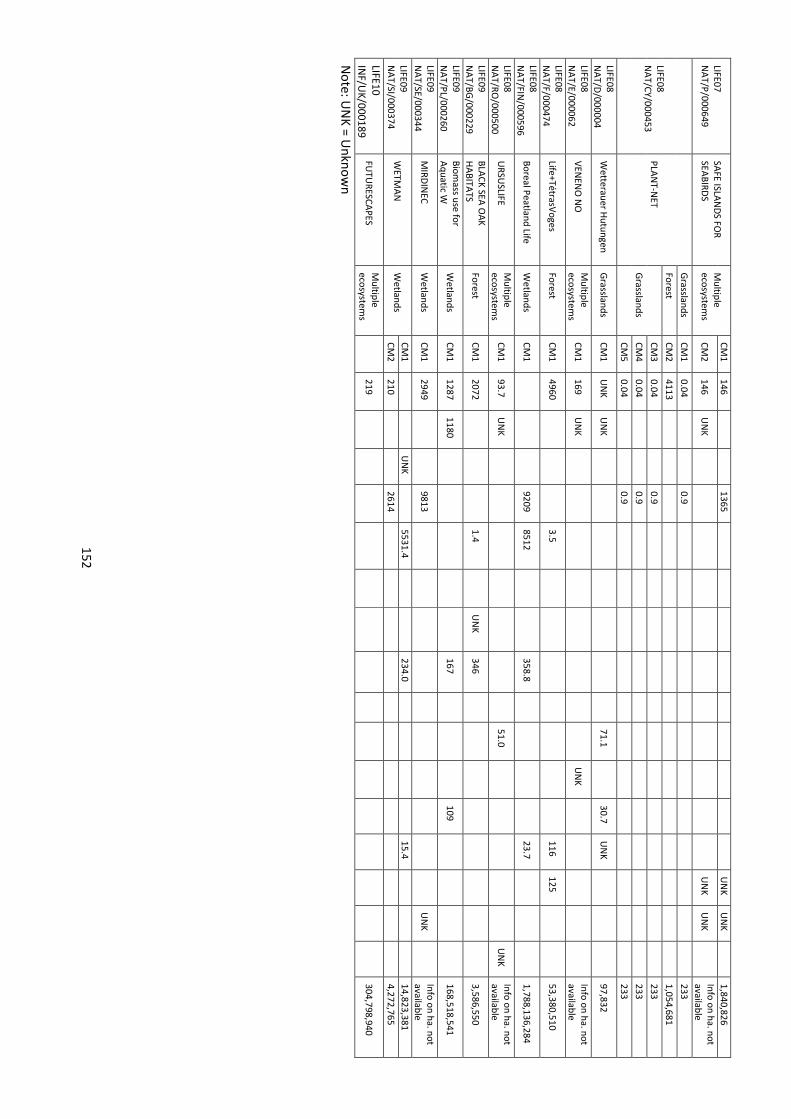
15
2
LIFE
07
NA
T/P
/00
06
49
SA
FE
ISLA
ND
S F
OR
SE
AB
IRD
S
Mu
ltiple
eco
system
s
CM
1
14
6
13
65
UN
K
UN
K
1
,84
0,8
26
CM
2
14
6
UN
K
U
NK
U
NK
Info
on
ha
. no
t
ava
ilab
le
LIFE
08
NA
T/C
Y/0
00
45
3
PLA
NT
-NE
T
Gra
sslan
ds
CM
1
0.0
4
0.9
2
33
Fo
rest
CM
2
41
13
1,0
54
,68
1
Gra
sslan
ds
CM
3
0.0
4
0.9
2
33
CM
4
0.0
4
0.9
2
33
CM
5
0.0
4
0.9
2
33
LIFE
08
NA
T/D
/00
00
04
W
ette
rau
er H
utu
ng
en
G
rassla
nd
s C
M1
U
NK
U
NK
71
.1
3
0.7
U
NK
97
,83
2
LIFE
08
NA
T/E
/00
00
62
V
EN
EN
O N
O
Mu
ltiple
eco
system
s C
M1
1
69
U
NK
U
NK
Info
on
ha
. no
t
ava
ilab
le
LIFE
08
NA
T/F
/00
04
74
Life
+T
étra
sVo
ge
s F
ore
st C
M1
4
96
0
3
.5
1
16
1
25
5
3,3
80
,51
0
LIFE
08
NA
T/F
IN/0
00
59
6
Bo
rea
l Pe
atla
nd
Life
We
tlan
ds
CM
1
9
20
9
85
12
3
58
.8
23
.7
1
,78
8,1
36
,28
4
LIFE
08
NA
T/R
O/0
00
50
0
UR
SU
SLIF
E
Mu
ltiple
eco
system
s C
M1
9
3.7
U
NK
51
.0
U
NK
In
fo o
n h
a. n
ot
ava
ilab
le
LIFE
09
NA
T/B
G/0
00
22
9
BLA
CK
SE
A O
AK
HA
BIT
AT
S
Fo
rest
CM
1
20
72
1.4
UN
K
34
6
3,5
86
,55
0
LIFE
09
NA
T/P
L/00
02
60
Bio
ma
ss use
for
Aq
ua
tic W
We
tlan
ds
CM
1
12
87
1
18
0
1
67
10
9
16
8,5
18
,54
1
LIFE
09
NA
T/S
E/0
00
34
4
MIR
DIN
EC
W
etla
nd
s C
M1
2
94
9
98
13
U
NK
Info
on
ha
. no
t
ava
ilab
le
LIFE
09
NA
T/S
I/00
03
74
W
ET
MA
N
We
tlan
ds
CM
1
UN
K
5
53
1.4
2
34
.0
15
.4
1
4,8
23
,38
1
CM
2
21
0
26
14
4
,27
2,7
65
LIFE
10
INF
/UK
/00
01
89
F
UT
UR
ES
CA
PE
S
Mu
ltiple
eco
system
s
21
9
3
04
,79
8,9
40
No
te: U
NK
= U
nk
no
wn
153
A view on the overall results of the 25 cases shows that in 15 of the projects, all selected
conservation measures and ecosystem services could be monetized. In 10 projects (MOROVKA,
BLACK SEA OAK HABITATS, SAFE ISLANDS FOR SEABIRDS and others), various monetary values
could not be assessed for not existing previous monetary value estimations or for not existing
any surface area affected or being it unknown. Despite these blanks, the present value of
benefits in almost all cases could be calculated. The present value of benefits could not be
estimated for projects where data on affected area was missing. 14 of the 25 cases show
benefits higher than 1 million Euros (when minimum values are considered) after the
conservation measures are implemented. The remaining cases have a small benefit.
These tables also show that in some projects (SAFE ISLANDS FOR SEABIRDS, WETTERAUER
HUTUNGEN and VENENO NO) very few monetary values could be assessed. Other projects,
have well elaborated valuation. The most frequently valued services are genetic and species
diversity (22 of 25 cases), recreation and ecotourism (12 of 25 projects), and water regulation
(7 of 25 projects). Other services were only valued in four or fewer cases. The inability to value
some ecosystem services in most of the projects suggests there is an important data gap. The
tables also allow to figure out which ecosystem service is of the greatest importance and
which are marginal.
Overall indirect economic impact of the 25 selected LIFE projects
The results of the assessment of the projects’ impact on the whole range of ecosystem
services are detailed in Annex I. Table 6 presents below the overall results for all the 25
projects.
The overall view presented in Table 6 shows how only part of the projects’ impact on ecosystem services was considered for the monetary valuation (see right columns of the
table). This is justified by the lack of data and quantitative details and the need of simplifying
the exercise. However, taking this into account it seems reasonable to think that in a more in-
depth analysis the monetary valuation would probably be higher for most of the projects.
As in the monetary valuation, in the overall assessment the ecosystem service most frequently
affected by the project is genetic and species diversity (25 of 25 projects), which was
expectable as all the projects targeted natural ecosystems, habitats and species. On the other
hand, other services not always selected for the monetary valuation appear here as very
frequently affected, as is the case of cultural values and inspirational services (20 of 25
projects), or ecological interactions (19 of 25).
The table shows a high rate of cases where the impact is considered only as highly probable
[marked with the (+) symbol] because the information contained in the reference reports did
not include sufficient data to allow considering a clear effect of the project on the concerned
types of services. For example, in LIFE07 NAT/P/000649 - SAFE ISLANDS FOR SEABIRDS, the
reference documents mention feral goats as an important erosion threat (a quite frequent
problem in natural ecosystems under high grazing pressure), a problem that would in principle
be tackled by the alien species elimination intervention within a fenced area; however, there
was no data on how and/or to which extent the erosion problem was mitigated.
Only in three cases it has been considered that the project could have a potential/ actual
negative impact: LIFE06 NAT/CZ/000121–MORAVKA, LIFE06 NAT/H/000098–HUNSTEPPICOAKS
154
and LIFE06 NAT/NL/000078 – Roer Migration. In the case of LIFE06 NAT/CZ/000121 –MORAVKA, the information available does not allow to assess whether the chemical herbicides
used to fight invasive alien species were adequate and correctly applied; otherwise, they could
have a negative impact on water bodies (this is an aspect not always sufficiently considered in
the LIFE Nature projects). In LIFE06 NAT/H/000098–HUNSTEPPICOAKS herbivores control was
negatively perceived by the public (also a frequent problem that must be addressed though
adequate communication campaigns) and the river restoration undertaken LIFE06
NAT/NL/000078 – Roer Migration made for kayak users no longer possible to practice their
sport at the targeted site and so this was the only group that reacted negatively to the
implementation of the project.
Some of the types of ecosystem services were clearly affected by the projects in all or most
cases (species diversity, ecological interactions, water regulation, landscape and cultural
values), while other types were most of the times only potentially or unclearly affected due to
the lack of data (pollination, erosion control, water provisioning, food).
On the other hand, it could be interesting to establish the difference between long-term and
short-term impact of the projects (for example, planting trees will have a impact on carbon
sequestration only in the long-term). This is highlighted when relevant in Annex I.
Finally, Table 6 gives a clear picture of the uncertainty of the assessment, as many (+) symbols
appear, meaning that the available information was insufficient for an in depth evaluation and
only very rough estimations are possible with the method used in this report (see discussion
on limitations/uncertainties in the Conclusions section).
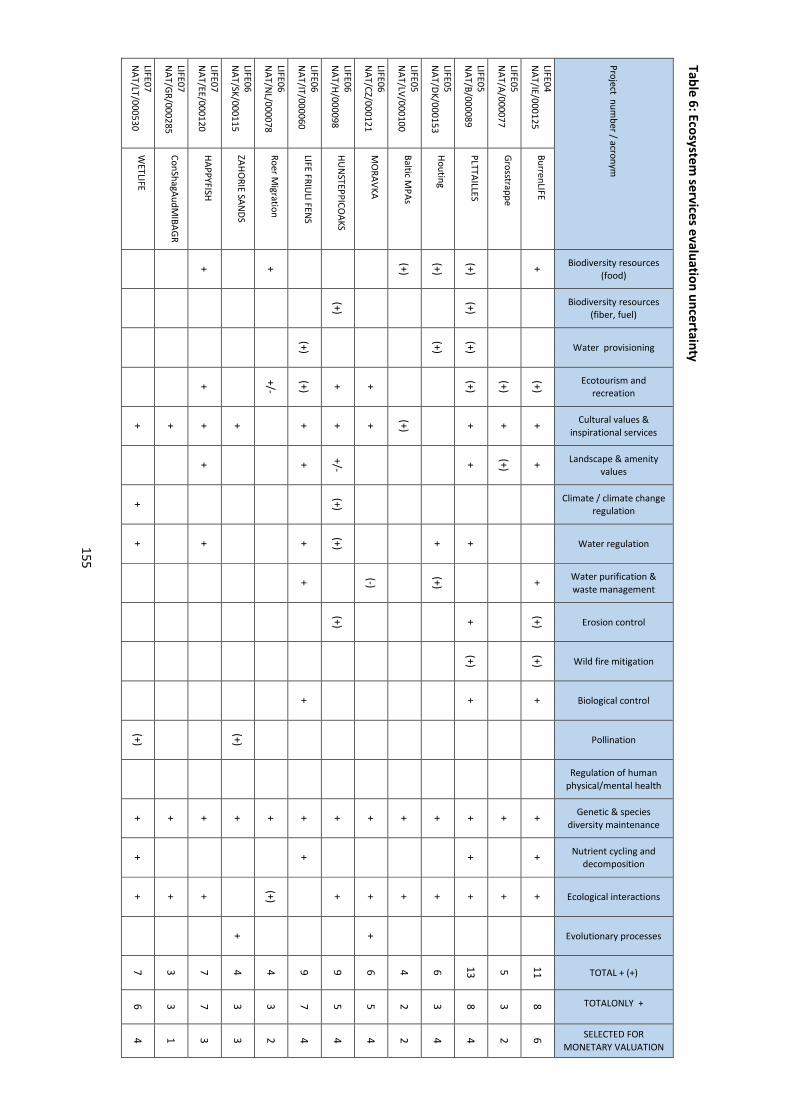
15
5
Table 6: Ecosystem services evaluation uncertainty
Pro
ject n
um
be
r / acro
nym
Biodiversity resources
(food)
Biodiversity resources
(fiber, fuel)
Water provisioning
Ecotourism and
recreation
Cultural values &
inspirational services
Landscape & amenity
values
Climate / climate change
regulation
Water regulation
Water purification &
waste management
Erosion control
Wild fire mitigation
Biological control
Pollination
Regulation of human
physical/mental health
Genetic & species
diversity maintenance
Nutrient cycling and
decomposition
Ecological interactions
Evolutionary processes
TOTAL + (+)
TOTALONLY +
SELECTED FOR
MONETARY VALUATION
LIFE
04
NA
T/IE
/00
01
25
B
urre
nLIF
E
+
(+)
+
+
+
(+)
(+)
+
+
+
+
1
1
8
6
LIFE
05
NA
T/A
/00
00
77
G
rosstra
pp
e
(+
) +
(+
)
+
+
5
3
2
LIFE
05
NA
T/B
/00
00
89
P
LTT
AILLE
S
(+)
(+)
(+)
(+)
+
+
+
+
(+)
+
+
+
+
1
3
8
4
LIFE
05
NA
T/D
K/0
00
15
3
Ho
utin
g
(+)
(+
)
+
(+
)
+
+
6
3
4
LIFE
05
NA
T/LV
/00
01
00
B
altic M
PA
s (+
)
(+)
+
+
4
2
2
LIFE
06
NA
T/C
Z/0
00
12
1
MO
RA
VK
A
+
+
(-)
+
+
+
6
5
4
LIFE
06
NA
T/H
/00
00
98
H
UN
ST
EP
PIC
OA
KS
(+)
+
+
+
/- (+
) (+
)
(+)
+
+
9
5
4
LIFE
06
NA
T/IT
/00
00
60
LIF
E F
RIU
LI FE
NS
(+)
(+)
+
+
+
+
+
+
+
9
7
4
LIFE
06
NA
T/N
L/00
00
78
R
oe
r Mig
ratio
n
+
+/-
+
(+
)
4
3
2
LIFE
06
NA
T/S
K/0
00
11
5
ZA
HO
RIE
SAN
DS
+
(+
)
+
+
4
3
3
LIFE
07
NA
T/E
E/0
00
12
0
HA
PP
YF
ISH
+
+
+
+
+
+
+
7
7
3
LIFE
07
NA
T/G
R/0
00
28
5
Co
nS
ha
gA
ud
MIB
AG
R
+
+
+
3
3
1
LIFE
07
NA
T/LT
/00
05
30
W
ET
LIFE
+
+
+
(+)
+
+
+
7
6
4
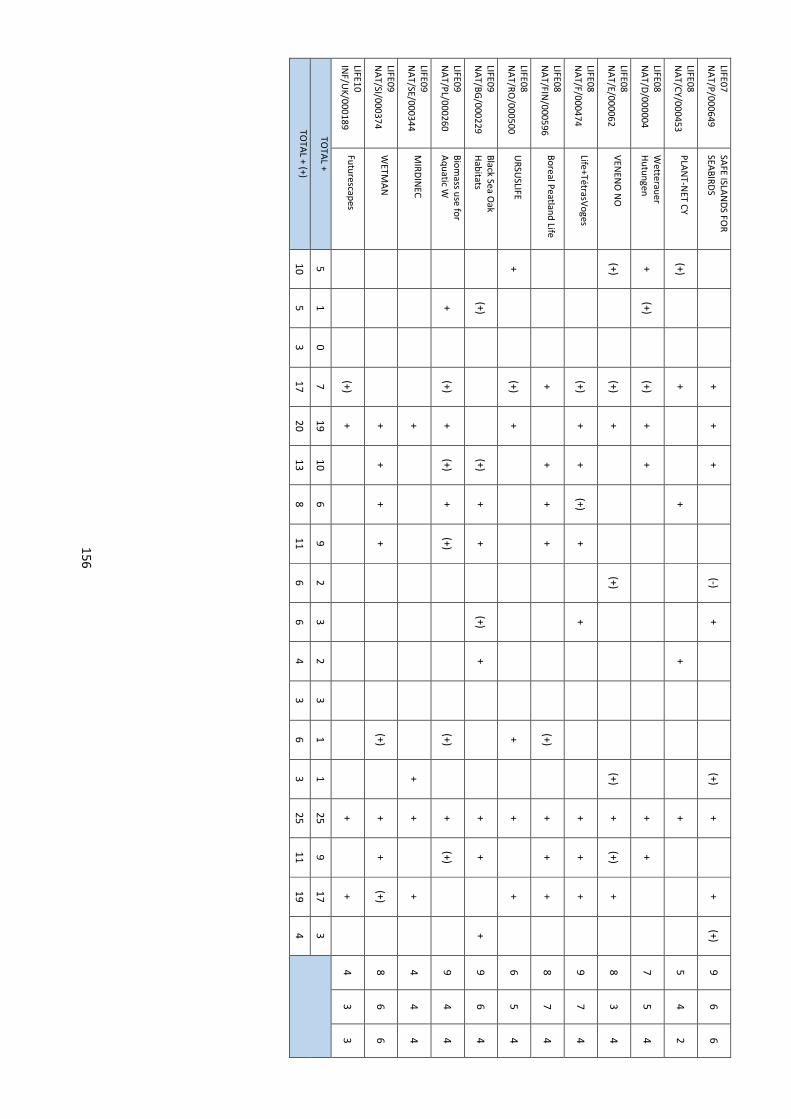
15
6
LIFE
07
NA
T/P
/00
06
49
SA
FE
ISLA
ND
S F
OR
SE
AB
IRD
S
+
+
+
(-)
+
(+
) +
+
(+)
9
6
6
LIFE
08
NA
T/C
Y/0
00
45
3
PLA
NT
-NE
T C
Y
(+)
+
+
+
+
5
4
2
LIFE
08
NA
T/D
/00
00
04
We
ttera
ue
r
Hu
tun
ge
n
+
(+)
(+
) +
+
+
+
7
5
4
LIFE
08
NA
T/E
/00
00
62
V
EN
EN
O N
O
(+)
(+)
+
(+
)
(+
) +
(+
) +
8
3
4
LIFE
08
NA
T/F
/00
04
74
Life
+T
étra
sVo
ge
s
(+)
+
+
(+)
+
+
+
+
+
9
7
4
LIFE
08
NA
T/F
IN/0
00
59
6
Bo
rea
l Pe
atla
nd
Life
+
+
+
+
(+)
+
+
+
8
7
4
LIFE
08
NA
T/R
O/0
00
50
0
UR
SU
SLIF
E
+
(+)
+
+
+
+
6
5
4
LIFE
09
NA
T/B
G/0
00
22
9
Bla
ck S
ea
Oa
k
Ha
bita
ts
(+)
(+
) +
+
(+)
+
+
+
+
9
6
4
LIFE
09
NA
T/P
L/00
02
60
Bio
ma
ss use
for
Aq
ua
tic W
+
(+)
+
(+)
+
(+)
(+)
+
(+
)
9
4
4
LIFE
09
NA
T/S
E/0
00
34
4
MIR
DIN
EC
+
+
+
+
4
4
4
LIFE
09
NA
T/S
I/00
03
74
W
ET
MA
N
+
+
+
+
(+)
+
+
(+
)
8
6
6
LIFE
10
INF
/UK
/00
01
89
F
utu
resca
pe
s
(+)
+
+
+
4
3
3
TO
TA
L +
5
1
0
7
19
1
0
6
9
2
3
2
3
1
1
25
9
1
7
3
T
OT
AL +
(+)
10
5
3
1
7
20
1
3
8
11
6
6
4
3
6
3
2
5
11
1
9
4
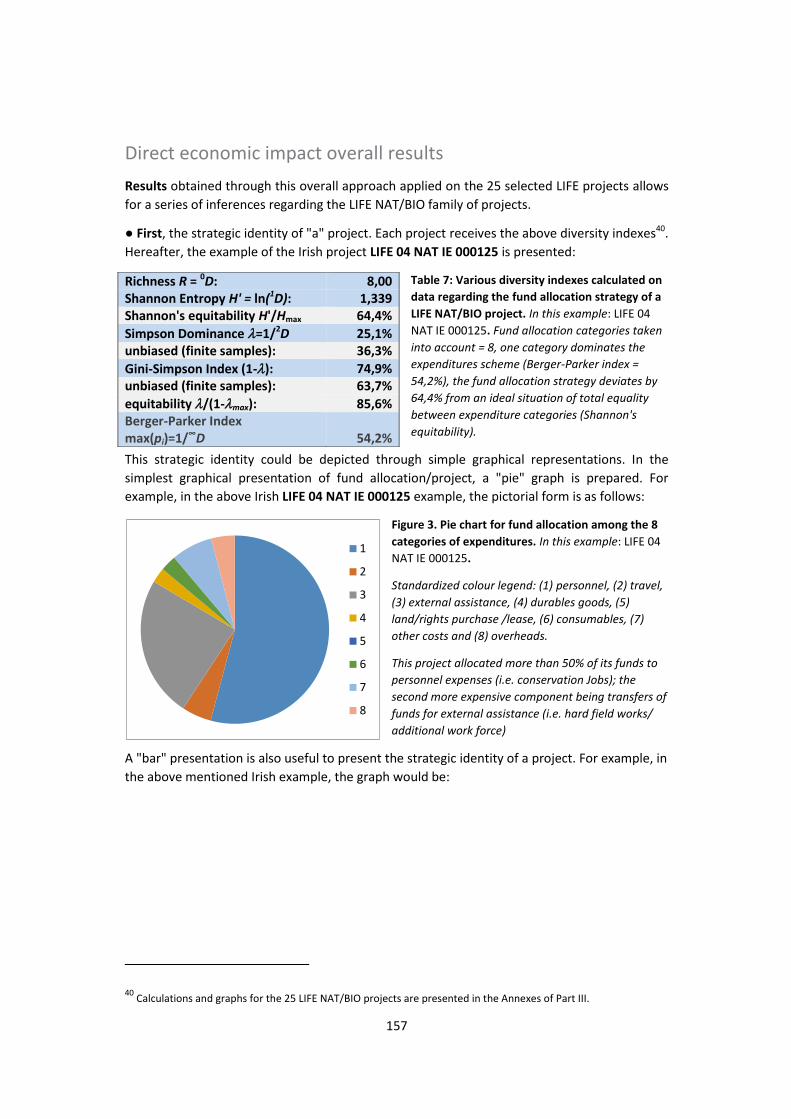
157
Direct economic impact overall results
Results obtained through this overall approach applied on the 25 selected LIFE projects allows
for a series of inferences regarding the LIFE NAT/BIO family of projects.
● First, the strategic identity of "a" project. Each project receives the above diversity indexes40
.
Hereafter, the example of the Irish project LIFE 04 NAT IE 000125 is presented:
Table 7: Various diversity indexes calculated on data regarding the fund allocation strategy of a LIFE NAT/BIO project. In this example: LIFE 04
NAT IE 000125. Fund allocation categories taken into account = 8, one category dominates the expenditures scheme (Berger-Parker index = 54,2%), the fund allocation strategy deviates by 64,4% from an ideal situation of total equality between expenditure categories (Shannon's equitability).
This strategic identity could be depicted through simple graphical representations. In the
simplest graphical presentation of fund allocation/project, a "pie" graph is prepared. For
example, in the above Irish LIFE 04 NAT IE 000125 example, the pictorial form is as follows:
Figure 3. Pie chart for fund allocation among the 8 categories of expenditures. In this example: LIFE 04
NAT IE 000125.
Standardized colour legend: (1) personnel, (2) travel, (3) external assistance, (4) durables goods, (5) land/rights purchase /lease, (6) consumables, (7) other costs and (8) overheads.
This project allocated more than 50% of its funds to personnel expenses (i.e. conservation Jobs); the second more expensive component being transfers of funds for external assistance (i.e. hard field works/ additional work force)
A "bar" presentation is also useful to present the strategic identity of a project. For example, in
the above mentioned Irish example, the graph would be:
40
Calculations and graphs for the 25 LIFE NAT/BIO projects are presented in the Annexes of Part III.
Richness R = 0D: 8,00 Shannon Entropy H' = ln(1D): 1,339 Shannon's equitability H'/Hmax 64,4% Simpson Dominance�O=1/2D 25,1% unbiased (finite samples): 36,3% Gini-Simpson Index (1-O): 74,9% unbiased (finite samples): 63,7% equitability O/(1-Omax): 85,6% Berger-Parker Index max(pi)=1/∞D 54,2%
1
2
3
4
5
6
7
8
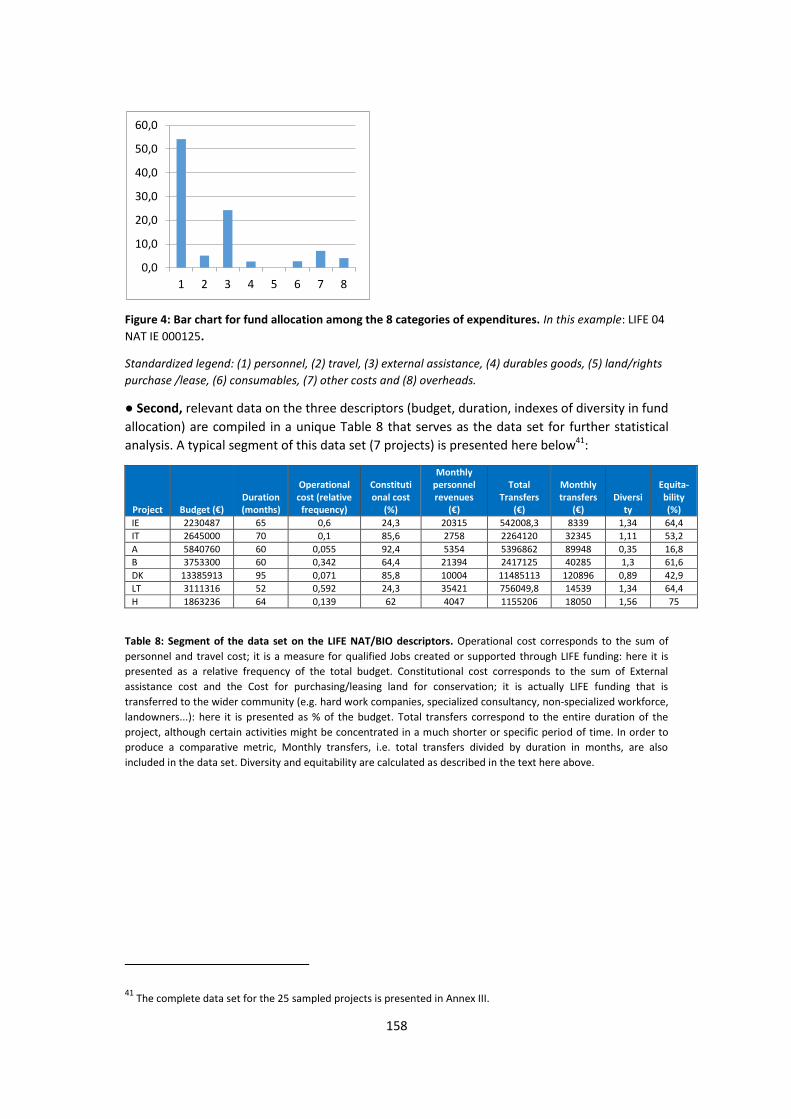
158
Figure 4: Bar chart for fund allocation among the 8 categories of expenditures. In this example: LIFE 04
NAT IE 000125.
Standardized legend: (1) personnel, (2) travel, (3) external assistance, (4) durables goods, (5) land/rights purchase /lease, (6) consumables, (7) other costs and (8) overheads.
● Second, relevant data on the three descriptors (budget, duration, indexes of diversity in fund
allocation) are compiled in a unique Table 8 that serves as the data set for further statistical
analysis. A typical segment of this data set (7 projects) is presented here below41
:
Project Budget (€) Duration (months)
Operational cost (relative
frequency)
Constitutional cost
(%)
Monthly personnel revenues
(€)
Total Transfers
(€)
Monthly transfers
(€) Diversi
ty
Equita-bility (%)
IE 2230487 65 0,6 24,3 20315 542008,3 8339 1,34 64,4
IT 2645000 70 0,1 85,6 2758 2264120 32345 1,11 53,2
A 5840760 60 0,055 92,4 5354 5396862 89948 0,35 16,8
B 3753300 60 0,342 64,4 21394 2417125 40285 1,3 61,6
DK 13385913 95 0,071 85,8 10004 11485113 120896 0,89 42,9
LT 3111316 52 0,592 24,3 35421 756049,8 14539 1,34 64,4
H 1863236 64 0,139 62 4047 1155206 18050 1,56 75
Table 8: Segment of the data set on the LIFE NAT/BIO descriptors. Operational cost corresponds to the sum of
personnel and travel cost; it is a measure for qualified Jobs created or supported through LIFE funding: here it is
presented as a relative frequency of the total budget. Constitutional cost corresponds to the sum of External
assistance cost and the Cost for purchasing/leasing land for conservation; it is actually LIFE funding that is
transferred to the wider community (e.g. hard work companies, specialized consultancy, non-specialized workforce,
landowners...): here it is presented as % of the budget. Total transfers correspond to the entire duration of the
project, although certain activities might be concentrated in a much shorter or specific period of time. In order to
produce a comparative metric, Monthly transfers, i.e. total transfers divided by duration in months, are also
included in the data set. Diversity and equitability are calculated as described in the text here above.
41
The complete data set for the 25 sampled projects is presented in Annex III.
0,0
10,0
20,0
30,0
40,0
50,0
60,0
1 2 3 4 5 6 7 8
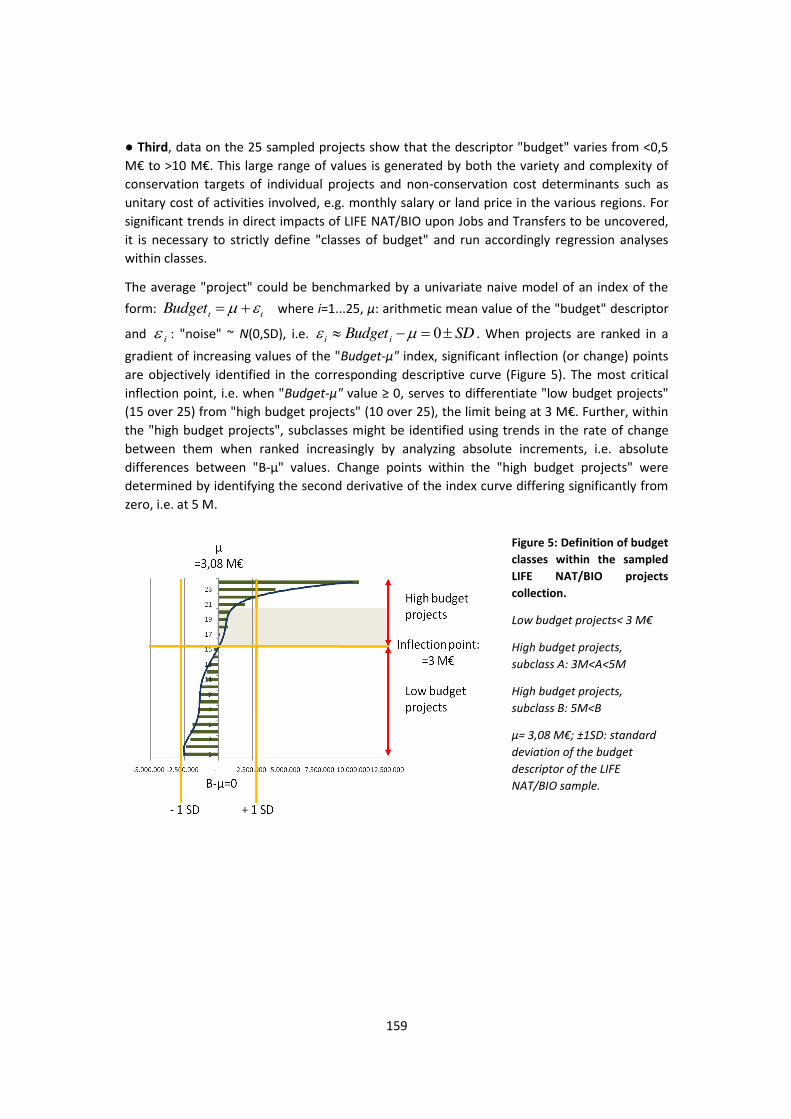
159
● Third, data on the 25 sampled projects show that the descriptor "budget" varies from <0,5
M€ to >10 M€. This large range of values is generated by both the variety and complexity of conservation targets of individual projects and non-conservation cost determinants such as
unitary cost of activities involved, e.g. monthly salary or land price in the various regions. For
significant trends in direct impacts of LIFE NAT/BIO upon Jobs and Transfers to be uncovered,
it is necessary to strictly define "classes of budget" and run accordingly regression analyses
within classes.
The average "project" could be benchmarked by a univariate naive model of an index of the
form: LL HP � Budget where i=1...25, μ: arithmetic mean value of the "budget" descriptor
and iH : "noise" ~ N(0,SD), i.e. SDBudgetii r �| 0PH . When projects are ranked in a
gradient of increasing values of the "Budget-μ" index, significant inflection (or change) points
are objectively identified in the corresponding descriptive curve (Figure 5). The most critical
inflection point, i.e. when "Budget-μ" value ≥ 0, serves to differentiate "low budget projects" (15 over 25) from "high budget projects" (10 over 25), the limit being at 3 M€. Further, within the "high budget projects", subclasses might be identified using trends in the rate of change
between them when ranked increasingly by analyzing absolute increments, i.e. absolute
differences between "Β-μ" values. Change points within the "high budget projects" were
determined by identifying the second derivative of the index curve differing significantly from
zero, i.e. at 5 M.
Figure 5: Definition of budget classes within the sampled LIFE NAT/BIO projects collection.
Low budget projects˂ 3 M€
High budget projects, subclass A: 3M<A<5M
High budget projects, subclass B: 5M<B
μ= 3,08 M€; ±1SD: standard deviation of the budget descriptor of the LIFE NAT/BIO sample.
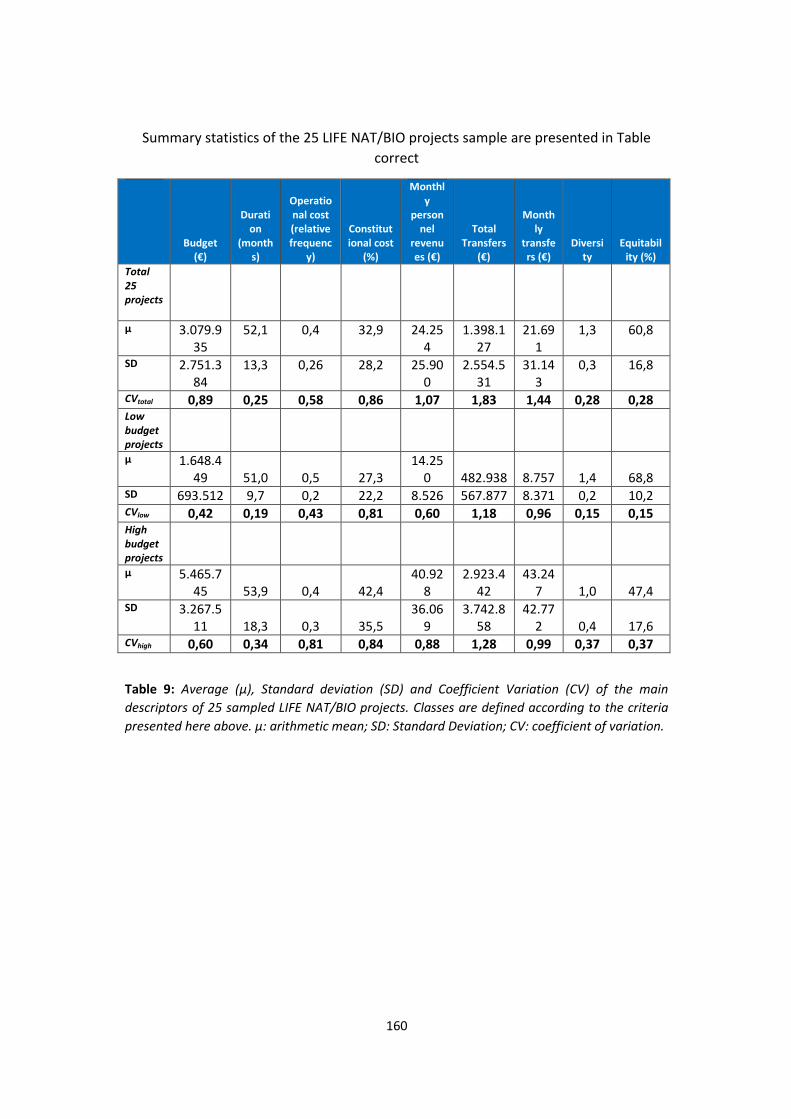
160
Summary statistics of the 25 LIFE NAT/BIO projects sample are presented in Table
correct
Budget (€)
Duration
(months)
Operational cost (relative frequenc
y)
Constitutional cost
(%)
Monthly
personnel
revenues (€)
Total Transfers
(€)
Monthly
transfers (€)
Diversity
Equitability (%)
Total 25 projects
μ 3.079.9
35
52,1 0,4 32,9 24.25
4
1.398.1
27
21.69
1
1,3 60,8
SD 2.751.3
84
13,3 0,26 28,2 25.90
0
2.554.5
31
31.14
3
0,3 16,8
CVtotal 0,89 0,25 0,58 0,86 1,07 1,83 1,44 0,28 0,28 Low budget projects
μ 1.648.4
49 51,0 0,5 27,3
14.25
0 482.938 8.757 1,4 68,8 SD 693.512 9,7 0,2 22,2 8.526 567.877 8.371 0,2 10,2 CVlow 0,42 0,19 0,43 0,81 0,60 1,18 0,96 0,15 0,15 High budget projects
μ 5.465.7
45 53,9 0,4 42,4
40.92
8
2.923.4
42
43.24
7 1,0 47,4 SD 3.267.5
11 18,3 0,3 35,5
36.06
9
3.742.8
58
42.77
2 0,4 17,6 CVhigh 0,60 0,34 0,81 0,84 0,88 1,28 0,99 0,37 0,37
Table 9: Average (μ), Standard deviation (SD) and Coefficient Variation (CV) of the main descriptors of 25 sampled LIFE NAT/BIO projects. Classes are defined according to the criteria presented here above. μ: arithmetic mean; SD: Standard Deviation; CV: coefficient of variation.
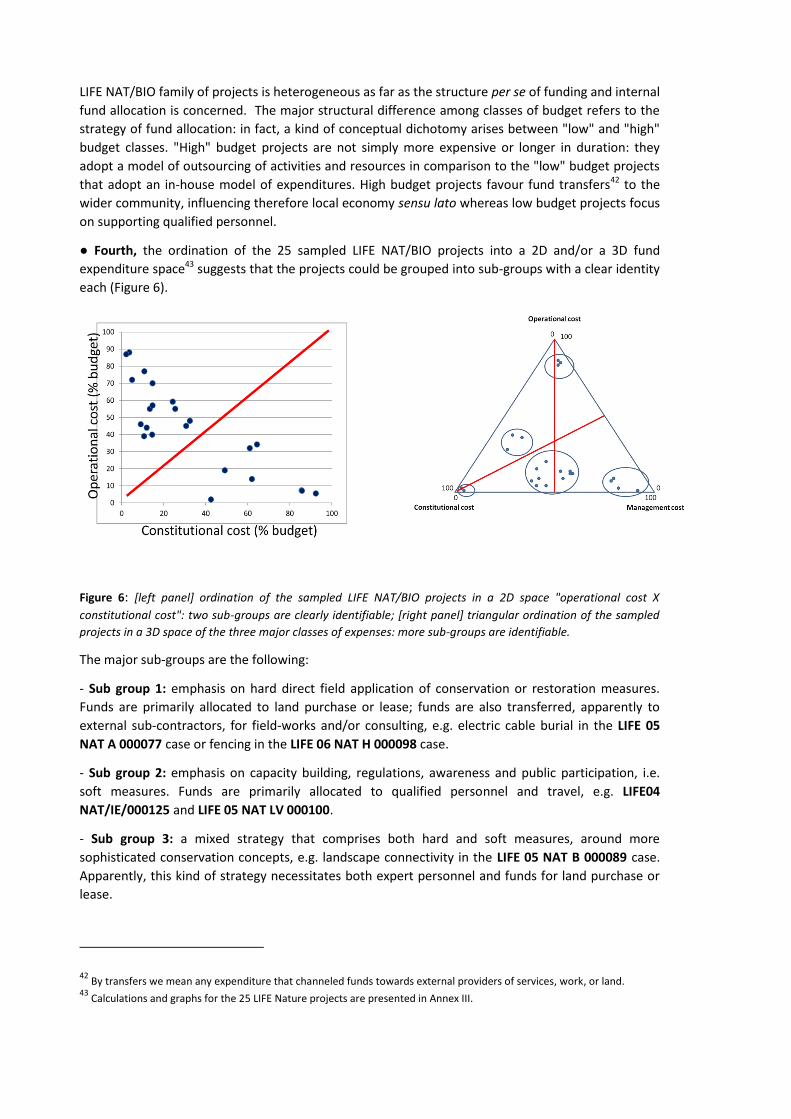
LIFE NAT/BIO family of projects is heterogeneous as far as the structure per se of funding and internal
fund allocation is concerned. The major structural difference among classes of budget refers to the
strategy of fund allocation: in fact, a kind of conceptual dichotomy arises between "low" and "high"
budget classes. "High" budget projects are not simply more expensive or longer in duration: they
adopt a model of outsourcing of activities and resources in comparison to the "low" budget projects
that adopt an in-house model of expenditures. High budget projects favour fund transfers42
to the
wider community, influencing therefore local economy sensu lato whereas low budget projects focus
on supporting qualified personnel.
● Fourth, the ordination of the 25 sampled LIFE NAT/BIO projects into a 2D and/or a 3D fund
expenditure space43
suggests that the projects could be grouped into sub-groups with a clear identity
each (Figure 6).
Figure 6: [left panel] ordination of the sampled LIFE NAT/BIO projects in a 2D space "operational cost X constitutional cost": two sub-groups are clearly identifiable; [right panel] triangular ordination of the sampled projects in a 3D space of the three major classes of expenses: more sub-groups are identifiable.
The major sub-groups are the following:
- Sub group 1: emphasis on hard direct field application of conservation or restoration measures.
Funds are primarily allocated to land purchase or lease; funds are also transferred, apparently to
external sub-contractors, for field-works and/or consulting, e.g. electric cable burial in the LIFE 05 NAT A 000077 case or fencing in the LIFE 06 NAT H 000098 case.
- Sub group 2: emphasis on capacity building, regulations, awareness and public participation, i.e.
soft measures. Funds are primarily allocated to qualified personnel and travel, e.g. LIFE04 NAT/IE/000125 and LIFE 05 NAT LV 000100.
- Sub group 3: a mixed strategy that comprises both hard and soft measures, around more
sophisticated conservation concepts, e.g. landscape connectivity in the LIFE 05 NAT B 000089 case.
Apparently, this kind of strategy necessitates both expert personnel and funds for land purchase or
lease.
42
By transfers we mean any expenditure that channeled funds towards external providers of services, work, or land. 43
Calculations and graphs for the 25 LIFE Nature projects are presented in Annex III.
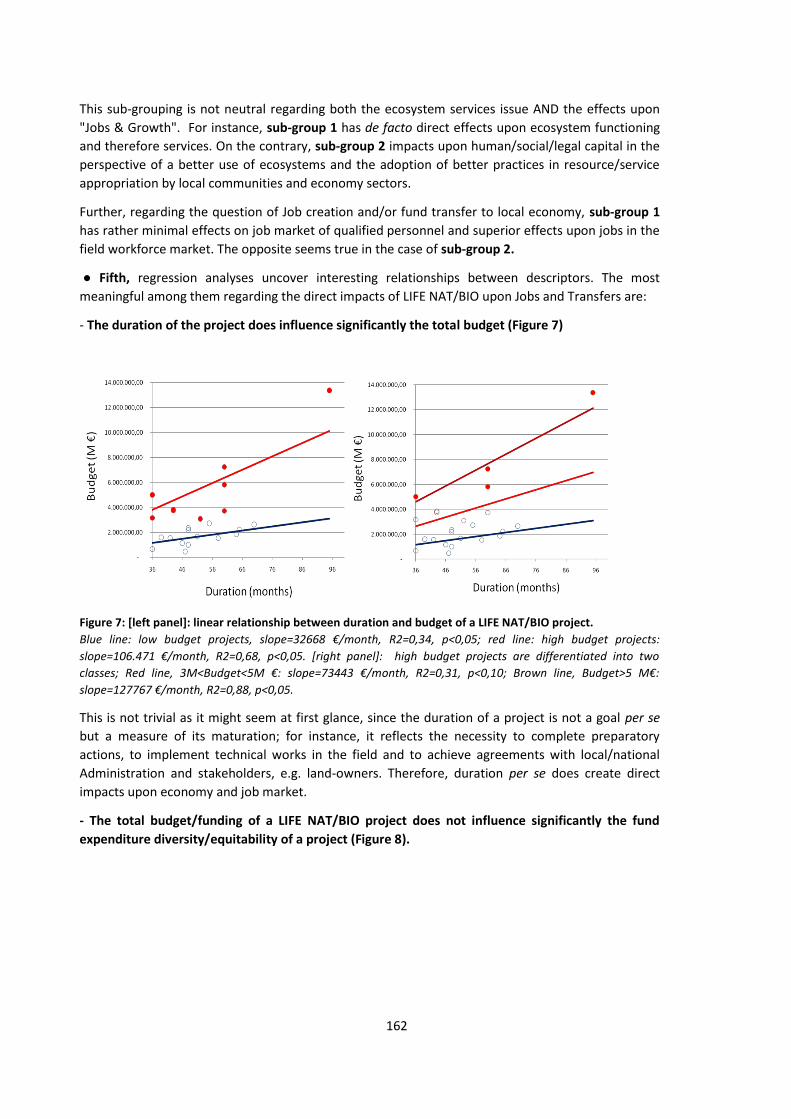
162
This sub-grouping is not neutral regarding both the ecosystem services issue AND the effects upon
"Jobs & Growth". For instance, sub-group 1 has de facto direct effects upon ecosystem functioning
and therefore services. On the contrary, sub-group 2 impacts upon human/social/legal capital in the
perspective of a better use of ecosystems and the adoption of better practices in resource/service
appropriation by local communities and economy sectors.
Further, regarding the question of Job creation and/or fund transfer to local economy, sub-group 1
has rather minimal effects on job market of qualified personnel and superior effects upon jobs in the
field workforce market. The opposite seems true in the case of sub-group 2.
● Fifth, regression analyses uncover interesting relationships between descriptors. The most
meaningful among them regarding the direct impacts of LIFE NAT/BIO upon Jobs and Transfers are:
- The duration of the project does influence significantly the total budget (Figure 7)
Figure 7: [left panel]: linear relationship between duration and budget of a LIFE NAT/BIO project. Blue line: low budget projects, slope=32668 €/month, R2=0,34, p<0,05; red line: high budget projects: slope=106.471 €/month, R2=0,68, p<0,05. [right panel]: high budget projects are differentiated into two classes; Red line, 3M<Budget<5M €: slope=73443 €/month, R2=0,31, p<0,10; Brown line, Budget>5 M€: slope=127767 €/month, R2=0,88, p<0,05.
This is not trivial as it might seem at first glance, since the duration of a project is not a goal per se
but a measure of its maturation; for instance, it reflects the necessity to complete preparatory
actions, to implement technical works in the field and to achieve agreements with local/national
Administration and stakeholders, e.g. land-owners. Therefore, duration per se does create direct
impacts upon economy and job market.
- The total budget/funding of a LIFE NAT/BIO project does not influence significantly the fund expenditure diversity/equitability of a project (Figure 8).
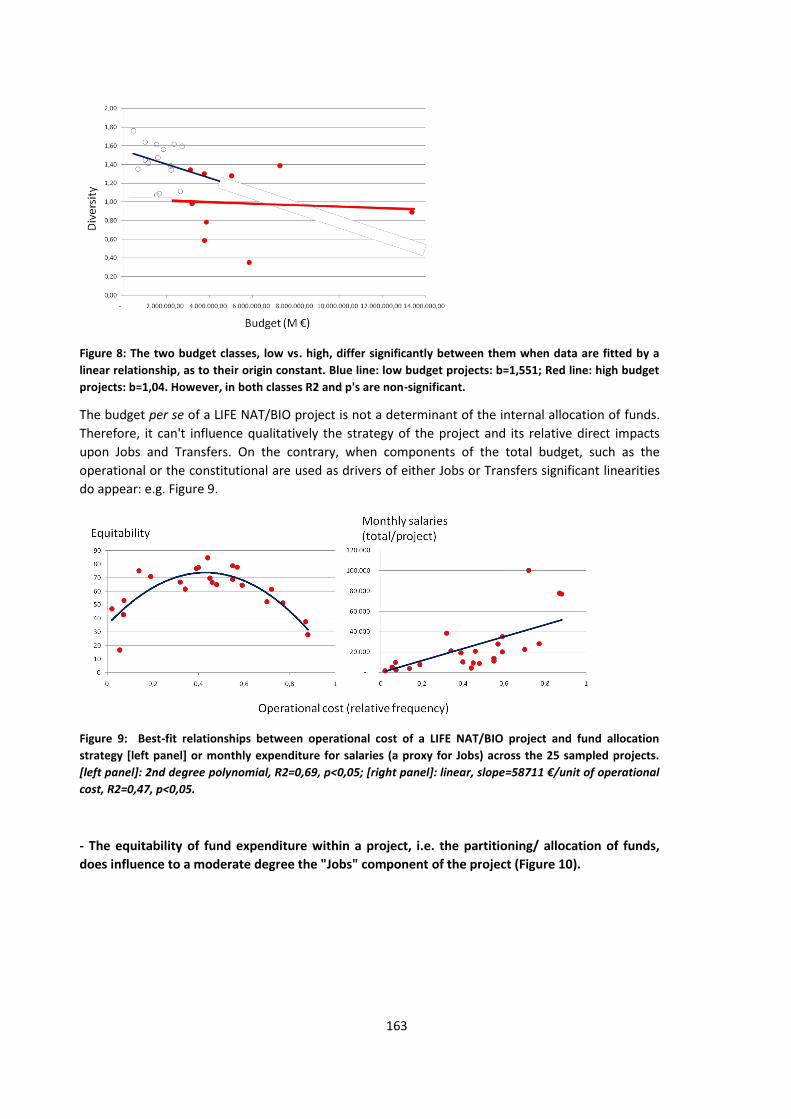
163
Figure 8: The two budget classes, low vs. high, differ significantly between them when data are fitted by a linear relationship, as to their origin constant. Blue line: low budget projects: b=1,551; Red line: high budget projects: b=1,04. However, in both classes R2 and p's are non-significant.
The budget per se of a LIFE NAT/BIO project is not a determinant of the internal allocation of funds.
Therefore, it can't influence qualitatively the strategy of the project and its relative direct impacts
upon Jobs and Transfers. On the contrary, when components of the total budget, such as the
operational or the constitutional are used as drivers of either Jobs or Transfers significant linearities
do appear: e.g. Figure 9.
Figure 9: Best-fit relationships between operational cost of a LIFE NAT/BIO project and fund allocation strategy [left panel] or monthly expenditure for salaries (a proxy for Jobs) across the 25 sampled projects. [left panel]: 2nd degree polynomial, R2=0,69, p<0,05; [right panel]: linear, slope=58711 €/unit of operational cost, R2=0,47, p<0,05.
- The equitability of fund expenditure within a project, i.e. the partitioning/ allocation of funds, does influence to a moderate degree the "Jobs" component of the project (Figure 10).
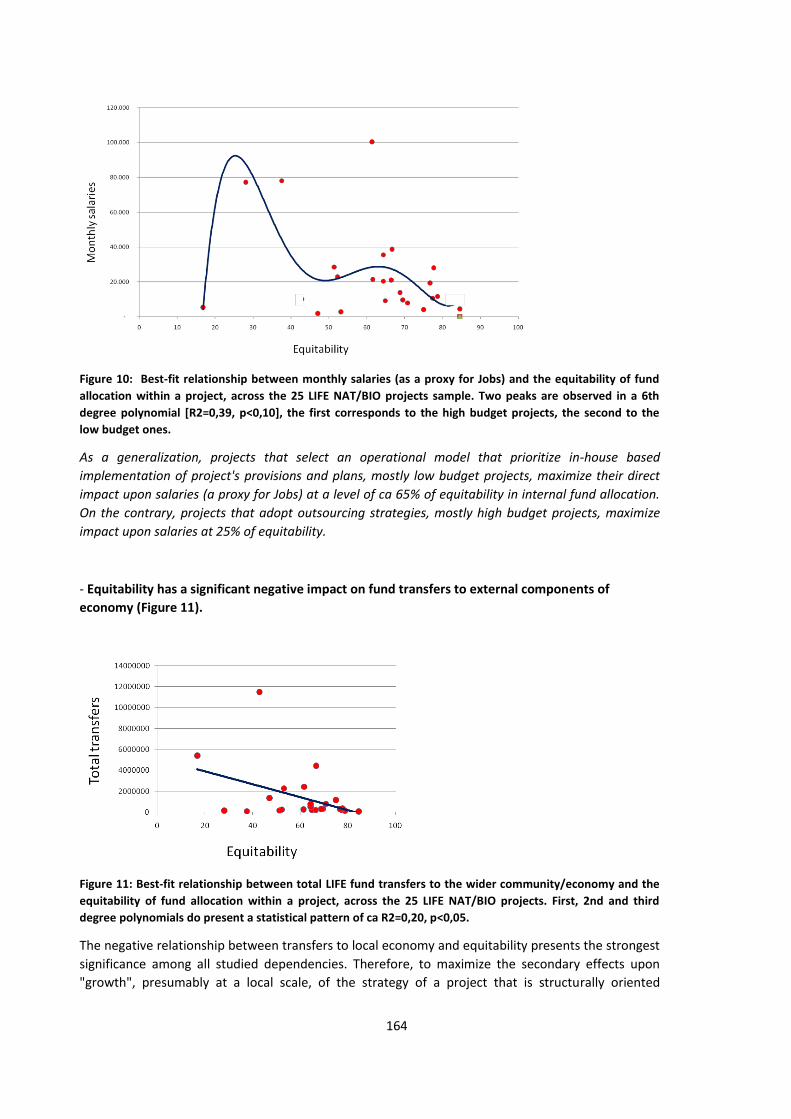
164
Figure 10: Best-fit relationship between monthly salaries (as a proxy for Jobs) and the equitability of fund allocation within a project, across the 25 LIFE NAT/BIO projects sample. Two peaks are observed in a 6th degree polynomial [R2=0,39, p<0,10], the first corresponds to the high budget projects, the second to the low budget ones.
As a generalization, projects that select an operational model that prioritize in-house based implementation of project's provisions and plans, mostly low budget projects, maximize their direct impact upon salaries (a proxy for Jobs) at a level of ca 65% of equitability in internal fund allocation. On the contrary, projects that adopt outsourcing strategies, mostly high budget projects, maximize impact upon salaries at 25% of equitability.
- Equitability has a significant negative impact on fund transfers to external components of economy (Figure 11).
Figure 11: Best-fit relationship between total LIFE fund transfers to the wider community/economy and the equitability of fund allocation within a project, across the 25 LIFE NAT/BIO projects. First, 2nd and third degree polynomials do present a statistical pattern of ca R2=0,20, p<0,05.
The negative relationship between transfers to local economy and equitability presents the strongest
significance among all studied dependencies. Therefore, to maximize the secondary effects upon
"growth", presumably at a local scale, of the strategy of a project that is structurally oriented

165
towards a high level supervision/ commanding of outsourced activities, either as external
scientific/field work expertise or directing funds towards the acquisition/long-term leasing of land for
conservation, the higher the investment on land purchase/leasing and/or the request for external
assistance, the more significant the impact would be.
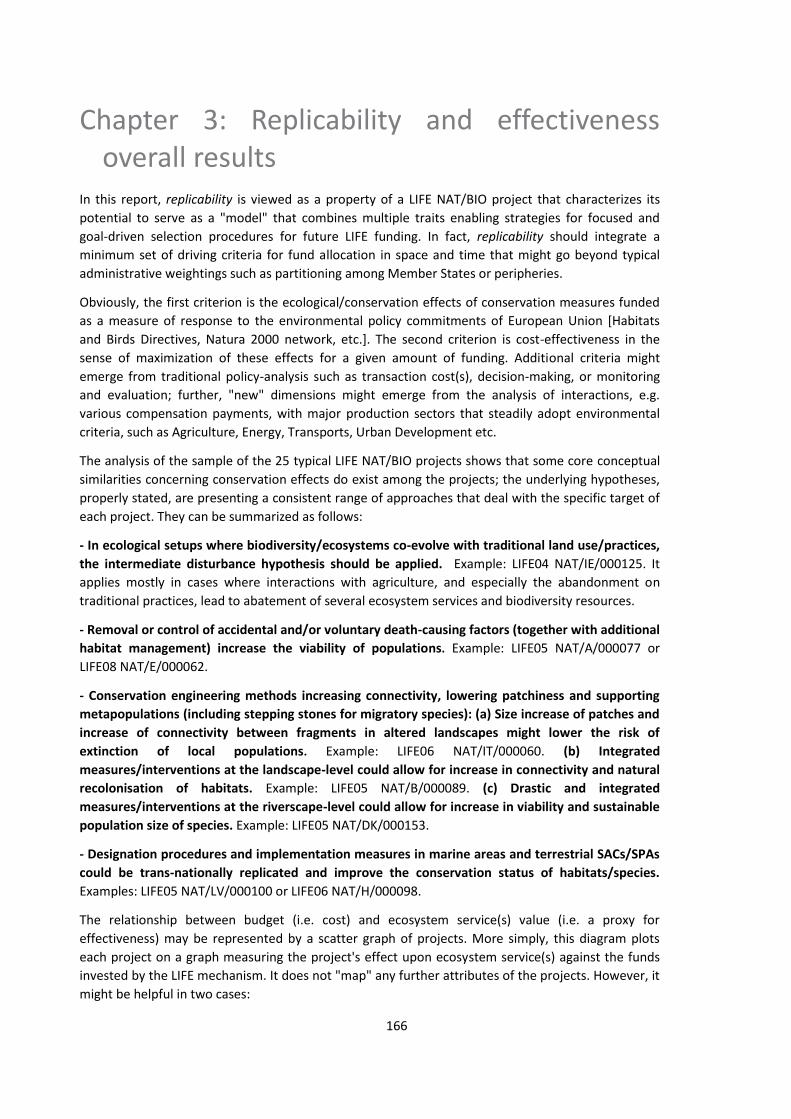
166
Chapter 3: Replicability and effectiveness
overall results
In this report, replicability is viewed as a property of a LIFE NAT/BIO project that characterizes its
potential to serve as a "model" that combines multiple traits enabling strategies for focused and
goal-driven selection procedures for future LIFE funding. In fact, replicability should integrate a
minimum set of driving criteria for fund allocation in space and time that might go beyond typical
administrative weightings such as partitioning among Member States or peripheries.
Obviously, the first criterion is the ecological/conservation effects of conservation measures funded
as a measure of response to the environmental policy commitments of European Union [Habitats
and Birds Directives, Natura 2000 network, etc.]. The second criterion is cost-effectiveness in the
sense of maximization of these effects for a given amount of funding. Additional criteria might
emerge from traditional policy-analysis such as transaction cost(s), decision-making, or monitoring
and evaluation; further, "new" dimensions might emerge from the analysis of interactions, e.g.
various compensation payments, with major production sectors that steadily adopt environmental
criteria, such as Agriculture, Energy, Transports, Urban Development etc.
The analysis of the sample of the 25 typical LIFE NAT/BIO projects shows that some core conceptual
similarities concerning conservation effects do exist among the projects; the underlying hypotheses,
properly stated, are presenting a consistent range of approaches that deal with the specific target of
each project. They can be summarized as follows:
- In ecological setups where biodiversity/ecosystems co-evolve with traditional land use/practices, the intermediate disturbance hypothesis should be applied. Example: LIFE04 NAT/IE/000125. It
applies mostly in cases where interactions with agriculture, and especially the abandonment on
traditional practices, lead to abatement of several ecosystem services and biodiversity resources.
- Removal or control of accidental and/or voluntary death-causing factors (together with additional habitat management) increase the viability of populations. Example: LIFE05 NAT/A/000077 or
LIFE08 NAT/E/000062.
- Conservation engineering methods increasing connectivity, lowering patchiness and supporting metapopulations (including stepping stones for migratory species): (a) Size increase of patches and increase of connectivity between fragments in altered landscapes might lower the risk of extinction of local populations. Example: LIFE06 NAT/IT/000060. (b) Integrated measures/interventions at the landscape-level could allow for increase in connectivity and natural recolonisation of habitats. Example: LIFE05 NAT/B/000089. (c) Drastic and integrated measures/interventions at the riverscape-level could allow for increase in viability and sustainable population size of species. Example: LIFE05 NAT/DK/000153.
- Designation procedures and implementation measures in marine areas and terrestrial SACs/SPAs could be trans-nationally replicated and improve the conservation status of habitats/species. Examples: LIFE05 NAT/LV/000100 or LIFE06 NAT/H/000098.
The relationship between budget (i.e. cost) and ecosystem service(s) value (i.e. a proxy for
effectiveness) may be represented by a scatter graph of projects. More simply, this diagram plots
each project on a graph measuring the project's effect upon ecosystem service(s) against the funds
invested by the LIFE mechanism. It does not "map" any further attributes of the projects. However, it
might be helpful in two cases:
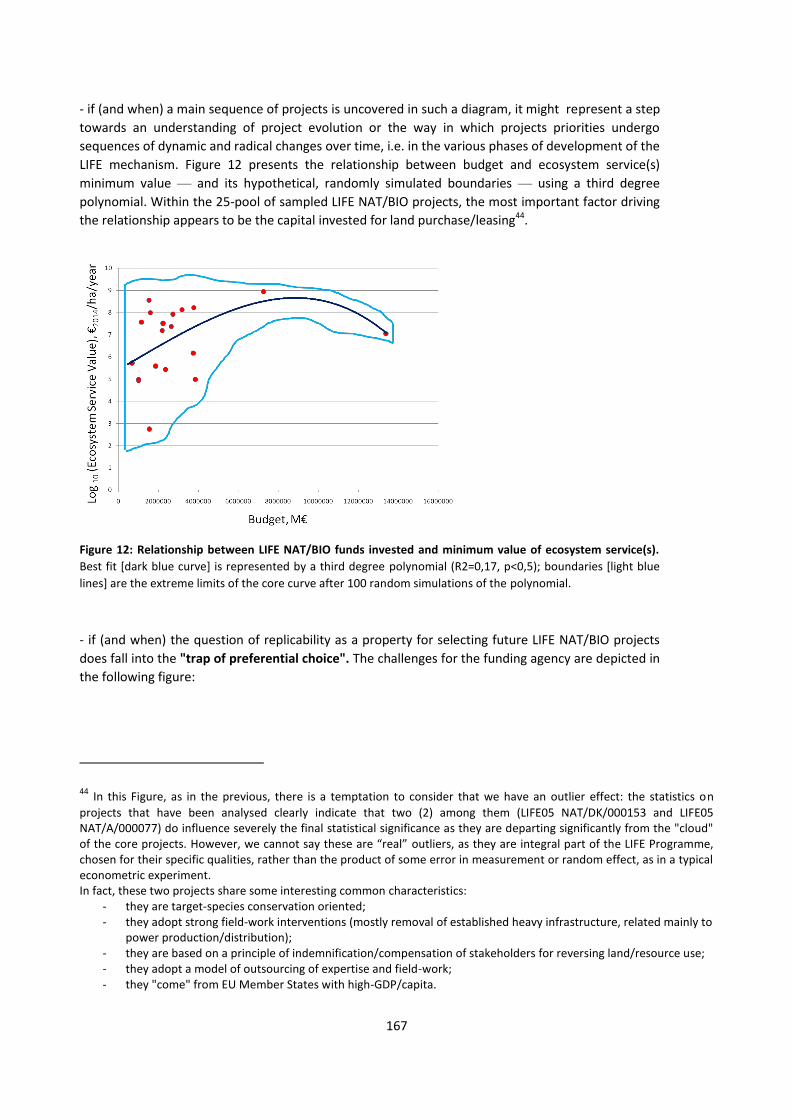
167
- if (and when) a main sequence of projects is uncovered in such a diagram, it might represent a step
towards an understanding of project evolution or the way in which projects priorities undergo
sequences of dynamic and radical changes over time, i.e. in the various phases of development of the
LIFE mechanism. Figure 12 presents the relationship between budget and ecosystem service(s)
minimum value — and its hypothetical, randomly simulated boundaries — using a third degree
polynomial. Within the 25-pool of sampled LIFE NAT/BIO projects, the most important factor driving
the relationship appears to be the capital invested for land purchase/leasing44
.
Figure 12: Relationship between LIFE NAT/BIO funds invested and minimum value of ecosystem service(s). Best fit [dark blue curve] is represented by a third degree polynomial (R2=0,17, p<0,5); boundaries [light blue
lines] are the extreme limits of the core curve after 100 random simulations of the polynomial.
- if (and when) the question of replicability as a property for selecting future LIFE NAT/BIO projects
does fall into the "trap of preferential choice". The challenges for the funding agency are depicted in
the following figure:
44
In this Figure, as in the previous, there is a temptation to consider that we have an outlier effect: the statistics on
projects that have been analysed clearly indicate that two (2) among them (LIFE05 NAT/DK/000153 and LIFE05
NAT/A/000077) do influence severely the final statistical significance as they are departing significantly from the "cloud"
of the core projects. However, we cannot say these are “real” outliers, as they are integral part of the LIFE Programme,
chosen for their specific qualities, rather than the product of some error in measurement or random effect, as in a typical
econometric experiment.
In fact, these two projects share some interesting common characteristics:
- they are target-species conservation oriented;
- they adopt strong field-work interventions (mostly removal of established heavy infrastructure, related mainly to
power production/distribution);
- they are based on a principle of indemnification/compensation of stakeholders for reversing land/resource use;
- they adopt a model of outsourcing of expertise and field-work;
- they "come" from EU Member States with high-GDP/capita.
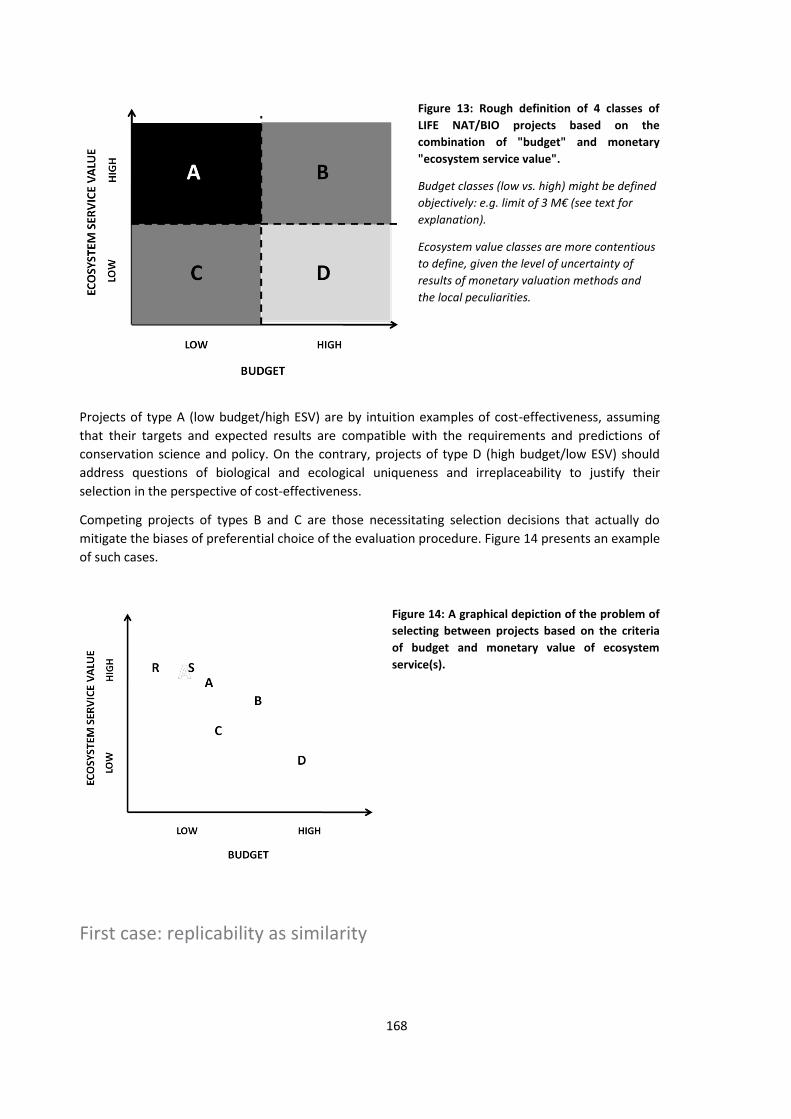
168
Figure 13: Rough definition of 4 classes of LIFE NAT/BIO projects based on the combination of "budget" and monetary "ecosystem service value".
Budget classes (low vs. high) might be defined objectively: e.g. limit of 3 M€ (see text for explanation).
Ecosystem value classes are more contentious to define, given the level of uncertainty of results of monetary valuation methods and the local peculiarities.
Projects of type A (low budget/high ESV) are by intuition examples of cost-effectiveness, assuming
that their targets and expected results are compatible with the requirements and predictions of
conservation science and policy. On the contrary, projects of type D (high budget/low ESV) should
address questions of biological and ecological uniqueness and irreplaceability to justify their
selection in the perspective of cost-effectiveness.
Competing projects of types B and C are those necessitating selection decisions that actually do
mitigate the biases of preferential choice of the evaluation procedure. Figure 14 presents an example
of such cases.
Figure 14: A graphical depiction of the problem of selecting between projects based on the criteria of budget and monetary value of ecosystem service(s).
First case: replicability as similarity
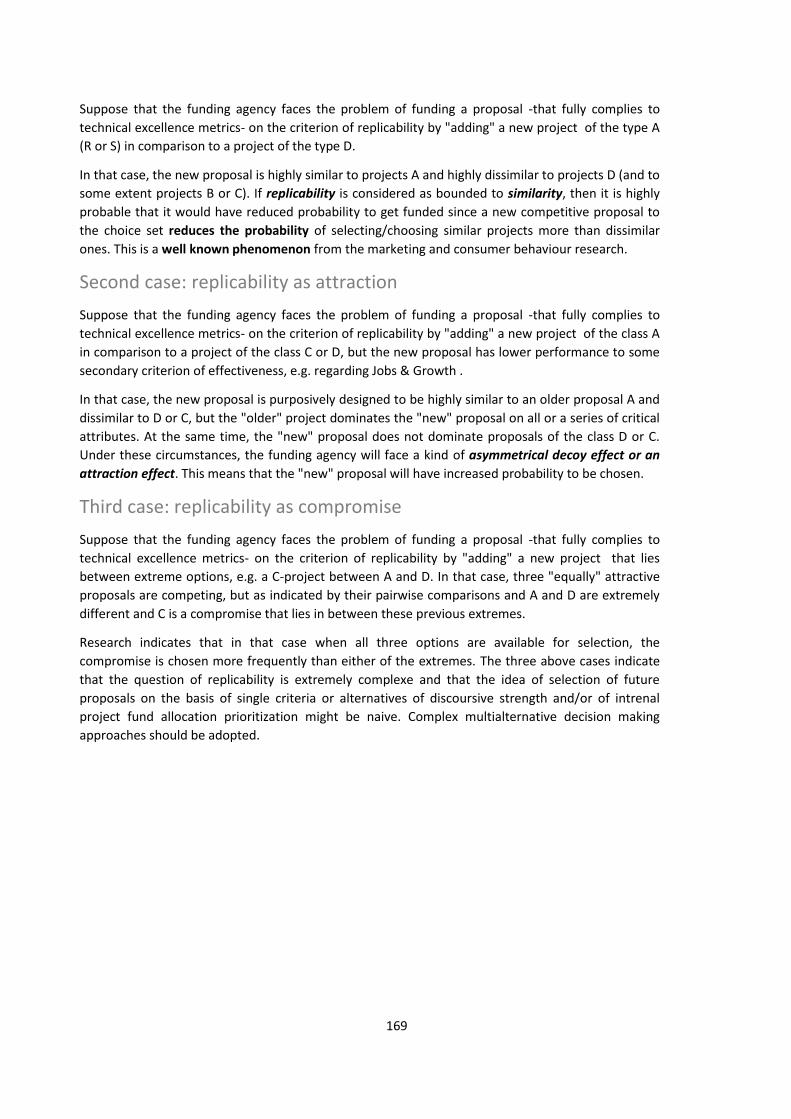
169
Suppose that the funding agency faces the problem of funding a proposal -that fully complies to
technical excellence metrics- on the criterion of replicability by "adding" a new project of the type A
(R or S) in comparison to a project of the type D.
In that case, the new proposal is highly similar to projects A and highly dissimilar to projects D (and to
some extent projects B or C). If replicability is considered as bounded to similarity, then it is highly
probable that it would have reduced probability to get funded since a new competitive proposal to
the choice set reduces the probability of selecting/choosing similar projects more than dissimilar
ones. This is a well known phenomenon from the marketing and consumer behaviour research.
Second case: replicability as attraction
Suppose that the funding agency faces the problem of funding a proposal -that fully complies to
technical excellence metrics- on the criterion of replicability by "adding" a new project of the class A
in comparison to a project of the class C or D, but the new proposal has lower performance to some
secondary criterion of effectiveness, e.g. regarding Jobs & Growth .
In that case, the new proposal is purposively designed to be highly similar to an older proposal A and
dissimilar to D or C, but the "older" project dominates the "new" proposal on all or a series of critical
attributes. At the same time, the "new" proposal does not dominate proposals of the class D or C.
Under these circumstances, the funding agency will face a kind of asymmetrical decoy effect or an attraction effect. This means that the "new" proposal will have increased probability to be chosen.
Third case: replicability as compromise
Suppose that the funding agency faces the problem of funding a proposal -that fully complies to
technical excellence metrics- on the criterion of replicability by "adding" a new project that lies
between extreme options, e.g. a C-project between A and D. In that case, three "equally" attractive
proposals are competing, but as indicated by their pairwise comparisons and A and D are extremely
different and C is a compromise that lies in between these previous extremes.
Research indicates that in that case when all three options are available for selection, the
compromise is chosen more frequently than either of the extremes. The three above cases indicate
that the question of replicability is extremely complexe and that the idea of selection of future
proposals on the basis of single criteria or alternatives of discoursive strength and/or of intrenal
project fund allocation prioritization might be naive. Complex multialternative decision making
approaches should be adopted.
170
Chapter 4: Conclusions and Projections
The application of the described method for the monetary assessment has allowed to obtain
economic values for some conservation measures implemented in a set of 25 LIFE Nature projects.
The method applied combines inputs of changes in ecosystem services and environmental economics
to value the impact of conservation measures on the ecosystem services. Inputs on ecosystem
service changes were based on information mostly contained in the LIFE projects ex-post evaluation
reports, and then linked to economic valuation evidence. Although this does not always provide an
accurate picture due to uncertainties in monetary valuation (see below), the methodology is
considered to be able to provide at least rough estimates of the benefits that the conservation
measures provide, and constitutes a suitable method for identifying economic values associated with
conservation interventions.
For the entire sample of 20 (out of the 25) projects that it was possible to obtain monetary values of direct ecosystem services benefits, we obtained an aggregate present value in the range of 1,8 to 3,7 € billion. Extrapolating to the 479 projects of the 2004 – 2010, by taking the lowest figure of the range, we estimate the value created by LIFE during a programming period in Nature projects at € 43 billion45.
However, it must be emphasised that the method implies a number of limitations and uncertainties
in the values obtained that can (and do) hinder accurate calculations. These are mainly related to:
1- The method itself.
- The method was based on a selection of conservation measures of the projects under
study and on a selection of types of ecosystem services (those more likely to be affected
by the conservation measures) instead of considering the whole project and the whole
range of ecosystem services. This necessarily implies disregarding important impacts, as
highlighted in the Results section.
- Calculations were based on a targeted site and a surface area affected by the projects.
However, there was not always a targeted site and an affected area, as many LIFE Nature
projects are species-oriented actions and so do not necessarily include land-based
actions (such as habitat restoration) and/or focus on any specific Natura 2000 site (in
many cases they do focus on a high number of sites), as was the case of the 50% of the
selected LIFE projects of this study. Therefore, some of the projects under analysis did
45
We also attempted a series of sensitivity analyses of the Present Value of Benefits (PVB) in order to illustrate
the sensitivity of our results to variations in the discount rate and selected time horizon. The results are given
in the Annexes, and are based on discount rates of 5 per cent and 2 per cent, and an expected life of the
conservation measure of 20 and 30 years. As expected, the results are highly sensitive to the choice of the
discount rate and the assumed length of life. Generally speaking, reducing the discount rate to 2 per cent leads
to an increase of the PVB by approximately 30 per cent, while increasing the expected life from 20 to 30 years
pushes the PVB up by around 40 to 50 per cent. Thus, the combined effect of a 30-year/2-percent vs. a 20-
year/3-percent estimation is a notable increase of the ecosystem services value by roughly 80 per cent.
However, in making the programme-wide projections, we preferred to keep the most conservative approach
of the initial 20-year/5-percent hypothesis.
171
have a relevant impact on ecosystem services, but it could not be measured for not
existing an “affected area”.
2- The economic valuations used as reference (Environmental Service Value Database).
- The Environmental Service Value Database contained a wide range of sources,
necessarily meaning a wide range of methods used and heterogeneous results.
- Not all the ecosystem services had corresponding economic evidence in the
Environmental Service Value Database used as reference for our assessment. Therefore,
there were not always economic values of reference.
3- The available information on the LIFE projects under evaluation.
- The available information on the projects’ impact on the ecosystem services was scarce and inaccurate (for many types of ecosystem services even inexistent), as in the
programming periods when the LIFE Nature projects under evaluation were approved
such data were not compulsorily and systematically required. This is the case of erosion
control, landscape and amenity values and cultural values, among others.
The evaluation will be more accurate, and thus will have more reliable results, as knowledge of
ecosystem services and studies on their economic value increases. On the other hand, a precise
definition and description of the projects’ conservation measures and the results obtained from them is crucial for valuing their impact on ecosystem services. Both the LIFE Nature proposals and
the monitoring and evaluation reports should make reference to clear and well-defined indicators.
This will be possible in the future with the application of the new LIFE Regulation and the set of
indicators established in the multiannual work-programme for 2014-2017. In this regard, the
abovementioned LIFE indicator database will be of crucial importance for these kinds of analysis.
Application of the economic valuation method requires input from environmental economists, who
are aware of relevant valuation evidence and methods (together with an in-depth analysis
undertaken by experts in nature conservation, who know well the effect that the conservation
measures have on the ecosystem services). In this sense, it is important to promote the use of
databases that contain information on monetary values of changes in ecosystem services, such as the
Environmental Service Value Database used in this study.
172
References
BIO Intelligence Service (2011). Estimating the economic value of the benefits provide by the
tourism/recreation and Employment supported by Natura 2000, Final Report prepared for European
Commission – DG Environment.
Duce, I. (2012). Evaluation of the Progress Report of Life Project Restoring Hydrology in Amalvas and
Žuvintas Wetlands - LIFE07 NAT/LT/000530
European Commission (2011). Recognizing Natura 2000 benefits and demonstrating the economic
benefits of conservation measures.
European Commission (2013). Mapping and Assessing Ecosystems and their Services. An analytical
framework for ecosystem assessments under Action 5 of the EU Biodiversity Strategy to 2020.
Gratani, Loretta and Varone, Laura (2006). Carbon sequestration by Quercus ilex L. and Quercus
pubescens Willd. And their contribution to decreasing air temperature in Rome. Urban Ecosyst
(2006) 9:27-37. DOI10.1007/s11252-006-5527-2
Ivaylo Zafirov and Anastasia Koutsolioutsou. Evaluation of the Progress Report of Life Project
Conservation and Restoration of Black Sea Oak Habitats - LIFE09 NAT/BG/000229
Kettunen, M., et. al., Bassi, S., Gantioler, S. & ten Brink, P., 2009. Assessing Socio-economic Benefits
of Natura 2000 – a Toolkit for Practitioners (September 2009 Edition). Output of the European
Commission Project Financing Natura 2000: Cost estimate and benefits of Natura 2000 (Contract No.:
070307/2007/484403/MAR/B2). Institute for European Environmental Policy (IEEP), Brussels,
Belgium. 191 pp. + Annexes.
Layman’s report (2011) of Life Project Preservation of alluvial forest habitats in the Morávka river Basin - LIFE06 NAT/CZ/000121
Layman’s report of Life Project Conservation and Restoration of Black Sea Oak Habitats - LIFE09
NAT/BG/000229
Layman’s report of Life Project Establishment of a Plant Micro-Reserve Network in Cyprus for the
Conservation of Priority Species and Habitats - LIFE08 NAT/CY/000453 (2013)
Layman’s Report (2008) of Life Project Restoring migration possibilities for 8 Annex II species in the Roer - LIFE06 NAT/NL/000078
Layman’s Report (2011) of Life Project Restoration and Management of Sand Dunes Habitats in Zahorie Military Training Area - LIFE06 NAT/SK/000115
Layman’s Report (2011) of Life Project Saving life in meanders and oxbow lakes of Emajõgi River on
Alam-Pedja NATURA2000 area - LIFE07 NAT/EE/000120
Layman’s Report (2012) of Life Project Concrete Conservation Actions for the Mediterranean Shag
and Audouin's gull in Greece including the inventory of relevant marine IBAs - LIFE07
NAT/GR/000285
Layman’s Report (2012) of Life Project Restoring Hydrology in Amalvas and Žuvintas Wetlands -
LIFE07 NAT/LT/000530
Lubos Halada and Zsuzsanna Kocsis-Kupper (2011). Evaluation of the Progress Report of Life Project
Preservation of alluvial forest habitats in the Morávka river Basin - LIFE06 NAT/CZ/000121
M. Broshtilova and V. Tsakova. Presentation of Life Project Conservation and Restoration of Black Sea
Oak Habitats - LIFE09 NAT/BG/000229
173
Moussouris, Y., Raftopoulou, K., and Malnaca, M., (2014). Evaluation of the Progress Report of Life
Project Establishment of a Plant Micro-reserve Network in Cyprus for the Conservation of Priority
Species and Habitats - LIFE08 NAT/CY/000453
NAVRUD, Ståle (2009) Overview and evaluation of benefit transfer techniques and their reliability
Science for Environment Policy (2015) Ecosystem Services and the Environment. In-depth Report 11
produced for the European Commission, DG Environment by the Science Communication Unit, UWE,
Bristol. Available at: http://ec.europa.eu/science-environment-policy
Silva, I. (2009). Evaluation of the Progress Report of Life Project Restoring migration possibilities for 8
Annex II species in the Roer - LIFE06 NAT/NL/000078
Sliva, J. (2012). Evaluation of the Progress Report of Life Project Restoration and Management of
Sand Dunes Habitats in Zahorie Military Training Area - LIFE06 NAT/SK/000115
TEEB (2010). The Economics of Ecosystems and Biodiversity: The Ecological and Economic
Foundations
ten Brink P., Badura T., Bassi S., Daly, E., Dickie, I., Ding H., Gantioler S., Gerdes, H., Kettunen M.,
Lago, M., Lang, S., Markandya A., Nunes P.A.L.D., Pieterse, M., Rayment M., Tinch R., (2011).
Estimating the Overall Economic Value of the Benefits provided by the Natura 2000 Network. Final
Report to the European Commission, DG Environment on Contract ENV.B.2/SER/2008/0038. Institute
for European Environmental Policy / GHK / Ecologic, Brussels 2011
Treier, K. (2013). Evaluation of the Progress Report of Life Project Saving life in meanders and oxbow
lakes of Emajõgi River on Alam-Pedja NATURA2000 area - LIFE07 NAT/EE/000120
Valaoras, G. (2013). Evaluation of the Progress Report of Life Project Concrete Conservation Actions
for the Mediterranean Shag and Audouin's gull in Greece including the inventory of relevant marine
IBAs - LIFE07 NAT/GR/000285
Rudolf de Groot, Luke Brander, Sander van der Ploeg, Robert Costanza, Florence Bernard, Leon Braat,
Mike Christie, Neville Crossman, Andrea Ghermandi, Lars Hein, SalmanHussain, Pushpam Kumar,
Alistair McVittie, Rosimeiry Portela, Luis C. Rodriguez, Patrick ten Brink, Pieter van Beukering (2012)
Global estimates of the value of ecosystems and their services in monetary units.
174
PART IV: Special Report – Financing LIFE projects
replication
175
Introduction
LIFE Programme has financed successfully implemented projects with strong sustainability and
replicability attributes, bearing significant number of the characteristics of the green investments
sought after investors. However, it is usually the case that the stakeholders involved in LIFE projects
fail to attract the required funds thus projects though successful fail to replicate.
Therefore there is substantial ground for further exploration of newly developed or under
development instruments and structures and for further elaboration on how these may be used to
finance and successfully combined with completed LIFE projects.
Of course, a detailed analysis is necessary and will be required in an attempt to successfully fine tune
and match specific LIFE projects with specific or alternative green financial instruments or structures
currently available in the market.
176
1. The Global Landscape of Green Finance
The Global Landscape of Climate Finance 2015 of the Climate Policy Initiative (CPI) presents the most
comprehensive information available on which sources and financial instruments are driving
investments, and how much climate finance is flowing globally.
It aims to provide an updated picture on how, where, and from whom finance is flowing toward low-
carbon and climate-resilient actions globally, and to improve understanding of how public and
private sources of finance interact. It also tracks progress towards commitments made by developed
country Parties to the UNFCCC (United Nations Framework Convention on Climate Change) to
mobilize US$ 100 billion annually for climate interventions in developing countries by 2020.
Despite existing obstacles in both the definition of climate finance as well as in gathering data the CPI
has used a methodology with special references on the amount of climate finance not included and
refers to a 3year period. The amount of climate finance invested around the world after levelling off
in 2012, and declining in 2013, increased by 18%, from US$ 331 billion in 2013 to an estimated US$
391 billion in 2014 with he bulk of climate finance being provided by the private sector.
Public climate finance is on the rise, with contributions by governments and intermediaries reaching
at least an amount of US$ 148 billion (range of US$ 144–152 billion) in 2014, an 8% increase from
2013 levels, and a 10% rise from 2012. Public actors are increasingly recognizing the benefits of
climate action for achieving their goals as well as that managing climate change is in their national
economic interest.
Private investment in renewable energies grew by 26% in 2014 after two years of decline, resulting in
record volumes of new installed capacity (103 GW). With US$ 243 billion, private investment
remained the largest source (62%) of global climate finance captured in Landscape 2015. Policy and
market signals, predictable and stable profits, and the strategic potential of investments are key
determinants of private actors’ financing behaviour. Obtaining the requisite technical expertise,
gaining access to finance, and managing project risks remain key challenges for enabling shifts in the
patterns of private climate finance investments.
To deal with existing limitations CPI followed a uniform philosophy however, the data that are not
captured by the Global Landscape 2015 if added could more than double the level the amount of
Global Climate Finance invested around the world.
Available data continues to show that private actors rely primarily on their own balance sheets to
finance renewable energy projects accounting for 72% or US$ 175 billion of total private investment
in 2014.
Mostly, they relied on balance sheet financing to invest in solar PV projects in high-income and
upper-middle income countries such as Japan, the US and China.
The reasons for investors’ reliance on balance sheets can vary, including the size of the project (it can
make more sense to finance small projects internally), difficulties in securing debt, high costs of
capital, and other factors.
Public actors delivered more than half of their financing in the form of grants and low-cost loans,
which accounted for 10% (US$ 14 billion) and 47% (US$ 69 billion) of total public finance respectively.
Over the past three years, grants’ share of total public finance averaged 9% (US$ 13 billion), while the share of low- cost loans averaged around 50% (US$ 71 billion), both with a +/- 10% from 2012 levels
177
attributable to data uncertainties.
Grants made up more than half of government entities’ and Climate Funds’ respective commitments, and most of those for which we had project-level detail supported projects in low and lower-middle
income countries – 34% of total grants (US$ 5 billion).
Twenty-six low-cost loans (including concessional loans) accounted for the majority of bilateral and
national DFIs’ financing – 64% (US$ 11 billion) and 78% (US$ 52 billion) respectively. 43% of low-cost
loans (US$ 30 billion) helped reduce the capital costs of mitigation and/or adaptation projects in
high- and upper-middle income countries.
Public concessional or lower-than-market-rate finance, including loans with longer tenors and grace
periods, play a catalytic role by supporting the establishment of policy frameworks, strengthening
technical capacity, lowering investment costs, and reducing investment risks for the first movers in a
market. Country macroeconomic and institutional conditions and the existence and level of project-
level revenues are key determinants of the appropriate combination of grants versus loans.
Multilateral (Development Finance Institutions) DFIs provided 84% (US$ 40 billion)of their
commitments as market-rate loans – often blended with governments and Climate Funds’ concessional resources – primarily for sustainable transport and renewable energy generation
projects (35% or US$ 14 billion and 26% or US$ 10 billion of total market debt extended respectively).
Around one third of the about US$ 2 billion external resources managed by multilateral DFIs for
which we have details, supported the financing of greenfield renewable energy generation, and
mostly targeted projects in Sub-Saharan Africa, East Asia and the Pacific, and Latin America and the
Caribbean.
Multilateral DFIs also provided a significantportion of climate finance, around US$ 1.5 billionof
their resources, in the form of risk management instruments.
These instruments, which can encompass credit guarantees, political risk insurance, and contingency
recovery grants, can play a criticalrole in enabling private investments in the context of political
uncertainty, or to back private equity and debt financing in countries with more challenging
investment environments.
Due to the risk of double counting, these are not captured as part of Global Landscape of Climate
Finance total estimate and are not officially supported export credit guarantees.
In this landscape, labelled green bonds are used to finance only a tiny fraction of the Global Climate
Finance despite the high rates of growth recorded since their debut in the global bonds market.
Another financing instrument that has also financed a small fraction of Global Climate Finance and
has steadily attracted a growing interest of investors mostly in the US, is the Yieldco structure.
Fifteen US and European YieldCos grew in value from USD 12 billion in 2013 to more than USD 20
billion in 2015 (see BNEF, 2015c).
Despite the fact that well-established instruments continue to finance the bulk of green projects,
investors are experimenting with new approaches. Governments and banks in order to broaden the
instruments and structures available for climate financing and support the global environmental
finance have formed specific structures such as Funds focused and prioritised in green development.
They also, participate directly or indirectly to several institutions specially formed to support their
development with initiatives such as EIB Initiatives, UNEP Initiative, the Climate Policy Initiative, or
the Climate Bond Initiative or the Green Lab.
178
In the following section of our report a general view of all these newly developed or under
development financing instruments, vehicles and institutions will be presented and analysed in some
extent to provide the reader with fundamental knowledge and allow for further thought of their use
and connection for financing of LIFE Programme projects replication.
2. Green Bonds
Green bonds (or climate bonds) are like ordinary bonds with proceeds earmarked for green
investments that have been explicitly labelled as “green” by their issuers.
The first, ever, green bond was issued in 2007 by ΕΙΒ (European Investment Bank). The World Bank
followed shortly after, in 2008, and issued green bonds responding to specific demand from
Scandinavian Pension Funds seeking to support climate focused projects while the issuance fell well
within its efforts to encourage climate change adaptation and mitigation
The market has slowly caught on, but has seen rapid rates of growth reaching an over US$41.8 billion
issuance in 2015 from US$807 million in 2007.
As the market grew rapidly, market players have sought to bring greater clarity to the definitions and
processes associated with green bonds.
Using the experiences of the Multilateral Development Banks (MDB’s), originally the only issuers which still dominate the market, in early 2014 a group of banks initiated the development of the
Green Bond Principles (GBP) - a set of voluntary guidelines framing the issuance of green bonds. In a
second edition published in March 2015, the GBP encourage transparency, disclosure, and integrity
in the development of the green bond market.
The GBP suggest a procedure for designating, disclosing, managing and reporting on the proceeds of
the bond. They are designed to provide issuers with guidance on the key components involved in
launching a green bond, including providing information to aid investors in evaluating the
environmental impact of their green bond investments. The International Capital Markets
Association acts as the GBP’s secretariat and facilitates the work of its members, including issuers, investors, banks underwriting green bonds and other market participants.
The GBP recognize several broad categories of potential eligible projects, which include but are not
limited to the following:
x Renewable energy
x Energy efficiency (including efficient buildings)
x Sustainable waste management
x Sustainable land use (including sustainable forestry and agriculture)
x Biodiversity conservation
x Clean transportation
x Sustainable water management
x Climate change adaptation
Drawing from the practice of earlier issuers and the GBP, green bonds issuers have developed their
own green bond definition and processes to suit their business profiles.
179
Investors in green bonds expect information from issuers in sufficient detail to allow them to assess
green bond offers, such as how issuers track and use green bond proceeds and how they report the
positive impacts expected from green projects.
The Investor Network on Climate Risk, (a North American non profit organization convened by CERES
that advocates for leadership in sustainability), has articulated its expectations in a statement to
guide issuers and other market participants.
The market has been relying on issuer disclosures, second opinions and commentary from
academics, investment advisers, auditors, technical experts media and NGO such as CICERO, the
Climate Bonds Initiative, Det Norske Veritas (DNV), Norway, Ockom, Sustainalytics and Vigeo among
others.
Several green bond indices (for example Barclays, Morgan Stanley Capital International (MSCI),
Standard’s & Poors and Solactive are useful benchmarks for green bond portfolios and support transparency in definitions and processes.
The early issuance of Green Bonds by Multilateral Development Banks and the availability of Green
Bond Principles have formed the basis for a number of issuers to develop their processes suitable for
their business models and practices.
Many have worked with investors to fine tune the categories of eligible projects and disclosure and
reporting agencies. Cities, States and State owned Entities (Subnationals) pioneered in the issuance
of Green Bonds include the British Columbia, the City of Gotenburg together with Swedish Bank
Skandinaviska Enskilda Banken (SEB), the City of Johannesburg, the State of Massachuseetts, the Bi-
Lateral, Trade and Development Agencies, the Export Development Canada and the KfW
Development Bank.
Similarly, Utilities companies include the District of Columbia Water and Sewer Authority (DC Water)
and the CDF Suez. Among the corporates that have issued green bonds the Regency Centers
Corporation and Toyota Financial Services are included. Commercial Banks currently involved in
green bonds include Bank of America, ABN AMRO and Yes Bank.
In Europe, Institutional Investors (such as pension funds and insurance companies) and in the United
States investors with strong environmental focus were the first green bond investors. Since then,
green bonds have appealed to a broader group of investors including asset managers, companies,
foundations and as well as to increasingly diverse type of investors.
The profile of issuers has also changed as the bond market has benefited from the participation of
different kinds of issuers. 2014 and 2015 saw multiple “firsts” by other issuers such as commercial banks, corporations and municipalities.
2015 saw also the issuance of the China Bank guide on green bonds signalling the state’s support and
commitment to their use for financing environmental friendly projects.
The level of green bond issuance stood at US$ 41.8bln by the end of 2015. The majority of issuers
remain the MDB’s while 2014 saw the entrance of corporates and municipalities providing a broader spectrum of risk (and return) in green bond offerings. Important to note is also the fact that though
other types of instruments have appeared to finance environmental projects, such as Yieldco’s (publicly traded companies created by a parent company that bundle operating infrastructure assets
to generate predictable cash flows that are thenpaid out in dividends to shareholders. In the United
States and the United Kingdom, Yieldco’s raised $4.5 billion in 2014.) or the instruments developed
180
under the Global Innovation Lab for Climate Finance, they have not shown the dynamics the growth
trends of green bonds issuance has shown.
Their pricing is the same as that of the ordinary bonds. Though the data available are not considered
sufficient, a recent study by Barclays Bank showed that there is an extra 20 basis points (0.20) on
their pricing in the secondary market.
Critics claim that funds raised by green bonds could have been raised by regular bonds. The
additional attractive characteristic of green bonds is that they appeal to different types of investors,
investors seeking or focused on sustainable and responsible investing (SRI) and investors that
incorporate environmental, social and governance (ESG) criteria as part of their investment analysis.
Furthermore, they have proven to be an effective tool to raise awareness about issuers’ projects addressed to climate change and other environmental challenges.
The amount of just over US$ 40 billion of the total green bond issuance in 2014 compared to a total
bond market of over US$90 trillion, or of US$ 391 billion of the total Climate Finance Market (as
estimated by the Climate Policy Initiative), provides considerable prospects for the green bonds
market to grow. So does the total of US$ 65.9 billion outstanding labelled green bonds to an
estimated total outstanding Climate Aligned Bonds of US$ 531.8 billion according to a report
conducted by the Climate Bonds Initiative.
Issues such as increased transparency around connecting the source of funding with the expected
impact, possibly with a green rating scheme, or improvement of existing standards are of great
importance and will assist to this direction. The role of the public sector will also be crucial.
During the UNFCC Paris Agreement COP21 in December 2015 green bonds appeared as a solution to
the existing investment gap of climate finance.
181
3. The Green Lab – Global Innovation Lab for
Green Finance
“The Lab” is a global initiative that supports the identification and piloting of cutting edge climate
finance instruments. Developed by the UK, the U.S. and Germany is in partnership with several
climate finance donor countries (Denmark, France, Japan, the Netherlands, Norway) and key private
sector representatives. It forms part of broader government and private sector efforts to scale up
climate finance.
Analytical and secretariat work of The Lab has been funded by the UK Department of Energy &
Climate Change (DECC), the German Federal Ministry for the Environment, Nature Conservation,
Building and Nuclear Safety (BMUB), the U.S. Department of State, the Netherlands Ministry for
Foreign Affairs, Bloomberg Philanthropies, and The Rockefeller Foundation.
Climate Policy Initiative serves as The Lab Secretariat and has led the analysis of proposed
instruments, drawing on the expertise of Lab members and additional financial and investment
leaders as appropriate.
Based on proposals from around the world, The Lab has identified, developed and delivered
instruments with potential to drive investment in developing countries at scale. Up to date the Lab
has called for proposed instruments in two cycles. The instruments outlined below are per cycle.
The instruments of 2014-2015 are at a more advanced stage of development or even are endorsed
while those of 205-2016 are at the elaboration phase. They are mostly instruments to facilitate
rather than provide finance. However, outlined here below included is a fund as well as a mechanism
to provide finance to a group of aggregated small loans.
2014-2015 A Cycle Instruments
i. LONG TERM FX Risk Management This instrument provides tools to address currency and interest rate risk for climate relevant projects
in developing countries.
ii. Climate Investor One Climate Investor One facilitates early-stage development, construction financing, and refinancing to
fast-track renewable energy projects in developing countries.
iii. Energy Savings Insurance This instrument insures the financial performance of energy efficiency savings projects. The pilot in
Mexico is underway, and the challenge now is to replicate in additional sectors and regions.
iv. Renewable Energy Platform For Institutional Investors By facilitating institutional investment in renewable energy projects, REPIN aims to increase the scale
of available financing and to reduce its costs.
v. Agricultural supply chain adaptation facility The instrument aims to provide farmers with know-how and finance for climate-resilient
investments. The Facility does this by enabling development banks to partner with agribusiness
corporations who empower farmers within their supply chains.
182
vi. Debt Fund for prepaid energy access The Debt Fund would lend to energy service providers of prepaid solar home system products and
services, providing the necessary working capital to expand energy access in Sub-Saharan Africa.
vii. Global renewable independent power supplier (GRIPS) GRIPS will be a renewable energy service company, building and operating a diversified portfolio of
hybrid energy plants in remote areas.
2015 – 2016 B Cycle Instruments
Following the 3 December Advisors’ Meeting in Paris, in which Lab Advisors voted in six Lab ideas as
finalists The Lab’s Second Cycle (Lab 2.0, 2015-2016), the Secretariat led a scoping process with
proponents for each idea. Again in this second cycle they are facilitating instruments and not
financing instruments per se. The interesting issue in this cycle is the concept of “water bond”.
The instruments, which will move forward from the scoping phase, are described below:
i. Water Financing Facility The Water Financing Facility would help create bankable projects to attract domestic private
investors and build climate-resilient water infrastructure in at-risk regions.
ii. Climate Smart Finance for smallholder farmers in developing countries This instrument, currently a demonstration project, provides credit providers with an “out-of-the-
box” set of tools for managing the issuance of loans to smallholders and incentivizing climate smart agricultural practices.
iii. OASIS Platform for catastrophe and climate risk assessment and adaptation This open access platform aims to increase data and analytics to enable risk assessment for
investments in insurance and resilience products, and climate adaptation.
iv. Small Scale Renewables Financing Facility This instrument is a small-scale renewable energy financing facility that would support local project
developers gain access to finance.
v. Mobilising `Equity to Drive Energy Efficiency Investments To mobilize private capital at scale for energy efficiency financing in emerging economies in both
private and public sector investments by providing the much needed risk (equity) capital.
183
4. Green Loans
European Investment Bank Green Loans (InnovFin EU Finance for
Innovators)
The Risk-Sharing Finance Facility (RSFF) financed some 114 RDI projects to the tune of EUR 11.3bn,
catalysing a further EUR 37.2 billion in private investment in European Innovation. Building on the
success of its predecessor, InnovFin is a debt-based instrument set to double this and trigger a
multiple of investments. Funded by Horizon 2020, it covers the full company lifecycle from SME to
large cap, stimulating more investment in research and innovation notably by the private sector.
InnovFin is demand driven and technology neutral with the potential to support low carbon
technologies and first of a kind demonstration projects (e.g. renewable energy and smart grid
sectors). By 2020, it is expected that the InnovFin products will make available more than EUR 24bn
of financing for research and innovation by small, med-cap and large companies and the promoters
of research infrastructures.
A mid-cap is a company, which at the time of the application employs less than 3,000 full-time
employees on a consolidated basis and is eligible for Growth Financing (GFI) if it meets at least one of
the following two conditions:
A. The company is a “fast growing enterprise” measured by employment or turnover. Annualized growth in sales or full-time employees > 10% a year over the last three years, or
B. The company is an “R&D or innovation-driven enterprise”, if it meets at least one of the following conditions:
1) R&D to Sales ratio is equal of higher than 5% for the last fiscal year, or
2) The company undertakes to spend at least 80% of the loan amount on research, development and
innovation activities over the next 36 months, or
3) The company has been awarded grants, loans or guarantees from the European R&D or innovation
support schemes (e.g. FP7, Horizon 2020) or regional or national support schemes over the last 36
months, or
4) The company won an innovation prize over the last 24 months, or
5) The company registered more than one patent over the last 24 months, or
6) The company received cash investment from an innovation-driven VC, or
7) The company is registered in a science, technology, or innovation park, or technology cluster or
incubator, in each case, for activities related to RDI, or
8) The company has benefited from tax credit related to innovation or investment in R&D in the last
24 months.
184
The UK Green Investment Bank
The UK Government established, Green Investment Bank Plc, is the first bank of its kind in the world
financing infrastructure projects, which are green and profitable. The projects the GIB invests in are
in sectors such as the Offshore Wind, Energy Efficiency, Waste and Bioenergy and onshore
renewable.
Funded and supported by the UK Government the GIB uses the funds available to back green
projects, on commercial terms, across the UK and mobilise private sector capital into the UK’s green economy. Among its five specifically created five funds to finance small projects of £2 million are the
UKCI (UK Climate Investments LLP) and the UK Green Investment Offshore Wind Fund.
The UKCI is a joint venture of the UK GIB and the UK Governments Department for Climate Change
(DECC) aiming to adopt GIB’s approach to projects in the UK. The joint venture will make minority
equity investments of c. £10-30m into renewable energy generation and energy efficiency projects
using proven technologies.
In addition its own investments in the UK’s offshore wind market, the UK Green Investment Bank established the UK Green Investment Offshore Wind Fund, through its wholly owned subsidiary UK
Green Investment Bank Financial Services Limited (GIBFS), to invest in operating offshore wind farms
in the UK. It is the largest renewable energy fund in the UK attracting investors such as UK-based
pension funds and international institutional investors among which one of the world’s largest sovereign wealth funds and a leading European life and pension company.
185
5. Green Funds
European Investment Bank Equity Funds
Equity funds allow EIB to provide indirect equity or target projects that would otherwise be too small
to benefit from its lending activities whilst enabling investment into new asset classes to gain
experience and to potentially mainstream these into the EIB core business at a later stage.
Existing EIB equity funds are:
i. Eco-Enterprises II Deploys expansion capital otherwise unavailable to growth stage sustainable ventures in fields such
as organic agriculture, non timber forest products, sustainable forestry or ecotourism. Instruments
used include quasi-equity, structured royalty streams and warrants, convertible notes and long-term
debt financing.
ii. Dasos Timberland II This fund targets sustainable forestry and biomass investments, mainly in Europe. It consists of a
timberland portfolio well diversified in terms of geography, age, wood fiber and end use. The total
size of the fund is EUR 300m and EIB’s contribution stands at EUR 30m. EIB adds value by improving sustainable forest management and certification as well as exploiting identified market inefficiencies
and benefitting from the delivery of ecosystem services.
iii. Glennmont Clean Energy Fund II It is a renewable energy fund, managed by Glennmont, a spin- off of BNP Paribas, and aims to make
around 15 investments, primarily in the onshore wind, solar, biomass and small hydro sectors in
Europe. EIB committed EUR 50m to this fund targeting a total of EUR 450m in commitments. EIB
investment took the fund to EUR 250m in size, and supported the establishment of a new investment
house dedicated to renewable energy investment.
iv. Althelia Climate Fund Althelia Climate Fund invests in projects that promote sustainable land use by reducing deforestation
and protecting biodiversity. EIB investment of EUR 25m will help mobilize EUR 150m in total private
equity investments in Africa, Asia and Latin America. Althelia is also supported by 50% loss guarantee
from the US agency for International Development offering country risk coverage for up to 133m of
the portfolio.
v. Global Energy Efficiency and Renewable Energy Fund Advised by the EIB, this Fund of Funds was launched in 2008 with funding totaling EUR 112m from
the European Union, Germany and Norway. In 2013 GEEREF was joined by private investors and the
fund size rose to 200m by 2014.GEEREF aims to anchor new private equity funds focusing on
renewable energy and energy efficiency projects in emerging markets and economies in transition
(Africa, Caribbean and Pacific regions, non EU Eastern Europe, Latin America and Asia). As of the end
of 2014 GEEREF has invested in seven funds aiming for a triple bottom: people, planet and profit.
GEEREF aims to invest in total 14 funds, mobilizing private capital sector risk capital and further
achieving a highly catalytic effect.
186
European Investment Bank Layered Risk Funds
Layered-risk funds are a special form of equity fund that allow the issuance of different tranches of
capital in the form of shares and notes to offer investors different risk-return profiles in a type of
public private partnership. Typically, the EIB acts as a cornerstone investor and sponsor and
structures the fund around public resources targeting a specific policy outcome, such as extending
financial cover- age to new or “underbanked” markets, or to demonstrate innovative financial
structures. These funds channel finance and, in some cases, technical assistance to transactions that
are too small to be handled directly by the EIB.
The capital structure of such an investment vehicle typically rests on the provision of a first-loss piece
(termed Junior - C Shares in the figure) by donors. This risk cushion allows the EIB and other public
financiers to invest in more senior A or B tranches, bringing the benefits of the EIB’s financial strength as an AAA rated bank to achieve economic sustainability and stimulate investment from
other sources. Once the asset side of the fund develops, this structure allows the possibility of issuing
notes to private investors who remain most senior in the cash waterfall of the fund.
i. European Energy Efficiency Fund (EEEF) In cooperation with the European Commission and managed by Deutsche Bank, EEEF aims to provide
market-based financing for viable small-sized energy efficiency and renewable energy projects in the
EU. Launched in 2011, EEEF deploys both debt and equity instruments to provide fast and flexible
financing to support small and innovative projects with tailored financing solutions. Currently a EUR
265m fund, it intends to grow to EUR 800-900m by attracting public and private investors.
The EEEF is providing upfront financing to an energy service company (ESCO) by purchasing 70% of
the energy savings expected to come from the retrofitting of the Jewish Museum. In addition to
winning the European Energy Service Initiative’s Award for the best European energy efficiency service project, the Jewish Museum project is an EEEF trailblazer in terms of financial structuring,
designed to foster ESCO structures in the European market.
ii. Global Climate Partnership Fund (GCPF) The EIB has secured approval to invest in an existing donor-supported debt provider, the GCPF, which
can provide long-term liquidity to small local financial intermediaries or co-finance projects alongside
them, potentially working to extend the overall tenor of the debt or through a subordinated loan.
Supporting the EU’s climate change and environmental policy objectives, this debt fund focuses on
financing small-scale energy efficiency and renewable energy investments. The EIB’s participation will encourage a focus on sub-Saharan Africa and also contribute to the United Nations Sustainable
Energy for All (SE4All) initiative.
iii. Green for Growth Fund (GGF) GGF is the first specialised fund to advance energy efficiency and renewable energy in South-Eastern
Europe – including Turkey – and Eastern Neighbourhood regions. Initiated by the EIB and KfW
Entwicklungsbank (German government owned Development Bank), GGF was established to reduce
energy consumption and CO2 emissions. With nearly EUR 290m committed by investors, GGF
provides refinancing to financial institutions to enhance their participation in the energy efficiency
and renewable energy sectors. It also makes direct investments in non-financial institutions having
projects in these areas.
187
Green Climate Fund
The Fund is a unique global initiative to respond to climate change by investing into low-emission and
climate-resilient development. The GCF was established by 194 governments, aiming to limit or
reduce greenhouse gas emissions in developing countries, and to help adapt vulnerable societies to
the unavoidable impacts of climate change.
GCF is accountable to the United Nations and guided by the principles and provisions of the UN
Framework Convention on Climate Change (UNFCCC). Given the urgency and seriousness of the
challenge, the Fund is mandated to make an ambitious contribution to the united global response to
climate change.
Access to GCF resources to undertake climate change projects and programmes is possible for
accredited national, regional, and international entities. Accredited Entities (AEs) can submit funding
proposals to the Fund at any time.
Climate Investment Fund
Climate Investment Funds' stakeholder base includes: countries, civil society organizations (CSOs),
indigenous peoples, private sector entities, multilateral development banks (MDBs), UN and UN
agencies, GEF, UNFCCC Adaptation Fund, bilateral development agencies, and scientific and technical
experts.
The $8.3 billion Climate Investment Fund (CIF) is providing 72 developing and middle income
countries with urgently needed resources to manage the challenges of climate change and reduce
their greenhouse gas emissions.
Since 2008, the CIF has been leading efforts to empower transformations in the energy, climate
resilience, and transport and forestry sectors. CIF concessional financing offers flexibility to test new
business models and approaches, build track records in unproven markets, and boost investor
confidence to unlock additional finance from other sources, particularly the private sector and the
multilateral development banks that implement CIF funding. Total CIF pledges of $8.3 billion are
expected to attract an additional $58 billion of co-financing for a portfolio of over 300 projects and
counting.
The CIF is comprised of four programs:
x The $5.6 billion Clean Technology Fund (CTF) provides middle-income countries with highly
concessional resources to scale up the demonstration, deployment, and transfer of low
carbon technologies in renewable energy, energy efficiency, and sustainable transport.
x The $1.2 billion Pilot Program for Climate Resilience (PPCR) is helping developing countries
integrate climate resilience into development planning and offers additional funding to
support public and private sector investments for implementation.
x The $780 million Scaling Up Renewable Energy in Low Income Countries Program (SREP) is
helping to deploy renewable energy solutions for increased energy access and economic
growth in the world’s poorest countries. x The $771 million Forest Investment Program (FIP) supports efforts of developing countries to
reduce deforestation and forest degradation and promote sustainable forest management
that leads to emissions’ reductions and enhancement of forest carbon stocks (REDD+).
188
6. Yieldco’s
Yieldco’s is a new financing vehicle developed the last couple of years, mainly in the US, to finance projects in the area of energy and energy renewables. A YieldCo is generally defined as a company
that predominantly distributes its cash flows from owned operating assets as dividends or other
payments to investors. These financing vehicles are gaining popularity and momentum, specifically
for portfolios of assets with contracted cash flows from investment grade counterparties. Due to
relatively low market yields YieldCo’s are exceedingly sought after as a low risk alternative.
YieldCo investment structures follow the pattern of Real Estate Investment Trusts (REITs) and Master
Limited Partnerships (MLPs), a popular investor option mainly in the US since the 1980’s, and apply it in a wider range of business areas to power infrastructure and generation.
For investors, REITs and MLPs provide two major benefits – tax advantages and liquidity. The ability
to pass through untaxed earnings to investors avoids the often maligned issue of double taxation, in
which corporate earnings are taxed along with investor income from interest, dividends, and capital
gains. Additionally, the ability to trade on public markets provides investors with greater flexibility
with regard to investment time horizon.
There are restrictions on the type of business which REITs and MLPs may pursue. REITs must
generate a defined amount of earnings through real estate ownership or indirectly from mortgage
interest. They typically own commercial and residential properties, which are highly differentiated,
illiquid investment classes otherwise inaccessible to most investors. There are some small
capitalization REITs that focus on investment in energy efficiency and renewable energy, but these
are a small minority of the total asset class.
Unlike REITs and MLPs YieldCos have no technical restrictions on asset or income composition (again,
other than market expectations of stability in cash flow). Consequently, YieldCos can be created from
assets that would not generate the qualifying income required for pass-through treatment under the
tax law currently applying in the US.
The YieldCo structure typically involves the sponsor company contributing cash-generating assets
into a limited liability company (the LLC). The YieldCo then raises cash from the public through an
initial public offering (IPO) of its stock, and uses the IPO proceeds to buy an interest in the LLC. The
sponsor retains an economic interest in the LLC but typically has no economic interest in YieldCo,
only a majority voting interest, which allows the sponsor to control investment and operational
decisions.
Example:
An interesting example is the recent $431 million Initial Public Offering (IPO) in July 2013 of NRG Yield
(NYLD), an equity carve out of NRG Energy’s conventional, renewable and thermal generation assets.
NRG Yield, Inc. was formed as a Delaware corporation, on December 20, 2012, to serve as the
primary vehicle through which NRG Energy, Inc., the leading integrated power company in the U.S,
owns, operates and acquires contracted renewable and conventional generation and thermal
infrastructure assets. The Company owns a diversified portfolio of contracted renewable and
conventional generation and thermal infrastructure assets in the U.S.
The motivation for the deal, as stated in the prospectus, was for NRG Energy and NYLD to raise cash
for growth and development opportunities, and to optimize the company’s capital structure with low cost equity. NYLD’s deal pipeline, acquisition opportunities intended to support dividend growth, is
189
primarily composed of other NRG Energy generating assets to which NYLD has the “right of first offer.” NRG maintains ownership of 70 percent of the economic and voting rights in NYLD and interests appear to be operationally aligned. However, there are potential transactional conflicts
between the two parties as NRG Energy could influence NYLD to overpay for assets acquired from
NRG Energy.
YieldCos can theoretically deliver a combination of benefits that can address perceived limitations of
other structures — namely, (1) the YieldCo offers a promise of regular and predictable cash
distributions, unlike the majority of publicly traded stocks; (2) the YieldCo offers a tax shield to its
investors (similar in net result to that of an MLP for certain periods); and (3) as a corporation for US
federal income tax purposes, non-US investors and tax-exempt investors may have a greater
investment appetite for this trending vehicle.
Fifteen US and European YieldCos grew in value from USD 12 billion in 2013 to more than USD 20
billion in 2015 (see BNEF, 2015c). See CPI, The Global Landscape of Climate Finance, 2015. A report
published by Deutsch Bank in 2015, claims that Yieldcos (the renewable energy finance vehicles)
currently financing 1% of the global climate finance, are likely to outgrow their oil and gas
equivalents which have grown by 27% over the last 24 years and sets its expectations to a magnitude
of 1 trillion in the next 10 years. The Deutsch Bank’s analyst also expect YieldCos to not only increase
the availability of capital, but also to provide significantly lower cost of capital to the renewables
sector.
7. Initiatives
European Investment Bank Initiatives
The EIB is involved in a series of innovative climate finance initiatives in collaboration with the
European Commission, EU Member States and other international financial institutions both within
and outside the EU. These initiatives aim to support new or innovative projects and products or
provide risk-sharing/risk- reduction mechanisms to stimulate additional low-carbon project
development.
Analytically described below, these initiatives are:
i. Debt for Energy Efficiency Projects Green (DEEP Green) The EIB launched the DEEP Green initiative to complement its existing financing offer for energy
efficiency investments in several EU countries. DEEP Green aims at developing a suite of new
financial products for four key groups of players in the energy efficiency market: banks, public sector,
ESCOs and utilities. Launched in 2014, the first concrete result in cooperation with the European
Commission is the Private Finance for Energy Efficiency (PF4EE) scheme, helping local financial
intermediaries to support the roll-out of national energy efficiency plans and ultimately to increase
lending for energy efficiency projects. By providing long- term low-cost loans, credit risk protection
and enhanced lending expertise to local banks, this initiative is expected to unlock at least EUR 500m
of dedicated financing to reduce energy bills.
ii. Natural Capital Funding Facility (NCFF) Also launched in 2014, NCFF is backed by EUR 125 m, provided by the European Investment Bank and
the European Commission under the LIFE Programme. It represents a new and innovative approach
to financing projects promoting the restoration, protection and enhancement of natural capital in
190
the EU. As part of the NCFF, the EIB will lend directly to projects or provide credit lines to commercial
banks so that they can make loans for eligible projects. In addition, the EIB can take shares in equity
funds that invest in natural capital projects. Eligible projects will include nature conservation, green
infrastructure, eco- system services, biodiversity offsets and compensation beyond legal
requirements as well as sustainable agriculture, forestry, aquaculture and eco-tourism. This initiative
demonstrates the potential for long-term private sector investment in projects currently seen as too
challenging to be viable for the private sector on its own. The NCFF will start with a 3 to 4-year pilot
phase and is expected to finance between 9 and 12 operations.
iii. Renewable Energy Performance Platform (REPP) The UN has created the SE4All initiative to provide sustainable energy for all by 2030; for those who
luck access to energy, the initiative aims to provide access. For those having access to energy, the
initiative aims to provide cleaner and more efficient.
In support of the SE4All initiative and alongside the United Nations Environmental Programme
(UNEP) the EIB has developed REPP to stimulate the bankability of innovative small and medium
scale renewable energy projects in Sub Saharan Africa by helping them tom access risk protection
and financing products. With REPP EIB seeks to mobilise private sector development activity and
investment in small/medium scale projects through improved access to existing risk mitigation
instruments, long term lending and results-based financial products. With REPP, the EIB seeks to
mobilize private sector development activity and investment in small/medium scale projects through
improved access to existing risk mitigation instruments, long term lending and results based financial
support.
United Nations Finance Initiative (UNEP FI)
Founded in 1992 in the context of the Earth Summit in Rio, and based in Geneva, Switzerland, the
United Nations Environment Programme Finance Initiative (UNEP FI) was established as a platform
associating the United Nations and the financial sector globally. The need for this unique United
Nations partnership arose from the growing recognition of the links between finance and
Environmental, Social and Governance (ESG) challenges, and the role financial institutions could play
for a more sustainable world.
UNEP FI is continuously building its membership, and works closely with over 200 members, who
have signed the UNEP FI Statement of Commitment. The membership is made up of public and
private financial institutions from around the world and is balanced between developed and
developing countries. They recognize sustainability as part of a collective responsibility and support
approaches to anticipate and prevent potential negative impacts on the environment and society.
Banking, insurance and investment, the three main sectors of finance, are represented and brought
together in this unique partnership. In addition, UNEP FI develops selective collaborations, UN-driven
and finance sector-driven, with other partner organizations, in order to increase awareness and raise
support for critical activities. UNEP FI contributes the perspectives of financial institutions to the
various United Nations and global activities on sustainable finance.
The Initiative's work includes:
• Capacity building and the sharing of best practices;
• Pioneering research and tools;
• Setting global standards and principles;
191
• Engaging stakeholders, both public and private;
• Facilitating the networking of members and stakeholders through global events and regional activities.
UNEP's cross-cutting themes are embedded throughout UNEP FI's activities, specifically in its
thematic work areas of Climate Change, Ecosystems Management, Energy Efficiency and Social
Issues.
The UNEPFI structure aims to Unlock Private Climate Finance for the implementation of the 2030
Agenda.

Related Documents