Welcome message from author
This document is posted to help you gain knowledge. Please leave a comment to let me know what you think about it! Share it to your friends and learn new things together.
Transcript


Hazard Mapping of the Philippines Using LIDAR (Phil-LIDAR 1)

LiDAR Surveys and Flood Mapping of Sta. Cruz River
i
© University of the Philippines Diliman and the University of the Philippines Los Baños 2017
Published by the UP Training Center for Applied Geodesy and Photogrammetry (TCAGP)College of EngineeringUniversity of the Philippines – DilimanQuezon City1101 PHILIPPINES
This research project is supported by the Department of Science and Technology (DOST) as part of its Grants-in-Aid (GIA) Program and is to be cited as:
E.C. Paringit and E.R. Abucay (2017), LiDAR Surveys and Flood Mapping of Sta. Cruz River, Quezon City: University of the Philippines Training Center for Applied Geodesy and Photogrammetry-183pp
The text of this information may be copied and distributed for research and educational purposes with proper acknowledgement. While every care is taken to ensure the accuracy of this publication, the UP TCAGP disclaims all responsibility and all liability (including without limitation, liability in negligence) and costs which might incur as a result of the materials in this publication being inaccurate or incomplete in any way and for any reason.
For questions/queries regarding this report, contact:
Asst. Prof. Edwin R. Abucay Project Leader, Phil-LiDAR 1 ProgramUniversity of the Philippines Los BañosLos Baños, Laguna, Philippines 4031E-mail: [email protected]
Enrico C. Paringit, Dr. Eng.Program Leader, Phil-LiDAR 1 Program University of the Philippines Diliman Quezon City, Philippines 1101 E-mail: [email protected]
National Library of the PhilippinesISBN: 978-621-430-158-4

Hazard Mapping of the Philippines Using LIDAR (Phil-LIDAR 1)
ii

LiDAR Surveys and Flood Mapping of Sta. Cruz River
iii
TABLE OF CONTENTSLIST OF TABLES .................................................................................................................................. vLIST OF FIGURES .............................................................................................................................. viiLIST OF ACRONYMS AND ABBREVIATIONS ........................................................................................ ixCHAPTER 1: OVERVIEW OF THE PROGRAM AND STA. CRUZ RIVER ..................................................... 1 1.1 Background of the Phil-LIDAR 1 Program ................................................................................... 1 1.2 Overview of the Sta. Cruz River Basin ........................................................................................ 1CHAPTER 2: LIDAR ACQUISITION IN STA. CRUZ FLOODPLAIN .............................................................. 4 2.1 Flight Plans ................................................................................................................................. 4 2.2 Ground Base Station .................................................................................................................. 6 2.3 Flight Missions ........................................................................................................................... 9 2.4 Survey Coverage ......................................................................................................................... 9CHAPTER 3: LIDAR DATA PROCESSING FOR STA. CRUZ FLOODPLAIN ................................................. 12 3.1 Overview of the LiDAR Data Pre-Processing ............................................................................ 12 3.2 Transmittal of Acquired LiDAR Data ......................................................................................... 13 3.3 Trajectory Computation ........................................................................................................... 13 3.4 LiDAR Point Cloud Computation............................................................................................... 16 3.5 LiDAR Data Quality Checking .................................................................................................... 16 3.6 LiDAR Point Cloud Classification and Rasterization .................................................................. 21 3.7 LiDAR Image Processing and Orthophotograph Rectification .................................................. 23 3.8 DEM Editing and Hydro-Correction .......................................................................................... 24 3.9 Mosaicking of Blocks ................................................................................................................ 25 3.10 Calibration and Validation of Mosaicked LiDAR Digital Elevation Model ............................... 28 3.11 Integration of Bathymetric Data into the LiDAR Digital Terrain Model .................................. 31CHAPTER 4: LIDAR VALIDATION SURVEY AND MEASUREMENTS IN THE STA. CRUZ RIVER BASIN ....... 33 4.1 Summary of Activities .............................................................................................................. 33 4.2 Control Survey .......................................................................................................................... 33 4.3 Baseline Processing .................................................................................................................. 37 4.4 Network Adjustment ................................................................................................................ 38 4.5 Bridge Cross-section and As-built Survey, and Water Level Marking ....................................... 39 4.6 Validation Points Acquisition Survey ........................................................................................ 39 4.7 River Bathymetric Survey ......................................................................................................... 41CHAPTER 5: FLOOD MODELING AND MAPPING ............................................................................... 44 5.1 Data Used for Hydrologic Modeling ......................................................................................... 44 5.1.1 Hydrometry and Rating Curves ................................................................................... 44 5.1.2 Precipitation ................................................................................................................ 44 5.1.3 Rating Curves and River Outflow ................................................................................ 45 5.2 RIDF Station .............................................................................................................................. 47 5.3 HMS Model .............................................................................................................................. 49 5.4 Cross-section Data ................................................................................................................... 52 5.5 FLO-2D Model .......................................................................................................................... 53 5.6 Results of HMS Calibration ....................................................................................................... 53 5.7 Calculated Outflow Hydrographs and Discharge Values for Different Rainfall Return Periods 55 5.7.1 Hydrograph Using the Rainfall Runoff Model ............................................................. 55 5.7.2 Discharge Data Using Dr. Horritt’s Recommended Hydrologic Method ...................... 56 5.8 River Analysis Model Simulation .............................................................................................. 57 5.9 Flow Depth and Flood Hazard .................................................................................................. 57 5.10 Inventory of Areas Exposed to Flooding ................................................................................ 62 5.11 Flood Validation ................................................................................................................... 126REFERENCES .................................................................................................................................. 128ANNEXES ................................................................................................................................... 129 Annex 1. OPTECH Technical Specification of the Pegasus Sensor ................................................ 129 Annex 2. NAMRIA Certificates of Reference Points Used in the LiDAR Survey ............................ 130 Annex 3. Baseline Processing Reports of Reference Points Used in the LiDAR Survey ................ 132 Annex 4. The LiDAR Survey Team Composition ............................................................................ 134 Annex 5. Data Transfer Sheet for Sta. Cruz Floodplain ................................................................. 135 Annex 6. Flight Logs for the Flight Missions ................................................................................. 138 Annex 7. Flight Status Reports ..................................................................................................... 142 Annex 8. Mission Summary Reports ............................................................................................ 147 Annex 9. Sta. Cruz Model Basin Parameters ................................................................................ 172 Annex 10. Sta. Cruz Model Reach Parameters ............................................................................. 174

Hazard Mapping of the Philippines Using LIDAR (Phil-LIDAR 1)
iv
Annex 11. Sta. Cruz Field Validation Points .................................................................................. 175 Annex 12. Phil-LiDAR 1 UPLB Team Composition..........................................................................183
LiDAR Surveys and Flood Mapping of Sta. Cruz River
v
LIST OF TABLESTable 1. Flight planning parameters for Pegasus LiDAR system ................................................................. 4Table 2. Details of the recovered NAMRIA horizontal control point LAG-20 used as base station for the LiDAR acquisition ...................................................................................................... 6Table 3. Details of the established horizontal control point LAG-20A with processed coordinates used as base station for the LiDAR acquisition ................................................................................ 7Table 4. Details of the recovered NAMRIA horizontal control point LAG-52 used as base station for the LiDAR acquisition .................................................................................................................. 8Table 5. Details of the recovered NAMRIA horizontal control point LAG-4415 used as base station for the LiDAR acquisition ...................................................................................................... 8Table 6. Ground control points used during LiDAR Data acquisition ......................................................... 9Table 7. Flight missions for LiDAR data acquisition in Sta. Cruz Floodplain ............................................... 9Table 8. Actual parameters used during LiDAR data acquisition ............................................................... 9Table 9. List of municipalities/cities surveyed during Sta. Cruz Floodplain LiDAR survey........................ 10Table 10. Self-calibration results values for Sta. Cruz flights.................................................................... 16Table 11. List of LiDAR blocks for Sta. Cruz Floodplain ............................................................................ 17Table 12. Sta. Cruz classification results in TerraScan .............................................................................. 21Table 13. LiDAR blocks with their corresponding area ............................................................................ 25Table 14. Shift values of each LiDAR Block of Sta. Cruz Floodplain .......................................................... 26Table 15. Calibration statistical measures ............................................................................................... 30Table 16. Validation statistical measures ................................................................................................. 31Table 17. List of references and control points used in Sta. Cruz River survey (Source: NAMRIA, UP-TCAGP) ...................................................................................................................... 35Table 18. Baseline processing report for Sta. Cruz River static survey .................................................... 37Table 19. Control point constraints ......................................................................................................... 38Table 20. Adjusted grid coordinates ........................................................................................................ 38Table 21. Adjusted geodetic coordinates................................................................................................. 39Table 22. Reference and control points used and its location (Source: NAMRIA, UP-TCAGP) ................. 39Table 23. RIDF values for Tayabas Rain Gauge computed by PAGASA ..................................................... 47Table 24. Range of calibrated values for Sta. Cruz ................................................................................... 54Table 25. Summary of the efficiency test of Sta. Cruz HMS Model ......................................................... 55Table 26. Peak values of the Sta. Cruz HEC-HMS Model outflow using the Tayabas RIDF ....................... 56Table 27. Summary of Sta. Cruz–Pagsanjan River discharge generated in HEC-HMS .............................. 56Table 28. Validation of river discharge estimates .................................................................................... 57Table 29. Municipalities affected in Sta. Cruz Floodplain ........................................................................ 58Table 30. Affected areas in Calauan, Laguna during a 5-year rainfall return period ................................ 62Table 31. Affected areas in Cavinti, Laguna during a 5-year rainfall return period .................................. 63Table 32. Affected areas in Laguna Lake, Laguna during a 5-year rainfall return period ......................... 63Table 33. Affected areas in Liliw, Laguna during a 5-year rainfall return period ...................................... 64Table 34. Affected areas in Luisiana, Laguna during a 5-year rainfall return period ................................ 65Table 35. Affected areas in Lumban, Laguna during a 5-year rainfall return period ................................ 67Table 36. Affected areas in Lumban, Laguna during a 5-year rainfall return period ................................ 67Table 37. Affected areas in Magdalena, Laguna during a 5-year rainfall return period ........................... 69Table 38. Affected areas in Magdalena, Laguna during a 5-year rainfall return period ........................... 69Table 39. Affected areas in Magdalena, Laguna during a 5-year rainfall return period ........................... 69Table 40. Affected areas in Majayjay, Laguna during a 5-year rainfall return period .............................. 71Table 41. Affected areas in Nagcarlan, Laguna during a 5-year rainfall return period ............................ 72Table 42. Affected areas in Nagcarlan, Laguna during a 5-year rainfall return period ............................ 72Table 43. Affected areas in Pagsanjan, Laguna during a 5-year rainfall return period ............................ 74Table 44. Affected areas in Pagsanjan, Laguna during a 5-year rainfall return period ............................ 74Table 45. Affected areas in Pila, Laguna during a 5-year rainfall return period ....................................... 76Table 46. Affected areas in Pila, Laguna during a 5-year rainfall return period ....................................... 76Table 47. Affected areas in Sta. Cruz, Laguna during a 5-year rainfall return period............................... 78Table 48. Affected areas in Sta. Cruz, Laguna during a 5-year rainfall return period............................... 78Table 49. Affected areas in Sta. Cruz, Laguna during a 5-year rainfall return period............................... 79Table 50. Affected areas in Victoria, Laguna during a 5-year rainfall return period ................................ 81Table 51. Affected areas in Calauan, Laguna during a 25-year rainfall return period .............................. 83Table 52. Affected areas in Cavinti, Laguna during a 25-year rainfall return period ................................ 84Table 53. Affected areas in Laguna Lake, Laguna during a 25-year rainfall return period ....................... 85Table 54. Affected areas in Liliw, Laguna during a 25-year rainfall return period .................................... 86Table 55. Affected areas in Luisiana, Laguna during a 25-year rainfall return period .............................. 87

Hazard Mapping of the Philippines Using LIDAR (Phil-LIDAR 1)
vi
Hazard Mapping of the Philippines Using LIDAR (Phil-LIDAR 1)
Table 56. Affected areas in Lumban, Laguna during a 25-year rainfall return period .............................. 88Table 57. Affected areas in Lumban, Laguna during a 25-year rainfall return period .............................. 88Table 58. Affected areas in Magdalena, Laguna during a 25-year rainfall return period ......................... 90Table 59. Affected areas in Magdalena, Laguna during a 25-year rainfall return period ......................... 90Table 60. Affected areas in Magdalena, Laguna during a 25-year rainfall return period ......................... 90Table 61. Affected areas in Majayjay, Laguna during a 25-year rainfall return period ............................ 92Table 62. Affected areas in Nagcarlan, Laguna during a 25-year rainfall return period .......................... 93Table 63. Affected areas in Nagcarlan, Laguna during a 25-year rainfall return period .......................... 93Table 64. Affected areas in Pagsanjan, Laguna during a 25-year rainfall return period .......................... 95Table 65. Affected areas in Pagsanjan, Laguna during a 25-year rainfall return period .......................... 95Table 66. Affected areas in Pila, Laguna during a 25-year rainfall return period ..................................... 97Table 67. Affected areas in Pila, Laguna during a 25-year rainfall return period ..................................... 97Table 68. Affected areas in Sta. Cruz, Laguna during a 25-year rainfall return period............................. 99Table 69. Affected areas in Sta. Cruz, Laguna during a 25-year rainfall return period............................. 99Table 70. Affected areas in Sta. Cruz, Laguna during a 25-year rainfall return period........................... 100Table 71. Affected areas in Victoria, Laguna during a 25-year rainfall return period ............................ 102Table 72. Affected areas in Calauan, Laguna during a 100-year rainfall return period .......................... 104Table 73. Affected areas in Cavinti, Laguna during a 100-year rainfall return period ............................ 105Table 74. Affected areas in Laguna Lake, Laguna during a 100-year rainfall return period ................... 106Table 75. Affected areas in Liliw, Laguna during a 100-year rainfall return period ................................ 107Table 76. Affected areas in Luisiana, Laguna during a 100-year rainfall return period .......................... 108Table 77. Affected areas in Lumban, Laguna during a 100-year rainfall return period .......................... 109Table 78. Affected areas in Lumban, Laguna during a 100-year rainfall return period .......................... 109Table 79. Affected areas in Magdalena, Laguna during a 100-year rainfall return period ..................... 111Table 80. Affected areas in Magdalena, Laguna during a 100-year rainfall return period ..................... 111Table 81. Affected areas in Magdalena, Laguna during a 100-year rainfall return period ..................... 112Table 82. Affected areas in Majayjay, Laguna during a 100-year rainfall return period ........................ 114Table 83. Affected areas in Nagcarlan, Laguna during a 100-year rainfall return period ...................... 115Table 84. Affected areas in Nagcarlan, Laguna during a 100-year rainfall return period ...................... 115Table 85. Affected areas in Pagsanjan, Laguna during a 100-year rainfall return period ...................... 117Table 86. Affected areas in Pagsanjan, Laguna during a 100-year rainfall return period ...................... 117Table 87. Affected areas in Pila, Laguna during a 100-year rainfall return period ................................. 119Table 88. Affected areas in Pila, Laguna during a 100-year rainfall return period ................................. 119Table 89. Affected areas in Sta. Cruz, Laguna during a 100-year rainfall return period......................... 121Table 90. Affected areas in Sta. Cruz, Laguna during a 100-year rainfall return period......................... 121Table 91. Affected areas in Sta. Cruz, Laguna during a 100-year rainfall return period......................... 122Table 92. Affected areas in Victoria, Laguna during a 100-year rainfall return period .......................... 124Table 93. Actual flood depth vs. simulated flood depth at different levels in the Sta. Cruz River Basin..............................................................................................................................................127Table 94. Summary of accuracy assessment in the Sta. Cruz River Basin survey .................................. 127
LiDAR Surveys and Flood Mapping of Sta. Cruz River
vii
LIST OF FIGURESFigure 1. Map of the Sta. Cruz River Basin (in brown) ............................................................................... 3Figure 2. Flight plans and base stations for Sta. Cruz Floodplain .............................................................. 5Figure 3. GPS set-up over LAG-20 near the freedom park in UP Los Baños (a) and NAMRIA reference point LAG-20 (b) as recovered by the field team ............................................................. 6Figure 4. LAG-20A as established inside the UP Los Baños compound near LAG-20 ................................ 7Figure 5. GPS set-up over LAG-52 near the flag pole of Magdalena Municipal Hall (a) and NAMRIA reference point LAG-52 (b) as recovered by the field team ...................................................................... 8Figure 6. Actual LiDAR survey coverage for Sta. Cruz Floodplain ............................................................ 11Figure 7. Schematic diagram for Data Pre-Processing Component ......................................................... 13Figure 8. Smoothed Performance Metric Parameters of a Sta. Cruz Flight 3299P. .................................. 14Figure 9. Solution Status Parameters of Sta. Cruz Flight 3299P. .............................................................. 15Figure 10. Best estimated trajectory of LiDAR missions conducted over Sta. Cruz Floodplain ............... 16Figure 11. Boundary of the processed LiDAR data over Sta. Cruz Floodplain ......................................... 17Figure 12. Image of data overlap for Sta. Cruz Floodplain ....................................................................... 18Figure 13. Pulse density map of merged LiDAR data for Sta. Cruz Floodplain ......................................... 19Figure 14. Elevation difference map between flight lines for Sta. Cruz Floodplain ................................. 20Figure 15. Quality checking for a Sta. Cruz flight 3299P using the Profile Tool of QT Modeler ............... 21Figure 16. Tiles for Sta. Cruz Floodplain (a) and classification results (b) in TerraScan ........................... 22Figure 17. Point cloud before (a) and after (b) classification ................................................................... 22Figure 18. The production of last return DSM (a) and DTM (b); first return DSM (c) and secondary DTM (d) in some portion of Sta. Cruz Floodplain ........................................................................... 23Figure 19. Sta. Cruz Floodplain with available orthophotographs ........................................................... 24Figure 20. Sample orthophotograph tiles for Sta. Cruz Floodplain ......................................................... 24Figure 21. Portions in the DTM of Sta. Cruz Floodplain—a bridge before (a) and after (b) manual editing; and a misclassified hill before (d) and after (e) manual editing ........................................ 25Figure 22. Map of processed LiDAR data for Sta. Cruz Floodplain........................................................... 27Figure 23. Map of Sta. Cruz Floodplain with validation survey points in green ...................................... 29Figure 24. Correlation plot between calibration survey points and LiDAR data ...................................... 30Figure 25. Correlation plot between validation survey points and LiDAR data ....................................... 31Figure 26. Map of Sta. Cruz Floodplain with bathymetric survey points shown in blue. ........................ 32Figure 27. Extent of the bathymetric survey (in blue) in Sta. Cruz River and the LiDAR validation survey (in red) ............................................................................................................... 33Figure 28. GNSS network of Sta. Cruz River field survey ......................................................................... 34Figure 29. GNSS receiver set-up, Trimble® SPS 985 at LAG-52 in the Municipality of Magdalena, Laguna ........................................................................................................................ 35Figure 30. GNSS receiver set-up, Trimble® SPS 882 at LA-204 in the Municipality of Lumban, Laguna ........................................................................................................................................... 36Figure 31. GNSS base receiver set-up, Trimble® SPS 852 at RB-1, located at the roof top of Asia Blooms Hotel, Brgy. Patimbao, Sta. Cruz, Laguna .......................................................................... 36Figure 32. GNSS base receiver set-up, Trimble® SPS 852 at UP-SCB-1, San Cristobal Bridge in Calamba City, Laguna ..................................................................................................................... 37Figure 33. Validation points acquisition set-up for Sta. Cruz River Basin ................................................ 40Figure 34. Validation points acquisition survey covering the length of Sta, Cruz River Basin ................. 41Figure 35. Bathymetric survey with echo sounder in Sta, Cruz River ...................................................... 42Figure 36. Manual Bathymetric survey in Sta. Cruz River ........................................................................ 42Figure 37. Bathymetric survey coverage of Sta. Cruz River ..................................................................... 43Figure 38. Riverbed profile of Sta. Cruz River .......................................................................................... 43Figure 39. Location map of Sta. Cruz HEC-HMS model used for calibration ............................................ 45Figure 40. Cross-section plot of Pagsawitan Bridge ................................................................................. 46Figure 41. Rating Curve at Pagsawitan Bridge, Laguna ............................................................................ 46Figure 42. Rainfall and outflow data at Sta. Cruz used for modeling ....................................................... 47Figure 43. Location of Tayabas RIDF Station relative to Sta. Cruz River Basin ......................................... 48Figure 44. Synthetic storm generated for a 24-hour period rainfall for various return periods .............. 48Figure 45. Soil map of the Sta. Cruz River Basin used for the estimation of the CN parameter (Source: DA-BSWM) ....................................................................................................................... 49Figure 46. Land cover map of the Sta. Cruz River Basin used for the estimation of the CN and watershed lag parameters of the rainfall-runoff model (Source: NAMRIA) .................................. 50Figure 47. Stream delineation map of the Sta. Cruz River Basin ............................................................. 51Figure 48. Sta. Cruz River Basin model generated using HEC-HMS ......................................................... 52Figure 49. River cross-section of Sta. Cruz River generated through Arcmap HEC GeoRAS tool ............. 52Figure 50. Screenshot of subcatchment with the computational area to be modeled in

Hazard Mapping of the Philippines Using LIDAR (Phil-LIDAR 1)
viii
FLO-2D GDS Pro ............................................................................................................................. 53Figure 51. Outflow hydrograph of Sta. Cruz produced by the HEC-HMS model compared with observed outflow ................................................................................................................... 54Figure 52. Outflow hydrograph at Sta. Cruz Station generated using Tayabas RIDF simulated in HEC-HMS .................................................................................................................................... 55Figure 53. Sta. Cruz–Pagsanjan River generated discharge using 5-, 25-, and 100-year Tayabas City RIDF in HEC-HMS ..................................................................................................................... 56Figure 54. Sta. Cruz HEC-RAS Output ...................................................................................................... 57Figure 55. 100-year flood hazard map for Sta. Cruz Floodplain .............................................................. 59Figure 56. 100-year flow depth map for Sta. Cruz Floodplain ................................................................. 59Figure 57. 25-year flood hazard map for Sta. Cruz Floodplain ................................................................ 60Figure 58. 25-year Flow Depth Map for Sta. Cruz Floodplain .................................................................. 60Figure 59. 5-year flood hazard map for Sta. Cruz Floodplain .................................................................. 61Figure 60. 5-year flow depth map for Sta. Cruz Floodplain ..................................................................... 61Figure 61. Affected areas in Calauan, Laguna during a 5-year rainfall return period .............................. 62Figure 62. Affected areas in Cavinti, Laguna during a 5-year rainfall return period ................................ 63Figure 63. Affected areas in Laguna Lake, Laguna during a 5-year rainfall return period ....................... 64Figure 64. Affected areas in Liliw, Laguna during a 5-year rainfall return period .................................... 65Figure 65. Affected areas in Luisiana, Laguna during a 5-year rainfall return period .............................. 66Figure 66. Affected areas in Lumban, Laguna during a 5-year rainfall return period .............................. 68Figure 67. Affected areas in Lumban, Laguna during a 5-year rainfall return period .............................. 70Figure 68. Affected areas in Majayjay, Laguna during a 5-year rainfall return period ............................. 71Figure 69. Affected areas in Nagcarlan, Laguna during a 5-year rainfall return period ........................... 73Figure 70. Affected areas in Pagsanjan, Laguna during a 5-year rainfall return period ........................... 75Figure 71. Affected areas in Pila, Laguna during a 5-year rainfall return period ..................................... 77Figure 72. Affected areas in Sta. Cruz, Laguna during a 5-year rainfall return period ............................. 80Figure 73. Affected areas in Victoria, Laguna during a 5-year rainfall return period ............................... 82Figure 74. Affected areas in Calauan, Laguna during a 25-year rainfall return period ............................ 83Figure 75. Affected areas in Cavinti, Laguna during a 25-year rainfall return period .............................. 84Figure 76. Affected areas in Laguna Lake, Laguna during a 25-year rainfall return period ..................... 85Figure 77. Affected areas in Liliw, Laguna during a 25-year rainfall return period .................................. 86Figure 78. Affected areas in Luisiana, Laguna during a 25-year rainfall return period ............................ 87Figure 79. Affected areas in Lumban, Laguna during a 25-year rainfall return period ............................ 89Figure 80. Affected areas in Magdalena, Laguna during a 25-year rainfall return period ....................... 91Figure 81. Affected areas in Majayjay, Laguna during a 25-year rainfall return period ........................... 92Figure 82. Affected areas in Nagcarlan, Laguna during a 25-year rainfall return period ......................... 94Figure 83. Affected areas in Pagsanjan, Laguna during a 25-year rainfall return period ......................... 96Figure 84. Affected areas in Pila, Laguna during a 25-year rainfall return period ................................... 98Figure 85. Affected areas in Sta. Cruz, Laguna during a 25-year rainfall return period ......................... 101Figure 86. Affected areas in Victoria, Laguna during a 25-year rainfall return period ........................... 103Figure 87. Affected areas in Calauan, Laguna during a 100-year rainfall return period ........................ 104Figure 88. Affected areas in Cavinti, Laguna during a 100-year rainfall return period .......................... 105Figure 89. Affected areas in Laguna Lake, Laguna during a 100-year rainfall return period ................. 106Figure 90. Affected areas in Liliw, Laguna during a 100-year rainfall return period .............................. 107Figure 91. Affected areas in Luisiana, Laguna during a 100-year rainfall return period ........................ 108Figure 92. Affected areas in Lumban, Laguna during a 100-year rainfall return period ........................ 110Figure 93. Affected areas in Magdalena, Laguna during a 100-year rainfall return period ................... 113Figure 94. Affected areas in Majayjay, Laguna during a 100-year rainfall return period ....................... 114Figure 95. Affected areas in Nagcarlan, Laguna during a 100-year rainfall return period ..................... 116Figure 96. Affected areas in Pagsanjan, Laguna during a 100-year rainfall return period ..................... 118Figure 97. Affected areas in Pila, Laguna during a 100-year rainfall return period ............................... 120Figure 98. Affected areas in Sta. Cruz, Laguna during a 100-year rainfall return period ....................... 123Figure 99. Affected areas in Victoria, Laguna during a 100-year rainfall return period ......................... 125Figure 100. Validation points for 25-year flood depth map of Sta. Cruz Floodplain .............................. 126Figure 101. Flood map depth vs. actual flood depth ............................................................................. 127

LiDAR Surveys and Flood Mapping of Sta. Cruz River
ix
AAC Asian Aerospace CorporationAb abutmentALTM Airborne LiDAR Terrain MapperARG automatic rain gaugeATQ AntiqueAWLS Automated Water Level SensorBA Bridge ApproachBM benchmarkCAD Computer-Aided DesignCN Curve NumberCSRS Chief Science Research SpecialistDAC Data Acquisition ComponentDEM Digital Elevation ModelDENR Department of Environment and
Natural ResourcesDOST Department of Science and Tech-
nologyDPPC Data Pre-Processing ComponentDREAM Disaster Risk and Exposure Assess-
ment for Mitigation [Program]DRRM Disaster Risk Reduction and Man-
agementDSM Digital Surface ModelDTM Digital Terrain ModelDVBC Data Validation and Bathymetry
ComponentFMC Flood Modeling ComponentFOV Field of ViewGiA Grants-in-AidGCP Ground Control PointGNSS Global Navigation Satellite SystemGPS Global Positioning SystemHEC-HMS Hydrologic Engineering Center -
Hydrologic Modeling SystemHEC-RAS Hydrologic Engineering Center -
River Analysis SystemHC High ChordIDW Inverse Distance Weighted [inter-
polation method]IMU Inertial Measurement Unitkts knotsLAS LiDAR Data Exchange File formatLC Low ChordLGU local government unitLiDAR Light Detection and RangingLMS LiDAR Mapping Suitem AGL meters Above Ground Level
LIST OF ACRONYMS AND ABBREVIATIONSMMS Mobile Mapping SuiteMSL mean sea levelNAMRIA National Mapping and Resource
Information AuthorityNSTC Northern Subtropical ConvergencePAF Philippine Air ForcePAGASA Philippine Atmospheric Geophys-
ical and Astronomical Services Administration
PDOP Positional Dilution of PrecisionPPK Post-Processed Kinematic [tech-
nique]PRF Pulse Repetition FrequencyPTM Philippine Transverse MercatorQC Quality CheckQT Quick Terrain [Modeler]RA Research AssociateRIDF Rainfall-Intensity-Duration-Fre-
quencyRMSE Root Mean Square ErrorSAR Synthetic Aperture RadarSCS Soil Conservation ServiceSRTM Shuttle Radar Topography MissionSRS Science Research SpecialistSSG Special Service GroupTBC Thermal Barrier CoatingsUPLB University of the Philippines Los
BañosUP-TCAGP University of the Philippines –
Training Center for Applied Geode-sy and Photogrammetry
UTM Universal Transverse MercatorWGS World Geodetic SystemUP-TCAGP University of the Philippines –
Training Center for Applied Geode-sy and Photogrammetry
UTM Universal Transverse MercatorWGS World Geodetic System

Hazard Mapping of the Philippines Using LIDAR (Phil-LIDAR 1)
x

LiDAR Surveys and Flood Mapping of Sta. Cruz River
1
CHAPTER 1: OVERVIEW OF THE PROGRAM AND STA. CRUZ RIVER
Enrico C. Paringit, Dr. Eng., Asst. Prof. Edwin R. Abucay, and and Ms. Mia D. Queliste
1.1 Background of the Phil-LIDAR 1 Program
The University of the Philippines Training Center for Applied Geodesy and Photogrammetry (UP-TCAGP) launched a research program in 2014 entitled “Nationwide Hazard Mapping using LiDAR” or Phil-LiDAR 1, supported by the Department of Science and Technology (DOST) Grant-in-Aid (GiA) Program. The pro-gram was primarily aimed at acquiring a national elevation and resource dataset at sufficient resolution to produce information necessary to support the different phases of disaster management. Particularly, it targeted to operationalize the development of flood hazard models that would produce updated and detailed flood hazard maps for the major river systems in the country.
The program was also aimed at producing an up-to-date and detailed national elevation dataset suitable for 1:5,000 scale mapping, with 50 cm and 20 cm horizontal and vertical accuracies, respectively. These accuracies were achieved through the use of the state-of-the-art Light Detection and Ranging (LiDAR) airborne technology procured by the project through DOST. The methods applied in this report are thor-oughly described in a separate publication titled Flood Mapping of Rivers in the Philippines Using Airborne LiDAR: Methods (Paringit et al., 2017).
The implementing partner university for the Phil-LiDAR 1 Program is the University of the Philippines Los Baños (UPLB). UPLB is in charge of processing LiDAR data and conducting data validation reconnaissance, cross section, bathymetric survey, validation, river flow measurements, flood height and extent data gath-ering, flood modeling, and flood map generation for the 45 river basins in the MIMAROPA. The university is located in the Municipality of Los Baños in the province of Laguna.
1.2 Overview of the Sta. Cruz River Basin
Sta. Cruz River Basin is a 15,050-hectare watershed located in the municipality of Sta. Cruz, Laguna. It is sit-uated in the south-eastern side of Laguna Lake and has a drainage area of 128 km2 with an estimated run-off of 120 MCM. It covers the municipalities of Calauan, Liliw, Lumban, Magdalena, Majayjay, Nagcarlan, Pagsanjan, Pila, Rizal, San Pablo City, and Sta. Cruz in Laguna; and Candelaria, Dolores, Lucban, Sariaya, and Tayabas in Quezon. The basin area has two geological classifications with Pliocene-Quaternary as the most dominant type while others are Recent. The river basin is generally characterized by 3–8% slope and ele-vation of more than 2,200 meters above mean sea level. The river basin has different soil types dominated by Lipa loam. Other soils include Marikina silt loam, Marikina silty clay loam, Luisiana clay loam, Macolod clay loam, and Calumpang clay. Other areas are still unclassified (mountain soils). Coconut plantation is predominant in the area followed by built-up area, cultivated area mixed with brushland/grassland, closed canopy, open canopy, arable land with crops mainly cereals and sugar, crop land mixed with coconut plan-tations, lake and marshy area, and swamp. Aquaculture is also present along coastal communities.
Its main stem, Sta. Cruz River, is one of the main tributaries of the Sta. Cruz River Basin. The river is con-nected to a larger stream network which connects itself to the Pila River in the municipality of Pila. The Sta. Cruz River is measured to be approximately 14.48 km in length, flowing towards Laguna Lake. Sta. Cruz River passes through the municipalities of Liliw, Magdalena, Nagcarlan, Pagsanjan, Pila, and Sta. Cruz leading down to the Laguna de Bay. There are a total of 36,739 people living within the immediate vicinity of the river according to the 2010 census conducted by NSO. Moreover, based on the 2010 NSO Census of Population and Housing, Santisima Cruz in Sta. Cruz is the most populated barangay in the area.
Climate Type I and III prevails in MIMAROPA and Laguna based on the Modified Corona Classification of climate. Type I has two pronounced seasons, dry from November to April, and wet the rest of the year with maximum rain period from June to September. On the other hand, Type III has no very pronounced maximum rain period and with short dry season lasting only from one to three months, during the period from December to February or from March to May.

Hazard Mapping of the Philippines Using LIDAR (Phil-LIDAR 1)
2
According to Mines and Geosciences Bureau (MGB), the Sta. Cruz River Basin was generally classified to be highly susceptible to flooding, and a combination of low and high risk when it comes to landslide sus-ceptibility. As stated in the Ecological Profile of Laguna (2011), most municipalities in the 2nd, 3rd and 4th districts of the province are affected by flood hazards and rain-induced to landslide hazard as assessed by the Office of Civil Defence (OCD), DENR-Mines Geosciences Bureau, and NAMRIA. On the other hand, municipalities including Calauan, Cavinti, Lumban, Mabitac, Nagcarlan, Paete, Rizal, Siniloan and Sta. Ma-ria are susceptible to soil and river bank erosion. Meanwhile, the municipalities of Bay, Biñan, Cabuyao, Calamba, Famy , Kalayaan, Los Baños, Lumban, Paete, Pagsanjan, Pakil, Pangil, Mabitac, San Pedro, Sta. Cruz, Sta. Rosa, Sta. Maria, Siniloan, and Victoria are prone to liquefaction. Moreover, municipalities of San Pedro and Calamba are also prone to highly ground rupture hazard.
The field surveys conducted by the PHIL-LiDAR 1 validation team found that several weather disturbances caused flooding in 2006 (Milenyo), 2009 (Ondoy and Santi), 2013 (Yolanda), and 2014 (Glenda). Heavy rains brought by southwest monsoon in 2012 also caused flooding affecting several barangays in Sta. Cruz (San Pablo Norte, Sto. Angel Norte) and Lumba (Wawa).

LiDAR Surveys and Flood Mapping of Sta. Cruz River
3
Figure 1. Map of the Sta. Cruz River Basin (in brown)

Hazard Mapping of the Philippines Using LIDAR (Phil-LIDAR 1)
4
CHAPTER 2: LIDAR ACQUISITION IN STA. CRUZ FLOODPLAIN
Engr. Louie P. Balicanta, Engr. Christopher Cruz, Lovely Gracia Acuña, Engr. Gerome Hipolito, Engr. Grace B. Sinadjan, Engr. Millie Shane R. Reyes
The methods applied in this chapter were based on the DREAM methods manual (Sarmiento et al., 2014) and further enhanced and updated in Paringit et al. (2017).
2.1 Flight Plans
Plans were made to acquire LiDAR data within the delineated priority area for Sta. Cruz Floodplain in Cavite. These missions were planned for 6 lines that run for at most three (3) hours including take-off, land-ing, and turning time. The flight planning parameters for Pegasus LiDAR system is found in Table 1. Figure 2 shows the flight plan for Sta. Cruz Floodplain survey.
Table 1. Flight planning parameters for Pegasus LiDAR system
Block NameFlying
Height (m AGL)
Overlap(%)
Field of View(θ)
Pulse Repetition Frequency
(PRF) (kHz)
Scan Frequency
(Hz)
Average Speed (kts)
Average Turn Time (Minutes)
BLK18 H 1200 20 50 200 50 130 5
BLK18 I 1000 30 50 200 50 130 5
BLK18 J 1000 30 50 200 50 130 5
BLK18 K 1000 30 50 200 50 130 5

LiDAR Surveys and Flood Mapping of Sta. Cruz River
5
Figure 2. Flight plans and base stations for Sta. Cruz Floodplain
Hazard Mapping of the Philippines Using LIDAR (Phil-LIDAR 1)
6
2.2 Ground Base Station
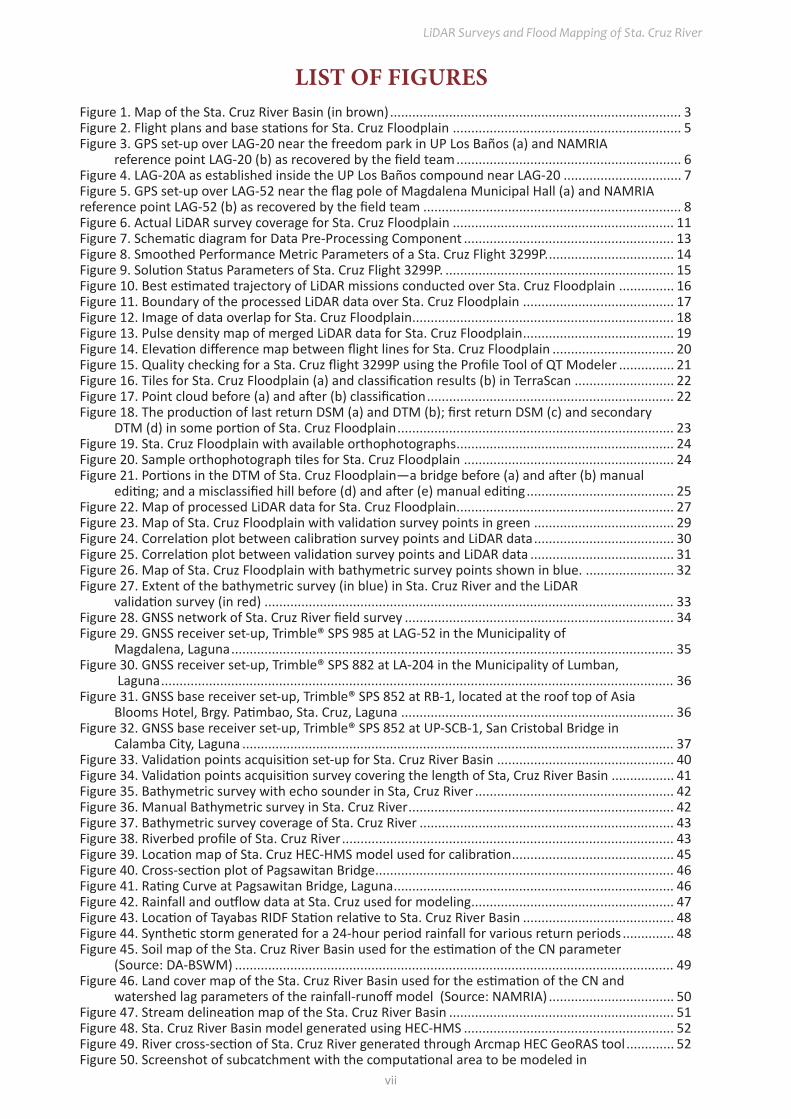
The project team was able to recover two (2) NAMRIA ground control points: LAG-52 which is of second (2nd)-order accuracy and LAG-20 which is of third (3rd)-order accuracy. The project team also established two (2) ground control points: LAG-20A and LAG-52A. The certifications for the base stations are found in ANNEX 2 while the baseline processing reports for the established points are found in ANNEX 3. These points were used as base stations during flight operations for the entire duration of the survey (February 4–8, 2014 and August 15, 2015). Base stations were observed using dual frequency GPS receivers, TRIM-BLE SPS 852 and TRIMBLE SPS 882. Flight plans and location of base stations used during the aerial LiDAR acquisition in Sta. Cruz Floodplain are shown in Figure 2.
Figure 3 to Figure 5 show the recovered NAMRIA reference points and established points within the area. In addition, Table 2 to Table 5 present the details about the NAMRIA control stations while Table 6 shows the list of all ground control points occupied during the acquisition together with the dates they were utilized during the survey.
Figure 3. GPS set-up over LAG-20 near the freedom park in UP Los Baños (a) and NAMRIA reference point LAG-20 (b) as recovered by the field team
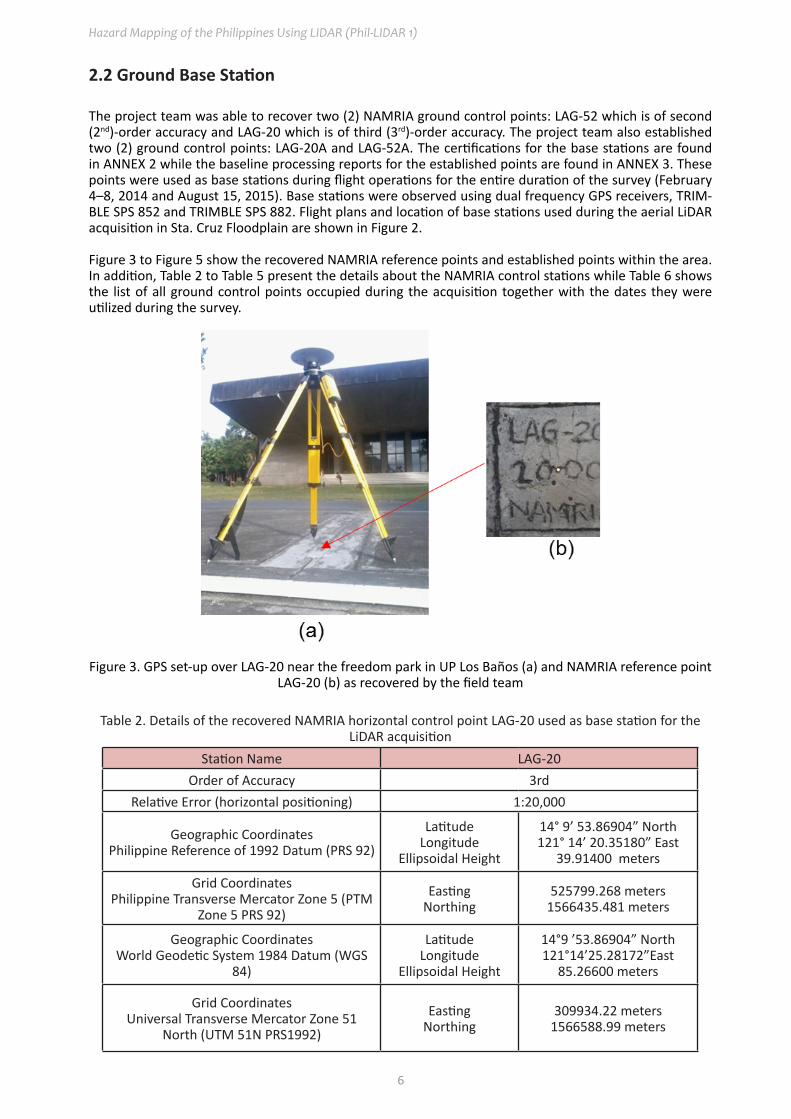
Table 2. Details of the recovered NAMRIA horizontal control point LAG-20 used as base station for the LiDAR acquisition
Station Name LAG-20Order of Accuracy 3rd
Relative Error (horizontal positioning) 1:20,000
Geographic CoordinatesPhilippine Reference of 1992 Datum (PRS 92)
LatitudeLongitude
Ellipsoidal Height
14° 9’ 53.86904” North121° 14’ 20.35180” East
39.91400 meters
Grid CoordinatesPhilippine Transverse Mercator Zone 5 (PTM
Zone 5 PRS 92)
EastingNorthing
525799.268 meters1566435.481 meters
Geographic CoordinatesWorld Geodetic System 1984 Datum (WGS
84)
LatitudeLongitude
Ellipsoidal Height
14°9 ’53.86904” North121°14’25.28172”East
85.26600 meters
Grid CoordinatesUniversal Transverse Mercator Zone 51
North (UTM 51N PRS1992)
EastingNorthing
309934.22 meters1566588.99 meters

LiDAR Surveys and Flood Mapping of Sta. Cruz River
7
Figure 4. LAG-20A as established inside the UP Los Baños compound near LAG-20
Table 3. Details of the established horizontal control point LAG-20A with processed coordinates used as base station for the LiDAR acquisition
Station Name LAG-20AOrder of Accuracy 2nd
Relative Error (horizontal positioning) 1:50,000
Geographic CoordinatesPhilippine Reference of 1992 Datum (PRS 92)
LatitudeLongitude
Ellipsoidal Height
14° 9’ 53.86904” North120° 24’ 5.41918” East
35.63300 metersGrid Coordinates
Philippine Transverse Mercator Zone 3 (PTM Zone 3 PRS 92)
EastingNorthing
436193.115 meters1854816.574 meters
Geographic CoordinatesWorld Geodetic System 1984 Datum (WGS
84)
LatitudeLongitude
Ellipsoidal Height
16° 46’ 8.39718” North120° 24’ 10.13252” East
71.25300 meters

Hazard Mapping of the Philippines Using LIDAR (Phil-LIDAR 1)
8
Figure 5. GPS set-up over LAG-52 near the flag pole of Magdalena Municipal Hall (a) and NAMRIA reference point LAG-52 (b) as recovered by the field team
Table 4. Details of the recovered NAMRIA horizontal control point LAG-52 used as base station for the LiDAR acquisition
Station Name LAG-52Order of Accuracy 2nd
Relative Error (horizontal positioning) 1 in 50,000
Geographic CoordinatesPhilippine Reference of 1992 Datum (PRS 92)
LatitudeLongitude
Ellipsoidal Height
14° 12’ 4.64805” North121° 25’ 41.33587” East
66.698 metersGrid Coordinates
Philippine Transverse Mercator Zone 3 (PTM Zone 3 PRS 92)
EastingNorthing
546212.761 meters1570483.553 meters
Geographic CoordinatesWorld Geodetic System 1984 Datum (WGS
84)
LatitudeLongitude
Ellipsoidal Height
14° 11’59.35842” North121° 25’ 46.26158” East
112.41 metersGrid Coordinates
Universal Transverse Mercator Zone 51 North (UTM 51N WGS 1984)
EastingNorthing
330382.29 meters1570462.41 meters
Table 5. Details of the recovered NAMRIA horizontal control point LAG-4415 used as base station for the LiDAR acquisition
Station Name LAG-4415Order of Accuracy 2nd
Relative Error (horizontal positioning) 1:50,000
Geographic CoordinatesPhilippine Reference of 1992 Datum (PRS 92)
LatitudeLongitude
Ellipsoidal Height
14° 12’ 05.34595” North121° 25’ 39.04510” East
65.12200 metersGrid Coordinates
Philippine Transverse Mercator Zone 3 (PTM Zone 3 PRS 92)
EastingNorthing
330313.757 meters1570484.318 meters

LiDAR Surveys and Flood Mapping of Sta. Cruz River
9
Geographic CoordinatesWorld Geodetic System 1984 Datum (WGS
84)
LatitudeLongitude
Ellipsoidal Height
14° 12’ 00.05622” North121° 25’ 43.97080” East
110.83200 meters
Table 6. Ground control points used during LiDAR Data acquisition
Date Surveyed Flight Number Mission Name Ground Control Points
February 4, 2014 1067P 1BLK18H035A LAG-20 and LAG-20A
February 5, 2014 1071P 1BLK18I036A LAG-20 and LAG-20A
February 8, 2014 1083P 1BLK18J39A LAG-52
August 15, 2015 3299P 1BLK18KS227A LAG-52 and LAG-4415
2.3 Flight Missions
Four (4) missions were conducted to complete the LiDAR data acquisition in Sta. Cruz Floodplain, for a total of eleven hours and forty six minutes (11+46) of flying time for RP-C9022. All missions were acquired using the Pegasus LiDAR system. Table 7 shows the total area of actual coverage and the corresponding flying hours per mission, while Table 8 presents the actual parameters used during the LiDAR data acquisition.
Table 7. Flight missions for LiDAR data acquisition in Sta. Cruz Floodplain
Date Surveyed
Flight Number
Flight Plan Area
(km2)
Surveyed Area
(km2)
Area Surveyed
within the Floodplain
(km2)
Area Surveyed
Outside the Floodplain
(km2)
No. of Images
(Frames)
Flying Hours
Hr
Min
February 4, 2014 1067P 213.3 108.53 9.73 98.80 221 2 55
February 5, 2014 1071P 213.3 190.64 24.49 166.15 311 2 47
February 8, 2014 1083P 223.1 139.63 0.48 139.15 372 3 29
August 15, 2015 3299P 84.54 84.53 9.56 74.97 NA 2 35
TOTAL 734.24 523.33 44.26 479.07 904 11 46
Table 8. Actual parameters used during LiDAR data acquisition
Date Surveyed Flight Number
Flying Height
(AGL) (m)
Overlap (%)
Field of View
Scan Frequency
(kHz)
Speed of Plane (Kts)
February 4, 2014 1067P 1200 20 50 30 130February 5, 2014 1071P 1000 30 50 30 130February 8, 2014 1083P 1000 30 50 30 130August 15, 2015 3299P 1000 30 50 30 130
2.4 Survey Coverage
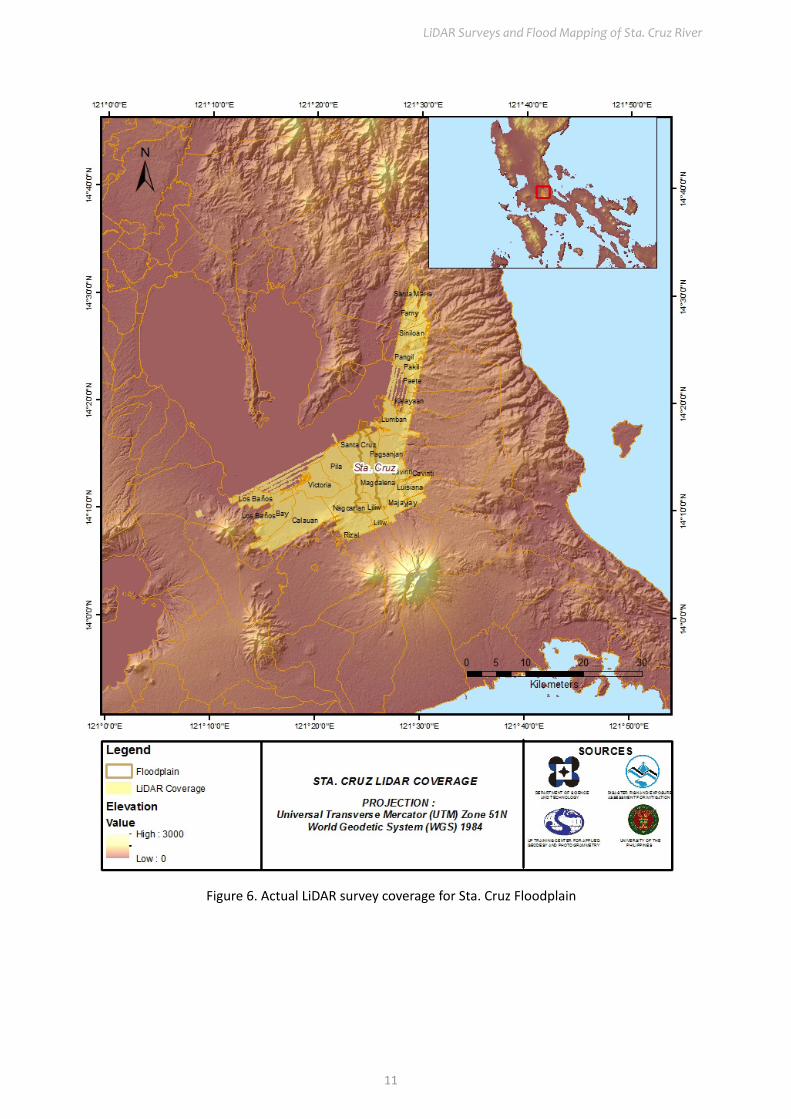
Sta. Cruz Floodplain is situated within the municipalities in Laguna. The municipalities of Magdalena, Pila, and Victoria are mostly covered during the survey. The list of municipalities and cities surveyed, with at

Hazard Mapping of the Philippines Using LIDAR (Phil-LIDAR 1)
10
least one (1) square kilometer coverage, is shown in Table 9. The actual coverage of the LiDAR acquisition for Sta. Cruz Floodplain is presented in Figure 6.
Table 9. List of municipalities/cities surveyed during Sta. Cruz Floodplain LiDAR survey
Province Municipality/City
Area of Municipality/
City(km2)
Total Area Surveyed
(km2)Percentage of Area Surveyed
Laguna
Magdalena 29.61 29.49 99.57%Pila 28.77 28.41 98.72%
Victoria 28.37 27.41 96.62%Sta. Cruz 37.63 33.15 88.10%
Pagsanjan 40.773 32.86 80.60%Bay 40.80 29.35 71.94%
Calauan 79.44 53.81 67.74%Nagcarlan 81.20 49.01 60.36%Sinoloan 26.18 14.82 56.62%
Famy 33.43 18.25 54.60%Pangil 35.64 17.58 49.34%Liliw 36.20 14.47 39.97%
Los Baños 50.48 18.08 35.82%Luisiana 61.00 16.96 27.80%Majayjay 64.40 16.44 25.53%Lumban 117.34 25.27 21.54%
Pakil 30.02 6.10 20.32%Kalayaan 52.63 5.49 10.42%
Rizal 24.02 1.95 8.11%Paete 78.9 5.74 7.27%
Santa Maria 137.35 5.21 3.79%Cavinti 96.78 1.83 1.89%
Total 1210.96 451.68 37.30%
LiDAR Surveys and Flood Mapping of Sta. Cruz River
11
Figure 6. Actual LiDAR survey coverage for Sta. Cruz Floodplain

Hazard Mapping of the Philippines Using LIDAR (Phil-LIDAR 1)
12
CHAPTER 3: LIDAR DATA PROCESSING FOR STA. CRUZ FLOODPLAIN
Engr. Ma. Rosario Concepcion O. Ang, Engr. John Louie D. Fabila, Engr. Sarah Jane D. Samalburo, Engr. Harmond F. Santos, Engr. Angelo Carlo B. Bongat, Engr. Ma. Ailyn L. Olanda,Engr. Antonio B. Chua Jr., Marie Denise V. Bueno, Engr. Regis R. Guhiting, Engr. Merven Matthew D. Natino, Gillian Katherine L.
Inciong, Gemmalyn E. Magnaye, Leendel Jane D. Punzalan, Sarah Joy A. Acepcion, Ivan Marc H. Escamos, Allen Roy C. Roberto, and Jan Martin C. Magcale
The methods applied in this chapter were based on the DREAM methods manual (Ang et al., 2014) and further enhanced and updated in Paringit et al. (2017).
3.1 Overview of the LiDAR Data Pre-Processing
The data transmitted by the Data Acquisition Component (DAC) were checked for completeness based on the list of raw files required to proceed with the pre-processing of the LiDAR data. Upon acceptance of the LiDAR field data, georeferencing of the flight trajectory was done in order to obtain the exact location of the LiDAR sensor when the laser was shot. Point cloud georectification was performed to incorporate correct position and orientation for each point acquired. The georectified LiDAR point clouds were subject for quality checking to ensure that the required accuracies of the program, which were the minimum point density, vertical and horizontal accuracies, were met. The point clouds were then classified into various classes before generating Digital Elevation Models such as Digital Terrain Model and Digital Surface Model.
Using the elevation of points gathered in the field, the LiDAR-derived digital models were calibrated. Por-tions of the river that were barely penetrated by the LiDAR system were replaced by the actual river geometry measured from the field by the Data Validation and Bathymetry Component. LiDAR acquired temporally were then mosaicked to completely cover the target river systems in the Philippines. Orth-orectification of images acquired simultaneously with the LiDAR data was done through the help of the georectified point clouds and the metadata containing the time the image was captured.
These processes are summarized in the flowchart shown in Figure 7.

LiDAR Surveys and Flood Mapping of Sta. Cruz River
13
Figure 7. Schematic diagram for Data Pre-Processing Component
3.2 Transmittal of Acquired LiDAR Data
Data transfer sheets for all the LiDAR missions for Sta. Cruz Floodplain can be found in ANNEX 5. Mis-sions flown during the first survey conducted on February 2014 used the Airborne LiDAR Terrain Mapper (ALTM™ Optech Inc.) Pegasus system. The missions acquired during the second survey on September 2015 were flown using the same system over Sta. Cruz, Laguna. The Data Acquisition Component transferred a total of 67.28 Gigabytes of Range data, 862.7 Megabytes of POS data, 30.13 Megabytes of GPS base station data, and 50.29 Gigabytes of raw image data to the data server on February 20, 2014 for the first survey and September 7, 2015 for the second survey. The Data Pre-Processing Component (DPPC) verified the completeness of the transferred data. The whole dataset for Sta. Cruz was fully transferred on September 10, 2015, as indicated on the data transfer sheets for Sta. Cruz Floodplain.
3.3 Trajectory Computation
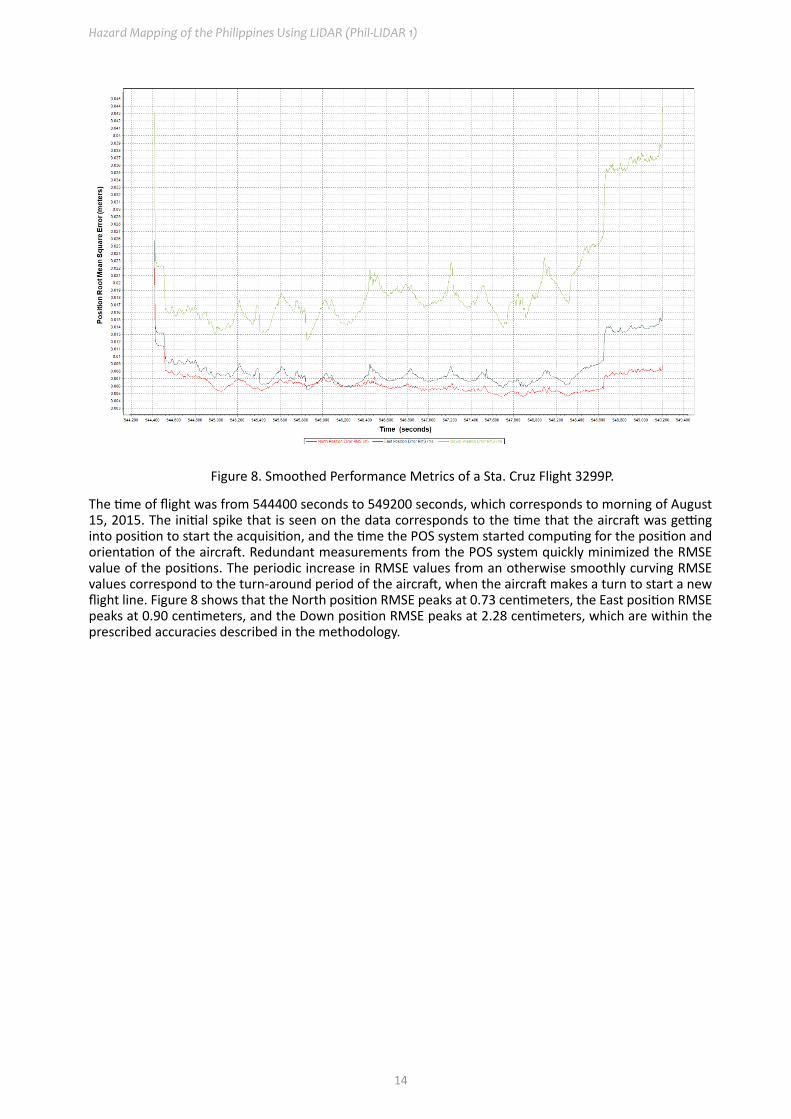
The Smoothed Performance Metrics of the computed trajectory for flight 3299P, one of the Sta. Cruz flights, which is the North, East, and Down position RMSE values are shown in Figure 8. The x-axis corre-sponds to the time of flight, which is measured by the number of seconds from the midnight of the start of the GPS week, which on that week fell on August 15, 2015 00:00AM. The y-axis is the RMSE value for that particular position.
Hazard Mapping of the Philippines Using LIDAR (Phil-LIDAR 1)
14
Figure 8. Smoothed Performance Metrics of a Sta. Cruz Flight 3299P.
The time of flight was from 544400 seconds to 549200 seconds, which corresponds to morning of August 15, 2015. The initial spike that is seen on the data corresponds to the time that the aircraft was getting into position to start the acquisition, and the time the POS system started computing for the position and orientation of the aircraft. Redundant measurements from the POS system quickly minimized the RMSE value of the positions. The periodic increase in RMSE values from an otherwise smoothly curving RMSE values correspond to the turn-around period of the aircraft, when the aircraft makes a turn to start a new flight line. Figure 8 shows that the North position RMSE peaks at 0.73 centimeters, the East position RMSE peaks at 0.90 centimeters, and the Down position RMSE peaks at 2.28 centimeters, which are within the prescribed accuracies described in the methodology.

LiDAR Surveys and Flood Mapping of Sta. Cruz River
15
Figure 9. Solution Status Parameters of Sta. Cruz Flight 3299P.
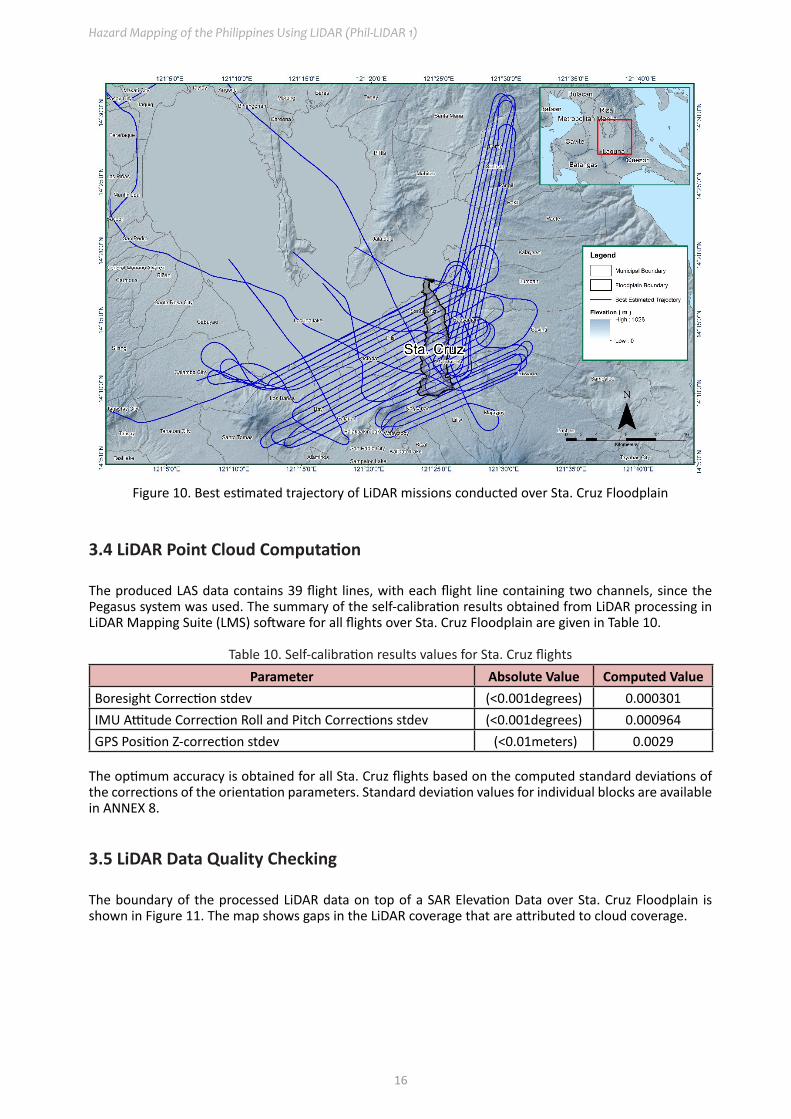
The Solution Status parameters of flight 3299P, one of the Sta. Cruz flights, which are the number of GPS satellites, Positional Dilution of Precision (PDOP), and the GPS processing mode used, are shown in Figure 9. The graphs indicate that the number of satellites during the acquisition did not go down to 6. Majority of the time, the number of satellites tracked was between 6 and 10. The PDOP value also did not go above the value of 3, which indicates optimal GPS geometry. The processing mode stayed at the value of 0 for majority of the survey with some peaks up to 1 attributed to the turns performed by the aircraft. The value of 0 corresponds to a Fixed, Narrow-Lane mode, which is the optimum carrier-cycle integer ambiguity res-olution technique available for POSPAC MMS. All of the parameters adhered to the accuracy requirements for optimal trajectory solutions, as indicated in the methodology. The computed best estimated trajectory for all Sta. Cruz flights is shown in Figure 10.
Hazard Mapping of the Philippines Using LIDAR (Phil-LIDAR 1)
16
Figure 10. Best estimated trajectory of LiDAR missions conducted over Sta. Cruz Floodplain
3.4 LiDAR Point Cloud Computation
The produced LAS data contains 39 flight lines, with each flight line containing two channels, since the Pegasus system was used. The summary of the self-calibration results obtained from LiDAR processing in LiDAR Mapping Suite (LMS) software for all flights over Sta. Cruz Floodplain are given in Table 10.
Table 10. Self-calibration results values for Sta. Cruz flightsParameter Absolute Value Computed Value
Boresight Correction stdev (<0.001degrees) 0.000301IMU Attitude Correction Roll and Pitch Corrections stdev (<0.001degrees) 0.000964GPS Position Z-correction stdev (<0.01meters) 0.0029
The optimum accuracy is obtained for all Sta. Cruz flights based on the computed standard deviations of the corrections of the orientation parameters. Standard deviation values for individual blocks are available in ANNEX 8.
3.5 LiDAR Data Quality Checking
The boundary of the processed LiDAR data on top of a SAR Elevation Data over Sta. Cruz Floodplain is shown in Figure 11. The map shows gaps in the LiDAR coverage that are attributed to cloud coverage.

LiDAR Surveys and Flood Mapping of Sta. Cruz River
17
Figure 11. Boundary of the processed LiDAR data over Sta. Cruz Floodplain
The total area covered by the Sta. Cruz missions is 512.62 sq km comprised of five (5) flight acquisitions grouped and merged into four (4) blocks as shown in Table 11.
Table 11. List of LiDAR blocks for Sta. Cruz FloodplainLiDAR Blocks Flight Numbers Area (sq km)
CALABARZON_Blk18I_supplement3299P
89.263377P
Laguna_Blk18H 1067P 102.25Laguna_Blk18J 1083P 133.00Cavite_Blk18I 1071P 188.11
TOTAL 512.62 sq km
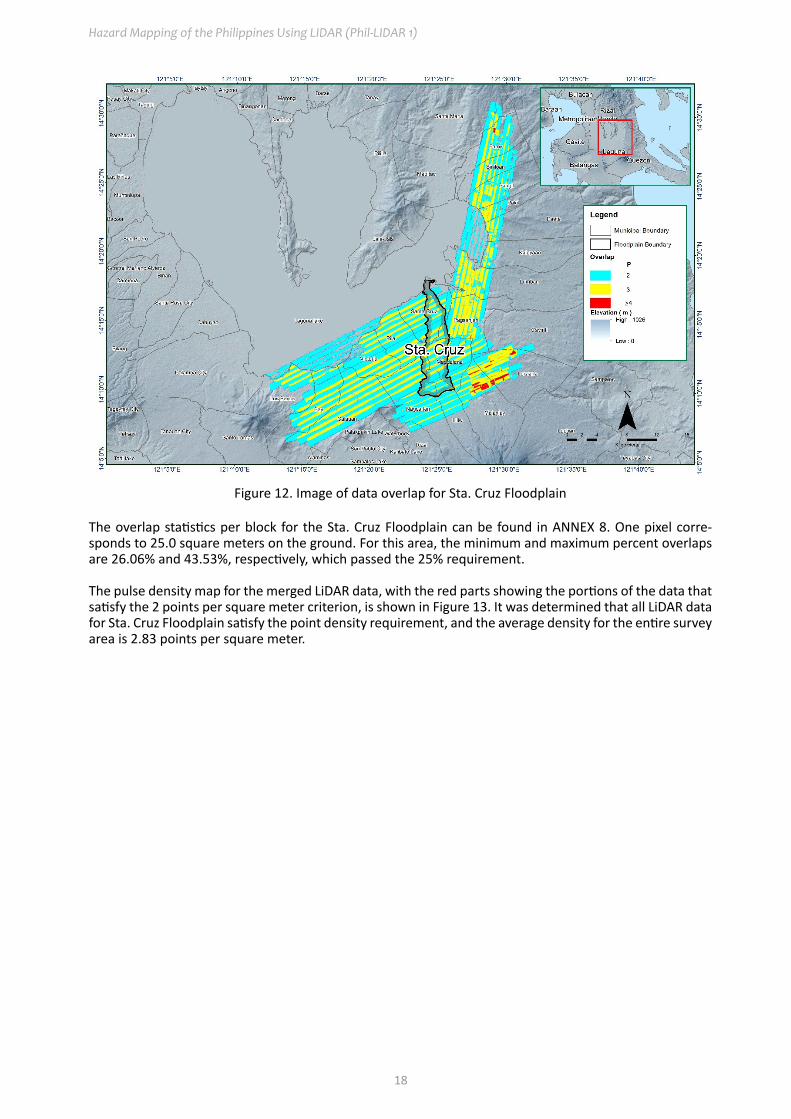
The overlap data for the merged LiDAR blocks, showing the number of channels that pass through a par-ticular location, is shown in Figure 12. Since the Pegasus system employs two channels, an average value of 2 (blue) would be expected for areas where there is limited overlap, and a value of 3 (yellow) or more (red) for areas with three or more overlapping flight lines.
Hazard Mapping of the Philippines Using LIDAR (Phil-LIDAR 1)
18
Figure 12. Image of data overlap for Sta. Cruz Floodplain
The overlap statistics per block for the Sta. Cruz Floodplain can be found in ANNEX 8. One pixel corre-sponds to 25.0 square meters on the ground. For this area, the minimum and maximum percent overlaps are 26.06% and 43.53%, respectively, which passed the 25% requirement.
The pulse density map for the merged LiDAR data, with the red parts showing the portions of the data that satisfy the 2 points per square meter criterion, is shown in Figure 13. It was determined that all LiDAR data for Sta. Cruz Floodplain satisfy the point density requirement, and the average density for the entire survey area is 2.83 points per square meter.

LiDAR Surveys and Flood Mapping of Sta. Cruz River
19
Figure 13. Pulse density map of merged LiDAR data for Sta. Cruz Floodplain
The elevation difference between overlaps of adjacent flight lines is shown in Figure 14. The default color range is from blue to red, where bright blue areas correspond to portions where elevations of a previous flight line, identified by its acquisition time, are higher by more than 0.20 m relative to elevations of its adjacent flight line. Bright red areas indicate portions where elevations of a previous flight line are lower by more than 0.20 m relative to elevations of its adjacent flight line. Areas with bright red or bright blue need to be investigated further using Quick Terrain Modeler software.

Hazard Mapping of the Philippines Using LIDAR (Phil-LIDAR 1)
20
Figure 14. Elevation difference map between flight lines for Sta. Cruz Floodplain
A screen capture of the processed LAS data from a Sta. Cruz flight 3299P loaded in QT Modeler is shown in Figure 15. The upper left image shows the elevations of the points from two overlapping flight strips traversed by the profile, illustrated by a dashed yellow line. The x-axis corresponds to the length of the profile. It is evident that there are differences in elevation, but the differences do not exceed the 20-cen-timeter mark. This profiling was repeated until the quality of the LiDAR data becomes satisfactory. No reprocessing was done for this LiDAR dataset.

LiDAR Surveys and Flood Mapping of Sta. Cruz River
21
Figure 15. Quality checking for a Sta. Cruz flight 3299P using the Profile Tool of QT Modeler
3.6 LiDAR Point Cloud Classification and Rasterization
Table 12. Sta. Cruz classification results in TerraScanPertinent Class Total Number of Points
Ground 414,922,423Low Vegetation 362,470,450
Medium Vegetation 464,323,716High Vegetation 771,958,524
Building 55,010,794
The tile system that TerraScan employed for the LiDAR data and the final classification image for a block in Sta. Cruz Floodplain is shown in Figure 16. A total of 728 1 km by 1 km tiles were produced. The number of points classified to the pertinent categories is illustrated in Table 12. The point cloud has a maximum and minimum height of 978.05 meters and 37.58, respectively.
Hazard Mapping of the Philippines Using LIDAR (Phil-LIDAR 1)
22
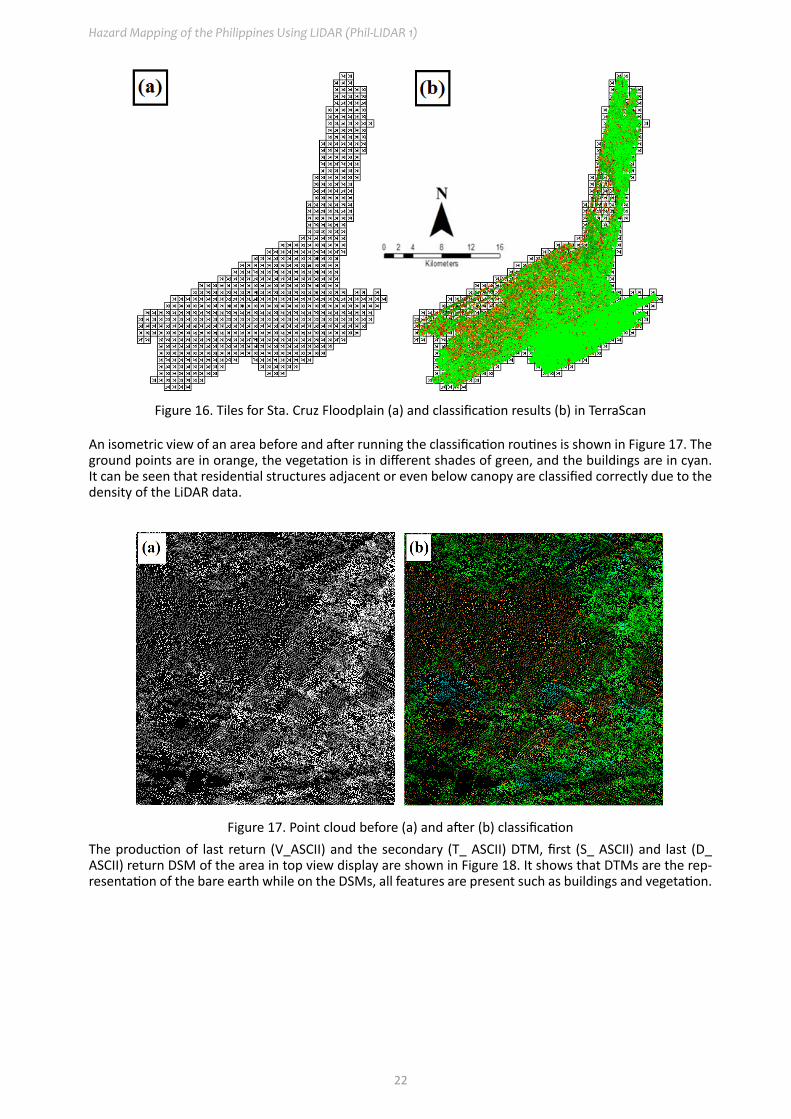
Figure 16. Tiles for Sta. Cruz Floodplain (a) and classification results (b) in TerraScan
An isometric view of an area before and after running the classification routines is shown in Figure 17. The ground points are in orange, the vegetation is in different shades of green, and the buildings are in cyan. It can be seen that residential structures adjacent or even below canopy are classified correctly due to the density of the LiDAR data.
Figure 17. Point cloud before (a) and after (b) classificationThe production of last return (V_ASCII) and the secondary (T_ ASCII) DTM, first (S_ ASCII) and last (D_ ASCII) return DSM of the area in top view display are shown in Figure 18. It shows that DTMs are the rep-resentation of the bare earth while on the DSMs, all features are present such as buildings and vegetation.

LiDAR Surveys and Flood Mapping of Sta. Cruz River
23
Figure 18. The production of last return DSM (a) and DTM (b); first return DSM (c) and secondary DTM (d) in some portion of Sta. Cruz Floodplain
3.7 LiDAR Image Processing and Orthophotograph Rectification
The 333 1 km by 1 km tiles area covered by Sta. Cruz Floodplain is shown in Figure 19. After tie-point se-lection to fix photo misalignments, color points were added to smoothen out visual inconsistencies along the seamlines where photos overlap. The Sta. Cruz Floodplain attained a total of 229.19 sq km in ortho-photogaph coverage comprised of 566 images. A zoomed in version of sample orthophotographs named in reference to its tile number is shown in Figure 20.

Hazard Mapping of the Philippines Using LIDAR (Phil-LIDAR 1)
24
Figure 19. Sta. Cruz Floodplain with available orthophotographs
Figure 20. Sample orthophotograph tiles for Sta. Cruz Floodplain
3.8 DEM Editing and Hydro-CorrectionFour (4) mission blocks were processed for Sta. Cruz Floodplain. These blocks are composed of Calabarzon, Laguna, and Cavite blocks with a total area of 512.62 square kilometers. Table 13 shows the name and corresponding area of each block in square kilometers.

LiDAR Surveys and Flood Mapping of Sta. Cruz River
25
Table 13. LiDAR blocks with their corresponding areaLiDAR Blocks Area (sq km)
CALABARZON_18I_supplement 89.26Laguna_Blk18H 102.25Laguna_Blk18J 133Cavite_Blk18I 188.11
TOTAL 512.62 sq km
Portions of DTM before and after manual editing are shown in Figure 21. The bridge (Figure 21a) was considered to be an impedance to the flow of water along the river and had to be removed (Figure 21b) in order to hydrologically correct the river. A portion of hill also (Figure 21c) had been misclassified and needed to be retrieved to retain the correct terrain (Figure 21d). Object retrieval used the secondary DTM (t_layer) to fill in these areas.
Figure 21. Portions in the DTM of Sta. Cruz Floodplain—a bridge before (a) and after (b) manual editing; and a misclassified hill before (d) and after (e) manual editing
3.9 Mosaicking of BlocksNo assumed reference block was used in mosaicking because the identified reference for shifting was an existing calibrated Calabarzon DEM overlapping with the blocks to be mosaicked. Table 14 shows the shift values applied to each LiDAR block during mosaicking.
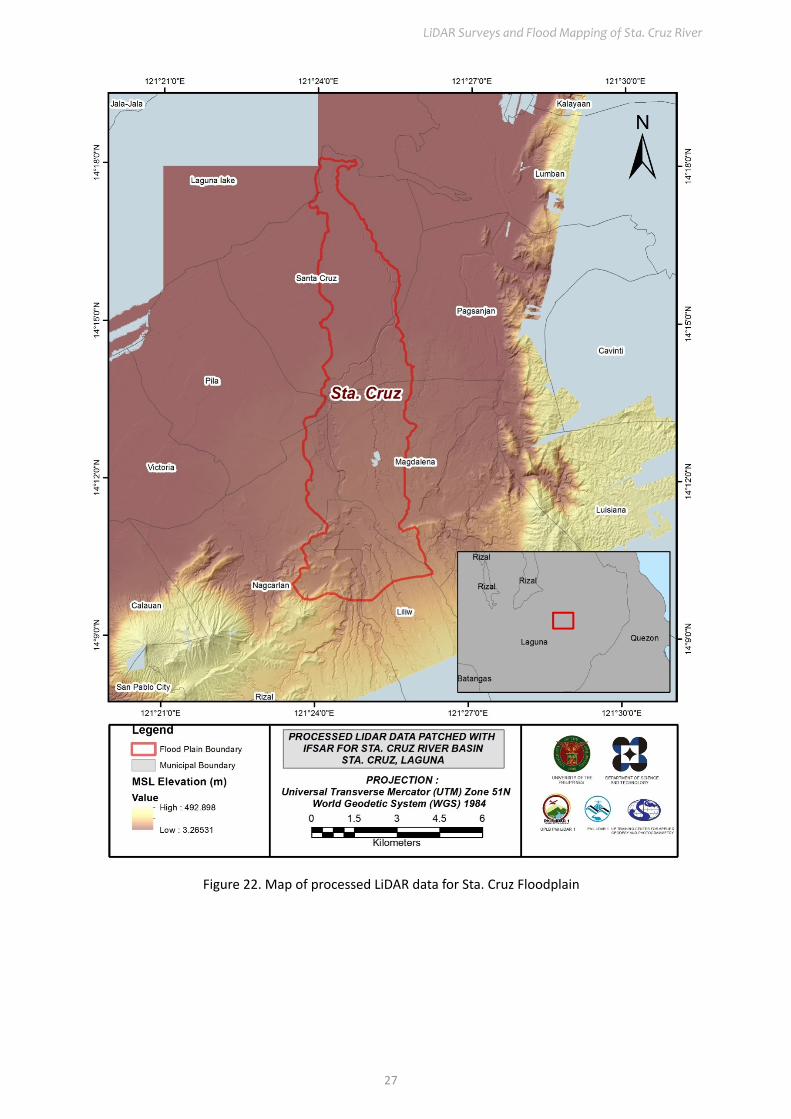
Mosaicked LiDAR DTM for Sta. Cruz Floodplain is shown in Figure 22. It can be seen that the entire Sta. Cruz Floodplain is 96.60% covered by LiDAR data.

Hazard Mapping of the Philippines Using LIDAR (Phil-LIDAR 1)
26
Table 14. Shift values of each LiDAR Block of Sta. Cruz Floodplain
Mission BlocksShift Values (meters)
x y zCALABARZON_18I_supplement 0.00 0.00 -0.74
Laguna_Blk18H 0.00 0.00 0.30Laguna_Blk18J 0.00 0.00 0.00Cavite_Blk18I -0.21 -0.08 0.30
LiDAR Surveys and Flood Mapping of Sta. Cruz River
27
Figure 22. Map of processed LiDAR data for Sta. Cruz Floodplain

Hazard Mapping of the Philippines Using LIDAR (Phil-LIDAR 1)
28
3.10 Calibration and Validation of Mosaicked LiDAR Digital Elevation Model
The extent of the validation survey done by the Data Validation and Bathymetry Component (DVBC) in Sta. Cruz to collect points with which the LiDAR dataset is validated is shown in Figure 23. A total of 24,251 survey points were gathered for all the flood plains within the provinces of CALABARZON wherein the Sta. Cruz floodplain is located. Random selection of 80% of the survey points, resulting to 19,401 points, was used for calibration.
A good correlation between the uncalibrated mosaicked LiDAR DTM and ground survey elevation values is shown in Figure 24. Statistical values were computed from extracted LiDAR values using the selected points to assess the quality of data and obtain the value for vertical adjustment. The computed height difference between the LiDAR DTM and calibration points is 2.97 meters with a standard deviation of 0.20 meters. Calibration of the LiDAR data was done by subtracting the height difference value, 2.97 meters, to the mosaicked LiDAR data. Table 15 shows the statistical values of the compared elevation values between the LiDAR data and calibration data.

LiDAR Surveys and Flood Mapping of Sta. Cruz River
29
Figure 23. Map of Sta. Cruz Floodplain with validation survey points in green

Hazard Mapping of the Philippines Using LIDAR (Phil-LIDAR 1)
30
Figure 24. Correlation plot between calibration survey points and LiDAR data
Table 15. Calibration statistical measures
Calibration Statistical Measures Value (meters)
Height Difference 2.97Standard Deviation 0.20
Average -2.97Minimum -3.48Maximum -2.40
The remaining 20% of the total survey points were intersected to the flood plain, resulting to 58 points, were used for the validation of calibrated Sta Cruz DTM. A good correlation between the calibrated mosa-icked LiDAR elevation values and the ground survey elevation, which reflects the quality of the LiDAR DTM, is shown in Figure 25. The computed RMSE between the calibrated LiDAR DTM and validation elevation values is 0.14 meters with a standard deviation of 0.05 meters, as shown in Table 16.

LiDAR Surveys and Flood Mapping of Sta. Cruz River
31
Figure 25. Correlation plot between validation survey points and LiDAR data
Table 16. Validation statistical measures
Validation Statistical Measures Value (meters)
RMSE 0.14Standard Deviation 0.05
Average 0.13Minimum 0.04Maximum 0.26
3.11 Integration of Bathymetric Data into the LiDAR Digital Terrain Model
For bathy integration, only centerline data was available for Sta. Cruz with 2,192 bathymetric survey points. The resulting raster surface produced was done by Kernel Interpolation with barriers method. After burn-ing the bathymetric data to the calibrated DTM, assessment of the interpolated surface was represented by the computed RMSE value of 0.44 meters. The extent of the bathymetric survey done by the Data Vali-dation and Bathymetry Component (DVBC) in Sta. Cruz integrated with the processed LiDAR DEM is shown in Figure 26.

Hazard Mapping of the Philippines Using LIDAR (Phil-LIDAR 1)
32
Figure 26. Map of Sta. Cruz Floodplain with bathymetric survey points shown in blue.

LiDAR Surveys and Flood Mapping of Sta. Cruz River
33
CHAPTER 4: LIDAR VALIDATION SURVEY AND MEASUREMENTS IN THE STA. CRUZ RIVER BASIN
Engr. Louie P. Balicanta, Engr. Joemarie S. Caballero, Ms. Patrizcia Mae. P. dela Cruz, Engr. Dexter T. Lozano For. Dona Rina Patricia C. Tajora, Elaine Bennet Salvador, and For. Rodel C. Alberto
The methods applied in this chapter were based on the DREAM methods manual (Balicanta et al., 2014) and further enhanced and updated in Paringit et al. (2017).
4.1 Summary of Activities
The DVBC conducted field survey in Sta. Cruz River on September 2 to 6, 2014 in partnership with the Uni-versity of The Philippines Los Baños. The survey covered the bathymetry and ground validation of the river. The bathymetry survey was conducted using an echo sounder to determine the depth of the river while a Trimble® SPS 882 rover GPS gathered the coordinates and elevation values of the survey points.
Figure 27. Extent of the bathymetric survey (in blue) in Sta. Cruz River and the LiDAR validation survey (in red)
4.2 Control SurveyThe GNSS network used for Sta. Cruz Survey is composed of two loops established on Sept 2, 2014 occu-pying the following reference points: LAG-52, second-order GCP located in Brgy. Poblacion, Municipality of Magdalena, Laguna; and LA-204, first-order BM located in Brgy. Balubad, Municipality of Lumban, Laguna.
A control point was established on the approach of San Cristobal Bridge, UP-SCB-1, in Brgy. Paciano Rizal, Calamba City, Laguna; and RB-1, on top of a hotel in Brgy. Patimbao, Municipality of Sta. Cruz Laguna, to be used as marker.
The summary of control points used is found in Table 21, while the GNNS network established is illustrated in Figure 30.

Hazard Mapping of the Philippines Using LIDAR (Phil-LIDAR 1)
34
Figure 28. GNSS network of Sta. Cruz River field survey
LiDAR Surveys and Flood Mapping of Sta. Cruz River
35
Table 17. List of references and control points used in Sta. Cruz River survey (Source: NAMRIA, UP-TCAGP)
Control Point
Order ofAccuracy
Geographic Coordinates (WGS 84)
Latitude LongitudeEllipsoidal
Height(m)
BMOrtho
(m)
Date Established
First loop September 2, 2014
LAG-522nd
Order GCP 14°11’59.35842” 121°25’46.26158” 109.637 63.727
2007
LA-204 1st Order BM 14°17’30.95410” 121°27’36.89050” 54.504 8.564 Sept 2, 2014
RB-1 UP Estab-lished - - - - Sept 2, 2014
UP SCB-1
UP Estab-lished - - - - 2007
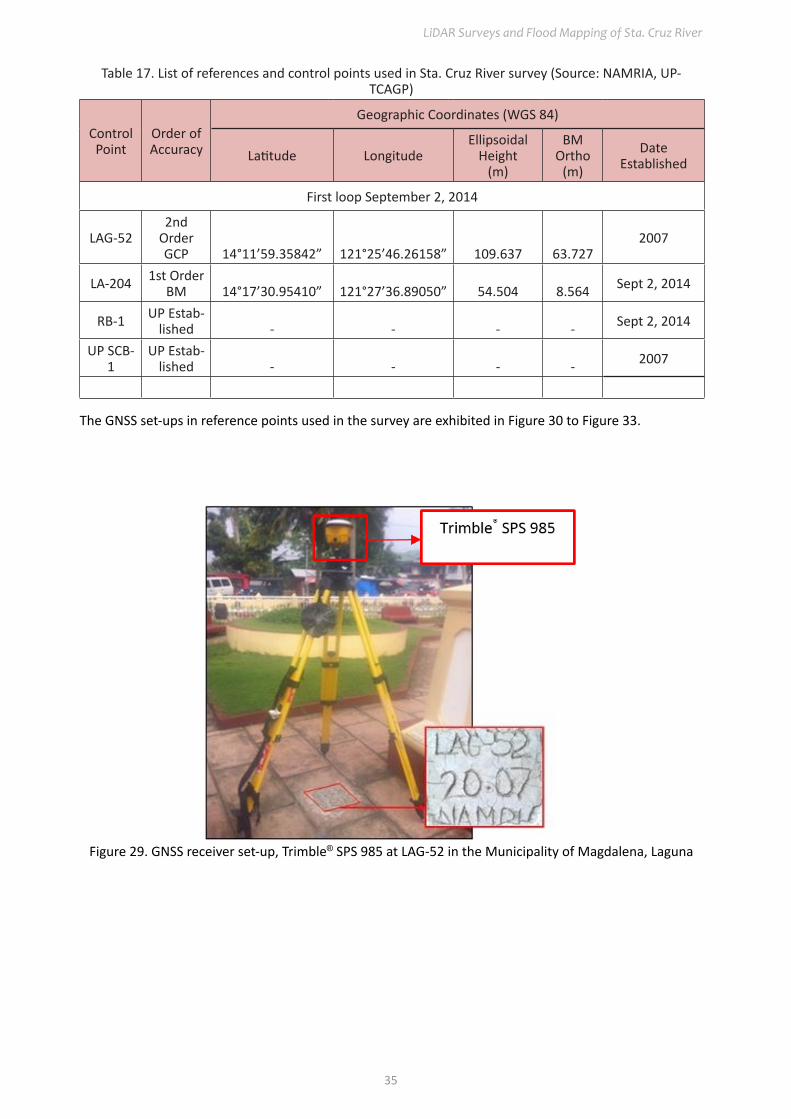
The GNSS set-ups in reference points used in the survey are exhibited in Figure 30 to Figure 33.
Figure 29. GNSS receiver set-up, Trimble® SPS 985 at LAG-52 in the Municipality of Magdalena, Laguna

Hazard Mapping of the Philippines Using LIDAR (Phil-LIDAR 1)
36
Figure 30. GNSS receiver set-up, Trimble® SPS 882 at LA-204 in the Municipality of Lumban, Laguna
Figure 31. GNSS base receiver set-up, Trimble® SPS 852 at RB-1, located at the roof top of Asia Blooms Hotel, Brgy. Patimbao, Sta. Cruz, Laguna

LiDAR Surveys and Flood Mapping of Sta. Cruz River
37
Figure 32. GNSS base receiver set-up, Trimble® SPS 852 at UP-SCB-1, San Cristobal Bridge in Calamba City, Laguna
4.3 Baseline Processing
GNSS baselines were processed simultaneously in TBC by observing that all baselines have fixed solutions with horizontal and vertical precisions within +/- 20 cm and +/- 10 cm requirement, respectively. In cases where one or more baselines did not meet all of these criteria, masking was performed. Masking is done by removing/masking portions of these baseline data using the same processing software. It is repeatedly processed until all baseline requirements are met. If the reiteration yields out of the required accuracy, resurvey is initiated. Baseline processing result of control points in Sta. Cruz River Basin is summarized in Table 22 generated by TBC software.
Table 18. Baseline processing report for Sta. Cruz River static survey
Observation Date of Observation
Solution Type
H.Prec. (Meter)
V.Prec. (Meter) Geodetic Az.
Ellipsoid Dist.
(Meter)
Height (Meter)
UP-SCB --- LA-204 9-2-14 Fixed 0.006 0.022 77°03’30” 35520.745 -10.879
UP-SCB --- RB-1 9-2-14 Fixed 0.002 0.008 260°12’22” 30546.000 5.472
RB-1 --- LA-204 9-2-14 Fixed 0.005 0.017 59°01’24” 5280.226 -5.355
UP-SCB --- LAG-52 9-2-14 Fixed 0.012 0.053 274°09’49” 31395.596 -44.499
RB-1 --- LAG-52 9-2-14 Fixed 0.006 0.028 170°47’21” 7571.511 49.751
RB-1 --- UP-SCB 9-2-14 Fixed 0.006 0.034 260°12’22” 30546.038 5-284

Hazard Mapping of the Philippines Using LIDAR (Phil-LIDAR 1)
38
4.4 Network Adjustment
After the baseline processing procedure, network adjustment was performed using TBC. Looking at the adjusted grid coordinates table of the TBC-generated Network Adjustment Report, it is observed that the square root of the sum of the squares of x and y must be less than 20 cm and z less than 10 cm or in equation form:
<20cm and
Where: xe is the Easting Error, ye is the Northing Error, and ze is the Elevation Error
for each control point. See the Network Adjustment Report shown in Table 23 to Table 25 for the complete details.
Table 19. Control point constraints
Point ID Type East σ (Meter)
North σ (Meter)
Height σ (Meter)
Elevation σ (Meter)
LA-204 Grid Fixed
LAG-52 Global Fixed Fixed Fixed
Fixed = 0.000001 (Meter)
The four (4) control points, LA-204, LAG-52, RB-1, and UP-SCB, were occupied and observed simultane-ously to form a GNSS loop. Coordinates of LAG-52 and elevation of LA-204 were held fixed during the processing of the control points as presented in Table 23. Through these reference points, the coordinates and elevation of the unknown control points were computed.
Table 20. Adjusted grid coordinates
Point ID Easting (Meter)
EastingError
(Meter)
Northing (Meter)
NorthingError
(Meter)
Elevation (Meter)
ElevationError
(Meter)Constraint
LA-204 333915.290 0.028 1580563.904 0.022 8.564 ? e LAG-52 330531.105 ? 1570395.630 ? 63.727 0.150 LL
RB-1 329369.956 0.023 1577877.257 0.019 14.109 0.065 UP-SCB 299233.666 0.025 1572885.788 0.020 20.595 0.068
The network is fixed at NAMRIA reference points LAG-52 and LA-204 for grid and elevation, respectively. With the mentioned equation, for horizontal and for the vertical, the computations for the accuracy for the horizontal and vertical accuracy are as follows:
LAG-52Horizontal accuracy = fixedVertical accuracy = 1.5 cm < 10 cm
LA-204Horizontal accuracy = √((2.8)² + (2.2)² = √(7.84 + 4.84) = 3.56 cm < 20 cmVertical accuracy = fixed
UP-SCB-1horizontal accuracy = √((2.5)² + (2.0)² = √(6.25 + 4.0) = 3.20 cm < 20 cmvertical accuracy = 6.8 cm < 10 cm
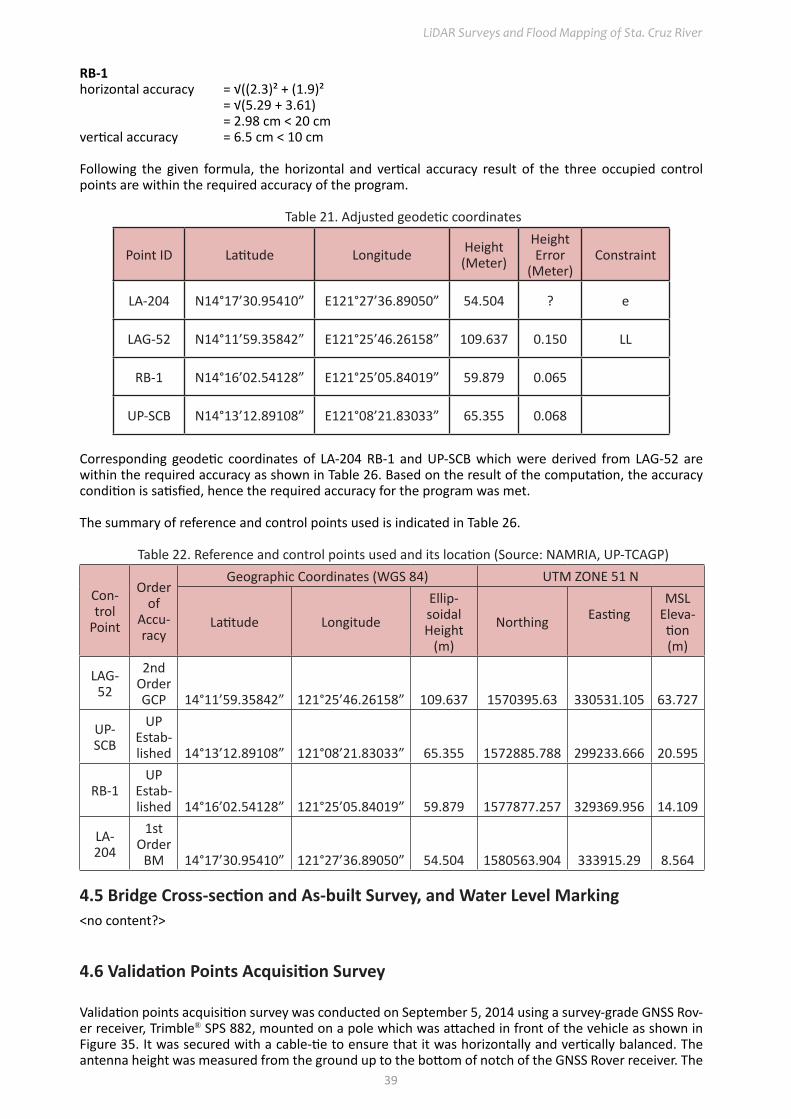
LiDAR Surveys and Flood Mapping of Sta. Cruz River
39
RB-1horizontal accuracy = √((2.3)² + (1.9)² = √(5.29 + 3.61) = 2.98 cm < 20 cmvertical accuracy = 6.5 cm < 10 cm
Following the given formula, the horizontal and vertical accuracy result of the three occupied control points are within the required accuracy of the program.
Table 21. Adjusted geodetic coordinates
Point ID Latitude Longitude Height (Meter)
Height Error
(Meter)Constraint
LA-204 N14°17’30.95410” E121°27’36.89050” 54.504 ? e
LAG-52 N14°11’59.35842” E121°25’46.26158” 109.637 0.150 LL
RB-1 N14°16’02.54128” E121°25’05.84019” 59.879 0.065
UP-SCB N14°13’12.89108” E121°08’21.83033” 65.355 0.068
Corresponding geodetic coordinates of LA-204 RB-1 and UP-SCB which were derived from LAG-52 are within the required accuracy as shown in Table 26. Based on the result of the computation, the accuracy condition is satisfied, hence the required accuracy for the program was met.
The summary of reference and control points used is indicated in Table 26.
Table 22. Reference and control points used and its location (Source: NAMRIA, UP-TCAGP)
Con-trol
Point
Order of
Accu-racy
Geographic Coordinates (WGS 84) UTM ZONE 51 N
Latitude Longitude
Ellip-soidal Height
(m)
Northing EastingMSL
Eleva-tion (m)
LAG-52
2nd Order GCP 14°11’59.35842” 121°25’46.26158” 109.637 1570395.63 330531.105 63.727
UP-SCB
UP Estab-lished 14°13’12.89108” 121°08’21.83033” 65.355 1572885.788 299233.666 20.595
RB-1UP
Estab-lished 14°16’02.54128” 121°25’05.84019” 59.879 1577877.257 329369.956 14.109
LA-204
1st Order
BM 14°17’30.95410” 121°27’36.89050” 54.504 1580563.904 333915.29 8.564
4.5 Bridge Cross-section and As-built Survey, and Water Level Marking<no content?>
4.6 Validation Points Acquisition Survey
Validation points acquisition survey was conducted on September 5, 2014 using a survey-grade GNSS Rov-er receiver, Trimble® SPS 882, mounted on a pole which was attached in front of the vehicle as shown in Figure 35. It was secured with a cable-tie to ensure that it was horizontally and vertically balanced. The antenna height was measured from the ground up to the bottom of notch of the GNSS Rover receiver. The

Hazard Mapping of the Philippines Using LIDAR (Phil-LIDAR 1)
40
antenna’s height is 2.12 meters from the ground. The activity started from the Municipality of Calamba to Pangil in Laguna.
Figure 33. Validation points acquisition set-up for Sta. Cruz River Basin
A total of 5,108 ground validation points were acquired with an approximate length of 47.5 km using Ho-tel-1 as the GNSS base station, as shown in the map in Figure 36.

LiDAR Surveys and Flood Mapping of Sta. Cruz River
41
Figure 34. Validation points acquisition survey covering the length of Sta, Cruz River Basin
4.7 River Bathymetric Survey
Bathymetric survey of Sta. Cruz River was conducted on September 3, 2014 using a GNSS Rover receiver, Trimble® SPS 882 in PPK survey technique mounted on top of a pole with Ohmex™ single-beam echo sounder below and submerged on water and attached to a boat as shown in Figure 37. The survey started in the upstream in Brgy. Palasan with coordinates 14°14’58.80610” 121°25’30.99189” down to the mouth of the river in Laguna Lake with coordinates 14°18’00.40324” 121°24’23.33698”. The control point RB-1 was used as the base station.

Hazard Mapping of the Philippines Using LIDAR (Phil-LIDAR 1)
42
Figure 35. Bathymetric survey with echo sounder in Sta, Cruz River
On September 4–5, 2015, manual bathymetric survey was done on the shallow parts of the river using a GNSS Rover receiver, Trimble® SPS 882 in PPK survey technique mounted on top of a pole and measured the bathymetric points by foot as shown in Figure 38. The survey started in the upstream in Brgy. Mojon, Municipality of Liliw with coordinates 14°11’35.29203” 121°24’28.98574”, traversed down the river and ended in Brgy. Mojo, Municipality of Pila with coordinates 14°13’21.58337” 121°24’12.64197”. RB-01 was used as the GNSS base station all throughout the survey.
Figure 36. Manual Bathymetric survey in Sta. Cruz RiverA total of 2,638 bathymetric points were acquired with an approximate length of 2.81 km as illustrated in the map in Figure 39. A CAD drawing was also produced to illustrate the Sta. Cruz Riverbed profile from Brgy. Halayhayin down to Brgy. Pagsawitan as shown in Figure 40. An elevation drop of 42.65 meters with respect to MSL was observed within the approximated distance of 14.48 kilometers. A 3-km gap was not surveyed due to absence of satellite signal in the area.

LiDAR Surveys and Flood Mapping of Sta. Cruz River
43
Figure 37. Bathymetric survey coverage of Sta. Cruz River
Figure 38. Riverbed profile of Sta. Cruz River
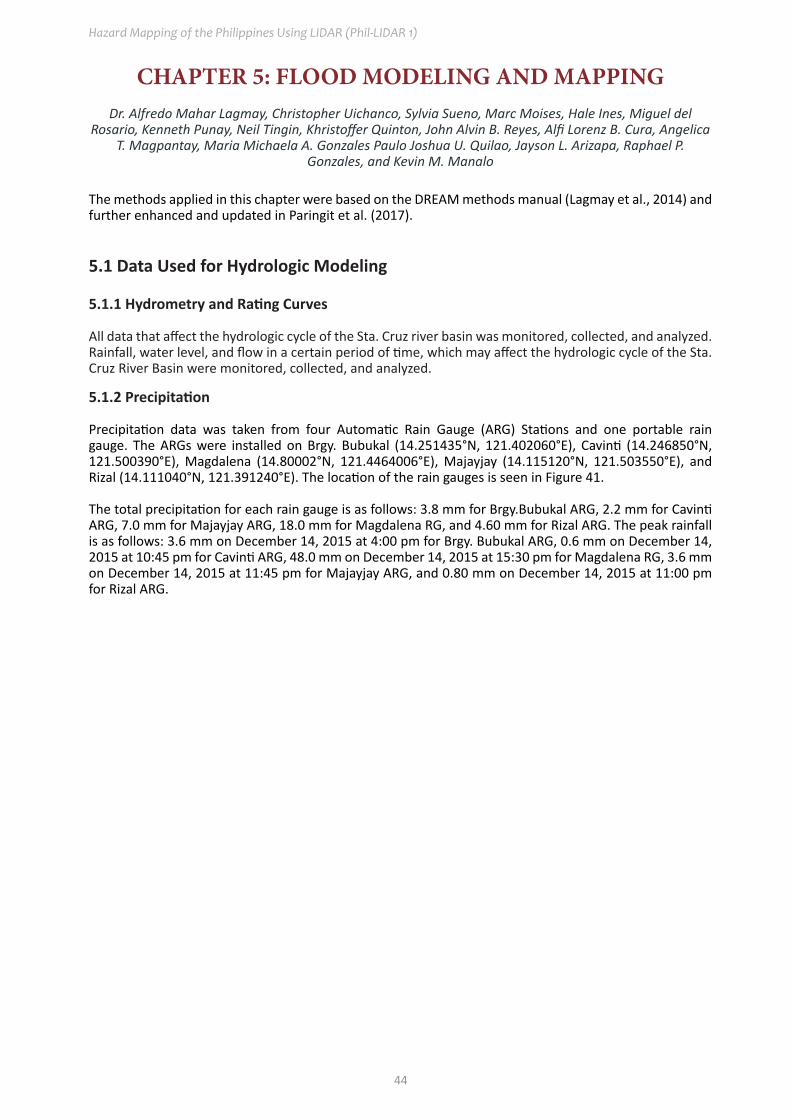
Hazard Mapping of the Philippines Using LIDAR (Phil-LIDAR 1)
44
CHAPTER 5: FLOOD MODELING AND MAPPINGDr. Alfredo Mahar Lagmay, Christopher Uichanco, Sylvia Sueno, Marc Moises, Hale Ines, Miguel del
Rosario, Kenneth Punay, Neil Tingin, Khristoffer Quinton, John Alvin B. Reyes, Alfi Lorenz B. Cura, Angelica T. Magpantay, Maria Michaela A. Gonzales Paulo Joshua U. Quilao, Jayson L. Arizapa, Raphael P.
Gonzales, and Kevin M. Manalo
The methods applied in this chapter were based on the DREAM methods manual (Lagmay et al., 2014) and further enhanced and updated in Paringit et al. (2017).
5.1 Data Used for Hydrologic Modeling
5.1.1 Hydrometry and Rating Curves
All data that affect the hydrologic cycle of the Sta. Cruz river basin was monitored, collected, and analyzed. Rainfall, water level, and flow in a certain period of time, which may affect the hydrologic cycle of the Sta. Cruz River Basin were monitored, collected, and analyzed.
5.1.2 Precipitation
Precipitation data was taken from four Automatic Rain Gauge (ARG) Stations and one portable rain gauge. The ARGs were installed on Brgy. Bubukal (14.251435°N, 121.402060°E), Cavinti (14.246850°N, 121.500390°E), Magdalena (14.80002°N, 121.4464006°E), Majayjay (14.115120°N, 121.503550°E), and Rizal (14.111040°N, 121.391240°E). The location of the rain gauges is seen in Figure 41.
The total precipitation for each rain gauge is as follows: 3.8 mm for Brgy.Bubukal ARG, 2.2 mm for Cavinti ARG, 7.0 mm for Majayjay ARG, 18.0 mm for Magdalena RG, and 4.60 mm for Rizal ARG. The peak rainfall is as follows: 3.6 mm on December 14, 2015 at 4:00 pm for Brgy. Bubukal ARG, 0.6 mm on December 14, 2015 at 10:45 pm for Cavinti ARG, 48.0 mm on December 14, 2015 at 15:30 pm for Magdalena RG, 3.6 mm on December 14, 2015 at 11:45 pm for Majayjay ARG, and 0.80 mm on December 14, 2015 at 11:00 pm for Rizal ARG.
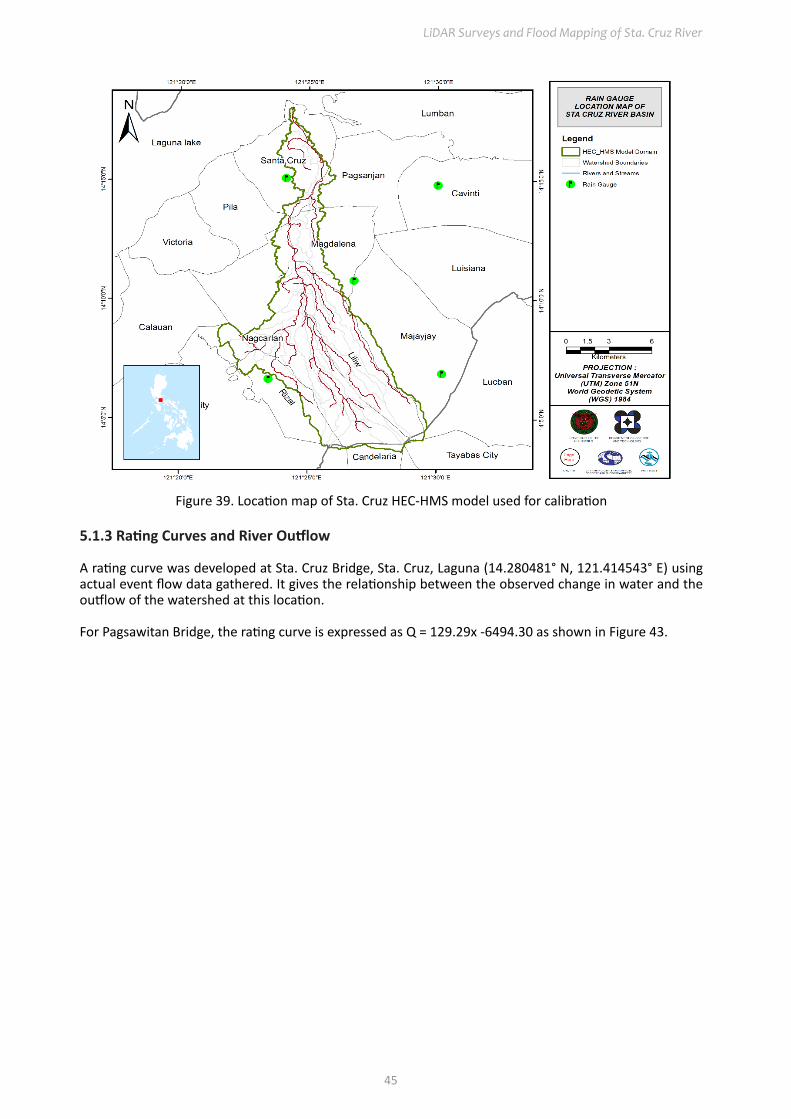
LiDAR Surveys and Flood Mapping of Sta. Cruz River
45
Figure 39. Location map of Sta. Cruz HEC-HMS model used for calibration
5.1.3 Rating Curves and River Outflow
A rating curve was developed at Sta. Cruz Bridge, Sta. Cruz, Laguna (14.280481° N, 121.414543° E) using actual event flow data gathered. It gives the relationship between the observed change in water and the outflow of the watershed at this location.
For Pagsawitan Bridge, the rating curve is expressed as Q = 129.29x -6494.30 as shown in Figure 43.

Hazard Mapping of the Philippines Using LIDAR (Phil-LIDAR 1)
46
Figure 40. Cross-section plot of Pagsawitan Bridge
Figure 41. Rating Curve at Pagsawitan Bridge, Laguna
For the calibration of the HEC-HMS model, shown in Figure 44, actual flow discharge during a rainfall event was collected in the Pagsawitan Bridge. Peak discharge is 18.17 m3/s on December 14, 2015 at 11:40 pm.

LiDAR Surveys and Flood Mapping of Sta. Cruz River
47
Figure 42. Rainfall and outflow data at Sta. Cruz used for modeling
5.2 RIDF Station
The Philippine Atmospheric Geophysical and Astronomical Services Administration (PAGASA) computed Rainfall Intensity Duration Frequency (RIDF) values for the Tayabas Rain Gauge. The RIDF rainfall amount for 24 hours was converted to a synthetic storm by interpolating and re-arranging the values in such a way a certain peak value will be attained at a certain time. This station was chosen based on its proximity to the Sta. Cruz watershed. The extreme values for this watershed were computed based on a 41-year record.
Table 23. RIDF values for Tayabas Rain Gauge computed by PAGASACOMPUTED EXTREME VALUES (in mm) OF PRECIPITATION
T (yrs) 10 mins 20 mins 30 mins 1 hr 2 hrs 3 hrs 6 hrs 12 hrs 24 hrs2 21 32.7 42 59.3 83 99.9 128.2 161.5 195.95 29.6 42.1 52.5 77.3 116.1 143 192.6 232.3 279.5
10 35.4 48.3 59.4 89.2 138 171.5 235.2 279.3 334.915 38.6 51.8 63.3 96 150.3 187.6 259.3 305.7 366.120 40.9 54.3 66.1 100.7 159 198.9 276.1 324.3 38825 42.6 56.2 68.2 104.3 165.7 207.5 289.1 338.5 404.850 48 62 74.7 115.5 186.2 234.3 329.1 382.5 456.7
100 53.4 67.8 81.1 126.6 206.6 260.8 368.8 426.2 508.3
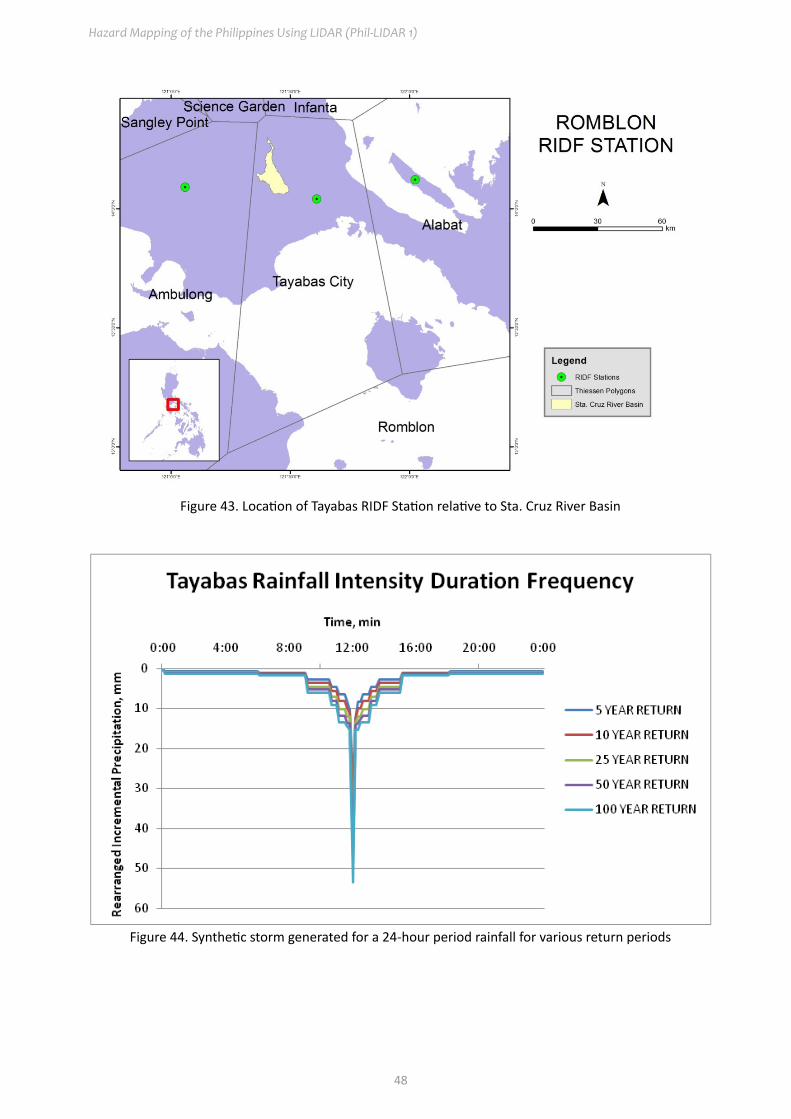
Hazard Mapping of the Philippines Using LIDAR (Phil-LIDAR 1)
48
Figure 43. Location of Tayabas RIDF Station relative to Sta. Cruz River Basin
Figure 44. Synthetic storm generated for a 24-hour period rainfall for various return periods

LiDAR Surveys and Flood Mapping of Sta. Cruz River
49
5.3 HMS Model
The soil dataset was taken from and generated by the Bureau of Soils and Water Management (BSWM) under the Department of Agriculture (DA). The land cover dataset was taken from the National Mapping and Resource Information Authority (NAMRIA).
Figure 45. Soil map of the Sta. Cruz River Basin used for the estimation of the CN parameter (Source: DA-BSWM)
Hazard Mapping of the Philippines Using LIDAR (Phil-LIDAR 1)
50
Figure 46. Land cover map of the Sta. Cruz River Basin used for the estimation of the CN and watershed lag parameters of the rainfall-runoff model (Source: NAMRIA)

LiDAR Surveys and Flood Mapping of Sta. Cruz River
51
Figure 47. Stream delineation map of the Sta. Cruz River Basin
Using SAR-based DEM, the Sta. Cruz Basin was delineated and further subdivided into subbasins. The model consists of 43 subbasins, 43 reaches, and 22 junctions. The main outlet is labeled as 140. The main outlet is at Sta. Cruz Bridge.
STREAM DELINEATION MAP OF STA. CRUZ
BASIN

Hazard Mapping of the Philippines Using LIDAR (Phil-LIDAR 1)
52
Figure 48. Sta. Cruz River Basin model generated using HEC-HMS
5.4 Cross-section Data
Riverbed cross-sections of the watershed are crucial in the HEC-RAS model setup. The cross-section data for the HEC-RAS model was derived using the LiDAR DEM data. It was defined using the Arc GeoRAS tool and was post-processed in ArcGIS.
Figure 49. River cross-section of Sta. Cruz River generated through Arcmap HEC GeoRAS tool

LiDAR Surveys and Flood Mapping of Sta. Cruz River
53
5.5 FLO-2D Model
The automated modeling process allows for the creation of a model with boundaries that are almost ex-actly coincidental with that of the catchment area. As such, they have approximately the same land area and location. The entire area was divided into square grid elements, 10 meter by 10 meter in size. Each element was assigned a unique grid element number which served as its identifier, then attributed with the parameters required for modeling such as x-and y-coordinate of centroid, names of adjacent grid el-ements, Manning coefficient of roughness, infiltration, and elevation value. The elements were arranged spatially to form the model, allowing the software to simulate the flow of water across the grid elements and in eight directions (north, south, east, west, northeast, northwest, southeast, southwest).
Based on the elevation and flow direction, it is seen that the water will generally flow from the west of the model to the northeast, following the main channel. As such, boundary elements in those particular regions of the model are assigned as inflow and outflow elements, respectively.
Figure 50. Screenshot of subcatchment with the computational area to be modeled in FLO-2D GDS Pro
The simulation was then run through FLO-2D GDS Pro. This particular model had a computer run time of 126.57959 hours. After the simulation, FLO-2D Mapper Pro was used to transform the simulation results into spatial data that showed flood hazard levels, as well as the extent and inundation of the flood. Assign-ing the appropriate flood depth and velocity values for Low, Medium, and High created the flood hazard maps. Most of the default values given by FLO-2D Mapper Pro were used, except for those in the Low haz-ard level. For this particular level, the minimum h (Maximum depth) was set at 0.2 m while the minimum vh (Product of maximum velocity (v) times maximum depth (h)) was set at 0 m2/s.
The creation of a flood hazard map from the model also automatically created a flow depth map depicting the maximum amount of inundation for every grid element. The legend used by default in Flo-2D Mapper was not a good representation of the range of flood inundation values, so a different legend was used for the layout. In this particular model, the inundated parts cover a maximum land area of 23775100.00 m2.
There is a total of 1,281,282,208.54 m3 of water entering the model. Of this amount, 11,740,227.71 m3 is due to rainfall while 1,269,541,980.84 m3 is inflow from other areas outside the model. About 2,054,632.50 m3 of this water is lost to infiltration and interception, while 160,542,688.39 m3 is stored by the floodplain. The rest, amounting up to 1,120,082,869.77 m3, is outflow.
5.6 Results of HMS Calibration
After calibrating the Sta. Cruz HEC-HMS river basin model, its accuracy was measured against the observed values. Figure 53 shows the comparison between the two discharge data.
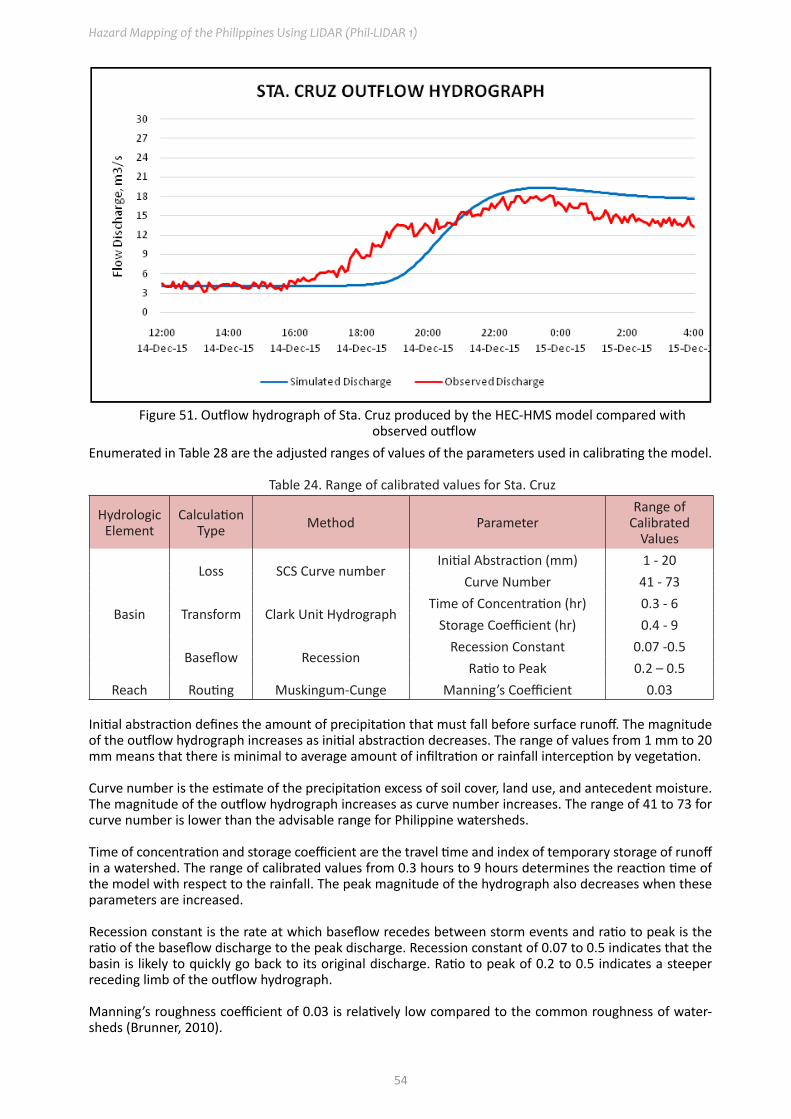
Hazard Mapping of the Philippines Using LIDAR (Phil-LIDAR 1)
54
Figure 51. Outflow hydrograph of Sta. Cruz produced by the HEC-HMS model compared with observed outflow
Enumerated in Table 28 are the adjusted ranges of values of the parameters used in calibrating the model.
Table 24. Range of calibrated values for Sta. Cruz
Hydrologic Element
Calculation Type Method Parameter
Range of Calibrated
Values
Basin
Loss SCS Curve numberInitial Abstraction (mm) 1 - 20
Curve Number 41 - 73
Transform Clark Unit HydrographTime of Concentration (hr) 0.3 - 6
Storage Coefficient (hr) 0.4 - 9
Baseflow RecessionRecession Constant 0.07 -0.5
Ratio to Peak 0.2 – 0.5Reach Routing Muskingum-Cunge Manning’s Coefficient 0.03
Initial abstraction defines the amount of precipitation that must fall before surface runoff. The magnitude of the outflow hydrograph increases as initial abstraction decreases. The range of values from 1 mm to 20 mm means that there is minimal to average amount of infiltration or rainfall interception by vegetation.
Curve number is the estimate of the precipitation excess of soil cover, land use, and antecedent moisture. The magnitude of the outflow hydrograph increases as curve number increases. The range of 41 to 73 for curve number is lower than the advisable range for Philippine watersheds.
Time of concentration and storage coefficient are the travel time and index of temporary storage of runoff in a watershed. The range of calibrated values from 0.3 hours to 9 hours determines the reaction time of the model with respect to the rainfall. The peak magnitude of the hydrograph also decreases when these parameters are increased.
Recession constant is the rate at which baseflow recedes between storm events and ratio to peak is the ratio of the baseflow discharge to the peak discharge. Recession constant of 0.07 to 0.5 indicates that the basin is likely to quickly go back to its original discharge. Ratio to peak of 0.2 to 0.5 indicates a steeper receding limb of the outflow hydrograph.
Manning’s roughness coefficient of 0.03 is relatively low compared to the common roughness of water-sheds (Brunner, 2010).

LiDAR Surveys and Flood Mapping of Sta. Cruz River
55
Table 25. Summary of the efficiency test of Sta. Cruz HMS ModelRoot Mean Square Error (RMSE) 3.103Pearson Correlation Coefficient (r2) 0.899Nash-Sutcliffe (E) 0.631Percent Bias (PBIAS) -0.206Observation Standard Deviation Ratio (RSR) 0.608
The Root Mean Square Error (RMSE) method aggregates the individual differences of these two measure-ments. It was identified at 3.103.
The Pearson correlation coefficient (r2) assesses the strength of the linear relationship between the ob-servations and the model. A value close to 1 corresponds to an almost perfect match of the observed discharge and the resulting discharge from the HEC-HMS model. Here, it measured 0.899.
The Nash-Sutcliffe (E) method was also used to assess the predictive power of the model. Here, the opti-mal value is 1. The model attained an efficiency coefficient of 0.631.
A positive Percent Bias (PBIAS) indicates a model’s propensity towards under-prediction. Negative values indicate bias towards over-prediction. Again, the optimal value is 0. In the model, the PBIAS is -0.206.
The Observation Standard Deviation Ratio (RSR) is an error index. A perfect model attains a value of 0 when the error in the units of the valuable a quantified. The model has an RSR value of 0.608.
5.7 Calculated Outflow Hydrographs and Discharge Values for Different Rainfall Return Periods
5.7.1 Hydrograph Using the Rainfall Runoff ModelThe summary graph (Figure 54) shows the Sta. Cruz outflow using the Tayabas RIDF curves in 5 different return periods (5-year, 10-year, 25-year, 50-year, and 100-year rainfall time series) based on the PAGASA data. The simulation results reveal significant increase in outflow magnitude as the rainfall intensity in-creases for a range of durations and return periods.
Figure 52. Outflow hydrograph at Sta. Cruz Station generated using Tayabas RIDF simulated in HEC-HMS

Hazard Mapping of the Philippines Using LIDAR (Phil-LIDAR 1)
56
A summary of the total precipitation, peak rainfall, peak outflow, time to peak, and lag time of the Sta. Cruz discharge using the Tayabas RIDF curves in five different return periods is shown in Table 30.
Table 26. Peak values of the Sta. Cruz HEC-HMS Model outflow using the Tayabas RIDF
RIDF PERIOD
Total Precipitation
(mm)
Peak Rainfall (mm)
Peak Outflow (cu.m/s) Time to Peak
5-yr 279.50 29.60 258.637 7 hours 10 minutes
10-yr 334.90 35.40 327.951 6 hours 50 minutes
25-yr 404.80 42.60 418.731 6 hours 40 minutes
50-yr 456.70 48.0 487.468 6 hours 30 minutes
100-yr 508.30 53.40 556.380 6 hours 20 minutes
5.7.2 Discharge Data Using Dr. Horritt’s Recommended Hydrologic MethodThe river discharge values for the river entering the floodplain with the computed discharge are shown in Figure 55 and the peak values are summarized in Table 31.
Figure 53. Sta. Cruz–Pagsanjan River generated discharge using 5-, 25-, and 100-year Tayabas City RIDF in HEC-HMS
Table 27. Summary of Sta. Cruz–Pagsanjan River discharge generated in HEC-HMS
RIDF Period Peak discharge (cms) Time-to-peak
100-Year 1167.5 6 hours, 6 minutes25-Year 860.9 6 hours, 6 minutes5-Year 506 6 hours, 6 minutes

LiDAR Surveys and Flood Mapping of Sta. Cruz River
57
Table 28. Validation of river discharge estimates
Discharge Point
QMED(SCS), cms
QBANKFUL, cms
QMED(SPEC), cms
VALIDATIONBankful
DischargeSpecific
DischargeSta. Cruz-Pagsanjan 445.280 643.274 686.876 PASS PASS
The results of the HEC-HMS river discharge estimates were able to satisfy the conditions for validation us-ing the bankful and specific discharge methods. The passing values are based on theory but are supported using other discharge computation methods so they were good to use for flood modeling. These values will need further investigation for the purpose of validation. It is therefore recommended to obtain actual values of the river discharges for higher-accuracy modeling.
5.8 River Analysis Model Simulation
The HEC-RAS flood model produced a simulated water level at every cross-section for every time step for every flood simulation created. The resulting model will be used in determining the flooded areas within the model. The simulated model will be an integral part in determining real-time flood inundation extent of the river after it has been automated and uploaded on the DREAM website. The sample map of Sta. Cruz River using the HMS base flow is shown on Figure 13 below.
Figure 54. Sta. Cruz HEC-RAS Output
5.9 Flow Depth and Flood Hazard
The resulting hazard and flow depth maps for 100-, 25-, and 5-year rain return scenarios of the Sta. Cruz Floodplain are shown in Figure 57 to 62. The floodplain, with an area of 214.03 sq km, covers thirteen municipalities namely Calauan, Cavinti, Laguna Lake, Liliw, Luisiana, Lumban, Magdalena, Majayjay, Nag-carlan, Pagsanjan, Pila, Sta. Cruz, and Victoria. Table 33 shows the percentage of area affected by flooding per municipality.

Hazard Mapping of the Philippines Using LIDAR (Phil-LIDAR 1)
58
Table 29. Municipalities affected in Sta. Cruz Floodplain
Municipality Total Area
Area Flooded
% Flooded
Calauan 79.44 4.34 5.45Cavinti 96.78 0.91 0.94
Laguna lake 892.20 0.92 0.10Liliw 36.20 0.82 2.26
Luisiana 61.01 3.07 5.03Lumban 117.34 22.32 19.02
Magdalena 29.61 27.08 91.42Majayjay 64.40 3.77 5.86Nagcarlan 81.20 28.61 35.24Pagsanjan 40.77 32.87 80.61
Pila 28.77 28.38 98.63Sta. Cruz 37.63 36.50 97Victoria 28.37 24.44 86.17

LiDAR Surveys and Flood Mapping of Sta. Cruz River
59
Figure 55. 100-year flood hazard map for Sta. Cruz Floodplain
Figure 56. 100-year flow depth map for Sta. Cruz Floodplain
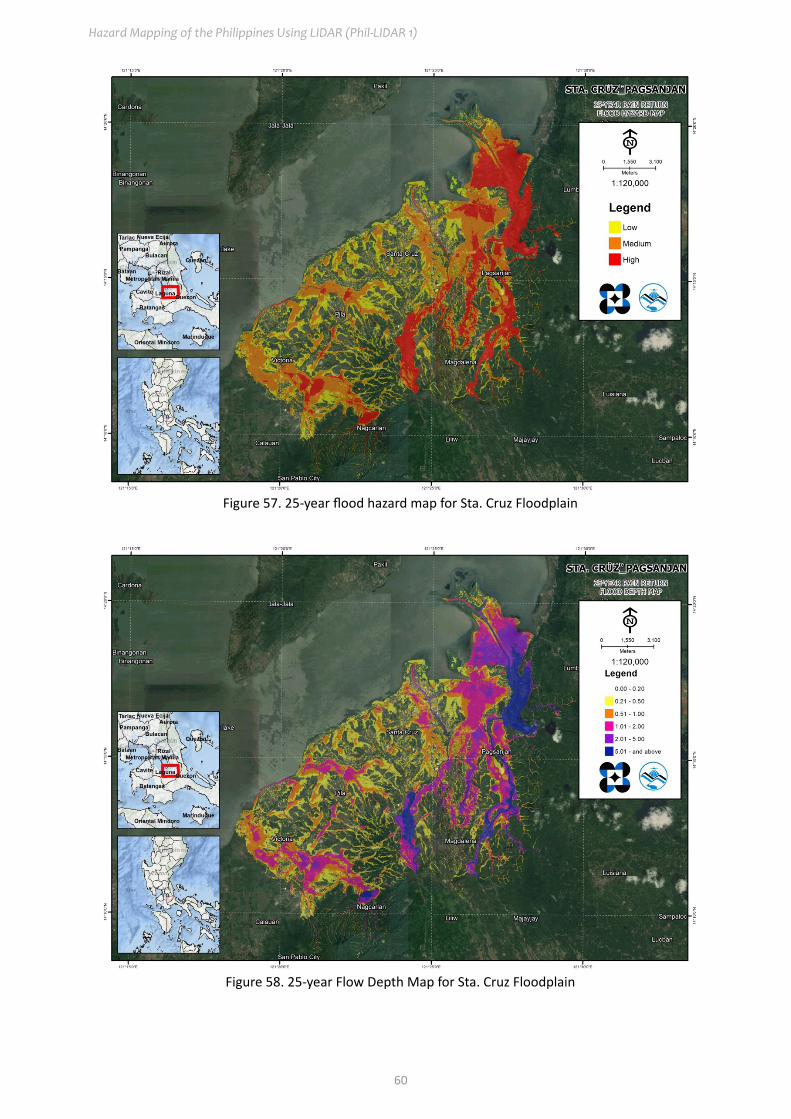
Hazard Mapping of the Philippines Using LIDAR (Phil-LIDAR 1)
60
Figure 57. 25-year flood hazard map for Sta. Cruz Floodplain
Figure 58. 25-year Flow Depth Map for Sta. Cruz Floodplain

LiDAR Surveys and Flood Mapping of Sta. Cruz River
61
Figure 59. 5-year flood hazard map for Sta. Cruz Floodplain
Figure 60. 5-year flow depth map for Sta. Cruz Floodplain

Hazard Mapping of the Philippines Using LIDAR (Phil-LIDAR 1)
62
5.10 Inventory of Areas Exposed to Flooding
Listed below are the barangays affected by the Pagsanjan River Basin, grouped accordingly by municipali-ty. For the said basin, thirteen (13) municipalities consisting of 143 barangays are expected to experience flooding when subjected to a 5-year rainfall return period.
For the 5-year return period, 4.34% of the municipality of Calauan with an area of 79.44 sq km will experi-ence flood levels of less 0.20 meters, 0.74% of the area will experience flood levels of 0.21 to 0.50 meters; while 0.31%, 0.06%, 0.02%, and 0.0004% of the area will experience flood depths of 0.51 to 1 meter, 1.01 to 2 meters, 2.01 t0 5 meters, and more than 5 meters, respectively. Table 34 depicts the areas affected in Calauan in square kilometers by flood depth per barangay.
Table 30. Affected areas in Calauan, Laguna during a 5-year rainfall return period
Affected Area(sq. km.) by flood
depth (in m.)
Affected Barangays in Calauan
Dayap Lamot 2 Santo Tomas
0.03-0.20 0.52 2.69 0.240.21-0.50 0.13 0.18 0.280.51-1.00 0.088 0.058 0.11.01-2.00 0.016 0.023 0.00942.01-5.00 0 0.008 0.0049
> 5.00 0 0.0003 0
Among the barangays in the municipality of Calauan, Lamot 2 is projected to have the highest percentage of area that will experience flood levels at 3.72%. On the other hand, Dayap posted the percentage of area that may be affected by flood depths at 0.95%.
Figure 61. Affected areas in Calauan, Laguna during a 5-year rainfall return periodFor the municipality of Cavinti, with an area of 96.78 sq km, 0.90% will experience flood levels of less 0.20 meters; 0.03% of the area will experience flood levels of 0.21 to 0.50 meters; while 0.01%, 0.005%, 0.004%, and 0.0002% of the area will experience flood depths of 0.51 to 1 meter, 1.01 to 2 meters, 2.01 to 5 meters, and more than 5 meters, respectively. Table 35 depicts the affected areas in square kilometers by flood depth per barangay.

LiDAR Surveys and Flood Mapping of Sta. Cruz River
63
Table 31. Affected areas in Cavinti, Laguna during a 5-year rainfall return periodAffected Area
(sq. km.) by flood depth (in m.)
Affected Barangays in Cavinti
Anglas Bangco Bulajo
0.03-0.20 0.44 0.43 0.00260.21-0.50 0.014 0.014 00.51-1.00 0.0079 0.0049 01.01-2.00 0.0019 0.0033 02.01-5.00 0.0015 0.0026 0
> 5.00 0 0.0002 0
Among the barangays in the municipality of Cavinti, Anglas is projected to have the highest percentage of area that will experience flood levels at 0.48%. On the other hand, Bangco posted the percentage of area that may be affected by flood depths f at 0.47%.
Figure 62. Affected areas in Cavinti, Laguna during a 5-year rainfall return periodFor the municipality of Laguna Lake, with an area of 892.20 sq km, 0.05% will experience flood levels of less 0.20 meters; 0.01% of the area will experience flood levels of 0.21 to 0.50 meters; while 0.02%, 0.02%, 0.001%, and 0.001% of the area will experience flood depths of 0.51 to 1 meter, 1.01 to 2 meters, 2.01 to 5 meters, and more than 5 meters, respectively. Table 36 depicts the affected areas in square kilometers by flood depth per barangay.
Table 32. Affected areas in Laguna Lake, Laguna during a 5-year rainfall return period
Affected Area(sq. km.) by flood depth (in m.)
Affected Barangays in Laguna lakeLaguna Lake
0.03-0.20 0.470.21-0.50 0.120.51-1.00 0.141.01-2.00 0.192.01-5.00 0.012
> 5.00 0
Among the barangays in the Municipality of Laguna Lake, Laguna Lake is projected to have the highest percentage of area that will experience flood levels at 0.10%.

Hazard Mapping of the Philippines Using LIDAR (Phil-LIDAR 1)
64
Figure 63. Affected areas in Laguna Lake, Laguna during a 5-year rainfall return periodFor the municipality of Liliw, with an area of 36.20 sq km, 1.62% will experience flood levels of less 0.20 meters; 0.10% of the area will experience flood levels of 0.21 to 0.50 meters; while 0.09%, 0.22%, 0.19%, and 0.05% of the area will experience flood depths of 0.51 to 1 meter, 1.01 to 2 meters, 2.01 to 5 meters, and more than 5 meters, respectively. Table 37 depicts the affected areas in square kilometers by flood depth per barangay.
Table 33. Affected areas in Liliw, Laguna during a 5-year rainfall return periodAffected Area
(sq. km.) by flood depth (in m.)
Affected Barangays in Liliw
Dagatan Daniw Dita Mojon
0.03-0.20 0.056 0.084 0.012 0.430.21-0.50 0 0.0014 0.00033 0.0340.51-1.00 0 0.00051 0.00029 0.0311.01-2.00 0.000047 0 0 0.082.01-5.00 0 0 0 0.069
> 5.00 0 0 0 0.016
Among the barangays in the municipality of Liliw, Mojon is projected to have the highest percentage of area that will experience flood levels at 1.84%. On the other hand, Daniw posted the percentage of area that may be affected by flood depths at 0.24%.

LiDAR Surveys and Flood Mapping of Sta. Cruz River
65
Figure 64. Affected areas in Liliw, Laguna during a 5-year rainfall return periodFor the municipality of Luisiana, with an area of 61.01 sq km, 4.63% will experience flood levels of less 0.20 meters; 0.09% of the area will experience flood levels of 0.21 to 0.50 meters; while 0.07%, 0.06%, 0.13%, and 0.06% of the area will experience flood depths of 0.51 to 1 meter, 1.01 to 2 meters, 2.01 to 5 meters, and more than 5 meters, respectively. Table 38 depicts the affected areas in square kilometers by flood depth per barangay.
Table 34. Affected areas in Luisiana, Laguna during a 5-year rainfall return period
Affected Area(sq. km.) by flood
depth (in m.)
Affected Barangays in Luisiana
San Diego
San Salvador
0.03-0.20 0.0012 2.820.21-0.50 0 0.0540.51-1.00 0 0.041.01-2.00 0 0.0342.01-5.00 0 0.077
> 5.00 0 0.038
Among the barangays in the municipality of Luisiana, San Salvador is projected to have the highest per-centage of area that will experience flood levels at 5.03%. On the other hand, San Diego posted the per-centage of area that may be affected by flood depths at 0.002%.

Hazard Mapping of the Philippines Using LIDAR (Phil-LIDAR 1)
66
Figure 65. Affected areas in Luisiana, Laguna during a 5-year rainfall return period
For the municipality of Lumban, with an area of 117.34 sq km, 10.74% will experience flood levels of less 0.20 meters; 3.88% of the area will experience flood levels of 0.21 to 0.50 meters; while 2.33%, 1.82%, 0.70%, and 0.0001% of the area will experience flood depths of 0.51 to 1 meter, 1.01 to 2 meters, 2.01 to 5 meters, and more than 5 meters, respectively. Table 39 and Table 40 depict the affected areas in square kilometers by flood depth per barangay.

LiDAR Surveys and Flood Mapping of Sta. Cruz River
67
Tabl
e 35
. Affe
cted
are
as in
Lum
ban,
Lag
una
durin
g a
5-ye
ar ra
infa
ll re
turn
per
iod
Affec
ted
Area
(sq.
km
.) by
floo
d de
pth
(in m
.)
Affec
ted
Bara
ngay
s in
Lum
ban
Bago
ng
Sila
ngBa
limbi
ngan
Balu
bad
Calir
aya
Conc
epci
onLe
win
Mar
acta
May
tala
ng
I0.
03-0
.20
0.81
0.09
71.
890.
017
1.18
0.95
0.17
0.43
0.21
-0.5
00.
031
0.02
10.
180
0.23
0.08
90.
073
0.22
0.51
-1.0
00.
010.
021
0.3
00.
093
0.17
0.02
70.
181.
01-2
.00
0.00
240
0.34
00.
037
0.08
50
0.03
32.
01-5
.00
00
0.05
70
0.08
0.00
150
0.1
> 5.
000
00
00
00
0.00
015
Tabl
e 36
. Affe
cted
are
as in
Lum
ban,
Lag
una
durin
g a
5-ye
ar ra
infa
ll re
turn
per
iod
Affec
ted
Area
(sq.
km
.) by
floo
d de
pth
(in m
.)
Affec
ted
Bara
ngay
s in
Lum
ban
May
tala
ng
IIPr
imer
a Pa
rang
Prim
era
Pulo
Sala
cSa
nto
Niñ
oSe
gund
a Pa
rang
Segu
nda
Pulo
Waw
a
0.03
-0.2
00.
680.
170.
035
0.15
0.44
0.17
0.06
15.
350.
21-0
.50
0.73
0.05
50.
015
0.06
10.
180.
060.
062.
530.
51-1
.00
1.18
0.03
20.
028
0.09
30.
053
0.04
50.
016
0.48
1.01
-2.0
01.
460.
008
00.
003
0.00
240.
011
00.
162.
01-5
.00
0.00
0066
0.03
70
00
0.02
60
0.52
> 5.
000
00
00
00
0

Hazard Mapping of the Philippines Using LIDAR (Phil-LIDAR 1)
68
Amon
g th
e ba
rang
ays
in th
e m
unic
ipal
ity o
f Lum
ban,
Waw
a is
proj
ecte
d to
hav
e th
e hi
ghes
t per
cent
age
of a
rea
that
will
exp
erie
nce
flood
leve
ls at
7.7
1%. O
n th
e ot
her
hand
, May
tala
ng II
pos
ted
the
perc
enta
ge o
f are
a th
at m
ay b
e aff
ecte
d by
floo
d de
pths
at 3
.46%
.
Figu
re 6
6. A
ffect
ed a
reas
in L
umba
n, L
agun
a du
ring
a 5-
year
rain
fall
retu
rn p
erio
d

LiDAR Surveys and Flood Mapping of Sta. Cruz River
69
For the municipality of Magdalena, with an area of 29.61 sq km, 65.36% will experience flood levels of less 0.20 meters; 8.42% of the area will experience flood levels of 0.21 to 0.50 meters; while 5.04%, 4.03%, 4.63%, and 4.14% of the area will experience flood depths of 0.51 to 1 meter, 1.01 to 2 meters, 2.01 to 5 meters, and more than 5 meters, respectively. Table 41 to Table 43 depict the affected areas in square kilometers by flood depth per barangay.
Table 37. Affected areas in Magdalena, Laguna during a 5-year rainfall return periodAffected
Area(sq. km.) by flood depth
(in m.)
Affected Barangays in Magdalena
Alipit Baanan Balanac Bucal Buenavista Bungkol Buo Burlungan
0.03-0.20 1.41 0.33 0.58 0.69 0.93 1.84 0.6 1.220.21-0.50 0.12 0.026 0.2 0.21 0.19 0.13 0.067 0.0980.51-1.00 0.077 0.0097 0.19 0.045 0.15 0.022 0.067 0.0341.01-2.00 0.07 0.004 0.13 0.016 0.13 0.019 0.054 0.0862.01-5.00 0.054 0.0011 0.21 0.081 0.081 0.02 0.046 0.12
> 5.00 0.078 0 0.29 0.14 0.004 0.0002 0.027 0.03
Table 38. Affected areas in Magdalena, Laguna during a 5-year rainfall return periodAffected Area(sq. km.) by
flood depth (in m.)
Affected Barangays in Magdalena
Cigaras Halayhayin Ibabang Atingay
Ibabang Butnong
Ilayang Atingay
Ilayang Butnong Ilog Malaking
Ambling
0.03-0.20 0.56 0.99 0.31 1.02 0.8 0.44 0.23 0.470.21-0.50 0.12 0.071 0.053 0.068 0.14 0.011 0.069 0.0340.51-1.00 0.12 0.011 0.029 0.049 0.11 0.013 0.076 0.0171.01-2.00 0.14 0.024 0.026 0.042 0.053 0.019 0.087 0.0322.01-5.00 0.14 0.099 0.054 0.0062 0.067 0.014 0.05 0.06
> 5.00 0.04 0.061 0.11 0 0.013 0.0049 0.0014 0.021
Table 39. Affected areas in Magdalena, Laguna during a 5-year rainfall return periodAffected
Area(sq. km.) by flood depth
(in m.)
Affected Barangays in Magdalena
Malinao Maravilla Munting Ambling Poblacion Sabang Salasad Tanawan Tipunan
0.03-0.20 0.94 1.28 0.5 0.51 1.72 0.89 0.58 0.520.21-0.50 0.12 0.28 0.034 0.036 0.24 0.1 0.036 0.030.51-1.00 0.036 0.086 0.014 0.012 0.18 0.097 0.03 0.0141.01-2.00 0.011 0.032 0.009 0.009 0.1 0.066 0.023 0.00662.01-5.00 0.01 0.041 0.0085 0.0047 0.18 0.026 0.0006 0.0013
> 5.00 0.015 0.32 0.0056 0 0.071 0.0002 0 0
Among the barangays in the municipality of Magdalena, Sabang is projected to have the highest percent-age of area that will experience flood levels at 8.39%. On the other hand, Maravilla posted the percentage of area that may be affected by flood depths at 6.87%.

Hazard Mapping of the Philippines Using LIDAR (Phil-LIDAR 1)
70
Figu
re 6
7. A
ffect
ed a
reas
in L
umba
n, L
agun
a du
ring
a 5-
year
rain
fall
retu
rn p
erio
d

LiDAR Surveys and Flood Mapping of Sta. Cruz River
71
For the municipality of Majayjay, with an area of 64.40 sq km, 5.29% will experience flood levels of less 0.20 meters; 0.30% of the area will experience flood levels of 0.21 to 0.50 meters; while 0.17%, 0.07%, 0.03%, and 0.008% of the area will experience flood depths of 0.51 to 1 meter, 1.01 to 2 meters, 2.01 to 5 meters, and more than 5 meters, respectively. Table 44 depicts the affected areas in square kilometers by flood depth per barangay.
Table 40. Affected areas in Majayjay, Laguna during a 5-year rainfall return period
Affected Area(sq. km.) by flood
depth (in m.)
Affected Barangays in Majayjay
Balanac Banilad Banti Burol San Isidro Tanawan
0.03-0.20 0.084 1.04 0.74 0.032 0.012 1.50.21-0.50 0.002 0.072 0.028 0 0.0016 0.0870.51-1.00 0.0001 0.055 0.0098 0 0.00081 0.0431.01-2.00 0 0.022 0.0027 0 0 0.022.01-5.00 0 0.018 0 0 0 0.002
> 5.00 0 0.0051 0 0 0 0
Among the barangays in the municipality of Majayjay, Tanawan is projected to have the highest percentage of area that will experience flood levels at 2.56%. On the other hand, Banilad posted the percentage of area that may be affected by flood depths at 1.88%.
Figure 68. Affected areas in Majayjay, Laguna during a 5-year rainfall return period

Hazard Mapping of the Philippines Using LIDAR (Phil-LIDAR 1)
72
For t
he m
unic
ipal
ity o
f Nag
carla
n, w
ith a
n ar
ea o
f 81.
20 s
q km
, 25.
81%
will
exp
erie
nce
flood
leve
ls of
less
0.2
0 m
eter
s; 3
.58%
of t
he a
rea
will
exp
erie
nce
flood
leve
ls of
0.
21 to
0.5
0 m
eter
s; w
hile
2.5
4%, 1
.82%
, 0.8
4%, a
nd 0
.78%
of t
he a
rea
will
exp
erie
nce
flood
dep
ths o
f 0.5
1 to
1 m
eter
, 1.0
1 to
2 m
eter
s, 2
.01
to 5
met
ers,
and
mor
e th
an
5 m
eter
s, re
spec
tivel
y. T
able
45
and
Tabl
e 46
dep
ict t
he a
ffect
ed a
reas
in sq
uare
kilo
met
ers b
y flo
od d
epth
per
bar
anga
y.
Tabl
e 41
. Affe
cted
are
as in
Nag
carla
n, L
agun
a du
ring
a 5-
year
rain
fall
retu
rn p
erio
d
Affec
ted
Area
(sq.
km
.) by
floo
d de
pth
(in m
.)
Affec
ted
Bara
ngay
s in
Nag
carla
n
Bala
yong
Banc
a-Ba
nca
Baya
quito
sBu
enav
ista
Buha
ngin
anCa
lum
pang
Kanl
uran
Ka
bubu
haya
nLa
bang
an
0.03
-0.2
00.
322.
380.
513.
031.
391.
690.
810.
680.
21-0
.50
0.01
10.
580.
014
0.15
0.27
0.32
0.1
0.02
20.
51-1
.00
0.00
280.
330.
0088
0.08
10.
028
0.43
0.02
50.
011
1.01
-2.0
00.
0006
0.27
0.00
480.
030.
0000
10.
550.
0016
0.00
422.
01-5
.00
0.00
020.
10.
0015
0.01
80
0.16
0.00
120.
0004
1>
5.00
00.
0053
00.
0032
00.
510
0
Tabl
e 42
. Affe
cted
are
as in
Nag
carla
n, L
agun
a du
ring
a 5-
year
rain
fall
retu
rn p
erio
d
Affec
ted
Area
(sq.
km
.) by
floo
d de
pth
(in m
.)
Affec
ted
Bara
ngay
s in
Nag
carla
n
Lagu
loLa
wag
uin
Man
aol
Mar
avill
aSa
bang
Sibu
lan
Sila
ngan
Ka
bubu
haya
nW
akat
0.03
-0.2
00.
412.
290.
882.
050.
331.
630.
262.
30.
21-0
.50
0.00
910.
077
0.23
0.62
0.01
40.
087
0.01
90.
380.
51-1
.00
0.00
440.
030.
055
0.63
0.00
130.
034
0.00
760.
391.
01-2
.00
0.00
250.
025
0.00
058
0.31
0.00
037
0.03
20.
003
0.24
2.01
-5.0
00.
0017
0.02
70.
0011
0.31
0.00
017
0.04
80
0.01
1>
5.00
0.00
010.
0018
00.
110.
0000
390.
0022
00.
0003
Amon
g th
e ba
rang
ays i
n th
e m
unic
ipal
ity o
f Nag
carla
n, M
arav
illa
is pr
ojec
ted
to h
ave
the
high
est p
erce
ntag
e of
are
a th
at w
ill e
xper
ienc
e flo
od le
vels
at 4
.95%
. On
the
othe
r ha
nd, C
alum
pang
pos
ted
the
perc
enta
ge o
f are
a th
at m
ay b
e aff
ecte
d by
floo
d de
pths
at 4
.52%
.

LiDAR Surveys and Flood Mapping of Sta. Cruz River
73
Figu
re 6
9. A
ffect
ed a
reas
in N
agca
rlan,
Lag
una
durin
g a
5-ye
ar ra
infa
ll re
turn
per
iod

Hazard Mapping of the Philippines Using LIDAR (Phil-LIDAR 1)
74
For t
he m
unic
ipal
ity o
f Pag
sanj
an, w
ith a
n ar
ea o
f 40.
77 s
q km
, 46.
40%
will
exp
erie
nce
flood
leve
ls of
less
0.2
0 m
eter
s; 8
.56%
of t
he a
rea
will
exp
erie
nce
flood
leve
ls of
0.
21 to
0.5
0 m
eter
s; w
hile
10.
85%
, 9.2
6%, 3
.57%
, and
2.2
6% o
f the
are
a w
ill e
xper
ienc
e flo
od d
epth
s of 0
.51
to 1
met
er, 1
.01
to 2
met
ers,
2.0
1 to
5 m
eter
s, a
nd m
ore
than
5
met
ers,
resp
ectiv
ely.
Tab
le 4
7 an
d Ta
ble
48 d
epic
t the
affe
cted
are
as in
squa
re k
ilom
eter
s by
flood
dep
th p
er b
aran
gay.
Tabl
e 43
. Affe
cted
are
as in
Pag
sanj
an, L
agun
a du
ring
a 5-
year
rain
fall
retu
rn p
erio
d
Affec
ted
Area
(sq.
km
.) by
floo
d de
pth
(in m
.)
Affec
ted
Bara
ngay
s in
Pags
anja
n
Anib
ong
Bara
ngay
IBa
rang
ay
IIBi
ñan
Bubo
yCa
banb
anan
Calu
siche
Ding
in
0.03
-0.2
02.
490.
074
0.23
0.21
2.17
0.73
0.88
2.82
0.21
-0.5
00.
170.
017
0.02
50.
390.
30.
150.
330.
170.
51-1
.00
0.09
0.02
70.
0000
120.
860.
270.
150.
510.
151.
01-2
.00
0.12
0.09
50
0.22
0.33
0.22
0.72
0.23
2.01
-5.0
00.
130.
044
00.
0037
0.18
0.07
50.
190.
17>
5.00
0.13
0.03
20
00.
046
0.02
20.
170.
25
Tabl
e 44
. Affe
cted
are
as in
Pag
sanj
an, L
agun
a du
ring
a 5-
year
rain
fall
retu
rn p
erio
d
Affec
ted
Area
(sq.
km
.) by
floo
d de
pth
(in m
.)
Affec
ted
Bara
ngay
s in
Pags
anja
n
Lam
bac
Layu
gan
Mag
dapi
oM
aula
win
Pina
gsan
jan
Saba
ngSa
mpa
loc
San
Isid
ro0.
03-0
.20
1.01
2.36
1.64
0.14
3.09
0.49
0.24
0.36
0.21
-0.5
00.
340.
630.
064
0.03
50.
290.
310.
150.
130.
51-1
.00
0.49
0.46
0.04
40.
051
0.44
0.29
0.51
0.08
81.
01-2
.00
0.21
0.27
0.05
60.
180.
60.
210.
30.
025
2.01
-5.0
00.
0024
0.2
0.04
30.
017
0.3
0.00
320.
10
> 5.
000
0.01
20
0.01
0.22
00.
032
0
Amon
g th
e ba
rang
ays i
n th
e m
unic
ipal
ity o
f Pag
sanj
an, P
inag
sanj
an is
pro
ject
ed to
hav
e th
e hi
ghes
t per
cent
age
of a
rea
that
will
exp
erie
nce
flood
leve
ls at
12.
14%
. On
the
othe
r han
d, L
ayug
an p
oste
d th
e pe
rcen
tage
of a
rea
that
may
be
affec
ted
by fl
ood
dept
hs a
t 9.6
0%.

LiDAR Surveys and Flood Mapping of Sta. Cruz River
75
Figu
re 7
0. A
ffect
ed a
reas
in P
agsa
njan
, Lag
una
durin
g a
5-ye
ar ra
infa
ll re
turn
per
iod

Hazard Mapping of the Philippines Using LIDAR (Phil-LIDAR 1)
76
For t
he m
unic
ipal
ity o
f Pila
, with
an
area
of 2
8.77
sq k
m, 6
4.99
% w
ill e
xper
ienc
e flo
od le
vels
of le
ss 0
.20
met
ers;
19.
21%
of t
he a
rea
will
exp
erie
nce
flood
leve
ls of
0.2
1 to
0.
50 m
eter
s; w
hile
10.
16%
, 3.8
6%, 0
.28%
, and
0.5
8% o
f the
are
a w
ill e
xper
ienc
e flo
od d
epth
s of 0
.51
to 1
met
er, 1
.01
to 2
met
ers,
2.0
1 to
5 m
eter
s, a
nd m
ore
than
5 m
eter
s,
resp
ectiv
ely.
Tab
le 4
9 an
d Ta
ble
50 d
epic
t the
affe
cted
are
as in
squa
re k
ilom
eter
s by
flood
dep
th p
er b
aran
gay.
Tabl
e 45
. Affe
cted
are
as in
Pila
, Lag
una
durin
g a
5-ye
ar ra
infa
ll re
turn
per
iod
Affec
ted
Area
(sq.
km
.) by
floo
d de
pth
(in m
.)
Affec
ted
Bara
ngay
s in
Pila
Apla
yaBa
gong
Po
okBu
kal
Bulil
an
Nor
teBu
lilan
Su
rCo
ncep
cion
Labu
inLi
nga
0.03
-0.2
00.
431.
350.
980.
350.
432.
070.
710.
470.
21-0
.50
0.13
0.45
0.15
0.08
50.
360.
920.
280.
250.
51-1
.00
0.04
70.
120.
046
0.34
0.06
70.
590.
170.
11.
01-2
.00
0.00
10.
0001
0.01
10.
190.
061
0.22
0.11
02.
01-5
.00
00
00.
0056
0.00
010.
0049
00
> 5.
000
00
00
00
0
Tabl
e 46
. Affe
cted
are
as in
Pila
, Lag
una
durin
g a
5-ye
ar ra
infa
ll re
turn
per
iod
Affec
ted
Area
(sq.
km
.) by
floo
d de
pth
(in m
.)
Affec
ted
Bara
ngay
s in
Pila
Mas
ico
Moj
onPa
nsol
Pina
gbay
anan
San
Anto
nio
San
Mig
uel
Sant
a Cl
ara
Nor
te
Sant
a Cl
ara
Sur
Tubu
an
0.03
-0.2
00.
82.
172.
010.
731.
541.
650.
460.
651.
920.
21-0
.50
0.17
0.35
0.4
0.3
0.37
0.3
0.09
70.
170.
740.
51-1
.00
0.05
80.
150.
150.
170.
20.
051
0.05
60.
043
0.56
1.01
-2.0
00.
018
0.08
20.
046
0.06
0.13
0.00
230.
071
0.00
085
0.11
2.01
-5.0
00
0.05
10
00.
011
00.
0062
00.
0011
> 5.
000
0.17
00
00
00
0
Amon
g th
e ba
rang
ays i
n th
e m
unic
ipal
ity o
f Pila
, Con
cepti
on is
pro
ject
ed to
hav
e th
e hi
ghes
t per
cent
age
of a
rea
that
will
exp
erie
nce
flood
leve
ls at
13.
24%
. On
the
othe
r ha
nd, T
ubua
n po
sted
the
perc
enta
ge o
f are
a th
at m
ay b
e aff
ecte
d by
floo
d de
pths
at 1
1.56
%.

LiDAR Surveys and Flood Mapping of Sta. Cruz River
77
Figu
re 7
1. A
ffect
ed a
reas
in P
ila, L
agun
a du
ring
a 5-
year
rain
fall
retu
rn p
erio
d

Hazard Mapping of the Philippines Using LIDAR (Phil-LIDAR 1)
78
For t
he m
unic
ipal
ity o
f Sta
. Cru
z, w
ith a
n ar
ea o
f 37.
63 s
q km
, 62.
31%
will
exp
erie
nce
flood
leve
ls of
less
0.2
0 m
eter
s; 2
3.90
% o
f the
are
a w
ill e
xper
ienc
e flo
od le
vels
of
0.21
to 0
.50
met
ers;
whi
le 7
.55%
, 1.8
4%, 0
.52%
, and
0.9
9% o
f the
are
a w
ill e
xper
ienc
e flo
od d
epth
s of 0
.51
to 1
met
er, 1
.01
to 2
met
ers,
2.0
1 to
5 m
eter
s, a
nd m
ore
than
5
met
ers,
resp
ectiv
ely.
Tab
le 5
1 to
Tab
le 5
3 de
pict
the
affec
ted
area
s in
squa
re k
ilom
eter
s by
flood
dep
th p
er b
aran
gay.
Tabl
e 47
. Affe
cted
are
as in
Sta
. Cru
z, L
agun
a du
ring
a 5-
year
rain
fall
retu
rn p
erio
d
Affec
ted
Area
(sq.
km
.) by
floo
d de
pth
(in m
.)
Affec
ted
Bara
ngay
s in
Sant
a Cr
uz
Alip
itBa
gum
baya
nBa
rang
ay I
Bara
ngay
IIBa
rang
ay
IIIBa
rang
ay IV
Bara
ngay
VBu
buka
lCa
lios
0.03
-0.2
00.
422.
180.
059
0.07
80.
041
0.09
50.
079
1.29
0.77
0.21
-0.5
00.
130.
750.
039
0.01
80.
0067
0.04
20.
031
0.38
0.49
0.51
-1.0
00.
160.
130.
011
0.00
260.
0000
620.
0093
0.01
40.
081
0.29
1.01
-2.0
00.
086
0.00
460
00
00
0.00
170.
032
2.01
-5.0
00.
025
00
00
00
00
> 5.
000.
130
00
00
00
0
Tabl
e 48
. Affe
cted
are
as in
Sta
. Cru
z, L
agun
a du
ring
a 5-
year
rain
fall
retu
rn p
erio
dAff
ecte
d Ar
ea(s
q. k
m.)
by fl
ood
dept
h (in
m.)
Affec
ted
Bara
ngay
s in
Sant
a Cr
uz
Duha
tGa
tidJa
saan
Labu
inM
alin
aoO
ogon
gPa
gsaw
itan
Pala
san
Patim
bao
0.03
-0.2
01.
922.
241.
110.
770.
870.
91.
691.
811
0.21
-0.5
00.
740.
920.
240.
270.
540.
170.
440.
780.
580.
51-1
.00
0.06
80.
220.
022
0.11
0.15
0.05
80.
084
0.34
0.56
1.01
-2.0
00
0.00
740.
0034
0.00
730.
015
0.05
90.
026
0.07
10.
182.
01-5
.00
00
00
00.
030
0.03
70.
038
> 5.
000
00
00
0.15
00.
055
0.04
2

LiDAR Surveys and Flood Mapping of Sta. Cruz River
79
Tabl
e 49
. Affe
cted
are
as in
Sta
. Cru
z, L
agun
a du
ring
a 5-
year
rain
fall
retu
rn p
erio
d
Affec
ted
Area
(sq.
km
.) by
floo
d de
pth
(in m
.)
Affec
ted
Bara
ngay
s in
Sant
a Cr
uz
San
Jose
San
Juan
San
Pabl
o N
orte
San
Pabl
o Su
r
Santi
sima
Cruz
Sant
o An
gel
Cent
ral
Sant
o An
gel
Nor
te
Sant
o An
gel
Sur
0.03
-0.2
01.
811.
170.
291.
070.
40.
380.
750.
250.
21-0
.50
0.61
0.46
0.17
0.55
0.15
0.08
40.
30.
087
0.51
-1.0
00.
086
0.07
0.00
60.
250.
015
0.01
30.
061
0.03
31.
01-2
.00
0.00
062
0.00
610
0.09
00.
028
0.06
80.
011
2.01
-5.0
00.
0001
30.
0003
00
00.
023
00.
042
> 5.
000.
0000
070
00
00
00
Amon
g th
e ba
rang
ays i
n th
e m
unic
ipal
ity o
f Sta
. Cru
z, G
atid
is pr
ojec
ted
to h
ave
the
high
est p
erce
ntag
e of
are
a th
at w
ill e
xper
ienc
e flo
od le
vels
at 9
%. O
n th
e ot
her h
and,
Pa
lasa
n po
sted
the
perc
enta
ge o
f are
a th
at m
ay b
e aff
ecte
d by
floo
d de
pths
at 8
.23%
.

Hazard Mapping of the Philippines Using LIDAR (Phil-LIDAR 1)
80
Figu
re 7
2. A
ffect
ed a
reas
in S
ta. C
ruz,
Lag
una
durin
g a
5-ye
ar ra
infa
ll re
turn
per
iod

LiDAR Surveys and Flood Mapping of Sta. Cruz River
81
For t
he m
unic
ipal
ity o
f Vic
toria
, with
an
area
of 2
8.37
sq k
m, 4
4.75
% w
ill e
xper
ienc
e flo
od le
vels
of le
ss 0
.20
met
ers;
19.
82%
of t
he a
rea
will
exp
erie
nce
flood
leve
ls of
0.2
1 to
0.5
0 m
eter
s; w
hile
14.
60%
, 6.9
8%, a
nd 0
.35%
of t
he a
rea
will
exp
erie
nce
flood
dep
ths o
f 0.5
1 to
1 m
eter
, 1.0
1 to
2 m
eter
s, a
nd m
ore
than
2 m
eter
s, re
spec
tivel
y. T
able
54
dep
icts
the
affec
ted
area
s in
squa
re k
ilom
eter
s by
flood
dep
th p
er b
aran
gay.
Tabl
e 50
. Affe
cted
are
as in
Vic
toria
, Lag
una
durin
g a
5-ye
ar ra
infa
ll re
turn
per
iod
Affec
ted
Area
(sq.
km
.) by
floo
d de
pth
(in m
.)
Affec
ted
Bara
ngay
s in
Vict
oria
Banc
a-Ba
nca
Dani
wM
asap
ang
Nan
haya
Paga
lang
anSa
n Be
nito
San
Felix
San
Fran
cisc
oSa
n Ro
que
0.03
-0.2
01.
722.
170.
580.
90.
960.
742.
091.
981.
560.
21-0
.50
0.46
1.13
0.46
0.22
0.42
0.53
1.8
0.26
0.35
0.51
-1.0
00.
111.
270.
570.
041
0.29
0.68
1.12
0.03
0.03
11.
01-2
.00
0.08
11.
30.
340.
0069
0.02
50.
068
0.16
0.00
20.
0001
12.
01-5
.00
0.00
260.
078
0.01
40
00.
0016
0.00
110.
0001
0>
5.00
00
00
00
00
0
Amon
g th
e ba
rang
ays
in th
e m
unic
ipal
ity o
f Vic
toria
, Dan
iw is
pro
ject
ed to
hav
e th
e hi
ghes
t per
cent
age
of a
rea
that
will
exp
erie
nce
flood
leve
ls at
20.
96%
. On
the
othe
r ha
nd, S
an F
elix
pos
ted
the
perc
enta
ge o
f are
a th
at m
ay b
e aff
ecte
d by
floo
d de
pths
at 1
8.21
%.

Hazard Mapping of the Philippines Using LIDAR (Phil-LIDAR 1)
82
Figu
re 7
3. A
ffect
ed a
reas
in V
icto
ria, L
agun
a du
ring
a 5-
year
rain
fall
retu
rn p
erio
d

LiDAR Surveys and Flood Mapping of Sta. Cruz River
83
For the 25-year return period, 4.08% of the municipality of Calauan with an area of 79.44 sq km will experi-ence flood levels of less 0.20 meters; 0.82% of the area will experience flood levels of 0.21 to 0.50 meters; while 0.44%, 0.11%, 0.02%, and 0.0004% of the area will experience flood depths of 0.51 to 1 meter, 1.01 to 2 meters, 2.01 t0 5 meters, and more than 5 meters, respectively. Table 55 depicts the areas affected in Calauan in square kilometers by flood depth per barangay.
Table 51. Affected areas in Calauan, Laguna during a 25-year rainfall return period
Affected Area(sq. km.) by flood
depth (in m.)
Affected Barangays in Calauan
Dayap Lamot 2 Santo Tomas
0.03-0.20 0.45 2.61 0.180.21-0.50 0.16 0.22 0.270.51-1.00 0.11 0.081 0.161.01-2.00 0.039 0.031 0.0142.01-5.00 0 0.014 0.0056
> 5.00 0 0.0003 0
Figure 74. Affected areas in Calauan, Laguna during a 25-year rainfall return period

Hazard Mapping of the Philippines Using LIDAR (Phil-LIDAR 1)
84
For the municipality of Cavinti, with an area of 96.78 sq km, 0.91% will experience flood levels of less 0.20 meters; 0.04% of the area will experience flood levels of 0.21 to 0.50 meters; while 0.02%, 0.009%, 0.006%, and 0.0003% of the area will experience flood depths of 0.51 to 1 meter, 1.01 to 2 meters, 2.01 to 5 meters, and more than 5 meters, respectively. Table 56 depicts the affected areas in square kilometers by flood depth per barangay.
Table 52. Affected areas in Cavinti, Laguna during a 25-year rainfall return periodAffected Area
(sq. km.) by flood depth (in m.)
Affected Barangays in Cavinti
Anglas Bangco Bulajo
0.03-0.20 0.46 0.42 0.00260.21-0.50 0.016 0.018 00.51-1.00 0.011 0.0066 01.01-2.00 0.0036 0.0048 02.01-5.00 0.0018 0.0044 0
> 5.00 0 0.0003 0
Figure 75. Affected areas in Cavinti, Laguna during a 25-year rainfall return period

LiDAR Surveys and Flood Mapping of Sta. Cruz River
85
For the municipality of Laguna Lake, with an area of 892.20 sq km, 0.04% will experience flood levels of less 0.20 meters; 0.02% of the area will experience flood levels of 0.21 to 0.50 meters; while 0.009%, 0.03%, and 0.003% of the area will experience flood depths of 0.51 to 1 meter, 1.01 to 2 meters, and more than 2 meters, respectively. Table 57 depicts the affected areas in square kilometers by flood depth per barangay.
Table 53. Affected areas in Laguna Lake, Laguna during a 25-year rainfall return period
Affected Area(sq. km.) by flood
depth (in m.)
Affected Barangays in Laguna lakeLaguna Lake
0.03-0.20 0.40.21-0.50 0.140.51-1.00 0.0841.01-2.00 0.282.01-5.00 0.029
> 5.00 0
Figure 76. Affected areas in Laguna Lake, Laguna during a 25-year rainfall return period

Hazard Mapping of the Philippines Using LIDAR (Phil-LIDAR 1)
86
For the municipality of Liliw, with an area of 36.20 sq km, 1.55% will experience flood levels of less 0.20 meters; 0.12% of the area will experience flood levels of 0.21 to 0.50 meters; while 0.06%, 0.19%, 0.26%, and 0.09% of the area will experience flood depths of 0.51 to 1 meter, 1.01 to 2 meters, 2.01 to 5 meters, and more than 5 meters, respectively. Table 58 depicts the affected areas in square kilometers by flood depth per barangay.
Table 54. Affected areas in Liliw, Laguna during a 25-year rainfall return periodAffected Area
(sq. km.) by flood depth (in m.)
Affected Barangays in Liliw
Dagatan Daniw Dita Mojon
0.03-0.20 0.056 0.083 0.012 0.410.21-0.50 0.0002 0.0021 0.00044 0.0410.51-1.00 0 0.00052 0.00035 0.021.01-2.00 0.000047 0.000091 0.000009 0.0692.01-5.00 0 0 0 0.094
> 5.00 0 0 0 0.031
Figure 77. Affected areas in Liliw, Laguna during a 25-year rainfall return period

LiDAR Surveys and Flood Mapping of Sta. Cruz River
87
For the municipality of Luisiana, with an area of 61.01 sq km, 4.56% will experience flood levels of less 0.20 meters; 0.09% of the area will experience flood levels of 0.21 to 0.50 meters; while 0.07%, 0.07%, 0.14%, and 0.10% of the area will experience flood depths of 0.51 to 1 meter, 1.01 to 2 meters, 2.01 to 5 meters, and more than 5 meters, respectively. Table 59 depicts the affected areas in square kilometers by flood depth per barangay.
Table 55. Affected areas in Luisiana, Laguna during a 25-year rainfall return period
Affected Area(sq. km.) by flood
depth (in m.)
Affected Barangays in Luisiana
San Diego
San Salvador
0.03-0.20 0.0012 2.780.21-0.50 0 0.0560.51-1.00 0 0.0451.01-2.00 0 0.0432.01-5.00 0 0.083
> 5.00 0 0.06
Figure 78. Affected areas in Luisiana, Laguna during a 25-year rainfall return period

Hazard Mapping of the Philippines Using LIDAR (Phil-LIDAR 1)
88
For t
he m
unic
ipal
ity o
f Lum
ban,
with
an
area
of 1
17.3
4 sq
km
, 9.4
1% w
ill e
xper
ienc
e flo
od le
vels
of le
ss 0
.20
met
ers;
3.6
8% o
f the
are
a w
ill e
xper
ienc
e flo
od le
vels
of 0
.21
to 0
.50
met
ers;
whi
le 2
.59%
, 2.8
1%, 1
.13%
, and
0.0
002%
of t
he a
rea
will
exp
erie
nce
flood
dep
ths o
f 0.5
1 to
1 m
eter
, 1.0
1 to
2 m
eter
s, 2
.01
to 5
met
ers,
and
mor
e th
an 5
m
eter
s, re
spec
tivel
y. T
able
60
and
Tabl
e 61
dep
ict t
he a
ffect
ed a
reas
in sq
uare
kilo
met
ers b
y flo
od d
epth
per
bar
anga
y.
Tabl
e 56
. Affe
cted
are
as in
Lum
ban,
Lag
una
durin
g a
25-y
ear r
ainf
all r
etur
n pe
riod
Affec
ted
Area
(sq.
km
.) by
floo
d de
pth
(in m
.)
Affec
ted
Bara
ngay
s in
Lum
ban
Bago
ng
Sila
ngBa
limbi
ngan
Balu
bad
Calir
aya
Conc
epci
onLe
win
Mar
acta
May
tala
ng
I0.
03-0
.20
0.79
0.08
41.
790.
017
1.11
0.91
0.14
0.33
0.21
-0.5
00.
036
0.02
40.
160
0.29
0.08
70.
060.
160.
51-1
.00
0.01
60.
012
0.21
00.
150.
160.
069
0.24
1.01
-2.0
00.
0046
0.01
90.
450
0.04
80.
140
0.21
2.01
-5.0
00
00.
160
0.08
60.
0061
00.
11>
5.00
00
0.00
0088
00.
0000
150
00.
0001
7
Tabl
e 57
. Affe
cted
are
as in
Lum
ban,
Lag
una
durin
g a
25-y
ear r
ainf
all r
etur
n pe
riod
Affec
ted
Area
(sq.
km
.) by
floo
d de
pth
(in m
.)
Affec
ted
Bara
ngay
s in
Lum
ban
May
tala
ng
IIPr
imer
a Pa
rang
Prim
era
Pulo
Sala
cSa
nto
Niñ
oSe
gund
a Pa
rang
Segu
nda
Pulo
Waw
a
0.03
-0.2
00.
410.
130.
030.
120.
330.
140.
047
4.66
0.21
-0.5
00.
570.
073
0.01
60.
061
0.22
0.06
20.
065
2.44
0.51
-1.0
00.
640.
049
0.00
610.
10.
120.
057
0.01
11.
21.
01-2
.00
2.13
0.01
10.
027
0.02
60.
013
0.01
70.
015
0.19
2.01
-5.0
00.
370.
038
00
00.
026
00.
52>
5.00
00
00
00
00

LiDAR Surveys and Flood Mapping of Sta. Cruz River
89
Figu
re 7
9. A
ffect
ed a
reas
in L
umba
n, L
agun
a du
ring
a 25
-yea
r rai
nfal
l ret
urn
perio
d

Hazard Mapping of the Philippines Using LIDAR (Phil-LIDAR 1)
90
For the municipality of Magdalena, with an area of 29.61 sq km, 56.83% will experience flood levels of less 0.20 meters; 9.37% of the area will experience flood levels of 0.21 to 0.50 meters; while 6.44%, 6.92%, 6.54%, and 5.59% of the area will experience flood depths of 0.51 to 1 meter, 1.01 to 2 meters, 2.01 to 5 meters, and more than 5 meters, respectively. Table 62 to Table 64 depict the affected areas in square kilometers by flood depth per barangay.
Table 58. Affected areas in Magdalena, Laguna during a 25-year rainfall return periodAffected
Area(sq. km.) by flood depth (in
m.)
Affected Barangays in Magdalena
Alipit Baanan Balanac Bucal Buenavista Bungkol Buo Burlungan
0.03-0.20 1.2 0.32 0.3 0.59 0.59 1.76 0.56 1.160.21-0.50 0.17 0.032 0.13 0.27 0.19 0.19 0.07 0.120.51-1.00 0.096 0.012 0.24 0.065 0.25 0.027 0.071 0.0311.01-2.00 0.11 0.0052 0.3 0.022 0.28 0.021 0.068 0.0732.01-5.00 0.15 0.0013 0.28 0.033 0.19 0.025 0.064 0.16
> 5.00 0.087 0 0.35 0.2 0.0092 0.0013 0.034 0.039
Table 59. Affected areas in Magdalena, Laguna during a 25-year rainfall return periodAffected Area(sq. km.) by flood depth
(in m.)
Affected Barangays in Magdalena
Cigaras Halayhayin Ibabang Atingay
Ibabang Butnong
Ilayang Atingay
Ilayang Butnong Ilog Malaking
Ambling
0.03-0.20 0.23 0.94 0.26 0.98 0.74 0.42 0.11 0.440.21-0.50 0.098 0.1 0.051 0.081 0.14 0.015 0.039 0.0420.51-1.00 0.19 0.016 0.049 0.047 0.14 0.013 0.078 0.0151.01-2.00 0.28 0.015 0.033 0.055 0.071 0.019 0.17 0.0222.01-5.00 0.26 0.11 0.044 0.019 0.061 0.018 0.11 0.072
> 5.00 0.057 0.07 0.14 0.00061 0.037 0.0078 0.0052 0.041
Table 60. Affected areas in Magdalena, Laguna during a 25-year rainfall return periodAffected
Area(sq. km.) by flood depth
(in m.)
Affected Barangays in Magdalena
Malinao Maravilla Munting Ambling Poblacion Sabang Salasad Tanawan Tipunan
0.03-0.20 0.82 1.15 0.48 0.49 1.4 0.78 0.57 0.50.21-0.50 0.14 0.33 0.043 0.049 0.29 0.1 0.041 0.0380.51-1.00 0.06 0.1 0.019 0.016 0.22 0.11 0.035 0.0181.01-2.00 0.067 0.035 0.012 0.0095 0.22 0.12 0.03 0.00932.01-5.00 0.031 0.072 0.01 0.0086 0.16 0.07 0.002 0.002
> 5.00 0.019 0.35 0.0078 0 0.19 0.0011 0 0
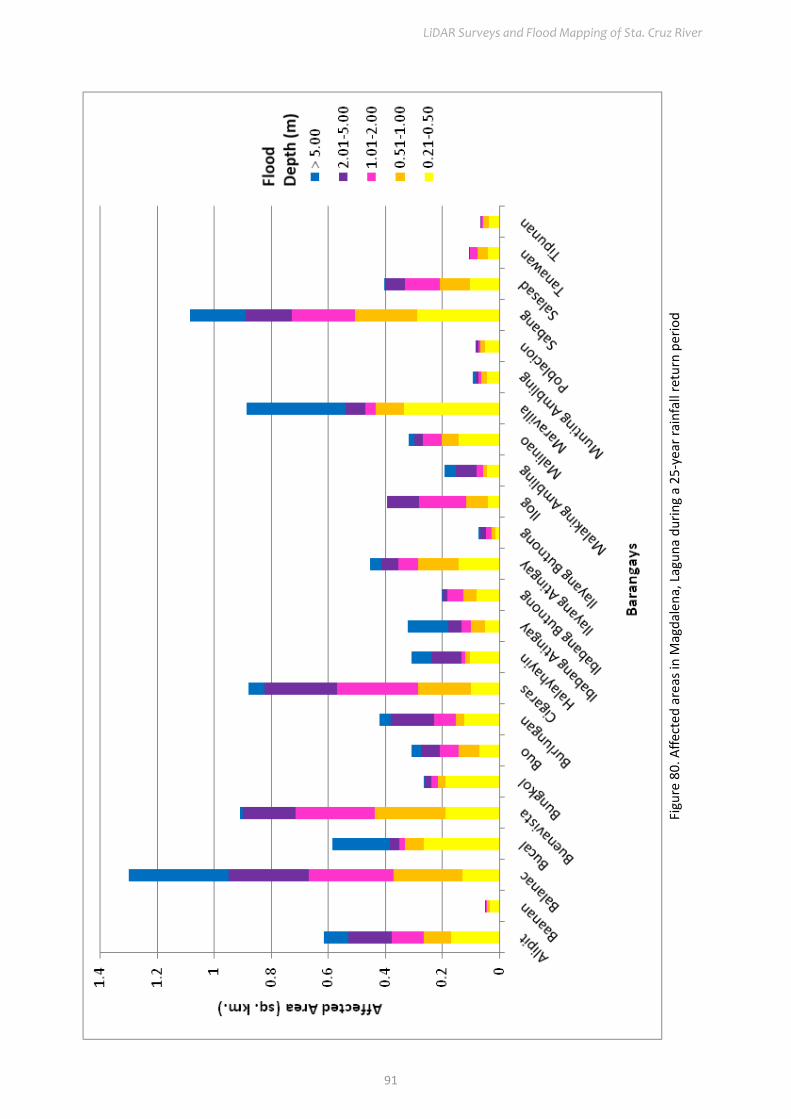
LiDAR Surveys and Flood Mapping of Sta. Cruz River
91
Figu
re 8
0. A
ffect
ed a
reas
in M
agda
lena
, Lag
una
durin
g a
25-y
ear r
ainf
all r
etur
n pe
riod

Hazard Mapping of the Philippines Using LIDAR (Phil-LIDAR 1)
92
For the municipality of Majayjay, with an area of 64.40 sq km, 5.18% will experience flood levels of less 0.20 meters; 0.33% of the area will experience flood levels of 0.21 to 0.50 meters; while 0.20%, 0.09%, 0.05%, and 0.01% of the area will experience flood depths of 0.51 to 1 meter, 1.01 to 2 meters, 2.01 to 5 meters, and more than 5 meters, respectively. Table 65 depicts the affected areas in square kilometers by flood depth per barangay.
Table 61. Affected areas in Majayjay, Laguna during a 25-year rainfall return period
Affected Area(sq. km.) by flood
depth (in m.)
Affected Barangays in Majayjay
Balanac Banilad Banti Burol San Isidro Tanawan
0.03-0.20 0.082 1.01 0.73 0.032 0.012 1.470.21-0.50 0.0034 0.08 0.032 0.000037 0.0013 0.0950.51-1.00 0.00028 0.064 0.014 0 0.0013 0.0511.01-2.00 0 0.026 0.0044 0 0 0.0282.01-5.00 0 0.027 0 0 0 0.0053
> 5.00 0 0.0076 0 0 0 0
Figure 81. Affected areas in Majayjay, Laguna during a 25-year rainfall return period
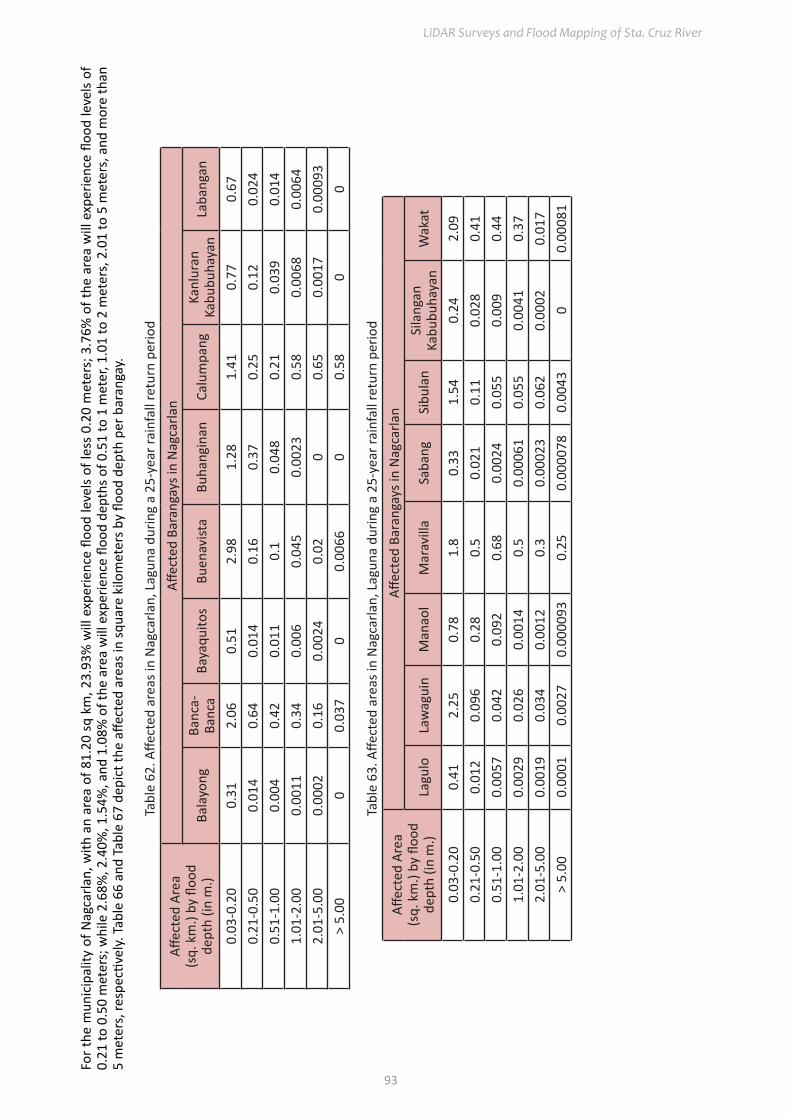
LiDAR Surveys and Flood Mapping of Sta. Cruz River
93
For t
he m
unic
ipal
ity o
f Nag
carla
n, w
ith a
n ar
ea o
f 81.
20 s
q km
, 23.
93%
will
exp
erie
nce
flood
leve
ls of
less
0.2
0 m
eter
s; 3
.76%
of t
he a
rea
will
exp
erie
nce
flood
leve
ls of
0.
21 to
0.5
0 m
eter
s; w
hile
2.6
8%, 2
.40%
, 1.5
4%, a
nd 1
.08%
of t
he a
rea
will
exp
erie
nce
flood
dep
ths o
f 0.5
1 to
1 m
eter
, 1.0
1 to
2 m
eter
s, 2
.01
to 5
met
ers,
and
mor
e th
an
5 m
eter
s, re
spec
tivel
y. T
able
66
and
Tabl
e 67
dep
ict t
he a
ffect
ed a
reas
in sq
uare
kilo
met
ers b
y flo
od d
epth
per
bar
anga
y.
Tabl
e 62
. Affe
cted
are
as in
Nag
carla
n, L
agun
a du
ring
a 25
-yea
r rai
nfal
l ret
urn
perio
d
Affec
ted
Area
(sq.
km
.) by
floo
d de
pth
(in m
.)
Affec
ted
Bara
ngay
s in
Nag
carla
n
Bala
yong
Banc
a-Ba
nca
Baya
quito
sBu
enav
ista
Buha
ngin
anCa
lum
pang
Kanl
uran
Ka
bubu
haya
nLa
bang
an
0.03
-0.2
00.
312.
060.
512.
981.
281.
410.
770.
670.
21-0
.50
0.01
40.
640.
014
0.16
0.37
0.25
0.12
0.02
40.
51-1
.00
0.00
40.
420.
011
0.1
0.04
80.
210.
039
0.01
41.
01-2
.00
0.00
110.
340.
006
0.04
50.
0023
0.58
0.00
680.
0064
2.01
-5.0
00.
0002
0.16
0.00
240.
020
0.65
0.00
170.
0009
3>
5.00
00.
037
00.
0066
00.
580
0
Tabl
e 63
. Affe
cted
are
as in
Nag
carla
n, L
agun
a du
ring
a 25
-yea
r rai
nfal
l ret
urn
perio
d
Affec
ted
Area
(sq.
km
.) by
floo
d de
pth
(in m
.)
Affec
ted
Bara
ngay
s in
Nag
carla
n
Lagu
loLa
wag
uin
Man
aol
Mar
avill
aSa
bang
Sibu
lan
Sila
ngan
Ka
bubu
haya
nW
akat
0.03
-0.2
00.
412.
250.
781.
80.
331.
540.
242.
090.
21-0
.50
0.01
20.
096
0.28
0.5
0.02
10.
110.
028
0.41
0.51
-1.0
00.
0057
0.04
20.
092
0.68
0.00
240.
055
0.00
90.
441.
01-2
.00
0.00
290.
026
0.00
140.
50.
0006
10.
055
0.00
410.
372.
01-5
.00
0.00
190.
034
0.00
120.
30.
0002
30.
062
0.00
020.
017
> 5.
000.
0001
0.00
270.
0000
930.
250.
0000
780.
0043
00.
0008
1

Hazard Mapping of the Philippines Using LIDAR (Phil-LIDAR 1)
94
Figu
re 8
2. A
ffect
ed a
reas
in N
agca
rlan,
Lag
una
durin
g a
25-y
ear r
ainf
all r
etur
n pe
riod

LiDAR Surveys and Flood Mapping of Sta. Cruz River
95
For t
he m
unic
ipal
ity o
f Pag
sanj
an, w
ith a
n ar
ea o
f 40.
77 s
q km
, 38.
03%
will
exp
erie
nce
flood
leve
ls of
less
0.2
0 m
eter
s; 6
.47%
of t
he a
rea
will
exp
erie
nce
flood
leve
ls of
0.
21 to
0.5
0 m
eter
s; w
hile
9.7
7%, 9
.26%
, 16.
99%
, and
2.7
6% o
f the
are
a w
ill e
xper
ienc
e flo
od d
epth
s of 0
.51
to 1
met
er, 1
.01
to 2
met
ers,
2.0
1 to
5 m
eter
s, a
nd m
ore
than
5
met
ers,
resp
ectiv
ely.
Tab
le 6
8 an
d Ta
ble
69 d
epic
t the
affe
cted
are
as in
squa
re k
ilom
eter
s by
flood
dep
th p
er b
aran
gay.
Tabl
e 64
. Affe
cted
are
as in
Pag
sanj
an, L
agun
a du
ring
a 25
-yea
r rai
nfal
l ret
urn
perio
dAff
ecte
d Ar
ea(s
q. k
m.)
by fl
ood
dept
h (in
m.)
Affec
ted
Bara
ngay
s in
Pags
anja
n
Anib
ong
Bara
ngay
IBa
rang
ay II
Biña
nBu
boy
Caba
nban
anCa
lusic
heDi
ngin
0.03
-0.2
02.
390.
081
0.19
0.06
91.
610.
470.
52.
690.
21-0
.50
0.16
0.02
10.
052
0.07
40.
380.
180.
280.
150.
51-1
.00
0.07
10.
029
0.00
660.
470.
350.
250.
420.
111.
01-2
.00
0.14
0.09
20.
0000
121.
040.
510.
240.
90.
152.
01-5
.00
0.21
0.05
70
0.03
30.
390.
190.
540.
38>
5.00
0.15
0.03
50
00.
071
0.02
40.
190.
29
Tabl
e 65
. Affe
cted
are
as in
Pag
sanj
an, L
agun
a du
ring
a 25
-yea
r rai
nfal
l ret
urn
perio
d
Affec
ted
Area
(sq.
km
.) by
floo
d de
pth
(in m
.)
Affec
ted
Bara
ngay
s in
Pags
anja
n
Lam
bac
Layu
gan
Mag
dapi
oM
aula
win
Pina
gsan
jan
Saba
ngSa
mpa
loc
San
Isid
ro0.
03-0
.20
0.85
1.4
1.72
0.11
2.93
0.16
0.18
0.16
0.21
-0.5
00.
180.
410.
073
0.03
20.
230.
20.
090.
120.
51-1
.00
0.37
0.61
0.04
80.
056
0.35
0.42
0.23
0.18
1.01
-2.0
00.
650.
980.
051
0.15
0.74
0.48
0.68
0.14
2.01
-5.0
00.
012
0.48
0.06
90.
090.
510.
040.
130
> 5.
000.
0000
540.
032
00.
012
0.29
00.
034
0

Hazard Mapping of the Philippines Using LIDAR (Phil-LIDAR 1)
96
Figu
re 8
3. A
ffect
ed a
reas
in P
agsa
njan
, Lag
una
durin
g a
25-y
ear r
ainf
all r
etur
n pe
riod
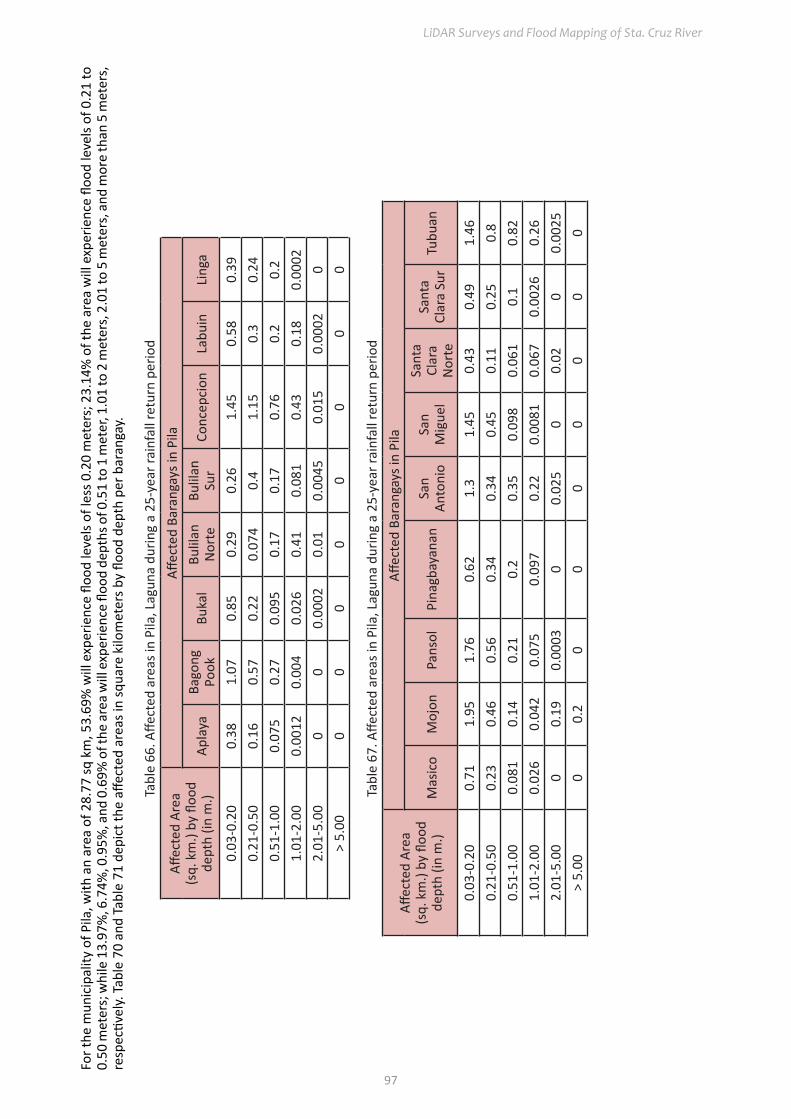
LiDAR Surveys and Flood Mapping of Sta. Cruz River
97
For t
he m
unic
ipal
ity o
f Pila
, with
an
area
of 2
8.77
sq k
m, 5
3.69
% w
ill e
xper
ienc
e flo
od le
vels
of le
ss 0
.20
met
ers;
23.
14%
of t
he a
rea
will
exp
erie
nce
flood
leve
ls of
0.2
1 to
0.
50 m
eter
s; w
hile
13.
97%
, 6.7
4%, 0
.95%
, and
0.6
9% o
f the
are
a w
ill e
xper
ienc
e flo
od d
epth
s of 0
.51
to 1
met
er, 1
.01
to 2
met
ers,
2.0
1 to
5 m
eter
s, a
nd m
ore
than
5 m
eter
s,
resp
ectiv
ely.
Tab
le 7
0 an
d Ta
ble
71 d
epic
t the
affe
cted
are
as in
squa
re k
ilom
eter
s by
flood
dep
th p
er b
aran
gay.
Tabl
e 66
. Affe
cted
are
as in
Pila
, Lag
una
durin
g a
25-y
ear r
ainf
all r
etur
n pe
riod
Affec
ted
Area
(sq.
km
.) by
floo
d de
pth
(in m
.)
Affec
ted
Bara
ngay
s in
Pila
Apla
yaBa
gong
Po
okBu
kal
Bulil
an
Nor
teBu
lilan
Su
rCo
ncep
cion
Labu
inLi
nga
0.03
-0.2
00.
381.
070.
850.
290.
261.
450.
580.
390.
21-0
.50
0.16
0.57
0.22
0.07
40.
41.
150.
30.
240.
51-1
.00
0.07
50.
270.
095
0.17
0.17
0.76
0.2
0.2
1.01
-2.0
00.
0012
0.00
40.
026
0.41
0.08
10.
430.
180.
0002
2.01
-5.0
00
00.
0002
0.01
0.00
450.
015
0.00
020
> 5.
000
00
00
00
0
Tabl
e 67
. Affe
cted
are
as in
Pila
, Lag
una
durin
g a
25-y
ear r
ainf
all r
etur
n pe
riod
Affec
ted
Area
(sq.
km
.) by
floo
d de
pth
(in m
.)
Affec
ted
Bara
ngay
s in
Pila
Mas
ico
Moj
onPa
nsol
Pina
gbay
anan
San
Anto
nio
San
Mig
uel
Sant
a Cl
ara
Nor
te
Sant
a Cl
ara
Sur
Tubu
an
0.03
-0.2
00.
711.
951.
760.
621.
31.
450.
430.
491.
460.
21-0
.50
0.23
0.46
0.56
0.34
0.34
0.45
0.11
0.25
0.8
0.51
-1.0
00.
081
0.14
0.21
0.2
0.35
0.09
80.
061
0.1
0.82
1.01
-2.0
00.
026
0.04
20.
075
0.09
70.
220.
0081
0.06
70.
0026
0.26
2.01
-5.0
00
0.19
0.00
030
0.02
50
0.02
00.
0025
> 5.
000
0.2
00
00
00
0

Hazard Mapping of the Philippines Using LIDAR (Phil-LIDAR 1)
98
Figu
re 8
4. A
ffect
ed a
reas
in P
ila, L
agun
a du
ring
a 25
-yea
r rai
nfal
l ret
urn
perio
d
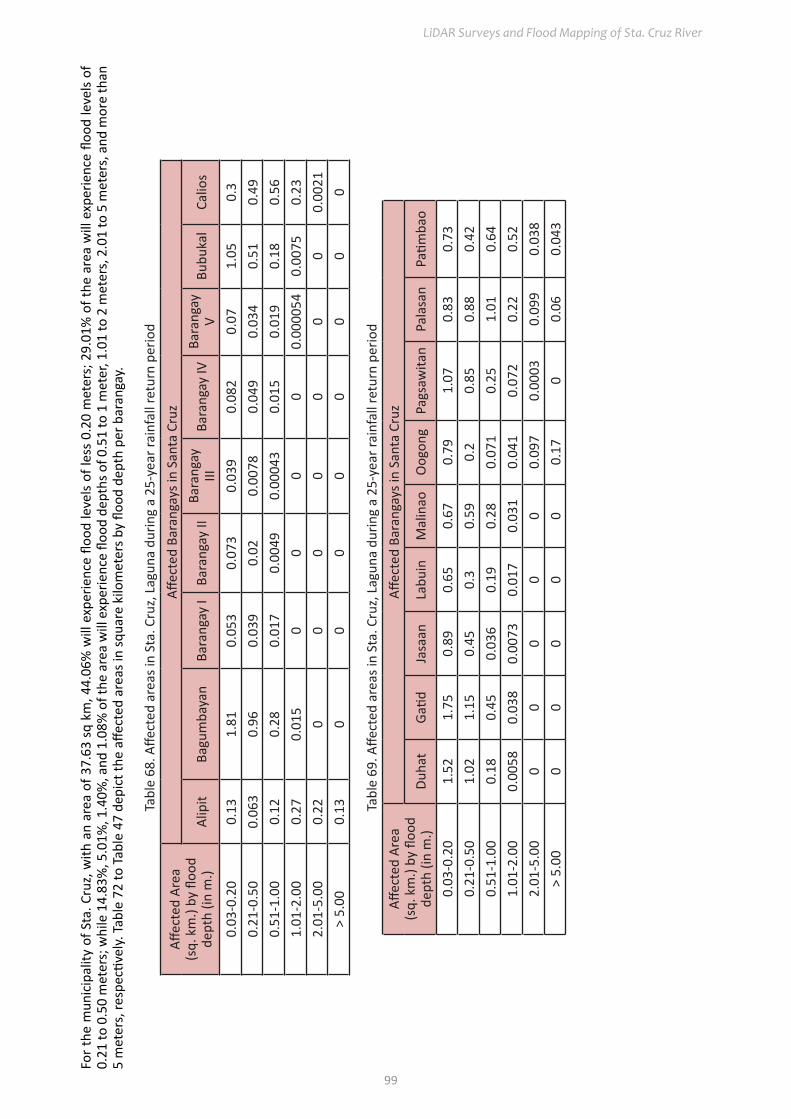
LiDAR Surveys and Flood Mapping of Sta. Cruz River
99
For t
he m
unic
ipal
ity o
f Sta
. Cru
z, w
ith a
n ar
ea o
f 37.
63 s
q km
, 44.
06%
will
exp
erie
nce
flood
leve
ls of
less
0.2
0 m
eter
s; 2
9.01
% o
f the
are
a w
ill e
xper
ienc
e flo
od le
vels
of
0.21
to 0
.50
met
ers;
whi
le 1
4.83
%, 5
.01%
, 1.4
0%, a
nd 1
.08%
of t
he a
rea
will
exp
erie
nce
flood
dep
ths o
f 0.5
1 to
1 m
eter
, 1.0
1 to
2 m
eter
s, 2
.01
to 5
met
ers,
and
mor
e th
an
5 m
eter
s, re
spec
tivel
y. T
able
72
to T
able
47
depi
ct th
e aff
ecte
d ar
eas i
n sq
uare
kilo
met
ers b
y flo
od d
epth
per
bar
anga
y.
Tabl
e 68
. Affe
cted
are
as in
Sta
. Cru
z, L
agun
a du
ring
a 25
-yea
r rai
nfal
l ret
urn
perio
d
Affec
ted
Area
(sq.
km
.) by
floo
d de
pth
(in m
.)
Affec
ted
Bara
ngay
s in
Sant
a Cr
uz
Alip
itBa
gum
baya
nBa
rang
ay I
Bara
ngay
IIBa
rang
ay
IIIBa
rang
ay IV
Bara
ngay
V
Bubu
kal
Calio
s
0.03
-0.2
00.
131.
810.
053
0.07
30.
039
0.08
20.
071.
050.
30.
21-0
.50
0.06
30.
960.
039
0.02
0.00
780.
049
0.03
40.
510.
490.
51-1
.00
0.12
0.28
0.01
70.
0049
0.00
043
0.01
50.
019
0.18
0.56
1.01
-2.0
00.
270.
015
00
00
0.00
0054
0.00
750.
232.
01-5
.00
0.22
00
00
00
00.
0021
> 5.
000.
130
00
00
00
0
Tabl
e 69
. Affe
cted
are
as in
Sta
. Cru
z, L
agun
a du
ring
a 25
-yea
r rai
nfal
l ret
urn
perio
dAff
ecte
d Ar
ea(s
q. k
m.)
by fl
ood
dept
h (in
m.)
Affec
ted
Bara
ngay
s in
Sant
a Cr
uz
Duha
tGa
tidJa
saan
Labu
inM
alin
aoO
ogon
gPa
gsaw
itan
Pala
san
Patim
bao
0.03
-0.2
01.
521.
750.
890.
650.
670.
791.
070.
830.
730.
21-0
.50
1.02
1.15
0.45
0.3
0.59
0.2
0.85
0.88
0.42
0.51
-1.0
00.
180.
450.
036
0.19
0.28
0.07
10.
251.
010.
641.
01-2
.00
0.00
580.
038
0.00
730.
017
0.03
10.
041
0.07
20.
220.
522.
01-5
.00
00
00
00.
097
0.00
030.
099
0.03
8>
5.00
00
00
00.
170
0.06
0.04
3

Hazard Mapping of the Philippines Using LIDAR (Phil-LIDAR 1)
100
Tabl
e 70
. Affe
cted
are
as in
Sta
. Cru
z, L
agun
a du
ring
a 25
-yea
r rai
nfal
l ret
urn
perio
d
Affec
ted
Area
(sq.
km
.) by
floo
d de
pth
(in m
.)
Affec
ted
Bara
ngay
s in
Sant
a Cr
uz
San
Jose
San
Juan
San
Pabl
o N
orte
San
Pabl
o Su
r
Santi
sima
Cruz
Sant
o An
gel
Cent
ral
Sant
o An
gel
Nor
te
Sant
o An
gel
Sur
0.03
-0.2
01.
470.
960.
140.
610.
340.
340
0.18
0.21
-0.5
00.
760.
480.
240.
630.
210.
110.
360.
110.
51-1
.00
0.29
0.24
0.08
10.
450.
022
0.02
30.
075
0.07
91.
01-2
.00
0.00
690.
010
0.28
0.00
0046
0.02
50.
073
0.02
2.01
-5.0
00.
0002
10.
0003
00
00.
026
00.
042
> 5.
000.
0000
070
00
00
00

LiDAR Surveys and Flood Mapping of Sta. Cruz River
101
Figu
re 8
5. A
ffect
ed a
reas
in S
ta. C
ruz,
Lag
una
durin
g a
25-y
ear r
ainf
all r
etur
n pe
riod
For t
he m
unic
ipal
ity o
f Vic
toria
, with
an
area
of 2
8.37
sq k
m, 3
3.33
% w
ill e
xper
ienc
e flo
od le
vels
of le
ss 0
.20
met
ers;
19.
29%
of t
he a
rea
will
exp
erie
nce
flood
leve
ls of
0.2
1 to
0.5
0 m
eter
s; w
hile
18.
87%
, 13.
47%
, and
1.6
6% o
f the
are
a w
ill e
xper
ienc
e flo
od d
epth
s of 0
.51
to 1
met
er, 1
.01
to 2
met
ers,
and
mor
e th
an 2
met
ers,
resp
ectiv
ely.
Tabl
e

Hazard Mapping of the Philippines Using LIDAR (Phil-LIDAR 1)
102
75 d
epic
ts th
e aff
ecte
d ar
eas i
n sq
uare
kilo
met
ers b
y flo
od d
epth
per
bar
anga
y.
Tabl
e 71
. Affe
cted
are
as in
Vic
toria
, Lag
una
durin
g a
25-y
ear r
ainf
all r
etur
n pe
riod
Affec
ted
Area
(sq.
km
.) by
floo
d de
pth
(in m
.)
Affec
ted
Bara
ngay
s in
Vict
oria
Banc
a-Ba
nca
Dani
wM
asap
ang
Nan
haya
Paga
lang
anSa
n Be
nito
San
Felix
San
Fran
cisc
oSa
n Ro
que
0.03
-0.2
01.
291.
610.
310.
760.
650.
451.
31.
771.
310.
21-0
.50
0.61
0.96
0.33
0.31
0.45
0.42
1.55
0.39
0.45
0.51
-1.0
00.
321.
150.
740.
084
0.46
0.61
1.7
0.11
0.18
1.01
-2.0
00.
131.
840.
530.
015
0.13
0.54
0.61
0.00
910.
004
2.01
-5.0
00.
022
0.39
0.05
40
00.
0027
0.00
350.
0002
0>
5.00
00
00
00
00
0

LiDAR Surveys and Flood Mapping of Sta. Cruz River
103
Figu
re 8
6. A
ffect
ed a
reas
in V
icto
ria, L
agun
a du
ring
a 25
-yea
r rai
nfal
l ret
urn
perio
d

Hazard Mapping of the Philippines Using LIDAR (Phil-LIDAR 1)
104
For the 100-Year return period, 3.86% of the municipality of Calauan with an area of 79.44 sq km will experience flood levels of less 0.20 meters; 0.84% of the area will experience flood levels of 0.21 to 0.50 meters; while 0.56%, 0.14%, 0.03%, and 0.0004% of the area will experience flood depths of 0.51 to 1 meter, 1.01 to 2 meters, 2.01 t0 5 meters, and more than 5 meters, respectively. Table 76 depicts the areas affected in Calauan in square kilometers by flood depth per barangay.
Table 72. Affected areas in Calauan, Laguna during a 100-year rainfall return period
Affected Area(sq. km.) by flood
depth (in m.)
Affected Barangays in Calauan
Dayap Lamot 2 Santo Tomas
0.03-0.20 0.4 2.53 0.140.21-0.50 0.16 0.25 0.250.51-1.00 0.13 0.098 0.211.01-2.00 0.052 0.036 0.0212.01-5.00 0.000065 0.019 0.0062
> 5.00 0 0.0003 0
Figure 87. Affected areas in Calauan, Laguna during a 100-year rainfall return period

LiDAR Surveys and Flood Mapping of Sta. Cruz River
105
For the municipality of Cavinti, with an area of 96.78 sq km, 0.90% will experience flood levels of less 0.20 meters; 0.04% of the area will experience flood levels of 0.21 to 0.50 meters; while 0.02%, 0.01%, 0.01%, and 0.001% of the area will experience flood depths of 0.51 to 1 meter, 1.01 to 2 meters, 2.01 to 5 meters, and more than 5 meters, respectively. Table 77 depicts the affected areas in square kilometers by flood depth per barangay.
Table 73. Affected areas in Cavinti, Laguna during a 100-year rainfall return periodAffected Area
(sq. km.) by flood depth (in m.)
Affected Barangays in Cavinti
Anglas Bangco Bulajo
0.03-0.20 0.44 0.43 0.00260.21-0.50 0.014 0.014 00.51-1.00 0.0079 0.0049 01.01-2.00 0.0019 0.0033 02.01-5.00 0.0015 0.0026 0
> 5.00 0 0.0002 0
Figure 88. Affected areas in Cavinti, Laguna during a 100-year rainfall return period

Hazard Mapping of the Philippines Using LIDAR (Phil-LIDAR 1)
106
For the municipality of Laguna Lake, with an area of 892.20 sq km, 0.03% will experience flood levels of less 0.20 meters; 0.02% of the area will experience flood levels of 0.21 to 0.50 meters; while 0.01%, 0.03%, and 0.01% of the area will experience flood depths of 0.51 to 1 meter, 1.01 to 2 meters, and more than 2 meters, respectively. Table 78 depicts the affected areas in square kilometers by flood depth per barangay.
Table 74. Affected areas in Laguna Lake, Laguna during a 100-year rainfall return period
Affected Area(sq. km.) by flood
depth (in m.)
Affected Barangays in Laguna lakeLaguna Lake
0.03-0.20 0.260.21-0.50 0.150.51-1.00 0.0711.01-2.00 0.252.01-5.00 0.083
> 5.00 0
Figure 89. Affected areas in Laguna Lake, Laguna during a 100-year rainfall return period

LiDAR Surveys and Flood Mapping of Sta. Cruz River
107
For the municipality of Liliw, with an area of 36.20 sq km, 1.47% will experience flood levels of less 0.20 meters; 0.12% of the area will experience flood levels of 0.21 to 0.50 meters; while 0.05%, 0.09%, 0.35%, and 0.14% of the area will experience flood depths of 0.51 to 1 meter, 1.01 to 2 meters, 2.01 to 5 meters, and more than 5 meters, respectively. Table 79 depicts the affected areas in square kilometers by flood depth per barangay.
Table 75. Affected areas in Liliw, Laguna during a 100-year rainfall return periodAffected Area
(sq. km.) by flood depth (in m.)
Affected Barangays in Liliw
Dagatan Daniw Dita Mojon
0.03-0.20 0.054 0.08 0.012 0.380.21-0.50 0.0003 0.0025 0.00055 0.0410.51-1.00 0 0.00052 0.00035 0.0171.01-2.00 0 0.00029 0.000009 0.0312.01-5.00 0 0 0 0.13
> 5.00 0 0 0 0.05
Figure 90. Affected areas in Liliw, Laguna during a 100-year rainfall return period

Hazard Mapping of the Philippines Using LIDAR (Phil-LIDAR 1)
108
For the municipality of Luisiana, with an area of 61.01 sq km, 4.50% will experience flood levels of less 0.20 meters; 0.11% of the area will experience flood levels of 0.21 to 0.50 meters; while 0.07%, 0.07%, 0.15%, and 0.13% of the area will experience flood depths of 0.51 to 1 meter, 1.01 to 2 meters, 2.01 to 5 meters, and more than 5 meters, respectively. Table 80 depicts the affected areas in square kilometers by flood depth per barangay.
Table 76. Affected areas in Luisiana, Laguna during a 100-year rainfall return period
Affected Area(sq. km.) by flood
depth (in m.)
Affected Barangays in Luisiana
San Diego
San Salvador
0.03-0.20 0.0012 2.750.21-0.50 0 0.0650.51-1.00 0 0.0451.01-2.00 0 0.0442.01-5.00 0 0.09
> 5.00 0 0.077
Figure 91. Affected areas in Luisiana, Laguna during a 100-year rainfall return period
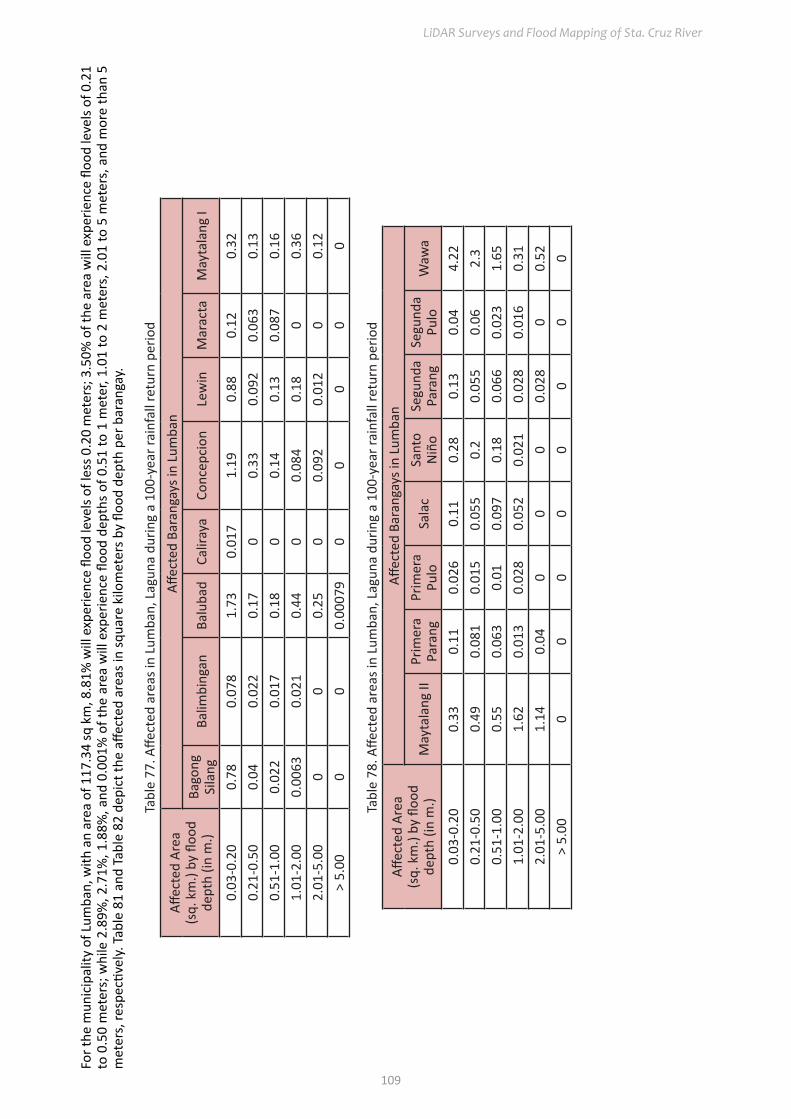
LiDAR Surveys and Flood Mapping of Sta. Cruz River
109
For t
he m
unic
ipal
ity o
f Lum
ban,
with
an
area
of 1
17.3
4 sq
km
, 8.8
1% w
ill e
xper
ienc
e flo
od le
vels
of le
ss 0
.20
met
ers;
3.5
0% o
f the
are
a w
ill e
xper
ienc
e flo
od le
vels
of 0
.21
to 0
.50
met
ers;
whi
le 2
.89%
, 2.7
1%, 1
.88%
, and
0.0
01%
of t
he a
rea
will
exp
erie
nce
flood
dep
ths
of 0
.51
to 1
met
er, 1
.01
to 2
met
ers,
2.0
1 to
5 m
eter
s, a
nd m
ore
than
5
met
ers,
resp
ectiv
ely.
Tab
le 8
1 an
d Ta
ble
82 d
epic
t the
affe
cted
are
as in
squa
re k
ilom
eter
s by
flood
dep
th p
er b
aran
gay.
Tabl
e 77
. Affe
cted
are
as in
Lum
ban,
Lag
una
durin
g a
100-
year
rain
fall
retu
rn p
erio
d
Affec
ted
Area
(sq.
km
.) by
floo
d de
pth
(in m
.)
Affec
ted
Bara
ngay
s in
Lum
ban
Bago
ng
Sila
ngBa
limbi
ngan
Balu
bad
Calir
aya
Conc
epci
onLe
win
Mar
acta
May
tala
ng I
0.03
-0.2
00.
780.
078
1.73
0.01
71.
190.
880.
120.
320.
21-0
.50
0.04
0.02
20.
170
0.33
0.09
20.
063
0.13
0.51
-1.0
00.
022
0.01
70.
180
0.14
0.13
0.08
70.
161.
01-2
.00
0.00
630.
021
0.44
00.
084
0.18
00.
362.
01-5
.00
00
0.25
00.
092
0.01
20
0.12
> 5.
000
00.
0007
90
00
00
Tabl
e 78
. Affe
cted
are
as in
Lum
ban,
Lag
una
durin
g a
100-
year
rain
fall
retu
rn p
erio
d
Affec
ted
Area
(sq.
km
.) by
floo
d de
pth
(in m
.)
Affec
ted
Bara
ngay
s in
Lum
ban
May
tala
ng II
Prim
era
Para
ngPr
imer
a Pu
loSa
lac
Sant
o N
iño
Segu
nda
Para
ngSe
gund
a Pu
loW
awa
0.03
-0.2
00.
330.
110.
026
0.11
0.28
0.13
0.04
4.22
0.21
-0.5
00.
490.
081
0.01
50.
055
0.2
0.05
50.
062.
30.
51-1
.00
0.55
0.06
30.
010.
097
0.18
0.06
60.
023
1.65
1.01
-2.0
01.
620.
013
0.02
80.
052
0.02
10.
028
0.01
60.
312.
01-5
.00
1.14
0.04
00
00.
028
00.
52>
5.00
00
00
00
00

Hazard Mapping of the Philippines Using LIDAR (Phil-LIDAR 1)
110
Figu
re 9
2. A
ffect
ed a
reas
in L
umba
n, L
agun
a du
ring
a 10
0-ye
ar ra
infa
ll re
turn
per
iod

LiDAR Surveys and Flood Mapping of Sta. Cruz River
111
For t
he m
unic
ipal
ity o
f Mag
dale
na, w
ith a
n ar
ea o
f 29.
61 s
q km
, 52.
26%
will
exp
erie
nce
flood
leve
ls of
less
0.2
0 m
eter
s; 9
.97%
of t
he a
rea
will
exp
erie
nce
flood
leve
ls of
0.
21 to
0.5
0 m
eter
s; w
hile
6.5
3%, 7
.92%
, 8.5
6%, a
nd 6
.40%
of t
he a
rea
will
exp
erie
nce
flood
dep
ths o
f 0.5
1 to
1 m
eter
, 1.0
1 to
2 m
eter
s, 2
.01
to 5
met
ers,
and
mor
e th
an
5 m
eter
s, re
spec
tivel
y. T
able
83
to T
able
85
depi
ct th
e aff
ecte
d ar
eas i
n sq
uare
kilo
met
ers b
y flo
od d
epth
per
bar
anga
y.
Tabl
e 79
. Affe
cted
are
as in
Mag
dale
na, L
agun
a du
ring
a 10
0-ye
ar ra
infa
ll re
turn
per
iod
Affec
ted
Area
(sq.
km
.) by
floo
d de
pth
(in m
.)
Affec
ted
Bara
ngay
s in
Mag
dale
na
Alip
itBa
anan
Bala
nac
Buca
lBu
enav
ista
Bung
kol
Buo
Burlu
ngan
0.03
-0.2
01.
040.
30.
160.
530.
511.
680.
531.
120.
21-0
.50
0.22
0.03
40.
092
0.29
0.16
0.25
0.07
10.
140.
51-1
.00
0.13
0.01
50.
180.
089
0.25
0.03
30.
072
0.03
21.
01-2
.00
0.13
0.00
630.
360.
030.
340.
024
0.07
80.
048
2.01
-5.0
00.
20.
0012
0.43
0.03
10.
230.
028
0.07
20.
19>
5.00
0.09
40
0.39
0.22
0.01
20.
0023
0.03
90.
05
Tabl
e 80
. Affe
cted
are
as in
Mag
dale
na, L
agun
a du
ring
a 10
0-ye
ar ra
infa
ll re
turn
per
iod
Affec
ted
Area
(sq.
km
.) by
floo
d de
pth
(in m
.)
Affec
ted
Bara
ngay
s in
Mag
dale
na
Ciga
ras
Hala
yhay
inIb
aban
g Ati
ngay
Ibab
ang
Butn
ong
Ilaya
ng
Ating
ayIla
yang
Bu
tnon
gIlo
gM
alak
ing
Ambl
ing
0.03
-0.2
00.
150.
910.
230.
960.
690.
410.
086
0.42
0.21
-0.5
00.
056
0.12
0.04
90.
094
0.15
0.01
90.
029
0.05
20.
51-1
.00
0.11
0.02
30.
054
0.05
10.
140.
013
0.05
70.
016
1.01
-2.0
00.
340.
014
0.04
0.05
90.
095
0.02
10.
160.
016
2.01
-5.0
00.
380.
098
0.04
10.
026
0.05
60.
021
0.17
0.06
9>
5.00
0.07
70.
083
0.17
0.00
066
0.05
70.
0092
0.00
940.
061
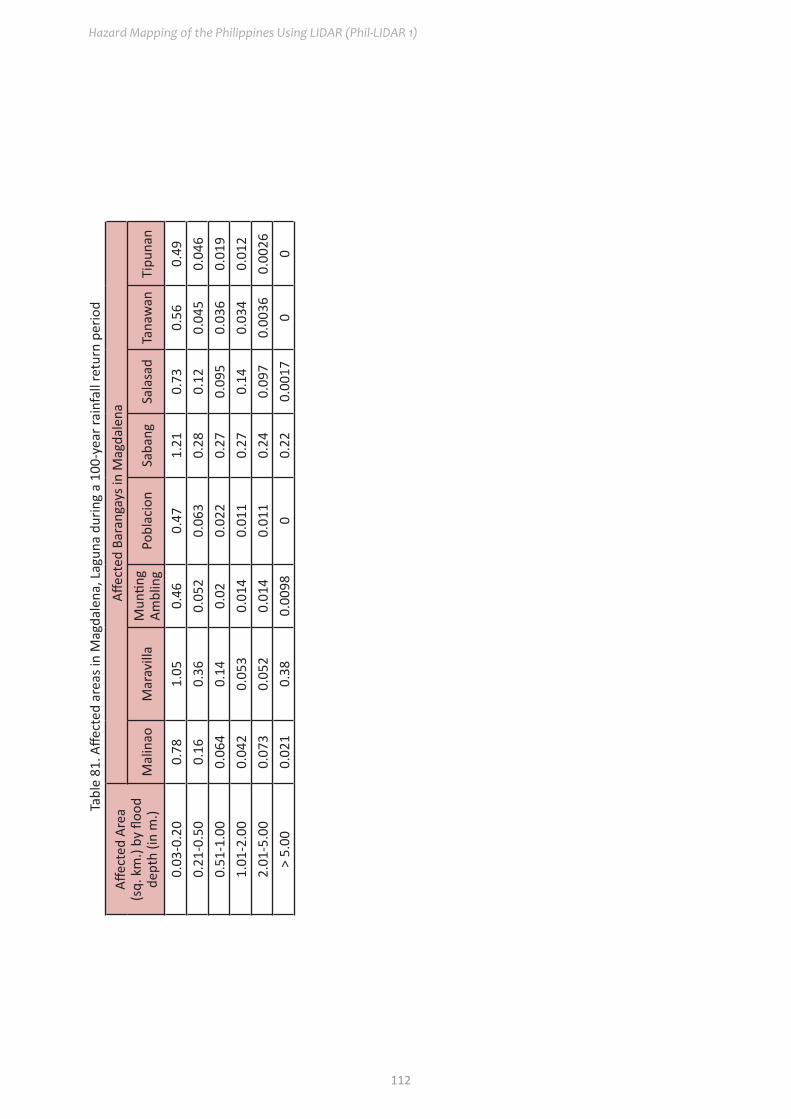
Hazard Mapping of the Philippines Using LIDAR (Phil-LIDAR 1)
112
Tabl
e 81
. Affe
cted
are
as in
Mag
dale
na, L
agun
a du
ring
a 10
0-ye
ar ra
infa
ll re
turn
per
iod
Affec
ted
Area
(sq.
km
.) by
floo
d de
pth
(in m
.)
Affec
ted
Bara
ngay
s in
Mag
dale
na
Mal
inao
Mar
avill
aM
untin
g Am
blin
gPo
blac
ion
Saba
ngSa
lasa
dTa
naw
anTi
puna
n
0.03
-0.2
00.
781.
050.
460.
471.
210.
730.
560.
490.
21-0
.50
0.16
0.36
0.05
20.
063
0.28
0.12
0.04
50.
046
0.51
-1.0
00.
064
0.14
0.02
0.02
20.
270.
095
0.03
60.
019
1.01
-2.0
00.
042
0.05
30.
014
0.01
10.
270.
140.
034
0.01
22.
01-5
.00
0.07
30.
052
0.01
40.
011
0.24
0.09
70.
0036
0.00
26>
5.00
0.02
10.
380.
0098
00.
220.
0017
00

LiDAR Surveys and Flood Mapping of Sta. Cruz River
113
Figu
re 9
3. A
ffect
ed a
reas
in M
agda
lena
, Lag
una
durin
g a
100-
year
rain
fall
retu
rn p
erio
d

Hazard Mapping of the Philippines Using LIDAR (Phil-LIDAR 1)
114
For the municipality of Majayjay, with an area of 64.40 sq km, 5.09% will experience flood levels of less 0.20 meters; 0.36% of the area will experience flood levels of 0.21 to 0.50 meters; while 0.22%, 0.11%, 0.06%, and 0.01% of the area will experience flood depths of 0.51 to 1 meter, 1.01 to 2 meters, 2.01 to 5 meters, and more than 5 meters, respectively. Table 86 depicts the affected areas in square kilometers by flood depth per barangay.
Table 82. Affected areas in Majayjay, Laguna during a 100-year rainfall return period
Affected Area(sq. km.) by flood
depth (in m.)
Affected Barangays in Majayjay
Balanac Banilad Banti Burol San Isidro Tanawan
0.03-0.20 0.081 0.99 0.72 0.032 0.012 1.450.21-0.50 0.0039 0.084 0.036 0.00024 0.0011 0.10.51-1.00 0.00058 0.068 0.017 0 0.0015 0.0571.01-2.00 0 0.034 0.0063 0 0 0.0332.01-5.00 0 0.032 0.0002 0 0 0.0074
> 5.00 0 0.009 0 0 0 0
Figure 94. Affected areas in Majayjay, Laguna during a 100-year rainfall return period

LiDAR Surveys and Flood Mapping of Sta. Cruz River
115
For t
he m
unic
ipal
ity o
f Nag
carla
n, w
ith a
n ar
ea o
f 81.
20 s
q km
, 22.
65%
will
exp
erie
nce
flood
leve
ls of
less
0.2
0 m
eter
s; 3
.90%
of t
he a
rea
will
exp
erie
nce
flood
leve
ls of
0.
21 to
0.5
0 m
eter
s; w
hile
2.8
2%, 2
.53%
, 1.9
6%, a
nd 1
.46%
of t
he a
rea
will
exp
erie
nce
flood
dep
ths o
f 0.5
1 to
1 m
eter
, 1.0
1 to
2 m
eter
s, 2
.01
to 5
met
ers,
and
mor
e th
an
5 m
eter
s, re
spec
tivel
y. T
able
87
and
Tabl
e 88
dep
ict t
he a
ffect
ed a
reas
in sq
uare
kilo
met
ers b
y flo
od d
epth
per
bar
anga
y.
Tabl
e 83
. Affe
cted
are
as in
Nag
carla
n, L
agun
a du
ring
a 10
0-ye
ar ra
infa
ll re
turn
per
iod
Affec
ted
Area
(sq.
km
.) by
floo
d de
pth
(in m
.)
Affec
ted
Bara
ngay
s in
Nag
carla
n
Bala
yong
Banc
a-Ba
nca
Baya
quito
sBu
enav
ista
Buha
ngin
anCa
lum
pang
Kanl
uran
Ka
bubu
haya
nLa
bang
an
0.03
-0.2
00.
31.
850.
52.
951.
221.
290.
740.
650.
21-0
.50
0.01
70.
690.
016
0.17
0.42
0.25
0.14
0.02
40.
51-1
.00
0.00
480.
480.
011
0.12
0.06
10.
140.
046
0.01
51.
01-2
.00
0.00
110.
370.
0066
0.05
30.
0018
0.38
0.01
40.
0075
2.01
-5.0
00.
0003
0.19
0.00
320.
024
00.
890.
0028
0.00
091
> 5.
000
0.08
10
0.00
740
0.73
00
Tabl
e 84
. Affe
cted
are
as in
Nag
carla
n, L
agun
a du
ring
a 10
0-ye
ar ra
infa
ll re
turn
per
iod
Affec
ted
Area
(sq.
km
.) by
floo
d de
pth
(in m
.)
Affec
ted
Bara
ngay
s in
Nag
carla
n
Lagu
loLa
wag
uin
Man
aol
Mar
avill
aSa
bang
Sibu
lan
Sila
ngan
Ka
bubu
haya
nW
akat
0.03
-0.2
00.
42.
20.
721.
620.
311.
460.
231.
950.
21-0
.50
0.01
30.
110.
320.
410.
027
0.13
0.03
60.
410.
51-1
.00
0.00
60.
049
0.13
0.68
0.00
40.
063
0.01
0.48
1.01
-2.0
00.
0026
0.02
80.
0026
0.66
0.00
047
0.06
80.
0052
0.46
2.01
-5.0
00.
0019
0.03
80.
0016
0.31
0.00
034
0.1
0.00
040.
03>
5.00
0.00
010.
004
0.00
0093
0.35
0.00
011
0.00
820
0.00
13
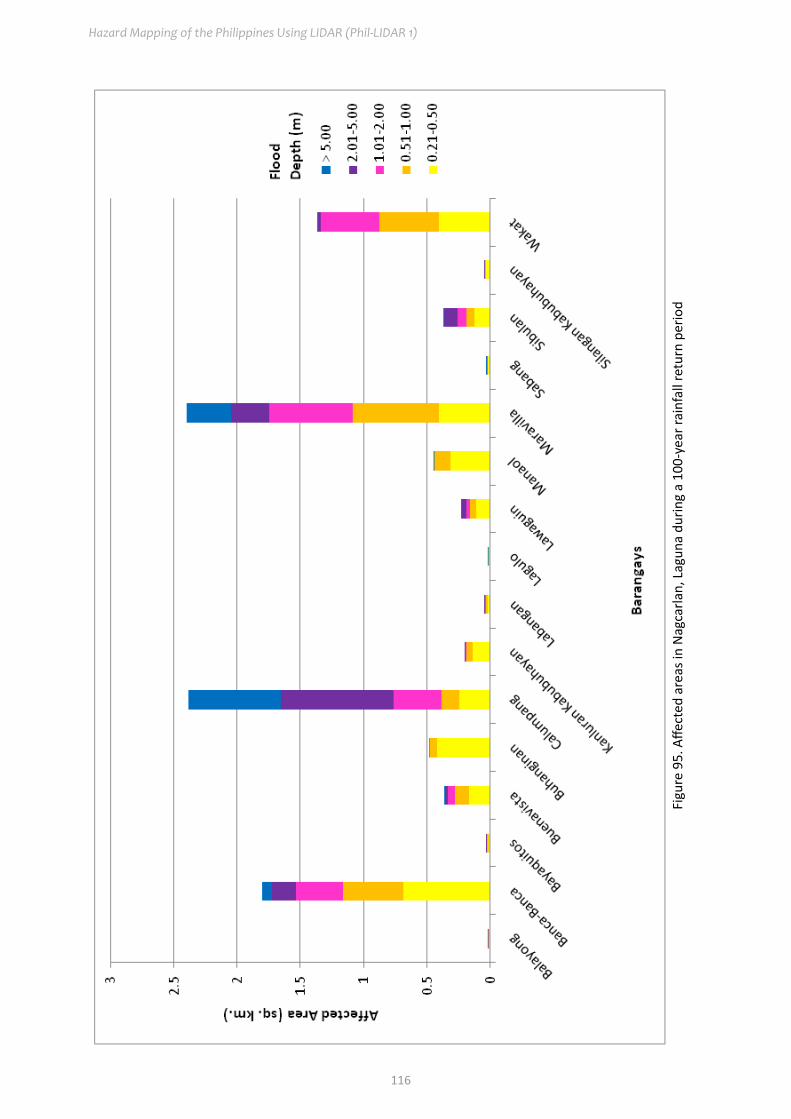
Hazard Mapping of the Philippines Using LIDAR (Phil-LIDAR 1)
116
Figu
re 9
5. A
ffect
ed a
reas
in N
agca
rlan,
Lag
una
durin
g a
100-
year
rain
fall
retu
rn p
erio
d

LiDAR Surveys and Flood Mapping of Sta. Cruz River
117
For t
he m
unic
ipal
ity o
f Pag
sanj
an, w
ith a
n ar
ea o
f 40.
77 sq
km
, 37.
38%
will
exp
erie
nce
flood
leve
ls of
less
0.2
0 m
eter
s; 5
.57%
of t
he a
rea
will
exp
erie
nce
flood
leve
ls of
0.2
1 to
0.5
0 m
eter
s; w
hile
8.5
1%, 1
8.25
%, 1
1.49
%, a
nd 3
.11%
of t
he a
rea
will
exp
erie
nce
flood
dep
ths o
f 0.5
1 to
1 m
eter
, 1.0
1 to
2 m
eter
s, 2
.01
to 5
met
ers,
and
mor
e th
an 5
m
eter
s, re
spec
tivel
y. T
able
89
and
Tabl
e 90
dep
ict t
he a
ffect
ed a
reas
in sq
uare
kilo
met
ers b
y flo
od d
epth
per
bar
anga
y.
Tabl
e 85
. Affe
cted
are
as in
Pag
sanj
an, L
agun
a du
ring
a 10
0-ye
ar ra
infa
ll re
turn
per
iod
Affec
ted
Area
(sq.
km
.) by
floo
d de
pth
(in m
.)
Affec
ted
Bara
ngay
s in
Pags
anja
n
Anib
ong
Bara
ngay
IBa
rang
ay II
Biña
nBu
boy
Caba
nban
anCa
lusic
heDi
ngin
0.03
-0.2
02.
340.
120.
250.
031.
240.
260.
422.
630.
21-0
.50
0.16
0.02
10.
061
0.03
60.
430.
170.
210.
160.
51-1
.00
0.06
80.
030.
034
0.16
0.45
0.3
0.37
0.11
1.01
-2.0
00.
076
0.08
90.
0045
1.29
0.57
0.32
0.82
0.13
2.01
-5.0
00.
290.
062
00.
170.
510.
270.
820.
43>
5.00
0.18
0.03
60
00.
093
0.02
60.
20.
31
Tabl
e 86
. Affe
cted
are
as in
Pag
sanj
an, L
agun
a du
ring
a 10
0-ye
ar ra
infa
ll re
turn
per
iod
Affec
ted
Area
(sq.
km
.) by
floo
d de
pth
(in m
.)
Affec
ted
Bara
ngay
s in
Pags
anja
n
Lam
bac
Layu
gan
Mag
dapi
oM
aula
win
Pina
gsan
jan
Saba
ngSa
mpa
loc
San
Isid
ro0.
03-0
.20
0.86
1.21
1.87
0.09
53.
490.
086
0.14
0.19
0.21
-0.5
00.
190.
260.
077
0.03
60.
240.
077
0.06
70.
067
0.51
-1.0
00.
40.
470.
050.
057
0.35
0.34
0.15
0.13
1.01
-2.0
00.
621.
020.
049
0.13
0.74
0.64
0.67
0.26
2.01
-5.0
00.
012
0.88
0.08
80.
110.
540.
150.
280.
056
> 5.
000.
0001
0.07
10.
001
0.01
30.
30
0.03
60

Hazard Mapping of the Philippines Using LIDAR (Phil-LIDAR 1)
118
Figu
re 9
6. A
ffect
ed a
reas
in P
agsa
njan
, Lag
una
durin
g a
100-
year
rain
fall
retu
rn p
erio
d
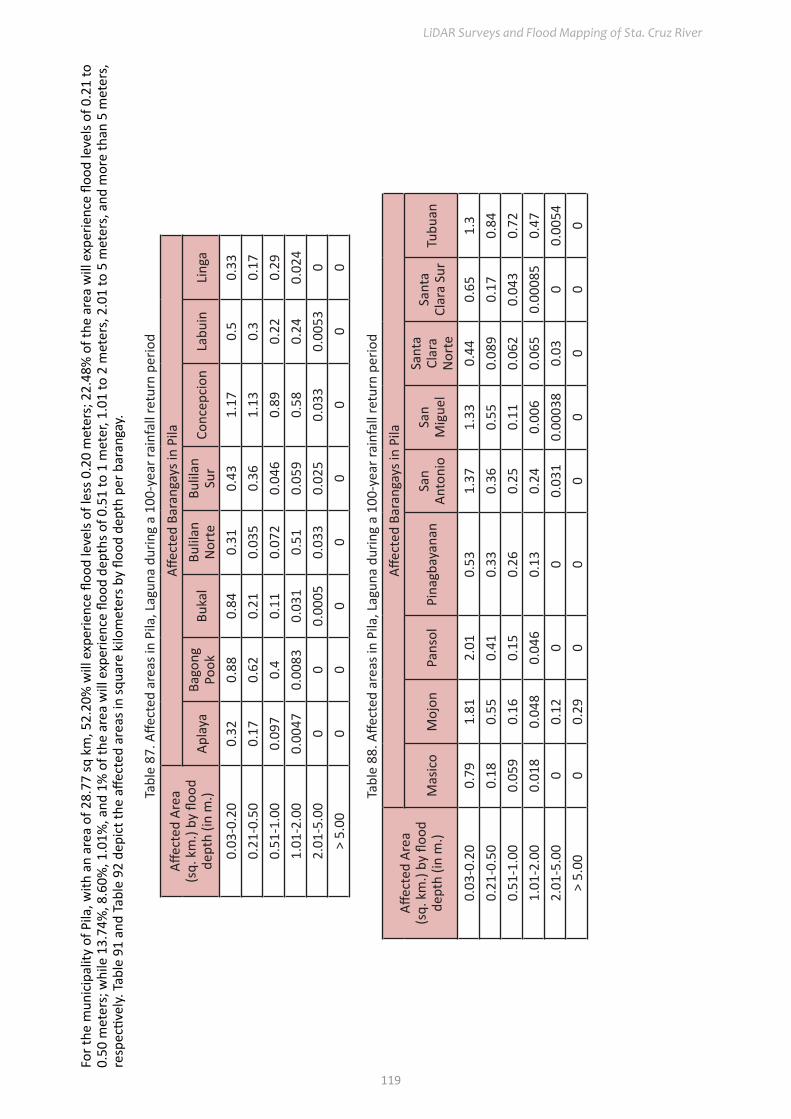
LiDAR Surveys and Flood Mapping of Sta. Cruz River
119
For t
he m
unic
ipal
ity o
f Pila
, with
an
area
of 2
8.77
sq k
m, 5
2.20
% w
ill e
xper
ienc
e flo
od le
vels
of le
ss 0
.20
met
ers;
22.
48%
of t
he a
rea
will
exp
erie
nce
flood
leve
ls of
0.2
1 to
0.
50 m
eter
s; w
hile
13.
74%
, 8.6
0%, 1
.01%
, and
1%
of t
he a
rea
will
exp
erie
nce
flood
dep
ths o
f 0.5
1 to
1 m
eter
, 1.0
1 to
2 m
eter
s, 2
.01
to 5
met
ers,
and
mor
e th
an 5
met
ers,
re
spec
tivel
y. T
able
91
and
Tabl
e 92
dep
ict t
he a
ffect
ed a
reas
in sq
uare
kilo
met
ers b
y flo
od d
epth
per
bar
anga
y.
Tabl
e 87
. Affe
cted
are
as in
Pila
, Lag
una
durin
g a
100-
year
rain
fall
retu
rn p
erio
d
Affec
ted
Area
(sq.
km
.) by
floo
d de
pth
(in m
.)
Affec
ted
Bara
ngay
s in
Pila
Apla
yaBa
gong
Po
okBu
kal
Bulil
an
Nor
teBu
lilan
Su
rCo
ncep
cion
Labu
inLi
nga
0.03
-0.2
00.
320.
880.
840.
310.
431.
170.
50.
330.
21-0
.50
0.17
0.62
0.21
0.03
50.
361.
130.
30.
170.
51-1
.00
0.09
70.
40.
110.
072
0.04
60.
890.
220.
291.
01-2
.00
0.00
470.
0083
0.03
10.
510.
059
0.58
0.24
0.02
42.
01-5
.00
00
0.00
050.
033
0.02
50.
033
0.00
530
> 5.
000
00
00
00
0
Tabl
e 88
. Affe
cted
are
as in
Pila
, Lag
una
durin
g a
100-
year
rain
fall
retu
rn p
erio
d
Affec
ted
Area
(sq.
km
.) by
floo
d de
pth
(in m
.)
Affec
ted
Bara
ngay
s in
Pila
Mas
ico
Moj
onPa
nsol
Pina
gbay
anan
San
Anto
nio
San
Mig
uel
Sant
a Cl
ara
Nor
te
Sant
a Cl
ara
Sur
Tubu
an
0.03
-0.2
00.
791.
812.
010.
531.
371.
330.
440.
651.
30.
21-0
.50
0.18
0.55
0.41
0.33
0.36
0.55
0.08
90.
170.
840.
51-1
.00
0.05
90.
160.
150.
260.
250.
110.
062
0.04
30.
721.
01-2
.00
0.01
80.
048
0.04
60.
130.
240.
006
0.06
50.
0008
50.
472.
01-5
.00
00.
120
00.
031
0.00
038
0.03
00.
0054
> 5.
000
0.29
00
00
00
0

Hazard Mapping of the Philippines Using LIDAR (Phil-LIDAR 1)
120
Figu
re 9
7. A
ffect
ed a
reas
in P
ila, L
agun
a du
ring
a 10
0-ye
ar ra
infa
ll re
turn
per
iod
For t
he m
unic
ipal
ity o
f Sta
. Cru
z, w
ith a
n ar
ea o
f 37.
63 s
q km
, 36.
71%
will
exp
erie
nce
flood
leve
ls of
less
0.2
0 m
eter
s; 2
9.70
% o
f the
are
a w
ill e
xper
ienc
e flo
od le
vels
of
0.21
to 0
.50
met
ers;
whi
le 1
9.26
%, 8
.29%
, 2.1
0%, a
nd 1
.11%
of t
he a
rea
will
exp
erie
nce
flood
dep
ths o
f 0.5
1 to
1 m
eter
, 1.0
1 to
2 m
eter
s, 2
.01
to 5
met
ers,
and
mor
e th
an
5 m
eter
s, re
spec
tivel
y. T
able
93
to T
able
95
depi
ct th
e aff
ecte
d ar
eas i
n sq
uare
kilo
met
ers b
y flo
od d
epth
per
bar
anga
y.

LiDAR Surveys and Flood Mapping of Sta. Cruz River
121
Tabl
e 89
. Affe
cted
are
as in
Sta
. Cru
z, L
agun
a du
ring
a 10
0-ye
ar ra
infa
ll re
turn
per
iod
Affec
ted
Area
(sq.
km
.) by
floo
d de
pth
(in m
.)
Affec
ted
Bara
ngay
s in
Sant
a Cr
uz
Alip
itBa
gum
baya
nBa
rang
ay I
Bara
ngay
II
Bara
ngay
III
Bara
ngay
IVBa
rang
ay V
Bubu
kal
Calio
s
0.03
-0.2
00.
074
1.53
0.04
80.
070.
037
0.07
40.
063
0.87
0.12
0.21
-0.5
00.
026
1.05
0.04
30.
038
0.01
60.
049
0.03
70.
570.
320.
51-1
.00
0.09
40.
430.
018
0.00
610.
001
0.02
10.
023
0.28
0.67
1.01
-2.0
00.
230.
029
00
00
0.00
025
0.03
50.
462.
01-5
.00
0.38
00
00
00
00.
0083
> 5.
000.
140
00
00
00
0
Tabl
e 90
. Affe
cted
are
as in
Sta
. Cru
z, L
agun
a du
ring
a 10
0-ye
ar ra
infa
ll re
turn
per
iod
Affec
ted
Area
(sq.
km
.) by
floo
d de
pth
(in m
.)
Affec
ted
Bara
ngay
s in
Sant
a Cr
uz
Duha
tGa
tidJa
saan
Labu
inM
alin
aoO
ogon
gPa
gsaw
itan
Pala
san
Patim
bao
0.03
-0.2
01.
271.
40.
710.
580.
540.
730.
690.
560.
560.
21-0
.50
1.08
1.27
0.61
0.3
0.58
0.25
0.97
0.71
0.36
0.51
-1.0
00.
370.
620.
055
0.25
0.41
0.08
40.
391.
180.
541.
01-2
.00
0.01
0.07
40.
010.
030.
049
0.03
40.
180.
450.
852.
01-5
.00
00
00
00.
120.
018
0.13
0.03
9>
5.00
00
00
00.
170
0.06
30.
043
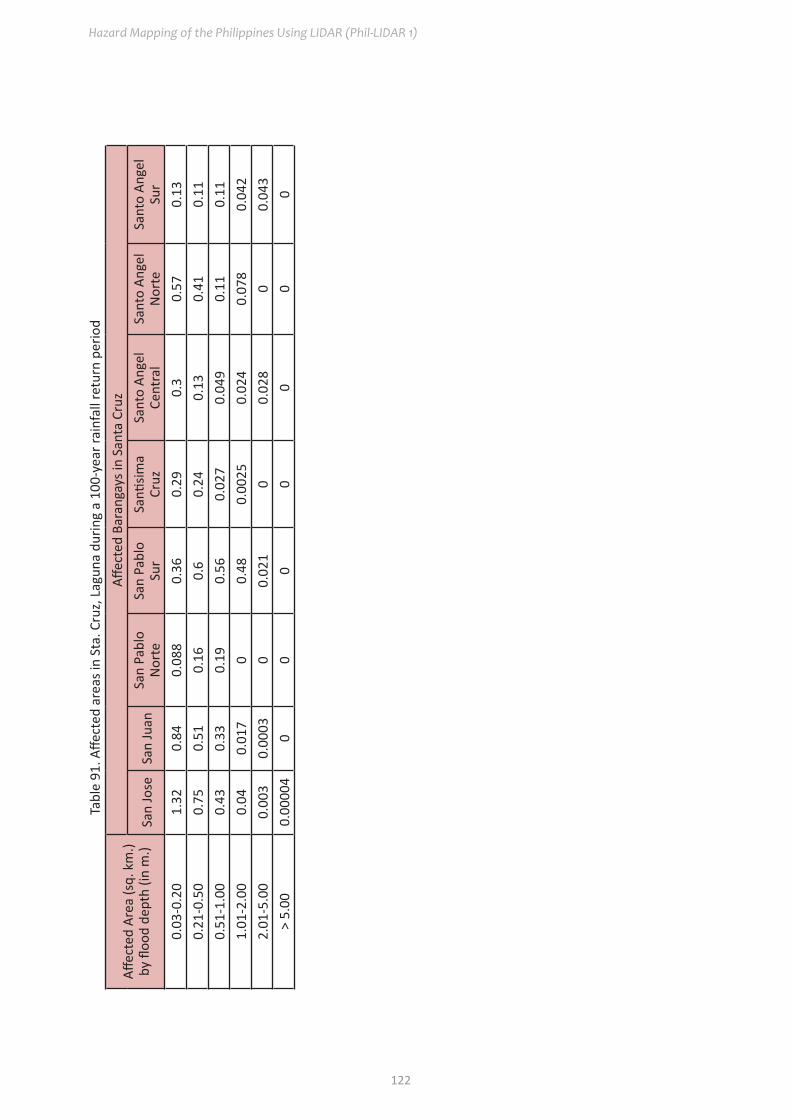
Hazard Mapping of the Philippines Using LIDAR (Phil-LIDAR 1)
122
Tabl
e 91
. Affe
cted
are
as in
Sta
. Cru
z, L
agun
a du
ring
a 10
0-ye
ar ra
infa
ll re
turn
per
iod
Affec
ted
Area
(sq.
km
.) by
floo
d de
pth
(in m
.)
Affec
ted
Bara
ngay
s in
Sant
a Cr
uz
San
Jose
San
Juan
San
Pabl
o N
orte
San
Pabl
o Su
rSa
ntisim
a Cr
uzSa
nto
Ange
l Ce
ntra
lSa
nto
Ange
l N
orte
Sant
o An
gel
Sur
0.03
-0.2
01.
320.
840.
088
0.36
0.29
0.3
0.57
0.13
0.21
-0.5
00.
750.
510.
160.
60.
240.
130.
410.
110.
51-1
.00
0.43
0.33
0.19
0.56
0.02
70.
049
0.11
0.11
1.01
-2.0
00.
040.
017
00.
480.
0025
0.02
40.
078
0.04
22.
01-5
.00
0.00
30.
0003
00.
021
00.
028
00.
043
> 5.
000.
0000
40
00
00
00

LiDAR Surveys and Flood Mapping of Sta. Cruz River
123
Figu
re 9
8. A
ffect
ed a
reas
in S
ta. C
ruz,
Lag
una
durin
g a
100-
year
rain
fall
retu
rn p
erio
d
For t
he m
unic
ipal
ity o
f Vic
toria
, with
an
area
of 2
8.37
sq k
m, 2
6.70
% w
ill e
xper
ienc
e flo
od le
vels
of le
ss 0
.20
met
ers;
17.
56%
of t
he a
rea
will
exp
erie
nce
flood
leve
ls of
0.2
1
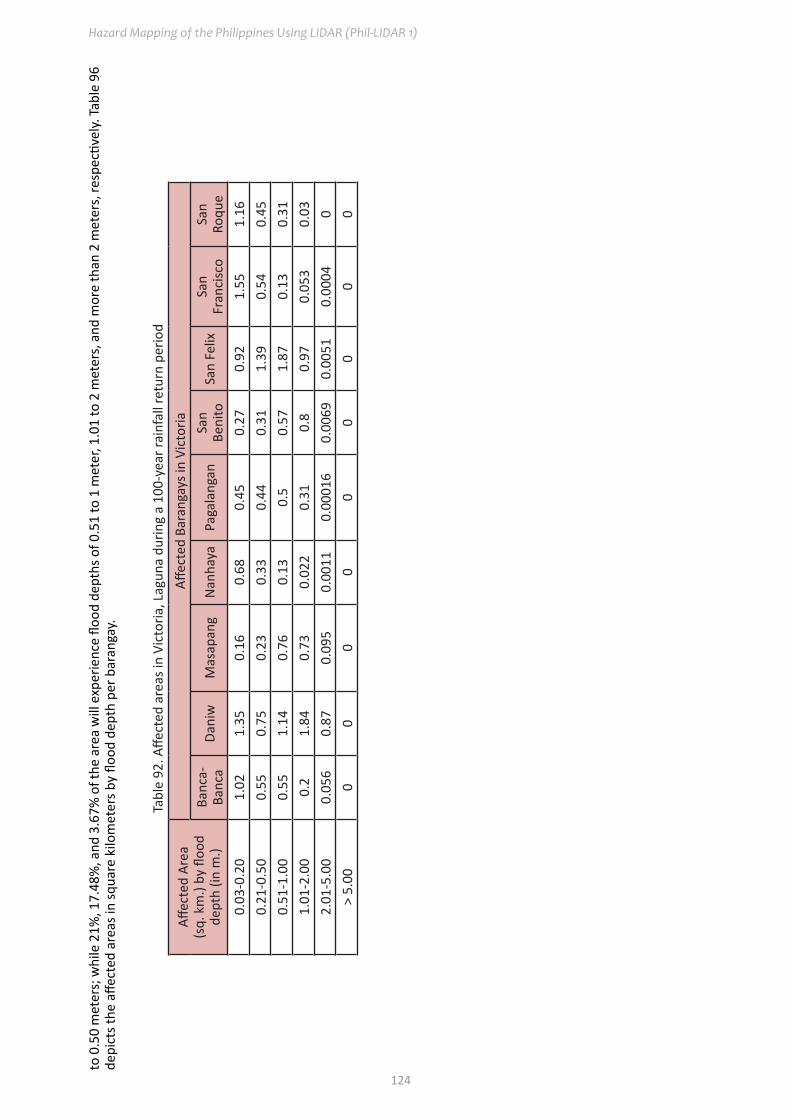
Hazard Mapping of the Philippines Using LIDAR (Phil-LIDAR 1)
124
to 0
.50
met
ers;
whi
le 2
1%, 1
7.48
%, a
nd 3
.67%
of t
he a
rea
will
exp
erie
nce
flood
dep
ths o
f 0.5
1 to
1 m
eter
, 1.0
1 to
2 m
eter
s, a
nd m
ore
than
2 m
eter
s, re
spec
tivel
y. Ta
ble
96
depi
cts t
he a
ffect
ed a
reas
in sq
uare
kilo
met
ers b
y flo
od d
epth
per
bar
anga
y.
Tabl
e 92
. Affe
cted
are
as in
Vic
toria
, Lag
una
durin
g a
100-
year
rain
fall
retu
rn p
erio
d
Affec
ted
Area
(sq.
km
.) by
floo
d de
pth
(in m
.)
Affec
ted
Bara
ngay
s in
Vict
oria
Banc
a-Ba
nca
Dani
wM
asap
ang
Nan
haya
Paga
lang
anSa
n Be
nito
San
Felix
San
Fran
cisc
oSa
n Ro
que
0.03
-0.2
01.
021.
350.
160.
680.
450.
270.
921.
551.
160.
21-0
.50
0.55
0.75
0.23
0.33
0.44
0.31
1.39
0.54
0.45
0.51
-1.0
00.
551.
140.
760.
130.
50.
571.
870.
130.
311.
01-2
.00
0.2
1.84
0.73
0.02
20.
310.
80.
970.
053
0.03
2.01
-5.0
00.
056
0.87
0.09
50.
0011
0.00
016
0.00
690.
0051
0.00
040
> 5.
000
00
00
00
00

LiDAR Surveys and Flood Mapping of Sta. Cruz River
125
Figu
re 9
9. A
ffect
ed a
reas
in V
icto
ria, L
agun
a du
ring
a 10
0-ye
ar ra
infa
ll re
turn
per
iod

Hazard Mapping of the Philippines Using LIDAR (Phil-LIDAR 1)
126
5.11 Flood Validation
In order to check and validate the extent of flooding in different river systems, there is a need to perform validation survey work. Field personnel gathered secondary data regarding flood occurrence in the area within the major river system in the Philippines.
From the flood depth maps produced by Phil-LiDAR 1 Program, multiple points representing the different flood depths for different scenarios were identified for validation.
The validation personnel went to the specified points identified in a river basin and gathered data regard-ing the actual flood level in each location. Data gathering was done by going to a local DRRM office to obtain maps or situation reports about the past flooding events or by interviewing some residents with knowledge of or have had experienced flooding in a particular area.
After which, the actual data from the field were compared to the simulated data to assess the accuracy of the flood depth maps produced and to improve on what is needed. The points in the flood map versus its corresponding validation depths are shown in Figure 102.
The flood validation consists of 270 points randomly selected all over the Sta. Cruz Floodplain. Comparing it with the flood depth map of the nearest storm event, the map has an RMSE value of 1.27 m. Table 103 shows a contingency matrix of the comparison.
Figure 100. Validation points for 25-year flood depth map of Sta. Cruz Floodplain

LiDAR Surveys and Flood Mapping of Sta. Cruz River
127
Figure 101. Flood map depth vs. actual flood depth
Table 93. Actual flood depth vs. simulated flood depth at different levels in the Sta. Cruz River BasinActual Flood Depth
(m)Modeled Flood Depth (m)
0-0.20 0.21-0.50 0.51-1.00 1.01-2.00 2.01-5.00 > 5.00 Total0-0.20 41 7 3 8 9 0 68
0.21-0.50 23 5 7 1 5 1 420.51-1.00 26 7 7 19 11 1 711.01-2.00 29 9 7 17 6 2 702.01-5.00 1 1 0 9 7 1 19
> 5.00 0 0 0 0 0 0 0Total 120 29 24 54 38 5 270
The overall accuracy generated by the flood model is estimated at 28.52% with 77 points correctly match-ing the actual flood depths. In addition, there were 79 points estimated one level above and below the correct flood depths while there were 52 points and 55 points estimated two levels above and below, and three or more levels above and below the correct flood. A total of 4 points were overestimated while a total of 112 points were underestimated in the modeled flood depths of Sta. Cruz. Table 98 depicts the summary of the accuracy assessment in the Sta. Cruz River Basin survey.
Table 94. Summary of accuracy assessment in the Sta. Cruz River Basin surveyNo. of Points %
Correct 77 28.52Overestimated 81 30.00
Underestimated 112 41.48Total 270 100.00
Hazard Mapping of the Philippines Using LIDAR (Phil-LIDAR 1)
128
REFERENCES
Ang M.O., Paringit E.C., et al. 2014. DREAM Data Processing Component Manual. Quezon City, Philippines: UP Training Center for Applied Geodesy and Photogrammetry.
Balicanta L.P., Paringit E.C., et al. 2014. DREAM Data Validation Component Manual. Quezon City, Philip-pines: UP Training Center for Applied Geodesy and Photogrammetry.
Brunner, G. H. 2010a. HEC-RAS River Analysis System Hydraulic Reference Manual. Davis, CA: U.S. Army Corps of Engineers, Institute for Water Resources, Hydrologic Engineering Center.
Lagmay A.F., Paringit E.C., et al. 2014. DREAM Flood Modeling Component Manual. Quezon City, Philip-pines: UP Training Center for Applied Geodesy and Photogrammetry.
Paringit E.C, Balicanta L.P., Ang, M.O., Sarmiento, C. 2017. Flood Mapping of Rivers in the Philippines Using Airborne Lidar: Methods. Quezon City, Philippines: UP Training Center for Applied Geodesy and Photo-grammetry.
Sarmiento C., Paringit E.C., et al. 2014. DREAM Data Acquisition Component Manual. Quezon City, Philip-pines: UP Training Center for Applied Geodesy and Photogrammetry.
UP TCAGP 2016, Acceptance and Evaluation of Synthetic Aperture Radar Digital Surface Model (SAR DSM) and Ground Control Points (GCP). Quezon City, Philippines: UP Training Center for Applied Geodesy and Photogrammetry.

LiDAR Surveys and Flood Mapping of Sta. Cruz River
129
ANNEXESAnnex 1. OPTECH Technical Specification of the Pegasus Sensor
Table A-1.1. Parameters and Specifications of Pegasus Sensor
Parameter SpecificationOperational envelope (1,2,3,4) 150-4000 m AGL, nominal
Laser wavelength 1064 nmHorizontal accuracy (2) 1/5,500 x altitude, (m AGL)Elevation accuracy (2) <5-35 cm, 1 σ
Effective laser repetition rate Programmable, 33-167 kHz
Position and orientation systemPOS AV™ AP50 (OEM);
220-channel dual frequency GPS/GNSS/Galileo/L-Band receiver
Scan width (WOV) Programmable, 0-50˚Scan frequency (5) Programmable, 0-70 Hz (effective)
Sensor scan product 1000 maximum
Beam divergence Dual divergence: 0.25 mrad (1/e) and 0.8 mrad (1/e), nominal
Roll compensation Programmable, ±5˚ (FOV dependent)
Range capture Up to 4 range measurements, including 1st, 2nd, 3rd, and last returns
Intensity capture Up to 4 intensity returns for each pulse, including last (12 bit)
Video Camera Internal video camera (NTSC or PAL)
Image capture Compatible with full Optech camera line (optional)
Full waveform capture 12-bit Optech IWD-2 Intelligent Waveform Digitizer (optional)
Data storage Removable solid state disk SSD (SATA II)Power requirements 28 V; 900 W;35 A(peak)
Dimensions and weight
Sensor: 260 mm (w) x 190 mm (l) x 570 mm (h); 23 kg
Control rack: 650 mm (w) x 590 mm (l) x 530 mm (h); 53 kg
Operating temperature -10˚C to +35˚C (with insulating jacket)Relative humidity 0-95% no-condensing

Hazard Mapping of the Philippines Using LIDAR (Phil-LIDAR 1)
130
Annex 2. NAMRIA Certificates of Reference Points Used in the LiDAR Survey
1. LAG-20
Figure A-2.1. LAG-20
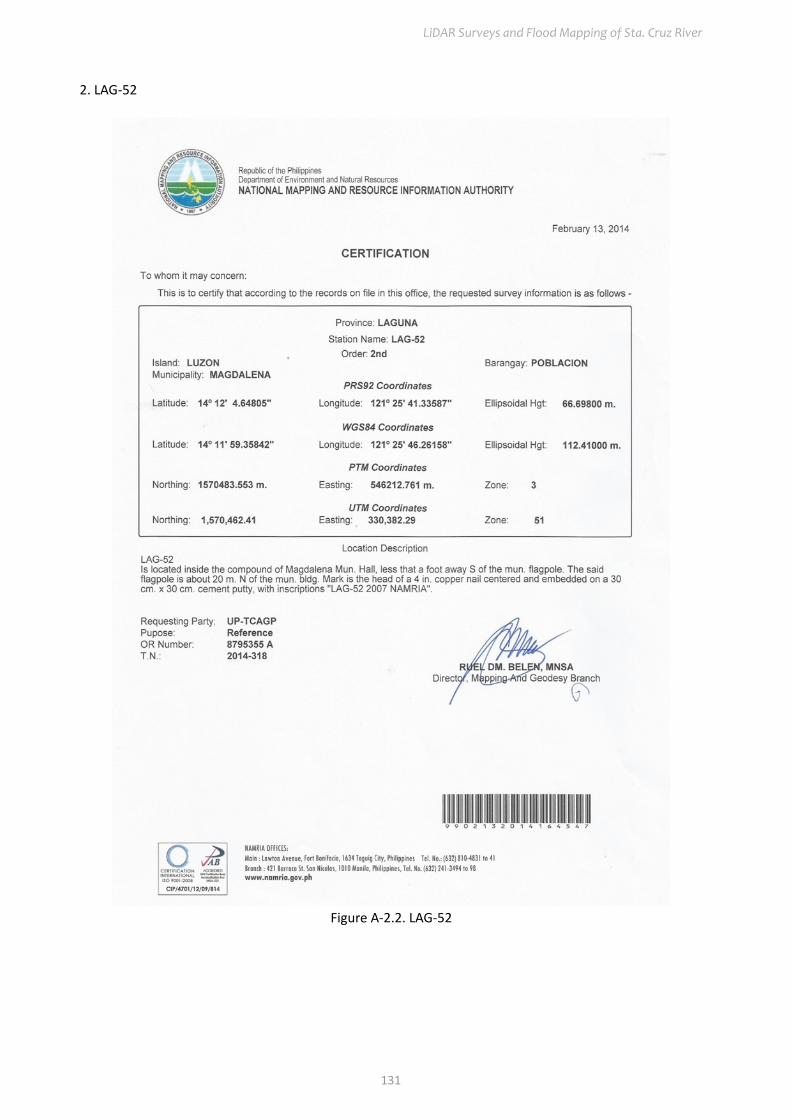
LiDAR Surveys and Flood Mapping of Sta. Cruz River
131
2. LAG-52
Figure A-2.2. LAG-52

Hazard Mapping of the Philippines Using LIDAR (Phil-LIDAR 1)
132
Annex 3. Baseline Processing Reports of Reference Points Used in the LiDAR Sur-vey 1. LAG-20A
Figure A-3.1. LAG-20A
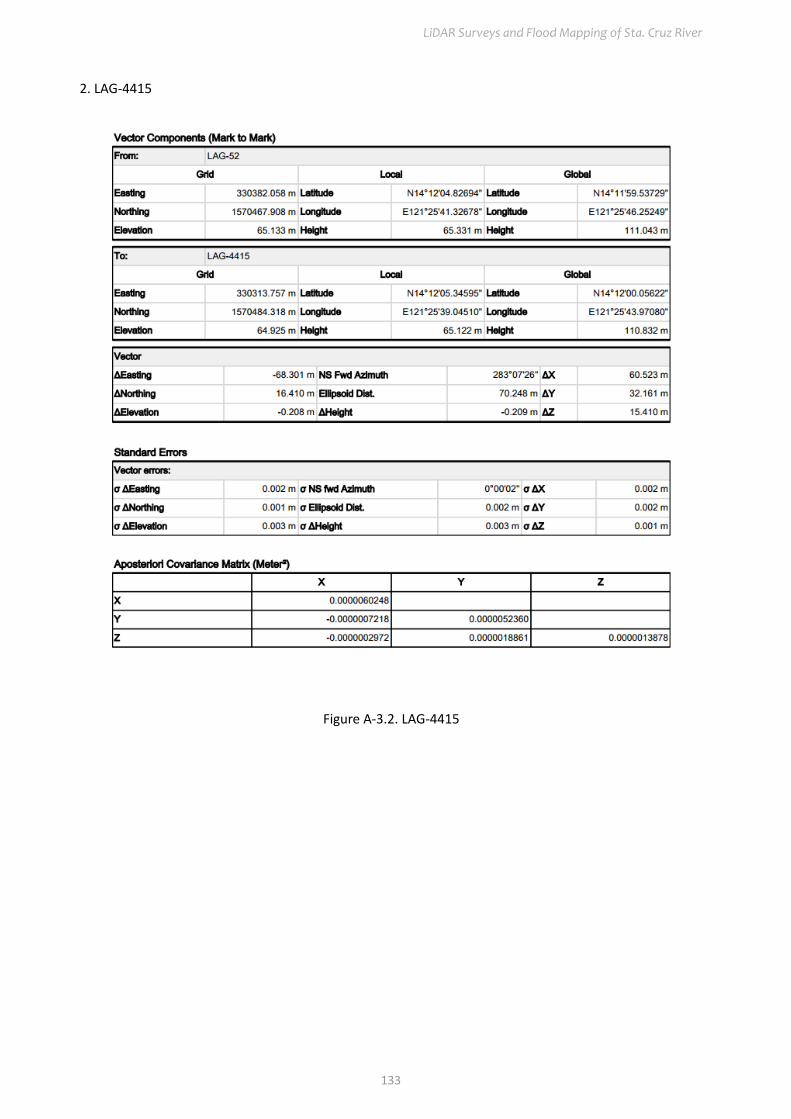
LiDAR Surveys and Flood Mapping of Sta. Cruz River
133
2. LAG-4415
Figure A-3.2. LAG-4415

Hazard Mapping of the Philippines Using LIDAR (Phil-LIDAR 1)
134
Annex 4. The LiDAR Survey Team CompositionTable A-4.1. The LiDAR Survey Team Composition
Data Acquisition ComponentSub-team
Designation Name Agency/Affiliation
Program Leader Program Leader –I ENRICO C. PARINGIT, D. Eng. UP TCAGPData Acquisition
Component Leader
Data Component Project Leader –I
ENGR. CZAR JAKIRI S. SARMIENTO UP TCAGP
Survey Supervisor
Chief Science Research Specialist (CSRS) ENGR. CHRISTOPHER CRUZ UP TCAGP
Supervising Science Research Specialist (Supervising SRS)
LOVELY GRACIA ACUNA UP TCAGP
ENGR. LOVELYN ASUNCION UP TCAGP
FIELD TEAM
LiDAR Operation
Senior Science Research Specialist
(SSRS)JASMINE ALVIAR UP TCAGP
Research Associate
ENGR. LARAH PARAGAS UP TCAGPPAULINE JOANNE ARCEO UP TCAGP
MARY CATHERINE ELIZABETH BALIGUAS UP TCAGP
FAITH JOY SABLE UP TCAGPGround Survey, Data Download
and TransferResearch Associate
MA. VERLINA TONGA UP TCAGPENGR. KENNETH QUISADO UP TCAGP
LiDAR Operation/ Ground Survey
Research Associate ENGR. RENAN PUNTO UP TCAGPENGR. DAN ALDOVINO UP TCAGP
LiDAR Operation Airborne Security SSG. RAYMUND DOMINE PHILIPPINE AIR FORCE (PAF)
LiDAR Operation Pilot
CAPT. MARK TANGONAN ASIAN AEROSPACE CORP (AAC)
CAPT. RAUL SAMAR ASIAN AEROSPACE CORP (AAC)
CAPT. FRANCO PEPITO ASIAN AEROSPACE CORP (AAC)
CAPT. CAESAR ALFONSO II ASIAN AEROSPACE CORP (AAC)

LiDAR Surveys and Flood Mapping of Sta. Cruz River
135
Annex 5. Data Transfer Sheet for Sta. Cruz Floodplain
Figure A-5.1. Transfer Sheet for Sta. Cruz Floodplain (A)

Hazard Mapping of the Philippines Using LIDAR (Phil-LIDAR 1)
136
Figure A-5.2. Transfer Sheet for Sta. Cruz Floodplain (B)

LiDAR Surveys and Flood Mapping of Sta. Cruz River
137
Figure A-5.3. Transfer Sheet for Sta. Cruz Floodplain (C)

Hazard Mapping of the Philippines Using LIDAR (Phil-LIDAR 1)
138
Annex 6. Flight Logs for the Flight Missions1. Flight Log for 1067P Mission
Figure A-6.1. Flight Log for Mission 1067P

LiDAR Surveys and Flood Mapping of Sta. Cruz River
139
2. Flight log for 1071P Mission
Figure A-6.2. Flight log for Mission 1071P

Hazard Mapping of the Philippines Using LIDAR (Phil-LIDAR 1)
140
3. Flight Log for 1083P Mission
Figure A-6.3. Flight Log for Mission 1083P

LiDAR Surveys and Flood Mapping of Sta. Cruz River
141
4. Flight log for 3299P Mission
Figure A-6.4. Flight log for Mission 3299P

Hazard Mapping of the Philippines Using LIDAR (Phil-LIDAR 1)
142
Annex 7. Flight Status Reports
CALABARZON(FEBRUARY 4-8, 2014 and August 15, 2015)
Table A-7.1. Flight Status Report
FLIGHT NO AREA MISSION OPERATOR DATE
FLOWN REMARKS
1067P BLK 18H 1BLK18H35A J. Alviar Feb 4 2014 Mission completed at 1100m AGL
1071P BLK 18I 1BLK18I036A J. Alviar Feb 5 2014 Mission completed at 1100m AGL
1083P BLK 18J 1BLK18J39A J. Alviar Feb 8 2014 Mission completed at 1100m AGL
3299P BLK 18KS 1BLK18KS227A J. Alviar AUG 15 2015
4 lines, flight aborted due to bad weather
Without Digitizer and Camera

LiDAR Surveys and Flood Mapping of Sta. Cruz River
143
LAS BOUNDARIES PER MISSION FLIGHT
Flight No. : 1067PArea: BLK 18HMission Name: 1BLK18H35ALAS
Figure A-7.1. Swath for Flight No. 1067P

Hazard Mapping of the Philippines Using LIDAR (Phil-LIDAR 1)
144
Flight No. : 1071PArea: BLK 18IMission Name: 1BLK18I036ALAS
Figure A-7.2. Swath for Flight No. 1071P

LiDAR Surveys and Flood Mapping of Sta. Cruz River
145
Flight No. : 1083PArea: BLK 18JMission Name: 1BLK18J39A
LAS
Figure A-7.3. Swath for Flight No. 1083P

Hazard Mapping of the Philippines Using LIDAR (Phil-LIDAR 1)
146
FLIGHT LOG NO. 3299PAREA: BLK 18KSMISSION NAME: 1BLK18KS227A PARAMETERS: Alt: 1000 Scan Freq: 25 kHz Scan Angle: 30 degSURVEY AREA: 88.5 km2
LAS
Figure A-7.4. Swath for Flight No. 3299P

LiDAR Surveys and Flood Mapping of Sta. Cruz River
147
Annex 8. Mission Summary ReportsTable A-8.1. Mission Summary Report for Mission Blk18I_supplement
Flight Area CALABARZONMission Name Blk18I_supplement
Inclusive Flights 3299P, 3377PRange data size 23.8 GB
POS 339 MBImage N/A
Transfer date 09/11/2015
Solution StatusNumber of Satellites (>6) No
PDOP (<3) NoBaseline Length (<30km) YesProcessing Mode (<=1) Yes
Smoothed Performance Metrics (in cm)RMSE for North Position (<4.0 cm) 0.9RMSE for East Position (<4.0 cm) 1.5
RMSE for Down Position (<8.0 cm) 3.9
Boresight correction stdev (<0.001deg) 0.000301IMU attitude correction stdev (<0.001deg) 0.012698
GPS position stdev (<0.01m) 0.0029
Minimum % overlap (>25) 34.56%Ave point cloud density per sq.m. (>2.0) 4.08
Elevation difference between strips (<0.20 m) Yes
Number of 1km x 1km blocks 124Maximum Height 715.82 mMinimum Height 72.48 m
Classification (# of points)Ground 51,435,640
Low vegetation 36,221,058Medium vegetation 169,763,632
High vegetation 405,680,252Building 8,514,938
Orthophoto No
Processed by Engr. Irish Cortez, Engr. Chelou Prado, Jovy Anne Narisma

Hazard Mapping of the Philippines Using LIDAR (Phil-LIDAR 1)
148
Figure 1.1.1. Solution Status
Figure 1.1.2. Smoothed Performance Metrics Parameters

LiDAR Surveys and Flood Mapping of Sta. Cruz River
149
Figure 1.1.3. Best Estimated Trajectory
Figure 1.1.4. Coverage of LiDAR data

Hazard Mapping of the Philippines Using LIDAR (Phil-LIDAR 1)
150
Figure 1.1.5. Image of data overlap
Figure 1.1.6. Density map of merged LiDAR data

LiDAR Surveys and Flood Mapping of Sta. Cruz River
151
Figure 1.1.7. Elevation difference between flight lines

Hazard Mapping of the Philippines Using LIDAR (Phil-LIDAR 1)
152
Table A-8.2. Mission Summary Report for Mission Blk18J
Flight Area LAGUNAMission Name Blk18J
Inclusive Flights 1083PRange data size 16.5 GB
POS 198 MBImage 22.6 GB
Transfer date 04/23/2014
Solution StatusNumber of Satellites (>6) No
PDOP (<3) NoBaseline Length (<30km) NoProcessing Mode (<=1) Yes
Smoothed Performance Metrics (in cm)RMSE for North Position (<4.0 cm) 1.0RMSE for East Position (<4.0 cm) 1.4
RMSE for Down Position (<8.0 cm) 4.7
Boresight correction stdev (<0.001deg) 0.000730IMU attitude correction stdev (<0.001deg) 0.002282
GPS position stdev (<0.01m) 0.0111
Minimum % overlap (>25) 43.53%Ave point cloud density per sq.m. (>2.0) 3.08
Elevation difference between strips (<0.20 m) Yes
Number of 1km x 1km blocks 198Maximum Height 978.05 mMinimum Height 39.71 m
Classification (# of points)Ground 98,066,387
Low vegetation 96,509,309Medium vegetation 134,853,601
High vegetation 171,911,755Building 11,926,035
Orthophoto Yes
Processed by Ma. Victoria Rejuso, Engr. Melanie Hingpit, Engr. Jeffrey Delica

LiDAR Surveys and Flood Mapping of Sta. Cruz River
153
Figure 1.2.1. Solution Status
Figure 1.2.2. Smoothed Performance Metrics Parameters

Hazard Mapping of the Philippines Using LIDAR (Phil-LIDAR 1)
154
Figure 1.2.3. Best Estimated Trajectory
Figure 1.2.4. Coverage of LiDAR data

LiDAR Surveys and Flood Mapping of Sta. Cruz River
155
Figure 1.2.5. Image of data overlap
Figure 1.2.6. Density map of merged LiDAR data

Hazard Mapping of the Philippines Using LIDAR (Phil-LIDAR 1)
156
Figure 1.2.7. Elevation difference between flight lines
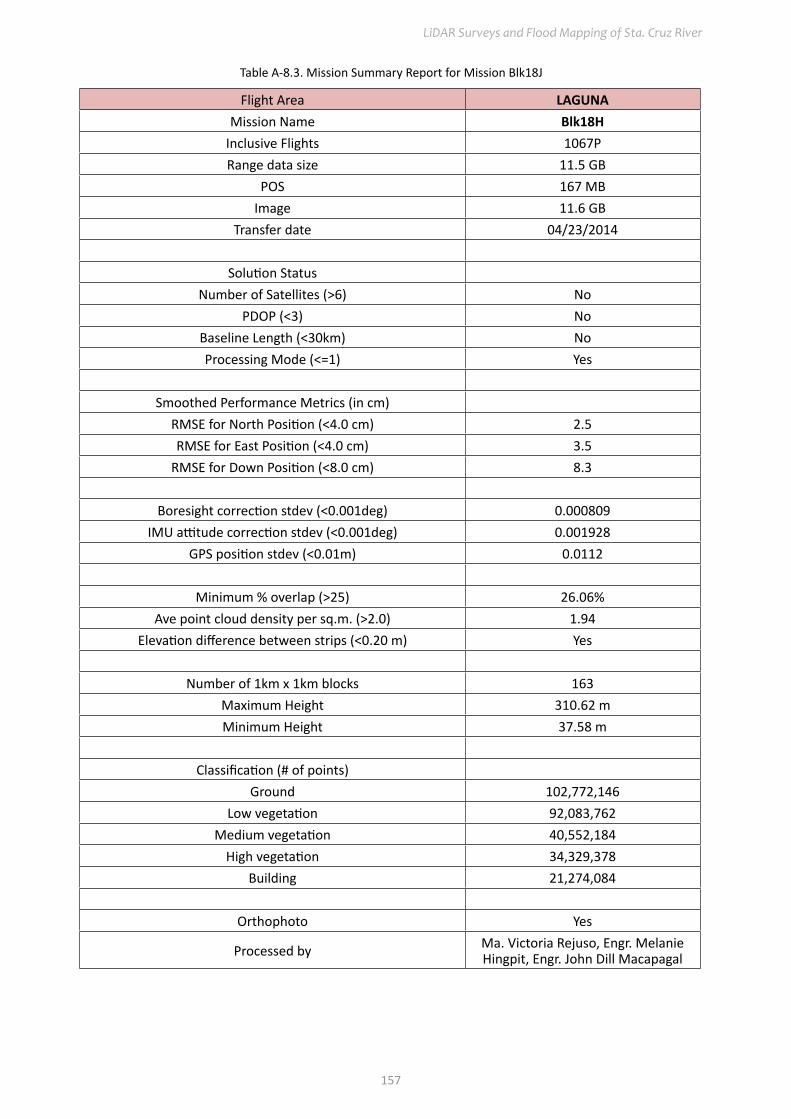
LiDAR Surveys and Flood Mapping of Sta. Cruz River
157
Table A-8.3. Mission Summary Report for Mission Blk18J
Flight Area LAGUNAMission Name Blk18H
Inclusive Flights 1067PRange data size 11.5 GB
POS 167 MBImage 11.6 GB
Transfer date 04/23/2014
Solution StatusNumber of Satellites (>6) No
PDOP (<3) NoBaseline Length (<30km) NoProcessing Mode (<=1) Yes
Smoothed Performance Metrics (in cm)RMSE for North Position (<4.0 cm) 2.5RMSE for East Position (<4.0 cm) 3.5
RMSE for Down Position (<8.0 cm) 8.3
Boresight correction stdev (<0.001deg) 0.000809IMU attitude correction stdev (<0.001deg) 0.001928
GPS position stdev (<0.01m) 0.0112
Minimum % overlap (>25) 26.06%Ave point cloud density per sq.m. (>2.0) 1.94
Elevation difference between strips (<0.20 m) Yes
Number of 1km x 1km blocks 163Maximum Height 310.62 mMinimum Height 37.58 m
Classification (# of points)Ground 102,772,146
Low vegetation 92,083,762Medium vegetation 40,552,184
High vegetation 34,329,378Building 21,274,084
Orthophoto Yes
Processed by Ma. Victoria Rejuso, Engr. Melanie Hingpit, Engr. John Dill Macapagal

Hazard Mapping of the Philippines Using LIDAR (Phil-LIDAR 1)
158
.Figure 1.3.1. Solution Status
Figure 1.3.2. Smoothed Performance Metrics Parameters

LiDAR Surveys and Flood Mapping of Sta. Cruz River
159
Figure 1.3.3. Best Estimated Trajectory
Figure 1.3.4. Coverage of LiDAR data

Hazard Mapping of the Philippines Using LIDAR (Phil-LIDAR 1)
160
Figure 1.3.5. Image of data overlap
Figure 1.3.6. Density map of merged LiDAR data

LiDAR Surveys and Flood Mapping of Sta. Cruz River
161
Figure 1.3.7. Elevation difference between flight lines

Hazard Mapping of the Philippines Using LIDAR (Phil-LIDAR 1)
162
Table A-8.4. Mission Summary Report for Mission Blk18I
Flight Area CaviteMission Name Blk18I
Inclusive Flights 1071PRange data size 15.4 GB
POS 157 MBImage 16 GB
Transfer date 04/23/2014
Solution StatusNumber of Satellites (>6) No
PDOP (<3) YesBaseline Length (<30km) NoProcessing Mode (<=1) Yes
Smoothed Performance Metrics (in cm)RMSE for North Position (<4.0 cm) 1.3RMSE for East Position (<4.0 cm) 1.4
RMSE for Down Position (<8.0 cm) 2.2
Boresight correction stdev (<0.001deg) 0.000444IMU attitude correction stdev (<0.001deg) 0.000955
GPS position stdev (<0.01m) 0.0111
Minimum % overlap (>25) 38.94%Ave point cloud density per sq.m. (>2.0) 2.24
Elevation difference between strips (<0.20 m) Yes
Number of 1km x 1km blocks 243Maximum Height 691.27 mMinimum Height 48.60 m
Classification (# of points)Ground 162,648,250
Low vegetation 137,656,321Medium vegetation 119,154,299
High vegetation 160,037,139Building 13,295,737
Orthophoto Yes
Processed by Engr. Jennifer Saguran, Engr. Harmond Santos, Ryan Nicholai Dizon

LiDAR Surveys and Flood Mapping of Sta. Cruz River
163
Figure 1.4.1. Solution Status
Figure 1.4.2. Smoothed Performance Metrics Parameters

Hazard Mapping of the Philippines Using LIDAR (Phil-LIDAR 1)
164
Figure 1.4.3. Best Estimated Trajectory
Figure 1.4.4. Coverage of LiDAR data

LiDAR Surveys and Flood Mapping of Sta. Cruz River
165
Figure 1.4.5. Image of data overlap
Figure 1.4.6. Density map of merged LiDAR data
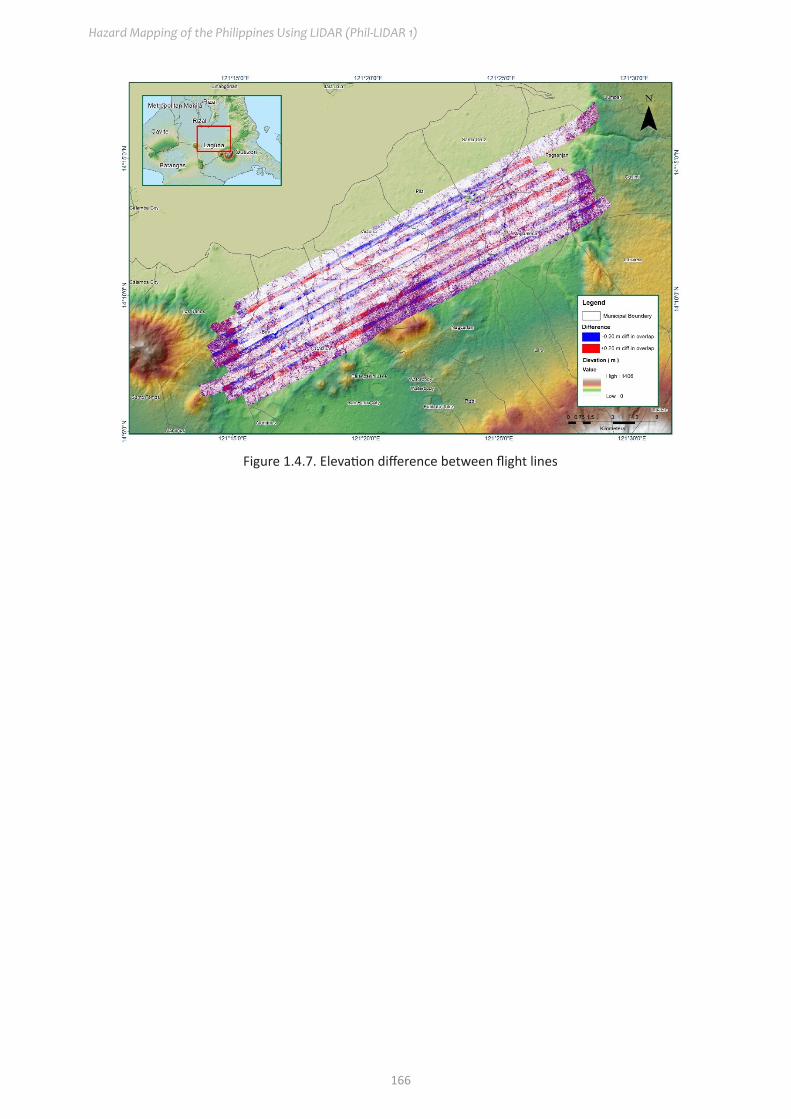
Hazard Mapping of the Philippines Using LIDAR (Phil-LIDAR 1)
166
Figure 1.4.7. Elevation difference between flight lines

LiDAR Surveys and Flood Mapping of Sta. Cruz River
167
Table A-8.5. Mission Summary Report for Mission Laguna_Blk18K
Flight Area LAGUNAMission Name Laguna_Blk18K
Inclusive Flights 1087PRange data size 14.8 GBPOS data size 10.7 MBBase data size 84.5 MB
Image n/aTransfer date April 10, 2014
Solution StatusNumber of Satellites (>6) Yes
PDOP (<3) NoBaseline Length (<30km) YesProcessing Mode (<=1) No
Smoothed Performance Metrics (in cm)RMSE for North Position (<4.0 cm) 1.9RMSE for East Position (<4.0 cm) 2.5
RMSE for Down Position (<8.0 cm) 5.4
Boresight correction stdev (<0.001deg) 0.000370IMU attitude correction stdev (<0.001deg) 0.000532
GPS position stdev (<0.01m) 0.0079
Minimum % overlap (>25) 14.84%Ave point cloud density per sq.m. (>2.0) 1.51
Elevation difference between strips (<0.20 m) Yes
Number of 1km x 1km blocks 76Maximum Height 104.52 mMinimum Height 49.26 m
Classification (# of points)Ground 36,313,648
Low vegetation 42,001,405Medium vegetation 21,298,010
High vegetation 11,905,512Building 6,902,781
Orthophoto NoProcessed by
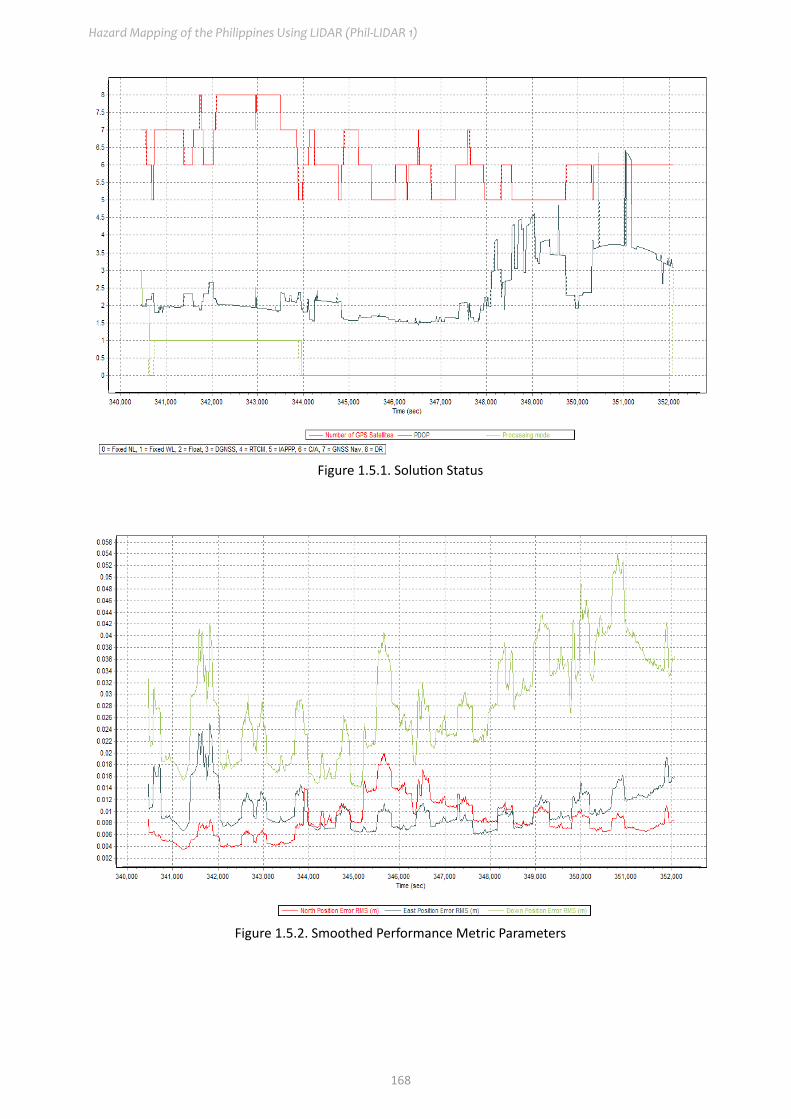
Hazard Mapping of the Philippines Using LIDAR (Phil-LIDAR 1)
168
Figure 1.5.1. Solution Status
Figure 1.5.2. Smoothed Performance Metric Parameters

LiDAR Surveys and Flood Mapping of Sta. Cruz River
169
Figure 1.5.3. Best Estimated Trajectory
Figure 1.5.4. Coverage of LiDAR Data

Hazard Mapping of the Philippines Using LIDAR (Phil-LIDAR 1)
170
Figure 1.5.5. Image of data overlap
Figure 1.5.6. Density map of merged LiDAR data

LiDAR Surveys and Flood Mapping of Sta. Cruz River
171
Figure 1.5.7. Elevation difference between flight lines

Hazard Mapping of the Philippines Using LIDAR (Phil-LIDAR 1)
172
Anne
x 9.
Sta
. Cru
z Mod
el B
asin
Par
amet
ers
Tabl
e A-
9.1.
Sta
. Cru
z Mod
el B
asin
Par
amet
ers
Subb
asin
SCS
CURV
E N
UM
BER
LOSS
CLAR
K U
NIT
HYD
ROGR
APH
TRAN
SFO
RMRE
CESS
ION
BAS
EFLO
WIn
itial
Ab
stra
ction
(M
M)
Curv
e N
umbe
rIm
perv
ious
ness
(%)
Tim
e of
Con
cent
ratio
n (H
R)St
orag
e Co
effici
ent (
HR)
Initi
al
Disc
harg
e (C
U.M
/S)
Rece
ssio
n Co
nsta
ntRa
tio to
Pe
ak
W43
03.
5764
66.5
940.
02.
7405
4.45
880.
0973
454
0.47
159
0.52
172
W45
06.
4117
60.0
220.
01.
7766
2.88
570.
0826
677
0.10
306
0.52
172
W46
06.
6644
59.6
250.
02.
1211
3.44
790.
0823
056
0.10
306
0.16
577
W47
07.
8823
57.2
620.
02.
6918
4.37
930.
1921
90.
4812
20.
5217
2W
480
6.41
1760
.022
0.0
3.84
946.
2685
0.31
943
0.48
122
0.52
172
W49
08.
6815
55.8
110.
02.
4152
3.92
790.
1453
70.
1030
60.
5217
2W
500
6.41
1760
.022
0.0
5.55
299.
0486
0.02
3094
50.
4812
20.
5217
2W
510
11.1
0651
.827
0.0
3.93
996.
4162
0.27
228
0.48
122
0.52
172
W52
011
.722
50.7
910.
02.
4745
4.02
460.
2252
50.
2226
90.
5217
2W
530
11.0
1851
.962
0.0
1.63
852.
6603
0.08
3872
80.
1030
60.
5217
2W
540
10.1
8853
.266
0.0
1.32
842.
1542
0.06
1148
40.
1030
60.
5217
2W
550
7.38
7758
.199
0.0
4.36
987.
1178
1.30
740.
3273
60.
5217
2W
560
5.32
6762
.457
0.0
2.07
3.36
450.
2412
50.
4812
20.
5217
2W
570
4.49
1764
.364
0.0
1.04
1.68
350.
0704
528
0.10
306
0.52
172
W58
05.
2907
62.5
360.
00.
7164
21.
1555
0.04
8380
40.
1030
60.
5217
2W
590
4.75
9363
.74
0.0
2.84
944.
6365
0.36
228
0.10
306
0.52
172
W60
04.
7017
63.8
680.
02.
8515
4.63
990.
2760
50.
3273
60.
5217
2W
610
4.16
2665
.148
0.0
1.95
843.
1823
0.34
268
0.15
149
0.52
172
W62
04.
7017
63.8
680.
01.
0575
1.71
210.
1069
50.
3273
60.
5217
2W
630
4.70
1763
.868
0.0
1.89
483.
0785
0.17
166
0.10
306
0.52
172
W64
04.
3694
64.6
530.
00.
2543
20.
4013
30.
0275
854
0.10
306
0.52
172
W65
05.
4723
62.1
350.
01.
0672
1.72
80.
0836
291
0.10
306
0.52
172
W66
07.
5056
57.9
740.
01.
8546
3.01
310.
1598
0.10
306
0.52
172

LiDAR Surveys and Flood Mapping of Sta. Cruz River
173
Subb
asin
SCS
CURV
E N
UM
BER
LOSS
CLAR
K U
NIT
HYD
ROGR
APH
TRAN
SFO
RMRE
CESS
ION
BAS
EFLO
WIn
itial
Ab
stra
ction
(M
M)
Curv
e N
umbe
rIm
perv
ious
ness
(%)
Tim
e of
Con
cent
ratio
n (H
R)St
orag
e Co
effici
ent (
HR)
Initi
al
Disc
harg
e (C
U.M
/S)
Rece
ssio
n Co
nsta
ntRa
tio to
Pe
ak
W67
09.
3981
54.5
710.
01.
0116
1.63
720.
1012
80.
1030
60.
5217
2W
680
4.92
263
.367
0.0
1.29
172.
0943
0.18
686
0.15
149
0.52
172
W69
06.
1869
60.6
060.
02.
9935
4.87
170.
6250
60.
4812
20.
5217
2W
700
9.10
2255
.077
0.0
2.27
743.
703
0.31
872
0.15
149
0.52
172
W71
06.
7303
59.4
930.
01.
8646
3.02
930.
2222
80.
1514
90.
5217
2W
720
8.47
0956
.187
0.0
2.50
464.
0738
0.69
383
0.32
736
0.52
172
W73
06.
1876
60.6
040.
01.
2345
2.00
090.
1832
90.
1030
60.
5217
2W
740
4.70
1763
.868
0.0
1.80
022.
9243
0.22
836
0.10
306
0.52
172
W75
012
.375
49.9
590.
01.
2961
2.10
160.
1468
50.
1514
90.
5217
2W
760
5.65
6661
.734
0.0
0.63
932
1.02
970.
0622
679
0.10
306
0.52
172
W77
014
.916
46.5
980.
02.
1343
3.46
950.
2595
80.
1514
90.
5217
2W
780
11.7
2250
.791
0.0
1.15
761.
8755
0.15
072
0.32
736
0.52
172
W79
016
.755
44.4
350.
01.
5137
2.45
670.
1578
0.15
149
0.52
172
W80
011
.722
50.7
910.
00.
2703
20.
4275
20.
0277
764
0.22
269
0.52
172
W81
020
.355
40.7
340.
01.
7545
2.84
960.
177
0.22
269
0.52
172
W82
020
.176
40.9
030.
01.
1184
1.81
160.
1181
90.
1030
60.
5217
2W
840
3.04
362
70.6
0.0
1.53
892.
5116
0.32
377
0.52
172
0.25
W85
01.
1917
73.0
990.
01.
4074
2.28
310.
0309
108
0.22
269
0.52
172
W89
04.
0964
65.3
080.
00.
8757
21.
4155
0.20
594
0.10
306
0.52
172
W90
06.
3372
60.2
940.
04.
1791
6.80
650.
1842
20.
0658
430.
5217
2

Hazard Mapping of the Philippines Using LIDAR (Phil-LIDAR 1)
174
Anne
x 10
. Sta
. Cru
z Mod
el R
each
Par
amet
ers
Tabl
e A-
10.1
. Sta
. Cru
z Mod
el R
each
Par
amet
ers
REAC
HM
USK
INGU
M C
UN
GE C
HAN
NEL
RO
UTI
NG
Tim
e St
ep M
etho
dLe
ngth
(M)
Slop
e(M
/M)
Man
ning
’s n
Shap
eW
idth
(M)
Side
Slo
pe (x
H:1V
)
R100
Auto
mati
c Fi
xed
Inte
rval
1915
.10.
0123
390
0.02
8571
4Tr
apez
oid
401
R110
Auto
mati
c Fi
xed
Inte
rval
772.
840.
0081
920
0.02
8571
4Tr
apez
oid
401
R120
Auto
mati
c Fi
xed
Inte
rval
1009
.10.
0152
341
0.02
8571
4Tr
apez
oid
401
R130
Auto
mati
c Fi
xed
Inte
rval
702.
130.
0133
766
0.02
8571
4Tr
apez
oid
401
R150
Auto
mati
c Fi
xed
Inte
rval
2195
.10.
0223
386
0.02
8571
4Tr
apez
oid
401
R160
Auto
mati
c Fi
xed
Inte
rval
215.
560.
0278
991
0.02
8571
4Tr
apez
oid
401
R190
Auto
mati
c Fi
xed
Inte
rval
4203
.70.
0209
649
0.02
8571
4Tr
apez
oid
401
R20
Auto
mati
c Fi
xed
Inte
rval
2734
.80.
0034
817
0.02
8571
4Tr
apez
oid
401
R210
Auto
mati
c Fi
xed
Inte
rval
1009
.50.
0120
658
0.02
8571
4Tr
apez
oid
401
R220
Auto
mati
c Fi
xed
Inte
rval
2222
.10.
0206
094
0.02
8571
4Tr
apez
oid
401
R240
Auto
mati
c Fi
xed
Inte
rval
1726
.90.
0048
070
0.02
8571
4Tr
apez
oid
401
R260
Auto
mati
c Fi
xed
Inte
rval
3619
.10.
0301
077
0.02
8571
4Tr
apez
oid
401
R30
Auto
mati
c Fi
xed
Inte
rval
1512
.4.0
0075
708
0.02
8571
4Tr
apez
oid
401
R300
Auto
mati
c Fi
xed
Inte
rval
1305
.70.
0369
659
0.02
8571
4Tr
apez
oid
401
R310
Auto
mati
c Fi
xed
Inte
rval
3201
.90.
0498
943
0.02
8571
4Tr
apez
oid
401
R330
Auto
mati
c Fi
xed
Inte
rval
211.
420.
0593
530
0.02
8571
4Tr
apez
oid
401
R390
Auto
mati
c Fi
xed
Inte
rval
2050
.70.
0763
791
0.02
8571
4Tr
apez
oid
401
R40
Auto
mati
c Fi
xed
Inte
rval
2270
.50.
0041
067
0.02
8571
4Tr
apez
oid
401
R60
Auto
mati
c Fi
xed
Inte
rval
494.
14.0
0041
263
0.02
8571
4Tr
apez
oid
401
R860
Auto
mati
c Fi
xed
Inte
rval
458.
990.
0020
036
0.02
8571
4Tr
apez
oid
401
R90
Auto
mati
c Fi
xed
Inte
rval
4344
.20.
0063
678
0.02
8571
4Tr
apez
oid
401
R920
Auto
mati
c Fi
xed
Inte
rval
3924
.30.
0010
646
0.02
8571
4Tr
apez
oid
401

LiDAR Surveys and Flood Mapping of Sta. Cruz River
175
Annex 11. Sta. Cruz Field Validation PointsTable A-11.1. Sta. Cruz Field Validation Points
Point Number
Validation Coordinates Model Var (m)
Validation Points (m) Error Event/Date
Rain Return/ ScenarioLatitude Longitude
1 14.224589 121.405963 0.06 0.22 0.22 Glenda / July, 2014 25-Year2 14.227874 121.402211 0.07 0.09 0.09 Ondoy / Sept. 26, 2009 25-Year3 14.224845 121.404570 8.46 0.82 0.82 Santi / Oct. 31, 2009 25-Year4 14.227874 121.402211 0.07 0.00 0.00 Santi / Oct. 31, 2009 25-Year5 14.223761 121.404884 0.07 0.00 0.00 Ondoy / Sept. 26, 2009 25-Year6 14.223614 121.404581 0.03 1.20 1.20 Santi / Oct. 31, 2009 25-Year7 14.230757 121.406508 7.08 0.40 0.40 Santi / Oct. 31, 2009 25-Year8 14.228207 121.404004 3.27 0.00 0.00 Santi / Oct. 31, 2009 25-Year9 14.228207 121.404004 3.27 4.00 4.00 Santi / Oct. 31, 2009 25-Year
10 14.228481 121.404619 3.40 4.00 4.00 Santi / Oct. 31, 2009 25-Year11 14.228308 121.403943 3.04 2.00 2.00 Ondoy / Sept. 26, 2009 25-Year12 14.228940 121.403647 3.97 0.00 0.00 Ondoy / Sept. 26, 2009 25-Year13 14.227900 121.403077 0.12 0.00 0.00 Santi / Oct. 31, 2009 25-Year14 14.231283 121.402108 0.23 1.40 1.40 Santi / Oct. 31, 2009 25-Year15 14.230165 121.400000 0.10 1.39 1.39 Santi / Oct. 31, 2009 25-Year16 14.231016 121.400489 0.03 1.12 1.12 Santi / Oct. 31, 2009 25-Year17 14.233378 121.401258 0.04 1.15 1.15 Santi / Oct. 31, 2009 25-Year18 14.231788 121.401356 0.04 1.06 1.06 Santi / Oct. 31, 2009 25-Year19 14.249040 121.416378 0.03 0.90 0.90 Santi / Oct. 31, 2009 25-Year20 14.248632 121.414954 0.06 0.23 0.23 Ondoy / Sept. 26, 2009 25-Year21 14.248423 121.414674 0.29 0.18 0.18 Santi / Oct. 31, 2009 25-Year22 14.248808 121.415565 0.19 1.53 1.53 Ondoy / Sept. 26, 2009 25-Year23 14.249451 121.414108 0.47 1.40 1.40 Ondoy / Sept. 26, 2009 25-Year24 14.249400 121.414062 0.99 0.76 0.76 Ondoy / Sept. 26, 2009 25-Year25 14.250025 121.414519 0.62 1.10 1.10 Ondoy / Sept. 26, 2009 25-Year26 14.269940 121.418265 0.03 0.38 0.38 Glenda / July, 2014 25-Year27 14.271200 121.419264 0.13 2.00 2.00 Glenda / July, 2014 25-Year28 14.270723 121.419285 0.06 0.00 0.00 Ondoy / Sept. 26, 2009 25-Year29 14.270443 121.419353 0.09 0.00 0.00 Ondoy / Sept. 26, 2009 25-Year30 14.271063 121.418614 0.06 0.15 0.15 Santi / Oct. 31, 2009 25-Year31 14.271755 121.417746 0.09 0.45 0.45 Ondoy / Sept. 26, 2009 25-Year32 14.265042 121.420423 0.51 0.50 0.50 Ondoy / Sept. 26, 2009 25-Year33 14.264926 121.420440 0.50 0.80 0.80 Ondoy / Sept. 26, 2009 25-Year34 14.264443 121.420853 0.14 0.90 0.90 Ondoy / Sept. 26, 2009 25-Year35 14.264897 121.421897 0.28 1.01 1.01 Santi / Oct. 31, 2009 25-Year36 14.263987 121.420797 0.07 0.50 0.50 Ondoy / Sept. 26, 2009 25-Year37 14.262112 121.420043 0.23 0.10 0.10 Ondoy / Sept. 26, 2009 25-Year38 14.288056 121.409722 0.03 1.63 1.63 Ondoy / 2009 25-Year39 14.287222 121.411389 0.05 1.64 1.64 Ondoy / 2009 25-Year
40 14.287222 121.412500 0.03 1.94 1.94Ondoy & Santi / 2009,
2013 25-Year

Hazard Mapping of the Philippines Using LIDAR (Phil-LIDAR 1)
176
Point Number
Validation Coordinates Model Var (m)
Validation Points (m) Error Event/Date
Rain Return/ ScenarioLatitude Longitude
41 14.289167 121.409722 0.24 1.36 1.36 Ondoy / 2009 25-Year
42 14.290556 121.411389 0.03 1.45 1.45Ondoy & Santi / 2009,
2013 25-Year43 14.288611 121.409444 0.03 1.93 1.93 Ondoy / 2009 25-Year
44 14.289444 121.409444 0.24 1.22 1.22Santi & Ondoy / 2013,
2009 25-Year45 14.288333 121.409444 0.04 2.25 2.25 Santi / 2013 25-Year46 14.288889 121.408889 0.03 1.68 1.68 Santi / 2013 25-Year47 14.289167 121.408611 0.03 1.28 1.28 Santi / 2013 25-Year48 14.288611 121.408889 0.37 1.46 1.46 Santi / 2013 25-Year49 14.290556 121.408333 0.03 0.82 0.82 Ondoy / 2009 25-Year50 14.288889 121.409722 0.03 1.17 1.17 Ondoy / 2009 25-Year
51 14.287778 121.410278 0.07 1.25 1.25Ondoy & Santi / 2009,
2013 25-Year52 14.280278 121.404167 0.15 1.08 1.08 Ondoy / 2009 25-Year53 14.280000 121.404100 0.15 0.58 0.58 Ondoy / 2009 25-Year
54 14.282500 121.444722 1.67 0.59 0.59Ondoy & Santi / 2009,
2013 25-Year
55 14.287500 121.409167 0.03 0.82 0.82Ondoy & Santi / 2009,
2013 25-Year56 14.287778 121.409444 2.08 0.75 0.75 Ondoy / 2009 25-Year57 14.285278 121.410833 0.03 0.92 0.92 Ondoy / 2009 25-Year58 14.280833 121.405000 0.40 0.24 0.24 Ondoy / 2009 25-Year59 14.281389 121.405833 0.75 0.82 0.82 Ondoy / 2009 25-Year60 14.280833 121.405000 0.40 1.10 1.10 Ondoy / 2009 25-Year61 14.280278 121.404444 0.15 1.19 1.19 Ondoy / 2009 25-Year62 14.287222 121.409444 0.03 0.80 0.80 Ondoy / 2009 25-Year
63 14.287500 121.409722 2.22 0.77 0.77Santi & Ondoy / 2013,
20009 25-Year
64 14.287778 121.408333 0.14 0.73 0.73Santi & Ondoy / 2013,
20009 25-Year
65 14.288389 121.407222 0.16 0.35 0.35Santi & Ondoy / 2013,
20009 25-Year66 14.288611 121.406389 0.03 1.00 1.00 Ondoy / 2009 25-Year
67 14.288056 121.408889 1.86 0.94 0.94Santi & Ondoy / 2013,
20009 25-Year68 14.288333 121.408611 1.84 0.83 0.83 Santi / 2013 25-Year69 14.288333 121.408889 1.80 0.72 0.72 Ondoy / 2009 25-Year70 14.288889 121.405278 0.11 1.15 1.15 Habagat / 2012/2013 25-Year
71 14.288056 121.405556 0.03 0.77 0.77Ondoy & Habagat / 2009,
2012/2013 25-Year72 14.281667 121.404444 0.40 0.83 0.83 Habagat / 2012/2013 25-Year73 14.289722 121.406944 0.03 0.76 0.76 Ondoy / 2009 25-Year74 14.256690 121.370833 0.03 0.00 0.00 Glenda / 2014 25-Year75 14.263013 121.368064 0.10 0.30 0.30 Glenda / 2014 25-Year76 14.259225 121.368158 0.04 0.12 0.12 Glenda / 2014 25-Year

LiDAR Surveys and Flood Mapping of Sta. Cruz River
177
Point Number
Validation Coordinates Model Var (m)
Validation Points (m) Error Event/Date
Rain Return/ ScenarioLatitude Longitude
77 14.255027 121.371668 0.03 0.00 0.00Ondoy & Rosing / 2009,
1995 25-Year78 14.268979 121.399406 0.35 0.10 0.10 Ondoy / 2009 25-Year79 14.282048 121.396063 0.04 1.17 1.17 Santi / 2013 25-Year80 14.281630 121.395943 0.17 1.30 1.30 Santi / 2013 25-Year
81 14.281510 121.395493 0.03 1.16 1.16Ondoy & Santi / 2009,
2013 25-Year82 14.280053 121.393328 0.03 0.89 0.89 Ondoy / 2009 25-Year
83 14.281213 121.394183 0.03 0.50 0.50Habagat & Yolanda /
2012/2013, 2013 25-Year84 14.282543 121.397496 0.07 0.70 0.70 Ondoy / 2009 25-Year
85 14.282330 121.396966 0.03 1.13 1.13Ondoy & Santi / 2009,
2013 25-Year
86 14.276823 121.383873 0.05 0.90 0.90Ondoy & Santi / 2009,
2013 25-Year87 14.276057 121.383620 0.72 1.63 1.63 Ondoy / 2009 25-Year88 14.265271 121.382189 0.03 0.15 0.15 Ondoy / 2009 25-Year
89 14.274181 121.381920 0.03 0.80 0.80Ondoy & Dading / 2009,
1964 25-Year
90 14.272188 121.378597 0.03 0.83 0.83Santi & Glenda / 2013,
2014 25-Year91 14.271426 121.378149 0.11 0.65 0.65 Ondoy / 2009 25-Year92 14.271072 121.377583 0.03 0.29 0.29 Ondoy / 2009 25-Year93 14.268956 121.454701 2.65 0.47 0.47 Glenda / July, 2014 25-Year94 14.230807 121.463446 0.03 0.43 0.43 Ondoy / Sept. 26, 2009 25-Year
95 14.231547 121.463348 0.03 0.04 0.04Ondoy/ Santi / Sept. 26,
2009; Oct. 31, 2009 25-Year
96 14.236500 121.462200 0.03 0.04 0.04Ondoy/ Santi / Sept. 26,
2009; Oct. 31, 2009 25-Year97 14.239400 121.461500 3.63 2.50 2.50 Yolanda / Nov. 8, 2013 25-Year98 14.240058 121.462033 2.10 0.00 0.00 Glenda / July, 2014 25-Year99 14.243124 121.460466 5.36 2.00 2.00 Santi / Oct. 31, 2009 25-Year
100 14.243207 121.460487 6.29 2.15 2.15 Santi / Oct. 31, 2009 25-Year101 14.243289 121.460585 2.58 0.97 0.97 Santi / Oct. 31, 2009 25-Year102 14.244973 121.460574 0.15 0.00 0.00 Santi / Oct. 31, 2009 25-Year103 14.244387 121.460855 0.03 0.43 0.43 Santi / Oct. 31, 2009 25-Year104 14.247097 121.458898 2.17 0.64 0.64 Santi / Oct. 31, 2009 25-Year105 14.247100 121.458997 2.23 0.67 0.67 Santi / Oct. 31, 2009 25-Year106 14.249251 121.457291 1.46 0.99 0.99 Santi / Oct. 31, 2009 25-Year107 14.249333 121.457685 1.39 0.40 0.40 Santi / Oct. 31, 2009 25-Year108 14.251883 121.455120 0.50 0.80 0.80 Glenda / July, 2014 25-Year109 14.254101 121.454505 2.16 0.38 0.38 Glenda / July, 2014 25-Year110 14.254225 121.454384 1.90 0.15 0.15 Santi / Oct. 31, 2009 25-Year111 14.254628 121.453468 1.93 1.02 1.02 Yolanda / Nov. 8, 2013 25-Year
112 14.269327 121.449792 1.59 0.96 0.96Ondoy/ Santi / Sept. 26,
2009; Oct. 31, 2009 25-Year

Hazard Mapping of the Philippines Using LIDAR (Phil-LIDAR 1)
178
Point Number
Validation Coordinates Model Var (m)
Validation Points (m) Error Event/Date
Rain Return/ ScenarioLatitude Longitude
113 14.269222 121.447735 1.16 0.82 0.82 Santi / Oct. 31, 2009 25-Year114 14.268981 121.447796 0.68 1.20 1.20 Santi / Oct. 31, 2009 25-Year115 14.270433 121.449267 1.22 1.13 1.13 Santi / Oct. 31, 2009 25-Year116 14.270286 121.449409 1.20 1.27 1.27 Santi / Oct. 31, 2009 25-Year117 14.268613 121.449986 1.98 1.43 1.43 Ondoy / Sept. 26, 2009 25-Year118 14.269374 121.450217 1.71 2.28 2.28 Santi / Oct. 31, 2009 25-Year119 14.271544 121.450796 7.74 1.42 1.42 Santi / Oct. 31, 2009 25-Year120 14.270370 121.451138 1.18 1.00 1.00 Santi / Oct. 31, 2009 25-Year121 14.271062 121.451358 1.30 2.19 2.19 Santi / Oct. 31, 2009 25-Year122 14.269460 121.451984 2.63 2.50 2.50 Santi / Oct. 31, 2009 25-Year123 14.269237 121.453533 3.16 2.70 2.70 Santi / Oct. 31, 2009 25-Year124 14.269389 121.454581 2.40 2.70 2.70 Santi / Oct. 31, 2009 25-Year125 14.269313 121.455019 1.98 1.75 1.75 Santi / Oct. 31, 2009 25-Year126 14.269432 121.455800 1.88 0.75 0.75 Santi / Oct. 31, 2009 25-Year127 14.270217 121.456740 0.83 0.50 0.50 Ondoy / Sept. 26, 2009 25-Year128 14.270298 121.455980 1.13 0.74 0.74 Ondoy / Sept. 26, 2009 25-Year129 14.270862 121.456671 1.54 2.10 2.10 Santi / Oct. 31, 2009 25-Year130 14.270504 121.454021 1.75 2.20 2.20 Santi / Oct. 31, 2009 25-Year131 14.243035 121.454299 1.68 0.00 0.00 Glenda / 2014 25-Year132 14.247619 121.453101 2.14 0.90 0.90 Santi / 2013 25-Year133 14.247603 121.453024 2.19 0.85 0.85 Santi / 2013 25-Year
134 14.247428 121.451818 3.68 1.33 1.33Ondoy, Glenda / 2009,
2014 25-Year135 14.247088 121.451119 0.90 0.00 0.00 Ondoy / 2009 25-Year136 14.246688 121.450782 1.38 0.00 0.00 Yolanda / 2013 25-Year137 14.247041 121.451754 1.20 0.00 0.00 Santi / 2013 25-Year138 14.249761 121.451229 1.94 1.89 1.89 Santi / 10/30/2016 25-Year139 14.249761 121.451229 1.94 2.25 2.25 Santi / 10/30/2016 25-Year
140 14.258443 121.447610 1.94 0.70 0.70Rosing, Santi / 1995,
2013 25-Year141 14.259119 121.447647 1.33 0.00 0.00 25-Year142 14.258882 121.447830 1.18 1.20 1.20 Ondoy / 2009 25-Year143 14.258882 121.447830 1.18 1.22 1.22 Santi / 2013 25-Year144 14.259134 121.447429 1.68 0.92 0.92 Ondoy / 7/7/2015 25-Year145 14.259134 121.447429 1.68 1.52 1.52 Rosing / 1995 25-Year146 14.258119 121.445740 1.62 0.70 0.70 Ondoy / 2009 25-Year147 14.257679 121.445394 1.60 1.35 1.35 Ondoy, Santi / 7/1/2014 25-Year
148 14.256813 121.445189 2.03 0.20 0.20Yolanda, Santi / 2013,
2013 25-Year149 14.255473 121.443885 0.05 0.13 0.13 Santi / 2013 25-Year150 14.254518 121.443608 0.03 0.00 0.00 Milenyo / 2006 25-Year
151 14.255693 121.443514 0.24 0.62 0.62Ondoy, Santi / 2009,
2013 25-Year152 14.261493 121.446689 1.55 1.15 1.15 Ondoy / 2009 25-Year

LiDAR Surveys and Flood Mapping of Sta. Cruz River
179
Point Number
Validation Coordinates Model Var (m)
Validation Points (m) Error Event/Date
Rain Return/ ScenarioLatitude Longitude
153 14.259327 121.447279 1.92 1.33 1.33Rosing, Santi / 1995,
2013 25-Year154 14.253114 121.448416 2.26 0.87 0.87 Santi / 2013 25-Year
155 14.253021 121.448088 1.88 1.20 1.20Rosing, Santi / 1995,
2013 25-Year
156 14.253866 121.449064 0.82 0.27 0.27Ondoy, Santi / 2009,
2013 25-Year157 14.254682 121.448176 2.04 1.47 1.47 Ondoy / 2009 25-Year158 14.263819 121.447109 2.26 1.34 1.34 Santi / 2013 25-Year
159 14.263842 121.446347 0.54 0.35 0.35Ondoy, Santi / 2009,
2013 25-Year
160 14.263406 121.446261 0.79 1.30 1.30Ondoy, Santi / 2009,
2013 25-Year161 14.263351 121.445872 1.19 0.61 0.61 Santi / 2013 25-Year162 14.263395 121.445621 1.37 1.32 1.32 Santi / 2013 25-Year163 14.267774 121.446308 1.48 1.58 1.58 Santi / 2013 25-Year164 14.268023 121.445940 2.15 0.14 0.14 Glenda / 2014 25-Year165 14.267913 121.445544 0.24 0.10 0.10 Santi / 2013 25-Year166 14.268321 121.445366 0.36 0.48 0.48 Santi / 2013 25-Year167 14.268251 121.445507 0.12 0.66 0.66 Santi / 2013 25-Year168 14.268250 121.445956 1.68 2.61 2.61 Santi, Basyang / 2009 25-Year169 14.268301 121.446663 0.46 0.84 0.84 Santi / 2013 25-Year170 14.268604 121.446049 1.97 2.40 2.40 Ondoy, Santi / 2009 25-Year171 14.268581 121.445528 0.06 0.00 0.00 25-Year172 14.268586 121.445164 0.12 0.27 0.27 Santi / 2013 25-Year173 14.269375 121.444741 0.61 1.32 1.32 Santi / 2013 25-Year174 14.269621 121.445344 0.40 1.34 1.34 Rosing / 1995 25-Year175 14.269393 121.446544 1.84 2.22 2.22 Santi / 2013 25-Year176 14.269404 121.446545 1.84 1.51 1.51 Santi / 2013 25-Year177 14.269846 121.446133 0.54 0.50 0.50 25-Year178 14.269893 121.446181 0.48 2.80 2.80 Santi / 2013 25-Year
179 14.270014 121.446649 1.90 2.55 2.55Santi, Rosing / 2013,
1995 25-Year180 14.270109 121.445254 0.51 0.68 0.68 Santi / 2013 25-Year181 14.270195 121.454683 2.04 1.24 1.24 Santi / Oct. 31, 2009 25-Year182 14.269703 121.454857 1.83 1.23 1.23 Santi / Oct. 31, 2009 25-Year183 14.205146 121.441228 0.03 0.00 0.00 25-Year184 14.204780 121.441186 0.03 0.00 0.00 25-Year185 14.205184 121.441244 0.03 0.00 0.00 25-Year186 14.205370 121.441448 0.03 0.00 0.00 25-Year187 14.207373 121.442269 0.03 0.00 0.00 25-Year188 14.208289 121.441924 0.03 0.41 0.41 Glenda / 2014 25-Year189 14.208542 121.441766 0.03 0.00 0.00 25-Year190 14.209358 121.441623 0.06 0.44 0.44 Ondoy / 2009 25-Year191 14.209440 121.441422 0.03 0.00 0.00 25-Year

Hazard Mapping of the Philippines Using LIDAR (Phil-LIDAR 1)
180
Point Number
Validation Coordinates Model Var (m)
Validation Points (m) Error Event/Date
Rain Return/ ScenarioLatitude Longitude
192 14.210204 121.439601 0.30 0.36 0.36 Glenda / 2014 25-Year193 14.210055 121.439279 0.39 0.00 0.00 25-Year194 14.204812 121.441857 0.03 0.00 0.00 25-Year195 14.204558 121.441702 0.75 0.00 0.00 25-Year196 14.205284 121.441920 0.03 0.00 0.00 25-Year197 14.203173 121.440600 0.05 0.00 0.00 25-Year198 14.203561 121.441041 0.03 0.00 0.00 25-Year199 14.205130 121.440512 0.04 0.00 0.00 25-Year200 14.223598 121.456242 1.93 0.52 0.52 Rosing / 1995 25-Year201 14.225340 121.458010 1.65 0.91 0.91 Milenyo / 2006 25-Year202 14.225633 121.458167 2.37 0.00 0.00 25-Year203 14.223524 121.456415 2.13 0.00 0.00 25-Year204 14.221390 121.454927 2.32 0.00 0.00 25-Year205 14.221148 121.454882 1.55 0.00 0.00 25-Year206 14.220420 121.454940 1.01 0.00 0.00 25-Year207 14.220129 121.454604 0.69 0.00 0.00 25-Year208 14.219606 121.454481 0.37 0.35 0.35 Yolanda / 2013 25-Year209 14.216413 121.452266 0.03 0.00 0.00 25-Year210 14.216402 121.452290 0.03 0.00 0.00 25-Year211 14.216938 121.453001 0.04 0.00 0.00 25-Year212 14.216962 121.453042 0.04 0.00 0.00 25-Year213 14.216301 121.453009 0.11 0.00 0.00 25-Year214 14.215878 121.452779 0.10 0.00 0.00 25-Year215 14.215028 121.452063 0.03 0.00 0.00 25-Year216 14.214896 121.452152 0.03 0.00 0.00 25-Year217 14.216093 121.452933 0.05 0.00 0.00 25-Year218 14.216103 121.452876 0.03 0.80 0.80 25-Year219 14.226651 121.458120 3.15 0.32 0.32 Bagyo / 25-Year220 14.226643 121.458234 3.18 0.62 0.62 Bagyo / 25-Year221 14.226715 121.458259 3.16 0.95 0.95 Santi / 2013 25-Year222 14.226821 121.458388 3.48 0.62 0.62 Bagyo 25-Year223 14.227218 121.458189 3.62 0.00 0.00 25-Year224 14.228056 121.456944 2.56 0.31 0.31 Ondoy / 2009 25-Year225 14.228333 121.457222 2.43 1.31 1.31 Santi / 2013 25-Year226 14.226944 121.455833 2.07 0.38 0.38 Yolanda / 2013 25-Year227 14.226667 121.455000 1.73 0.00 0.00 25-Year228 14.225833 121.450556 0.11 0.00 0.00 25-Year229 14.298889 121.461944 0.84 0.91 0.91 Ondoy / 2009 25-Year230 14.302500 121.461944 0.96 0.58 0.58 Ondoy / 2009 25-Year
231 14.302222 121.462222 1.08 0.62 0.62Ondoy, Santi / 2009,
2013 25-Year232 14.302778 121.461944 0.86 1.60 1.60 2011 25-Year233 14.305556 121.458889 0.10 0.17 0.17 Ondoy / 2009 25-Year234 14.305556 121.460000 0.04 1.11 1.11 Ondoy / 2009 25-Year

LiDAR Surveys and Flood Mapping of Sta. Cruz River
181
Point Number
Validation Coordinates Model Var (m)
Validation Points (m) Error Event/Date
Rain Return/ ScenarioLatitude Longitude
235 14.304444 121.460556 0.06 0.42 0.42Ondoy, Santi / 2009,
2013 25-Year
236 14.305000 121.462222 0.60 1.90 1.90Ondoy, Santi / 2009,
2013 25-Year237 14.307500 121.458333 0.10 1.15 1.15 Ondoy / 2009 25-Year238 14.308889 121.455833 0.14 0.30 0.30 Ondoy / 2009 25-Year239 14.308056 121.454722 1.97 0.90 0.90 Ondoy / 2009 25-Year240 14.305278 121.449444 0.03 0.70 0.70 Yolanda / 2013 25-Year241 14.308056 121.456111 0.05 0.40 0.40 Ondoy / 2009 25-Year242 14.310000 121.456389 0.09 0.72 0.72 Ondoy / 2009 25-Year243 14.309722 121.455556 0.22 0.00 0.00 Ondoy / 2009 25-Year244 14.306111 121.450000 0.10 0.30 0.30 Yolanda / 2013 25-Year245 14.310278 121.456111 0.08 0.23 0.23 Habagat / 2012/2013 25-Year246 14.299167 121.456111 0.55 0.82 0.82 Ondoy / 2009 25-Year
247 14.300000 121.461111 0.39 1.65 1.65Ondoy, Santi / 2009,
2013 25-Year248 14.301111 121.452222 0.08 0.50 0.50 Ondoy / 2009 25-Year249 14.301111 121.451667 0.07 0.44 0.44 Ondoy / 2009 25-Year
250 14.301667 121.452500 0.03 1.38 1.38Ondoy, Santi, Tino /
2009, 2013, 2013 25-Year251 14.300556 121.449722 0.22 0.00 0.00 Ondoy / 2009 25-Year
252 14.301111 121.449167 0.46 0.35 0.35Ondoy, Yolanda / 2009,
2013 25-Year
253 14.302500 121.451944 0.03 0.52 0.52
Habagat, Ondoy, Santi, Glenda / 2012/2013,
2009, 2013, 2014 25-Year254 14.302778 121.451944 1.23 0.60 0.60 Ondoy / 2009 25-Year
255 14.301389 121.449444 0.06 1.39 1.39Ondoy, Santi / 2009,
2013 25-Year
256 14.301944 121.453333 0.03 1.37 1.37Ondoy, Santi / 2009,
2013 25-Year
257 14.298889 121.456944 0.49 0.74 0.74Ondoy, Santi, Pepeng /
2009, 2013, 2009 25-Year
258 14.300000 121.460833 0.59 0.25 0.25Ondoy, Yolanda / 2009,
2013 25-Year
259 14.300278 121.453611 0.03 0.00 0.00Ondoy, Santi, Yolanda /
2009, 2013, 2013 25-Year
260 14.279167 121.432500 0.03 0.60 0.60Ondoy, Habagat / 2009,
2012/2013 25-Year
261 14.278611 121.432778 0.14 0.62 0.62Ondoy, Santi / 2009,
2013 25-Year262 14.277500 121.431944 0.03 0.90 0.90 Glenda / 2014 25-Year263 14.301667 121.458611 2.05 2.95 2.95 Ondoy / 2009 25-Year264 14.301667 121.458889 0.57 0.78 0.78 Santi / 2013 25-Year265 14.301667 121.459444 0.03 0.55 0.55 Ondoy / 2009 25-Year266 14.300278 121.461111 0.53 0.50 0.50 Ondoy / 2009 25-Year267 14.302222 121.459167 0.05 1.10 1.10 Ondoy / 2009 25-Year

Hazard Mapping of the Philippines Using LIDAR (Phil-LIDAR 1)
182
Point Number
Validation Coordinates Model Var (m)
Validation Points (m) Error Event/Date
Rain Return/ ScenarioLatitude Longitude
268 14.302778 121.460000 0.03 0.50 0.50 Ondoy / 2009 25-Year269 14.302500 121.460278 0.22 0.72 0.72 Ondoy / 2009 25-Year270 14.301944 121.460000 0.03 0.50 0.50 Glenda / 2014 25-Year

LiDAR Surveys and Flood Mapping of Sta. Cruz River
183
Annex 12. Phil-LiDAR 1 UPLB Team Composition
Project Leader Asst. Prof. Edwin R. Abucay (CHE, UPLB)
Project Staffs/Study Leaders Asst. Prof. Efraim D. Roxas (CHE, UPLB) Asst. Prof. Joan Pauline P. Talubo (CHE, UPLB) Ms. Sandra Samantela (CHE, UPLB) Dr. Cristino L. Tiburan (CFNR, UPLB) Engr. Ariel U. Glorioso (CEAT, UPLB) Ms. Miyah D. Queliste (CAS, UPLB) Mr. Dante Gideon K. Vergara (SESAM, UPLB)
Sr. Science Research Specialists Gillian Katherine L. Inciong For. John Alvin B. Reyes
Research Associates Alfi Lorenz B. Cura Angelica T. Magpantay Gemmalyn E. Magnaye Jayson L. Arizapa Kevin M. Manalo Leendel Jane D. Punzalan Maria Michaela A. Gonzales Paulo Joshua U. Quilao Sarah Joy A. Acepcion Raphael P. Gonzales
Computer Programmers Ivan Marc H. Escamos Allen Roy C. Roberto
Information Systems Analyst Jan Martin C. Magcale
Project Assistants Daisili Ann V. Pelegrina Athena Mercado Kaye Anne A. Matre Randy P. Porciocula
Related Documents