L IBSPECTOR: Context-Aware Large-Scale Network Traffic Analysis of Android Applications Onur Zungur Boston University Boston, USA [email protected] Gianluca Stringhini Boston University Boston, USA [email protected] Manuel Egele Boston University Boston, USA [email protected] Abstract—Android applications (apps) are a combination of code written by the developers as well as third-party libraries that carry out most commonly used functionalities such as advertisement and payments. Running apps in a monitoring environment allows researchers to measure how much network traffic is exchanged between an app and remote endpoints. However, current systems currently do not have the ability to reliably distinguish traffic that is generated by different libraries. This is important, because while mobile users are paying for data traffic without distinctions, some of this traffic is useful (e.g., data for core app functionalities), whereas the rest of the traffic can be considered a nuisance (e.g., excessive advertisements). In this paper, we present LIBSPECTOR, a system that precisely attributes network traffic coming from an Android app to the library that generated it. To this end, we instrument the Android Framework to inspect the network connections initiated by apps, provide fine-grained information on the libraries in use, and calculate method coverage information while performing dynamic analysis. We then perform a measurement on 25,000 popular Android apps and investigate the relation between different categories of apps with the use of specific libraries. We analyze the method coverage of our dynamic analysis method, and further characterize the endpoint connections established by the Android apps. Our results indicate that advertisement libraries account for over a quarter of the total data transmission. We further observe that there is no strict 1-to-1 correlation between the similar categories of network endpoints and libraries which initiated the data transfer. I. I NTRODUCTION Mobile applications, or apps, are a significant reason for the success of mobile smart devices over the last decade. Apps allow end-users to extend the capabilities of off-the-shelf mobile devices with functionality that the original designers did not anticipate. Today, the two most prominent mobile platforms, Google’s Android and Apple’s iOS, give users access to market places that each host in excess of 3.7 million third-party apps, many of which accumulated billions of installations [39]–[41]. A further testament to the success of mobile apps is the amount of revenue that app developers can generate. For example, SensorTower [37] reported that global mobile app revenue for Google PlayStore apps reached $7.1 billion for the first quarter of 2019 with a 20.2% increase year over year. In addition to revenues generated from App Store sales, developers can also tap into alternative revenue streams which frequently come in the form of advertising. The popularity and diversity of the app-ecosystem has resulted in a multitude of measurement studies that analyze these systems from various angles. For example, Petsas et. al [31] investigated how rankings on app-stores affect the install base of apps, whereas Wang et al. [45] focused on third- party library prevalence, API levels, privileges and malware occurrences. Most closely related to our work are the ad- library network traffic detection by Xue et al. [47], Maier et al. [28] and Tongaonkar et al. [42]. In their studies, Xue et al. and Maier et al. used User-Agent field in HTTP headers, whereas Tongaonkar et al. used hostnames for identifying ad- library traffic. Prior work focused on using the information contained in the network packets to identify which libraries generated the network traffic. Unfortunately, in general, modern mobile apps consist of an amalgamation of developer-authored and “exter- nal” library code, both of which can generate network traffic. Therefore, treating all network data equal when attributing it to an app, classifying the network traffic based on header information or network endpoints do not adequately consider this development, and might produce inaccurate results. For example, the prevalence of generic identifiers in HTTP head- ers, same hosts (i.e., companies) serving multiple apps and the use of Content Distribution Networks render a purely network- focused analysis of library traffic insufficient for reliable traffic attribution. In this paper, we are interested in answering questions such as, how much network data that is sent or received by an app belongs to first-party (i.e., developer-authored) code, and how much of that data serves auxiliary purposes, such as advertisement, or statistic usage information collection. Additionally, we are interested in questions, such as which library categories (e.g., development aid) are responsible for generating what fraction of the network traffic. To answer such detailed questions, it is not sufficient to attribute network traffic to an individual app or use network packets only. Instead, we argue that the attribution of network traffic to app components requires more precise runtime infor- mation, from which we can derive contextual information and gain insights on network activities. To obtain this additional contextual information, we built LIBSPECTOR, a dynamic analysis system for Android apps. LIBSPECTOR installs each app in an Android emulator and exercises it while monitoring the network traffic and the app’s execution in detail. Given that Android apps are inherently 1

Welcome message from author
This document is posted to help you gain knowledge. Please leave a comment to let me know what you think about it! Share it to your friends and learn new things together.
Transcript
LIBSPECTOR: Context-Aware Large-Scale NetworkTraffic Analysis of Android Applications
Onur ZungurBoston University
Boston, [email protected]
Gianluca StringhiniBoston University
Boston, [email protected]
Manuel EgeleBoston University
Boston, [email protected]
Abstract—Android applications (apps) are a combination ofcode written by the developers as well as third-party librariesthat carry out most commonly used functionalities such asadvertisement and payments. Running apps in a monitoringenvironment allows researchers to measure how much networktraffic is exchanged between an app and remote endpoints.However, current systems currently do not have the ability toreliably distinguish traffic that is generated by different libraries.This is important, because while mobile users are paying for datatraffic without distinctions, some of this traffic is useful (e.g., datafor core app functionalities), whereas the rest of the traffic canbe considered a nuisance (e.g., excessive advertisements).
In this paper, we present LIBSPECTOR, a system that preciselyattributes network traffic coming from an Android app to thelibrary that generated it. To this end, we instrument the AndroidFramework to inspect the network connections initiated byapps, provide fine-grained information on the libraries in use,and calculate method coverage information while performingdynamic analysis. We then perform a measurement on 25,000popular Android apps and investigate the relation betweendifferent categories of apps with the use of specific libraries. Weanalyze the method coverage of our dynamic analysis method,and further characterize the endpoint connections establishedby the Android apps. Our results indicate that advertisementlibraries account for over a quarter of the total data transmission.We further observe that there is no strict 1-to-1 correlationbetween the similar categories of network endpoints and librarieswhich initiated the data transfer.
I. INTRODUCTION
Mobile applications, or apps, are a significant reason forthe success of mobile smart devices over the last decade.Apps allow end-users to extend the capabilities of off-the-shelfmobile devices with functionality that the original designersdid not anticipate. Today, the two most prominent mobileplatforms, Google’s Android and Apple’s iOS, give usersaccess to market places that each host in excess of 3.7million third-party apps, many of which accumulated billionsof installations [39]–[41]. A further testament to the success ofmobile apps is the amount of revenue that app developers cangenerate. For example, SensorTower [37] reported that globalmobile app revenue for Google PlayStore apps reached $7.1billion for the first quarter of 2019 with a 20.2% increase yearover year. In addition to revenues generated from App Storesales, developers can also tap into alternative revenue streamswhich frequently come in the form of advertising.
The popularity and diversity of the app-ecosystem hasresulted in a multitude of measurement studies that analyze
these systems from various angles. For example, Petsas et.al [31] investigated how rankings on app-stores affect theinstall base of apps, whereas Wang et al. [45] focused on third-party library prevalence, API levels, privileges and malwareoccurrences. Most closely related to our work are the ad-library network traffic detection by Xue et al. [47], Maier etal. [28] and Tongaonkar et al. [42]. In their studies, Xue et al.and Maier et al. used User-Agent field in HTTP headers,whereas Tongaonkar et al. used hostnames for identifying ad-library traffic.
Prior work focused on using the information contained inthe network packets to identify which libraries generated thenetwork traffic. Unfortunately, in general, modern mobile appsconsist of an amalgamation of developer-authored and “exter-nal” library code, both of which can generate network traffic.Therefore, treating all network data equal when attributingit to an app, classifying the network traffic based on headerinformation or network endpoints do not adequately considerthis development, and might produce inaccurate results. Forexample, the prevalence of generic identifiers in HTTP head-ers, same hosts (i.e., companies) serving multiple apps and theuse of Content Distribution Networks render a purely network-focused analysis of library traffic insufficient for reliable trafficattribution.
In this paper, we are interested in answering questionssuch as, how much network data that is sent or received byan app belongs to first-party (i.e., developer-authored) code,and how much of that data serves auxiliary purposes, suchas advertisement, or statistic usage information collection.Additionally, we are interested in questions, such as whichlibrary categories (e.g., development aid) are responsible forgenerating what fraction of the network traffic.
To answer such detailed questions, it is not sufficient toattribute network traffic to an individual app or use networkpackets only. Instead, we argue that the attribution of networktraffic to app components requires more precise runtime infor-mation, from which we can derive contextual information andgain insights on network activities.
To obtain this additional contextual information, we builtLIBSPECTOR, a dynamic analysis system for Android apps.LIBSPECTOR installs each app in an Android emulator andexercises it while monitoring the network traffic and the app’sexecution in detail. Given that Android apps are inherently
1
driven by user-interface interactions, we leverage the Androidmonkey [4] User Interface exerciser tool. Similar to priorwork, we record packet captures of all network communica-tions in and out of the emulated environment. However, toderive the information necessary to attribute network packetsto classes and methods in an app, we modify the Androidframework to capture this information at runtime. Specifically,every time the app connects a network socket, our modifiedsystem attributes the resulting socket-pair (i.e., the tuple of(srcIP, srcPort, dstIP, dstPort)) with the corresponding Javamethod. With this additional information at hand, we canattribute each packet to the method that connected the cor-responding socket. Based on this detailed attribution, we cannow measure, for each app, how much traffic is originatingfrom which and what kind of library, what kind of networkendpoints the packets are destined, and how much of the appcode is leading to network-related activities.
We performed a large scale analysis on 25,000 apps thatspan 49 of the app categories in Google’s Play store. We ob-served that runtime inspection provided us with more detail onthe established network connections where the network-basedclassifications could lead to inaccurate results. To the bestof our knowledge, our study is the first dynamic analysis onAndroid apps which can attribute network traffic to apps’ third-party libraries using app runtime information with method-level granularity. Furthermore, we augment our measurementresults with existing data-sources (e.g., the library categoriza-tion efforts of LibRadar [26]) to shine additional light on thenetwork traffic behavior on entire library categories.
In summary, this paper makes the following contributions:• We design and implement LIBSPECTOR, a fine-grained
measurement system that attributes network packets to themethod and library of an Android app that is responsiblefor sending or receiving that packet (§II-A).
• Based on this automated analysis capability, we ana-lyze 25,000 Android apps via large-scale dynamic analy-sis, where we exercise each app via Android’s monkey.
• By analyzing the resulting captured network traffic, wedemonstrate the importance of library analysis using app-context, and make the following observations: i) ad-vertisement libraries cause a quarter of the mobile appnetwork traffic, ii) 35% of apps only had advertisementand tracker (AnT) traffic, whereas 89% of the apps hadsome AnT traffic, iii) there is not always a strict 1-to-1 correlation between libraries and connection endpointsof the same category, and iv) estimated advertisementtraffic costs $1.17 to users and causes 18.7% more energyconsumption.
II. LIBSPECTOR OVERVIEW
In this paper we aim to collect fine grained informationon which network data is generated by which libraries in anAndroid app. As such, our main goals when designing ouranalysis system are to i) exercise an app to determine whichlibraries and methods cause a network connection and measureJava method coverage, ii) measure how much data flow we
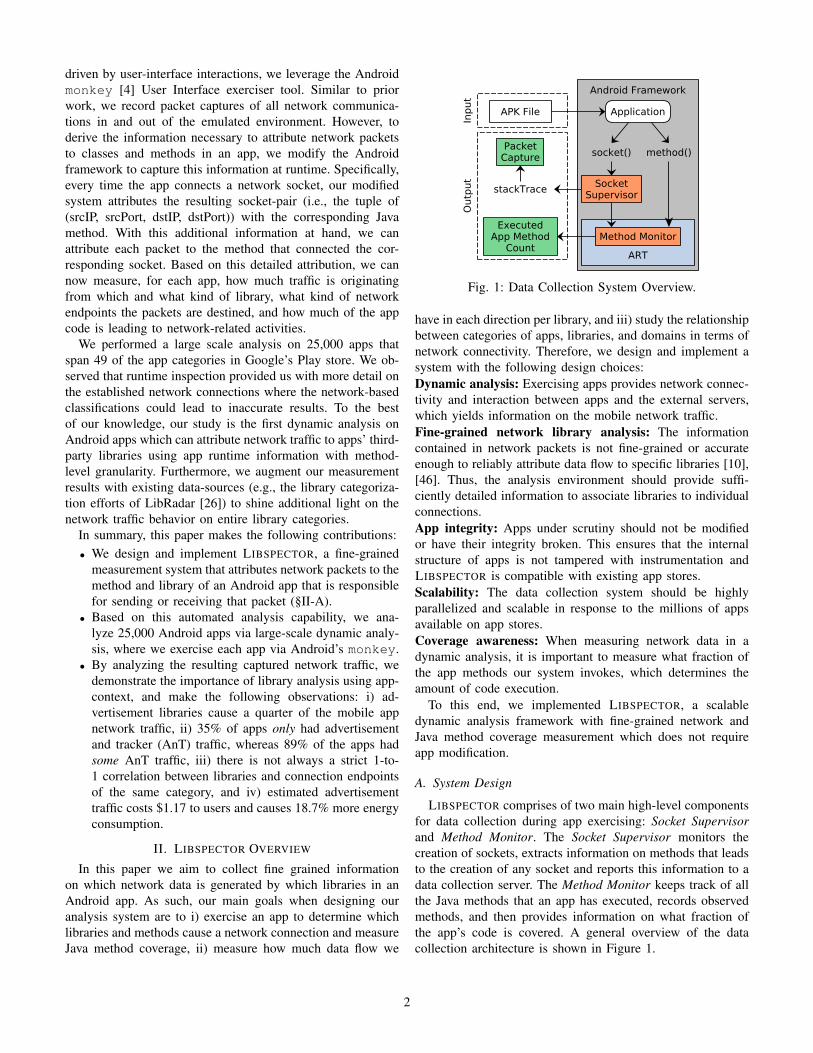
Fig. 1: Data Collection System Overview.
have in each direction per library, and iii) study the relationshipbetween categories of apps, libraries, and domains in terms ofnetwork connectivity. Therefore, we design and implement asystem with the following design choices:Dynamic analysis: Exercising apps provides network connec-tivity and interaction between apps and the external servers,which yields information on the mobile network traffic.Fine-grained network library analysis: The informationcontained in network packets is not fine-grained or accurateenough to reliably attribute data flow to specific libraries [10],[46]. Thus, the analysis environment should provide suffi-ciently detailed information to associate libraries to individualconnections.App integrity: Apps under scrutiny should not be modifiedor have their integrity broken. This ensures that the internalstructure of apps is not tampered with instrumentation andLIBSPECTOR is compatible with existing app stores.Scalability: The data collection system should be highlyparallelized and scalable in response to the millions of appsavailable on app stores.Coverage awareness: When measuring network data in adynamic analysis, it is important to measure what fraction ofthe app methods our system invokes, which determines theamount of code execution.
To this end, we implemented LIBSPECTOR, a scalabledynamic analysis framework with fine-grained network andJava method coverage measurement which does not requireapp modification.
A. System Design
LIBSPECTOR comprises of two main high-level componentsfor data collection during app exercising: Socket Supervisorand Method Monitor. The Socket Supervisor monitors thecreation of sockets, extracts information on methods that leadsto the creation of any socket and reports this information to adata collection server. The Method Monitor keeps track of allthe Java methods that an app has executed, records observedmethods, and then provides information on what fraction ofthe app’s code is covered. A general overview of the datacollection architecture is shown in Figure 1.
2
1) Socket Supervisor: Any network communication in An-droid starts with a socket system call, regardless of whetheran Android app establishes the network connection frommanaged Dalvik code or natively. It is therefore fundamentalfor a fine-grained network-activity data collection system tomonitor and examine the creation of sockets. Here, we definethe fine-grained information (i.e., context) as the Java callstack that is related to the socket creation, which includesinformation on the libraries.
2) Method Monitor: One of the drawbacks of dynamicanalysis is achieving complete coverage. Since every app mayuse different series of method calls leading to a networkconnection, lower coverage rates indicate unexplored methods.In such cases, the dynamic analysis would result in incom-plete data for total traffic volume and missing attribution ofdata transfer to libraries, as unexplored methods may causemore network traffic or belong to different libraries than thealready executed ones. Having an accurate method coveragemeasurement provides information on the lower bound of thecollected data over the course of our dynamic analysis andquantify the accuracy of our system.
While the Socket Supervisor can provide information onnetwork connections (i.e., Java methods in the call stack thatleads to a socket), the Socket Supervisor cannot monitor non-socket-related information. Therefore, we design the MethodMonitor, which monitors all the Java methods and creates aset of methods that that the app invokes. Subsequently, theMethod Monitor disassembles the apps’ dex file under theapk package to obtain a full set of methods that the appincludes, and calculates the Java method coverage as a ratioof executed app methods over total app methods.
B. System Implementation
1) Method Monitor: We implemented the Method Monitoras a combination of a modified ART runtime and Android’sbuilt-in debugging tools. The implementation of the ARTruntime includes an API through Activity Manager to measureapp performance with Android Profiler. This API provides pro-visions to monitor Java method calls using the Android DebugBridge (adb), to register method signatures and timestampswhen a Java method is entered or exited. Hence, we use thisAPI to control the Android Profiler and register listeners formethod invocations. The ART runtime, by default, stores thecollected data in a user-specified buffer, which is insufficient(i.e., filled within seconds of app initialization) for the amountof data we collect during our experiments as listeners alsorecord repeated calls to a method. Therefore, we modified theART runtime such that Android Profiler only records uniquemethods when the app calls methods for the first time.
2) Socket Supervisor: We implemented the Socket Supervi-sor as a custom module for the Xposed Framework [35], whichprovides an API to modify the behavior of user-space apps,enabling LIBSPECTOR to monitor the creation of sockets. TheSocket Supervisor collects information on a socket consistingof i) which app sent the data, ii) network connection’s socket
pair parameters (i.e., destination and source IPs and ports) and,iii) the stack trace at the time a socket is created.
Upon the establishment of a network connection, the SocketSupervisor gathers the active stack trace by invoking Java’sbuilt-in getStackTrace method. This method returns alist of active stack frames that are related to the creation ofsocket, and hence the network connection. Then, similar toour previous work BorderPatrol [50], we obtain a mappingof every active stack frame to their respective method signa-tures. Finally, the Socket Supervisor prepends the connectioninformation to the list of method signatures, and sends thisdata to our data collection servers using UDP packets. Forevery unique socket that the app creates, the Xposed moduleincludes a sha256 checksum of the apk file and socket pairparameters along with the translated stack trace.
For the above operations, the Socket Supervisor relies ontwo submodules, the custom Xposed module for socket mon-itoring and and a custom shared library for obtaining con-nection parameters. In the following paragraphs, we describethese two submodules in detail.
a) Xposed Framework and Custom Module: Our customXposed module and framework serves as the socket callinterceptor and context extractor. This module first places posthooks on the socket and connect method calls, and thenparses the dex files that the app’s apk package includes toobtain detailed information on methods including their classhierarchy and parameters. Using post hooks ensure that atthe time of program-flow interception, there is a networkconnection with distinct parameters. We use the parsed dexfile information to provide a translation from method names ina stack trace to their respective method signatures. In addition,this module obtains the socket pair parameters. This ensuresthat we can match the packet we observe in the network packetcapture with its respective socket call stack when we obtain thecontextual information from UDP packets (explained in SharedLibrary section below). Subsequently, the module creates oneUDP packet per socket, which includes the method signaturetranslations of the stack trace we gathered. Using methodsignatures ensures that we can differentiate the overloadedvariants of methods with the same name within one class whenwe examine the stack traces of sockets.
b) Shared Library: LIBSPECTOR gathers socket-relatedstack traces and sends them in separate UDP sockets, whichdoes not include the same connection parameters as the TCPsocket. Consequently, we have to associate the stack traceinformation included in UDP packets with their respectiveTCP socket. To associate a stack trace with its socket pair,we use the socket’s set of connection parameters (i.e., sourceand destination IP’s and ports). Since all socket pairs havea unique set of connection parameters for any given point intime, any packet that includes these parameters in their headerbelongs to the connection of the aforementioned socket pair.To access the connection parameters of a given socket, weuse the getsockname and getpeername system calls. Forthis purpose, we compile a shared library which exposes therequired system calls to the Xposed module via the Java Native
3
Interface.3) Experimental Setup: LIBSPECTOR’s data collection
framework consists of a job dispatcher and multiple workerswhich run different and fresh copies of the same modifiedAndroid 7.1.1 image (i.e., same user profile, advertising anddevice IDs without account logins) in Android emulatorson CentOS 7 servers. Every worker pulls the assigned apkfrom a database server and exercises the app in the Androidemulator using adb monkey [4] User Interface exerciserwith 1,000 events and 500ms throttling between events. Whilethe apps are exercised, we record all the network traffic of theemulator into a packet capture file and collect the set of visitedmethods in the emulator. At the end of each experiment, ourmodified framework writes the set of method signatures whichthe app invoked during experiment into a file and sends thepacket capture of all the network traffic of the emulator to acentral database for later evaluation. Our performance analysisshows that, LIBSPECTOR incurs a 0.5ms (9.75%) worst-casepacket delay per request on the mobile device. Offline analysisand heuristics, excluding external data scraping and databaseactivities, on average takes less than 5 seconds per app.
III. DATA
In this section, we describe the data sources that we usedas inputs to our system, and the methodology for our analysis.
A. App Collection
To collect a representative set of Android apps, we extracteda list of the most downloaded and free Android app packagenames from AndroidRank [5], which is a website that keepstrack of the Google PlayStore [16] app metadata. Then, wecross-referenced these package names with the list of availableapps from the AndroZoo dataset [2], which is a repositoryof Android apps for research purposes. For certain apps, theAndroZoo dataset includes more than one version of the sameapp, collected at different times. Each app in the dataset alsolists the date in which the app was created as specified inthe dex file as well as the date of the latest VirusTotal [44]scan of the apk. For all the package names we collected fromthe AndroidRank, we retrieved the apk from the AndroZoodataset with the latest dex time stamp. For packages withthe default dex time stamps (i.e., 01-01-1980), we selectedthe apk that was most recently scanned via VirusTotal (VT).At the time of our experiments, there were no apks that hadneither the non-default dex time-stamp nor a VT scan date.We further filtered out apps that only included ARM sharedlibraries, as LIBSPECTOR supports x86 compatible apps.
B. Output Data Set
We exercised every app for 8 minutes using adb monkeyUI exerciser [4] and issued 1,000 random events with 500msdelay while recording all network activity of the emula-tor. During our dynamic analysis, we collect (i) a set ofmethod signatures of the methods that the app executed,(ii) stack traces of socket calls that we obtain via thegetStackTrace Java method, (iii) the respective method
signatures of each stack frame, and (iv) source and desti-nation IPs and port numbers of each sockets. Additionally,we use the dexlib2 [18] library to extract all the methodsignatures contained in a particular apk. Previous work byReyes et al. [33] found that the adb monkey tool matchedor exceeded humans’ app screen coverage 61% of the time.However, we should note that, due to the randomness of themonkey, the results we present constitute a lower bound onthe method coverage, and hence the extensiveness of theseapps’ network activities.
C. Traffic Attribution
In this section, we present the methodology that allows usto determine how much data the app libraries consume.
Java classes are organized in packages according to ahierarchical naming pattern where dots separate the levels ofhierarchy. The structure of the package hierarchy representsthe relationship between classes and methods. Similar toPlumicke [32], we define the type signature of a methodas a unique identifier which includes all the levels of thishierarchy, including the method signature with input andreturn value types. Furthermore, a disassembled dex file (i.e.,smali code) clearly shows this structure in type signatures1.However, the hierarchical structure of the packages can bearbitrarily deep (i.e, length of the package names can bearbitrarily long). Since we can filter method and class namesfrom a type signature, we use our custom Xposed moduleto obtain the type signatures of the respective call frame andobtain the package name for every active method call in thecall stack.
As we are primarily interested in third-party libraries andtheir respective network connections, we then eliminate themethod calls to Android’s built-in packages. To do so, werefer to Android API 25 Class Index [15] and introduce aregular expression rule to filter out call frames of built-inpackages2. We then use LibRadar [26], a tool that detectsand categorizes third-party libraries in Android apps. Forthe majority of applications, LibRadar is able to detect thelibraries contained in apps. However, as there are first party-authored packages that LibRadar has not encountered beforewith varying degrees of hierarchical depth, it cannot resolve allthe libraries of an app. Consequently, we determine the libraryas the hierarchically greatest matching package structure (i.e.,longest matching prefix) among all the libraries that LibRadarhas detected across 25,000 apps.
Finally, we attribute the socket activity to the library ofthe chronologically first called method from a non built-inlibrary in the stack trace. We then define origin-libraries as thelibraries that such methods belong. While our analysis mainlyfocuses on the origin-libraries and their connections, we alsoprovide analysis for libraries with a reduced-granularity. Forthese libraries, we select only the top two levels of hierarchy,
1Smali convention for a method’s type signature is Lpackage/name/className$innerClassName;->methodName (inputTypes) returnTypes
2android.*, dalvik.*, java.*, javax.*, junit.*, org.apache.http.*, org.json.*,org.w3c.dom.*, org.xml.sax.*, org.xml.pull.v1.*
4
and name them 2-level libraries. The reduced granularityprovides us with the information on the activities of domains(and companies) that libraries belong.
Listing 1 shows a stack trace collected during our experi-ments and demonstrates the logic behind origin-libraries attri-bution. The first frame (line 1) represents the chronologicallylast method invocation before the creation of the socket. Theframes on lines 13 and 14 include internal API calls, whichwe eliminate with regular expression rules. Consequently, weattribute the socket creation to the method call in line 12,which precedes all other method invocations. As per ourlibrary name extraction methodology, we determine the origin-library as "com.unity3d.ads.android.cache". Con-sequently, the two-level library is com.unity3d.
1 java.net.Socket.connect2 com.android.okhttp.internal.Platform.connectSocket3 com.android.okhttp.Connection.connectSocket4 com.android.okhttp.Connection.connect5 com.android.okhttp.Connection.connectAndSetOwner6 com.android.okhttp.OkHttpClient$1.connectAndSetOwner7 com.android.okhttp.internal.http.HttpEngine.connect8 com.android.okhttp.internal.http.HttpEngine.sendRequest9 com.android.okhttp.internal.huc.HttpURLConnectionImpl.execute
10 com.android.okhttp.internal.huc.HttpURLConnectionImpl.connect11 com.unity3d.ads.android.cache.b.a12 com.unity3d.ads.android.cache.b.doInBackground13 android.os.AsyncTask$2.call14 java.util.concurrent.FutureTask.run
Listing 1: Stack Trace Example
D. Library Categories
To extract the categories of origin-libraries, we again relyon the output of LibRadar. We first run LibRadar on allthe apps that we collected (§ III-A). We then construct anaggregated list of libraries with their respective categories thatLibRadar provides. Additionally, we use Li et al.’s work [23] toidentify common advertisement/tracker (AnT) libraries, whichincreases precision and ensures a more comprehensive analysisregarding the AnT traffic.
For libraries where LibRadar cannot determine the corre-sponding category, we apply a majority voting heuristic. List-ing 2 is an example of our library categorization methodologyfor com.unity3d.example, where LibRadar cannot provide acategory. Here, we first find the longest matching organiza-tional structure (i.e., common prefix) across all the librariesthat LibRadar detects in our app dataset. (i.e., com.unity3d)Then, we collect all the libraries which start with the commonprefix and their categories into a list (i.e., lines markedwith [LibRadar] in Listing 2). Afterwards, we use majorityvoting within this list to predict the category of the unknownlibrary, and hence determine the category of com.unity.exampleas Game Engine, which has the most votes. Similarly, thecategory of the origin-library of the stack trace in Listing 1solely depends on com.unity3d.ads, as it is the longest prefixand the only matching library.
[LibRadar] com.unity3d -> Game Engine[LibRadar] com.unity3d.ads -> Advertisement[LibRadar] com.unity3d.plugin.downloader -> App Market[LibRadar] com.unity3d.services -> Game Engine
[Predicted] com.unity3d.example -> {Game Engine:2,Advertisement:1, App Market:1} -> Game Engine
[Predicted] com.unity3d.ads.android.cache ->{Advertisement:1} -> Advertisement
Listing 2: LibRadar category results of unity3d and categoryprediction for two related libraries
E. Traffic Volume
LIBSPECTOR sends a UDP packet which contains informa-tion on a socket right after the connection is established, andthus lacks the information on how much data is transmittedover a particular socket during an experiment. Consequently,we calculate the data transfer size after the connection isclosed, which is the sum of all TCP packets within the samestream (i.e., the packets which possess the same connection pa-rameters as the socket itself). First, we associate TCP packetsthat the socket sent by traversing packet capture file of the apprun using socket parameters. Then, we sum packet sizes to findthe data transfer size. Since the established network connec-tions need to have a unique set of connection parameters at agiven time, we ensure that stack traces of two different socketswith the same connection endpoint are counted separately.Finally, we associate the transfer size with origin-librariesbased on the stack trace information we collected from therespective socket of the connection (§ III-C). We should notethat the ratio of UDP traffic (excluding LIBSPECTOR’s UDPpackets) is 0.52% of the total traffic present in the dataset, themajority (97%) of which consists of DNS requests. Therefore,we chose to omit UDP traffic from our analysis.
F. Determining DNS Domain Categories
As part of our analysis, we analyze which domains were partof the DNS resolution requests at the time of our experiments.To this purpose, we collected domain categories provided byVirusTotal [44] using their public API. For every domain,VirusTotal returns a list of domain categories aggregatedfrom five different cybersecurity companies. As there areno universal baselines for domain category naming, it ispossible to see multiple different classifications for the samedomain. Hence, similar to the methodology of AVClass [36],we chose to simplify and tokenize various domain categoriesinto 17 generic-categories. For every domain category thatVirusTotal provides, we search for a list of hand-curated words(with regular expression rules) and classify it under a genericcategory. Table I shows the generic categories, number ofdomains that fall under each generic-category and the regularexpression patterns used for the tokenization of categories.
To find the category of a domain, we first tokenize all thecategories that VirusTotal returns. Then, we apply majorityvoting among the list of generic-categories for each domainand select the most occurring generic-category.
IV. RESULTS AND ANALYSIS
In this section, we present the analysis of the extracted dataand answer the following research questions:
5
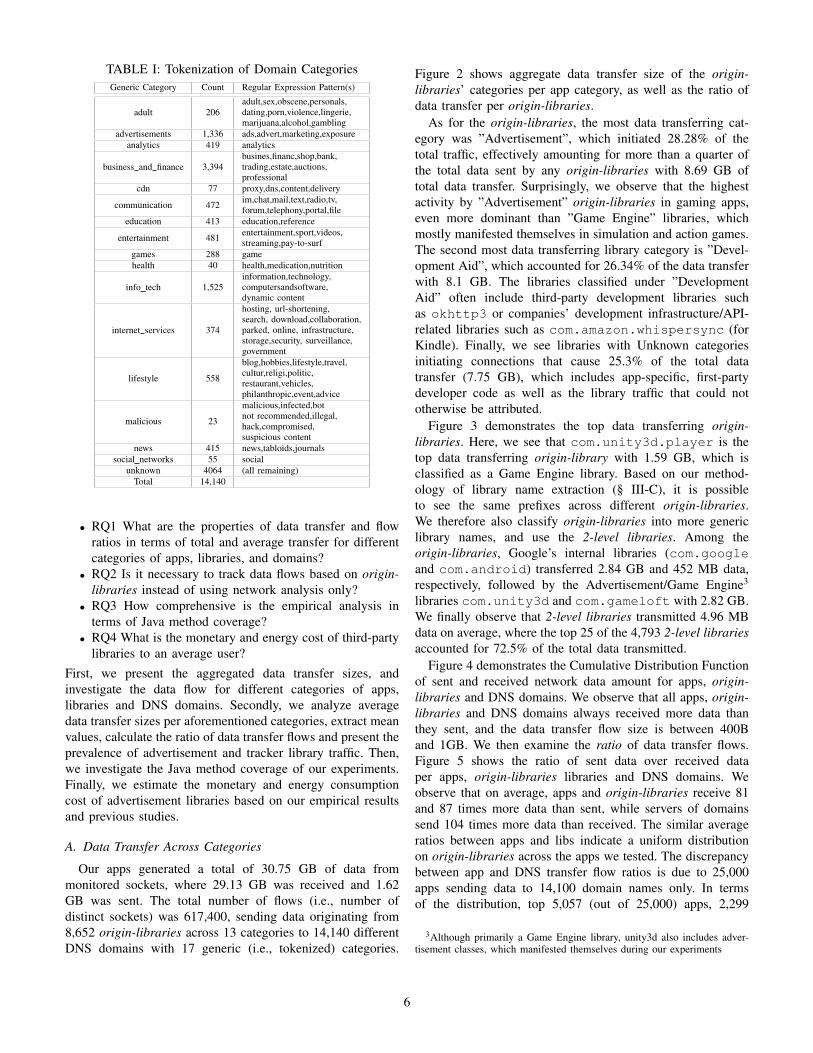
TABLE I: Tokenization of Domain CategoriesGeneric Category Count Regular Expression Pattern(s)
adult 206adult,sex,obscene,personals,dating,porn,violence,lingerie,marijuana,alcohol,gambling
advertisements 1,336 ads,advert,marketing,exposureanalytics 419 analytics
business and finance 3,394busines,financ,shop,bank,trading,estate,auctions,professional
cdn 77 proxy,dns,content,delivery
communication 472 im,chat,mail,text,radio,tv,forum,telephony,portal,file
education 413 education,reference
entertainment 481 entertainment,sport,videos,streaming,pay-to-surf
games 288 gamehealth 40 health,medication,nutrition
info tech 1,525information,technology,computersandsoftware,dynamic content
internet services 374
hosting, url-shortening,search, download,collaboration,parked, online, infrastructure,storage,security, surveillance,government
lifestyle 558
blog,hobbies,lifestyle,travel,cultur,religi,politic,restaurant,vehicles,philanthropic,event,advice
malicious 23
malicious,infected,botnot recommended,illegal,hack,compromised,suspicious content
news 415 news,tabloids,journalssocial networks 55 social
unknown 4064 (all remaining)Total 14,140
• RQ1 What are the properties of data transfer and flowratios in terms of total and average transfer for differentcategories of apps, libraries, and domains?
• RQ2 Is it necessary to track data flows based on origin-libraries instead of using network analysis only?
• RQ3 How comprehensive is the empirical analysis interms of Java method coverage?
• RQ4 What is the monetary and energy cost of third-partylibraries to an average user?
First, we present the aggregated data transfer sizes, andinvestigate the data flow for different categories of apps,libraries and DNS domains. Secondly, we analyze averagedata transfer sizes per aforementioned categories, extract meanvalues, calculate the ratio of data transfer flows and present theprevalence of advertisement and tracker library traffic. Then,we investigate the Java method coverage of our experiments.Finally, we estimate the monetary and energy consumptioncost of advertisement libraries based on our empirical resultsand previous studies.
A. Data Transfer Across Categories
Our apps generated a total of 30.75 GB of data frommonitored sockets, where 29.13 GB was received and 1.62GB was sent. The total number of flows (i.e., number ofdistinct sockets) was 617,400, sending data originating from8,652 origin-libraries across 13 categories to 14,140 differentDNS domains with 17 generic (i.e., tokenized) categories.
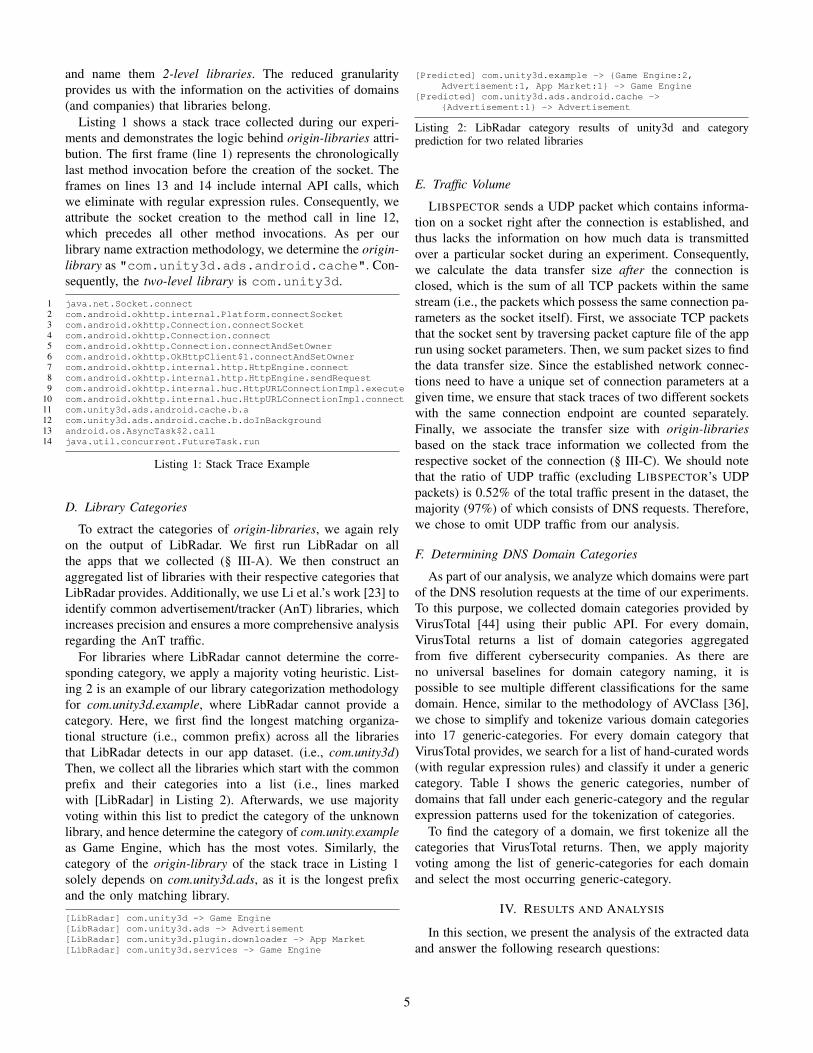
Figure 2 shows aggregate data transfer size of the origin-libraries’ categories per app category, as well as the ratio ofdata transfer per origin-libraries.
As for the origin-libraries, the most data transferring cat-egory was ”Advertisement”, which initiated 28.28% of thetotal traffic, effectively amounting for more than a quarter ofthe total data sent by any origin-libraries with 8.69 GB oftotal data transfer. Surprisingly, we observe that the highestactivity by ”Advertisement” origin-libraries in gaming apps,even more dominant than ”Game Engine” libraries, whichmostly manifested themselves in simulation and action games.The second most data transferring library category is ”Devel-opment Aid”, which accounted for 26.34% of the data transferwith 8.1 GB. The libraries classified under ”DevelopmentAid” often include third-party development libraries suchas okhttp3 or companies’ development infrastructure/API-related libraries such as com.amazon.whispersync (forKindle). Finally, we see libraries with Unknown categoriesinitiating connections that cause 25.3% of the total datatransfer (7.75 GB), which includes app-specific, first-partydeveloper code as well as the library traffic that could nototherwise be attributed.
Figure 3 demonstrates the top data transferring origin-libraries. Here, we see that com.unity3d.player is thetop data transferring origin-library with 1.59 GB, which isclassified as a Game Engine library. Based on our method-ology of library name extraction (§ III-C), it is possibleto see the same prefixes across different origin-libraries.We therefore also classify origin-libraries into more genericlibrary names, and use the 2-level libraries. Among theorigin-libraries, Google’s internal libraries (com.googleand com.android) transferred 2.84 GB and 452 MB data,respectively, followed by the Advertisement/Game Engine3
libraries com.unity3d and com.gameloft with 2.82 GB.We finally observe that 2-level libraries transmitted 4.96 MBdata on average, where the top 25 of the 4,793 2-level librariesaccounted for 72.5% of the total data transmitted.
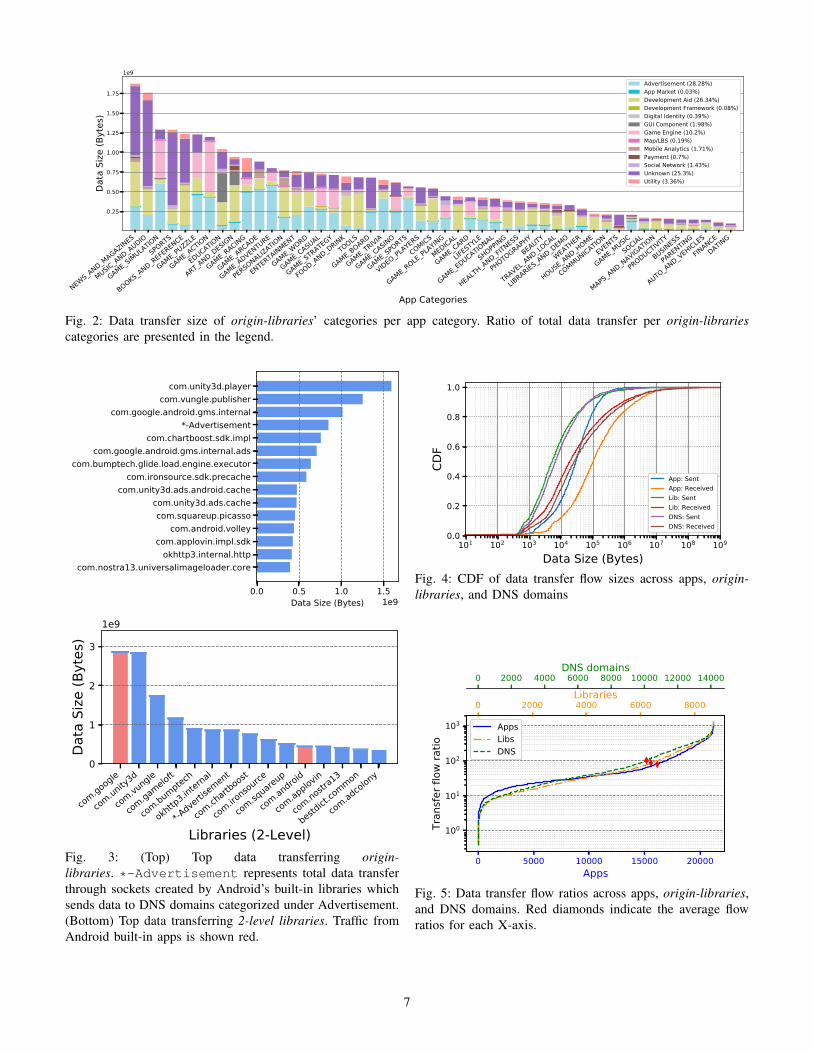
Figure 4 demonstrates the Cumulative Distribution Functionof sent and received network data amount for apps, origin-libraries and DNS domains. We observe that all apps, origin-libraries and DNS domains always received more data thanthey sent, and the data transfer flow size is between 400Band 1GB. We then examine the ratio of data transfer flows.Figure 5 shows the ratio of sent data over received dataper apps, origin-libraries libraries and DNS domains. Weobserve that on average, apps and origin-libraries receive 81and 87 times more data than sent, while servers of domainssend 104 times more data than received. The similar averageratios between apps and libs indicate a uniform distributionon origin-libraries across the apps we tested. The discrepancybetween app and DNS transfer flow ratios is due to 25,000apps sending data to 14,100 domain names only. In termsof the distribution, top 5,057 (out of 25,000) apps, 2,299
3Although primarily a Game Engine library, unity3d also includes adver-tisement classes, which manifested themselves during our experiments
6
NEWS_AN
D_MAGAZINE
S
MUSIC_AN
D_AUDIO
GAME_SIMULAT
IONSPO
RTS
BOOKS_A
ND_RE
FERENCE
GAME_PU
ZZLE
GAME_AC
TION
EDUCATION
ART_A
ND_DE
SIGN
GAME_RA
CING
GAME_AR
CADE
GAME_AD
VENTURE
PERSONALIZATION
ENTER
TAINMENT
GAME_WORD
GAME_CA
SUAL
GAME_ST
RATEG
Y
FOOD_AN
D_DRIN
KTOOLS
GAME_BO
ARD
GAME_TR
IVIA
GAME_CA
SINO
GAME_SP
ORTS
VIDEO_PL
AYERS
COMIC
S
GAME_RO
LE_PLA
YING
MEDIC
AL
GAME_CA
RD
LIFEST
YLE
GAME_ED
UCATIONAL
SHOPPING
HEALT
H_AND_FITNESS
PHOTOGRAPHY
BEAUTY
TRAVEL
_AND_L
OCAL
LIBRARIES_A
ND_DE
MO
WEATH
ER
HOUSE_A
ND_HO
ME
COMM
UNICA
TIONEVE
NTS
GAME_MUSICSOCIA
L
MAPS_
AND_N
AVIGA
TION
PRODUCTIVITY
BUSIN
ESS
PARENTING
AUTO_AN
D_VEHICLES
FINANCEDATING
App Categories
0.25
0.50
0.75
1.00
1.25
1.50
1.75Da
ta Size
(Bytes
)
1e9Advertisement (28.28%)App Market (0.03%)Development Aid (26.34%)Development Framework (0.08%)Digital Identity (0.39%)GUI Component (1.98%)Game Engine (10.2%)Map/LBS (0.19%)Mobile Analytics (1.71%)Payment (0.7%)Social Network (1.43%)Unknown (25.3%)Utility (3.36%)
Fig. 2: Data transfer size of origin-libraries’ categories per app category. Ratio of total data transfer per origin-librariescategories are presented in the legend.
0.0 0.5 1.0 1.5Data Size (Bytes) 1e9
com.unity3d.playercom.vungle.publisher
com.google.android.gms.internal*-Advertisement
com.chartboost.sdk.implcom.google.android.gms.internal.ads
com.bumptech.glide.load.engine.executorcom.ironsource.sdk.precache
com.unity3d.ads.android.cachecom.unity3d.ads.cachecom.squareup.picasso
com.android.volleycom.applovin.impl.sdk
okhttp3.internal.httpcom.nostra13.universalimageloader.core
com.go
ogle
com.un
ity3d
com.vu
ngle
com.ga
meloft
com.bu
mptech
okhttp
3.inter
nal
*-Adve
rtisem
ent
com.ch
artboo
st
com.iro
nsourc
e
com.sq
uareup
com.an
droid
com.ap
plovin
com.no
stra13
bestdic
t.common
com.ad
colony
Libraries (2-Level)
0
1
2
3
Data Size
(Bytes
)
1e9
Fig. 3: (Top) Top data transferring origin-libraries. *-Advertisement represents total data transferthrough sockets created by Android’s built-in libraries whichsends data to DNS domains categorized under Advertisement.(Bottom) Top data transferring 2-level libraries. Traffic fromAndroid built-in apps is shown red.
101 102 103 104 105 106 107 108 109
Data Size (Bytes)0.0
0.2
0.4
0.6
0.8
1.0
CDF
App: SentApp: ReceivedLib: SentLib: ReceivedDNS: SentDNS: Received
Fig. 4: CDF of data transfer flow sizes across apps, origin-libraries, and DNS domains
0 5000 10000 15000 20000Apps
100
101
102
103
Tran
sfer flow
ratio
AppsLibsDNS
0 2000 4000 6000 8000Libraries
0 2000 4000 6000 8000 10000 12000 14000DNS domains
Fig. 5: Data transfer flow ratios across apps, origin-libraries,and DNS domains. Red diamonds indicate the average flowratios for each X-axis.
7
0 2500 5000 7500 10000 12500 15000 17500 20000Apps
10−3
10−2
10−1
100
101
102Tran
sfer ra
tio (%
) AnTCL
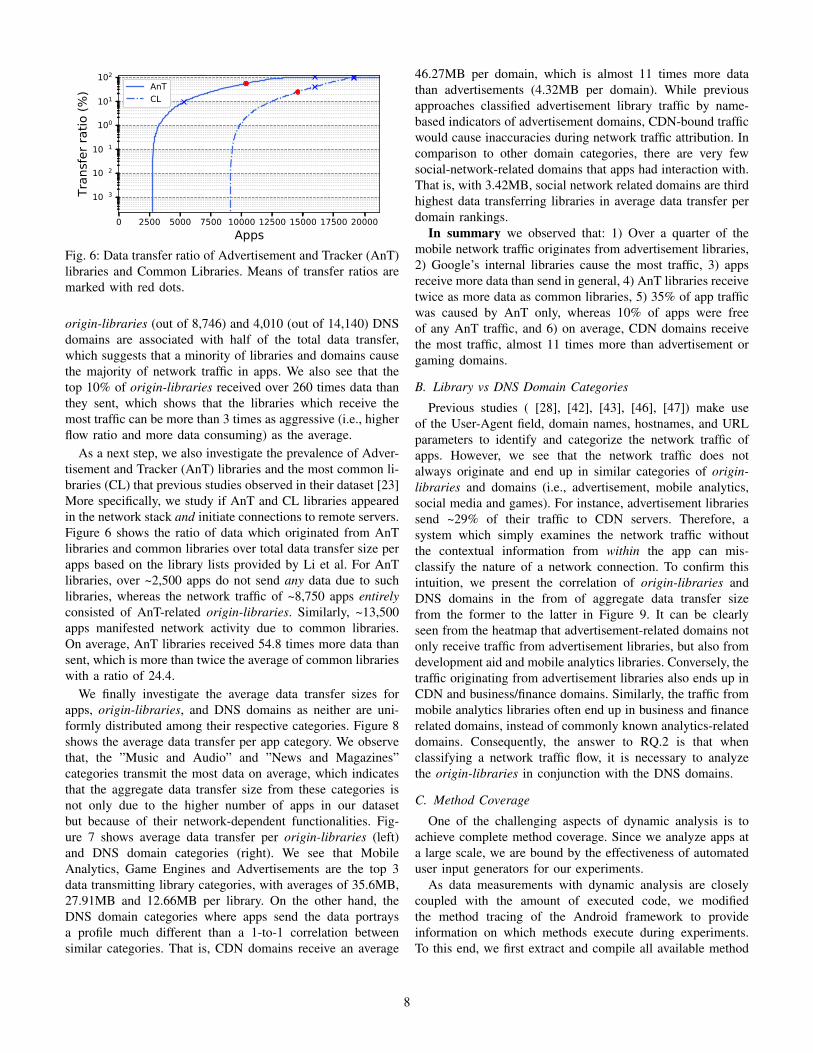
Fig. 6: Data transfer ratio of Advertisement and Tracker (AnT)libraries and Common Libraries. Means of transfer ratios aremarked with red dots.
origin-libraries (out of 8,746) and 4,010 (out of 14,140) DNSdomains are associated with half of the total data transfer,which suggests that a minority of libraries and domains causethe majority of network traffic in apps. We also see that thetop 10% of origin-libraries received over 260 times data thanthey sent, which shows that the libraries which receive themost traffic can be more than 3 times as aggressive (i.e., higherflow ratio and more data consuming) as the average.
As a next step, we also investigate the prevalence of Adver-tisement and Tracker (AnT) libraries and the most common li-braries (CL) that previous studies observed in their dataset [23]More specifically, we study if AnT and CL libraries appearedin the network stack and initiate connections to remote servers.Figure 6 shows the ratio of data which originated from AnTlibraries and common libraries over total data transfer size perapps based on the library lists provided by Li et al. For AnTlibraries, over ~2,500 apps do not send any data due to suchlibraries, whereas the network traffic of ~8,750 apps entirelyconsisted of AnT-related origin-libraries. Similarly, ~13,500apps manifested network activity due to common libraries.On average, AnT libraries received 54.8 times more data thansent, which is more than twice the average of common librarieswith a ratio of 24.4.
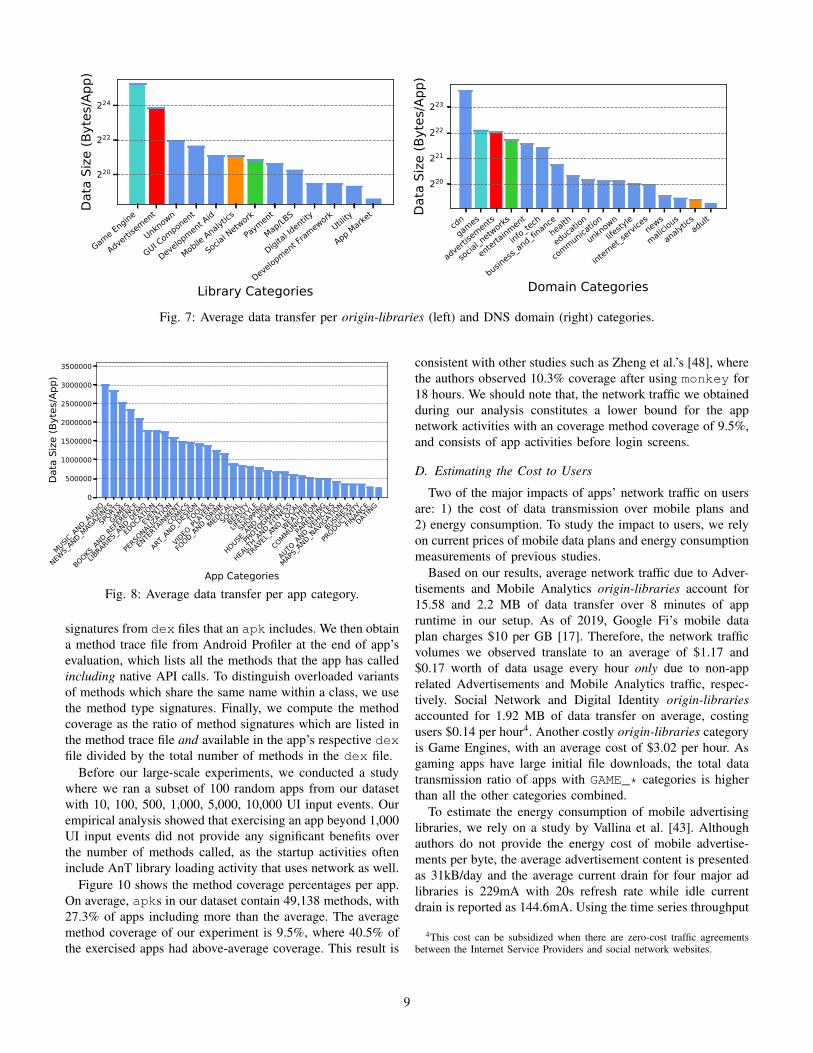
We finally investigate the average data transfer sizes forapps, origin-libraries, and DNS domains as neither are uni-formly distributed among their respective categories. Figure 8shows the average data transfer per app category. We observethat, the ”Music and Audio” and ”News and Magazines”categories transmit the most data on average, which indicatesthat the aggregate data transfer size from these categories isnot only due to the higher number of apps in our datasetbut because of their network-dependent functionalities. Fig-ure 7 shows average data transfer per origin-libraries (left)and DNS domain categories (right). We see that MobileAnalytics, Game Engines and Advertisements are the top 3data transmitting library categories, with averages of 35.6MB,27.91MB and 12.66MB per library. On the other hand, theDNS domain categories where apps send the data portraysa profile much different than a 1-to-1 correlation betweensimilar categories. That is, CDN domains receive an average
46.27MB per domain, which is almost 11 times more datathan advertisements (4.32MB per domain). While previousapproaches classified advertisement library traffic by name-based indicators of advertisement domains, CDN-bound trafficwould cause inaccuracies during network traffic attribution. Incomparison to other domain categories, there are very fewsocial-network-related domains that apps had interaction with.That is, with 3.42MB, social network related domains are thirdhighest data transferring libraries in average data transfer perdomain rankings.
In summary we observed that: 1) Over a quarter of themobile network traffic originates from advertisement libraries,2) Google’s internal libraries cause the most traffic, 3) appsreceive more data than send in general, 4) AnT libraries receivetwice as more data as common libraries, 5) 35% of app trafficwas caused by AnT only, whereas 10% of apps were freeof any AnT traffic, and 6) on average, CDN domains receivethe most traffic, almost 11 times more than advertisement orgaming domains.
B. Library vs DNS Domain Categories
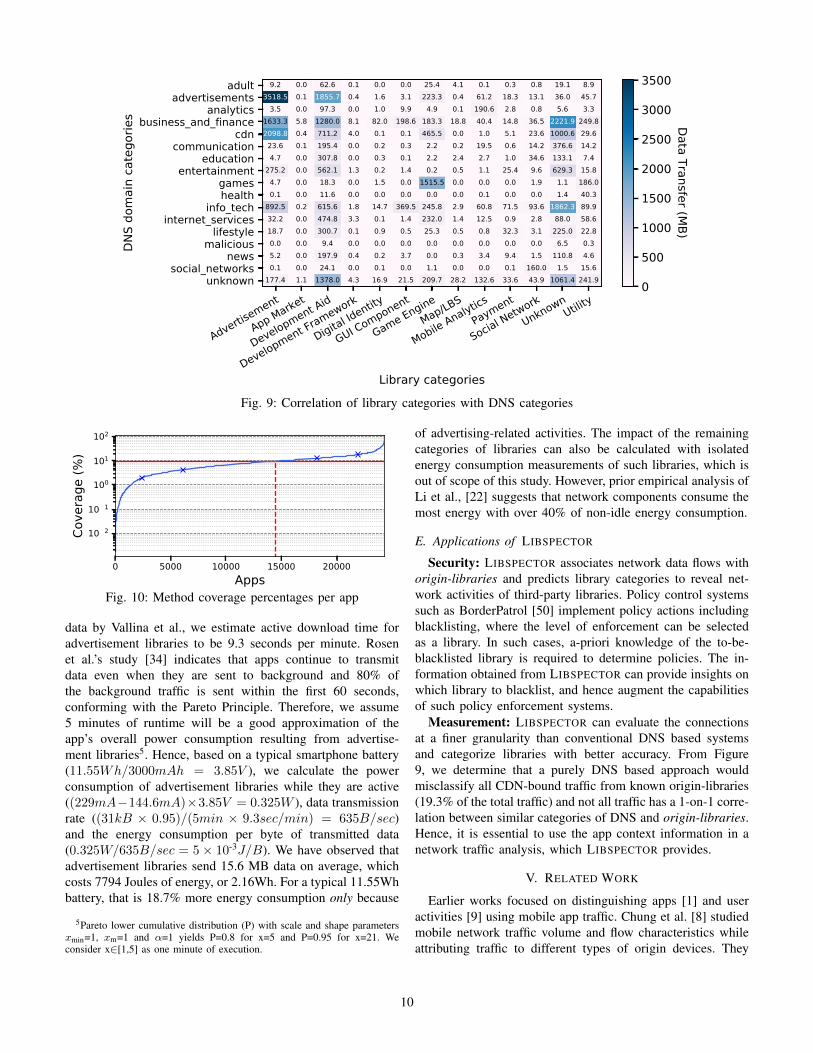
Previous studies ( [28], [42], [43], [46], [47]) make useof the User-Agent field, domain names, hostnames, and URLparameters to identify and categorize the network traffic ofapps. However, we see that the network traffic does notalways originate and end up in similar categories of origin-libraries and domains (i.e., advertisement, mobile analytics,social media and games). For instance, advertisement librariessend ~29% of their traffic to CDN servers. Therefore, asystem which simply examines the network traffic withoutthe contextual information from within the app can mis-classify the nature of a network connection. To confirm thisintuition, we present the correlation of origin-libraries andDNS domains in the from of aggregate data transfer sizefrom the former to the latter in Figure 9. It can be clearlyseen from the heatmap that advertisement-related domains notonly receive traffic from advertisement libraries, but also fromdevelopment aid and mobile analytics libraries. Conversely, thetraffic originating from advertisement libraries also ends up inCDN and business/finance domains. Similarly, the traffic frommobile analytics libraries often end up in business and financerelated domains, instead of commonly known analytics-relateddomains. Consequently, the answer to RQ.2 is that whenclassifying a network traffic flow, it is necessary to analyzethe origin-libraries in conjunction with the DNS domains.
C. Method Coverage
One of the challenging aspects of dynamic analysis is toachieve complete method coverage. Since we analyze apps ata large scale, we are bound by the effectiveness of automateduser input generators for our experiments.
As data measurements with dynamic analysis are closelycoupled with the amount of executed code, we modifiedthe method tracing of the Android framework to provideinformation on which methods execute during experiments.To this end, we first extract and compile all available method
8
Game Engine
Adver
tisement
Unkno
wn
GUI Co
mpone
nt
Developm
ent Aid
Mobile
Analytics
Social Netwo
rk
Payment
Map/LBS
Digital Ide
ntity
Developm
ent Fra
meworkUtility
App M
arket
Library Categories
220
222
224Da
ta Size
(Bytes
/App
)
cdngam
es
advertisements
social_
networks
entertainment
info_tech
business_and
_financ
ehea
lth
education
communicatio
n
unknow
nlifestyle
interne
t_servicesnew
s
malicious
analyticsadu
lt
Domain Categories
220
221
222
223
Data Size
(Bytes
/App
)
Fig. 7: Average data transfer per origin-libraries (left) and DNS domain (right) categories.
MUSIC
_AND_AU
DIO
NEWS
_AND_MA
GAZIN
ES
SPOR
TSGA
MES
BOOK
S_AND
_REFERENC
E
LIBRARIE
S_AND
_DEM
O
EDUC
ATION
EVENTS
PERSON
ALIZA
TION
ENTERTAIN
MENT
COMIC
S
ART_A
ND_DESIGNTOOLS
VIDEO
_PLAYERS
FOOD
_AND_DR
INK
MEDIC
AL
SOCIA
L
BEAU
TY
LIFESTYLE
SHOPPIN
G
HOUSE_A
ND_HOM
E
PHOTOG
RAPHY
HEALTH_AN
D_FIT
NESS
TRAVEL_
AND_LOCAL
WEATHER
COMM
UNICA
TION
PARENTING
AUTO_AN
D_VEHIC
LES
MAPS_AN
D_NA
VIGATION
BUSIN
ESS
PROD
UCTIV
ITY
FINAN
CE
DATIN
G
App Categories
0
500000
1000000
1500000
2000000
2500000
3000000
3500000
Data Size
(Bytes
/App
)
Fig. 8: Average data transfer per app category.
signatures from dex files that an apk includes. We then obtaina method trace file from Android Profiler at the end of app’sevaluation, which lists all the methods that the app has calledincluding native API calls. To distinguish overloaded variantsof methods which share the same name within a class, we usethe method type signatures. Finally, we compute the methodcoverage as the ratio of method signatures which are listed inthe method trace file and available in the app’s respective dexfile divided by the total number of methods in the dex file.
Before our large-scale experiments, we conducted a studywhere we ran a subset of 100 random apps from our datasetwith 10, 100, 500, 1,000, 5,000, 10,000 UI input events. Ourempirical analysis showed that exercising an app beyond 1,000UI input events did not provide any significant benefits overthe number of methods called, as the startup activities ofteninclude AnT library loading activity that uses network as well.
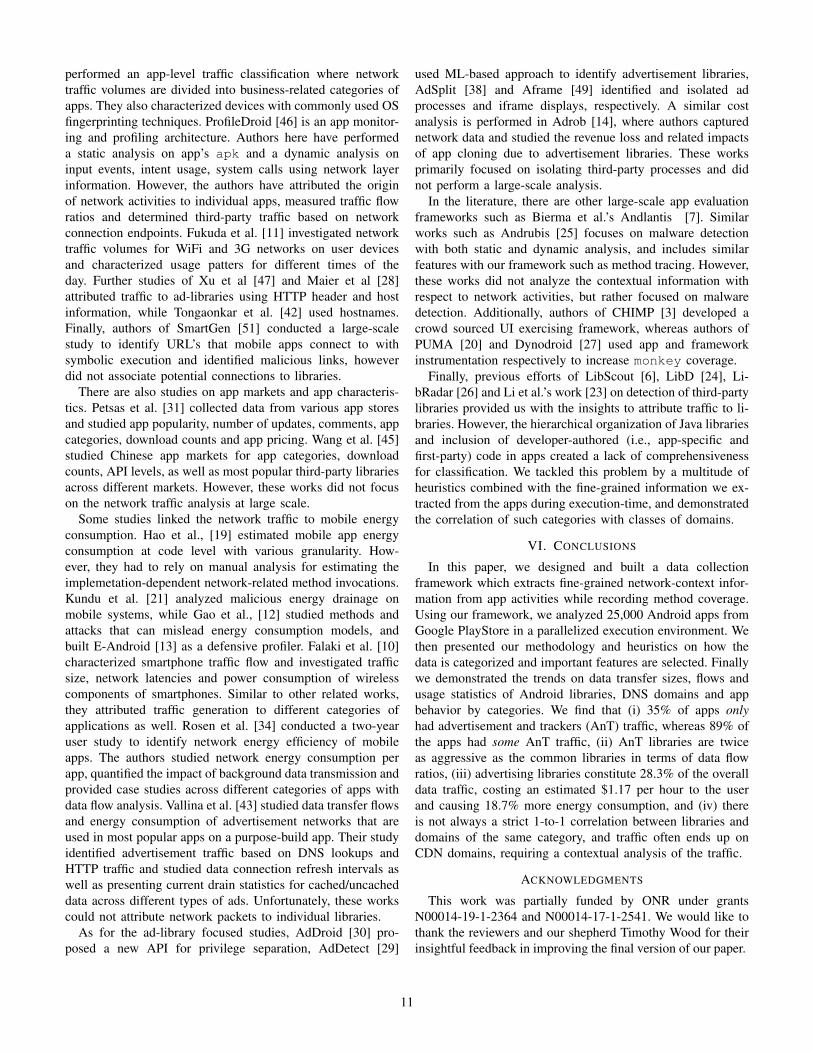
Figure 10 shows the method coverage percentages per app.On average, apks in our dataset contain 49,138 methods, with27.3% of apps including more than the average. The averagemethod coverage of our experiment is 9.5%, where 40.5% ofthe exercised apps had above-average coverage. This result is
consistent with other studies such as Zheng et al.’s [48], wherethe authors observed 10.3% coverage after using monkey for18 hours. We should note that, the network traffic we obtainedduring our analysis constitutes a lower bound for the appnetwork activities with an coverage method coverage of 9.5%,and consists of app activities before login screens.
D. Estimating the Cost to Users
Two of the major impacts of apps’ network traffic on usersare: 1) the cost of data transmission over mobile plans and2) energy consumption. To study the impact to users, we relyon current prices of mobile data plans and energy consumptionmeasurements of previous studies.
Based on our results, average network traffic due to Adver-tisements and Mobile Analytics origin-libraries account for15.58 and 2.2 MB of data transfer over 8 minutes of appruntime in our setup. As of 2019, Google Fi’s mobile dataplan charges $10 per GB [17]. Therefore, the network trafficvolumes we observed translate to an average of $1.17 and$0.17 worth of data usage every hour only due to non-apprelated Advertisements and Mobile Analytics traffic, respec-tively. Social Network and Digital Identity origin-librariesaccounted for 1.92 MB of data transfer on average, costingusers $0.14 per hour4. Another costly origin-libraries categoryis Game Engines, with an average cost of $3.02 per hour. Asgaming apps have large initial file downloads, the total datatransmission ratio of apps with GAME_* categories is higherthan all the other categories combined.
To estimate the energy consumption of mobile advertisinglibraries, we rely on a study by Vallina et al. [43]. Althoughauthors do not provide the energy cost of mobile advertise-ments per byte, the average advertisement content is presentedas 31kB/day and the average current drain for four major adlibraries is 229mA with 20s refresh rate while idle currentdrain is reported as 144.6mA. Using the time series throughput
4This cost can be subsidized when there are zero-cost traffic agreementsbetween the Internet Service Providers and social network websites.
9
Adverti
sement
App Ma
rket
Develop
ment Aid
Develop
ment Fr
amewor
k
Digital I
dentity
GUI Com
ponent
Game En
gineMap
/LBS
Mobile A
nalyticsPay
ment
Social N
etworkUnk
nownUtili
ty
Library categories
adultadvertisements
analyticsbusiness_and_finance
cdncommunication
educationentertainment
gameshealth
info_techinternet_services
lifestylemalicious
newssocial_networks
unknown
DNS domain categorie
s
9.2 0.0 62.6 0.1 0.0 0.0 25.4 4.1 0.1 0.3 0.8 19.1 8.93518.5 0.1 1855.7 0.4 1.6 3.1 223.3 0.4 61.2 18.3 13.1 36.0 45.73.5 0.0 97.3 0.0 1.0 9.9 4.9 0.1 190.6 2.8 0.8 5.6 3.3
1633.3 5.8 1280.0 8.1 82.0 198.6 183.3 18.8 40.4 14.8 36.5 2221.9 249.82098.8 0.4 711.2 4.0 0.1 0.1 465.5 0.0 1.0 5.1 23.6 1000.6 29.623.6 0.1 195.4 0.0 0.2 0.3 2.2 0.2 19.5 0.6 14.2 376.6 14.24.7 0.0 307.8 0.0 0.3 0.1 2.2 2.4 2.7 1.0 34.6 133.1 7.4
275.2 0.0 562.1 1.3 0.2 1.4 0.2 0.5 1.1 25.4 9.6 629.3 15.84.7 0.0 18.3 0.0 1.5 0.0 1515.5 0.0 0.0 0.0 1.9 1.1 186.00.1 0.0 11.6 0.0 0.0 0.0 0.0 0.0 0.1 0.0 0.0 1.4 40.3
892.5 0.2 615.6 1.8 14.7 369.5 245.8 2.9 60.8 71.5 93.6 1862.3 89.932.2 0.0 474.8 3.3 0.1 1.4 232.0 1.4 12.5 0.9 2.8 88.0 58.618.7 0.0 300.7 0.1 0.9 0.5 25.3 0.5 0.8 32.3 3.1 225.0 22.80.0 0.0 9.4 0.0 0.0 0.0 0.0 0.0 0.0 0.0 0.0 6.5 0.35.2 0.0 197.9 0.4 0.2 3.7 0.0 0.3 3.4 9.4 1.5 110.8 4.60.1 0.0 24.1 0.0 0.1 0.0 1.1 0.0 0.0 0.1 160.0 1.5 15.6
177.4 1.1 1378.0 4.3 16.9 21.5 209.7 28.2 132.6 33.6 43.9 1061.4 241.9 0
500
1000
1500
2000
2500
3000
3500
Data Transfer (MB)
Fig. 9: Correlation of library categories with DNS categories
0 5000 10000 15000 20000Apps
10−2
10−1
100
101
102
Cove
rage
(%)
Fig. 10: Method coverage percentages per app
data by Vallina et al., we estimate active download time foradvertisement libraries to be 9.3 seconds per minute. Rosenet al.’s study [34] indicates that apps continue to transmitdata even when they are sent to background and 80% ofthe background traffic is sent within the first 60 seconds,conforming with the Pareto Principle. Therefore, we assume5 minutes of runtime will be a good approximation of theapp’s overall power consumption resulting from advertise-ment libraries5. Hence, based on a typical smartphone battery(11.55Wh/3000mAh = 3.85V ), we calculate the powerconsumption of advertisement libraries while they are active((229mA−144.6mA)×3.85V = 0.325W ), data transmissionrate ((31kB × 0.95)/(5min × 9.3sec/min) = 635B/sec)and the energy consumption per byte of transmitted data(0.325W/635B/sec = 5× 10⁻³J/B). We have observed thatadvertisement libraries send 15.6 MB data on average, whichcosts 7794 Joules of energy, or 2.16Wh. For a typical 11.55Whbattery, that is 18.7% more energy consumption only because
5Pareto lower cumulative distribution (P) with scale and shape parametersxmin=1, xm=1 and α=1 yields P=0.8 for x=5 and P=0.95 for x=21. Weconsider x∈[1,5] as one minute of execution.
of advertising-related activities. The impact of the remainingcategories of libraries can also be calculated with isolatedenergy consumption measurements of such libraries, which isout of scope of this study. However, prior empirical analysis ofLi et al., [22] suggests that network components consume themost energy with over 40% of non-idle energy consumption.
E. Applications of LIBSPECTOR
Security: LIBSPECTOR associates network data flows withorigin-libraries and predicts library categories to reveal net-work activities of third-party libraries. Policy control systemssuch as BorderPatrol [50] implement policy actions includingblacklisting, where the level of enforcement can be selectedas a library. In such cases, a-priori knowledge of the to-be-blacklisted library is required to determine policies. The in-formation obtained from LIBSPECTOR can provide insights onwhich library to blacklist, and hence augment the capabilitiesof such policy enforcement systems.
Measurement: LIBSPECTOR can evaluate the connectionsat a finer granularity than conventional DNS based systemsand categorize libraries with better accuracy. From Figure9, we determine that a purely DNS based approach wouldmisclassify all CDN-bound traffic from known origin-libraries(19.3% of the total traffic) and not all traffic has a 1-on-1 corre-lation between similar categories of DNS and origin-libraries.Hence, it is essential to use the app context information in anetwork traffic analysis, which LIBSPECTOR provides.
V. RELATED WORK
Earlier works focused on distinguishing apps [1] and useractivities [9] using mobile app traffic. Chung et al. [8] studiedmobile network traffic volume and flow characteristics whileattributing traffic to different types of origin devices. They
10
performed an app-level traffic classification where networktraffic volumes are divided into business-related categories ofapps. They also characterized devices with commonly used OSfingerprinting techniques. ProfileDroid [46] is an app monitor-ing and profiling architecture. Authors here have performeda static analysis on app’s apk and a dynamic analysis oninput events, intent usage, system calls using network layerinformation. However, the authors have attributed the originof network activities to individual apps, measured traffic flowratios and determined third-party traffic based on networkconnection endpoints. Fukuda et al. [11] investigated networktraffic volumes for WiFi and 3G networks on user devicesand characterized usage patters for different times of theday. Further studies of Xu et al [47] and Maier et al [28]attributed traffic to ad-libraries using HTTP header and hostinformation, while Tongaonkar et al. [42] used hostnames.Finally, authors of SmartGen [51] conducted a large-scalestudy to identify URL’s that mobile apps connect to withsymbolic execution and identified malicious links, howeverdid not associate potential connections to libraries.
There are also studies on app markets and app characteris-tics. Petsas et al. [31] collected data from various app storesand studied app popularity, number of updates, comments, appcategories, download counts and app pricing. Wang et al. [45]studied Chinese app markets for app categories, downloadcounts, API levels, as well as most popular third-party librariesacross different markets. However, these works did not focuson the network traffic analysis at large scale.
Some studies linked the network traffic to mobile energyconsumption. Hao et al., [19] estimated mobile app energyconsumption at code level with various granularity. How-ever, they had to rely on manual analysis for estimating theimplemetation-dependent network-related method invocations.Kundu et al. [21] analyzed malicious energy drainage onmobile systems, while Gao et al., [12] studied methods andattacks that can mislead energy consumption models, andbuilt E-Android [13] as a defensive profiler. Falaki et al. [10]characterized smartphone traffic flow and investigated trafficsize, network latencies and power consumption of wirelesscomponents of smartphones. Similar to other related works,they attributed traffic generation to different categories ofapplications as well. Rosen et al. [34] conducted a two-yearuser study to identify network energy efficiency of mobileapps. The authors studied network energy consumption perapp, quantified the impact of background data transmission andprovided case studies across different categories of apps withdata flow analysis. Vallina et al. [43] studied data transfer flowsand energy consumption of advertisement networks that areused in most popular apps on a purpose-build app. Their studyidentified advertisement traffic based on DNS lookups andHTTP traffic and studied data connection refresh intervals aswell as presenting current drain statistics for cached/uncacheddata across different types of ads. Unfortunately, these workscould not attribute network packets to individual libraries.
As for the ad-library focused studies, AdDroid [30] pro-posed a new API for privilege separation, AdDetect [29]
used ML-based approach to identify advertisement libraries,AdSplit [38] and Aframe [49] identified and isolated adprocesses and iframe displays, respectively. A similar costanalysis is performed in Adrob [14], where authors capturednetwork data and studied the revenue loss and related impactsof app cloning due to advertisement libraries. These worksprimarily focused on isolating third-party processes and didnot perform a large-scale analysis.
In the literature, there are other large-scale app evaluationframeworks such as Bierma et al.’s Andlantis [7]. Similarworks such as Andrubis [25] focuses on malware detectionwith both static and dynamic analysis, and includes similarfeatures with our framework such as method tracing. However,these works did not analyze the contextual information withrespect to network activities, but rather focused on malwaredetection. Additionally, authors of CHIMP [3] developed acrowd sourced UI exercising framework, whereas authors ofPUMA [20] and Dynodroid [27] used app and frameworkinstrumentation respectively to increase monkey coverage.
Finally, previous efforts of LibScout [6], LibD [24], Li-bRadar [26] and Li et al.’s work [23] on detection of third-partylibraries provided us with the insights to attribute traffic to li-braries. However, the hierarchical organization of Java librariesand inclusion of developer-authored (i.e., app-specific andfirst-party) code in apps created a lack of comprehensivenessfor classification. We tackled this problem by a multitude ofheuristics combined with the fine-grained information we ex-tracted from the apps during execution-time, and demonstratedthe correlation of such categories with classes of domains.
VI. CONCLUSIONS
In this paper, we designed and built a data collectionframework which extracts fine-grained network-context infor-mation from app activities while recording method coverage.Using our framework, we analyzed 25,000 Android apps fromGoogle PlayStore in a parallelized execution environment. Wethen presented our methodology and heuristics on how thedata is categorized and important features are selected. Finallywe demonstrated the trends on data transfer sizes, flows andusage statistics of Android libraries, DNS domains and appbehavior by categories. We find that (i) 35% of apps onlyhad advertisement and trackers (AnT) traffic, whereas 89% ofthe apps had some AnT traffic, (ii) AnT libraries are twiceas aggressive as the common libraries in terms of data flowratios, (iii) advertising libraries constitute 28.3% of the overalldata traffic, costing an estimated $1.17 per hour to the userand causing 18.7% more energy consumption, and (iv) thereis not always a strict 1-to-1 correlation between libraries anddomains of the same category, and traffic often ends up onCDN domains, requiring a contextual analysis of the traffic.
ACKNOWLEDGMENTS
This work was partially funded by ONR under grantsN00014-19-1-2364 and N00014-17-1-2541. We would like tothank the reviewers and our shepherd Timothy Wood for theirinsightful feedback in improving the final version of our paper.
11
REFERENCES
[1] H. F. Alan and J. Kaur. Can Android applications be identified usingonly TCP/IP headers of their launch time traffic? In Proceedings ofthe 9th ACM conference on security & privacy in wireless and mobilenetworks, pages 61–66, 2016.
[2] K. Allix, T. F. Bissyande, J. Klein, and Y. Le Traon. Androzoo:Collecting millions of Android apps for the research community. InWorking Conference on Mining Software Repositories (MSR), pages468–471. IEEE/ACM, 2016.
[3] M. Almeida, M. Bilal, A. Finamore, I. Leontiadis, Y. Grunenberger,M. Varvello, and J. Blackburn. Chimp: Crowdsourcing human inputsfor mobile phones. In Proceedings of the World Wide Web Conferenceon World Wide Web, pages 45–54, 2018.
[4] Android. ADB Monkey UI Exerciser. https://developer.android.com/studio/test/monkey.html, 2019.
[5] AndroidRank. Most downloaded free Android applications. https://www.androidrank.org/app/ranking/all?sort=4&price=free, 2019.
[6] M. Backes, S. Bugiel, and E. Derr. Reliable third-party library detectionin Android and its security applications. In Proceedings of the Confer-ence on Computer and Communications Security, pages 356–367. ACMSIGSAC, 2016.
[7] M. Bierma, E. Gustafson, J. Erickson, D. Fritz, and Y. R. Choe.Andlantis: Large-scale Android dynamic analysis. arXiv preprintarXiv:1410.7751, 2014.
[8] J. Y. Chung, Y. Choi, B. Park, and J. W.-K. Hong. Measurementanalysis of mobile traffic in enterprise networks. In Asia-Pacific NetworkOperations and Management Symposium, pages 1–4. IEEE, 2011.
[9] M. Conti, L. V. Mancini, R. Spolaor, and N. V. Verde. AnalyzingAndroid encrypted network traffic to identify user actions. IEEETransactions on Information Forensics and Security, 11(1):114–125,2015.
[10] H. Falaki, D. Lymberopoulos, R. Mahajan, S. Kandula, and D. Estrin.A first look at traffic on smartphones. In Proceedings of the InternetMeasurement Conference, pages 281–287. ACM, 2010.
[11] K. Fukuda and K. Nagami. A measurement of mobile traffic offloading.In International Conference on Passive and Active Network Measure-ment, pages 73–82. Springer, 2013.
[12] X. Gao, D. Liu, D. Liu, and H. Wang. On energy security ofsmartphones. In Proceedings of the ACM Conference on Data andApplication Security and Privacy, pages 148–150, 2016.
[13] X. Gao, D. Liu, D. Liu, H. Wang, and A. Stavrou. E-android: A newenergy profiling tool for smartphones. In 2017 IEEE 37th InternationalConference on Distributed Computing Systems (ICDCS), pages 492–502.IEEE, 2017.
[14] C. Gibler, R. Stevens, J. Crussell, H. Chen, H. Zang, and H. Choi.Adrob: Examining the landscape and impact of Android applicationplagiarism. In Proceedings of the annual international conference onMobile systems, applications, and services, pages 431–444. ACM, 2013.
[15] Google. Android API 25 Class Index. https://developer.android.com/reference/classes.
[16] Google. Google Play Store. https://play.google.com/store.[17] Google. Fi data plan. https://fi.google.com/about/plan/, 2019.[18] B. Gruver. dexlib2 library. https://github.com/JesusFreke/smali/tree/
master/dexlib2, 2017.[19] S. Hao, D. Li, W. G. Halfond, and R. Govindan. Estimating mobile
application energy consumption using program analysis. In IEEEProceedings of the International Conference on Software Engineering,pages 92–101, 2013.
[20] S. Hao, B. Liu, S. Nath, W. G. Halfond, and R. Govindan. Puma:programmable UI-automation for large-scale dynamic analysis of mobileapps. In Proceedings of the annual international conference on Mobilesystems, applications, and services, pages 204–217. ACM, 2014.
[21] A. Kundu, Z. Lin, and J. Hammor. Energy attacks on mobile devices.https://arxiv.org/pdf/1704.04464.pdf, 2017.
[22] D. Li, S. Hao, J. Gui, and W. G. Halfond. An empirical study of theenergy consumption of Android applications. In IEEE InternationalConference on Software Maintenance and Evolution, pages 121–130,2014.
[23] L. Li, T. F. Bissyande, J. Klein, and Y. Le Traon. An investigation intothe use of common libraries in Android apps. In International Con-ference on Software Analysis, Evolution, and Reengineering (SANER),volume 1, pages 403–414. IEEE, 2016.
[24] M. Li, W. Wang, P. Wang, S. Wang, D. Wu, J. Liu, R. Xue, andW. Huo. Libd: scalable and precise third-party library detection inAndroid markets. In International Conference on Software Engineering(ICSE), pages 335–346. IEEE/ACM, 2017.
[25] M. Lindorfer, M. Neugschwandtner, L. Weichselbaum, Y. Fratantonio,V. Van Der Veen, and C. Platzer. Andrubis–1,000,000 apps later: A viewon current Android malware behaviors. In Third International Workshopon Building Analysis Datasets and Gathering Experience Returns forSecurity (BADGERS), pages 3–17. IEEE, 2014.
[26] Z. Ma, H. Wang, Y. Guo, and X. Chen. Libradar: fast and accuratedetection of third-party libraries in Android apps. In Proceedings ofthe international conference on software engineering companion, pages653–656. ACM, 2016.
[27] A. Machiry, R. Tahiliani, and M. Naik. Dynodroid: An input generationsystem for Android apps. In Proceedings of the Joint Meeting onFoundations of Software Engineering, pages 224–234. ACM, 2013.
[28] G. Maier, F. Schneider, and A. Feldmann. A first look at mobile hand-held device traffic. In International Conference on Passive and ActiveNetwork Measurement, pages 161–170. Springer, 2010.
[29] A. Narayanan, L. Chen, and C. K. Chan. Addetect: Automated detectionof Android ad libraries using semantic analysis. In InternationalConference on Intelligent Sensors, Sensor Networks and InformationProcessing (ISSNIP), pages 1–6. IEEE, 2014.
[30] P. Pearce, A. P. Felt, G. Nunez, and D. Wagner. Addroid: Privilegeseparation for applications and advertisers in Android. In Proceedingsof the Symposium on Information, Computer and CommunicationsSecurity, pages 71–72. ACM, 2012.
[31] T. Petsas, A. Papadogiannakis, M. Polychronakis, E. P. Markatos, andT. Karagiannis. Rise of the planet of the apps: A systematic study ofthe mobile app ecosystem. In Proceedings of the Internet MeasurementConference, pages 277–290. ACM, 2013.
[32] M. Plumicke. Java type unification with wildcards. In Applications ofDeclarative Programming and Knowledge Management, pages 223–240.Springer, 2007.
[33] I. Reyes, P. Wijesekera, J. Reardon, A. E. B. On, A. Razaghpanah,N. Vallina-Rodriguez, and S. Egelman. ”won’t somebody think of thechildren?” examining COPPA compliance at scale. Proceedings onPrivacy Enhancing Technologies, (3):63–83, 2018.
[34] S. Rosen, A. Nikravesh, Y. Guo, Z. M. Mao, F. Qian, and S. Sen.Revisiting network energy efficiency of mobile apps: Performance inthe wild. In Proceedings of the Internet Measurement Conference, pages339–345. ACM, 2015.
[35] rovo89. Xposed Framework API. http://api.xposed.info/reference/packages.html, 2019.
[36] M. Sebastian, R. Rivera, P. Kotzias, and J. Caballero. Avclass: A toolfor massive malware labeling. In International Symposium on Researchin Attacks, Intrusions, and Defenses, pages 230–253. Springer, 2016.
[37] SensoTower. Global app revenue for q1-2019. https://sensortower.com/blog/app-revenue-and-downloads-q1-2019, 2019.
[38] S. Shekhar, M. Dietz, and D. S. Wallach. Adsplit: Separating smartphoneadvertising from applications. In {USENIX} Security Symposium({USENIX} Security), pages 553–567, 2012.
[39] Statista. Combined global app down-loads. https://www.statista.com/statistics/604343/number-of-apple-app-store-and-google-play-app-downloads-worldwide/,2019.
[40] Statista. Number of available apps in appleapp store. https://www.statista.com/statistics/779768/number-of-available-apps-in-the-apple-app-store-quarter/, 2019.
[41] Statista. Number of available apps in google-play store. https://www.statista.com/statistics/289418/number-of-available-apps-in-the-google-play-store-quarter/, 2019.
[42] A. Tongaonkar, S. Dai, A. Nucci, and D. Song. Understanding mo-bile app usage patterns using in-app advertisements. In InternationalConference on Passive and Active Network Measurement, pages 63–72.Springer, 2013.
[43] N. Vallina-Rodriguez, J. Shah, A. Finamore, Y. Grunenberger, K. Papa-giannaki, H. Haddadi, and J. Crowcroft. Breaking for commercials:characterizing mobile advertising. In Proceedings of the InternetMeasurement Conference, pages 343–356. ACM, 2012.
[44] VirusTotal. Malware Scanner. https://www.virustotal.com, 2019.[45] H. Wang, Z. Liu, J. Liang, N. Vallina-Rodriguez, Y. Guo, L. Li,
J. Tapiador, J. Cao, and G. Xu. Beyond Google play: A large-scale
12
comparative study of Chinese Android app markets. In Proceedings ofthe Internet Measurement Conference, pages 293–307. ACM, 2018.
[46] X. Wei, L. Gomez, I. Neamtiu, and M. Faloutsos. Profiledroid: multi-layer profiling of Android applications. In Proceedings of the annualinternational conference on Mobile computing and networking, pages137–148. ACM, 2012.
[47] Q. Xu, J. Erman, A. Gerber, Z. Mao, J. Pang, and S. Venkataraman.Identifying diverse usage behaviors of smartphone apps. In Proceedingsof the conference on Internet measurement conference, pages 329–344.ACM, 2011.
[48] X. Zeng, D. Li, W. Zheng, F. Xia, Y. Deng, W. Lam, W. Yang, and T. Xie.Automated test input generation for Android: Are we really there yet inan industrial case? In Proceedings of the International Symposium onFoundations of Software Engineering, pages 987–992. ACM, 2016.
[49] X. Zhang, A. Ahlawat, and W. Du. Aframe: Isolating advertisementsfrom mobile applications in Android. In Proceedings of the AnnualComputer Security Applications Conference, pages 9–18. ACM, 2013.
[50] O. Zungur, G. Suarez-Tangil, G. Stringhini, and M. Egele. BorderPatrol:Securing BYOD using fine-grained contextual information. In Interna-tional Conference on Dependable Systems and Networks (DSN), pages460–472. IEEE/IFIP, 2019.
[51] C. Zuo and Z. Lin. Smartgen: Exposing server urls of mobile apps withselective symbolic execution. In Proceedings of the International Con-ference on World Wide Web, WWW ’17, pages 867–876. InternationalWorld Wide Web Conferences Steering Committee, 2017.
13
Related Documents