Economy and Environment Program for Southeast Asia 22 Cross Street #02-55 South Bridge Court Singapore 048421 Tel: (65) 6438 7877 Fax: (65) 6438 4844 E-mail: [email protected] Website: www.eepsea.org Nghia Dai Tran Department of Natural Resources and Environmental Management, University of Hawaii Manoa 1910 East-West Road, Rm 101 Sherman Lab Honolulu, HI 96822, USA Tel: 1 808 956 7518; Fax: 1 808 956 6539 Email: [email protected] No. 2008-RR8 Transition To Organic Tea Production in Thai Nguyen Province, Vietnam: Economic and Environmental Impacts This study from Vietnam shows that a switch from conventional to organic tea productions would bring real environmental, health and economic benefits for the country’s farmers and its society as a whole. In particular, the amount of agrochemical residue and waste produced by tea production would be reduced. Farmers would also be able to enjoy a better livelihood as they could command a premium price for their organic tea products. The study therefore recommends that organic tea production is the best method for farmers to adopt. The study, which was carried out by Mr. Nghia Dai Tran, from the University of Hawaii, finds that there are a number of technical and economic challenges that confront farmers making the switch to organic production. It therefore highlights the fact that clean tea production (which has a less strict environmental management regime) can offer an interim approach that still brings higher quality standards and profitability for tea growers. There are a number of ways in which the government can promote clean tea and organic tea production. Support from governmental agencies and NGOs in the form of technical training and on-farm monitoring is vital. The government can also create a market mechanism to guarantee a premium price for organic tea products. R E S E A R C H R E P O R T

Welcome message from author
This document is posted to help you gain knowledge. Please leave a comment to let me know what you think about it! Share it to your friends and learn new things together.
Transcript
Economy and Environment Program for Southeast Asia 22 Cross Street #02-55 South Bridge Court Singapore 048421 Tel: (65) 6438 7877 Fax: (65) 6438 4844 E-mail: [email protected] Website: www.eepsea.org
Nghia Dai Tran
Department of Natural Resources and Environmental Management, University of Hawaii
Manoa 1910 East-West Road, Rm 101 Sherman Lab Honolulu, HI 96822, USA Tel: 1 808 956 7518; Fax: 1 808 956 6539 Email: [email protected]
No. 2008-RR8
Transition To Organic Tea Production in Thai Nguyen Province, Vietnam: Economic and Environmental Impacts
This study from Vietnam shows that a switch from conventional to organic tea productions would bring real environmental, health and economic benefits for the country’s farmers and its society as a whole. In particular, the amount of agrochemical residue and waste produced by tea production would be reduced. Farmers would also be able to enjoy a better livelihood as they could command a premium price for their organic tea products. The study therefore recommends that organic tea production is the best method for farmers to adopt. The study, which was carried out by Mr. Nghia Dai Tran, from the University of Hawaii, finds that there are a number of technical and economic challenges that confront farmers making the switch to organic production. It therefore highlights the fact that clean tea production (which has a less strict environmental management regime) can offer an interim approach that still brings higher quality standards and profitability for tea growers. There are a number of ways in which the government can promote clean tea and organic tea production. Support from governmental agencies and NGOs in the form of technical training and on-farm monitoring is vital. The government can also create a market mechanism to guarantee a premium price for organic tea products.
R E S E A R C H R E P O R T
Published by the Economy and Environment Program for Southeast Asia (EEPSEA) 22 Cross Street #02-55, South Bridge Court, Singapore 048421 (www.eepsea.org) Tel: +65-6438 7877, fax: +65-6438 4844, email: [email protected] EEPSEA Research Reports are the outputs of research projects supported by the Economy and Environment Program for Southeast Asia. All have been peer reviewed and edited. In some cases, longer versions may be obtained from the author(s). The key findings of most EEPSEA Research Reports are condensed into EEPSEA Policy Briefs, available upon request. The Economy and Environment Program for Southeast Asia also publishes EEPSEA Special Papers, commissioned works with an emphasis on research methodology. Library and Archives Canada Cataloguing in Publication Tran, Nghia Dai Transition to Organic Tea production in Thai Nguyen Province, Vietnam: Economic and Environmental Impacts/ Nghia Dai Tran (Research report, ISSN 1608-5434; 2008-RR8) Co-published by the International Development Research Centre. Includes bibliographical references. Includes index. ISBN 978-1-55250-087-3 1. Tea Trade--Vietnam. 2. Tea --Organic Farming--Economic aspects--Vietnam. 3. Tea--Organic Farming--Environmental aspects--Vietnam. I. International Development Research Centre (Canada) II. Economy and Environment Program for Southeast Asia III. Title. IV. Series: Research report (Economy and Environment Program for Southeast Asia); 2008-RR8. HD9198 V53 T42 2009 338.1’737209597 C2009-980118-3 The views expressed in this publication are those of the author(s) and do not necessarily represent those of the Economy and Environment Program for Southeast Asia or its sponsors. Unless otherwise stated, copyright for material in this report is held by the author(s). Mention of a proprietary name does not constitute endorsement of the product and is given only for information. This publication may be consulted online at www.eepsea.org.
Transition to Organic Tea Production in Thai Nguyen Province, Vietnam: Economic and
Environmental Impacts
Nghia Dai Tran
January, 2009
Comments should be sent to: Mr. Nghia Dai Tran, Department of Natural Resources and Environmental Management, University of Hawaii, Manoa 1910 East-West Road, Room 101 Sherman Lab, Honolulu, HI 96822, USA.
Phone: 808-956-7518; Fax: 808-956-6539
Email: [email protected]
EEPSEA was established in May 1993 to support research and training in environmental and resource economics. Its objective is to enhance local capacity to undertake the economic analysis of environmental problems and policies. It uses a networking approach, involving courses, meetings, technical support, and access to literature and opportunities for comparative research. Member countries are Thailand, Malaysia, Indonesia, the Philippines, Vietnam, Cambodia, Lao PDR, China, and Papua New Guinea. EEPSEA is supported by the International Development Research Centre (IDRC); the Swedish International Development Cooperation Agency (Sida); and the Canadian International Development Agency (CIDA). EEPSEA publications are also available online at http://www.eepsea.org.
ACKNOWLEDGEMENTS
I want to express my most sincere appreciation and profound gratitude to the following organizations and individuals for their invaluable support, guidance, assistance, and encouragement shown to me in the course of my completing this doctoral dissertation.
• The Economy and Environment Program for Southeast Asia (EEPSEA) for
awarding me the Doctoral Dissertation Research Grant to do this research. • Dr. Hermi Francisco, for her helpful comments, support and encouragement. • Dr. David Glover and Dr. Ted Horbulyk, my project advisors from EEPSEA, for
their constructive comments and advice. • The Vietnam Education Foundation (VEF) for granting me a scholarship to pursue
my PhD. • Dr. John Yanagida, my main advisor and the Chairperson of my Dissertation
Committee, for his concern, invaluable guidance, and encouragement, but most of all, for his advice and constructive comments on the manuscript.
• Dr. Carl Evensen, Dr. Kent Kobayashi, Dr. Richard Bowen, Dr. Tung Bui Xuan, and members of the Dissertation Committee for sharing their knowledge and for their useful comments, technical suggestions, and moral support in all phases of my study and dissertation work at the University of Hawaii at Manoa.
• My colleagues and students in the survey team; Dr. Ly, Dr. Van, Ms. Chung, Mr. Tho, Mr. Tung, Ms. Hong, and Mr. Thach, for their great support in collecting the data.
• The staff of the Department of Agriculture and Rural Development of Dong Hy District and Thai Nguyen Province, especially the farmers of the surveyed communes and villages, for their cooperation in furnishing the needed information for my survey.
This humble work is warmly dedicated to all of the above individuals and organizations. Without their support and encouragement, the study would not have been accomplished successfully.
TABLE OF CONTENTS
EXECUTIVE SUMMARY
1.0 INTRODUCTION
1.1 Background
1.2 Problem Statement
1.3 Research Objectives
2.0 LITERATURE REVIEW
2.1 Organic Production
2.2 Efficiency Analysis
2.2.1 Methods for analyzing production efficiency
2.2.2. Stochastic frontier analysis
2.3 Adoption Analysis
2.4 Monte Carlo Model for Risk Analysis
2.5 Cost Benefit Analysis
2.6 Analyzing Environmental Impacts
3.0 METHODOLOGY
3.1 Selection of Study Sites
3.2 Sample Size Determination
3.3 Proposed Equations for Estimations
3.3.1 Stochastic frontier equations for efficiency analyses
3.3.2 Equation for adoption analysis
3.3.3 Equation for risk and uncertainty analysis
3.3.4 Equation for cost and benefit analysis
1
1
1
3
3
3
4
4
5
7
9
10
11
12
12
13
14
14
15
16
16
4.0 PRODUCTION EFFICIENCY
4.1 Descriptive Data for Production Efficiency Analysis
4.1.1 Household characteristics
4.1.2 Tea farm characteristics
4.1.3 Tea production characteristics
4.2 Production Efficiency Analysis
4.2.1 Factors affecting production efficiency
4.2.2 Production efficiency of organic tea production
4.2.3 Production efficiency of clean tea production
4.2.4 Production efficiency of conventional tea production
4.2.5 Cross-comparisons of the means of production efficiency
5.0 PROFIT EFFICIENCY ANALYSIS
5.1 Descriptive Data for Profit Efficiency Analysis
5.2 Profit Efficiency Analysis
5.2.1 Profit efficiency of organic tea production
5.2.2 Profit efficiency of clean tea production
5.2.3 Profit efficiency of conventional tea production
5.2.4 Cross-comparisons of the means of profit efficiency
6.0 ADOPTION ANALYSIS
6.1 Descriptive Data of the Independent Variables in the Analytical Model
6.1.1 Descriptive data for the organic tea adoption analysis
6.1.2 Descriptive data for the clean tea adoption analysis
6.2 Empirical Adoption Models
6.2.1 Empirical adoption model for organic tea production
17
17
17
17
20
23
23
24
25
25
26
27
27
30
30
31
31
32
32
32
32
34
36
6.2.2 Empirical adoption model for clean tea production
7.0 RISK ANALYSIS
7.1 Risk Analysis and Probability of Adoption
7.1.1 Changes in the adoption rates when premium pricing is removed
7.1.2 Changes in the adoption rates when outside support is removed
7.2 Possible Interventions to Increase the Adoption Rate of Organic Tea Production
7.2.1 Market incentives
7.2.2 Tax on conventional tea production
7.3 Changes in Expected Profits for Different Tea Production Methods
7.3.1 Changes in expected profits for organic tea production
7.3.2 Changes in expected profits for clean tea production
8.0 ENVIRONMENTAL IMPACTS AND BENEFITS
8.1 Agrochemical Residues in Soil, Water and Tea Products
8.1.1 Agrochemical residues in the soil
8.1.2 Agrochemical residues in the water
8.1.3 Agrochemical residues in tea samples
8.2 CBA Model to Evaluate Environmental Impacts
8.2.1 Private net present value analysis
8.2.2 Social net present value analysis
9.0 CONCLUSIONS AND POLICY IMPLICATIONS
9.1 Conclusions
9.1.1 Efficiency analysis
9.1.2 Adoption analysis
9.1.3 Risk analysis
36
37
38
38
39
40
41
41
42
44
44
45
46
46
47
47
48
49
50
52
55
55
55
56
9.1.4 Agrochemical residues
9.1.5 Cost-benefit analysis
9.1.6 Overall results
9.2 Policy Implications and Recommendations
9.2.1 Support services and programs for organic tea production
9.2.2 A premium price for organic tea
9.2.3 Tax on conventional tea output
9.2.4 Clean tea production as an intermediate alternative
9.3 Recommendations for Further Research
REFERENCES
APPENDICES
Appendix 1. Standards and Requirements for Organic Tea Production in Vietnam
Appendix 2. Agrochemical Residues in the Soil and Water
57
57
58
59
59
60
60
60
61
63
68
68
70
LIST OF TABLES
Table 1.
Table 2.
Table 3.
Table 4.
Table 5.
Table 6.
Table 7.
Table 8.
Table 9.
Table 10.
Table 11.
Table 12.
Table 13.
Table 14.
Table 15.
Table 16.
Table 17.
Table 18.
Table 19.
Table 20.
Table 21.
Table 22.
Actual use of pesticides in tea production in Vietnam
Household characteristics
Tea farm characteristics
Tea production characteristics
Results of Breusch-Pagan/Cook-Weisberg test for the production model
Production efficiency analysis statistics
Cross-comparisons of the means of production efficiency
Results of Breusch-Pagan/Cook-Weisberg test for the profit model
Descriptive statistics of variables in the profit efficiency analysis (2007)
Profit efficiency analysis statistics
Cross-comparisons of the means of profit efficiency
Characteristics of adopters and non-adopters of organic tea production
Characteristics of adopters and non-adopters of clean tea production
Adoption analyses of organic and clean tea production (probit model)
Agrochemical residues in tea-cultivated soil in Tan Cuong Commune
Agrochemical residues in water samples from tea farms in Tan Cuong Commune
Agrochemical residues in tea products from Tan Cuong Commune
Private net present value analysis of tea production (5-year span)
Private net present value analysis of tea production (30-year span)
Social net present value analysis of tea production (5-year span)
Social net present value analysis for tea production (30-year span)
Overall analytical ranking scores
2
19
21
22
23
25
26
28
29
30
32
34
35
37
47
48
49
51
52
53
54
59

LIST OF FIGURES
Fig 1.
Fig 2.
Fig 3.
Fig 4.
Fig 5.
Fig 6.
Fig 7.
Tea production areas in Vietnam
Adoption rates of organic and clean tea production without premium pricing
Adoption rates of organic and clean tea production without outside support
Adoption rates of organic tea production by premium price
Effect of tax on the adoption rate of organic tea production
Profits for organic tea production with and without premium pricing
Profits for clean tea production with and without premium pricing
1
40
41
42
43
45
46
TRANSITION TO ORGANIC TEA PRODUCTION IN THE THAI NGUYEN PROVINCE, VIETNAM: ECONOMIC AND ENVIRONMENTAL IMPACTS
Nghia Dai Tran
EXECUTIVE SUMMARY
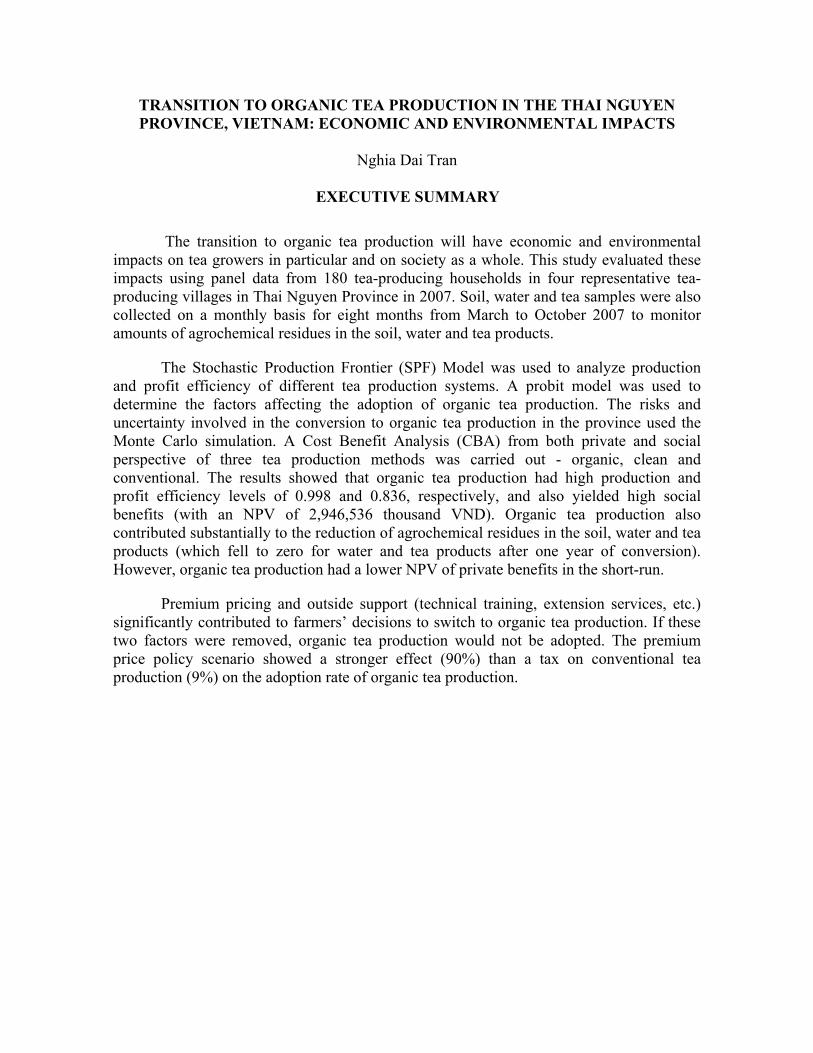
The transition to organic tea production will have economic and environmental
impacts on tea growers in particular and on society as a whole. This study evaluated these impacts using panel data from 180 tea-producing households in four representative tea-producing villages in Thai Nguyen Province in 2007. Soil, water and tea samples were also collected on a monthly basis for eight months from March to October 2007 to monitor amounts of agrochemical residues in the soil, water and tea products.
The Stochastic Production Frontier (SPF) Model was used to analyze production and profit efficiency of different tea production systems. A probit model was used to determine the factors affecting the adoption of organic tea production. The risks and uncertainty involved in the conversion to organic tea production in the province used the Monte Carlo simulation. A Cost Benefit Analysis (CBA) from both private and social perspective of three tea production methods was carried out - organic, clean and conventional. The results showed that organic tea production had high production and profit efficiency levels of 0.998 and 0.836, respectively, and also yielded high social benefits (with an NPV of 2,946,536 thousand VND). Organic tea production also contributed substantially to the reduction of agrochemical residues in the soil, water and tea products (which fell to zero for water and tea products after one year of conversion). However, organic tea production had a lower NPV of private benefits in the short-run.
Premium pricing and outside support (technical training, extension services, etc.) significantly contributed to farmers’ decisions to switch to organic tea production. If these two factors were removed, organic tea production would not be adopted. The premium price policy scenario showed a stronger effect (90%) than a tax on conventional tea production (9%) on the adoption rate of organic tea production.

1.0 INTRODUCTION
1.1 Background
In Vietnam, tea is grown in more than 39 provinces while being highly concentrated in 14 northern mountainous and midland provinces1, which account for 61% of the total production area of the country (see Figure 1). The total planted area reached 122,700 ha in 2006 (Nga 2007). Tea in Vietnam is exported to more than 59 countries (Vinatea 2005). As stated in Vietnam’s National Policy Framework and its ten-year Strategic Plan, organic farming especially organic tea production, is encouraged by the Ministry of Agriculture and Rural Development (MARD).
61% 23%
4%6%2%4%
Highlands and Midlands of theNorthCentral highlands
Red RD
The fourth zone
Mid coastal areas
Other
Figure 1. Tea production areas in Vietnam Source: Phuong and Trung 2004 Notes: (1) Red RD = Red River Delta (2) The fourth zone is commonly known in Vietnam as consisting of three provinces: Ha Tinh, Nghe An and Thanh Hoa.
1.2 Problem Statement
Although Vietnam is ranked as the seventh largest tea exporter in the world, most of Vietnam’s tea products go to traditional markets such as China, Taiwan, and Russia. The potential of exporting more tea from Vietnam is growing due to recent publicity about 1 The mountainous, midland and lowland provinces are classified based on their elevation.
1

the health benefits of green tea in preventing ulcers and stomach cancer. It is essential that the tea produced in Vietnam be competitive in the world market. This can be accomplished by satisfying required health standards.
The export price of Vietnamese tea is approximately USD 1.02 per kilogram or about 50% less than the average export price of tea products of other nations (GSO 2008). Two important factors contributing to the low price of Vietnamese tea are low product quality and lack of its own brand name. Among the principal tea-growing provinces in northern Vietnam, Thai Nguyen Province is among the most well-known for its high quality tea although it is not the largest tea-producing area (Que and Que 2000). It is also one of the participating provinces in the International Global Changing Institute (IGCI) Project (funded by the New Zealand government) to promote organic tea farming.
The survey results in Table 1 show that agrochemical use in conventional tea production is very high and tea growers have little knowledge and understanding about the dangers of pesticides and how to use them safely. There is also clean tea production which minimizes the use of pesticides and other chemical inputs and adopts Integrated Pest Management (IPM) for pest and disease control. However, the strict rules and requirements governing organic tea production totally prohibit the use of any synthetic agrochemicals, therefore, pesticide residues and waste will not pose a problem. Nevertheless, the positive impacts of the conversion to organic tea production on the environment, tea growers, and society in general should be evaluated in terms of the short-run and long-run effects.
Table 1. Actual use of pesticides in tea production in Vietnam
Items Unit Results Surveyed tea growing households Tea-growing households using pesticides
number % of total
540 100
Pesticide users Male Female Knowledge of using pesticides Using special instruments to measure applied doses
% of total % of total % of total
% of total
62.0 38.0 49.7
0.0
Protective measures when applying pesticides to tea plants Sufficient Partial None
% of total % of total % of total
7.0 64.9 28.1
Place for cleaning spraying equipment Special area reserved Lakes, ponds or rivers Wells or other water sources Collecting waste after spraying
% of total % of total % of total % of total
0.0 51.4 49.6 48.0
Source: Ngo et al. 2001
2
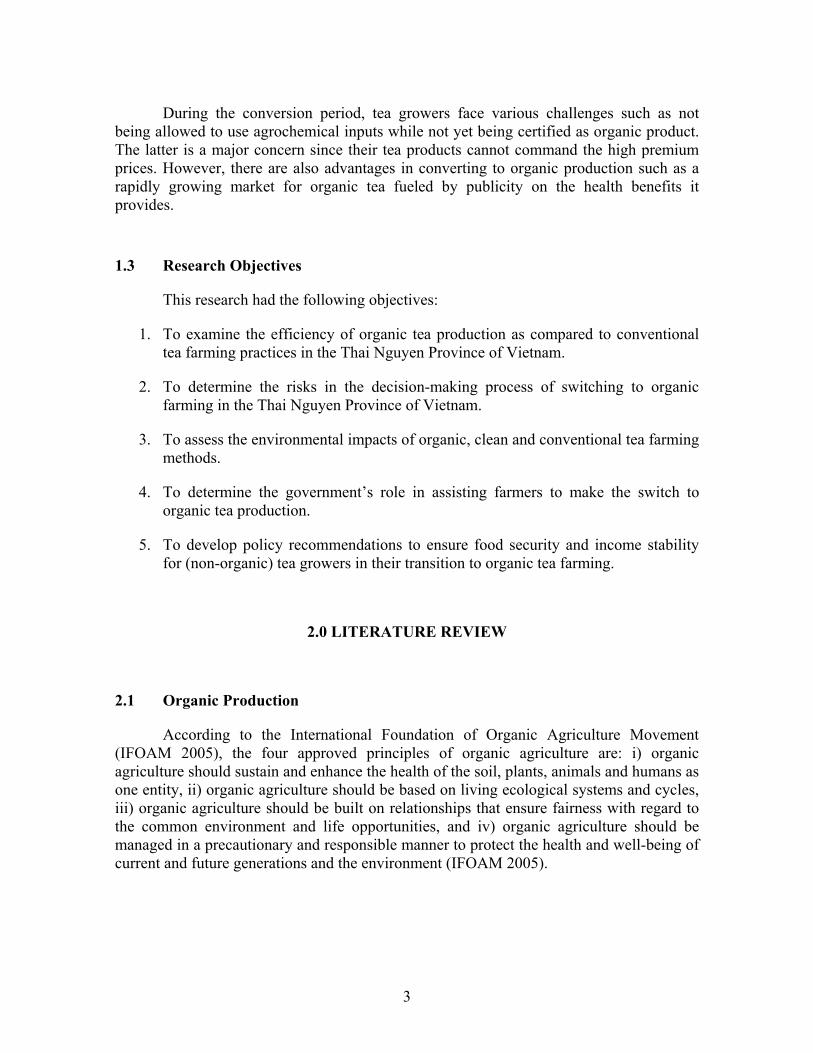
During the conversion period, tea growers face various challenges such as not being allowed to use agrochemical inputs while not yet being certified as organic product. The latter is a major concern since their tea products cannot command the high premium prices. However, there are also advantages in converting to organic production such as a rapidly growing market for organic tea fueled by publicity on the health benefits it provides.
1.3 Research Objectives
This research had the following objectives:
1. To examine the efficiency of organic tea production as compared to conventional tea farming practices in the Thai Nguyen Province of Vietnam.
2. To determine the risks in the decision-making process of switching to organic farming in the Thai Nguyen Province of Vietnam.
3. To assess the environmental impacts of organic, clean and conventional tea farming methods.
4. To determine the government’s role in assisting farmers to make the switch to organic tea production.
5. To develop policy recommendations to ensure food security and income stability for (non-organic) tea growers in their transition to organic tea farming.
2.0 LITERATURE REVIEW
2.1 Organic Production
According to the International Foundation of Organic Agriculture Movement (IFOAM 2005), the four approved principles of organic agriculture are: i) organic agriculture should sustain and enhance the health of the soil, plants, animals and humans as one entity, ii) organic agriculture should be based on living ecological systems and cycles, iii) organic agriculture should be built on relationships that ensure fairness with regard to the common environment and life opportunities, and iv) organic agriculture should be managed in a precautionary and responsible manner to protect the health and well-being of current and future generations and the environment (IFOAM 2005).
3

2.2 Efficiency Analysis
2.2.1 Methods for analyzing production efficiency
Production efficiency of different tea production methods (namely, organic, clean and conventional) is an important element in analyzing tea growers’ decision-making. Efficiency is economically measured by comparing observed and optimum costs against revenues or profits, subject to appropriate constraints on quantities and prices (Fried, Lovell and Schmitz 1993).
Production efficiency has two components. The technical component reflects the ability to produce as much output as input usage allows or to use as little input as output production allows. The allocative component refers to the ability to combine inputs and outputs in optimal proportions at given prices. There are two main analytical frontier approaches that can be used to analyze productive efficiency; the econometric approach and the programming (or mathematical) approach. The econometric approach is stochastic, and it has a number of virtues including internal consistency and ease of implementation. Another advantage is its ability to shift the deleterious effect of measurement error away from estimates of efficiency. However, the disadvantages of the econometric approach are that it is parametric and it compounds the effects of misspecification of the functional form with inefficiency in the error term. This study adopted the Stochastic Frontier Analysis (SFA) Method, a model used in the econometric approach.
2.2.2 Stochastic frontier analysis
In SFA, the assumption is that the production function of the fully efficient firm is known. Fried, Lovell and Schmitz (1993) have shown that econometric approaches like the SFA can distinguish the effects of noise from the effects of inefficiency. Kumbhakar and Lowell (2000) pointed out that SFA produces efficiency estimates or scores for individual producers. Since efficiency scores vary across producers, they can be related to producer characteristics such as size, ownership, and location. SFA thus provides a powerful tool for examining the effects of intervention. Since one of the objectives of this research is to examine the production efficiency (scores) of individual tea growers applying the organic or clean production methods as compared to those using the conventional method, the SFA was selected as the tool to measure technical and allocative efficiency in this study.
The model equation for the SFA is:
yi = f (xi; β)exp(-ui) i = 1, 2,….N (1)
where yi represents the output level for the ith farm;
xi is a vector of inputs for the ith farm;
4
β is a vector of unknown variables;
ui represents non-negative random variables associated with the firm’s specific factors which contribute to the ith farm not attaining maximum efficiency; and
N is the number of farms.
The technical efficiency of a given farm is defined by the factor exponential (-ui) which measures the level of the farm’s production lying beneath the frontier output curve. If TEi represents the technical efficiency of the ith firm, then TEi can be expressed as follows:
TEi = *i
i
yy
= );(
)exp();(β
β
i
ii
xfuxf −
= exp(-ui) (2)
where, y*i = f(xi; β) is the maximum feasible output; yi is the observed output; and
β is a vector of parameters estimated by the maximum likelihood (ML) or corrected ordinary least squares (COLS) methods. Since there are no statistical assumptions for the above equation, inferential results cannot be obtained.
Aigner, Lovell and Schmidt (1977) introduced the stochastic frontier model which incorporates an error term composed of two components: a symmetric component capturing random variations of the frontier across firms and the effects of a measurement error, and a one-sided component capturing the effects of inefficiency relative to the stochastic frontier. The stochastic frontier production function can be expressed as follows:
Yi = xi β + Ei (3)
and Ei = Vi - Ui (4)
where Yi denotes the output of the ith firm (i = 1, 2,… , N);
xi is a (1 x k) vector of inputs associated with the ith firm;
β is a (k x 1) vector of the coefficients of the associated independent variables in the production function;
Ei is a vector of the combined error terms (i.e., Ei = Vi (random error) - Ui (inefficient error) with mean = 0).
Vi is the stochastic effect that is independently, identically distributed with normal distribution (N(0, σ2
v))
Ui represents non-negative, technical inefficient effects that can follow a half normal, a truncated normal, an exponential, or a gamma distribution (Aigner, Lovell and Schmitz 1977; Greene 1990; Meeusen and van den Broeck 1977).
5
The maximum likelihood estimation of Equation (3) yields consistent estimators for β, λ and σ2 where β is a vector of unknown parameters, λ = σu/ σv and σ2 = σ2
u + σ2v.
Jondrow et al. (1982) showed that inference about the technical inefficiency of individual farmers can be made by considering the conditional distribution of Ui given the fitted values of ε and the respective parameters. Based on the assumptions v ~ N(0, σ2
v), u~ | N(0, σ2
u | and E(ev) = 0, they computed the conditional mean of ui given εi = vi as a measure of technical efficiency as follows:
E(ui| vi) = σ* )/(1
)/(*
*
σλεσλε
j
j
Ff−
- σλε j (5)
where f* and F* are standard normal density and cumulative distributions, respectively calculated by εiλ/σ, σ2 = σ2
u + σ2v and λ = σu/ σv. The estimates of σ2, λ and parameter
vector β are obtained by maximum likelihood. Jondrow et al. (1982) also derived a similar formula for the exponential distribution while Greene (1990) derived a formula using a gamma distribution.
Replacing ε, σ and λ by their estimates in Equations 3, 4 and 5, the estimates for v and u are derived. Subtracting v from both sides of Equation 3 yields the stochastic production frontier:
Y* = f (Xi; β)- u = Y – v (6)
where Y* is defined as the farm’s observed output adjusted for the statistical noise contained in v (Bravo-Ureta and Rieger 1991; Bravo-Ureta and Pinheiro 1997). Equation 6 can be used to derive an indirect cost function frontier and from this cost frontier, the minimum cost factor demand equation can be obtained, which then becomes the basis for calculating economically efficient input levels.
Kumbhakar and Lovell (2000) came up with a profit frontier function:
π(p, w) = maxy,x{pTy – wTx) (7)
where p is the output price; w is a vector of input prices; y is a scalar of output (y >0 ); x is a vector of inputs; and π(p, w) is the maximum profit obtainable from given ouput and input prices. A measure of profit efficiency is, therefore, a function: πE(y,x,p,w) = (pTy – wTx)/ π(p, w), provided π(p, w) > 0. This is the ratio of actual profit to maximum profit.
There are two different approaches for the estimation of stochastic profit inefficiency, the primal production frontier approach and the dual variable profit frontier approach. The primal frontier approach begins with the production frontier equation used by Kumbhakar and Lovell (2000):
y = f(x, z; β)exp{-u} (8)
6
where y ≥ 0 is scalar output; x = ( x1, x2, ……. xN ) ≥ 0 is a vector of variable inputs; z = ( z1, z2, ……. zQ ) ≥ 0 is a vector of quasi-fixed inputs; and u ≥ 0 represents output-oriented technical inefficiency.
If producers attempt to maximize variable profit, the first order conditions can be written as:
fn(x, z; β)exp{-u} = (wn/p)exp {ξn}, n = 1……..N (9)
where, fn(x, z; β) = δf (x, z; β)/ δxn and ξn is called the allocative inefficiency representing non-fulfillment of the first order conditions for variable profit maximization.
If the production frontier takes the Cobb-Douglas form, the first order conditions for variable profit maximization (9) can be written as:
Ln y = βo + nn
n xln∑β + qq
q zln∑γ + v –u (10)
Ln xn = βo + lnβn + kk
k xln∑β + qq
q zln∑γ - lnp
wn -u + ξn (11)
where n = 1,….. N; and v is the stochastic noise error component associated with the production frontier.
In deriving the first-order conditions, we start with the deterministic production frontier evaluated at v = 0. In the dual variable profit frontier approach, we also start from the production frontier (8). The dual variable profit frontier is:
vπ = vπ(pe-u, w, z; β) = vπ(p, w, z;β).h(p, w, z;β) (12)
where vπ = py-wTx = vπ{(pe-u)(yeu) – w Tx} and h(p, w, z;β) = vπ(pe-u, w, z;β)/ vπ(p, w, z;β) is the ratio of maximum variable profit with technical inefficiency to maximum variable profit.
2.3 Adoption Analysis
Technology adoption studies usually involve data where the dependent variable is a zero-one variable. The simplest model used to analyze technology adoption is the linear probability model (LPM). However, the application of ordinary least squares to data with a binary dependent variable has some drawbacks: (i) it contains a heterosdasctic error structure and inefficient parameter estimates (Goldberger 1964; Pindyck and Rubinfeld 1976; Wooldridge 2003); (ii) it can produce predicted probabilities that are less than zero or greater than one and it implies a constant marginal effect of each explanatory variable (Wooldridge 2003). Due to the presence of heterosdascticity, classical tests, such as the t-test and F-test, are invalid (Wooldridge 2003). According to Wooldridge (2003), for a
7
binary response model, the interest lies primary in the response probability estimated by the equation below:
P(y = 1| x) = P(y=1|x1, x2, , , xk) (13)
where x denotes the full set of explanatory variables.
To avoid the linear probability model (LPM) limitations, consider a class of binary response models of the form:
P(y = 1| x) = G(β0 + β1x1 + …. + βkxk ) = G(β0 + xβ) (14)
where G is a function taking on values strictly between zero and one: 0 < G(.) < 1, for all real numbers. This ensures that the estimated response probabilities are strictly between zero and one. Various non-linear functions have been suggested to estimate the function G in order to make sure that the probabilities are between zero and one. Logit and probit models are used in the vast majority of applications (Wooldridge 2003).
In the probit model, G is a standard normal cumulative distribution function (cdf) and can be written as follows:
G(z) = Ф(z) = (15) dvvz
)(φ∫∞−
where Ф(z) is the standard normal density.
Ф(z) = (2π)-1/2 exp(-z2/2) (16)
This choice of G ensures that (9) is strictly between zero and one for all values of the parameters and xj.
Logit and probit models can be derived from the underlying latent variable model.
y* = β0 + xβ + ε, y = 1 [y* > 0] and y = 0 otherwise (17)
where ε׀x ~ N(0, 1).
It is assumed that ε is independent of x and that ε has either the standard logistic distribution or standard normal distribution. In either case, ε is symmetrically distributed above zero for all real numbers of z. Economists tend to favor the normality assumption for ε, which is why the probit model is more popular than the logit model in econometrics (Wooldridge 2003). Besley and Case (1993) showed that the gain to farmer i of using the new technology is typically parameterized as γxi + ui, where xi are farm and farmer characteristics and ui is independently and identically distributed. The probit model is usually used to run this model. Garson (2006) also stated that in practical terms, the probit model usually delivers the same conclusions as the logistic regression.
8
2.4 Monte Carlo Model for Risk Analysis
Risk has always been a part of agriculture. The important task of risk analysis is to determine what type of uncertainty is likely to affect the outcome of a decision (Kammen and Hassenzahl 2001). As Romero and Rehmen (1989) pointed out, traditional risk and uncertainty analysis is, by its nature, a multi-objective analysis with two objectives of profits and a measure of their variability.
Tea production depends not only on soil quality, irrigation and production inputs (such as fertilizers and labor), but also on environmental variables, such as the weather, weeds, and pest populations. Since environmental variables are unknown at the time the farmer makes his production decisions, it can be said that he makes those decisions in a state of uncertainty about the outcome. If a tea grower is considering converting his tea farm from conventional to organic, he should consider the risks and uncertainty involved in this decision. In the conversion period, tea farmers will face the risk of reduced tea yields due to a biological imbalance resulting from not using synthetic fertilizers, pesticides, and other agrochemical inputs.
Roumasset (1981) shows that yield uncertainty can be represented by the stochastic production function,
Y = f(θ, T) (18)
where, θ is a random variable between 0 and 1, and T is a vector of inputs for the proposed production technique. If we postulate that fertilizer, F, is the only variable input, and that θ is discrete, the yield in the jth state of production can be expressed as: Yj = f(F).
Ignoring price fluctuations, the stochastic profit can be written as:
πj = PYj – C(F) (19)
where P is the price of outputs and C(F) is the cost of fertilizer (inputs).
The expected profit can be estimated by the following equation:
E(πj) = ∑ j jj Pπ (20)
where Pj is the probability of the jth production state.
High or low incidence of pest and disease problems can be associated with the application of different crop protection methods from organic and conventional tea production. Roumasset (1981) also argued that with limited knowledge, farmers may maximize expected profits only to the level of their (limited) perceptions. Although results from the stochastic frontier analysis may show a preference for organic tea production over conventional tea production, a risk analysis is still necessary to show how uncertainty and variability of expected production and profits will affect the farming households.
9

There are different techniques used to model risk analysis and risk management. The Monte Carlo analysis is among the most commonly used. A Monte Carlo simulation is a useful tool when the problem definition is unclear or the data available is uncertain (Kammen and Hassenzahl 2001). A Monte Carlo analysis simulates multiple scenarios (trials) of the model by using variables from repeated sampling of the probability distribution of the uncertain variables. The risk estimate is expressed as a distribution of values with a probability assigned for each value and the distribution reflects the variability and uncertainty of the studied variable. Since the Monte Carlo analysis is a tool for combining more than two distributions, and thereby propagating more than just summary statistics, it involves conducting and then comparing repeated trials with inputs that reflect the distributions of the system parameters.
According to Helton (2005), the underlying idea of sampling-based approaches to uncertainty and risk analysis is that the analyses result in Y(X) = [y1(X), y2(X)…. yn (X)] which are functions of uncertainty analysis inputs X = [ x1, x2…..xm]. In turn, uncertainty in X results in uncertainty in Y(X). This leads to two questions: (i) what is the uncertainty in Y(X) given the uncertainty in X? and (ii) how important are the individual elements of X with respect to the uncertainty in Y(X)? The goal of uncertainty analysis is to answer the first question and the goal of sensitivity analysis is to answer the second.
2.5 Cost Benefit Analysis
According to Kenneth (1968), the whole idea of a Cost Benefit Analysis (CBA) is of enormous importance in the evaluation of social choices and even of social institutions. Nick and Jason (2005) state that CBA assumes that informed people will make purposeful and consistent decisions to maximize their net gains. Relying on the rationale of CBA theory to guide environmental policy makes sense if citizens make consistent and systematic choices regarding both certain and risky events (Crocker, Shogren and Turner 1998).
Alston et al. (2000) found that in order to compare projects with different time patterns of costs and benefits (such as conventional and organic tea production in this case), costs and benefits must be aggregated over time and capital budgeting techniques, such as Net Present Value (NPV), used. Boardman et al. (2006) state that if environmental externalities lead to market distortions, the net changes in social costs (benefits) that are associated with negative (positive) environmental externalities should be added to the primary social costs (benefits).
In this research, the CBA model is used to compare the NPVs of conventional and organic tea production methods for both private (a representative tea producer) and social (society as a whole) costs (benefits). Whether we are interested in social or private costs (benefits) does not affect the formula, however, it does determine how we measure the stream of costs and benefits. As Coase (1960, p.16) argues, “The private product is the value of the additional product resulting from a particular activity of a business. The social product equals the private product minus the fall in the value of production elsewhere for
10

which no compensation is paid”. Arrow and Lind (1970) show that the social cost of risk-bearing will depend both upon which individual receives the benefits and pays the costs and how large each individual’s share of these benefits and costs is. In calculating the NPVs of benefits and costs from switching from conventional tea production to organic or clean tea production, a distinction must thus be made between private and public benefits and costs.
Charles, Brian and Donald (1992) suggest using the expenditure aversion method for valuing environmental improvement to approximate economic costs. Expenditure aversion includes using the contingent valuation method to measure survey respondents’ willingness to accept (WTA) a lower yield to improve the environment.
2.6 Analyzing Environmental Impacts
The standard for evaluating and certifying organic tea in Vietnam includes 22 different requirements and all of them are related to farming practices (Appendix 1). In this research, soil, water and tea samples were collected on a monthly basis for eight months during the research period from March to October 2007 in order to determine the presence and amounts of pesticide and other agrochemical residues in the soil, water and tea products. The selected conventional tea farm was a “typical” conventional tea producer that only had a pond for catching runoff water from the tea field. For organic tea production, the samples were taken from the first year after conversion and the organic tea farm also had a pond to catch runoff water from the tea field.
The soil samples were taken using a 0-20 cm soil sampler in five to seven locations on the diagonals of each field. The samples then were combined to obtain about one kilogram of soil sample per field for laboratory analysis. Water samples from each farm were taken at the same time as the soil samples, from about one meter in from the edge of the pond, using a 30-cm diameter bucket. Then about 500 ml of each water sample was kept in a glass jar for laboratory analysis.
A sample of one kilogram of fresh tea was taken from each farm (the same tea fields from which the soil and water samples were taken). The fresh tea samples were given to the organic tea farmer to process while the dried (processed) tea samples were brought to the laboratory of the Thai Nguyen University of Agriculture and Forestry for analysis. Residues of agrochemical inputs were analyzed by using a GCMS-Gas Chromatograph/Mass Spectrometer. The analytical procedure followed the GC/MS Practical Guide (McMaster and McMaster 2007).
11

3.0 METHODOLOGY
3.1 Selection of Study Sites
Thai Nguyen was one of the first provinces to be selected by the International Global Changing Institute (IGCI) project (funded by the New Zealand government) for the project to convert tea production from the conventional method to the organic method. Its tea area accounts for 13.8% of the total tea-grown area of the country, of which about 80 ha has been registered for conversion to organic tea production. Therefore, Thai Nguyen Province was selected for this research.
Representative organic tea farms, conventional tea farms and clean tea farms were selected from four representative communes of two tea-producing districts (Dong Hy District and Thai Nguyen City) in Thai Nguyen Province for a panel discussion and in-depth surveys conducted in 2007 (the initial survey was conducted in March and a follow-up survey was conducted in October) with the participation of 180 tea-producing households. Two communes, Minh Lap and Song Cau, were from Dong Hy District and the other two communes, Phuc Xuan and Tan Cuong, were from Thai Nguyen City. The selected tea farms were representative of topographical conditions in the tea production areas of Thai Nguyen Province. The other criterion for selecting these four representative tea-growing communes was that all the organic tea growers and most of the clean tea producers were based here. At least two of the three different types of tea production practices (i.e., conventional tea, clean and organic tea production) can be found in these four communes.
The Minh Lap Commune lives about 24 km east of Thai Nguyen City (center of Thai Nguyen Province and on the sides of the Cau River. Most of its tea farms are on uplands and hillsides with slopes ranging from 15% to 30%. The commune has about 30 tea growers engaged in clean tea production and eight registered organic tea growers from a total of about 2,000 tea growers. The Song Cau Commune, on the other hand, is located in the northeast, about 20 km from Thai Nguyen City. Tea fields in this commune are similar to those in the Minh Lap Commune, however, the tea farms here belong to the Song Cau Tea Company (a state-owned enterprise). There are 32 tea growers using the clean tea production method out of a total of 90.
The Tan Cuong and Phuc Xuan Communes belong administratively to Thai Nguyen City. Tan Cuong is well-known for having the highest tea quality in Vietnam. Most of the tea farms lie on the sides of the Cong River and are fairly flat (with 20% slope). There are 21 registered tea growers in the Organic Tea Club out of 134 tea growers in selected villages in the commune. In the Phuc Xuan Commune, tea is grown on hillsides and uplands and there are 43 tea growers out of 94 who are members of the clean tea cooperative (Thanh Huong Cooperative) where tea growers share standard safety product requirements and internal monitoring systems.
12
3.2 Sample Size Determination
Yansaneh (2007) discusses three major issues for determining the appropriate sample size for a survey considering factors such as precision, quality of the data, and cost in time and money of data collection, processing and dissemination. In order to obtain a statistically sound result, the following approach prescribed by Johnson (1980) and Yamane (1967) was used.
n = 2
2zE
( / )α σ⎡⎣⎢
⎤⎦⎥
(21)
where n = sample size,
α = confidence level,
z = the two-tail z value with the corresponding confidence level,
σ = population standard deviation, and
E = precision level.
Since the data was not continuous, the standard deviation was estimated using the proportions formula as follows:
σ = p x xii
n
( −−
=∑
1
2) (22)
where p is the proportion of farms.
Since agricultural research generally uses a 95% confidence interval, this research also adopted this confidence level. A pre-test was carried out for 15 tea growers, of which five were conventional tea farms, five were organic tea farms and the other five were clean tea farms. The standard deviation of the organic tea, clean tea and conventional tea yields were 1.3, 1.5 and 1.6 with precision levels of 0.09, 0.10 and 0.11 (1/15 of the estimated standard deviation), respectively. These values were then plugged into Equation 21 using automatic calculations introduced by Arsham (2007). The calculated sample sizes of 23 organic tea producers, 67 clean tea producers and 59 conventional tea producers were obtained. Since there were only 23 tea growers registered for organic tea production, all 23 were included in the survey.
13
3.3 Proposed Equations for Estimations
3.3.1 Stochastic frontier equations for efficiency analyses
The proposed log-linear production function was:
Ln y = βo + nin n Lnx∑ β – ui (23)
where i = tea producer index, xn = vector of inputs used by the i th tea producer, and ui = a non-negative error component associated with production inefficiency.
The dependent variable for tea production in Thai Nguyen Province was fresh tea production (kg). The input vectors for a tea grower in the province included:
X1 = labor measured in man-day units (one man-day = an adult working 8 hours in day),
X2 = family land area (m2),
X3 = N kg/ha (pure nitrogen per hectare; non-commercial products),
X4 = pesticides used in liter/ha of Bassa equivalent2 that are specific to actual types of pesticides used in the research area,
X5 = education level of the household head (=1 if elementary school, = 2 if middle school, = 3 if high school graduate, and = 4 if higher).
X6 = Irrigation (1 = having irrigation system and 2 = otherwise3),
X7 = distance from the home to the market place (local market, tea processing plants): = 1 if less than 1 km, = 2 if from 1-3 km, and = 3 if more than 3 km,
X8: gender of the household head (1 = for male and 0 = female), and
X9: tea stand (age of a tea field, in years).
The corresponding stochastic profit frontier function is:
π = py – wTx (24)
2 Bassa is a common pesticide used in tea production in Vietnam. Since different pesticides were used, we converted the prices and quantities of all other pesticides to Bassa equivalents to get a common base. 3 Using 2 instead of 0 is more convenient when using natural log in analyzing the models.
14

From the dual variable profit frontier equation (12), the equation for estimating the variable profit frontier for tea production in Thai Nguyen Province was rewritten as:
h(p, w, z,E;β) = vπ(pe-u, w, z,E; β)/vπ(p, w, z,E;β)
which is the ratio of maximum profit in the presence of output-oriented technical inefficiency to maximum profit or profit inefficiency. Kumbhakar and Lovell (2000) show that the normalized variable profit equation is rewritten as:
ππβββπ uvzp
wp
vq
n
nn ++++= ∑∑ lnlnln 0 (25)
where p = output price,
w = vector of input prices,
z = the normalized fixed costs
v = the normalized random effect,
u = the normalized profit inefficiency, and
β = a vector of technology parameters estimated.
3.3.2 Equation for adoption analysis
From the binary response probability model (13), the equation used for estimating binary response probabilities was:
P(y = 1| x) = G(β0 + β1x1 + …. + βkxk) = G(β0 + xβ) (26)
where y = 1 if farmers decide to convert to organic tea production and y = 0 if otherwise.
The independent variables for estimating the response probability included:
X1 = Education level of the household head (=1 if Education level of the household head (=1 if elementary school, = 2 if middle school, = 3 if high school graduate, and = 4 if higher),
X2 = Tea farm size (m2),
X3 = Health-related expenses of the household (thousand VND/year),
X4 = Income security requirement for a household (thousand VND/year),
X5 = Family labor supply (number of man-days per year),
15

X6 = Premium price for organic tea (thousand VND/ kg),
X7 = Government support program (support: =1 if from government; =2 if from NGO; and = 3 if there are more than two types of funders), and
X8 = Tea stand (years).
Other variables included gender of the household head and family size.
A probit model was used to estimate the response probability with the following functional form:
G(z) = Ф(z) = (27) dvvz
)(φ∫∞−
The results of this estimation provided information about what the main factors influencing the tea growers’ decision of whether or not to convert their farms from conventional to organic/clean tea production were.
3.3.3 Equation for risk and uncertainty analysis
The model for risk and uncertainty analysis was simulated and compared with the variability of profits under conventional and organic tea production. The outcomes from the production and profit efficiency analyses and the selection analysis were used as inputs in the risk and uncertainty analysis. The adoption and profit functions were used as objective functions in the risk analysis model. Different distributions were assigned to each uncertainty variable for the sensitivity analysis in order to obtain the best theoretical fit for each variable. The expected outcomes of this analysis were the risk levels associated with conventional, clean, and organic tea production methods.
3.3.4 Equation for cost and benefit analysis
The Net Present Value (NPV) method calculates the net returns or net benefits over time from streams of benefits and costs discounted to present day values. The equation used to calculate the NPVs for the different tea production methods (conventional, clean and organic tea production methods) is as follows:
jj
jj iCB )1/()(
0+−∑
∞
=
NPV = (28)
where Bj = benefits for the jth period, Cj = the costs for the jth period, and i = the discount rate.
16
Based on data collected for the 2007 crop year and three previous crop years (2004, 2005 and 2006), a CBA was carried out twice for a representative tea-growing household for each tea production method and from both private and social perspectives. For the private CBA, the costs and benefits were measured using the monetary valuation method (direct or indirect market operations and farmers’ accounting records). The prevailing interest rate in the market (from the Agricultural Development Bank) was used as the private discount rate. For the social CBA, the measurement of costs and benefits was more complicated. The prevailing interest rate from the Bank for the Poor (considered as the opportunity cost for social development) was used as the social discount rate.
4.0 PRODUCTION EFFICIENCY
4.1 Descriptive Data for Production Efficiency Analysis
4.1.1 Household characteristics
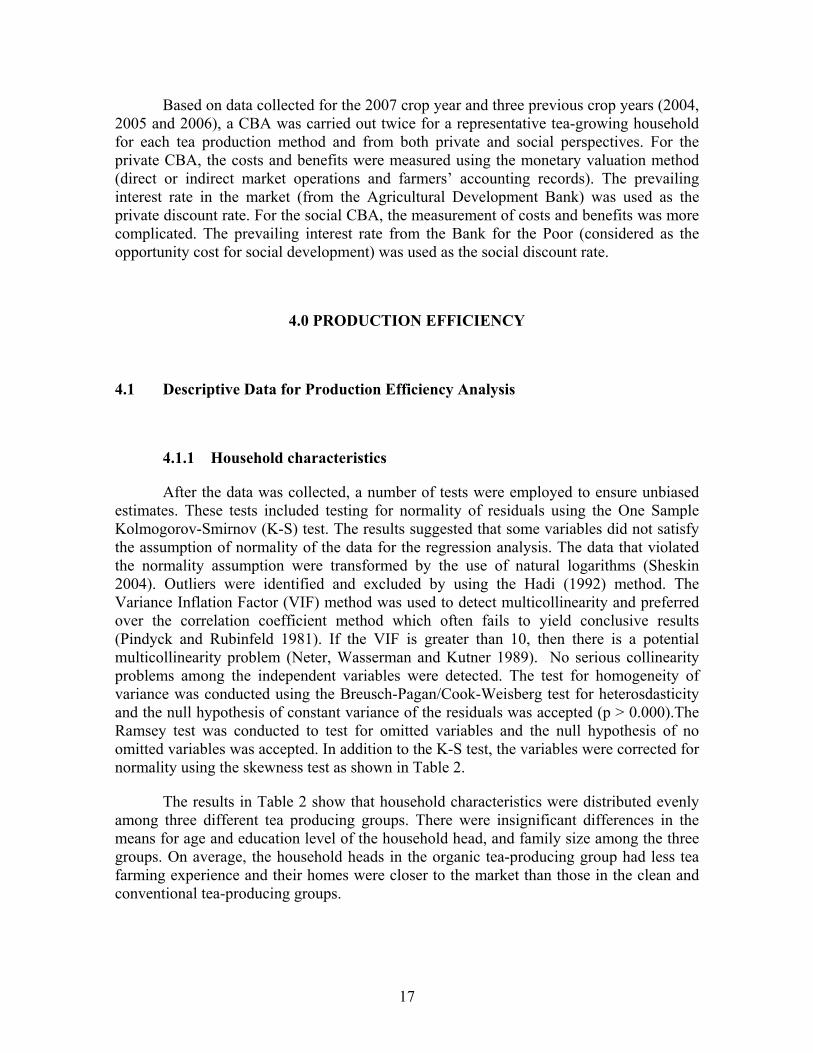
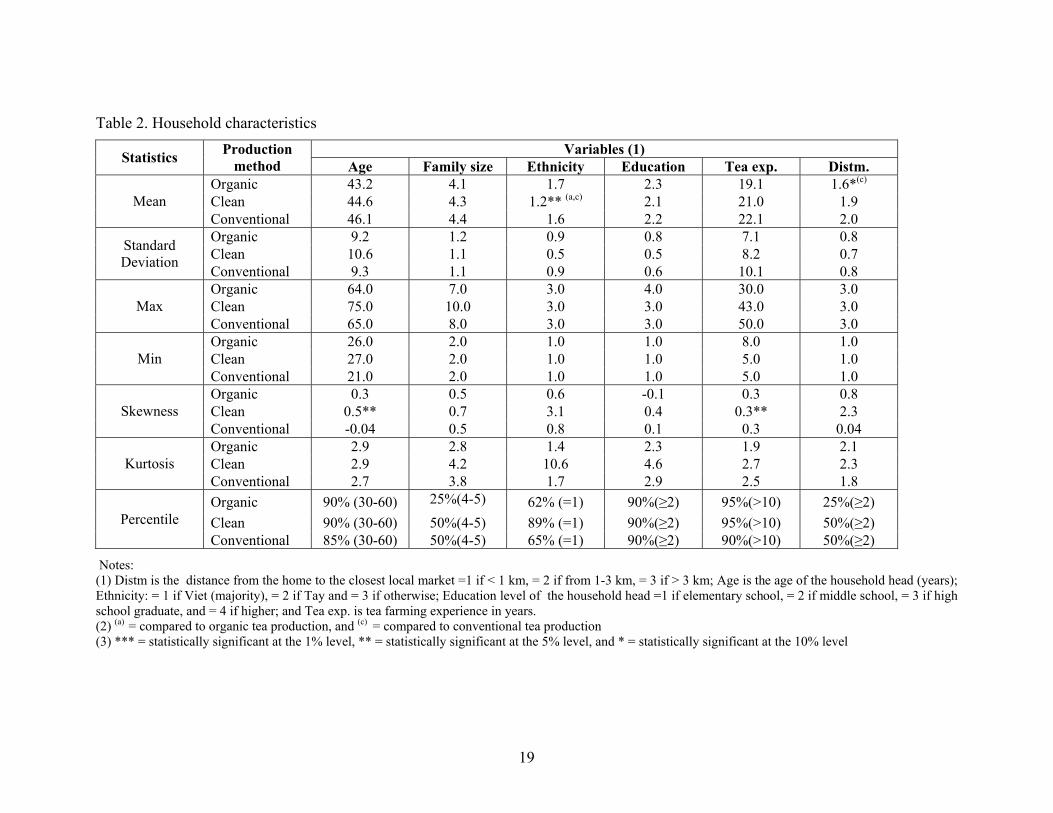
After the data was collected, a number of tests were employed to ensure unbiased estimates. These tests included testing for normality of residuals using the One Sample Kolmogorov-Smirnov (K-S) test. The results suggested that some variables did not satisfy the assumption of normality of the data for the regression analysis. The data that violated the normality assumption were transformed by the use of natural logarithms (Sheskin 2004). Outliers were identified and excluded by using the Hadi (1992) method. The Variance Inflation Factor (VIF) method was used to detect multicollinearity and preferred over the correlation coefficient method which often fails to yield conclusive results (Pindyck and Rubinfeld 1981). If the VIF is greater than 10, then there is a potential multicollinearity problem (Neter, Wasserman and Kutner 1989). No serious collinearity problems among the independent variables were detected. The test for homogeneity of variance was conducted using the Breusch-Pagan/Cook-Weisberg test for heterosdasticity and the null hypothesis of constant variance of the residuals was accepted (p > 0.000).The Ramsey test was conducted to test for omitted variables and the null hypothesis of no omitted variables was accepted. In addition to the K-S test, the variables were corrected for normality using the skewness test as shown in Table 2.
The results in Table 2 show that household characteristics were distributed evenly among three different tea producing groups. There were insignificant differences in the means for age and education level of the household head, and family size among the three groups. On average, the household heads in the organic tea-producing group had less tea farming experience and their homes were closer to the market than those in the clean and conventional tea-producing groups.
17

18
The K-S test results showed that age and tea farming experience of the household heads for the clean tea group were statistically skewed distributions, but not statistically significant for the kurtosis test. As suggested by Sheskin (2004), translog forms were used to correct the skewness problem. Since ethnicity, education and distm (distance from the home) variables only took discrete values (e.g., 1, 2, 3 and 4), the normality test for these variables was not applicable.
19
Table 2. Household characteristics Variables (1) Statistics Production
method Age Family size Ethnicity Education Tea exp. Distm. Organic 43.2 4.1 1.7 2.3 19.1 1.6*(c)
Clean 44.6 4.3 1.2** (a,c) 2.1 21.0 1.9 Mean Conventional 46.1 4.4 1.6 2.2 22.1 2.0 Organic 9.2 1.2 0.9 0.8 7.1 0.8 Clean 10.6 1.1 0.5 0.5 8.2 0.7 Standard
Deviation Conventional 9.3 1.1 0.9 0.6 10.1 0.8 Organic 64.0 7.0 3.0 4.0 30.0 3.0 Clean 75.0 10.0 3.0 3.0 43.0 3.0 Max Conventional 65.0 8.0 3.0 3.0 50.0 3.0 Organic 26.0 2.0 1.0 1.0 8.0 1.0 Clean 27.0 2.0 1.0 1.0 5.0 1.0 Min Conventional 21.0 2.0 1.0 1.0 5.0 1.0 Organic 0.3 0.5 0.6 -0.1 0.3 0.8 Clean 0.5** 0.7 3.1 0.4 0.3** 2.3 Skewness Conventional -0.04 0.5 0.8 0.1 0.3 0.04 Organic 2.9 2.8 1.4 2.3 1.9 2.1 Clean 2.9 4.2 10.6 4.6 2.7 2.3 Kurtosis Conventional 2.7 3.8 1.7 2.9 2.5 1.8 Organic 90% (30-60) 25%(4-5) 62% (=1) 90%(≥2) 95%(>10) 25%(≥2) Clean 90% (30-60) 50%(4-5) 89% (=1) 90%(≥2) 95%(>10) 50%(≥2) Percentile Conventional 85% (30-60) 50%(4-5) 65% (=1) 90%(≥2) 90%(>10) 50%(≥2)
Notes: (1) Distm is the distance from the home to the closest local market =1 if < 1 km, = 2 if from 1-3 km, = 3 if > 3 km; Age is the age of the household head (years); Ethnicity: = 1 if Viet (majority), = 2 if Tay and = 3 if otherwise; Education level of the household head =1 if elementary school, = 2 if middle school, = 3 if high school graduate, and = 4 if higher; and Tea exp. is tea farming experience in years. (2) (a) = compared to organic tea production, and (c) = compared to conventional tea production (3) *** = statistically significant at the 1% level, ** = statistically significant at the 5% level, and * = statistically significant at the 10% level
20
4.1.2 Tea farm characteristics
Table 3 shows that, average, the tea stand in the sample was quite young (around 16 years) for all three production groups. According to Do and Le (2000), the most productive period of a tea stand’s life is from 10-30 years old. Ninety per cent of the tea stands in the sample were 8-34 years old, suggesting that most of the surveyed tea farms were in their most productive period. The distance from the home to the tea farm was also relatively short (the percentage of tea growers having less than 200 m to travel to their farms were 50%, 75% and 50% for organic, clean and conventional tea producers respectively). A higher percentage of organic and clean tea farmers irrigated their tea crops compared with conventional tea growers in the sample. On average, organic tea growers had smaller tea farms (1545 m2, 3763 m2 and 2569 m2 for organic, clean and conventional tea producers respectively) and also higher machinery investment than the clean and conventional tea growers.
The results of the K-S test for normality of the tea stand, tea farm size and investment in capital, presented by levels of significance in Table 3, showed that the data for tea farm size was positively skewed for all three tea producer groups. The distribution of data for tea farm size in all the three groups was also statistically significant. For tea production capital, the K-S test showed that there was statistically significant leptokurtic distribution (positive kurtosis value). To correct the skewness and kurtosis problems, translog forms were used as suggested by Sheskin (2004). The K-S test for the translog form of the three stated variables showed no statistically significant presence of skewness or kurtosis.
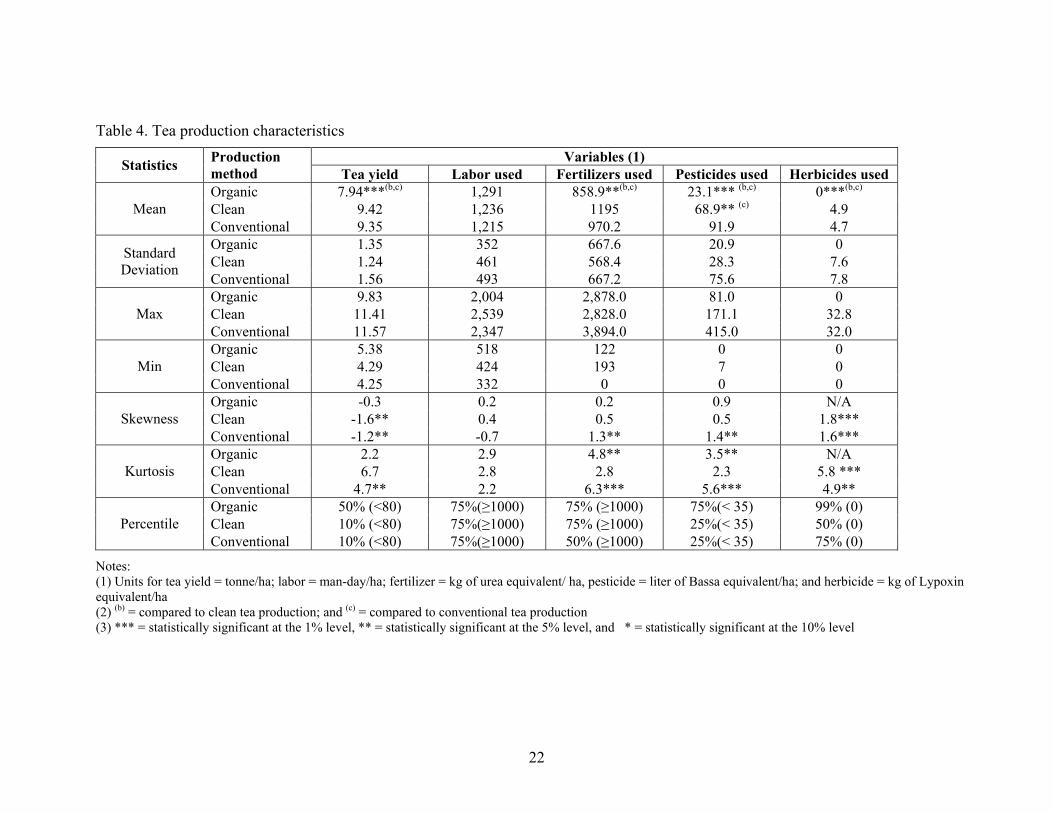
4.1.3 Tea production characteristics
The descriptive statistics presented in Table 4 illustrate the characteristics of important tea production variables for the farm samples. Statistically, organic tea production had a significantly lower yield than clean and conventional tea production. This result was also consistent with information gathered from organic tea growers i.e., that organic tea yields were about 70% of conventional tea yields. Approximately half of the total organic tea producers in the sample had yields of less than 8 tonnes/ha while only 10% of the clean and conventional tea producers fell into this lower yield range. Organic tea producers also used much less fertilizers and pesticides (especially herbicides) as compared to clean and conventional tea producers. One of the reasons organic tea producers did not use herbicides was that there were no herbal or bio-herbicides available and organic tea producers were not allowed to use chemical inputs. Also, clean tea producers applied significantly less pesticides than conventional tea producers. The K-S test showed the presence of a statistically significant negatively skewed distribution for tea yield and a positively skewed distribution for herbicide use for clean and conventional tea producer groups. Conventional tea production has both skewness and kurtosis problems for all except labor.
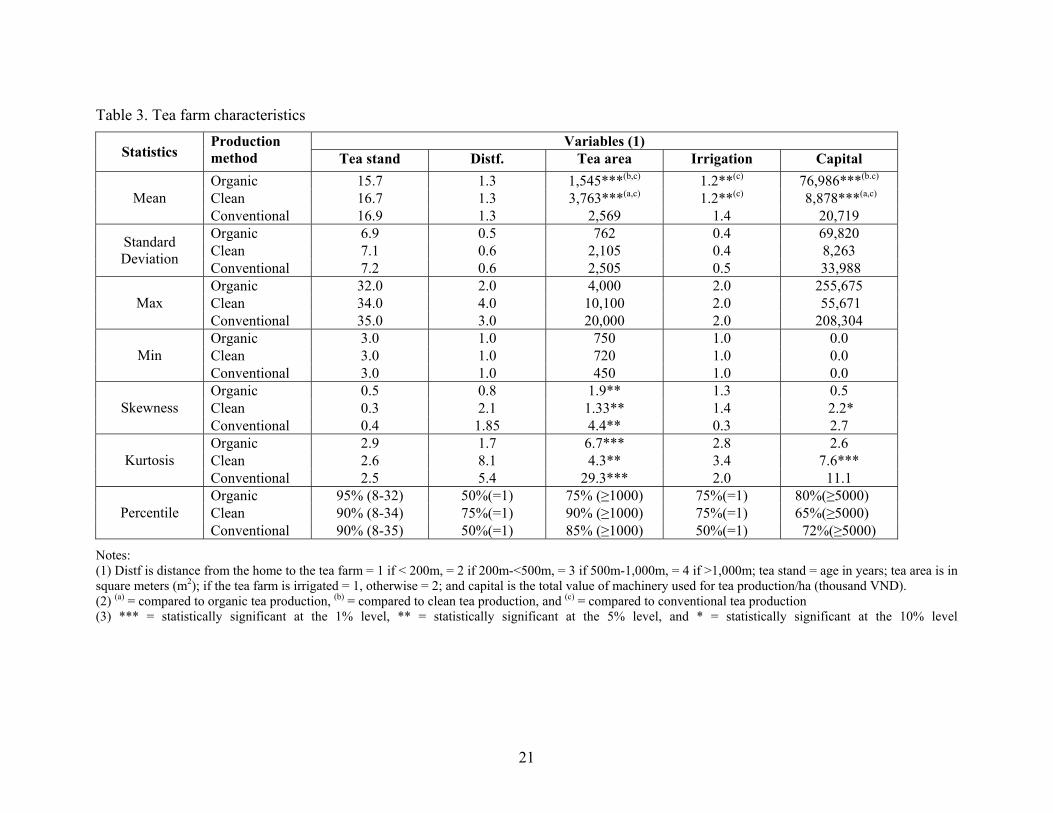
Table 3. Tea farm characteristics Variables (1)
Statistics Production method Tea stand Distf. Tea area Irrigation Capital Organic 15.7 1.3 1,545***(b,c) 1.2**(c) 76,986***(b.c) Clean 16.7 1.3 3,763***(a,c) 1.2**(c) 8,878***(a,c) Mean Conventional 16.9 1.3 2,569 1.4 20,719 Organic 6.9 0.5 762 0.4 69,820 Clean 7.1 0.6 2,105 0.4 8,263 Standard
Deviation Conventional 7.2 0.6 2,505 0.5 33,988 Organic 32.0 2.0 4,000 2.0 255,675 Clean 34.0 4.0 10,100 2.0 55,671 Max Conventional 35.0 3.0 20,000 2.0 208,304 Organic 3.0 1.0 750 1.0 0.0 Clean 3.0 1.0 720 1.0 0.0 Min Conventional 3.0 1.0 450 1.0 0.0 Organic 0.5 0.8 1.9** 1.3 0.5 Clean 0.3 2.1 1.33** 1.4 2.2* Skewness Conventional 0.4 1.85 4.4** 0.3 2.7 Organic 2.9 1.7 6.7*** 2.8 2.6 Clean 2.6 8.1 4.3** 3.4 7.6*** Kurtosis Conventional 2.5 5.4 29.3*** 2.0 11.1 Organic 95% (8-32) 50%(=1) 75% (≥1000) 75%(=1) 80%(≥5000) Clean 90% (8-34) 75%(=1) 90% (≥1000) 75%(=1) 65%(≥5000) Percentile Conventional 90% (8-35) 50%(=1) 85% (≥1000) 50%(=1) 72%(≥5000)
Notes: (1) Distf is distance from the home to the tea farm = 1 if < 200m, = 2 if 200m-<500m, = 3 if 500m-1,000m, = 4 if >1,000m; tea stand = age in years; tea area is in square meters (m2); if the tea farm is irrigated = 1, otherwise = 2; and capital is the total value of machinery used for tea production/ha (thousand VND). (2) (a) = compared to organic tea production, (b) = compared to clean tea production, and (c) = compared to conventional tea production (3) *** = statistically significant at the 1% level, ** = statistically significant at the 5% level, and * = statistically significant at the 10% level
21
22
Table 4. Tea production characteristics Variables (1) Statistics Production
method Tea yield Labor used Fertilizers used Pesticides used Herbicides used Organic 7.94***(b,c) 1,291 858.9**(b,c) 23.1*** (b,c) 0***(b,c) Clean 9.42 1,236 1195 68.9** (c) 4.9 Mean Conventional 9.35 1,215 970.2 91.9 4.7 Organic 1.35 352 667.6 20.9 0 Clean 1.24 461 568.4 28.3 7.6 Standard
Deviation Conventional 1.56 493 667.2 75.6 7.8 Organic 9.83 2,004 2,878.0 81.0 0 Clean 11.41 2,539 2,828.0 171.1 32.8 Max Conventional 11.57 2,347 3,894.0 415.0 32.0 Organic 5.38 518 122 0 0 Clean 4.29 424 193 7 0 Min Conventional 4.25 332 0 0 0 Organic -0.3 0.2 0.2 0.9 N/A Clean -1.6** 0.4 0.5 0.5 1.8*** Skewness Conventional -1.2** -0.7 1.3** 1.4** 1.6*** Organic 2.2 2.9 4.8** 3.5** N/A Clean 6.7 2.8 2.8 2.3 5.8 *** Kurtosis Conventional 4.7** 2.2 6.3*** 5.6*** 4.9** Organic 50% (<80) 75%(≥1000) 75% (≥1000) 75%(< 35) 99% (0) Clean 10% (<80) 75%(≥1000) 75% (≥1000) 25%(< 35) 50% (0) Percentile Conventional 10% (<80) 75%(≥1000) 50% (≥1000) 25%(< 35) 75% (0)
Notes: (1) Units for tea yield = tonne/ha; labor = man-day/ha; fertilizer = kg of urea equivalent/ ha, pesticide = liter of Bassa equivalent/ha; and herbicide = kg of Lypoxin equivalent/ha (2) (b) = compared to clean tea production; and (c) = compared to conventional tea production (3) *** = statistically significant at the 1% level, ** = statistically significant at the 5% level, and * = statistically significant at the 10% level
4.2 Production Efficiency Analysis
4.2.1 Factors affecting production efficiency
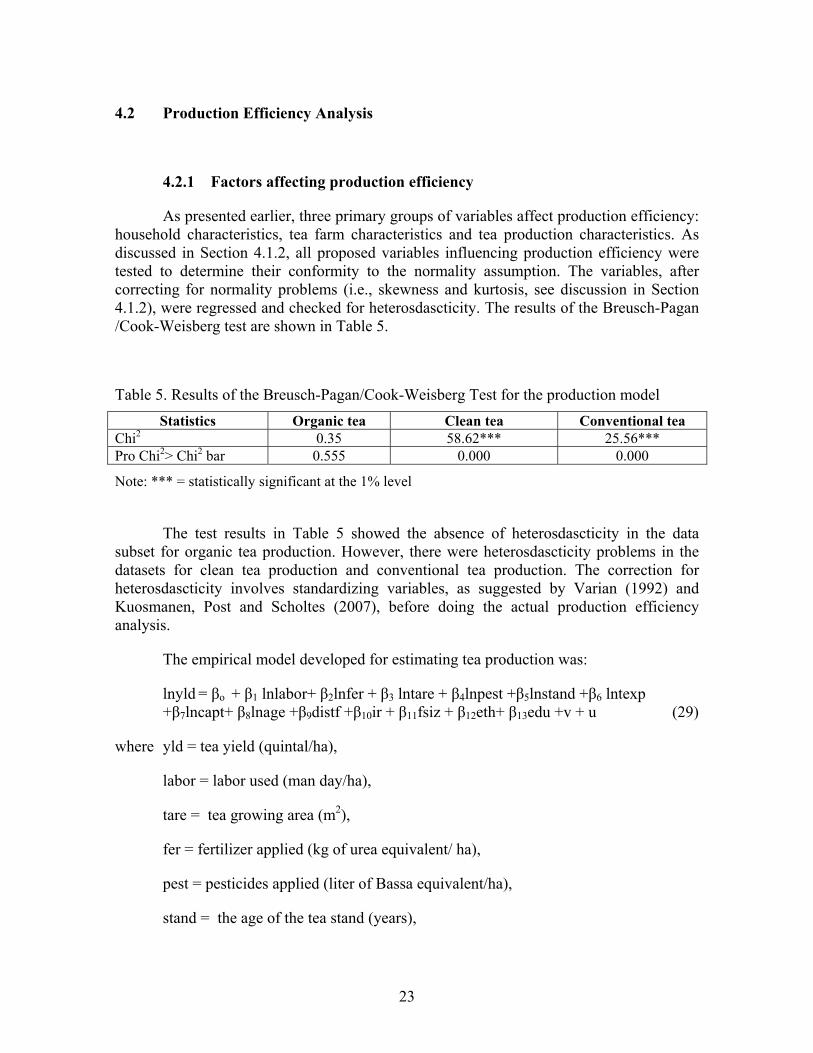
As presented earlier, three primary groups of variables affect production efficiency: household characteristics, tea farm characteristics and tea production characteristics. As discussed in Section 4.1.2, all proposed variables influencing production efficiency were tested to determine their conformity to the normality assumption. The variables, after correcting for normality problems (i.e., skewness and kurtosis, see discussion in Section 4.1.2), were regressed and checked for heterosdascticity. The results of the Breusch-Pagan /Cook-Weisberg test are shown in Table 5.
Table 5. Results of the Breusch-Pagan/Cook-Weisberg Test for the production model Statistics Organic tea Clean tea Conventional tea
Chi2 0.35 58.62*** 25.56*** Pro Chi2> Chi2 bar 0.555 0.000 0.000
Note: *** = statistically significant at the 1% level
The test results in Table 5 showed the absence of heterosdascticity in the data subset for organic tea production. However, there were heterosdascticity problems in the datasets for clean tea production and conventional tea production. The correction for heterosdascticity involves standardizing variables, as suggested by Varian (1992) and Kuosmanen, Post and Scholtes (2007), before doing the actual production efficiency analysis.
The empirical model developed for estimating tea production was:
lnyld = βo + β1 lnlabor+ β2lnfer + β3 lntare + β4lnpest +β5lnstand +β6 lntexp +β7lncapt+ β8lnage +β9distf +β10ir + β11fsiz + β12eth+ β13edu +v + u (29)
where yld = tea yield (quintal/ha),
labor = labor used (man day/ha),
tare = tea growing area (m2),
fer = fertilizer applied (kg of urea equivalent/ ha),
pest = pesticides applied (liter of Bassa equivalent/ha),
stand = the age of the tea stand (years),
23
texp = tea farming experience (years)
capt = capital (value of machinery used for tea production per ha),
age = the age of the household head (years),
distf = the distance from the home to tea field (= 1 if < 200 m, = 2 if 200 m - <500 m, = 3 if 500 m -1,000 m, = 4 if more than 1,000 m),
ir = irrigation status (= 1 if tea farm is irrigated, = 2 if otherwise),
fsiz = family size (number of persons)
eth = the ethnicity of the tea grower (= 1 if Viet, = 2 if Tay and = 3 if otherwise),
edu = the education level of the household head (=1 if elementary school, = 2 if middle school, = 3 if high school graduate, and = 4 if higher),
v = random error, and
u = inefficient error.
4.2.2 Production efficiency of organic tea production
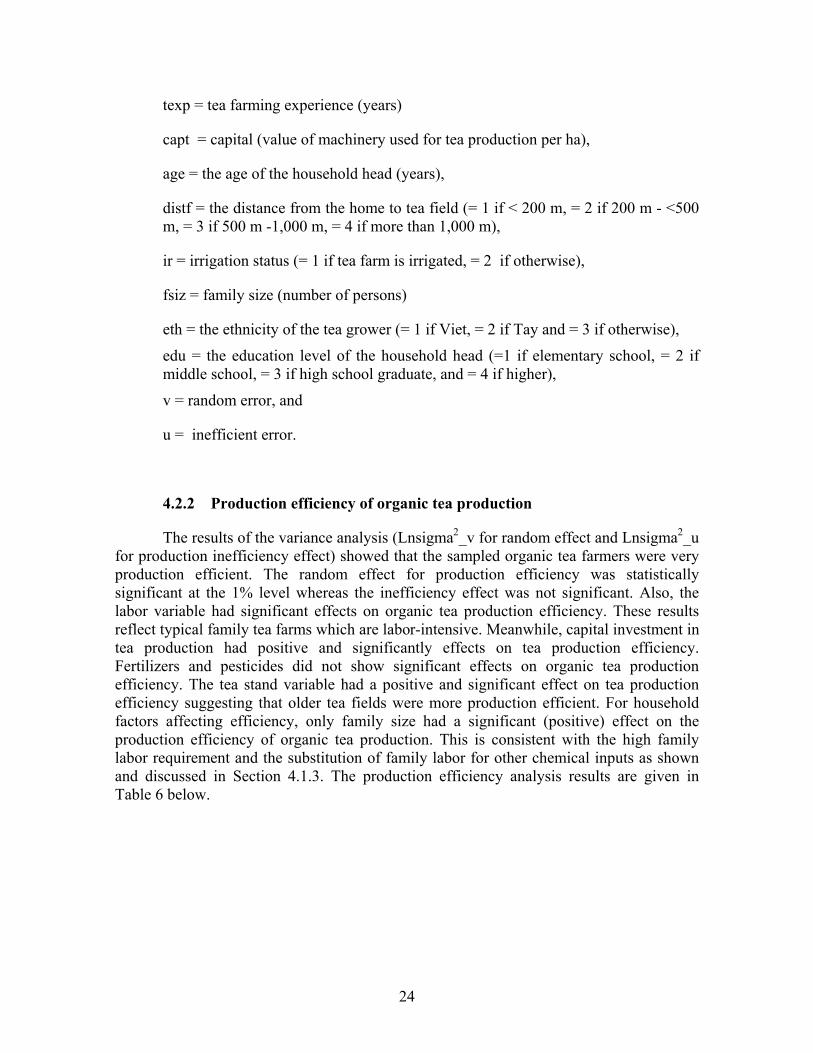
The results of the variance analysis (Lnsigma2_v for random effect and Lnsigma2_u for production inefficiency effect) showed that the sampled organic tea farmers were very production efficient. The random effect for production efficiency was statistically significant at the 1% level whereas the inefficiency effect was not significant. Also, the labor variable had significant effects on organic tea production efficiency. These results reflect typical family tea farms which are labor-intensive. Meanwhile, capital investment in tea production had positive and significantly effects on tea production efficiency. Fertilizers and pesticides did not show significant effects on organic tea production efficiency. The tea stand variable had a positive and significant effect on tea production efficiency suggesting that older tea fields were more production efficient. For household factors affecting efficiency, only family size had a significant (positive) effect on the production efficiency of organic tea production. This is consistent with the high family labor requirement and the substitution of family labor for other chemical inputs as shown and discussed in Section 4.1.3. The production efficiency analysis results are given in Table 6 below.
24
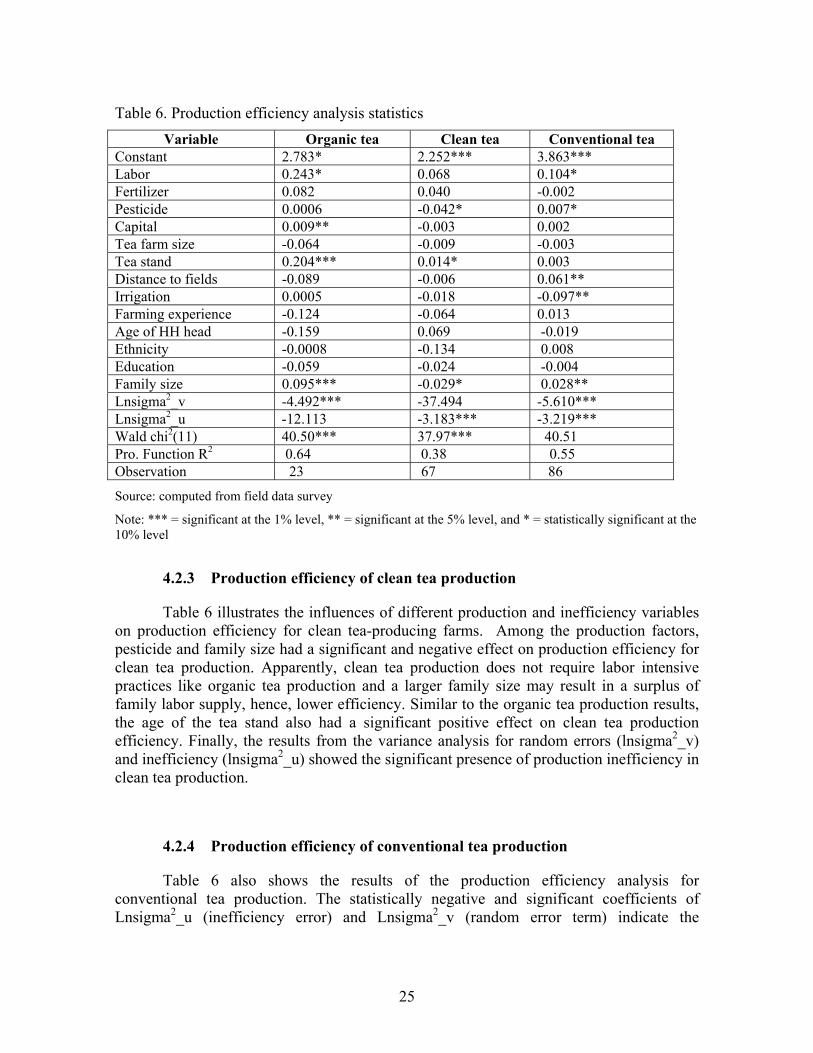
Table 6. Production efficiency analysis statistics Variable Organic tea Clean tea Conventional tea
Constant 2.783* 2.252*** 3.863*** Labor 0.243* 0.068 0.104* Fertilizer 0.082 0.040 -0.002 Pesticide 0.0006 -0.042* 0.007* Capital 0.009** -0.003 0.002 Tea farm size -0.064 -0.009 -0.003 Tea stand 0.204*** 0.014* 0.003 Distance to fields -0.089 -0.006 0.061** Irrigation 0.0005 -0.018 -0.097** Farming experience -0.124 -0.064 0.013 Age of HH head -0.159 0.069 -0.019 Ethnicity -0.0008 -0.134 0.008 Education -0.059 -0.024 -0.004 Family size 0.095*** -0.029* 0.028** Lnsigma2_v -4.492*** -37.494 -5.610*** Lnsigma2_u -12.113 -3.183*** -3.219*** Wald chi2(11) 40.50*** 37.97*** 40.51 Pro. Function R2 0.64 0.38 0.55 Observation 23 67 86
Source: computed from field data survey
Note: *** = significant at the 1% level, ** = significant at the 5% level, and * = statistically significant at the 10% level
4.2.3 Production efficiency of clean tea production
Table 6 illustrates the influences of different production and inefficiency variables on production efficiency for clean tea-producing farms. Among the production factors, pesticide and family size had a significant and negative effect on production efficiency for clean tea production. Apparently, clean tea production does not require labor intensive practices like organic tea production and a larger family size may result in a surplus of family labor supply, hence, lower efficiency. Similar to the organic tea production results, the age of the tea stand also had a significant positive effect on clean tea production efficiency. Finally, the results from the variance analysis for random errors (lnsigma2_v) and inefficiency (lnsigma2_u) showed the significant presence of production inefficiency in clean tea production.
4.2.4 Production efficiency of conventional tea production
Table 6 also shows the results of the production efficiency analysis for conventional tea production. The statistically negative and significant coefficients of Lnsigma2_u (inefficiency error) and Lnsigma2_v (random error term) indicate the
25
significant presence of production inefficiency and random effects in conventional tea production in the research areas.
Labor and pesticide variables played statistically significant roles in improving the production efficiency of conventional tea production farms (positive coefficients of 0.104 and 0.007 respectively). Distance from the home to the tea farm had a significant and positive relation to tea production efficiency (tea farms further away were more efficient). One explanation for this is that conventional tea farmers tend to reduce pesticide applications on tea fields closer to their homes. The significant and positive effect of family size on production efficiency for conventional tea production suggests that farms with larger family sizes tend to be more efficient given the labor-intensiveness of family farming operations. The negative and statistically significant effect of irrigation suggests that non-irrigated tea farms are less production efficient.
4.2.5 Comparison of production efficiency means
Table 7 shows that the highest production efficiency (0.998) came from organic tea production while conventional tea production had the lowest mean production efficiency (0.859). There was no statistically significant difference in the mean production efficiency levels between clean tea and conventional tea producers.
Table 7. Cross-comparisons of the means of production efficiency Statistics Pair-comparison
Mean Standard deviation Prob.│t│> t* 0.998*** 0.00002 Organic tea vs.
Clean tea 0.879 0.11259 0.000
0.998*** 0.00002 Organic tea vs. Conventional tea 0.859 0.11596 0.000
0.879 0.11259 Clean tea vs. Conventional tea 0.859 0.11596 0.285
Source: computed from field data survey
Notes: (1) Ho: No difference in means (2) *** = significant at the 1% level, ** = significant at the 5% level, and * = statistically significant at the 10% level
26
5.0 PROFIT EFFICIENCY ANALYSIS
5.1 Descriptive Data for Profit Efficiency Analysis
Tea profit efficiency as defined in this study is the profit gained from operating on the profit frontier taking into consideration farm-specific prices and factors. A tea farm is assumed to operate by maximizing profit subject to perfectly competitive input and output markets and a given output technology. Tea farm profit is measured in terms of gross margins that equal total revenue (TR) minus total variable cost (TVC) (Kolawole 2006; Shuwu 2006; FAO 2003; Coelli 1998; Ali and Flinn 1989). It is possible to incorporate institutional and environmental factors, such as quality of soil, water and rainfall as shown by Ali and Flinn (1989) and Coelli (1995), Thompson and Mark (1989), Goyal and Berg (2004), FAO (2003), and Kolawole (2006) used a normalized profit function, which divided profit, input prices, and other factors by output price(s). The descriptive statistics presented in Table 7 are for normalized variables. The model used for estimation was:
ln(profit/p) = β0+β1ln(plabor/p)+β2ln(pfer/p)+β3ln(pecost/p)+β4ln(hcost/p) +β5ln(ocost/p) +δ1lntexp+δ2lnage +δ3lntare + δ4distm + δ5edu (30)
where profit = the variable profit (thousand VND),
plabor = the price of labor4 (thousand VND/man-day),
pfer = the price of fertilizer (thousand VND/ kg of nitrogen equivalent),
pecost = the expenditure for pest and disease control5 (thousand VND),
hcost = the expenditure for health-care and hospitalization (thousand VND) as an indirect measurement of environmental cost,
ocost = other variable costs in thousand VND (fuel, irrigation fees, etc.,),
texp = tea growing experience (years),
age = the age of the household head (years),
tare = the tea farm size (m2),
4 Labor in this research was treated as an aggregated variable consisting of family labor and hired labor for tea production per hectare (Yotopoulos and Lau 1973; Sharma, Leung and Zaleski 1997). 5 For organic tea production, pesticide use is not allowed. Given this requirement, the total expenditure for pest and disease control was used to replace the cost of pesticides and herbicides.
27
28
distm = the distance from the home to the closest local market (= 1 if < 1km, = 2 if from 1-3 km, = 3 if >3 km), and
edu = the education level of the household head (=1 if elementary school, = 2 if middle school, = 3 if high school graduate, and = 4 if higher).
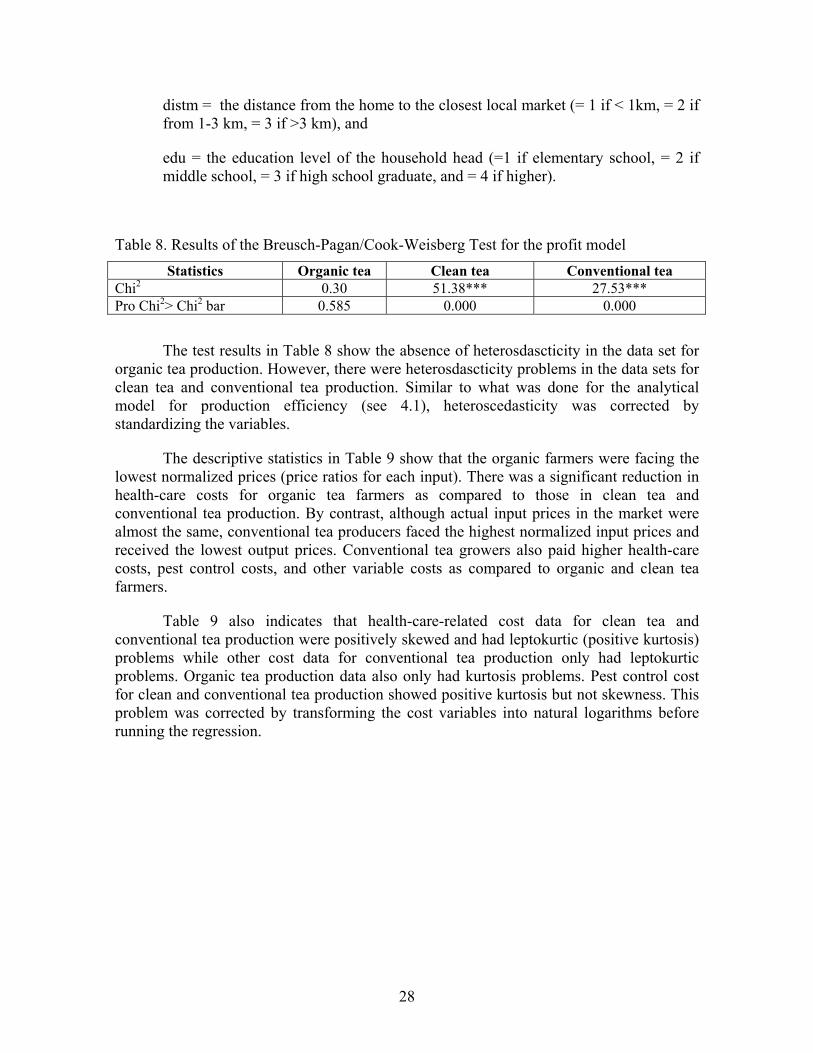
Table 8. Results of the Breusch-Pagan/Cook-Weisberg Test for the profit model Statistics Organic tea Clean tea Conventional tea
Chi2 0.30 51.38*** 27.53*** Pro Chi2> Chi2 bar 0.585 0.000 0.000
The test results in Table 8 show the absence of heterosdascticity in the data set for organic tea production. However, there were heterosdascticity problems in the data sets for clean tea and conventional tea production. Similar to what was done for the analytical model for production efficiency (see 4.1), heteroscedasticity was corrected by standardizing the variables.
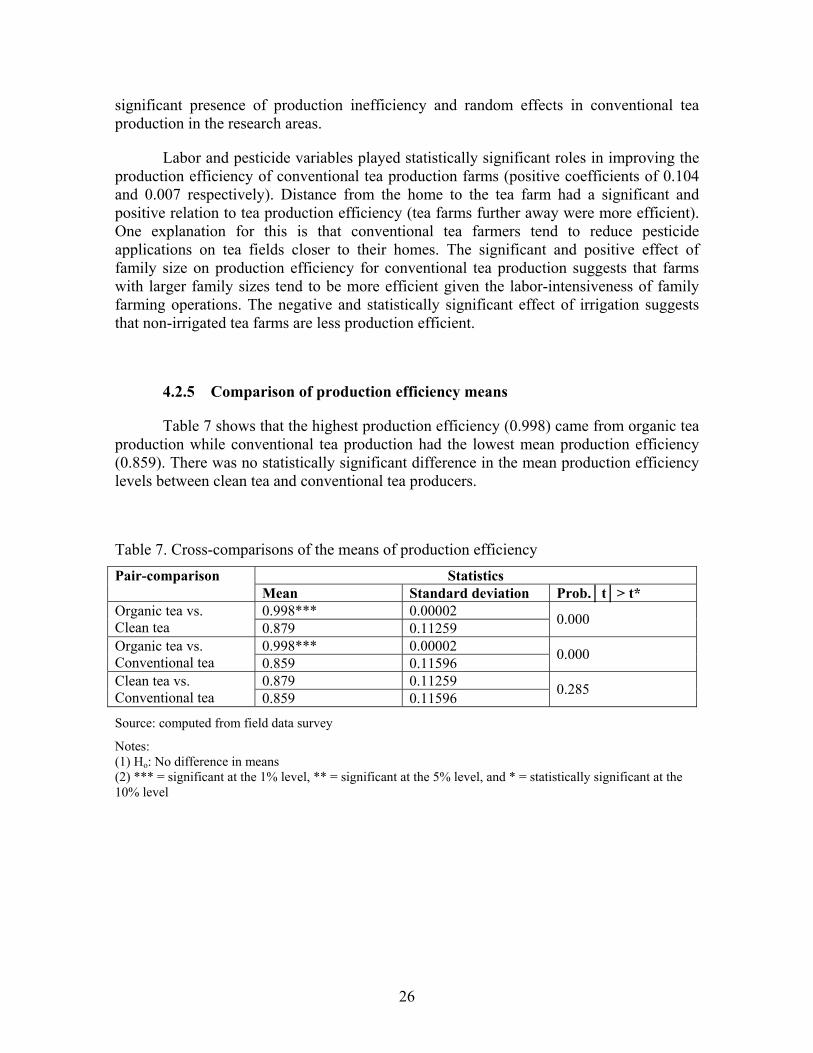
The descriptive statistics in Table 9 show that the organic farmers were facing the lowest normalized prices (price ratios for each input). There was a significant reduction in health-care costs for organic tea farmers as compared to those in clean tea and conventional tea production. By contrast, although actual input prices in the market were almost the same, conventional tea producers faced the highest normalized input prices and received the lowest output prices. Conventional tea growers also paid higher health-care costs, pest control costs, and other variable costs as compared to organic and clean tea farmers.
Table 9 also indicates that health-care-related cost data for clean tea and conventional tea production were positively skewed and had leptokurtic (positive kurtosis) problems while other cost data for conventional tea production only had leptokurtic problems. Organic tea production data also only had kurtosis problems. Pest control cost for clean and conventional tea production showed positive kurtosis but not skewness. This problem was corrected by transforming the cost variables into natural logarithms before running the regression.

Variables (1) (Normalized variables) Statistics Production method profit plabor pfer pecost hcost ocost Organic 4,510 2.25**(b,c) 1.19**(b,c) 111***(b,c) 83***(b,c) 799(c) Clean 4,632 2.69(a, c) 1.43 415***(c) 174 736 Mean Conventional 3,459 3.46 1.84 646 331 1,163 Organic 1,687 0.41 0.22 92 112 483 Clean 1,631 0.47 0.25 271 286 380 Standard
Deviation Conventional 1,742 0.98 0.53 501 1,013 771 Organic 7,201 2.9 1.5 283 526 1,769 Clean 7,400 3.6 1.9 1,282 1,808 1,941 Max Conventional 6,295 6 3.2 2,333 8,930 4,744 Organic 214 1.5 0.8 0 0 0 Clean 142 1.9 1 56 0 0 Min Conventional 0 2.1 1.1 0 0 0 Organic -0.63 -0.30 -0.46 -0.42 2.76 0.19 Clean -0.74 0.12 0.08 0.13 4.39** 0.67 Skewness Conventional -0.49 0.57 0.57 1.19 7.46*** 1.58 Organic 2.89 2.56 2.36 1.92 11.60*** 2.59 Clean 3.44* 1.73 1.76 1.91** 23.44*** 3.35** Kurtosis Conventional 2.24 2.40 2.36 4.09** 62.74*** 7.81*** Organic 57%>5000 75%<2.5 99%<1.5 75%< 190 25%> 105 71%>1000 Clean 50% >5000 48%< 2.5 68% < 1.5 24% < 190 50%> 105 81%> 1000 Percentile Conventional 23%>5000 25< 2.5 28% < 1.5 20% < 190 41%> 105 51%> 1000
29
Table 9. Descriptive statistics of variables in the profit efficiency analysis (2007)
Notes: (1) Profit denotes normalized profit, plabor is the normalized price of labor, pfer is the normalized price of fertilizers, pecost is the normalized pest control cost, hcost is the normalized health-care cost, and ocost refers to other normalized variable costs (fuel, irrigation fees, etc.) (2) (a) = compared to organic tea production; (b) = compared to clean tea production, and (c) = compared to conventional tea production (3) *** = statistically significant at the 1% level, ** = statistically significant at the 5% level, and * = statistically significant at the 10% level

5.2 Profit Efficiency Analysis
5.2.1 Profit efficiency of organic tea production
In the production efficiency analysis, the random effect was statistically significant at the 1% level (see 4.2.2). However, the results from the variance analysis shown in Table 10 reveal that the random effect for profit efficiency was insignificant while the profit inefficiency effect was significant (Lnsigma2_v for random effect and Lnsigma2_u for profit inefficiency effect).
The negative and significant effects of the pest and disease control costs on profit efficiency for organic tea production conform with hypothesized theory and observations made by Ali and Flinn (1989), Kolawole (2006), and Abdulai and Huffman (2000). This reflects the fact that for organic tea production, pest control costs contribute significantly to reduced profit due to applying more expensive pest control measures to substitute for synthetic pesticides. The positive and significant effects of the farmers’ tea growing experience in organic tea production imply that this will reduce tea profit inefficiency. These results are consistent with Ali and Flinn (1989), Abdulai and Huffman (2000) and Shuwu (2006). The positive coefficient of the variable, as found by Ali and Byerlee (1991) and Sharma, Leung and Zaleski (1997), also implies that experienced tea farmers are better performers than those without experience.
Table 10. Profit efficiency analysis statistics Variable Organic tea Clean tea Conventional tea
Constant 7.5110 11.910*** 8.298*** Labor price -0.497 0.099 2.684 Fertilizer price 0.403 -0.397*** -4.194** Pest control cost - 0.023* -0.048 -0.053*** Health-care cost -0.005 -0.006*** 0.007 Other costs -0.007 -0.009 -0.006 Tea farm size -0.164 0.164** 0.516 Distance to market -0.049 -0.121*** 0.031 Farming experience 0.796** 0.064 *** -0.456 Age of HH head -0.392 -0.019 0.338 Education 0.320 0.085 0.047 Lnsigma2_v -32.797 -34.885 -28.23 Lnsigma2_u -0.667** -0.735*** 3.90*** Wald chi2(11) 2e+7*** 3e+08*** 4+06*** R2 for profit 0.53 0.36 0.35 Observation 23 67 86
Source: computed from field data survey
Notes: *** = statistically significant at the 1% level, ** = statistically significant at the 5% level, and * = statistically significant at the 10% level
30
5.2.2 Profit efficiency of clean tea production
The results of the variance analysis for clean tea production are also found in Table 10. The random effect was statistically insignificant (lnsigma2_v). However, the profit inefficiency element (lnsigma2_u) was statistically significant at the 1% level. Table 10 also shows the influence of different input prices and inefficiency variables on profit efficiency for clean tea production farms. Fertilizer price had statistically negative and significant effects on profit efficiency for clean tea production. The negative fertilizer price coefficient is consistent with the theoretical hypothesis discussed in Section 5.1 that there is a negative relationship between profit efficiency and input prices. Similar results were reported by Ali and Flinn (1989), Abdulai and Huffman (2000), Kolawole (2006), and Shuwu (2006).
The positive and significant effects of the tea growing experience variable on profit efficiency were expected. The reasons are similar to what were discussed in Section 5.2.1 about the positive relationship between profit efficiency and tea growing experience. These results imply that more tea growing experience enables farmers to reduce profit inefficiency. These results are consistent with those of Ali and Flinn (1989), Abdulai and Huffman (2000) and Shuwu (2006). The positive coefficient of the tea growing experience variable also implies that experienced tea farmers are better performers than those without experience (Ali and Byerlee 1991; Sharma, Leung and Zaleski 1997).
The negative effect of distance (from the home to the local market) is probably due to the higher transportation costs incurred. The positive and significant effects of farm size are similar to results reported by Ali and Byerlee (1991), Abdulai and Huffman (2000), and Kolawole (2006). Namely, larger farms enable farmers to take advantage of economies of scale to improve profit (Mathijs and Swinnen 2001).
The negative and significant effects of health-care costs on the profit efficiency of clean tea production suggests that if health-care costs increase, the profit efficiency for clean tea production will decrease. Health-care costs still account for a significant portion of the total expenditure of clean tea producing farms.
5.2.3 Profit efficiency of conventional tea production
Table 10 also shows the results of the profit efficiency estimation for conventional tea production. The coefficient of Lnsigma2_v (random error) was not statistically significant implying the non-significant presence of random factors in conventional tea production in the sample. However, the variance for the profit inefficiency effect (Lnsigma2_u) was statistically significant at the 1% level implying significant inefficiency in conventional tea production in the sample. Among the input price variables, fertilizer and pest control costs had statistically significant effects on profit efficiency. However, the negative signs for the coefficients of these variables imply that as the prices of fertilizer and pesticides increase, profit efficiency will decrease. These results conform to those of Ali and Flinn (1989) and Abdulai and Huffman (2000).
31
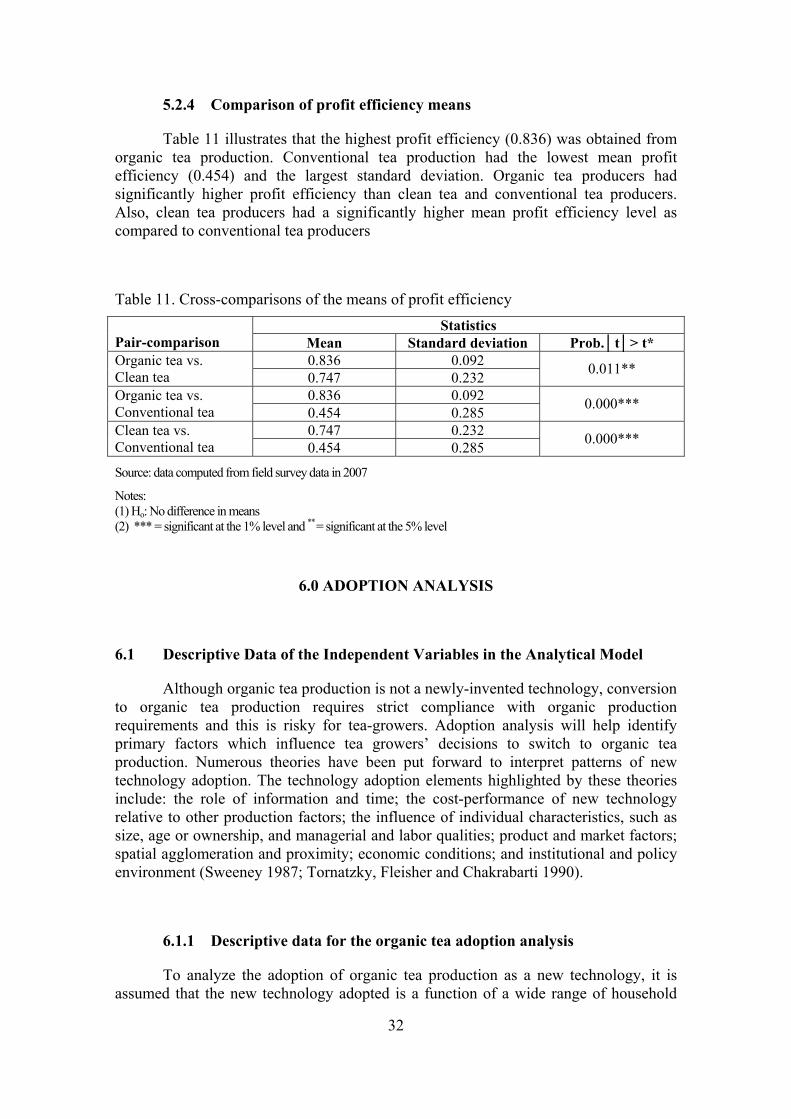
5.2.4 Comparison of profit efficiency means
Table 11 illustrates that the highest profit efficiency (0.836) was obtained from organic tea production. Conventional tea production had the lowest mean profit efficiency (0.454) and the largest standard deviation. Organic tea producers had significantly higher profit efficiency than clean tea and conventional tea producers. Also, clean tea producers had a significantly higher mean profit efficiency level as compared to conventional tea producers
Table 11. Cross-comparisons of the means of profit efficiency Statistics
Pair-comparison Mean Standard deviation Prob.│t│> t* 0.836 0.092 Organic tea vs.
Clean tea 0.747 0.232 0.011**
0.836 0.092 Organic tea vs. Conventional tea 0.454 0.285 0.000***
0.747 0.232 Clean tea vs. Conventional tea 0.454 0.285 0.000***
Source: data computed from field survey data in 2007
Notes: (1) Ho: No difference in means (2) *** = significant at the 1% level and ** = significant at the 5% level
6.0 ADOPTION ANALYSIS
6.1 Descriptive Data of the Independent Variables in the Analytical Model
Although organic tea production is not a newly-invented technology, conversion to organic tea production requires strict compliance with organic production requirements and this is risky for tea-growers. Adoption analysis will help identify primary factors which influence tea growers’ decisions to switch to organic tea production. Numerous theories have been put forward to interpret patterns of new technology adoption. The technology adoption elements highlighted by these theories include: the role of information and time; the cost-performance of new technology relative to other production factors; the influence of individual characteristics, such as size, age or ownership, and managerial and labor qualities; product and market factors; spatial agglomeration and proximity; economic conditions; and institutional and policy environment (Sweeney 1987; Tornatzky, Fleisher and Chakrabarti 1990).
6.1.1 Descriptive data for the organic tea adoption analysis
To analyze the adoption of organic tea production as a new technology, it is assumed that the new technology adopted is a function of a wide range of household
32
characteristics (Mendola 2007). Table 12 shows that there is a statistically significant difference between health-care-related costs for adopters and non-adopters. This suggests that the intensive use of chemicals and pesticides is an environmental and health hazard for non-adopters. The statistical difference in tea yields between adopters and non-adopters verifies the concern about the loss in tea yield in converting to organic production. The premium tea price for organic tea and outside support for organic tea production are statistically very different between adopters and non-adopters suggesting that these two factors are important factors affecting farmers’ decisions to adopt organic tea production.
The capital invested in tea production is significantly higher for adopters than for non-adopters indicating that machinery as a mechanical substitute for chemical inputs influences the decision to adopt organic production. The self-expressed willingness to accept (WTA) the loss in tea yield or profit in order to have a chemical and pesticide-free environment also differed significantly between adopters and non-adopters suggesting that WTA is a good candidate as an explanatory variable in the model. The statistically significant difference in family labor suggests that on average, non-adopters of organic tea production had more family workers per household than the adopter group, although the difference was very small (0.3 labor/household).
Family size, and education level and average age of the household head had mean values that were not statistically different between adopters and non-adopters. Farm size and tea stand age also did not have mean values that differed between adopters and non-adopters. Similarly, irrigation status and distance from the home to the tea farms were not statistically different. Therefore all these variables are not likely to affect the decision to adopt.
Finally, the probability of reduced tea income when switching to organic tea production did not differ significantly between adopters and non-adopters, suggesting that a reduction in the yield of organic tea was expected. In the sample for analyzing the adoption of organic tea, clean tea producers were included in the non-adopter group along with conventional tea producers.
33

Table 12. Characteristics of adopters and non-adopters of organic tea production Variable (1) Adopters Non-Adopters Difference (%)
Observations Farm and household characteristics - Family size (person) - Family labor (≈ # of adult ) - Age (years) - Education - Tea farming experience (yrs) - Health-care costs (‘000 VND/yr) - Farm size (m2) - Tea yield (quintal/ha) - Tea stand (yrs) - Irrigation (=1 irrigated, =2 otherwise) - Capital (‘000 VND) - Distance to tea field Market/institutional characteristics - Tea price (‘000 VND/kg of fresh tea) - WTA (% accepting yield reduction) - Outside support - Probability of reduced income
23 4.1 2.1 43.2 2.3 19.1 725.0 1,545 79.4 15.7 1.2 76,986 1.3 9.2 30.8 1.9 3.9
153 4.3 2.4 45.4 2.1 21.6 1,614.0 3,083 93.8 17.1 1.3 15,534 1.3 6.9 21.7 1.2 4.4
4.9 14.3** 5.1 -8.7 13.1 122.6** 99.5 18.1*** 8.9 8.3 -25.0*** 0 -36.8*** -79.8*** -36***
12.8
Source: computed from field data survey in 2007
Notes: (1) Distance from the home to the tea farm = 1 if < 200m, = 2 if 200-<500m and = 3 if 500m-1,000m and = 4 if > 1,000m; outside support: = 1 if government, = 2 if NGO and = 3 if more than 2 types of support; probability of reduced income measured by score (the lowest = 1 and the highest = 5); and education level of the household head =1 if elementary school, = 2 if middle school, = 3 if high school graduate, and = 4 if higher. (2) *** = statistically significant at the 1% level, ** = statistically significant at the 5% level, and * = statistically significant at the 10% level. (3) One quintal = 100 kg
6.1.2 Descriptive data for the clean tea adoption analysis
In the clean tea production analysis, organic tea producers were excluded, since by definition, they are considered more advanced than clean tea producers in terms of complying with restrictions on using pesticides and chemical inputs. Therefore, here, only clean tea producers and conventional tea producers were compared.
34
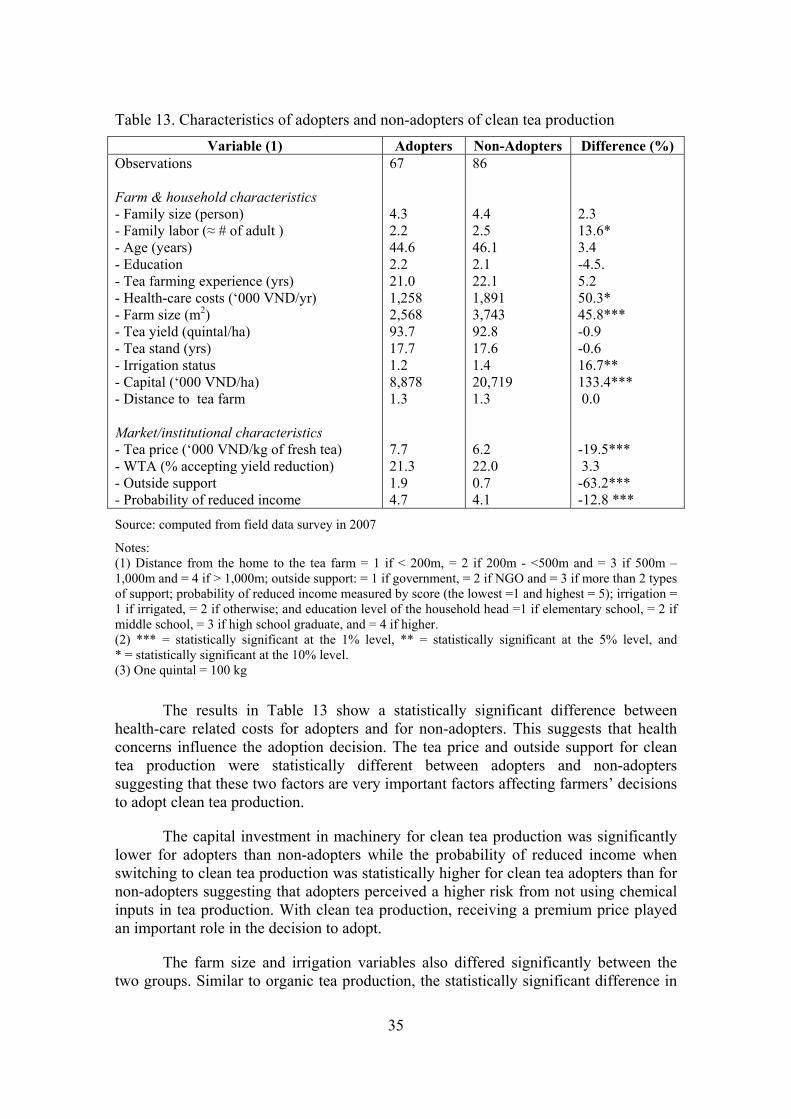
Table 13. Characteristics of adopters and non-adopters of clean tea production Variable (1) Adopters Non-Adopters Difference (%)
Observations Farm & household characteristics - Family size (person) - Family labor (≈ # of adult ) - Age (years) - Education - Tea farming experience (yrs) - Health-care costs (‘000 VND/yr) - Farm size (m2) - Tea yield (quintal/ha) - Tea stand (yrs) - Irrigation status - Capital (‘000 VND/ha) - Distance to tea farm Market/institutional characteristics - Tea price (‘000 VND/kg of fresh tea) - WTA (% accepting yield reduction) - Outside support - Probability of reduced income
67 4.3 2.2 44.6 2.2 21.0 1,258 2,568 93.7 17.7 1.2 8,878 1.3 7.7 21.3 1.9 4.7
86 4.4 2.5 46.1 2.1 22.1 1,891 3,743 92.8 17.6 1.4 20,719 1.3 6.2 22.0 0.7 4.1
2.3 13.6* 3.4 -4.5. 5.2 50.3* 45.8*** -0.9 -0.6 16.7** 133.4*** 0.0 -19.5*** 3.3 -63.2*** -12.8 ***
Source: computed from field data survey in 2007
Notes: (1) Distance from the home to the tea farm = 1 if < 200m, = 2 if 200m - <500m and = 3 if 500m – 1,000m and = 4 if > 1,000m; outside support: = 1 if government, = 2 if NGO and = 3 if more than 2 types of support; probability of reduced income measured by score (the lowest =1 and highest = 5); irrigation = 1 if irrigated, = 2 if otherwise; and education level of the household head =1 if elementary school, = 2 if middle school, = 3 if high school graduate, and = 4 if higher. (2) *** = statistically significant at the 1% level, ** = statistically significant at the 5% level, and * = statistically significant at the 10% level. (3) One quintal = 100 kg
The results in Table 13 show a statistically significant difference between health-care related costs for adopters and for non-adopters. This suggests that health concerns influence the adoption decision. The tea price and outside support for clean tea production were statistically different between adopters and non-adopters suggesting that these two factors are very important factors affecting farmers’ decisions to adopt clean tea production.
The capital investment in machinery for clean tea production was significantly lower for adopters than non-adopters while the probability of reduced income when switching to clean tea production was statistically higher for clean tea adopters than for non-adopters suggesting that adopters perceived a higher risk from not using chemical inputs in tea production. With clean tea production, receiving a premium price played an important role in the decision to adopt.
The farm size and irrigation variables also differed significantly between the two groups. Similar to organic tea production, the statistically significant difference in
35

family labor suggests that on average, non-adopters of clean tea production had more family workers per household than the adopter group, although the difference was very small (0.3 labor/household)
As in organic tea production, family size, and education level and age of the household head did not have mean values that differed significantly between the two groups. Also, there was no difference in tea stand age and tea farming experience between the two groups suggesting that these did not influence the decision to adopt clean tea production.
The results discussed in these two sections provided the basis for selecting the explanatory variables for the empirical models for organic and clean tea production presented next.
6.2 Empirical Adoption Models This study is based on primary data collected from field surveys in Thai Nguyen
Province and literature by Sweeney (1987), Tornatzky, Fleisher and Chakrabarti (1990), and Mendola (2007) to form the adoption model for analysis. The probit model was used for this analysis and the results of the analysis are shown in Table 14.
6.2.1 Empirical adoption model for organic tea production
It is observed from Table 14 that there are positive and statistically significant relationships between the response probability to adopt organic tea production and variables involving the premium price for organic tea, capital invested in machinery for tea production per hectare, tea yield per hectare, outside support and percentage of expressed willingness to accept reduced yields for chemical-free input tea production.
As discussed in Section 6.1.1, the loss in tea yields for organic tea production is the major concern. This suggests that in order to promote the adoption of organic tea production, the development of agricultural technologies that can improve organic tea yields should be considered. As mentioned earlier, mechanization is partly used as a substitute for chemical inputs in organic tea production. Therefore, those who can afford machinery are more likely to adopt. This is in keeping with the earlier finding that capital had a positive relationship with organic tea production efficiency. Since organic tea yields are lower, tea farmers are often hesitant in adopting organic tea production. The higher premium price for organic products is the only economic incentive for adoption. The self-expressed willingness to accept reduced tea yields is an indirect measure of the environmental benefit expected to be gained from organic tea production. Farmers who are strongly in favor of a better environment are more likely to adopt organic methods.
The positive and significant relationship between the response probability to adopt organic tea production and outside support reflects the fact that all 23 organic tea farmers have been receiving outside support from government agencies and non-government organizations (NGOs) in the form of extension services, technical training,
36
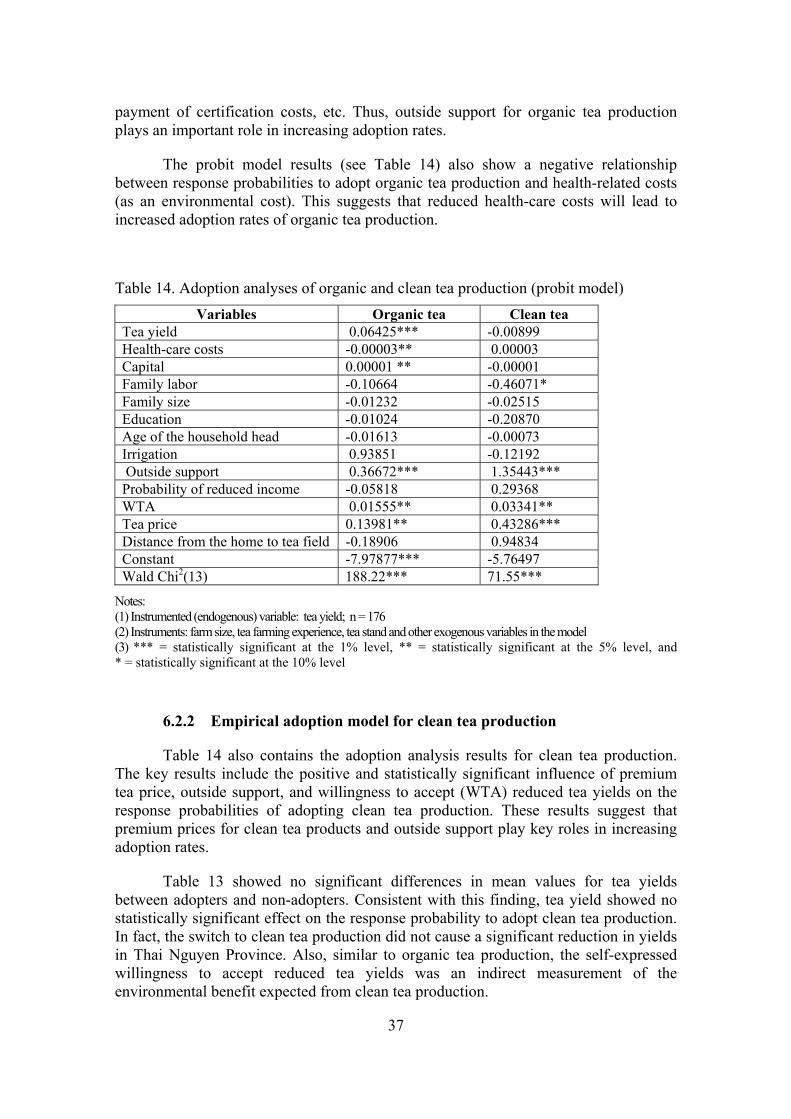
payment of certification costs, etc. Thus, outside support for organic tea production plays an important role in increasing adoption rates.
The probit model results (see Table 14) also show a negative relationship between response probabilities to adopt organic tea production and health-related costs (as an environmental cost). This suggests that reduced health-care costs will lead to increased adoption rates of organic tea production.
Table 14. Adoption analyses of organic and clean tea production (probit model) Variables Organic tea Clean tea
Tea yield 0.06425*** -0.00899 Health-care costs -0.00003** 0.00003 Capital 0.00001 ** -0.00001 Family labor -0.10664 -0.46071* Family size -0.01232 -0.02515 Education -0.01024 -0.20870 Age of the household head -0.01613 -0.00073 Irrigation 0.93851 -0.12192 Outside support 0.36672*** 1.35443*** Probability of reduced income -0.05818 0.29368 WTA 0.01555** 0.03341** Tea price 0.13981** 0.43286*** Distance from the home to tea field -0.18906 0.94834 Constant -7.97877*** -5.76497 Wald Chi2(13) 188.22*** 71.55***
Notes: (1) Instrumented (endogenous) variable: tea yield; n = 176 (2) Instruments: farm size, tea farming experience, tea stand and other exogenous variables in the model (3) *** = statistically significant at the 1% level, ** = statistically significant at the 5% level, and * = statistically significant at the 10% level
6.2.2 Empirical adoption model for clean tea production
Table 14 also contains the adoption analysis results for clean tea production. The key results include the positive and statistically significant influence of premium tea price, outside support, and willingness to accept (WTA) reduced tea yields on the response probabilities of adopting clean tea production. These results suggest that premium prices for clean tea products and outside support play key roles in increasing adoption rates.
Table 13 showed no significant differences in mean values for tea yields between adopters and non-adopters. Consistent with this finding, tea yield showed no statistically significant effect on the response probability to adopt clean tea production. In fact, the switch to clean tea production did not cause a significant reduction in yields in Thai Nguyen Province. Also, similar to organic tea production, the self-expressed willingness to accept reduced tea yields was an indirect measurement of the environmental benefit expected from clean tea production.
37
Farmers who are highly concerned about the environment are more likely to adopt clean tea production as a way to reduce environmental hazards. Although clean tea production does not prohibit tea farmers from using chemical inputs and pesticides, it does promote reduction in pesticide use (through integrated pest management) and appropriate fertilizer application. Therefore, clean tea production does not necessarily require the use of more labor. This is shown by the negative and significant relationship between family labor supply and the probability of adopting clean tea production.
7.0 RISK ANALYSIS
7.1 Risk Analysis and Probability of Adoption
As discussed in Section 6.2.1, there are several major factors that have statistically significant effects on the adoption rate of organic tea production: premium price, tea yield, capital investment in tea production, outside support, WTA, and health-related costs (regarded as environmental costs in this model). Meanwhile, Section 6.2.2 identified four major factors with statistically significant effects on the adoption rate of clean tea production: family labor, the premium price, outside support and WTA. Changes in the premium prices for organic tea and clean tea products and outside support are partly controllable and observable. In order to see what would happen to the adoption rates of organic and clean tea production when these variables were allowed to change, the risk model describing the adoption of organic tea production and clean tea production focused on these two variables.
The objective function for the adoption of organic tea production was taken from Table 14. In equation form, this was written as:
P(y=1׀xi) = ф(-7.979 + 0.0643 yld – 0.00003hcost + 0.00001 capt -0.1066flab – 0.0123fsiz – 0.0102edu – 0.0161age + 0.9385 ir +0.3667 sport - 0.0582 prob + 0.0155WTA + 0.1398 tprice – 0.1891distf (31)
The objective function for the adoption of clean tea production was written as:
P(y=1׀xi) = ф(-5.765 - 0.00889 yld – 0.00003hcost + 0.00001 capt -0.4607flab – 0.0252fsiz – 0.2087edu – 0.0007age + 0.1219 ir +1.3544 sport + 0.2939 prob + 0.0334WTA + 0.4329 tprice + 0.9483distf (32)
where P = the response probability of adopting organic (or clean) tea production,
ф = the standard normal distribution function,
yld = fresh tea yield (quintal/ha),
38

hcost = health-care related costs (thousand VND6),
capt = value of machinery for tea production/ha (thousand VND),
flab = the adults in a family (men),
fsiz = the family size (persons),
edu = the education level of the household head (=1 if elementary school, = 2 if middle school, = 3 if high school graduate, and = 4 for higher .
age = the age of the household head (years),
ir = irrigation status (= 1 if the farm is irrigated and = 2 if not),
sport = outside support (= 1 if from the government, = 2 if from NGO, = 3 if more than 2 types of support, and = 0 if no support),
prob = self-evaluated score for the probability of reduced tea yields or profits when switching to organic tea production (from 1 to 5 where 1 is the lowest),
WTA = the self-expressed willingness to accept reduced tea yields to be free of pesticides and chemicals in the farming environment (%),
tprice = the tea price (thousand VND), and
distf = distance from the home to the tea farm (= 1 if < 200m, = 2 if 200m - <500m, = 3 if 500m – 1,000m and = 4 if > 1,000m).
The simulations were done by using the @RISK 4.5 program to run a total of 100 trials. In these simulations, the variables were valued at their mean values for the sample. As in Section 3.3.2 (Equation 26), if the response probability is less than 0.5 (or y = 0), the probability of adopting organic or clean tea production will be zero.
7.1.1 Changes in the adoption rates when premium pricing is removed
The results illustrated in Figure 2 were simulated by using adoption equations 31 and 32. Tea prices were varied according to the regular tea prices in the market (no premium price for organic tea or clean tea scenarios).
6 The exchange rate from the Vietnam Commercial Bank was 1 USD = 15,966 VND (February 4, 2008).
39

0.0
0.1
0.2
0.3
0.4
0.5
0.6
0.7
0.8
0.9
1.0
0 0.1 0.2 0.3 0.4 0.5 0.6 0.7 0.8 0.9
Response probability to adopt organic/clean tea production
Cum
ulat
ive
prob
abilit
y de
nsity
func
tion
__ Clean tea --- Organic tea
Adoption rate (P ≥0.5) Organic tea = 0.0% Clean tea = 9.8%
Figure 2. Adoption rates of organic and clean tea production without premium pricing
Figure 2 illustrates the cumulative probability density function for clean tea adoption. The clean tea graph shows that holding other production and economic conditions constant, if the premium price for clean tea is removed, the probability of adopting clean tea production will be 9.8% (while it is 0% for organic tea production). The premium price is defined as the tea price that organic tea or clean tea producers receive for their products. It is about 10% higher (than the regular tea price) for clean tea and 30% higher for organic tea. Since the premium price for the clean tea is usually lower than organic tea, removing the premium price has a significant effect on the adoption rate of clean tea production.
7.1.2 Changes in the adoption rates when outside support is removed
Figure 3 shows changes in the response probabilities of adopting organic and clean tea production while holding other socio-economic conditions and premium prices constant and removing only outside support. Without outside support, the response probability of adopting organic tea production is 0.7% while it is 5.5% for clean tea production. This means that if outside support were to be removed, there would be almost no tea farmers switching to organic production while the adoption rate of clean tea production would be very low.
These simulated results reflect the fact that both types of tea production are heavily subsidized by government agencies or NGOs. This is an important
40
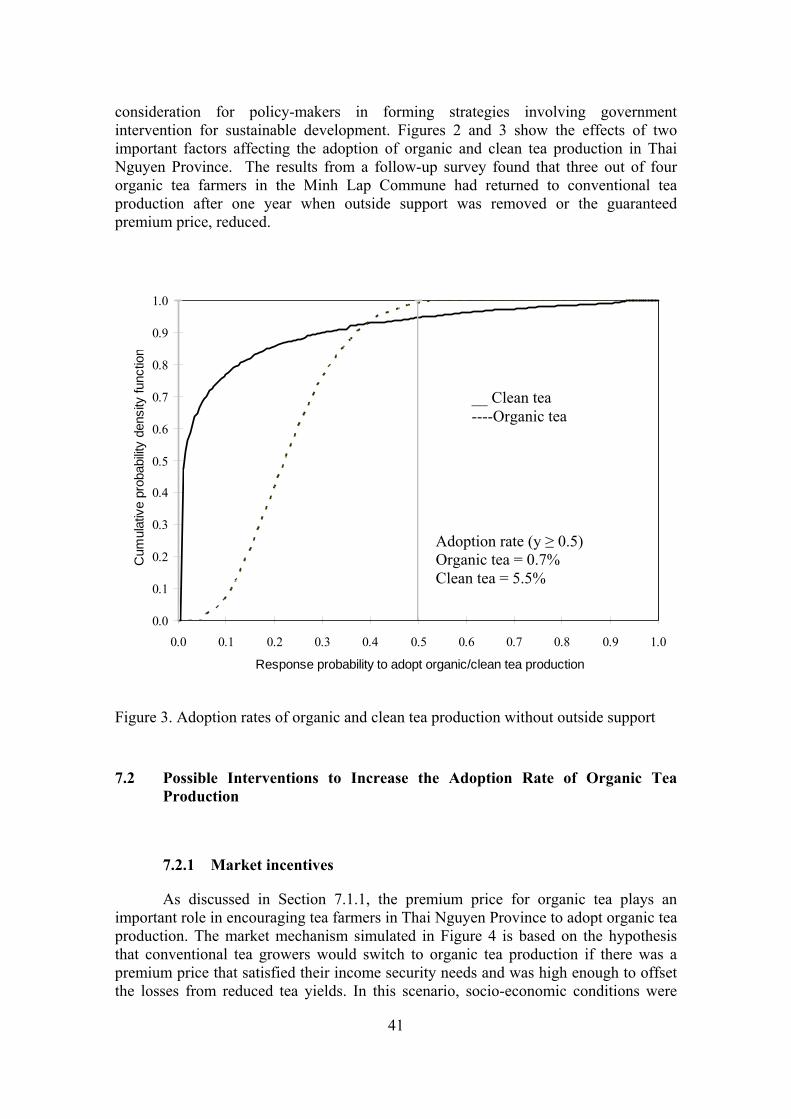
consideration for policy-makers in forming strategies involving government intervention for sustainable development. Figures 2 and 3 show the effects of two important factors affecting the adoption of organic and clean tea production in Thai Nguyen Province. The results from a follow-up survey found that three out of four organic tea farmers in the Minh Lap Commune had returned to conventional tea production after one year when outside support was removed or the guaranteed premium price, reduced.
0.0
0.1
0.2
0.3
0.4
0.5
0.6
0.7
0.8
0.9
1.0
0.0 0.1 0.2 0.3 0.4 0.5 0.6 0.7 0.8 0.9 1.0
Response probability to adopt organic/clean tea production
Cum
ulat
ive
prob
abilit
y de
nsity
func
tion
__ Clean tea ----Organic tea
Adoption rate (y ≥ 0.5) Organic tea = 0.7% Clean tea = 5.5%
Figure 3. Adoption rates of organic and clean tea production without outside support
7.2 Possible Interventions to Increase the Adoption Rate of Organic Tea Production
7.2.1 Market incentives
As discussed in Section 7.1.1, the premium price for organic tea plays an important role in encouraging tea farmers in Thai Nguyen Province to adopt organic tea production. The market mechanism simulated in Figure 4 is based on the hypothesis that conventional tea growers would switch to organic tea production if there was a premium price that satisfied their income security needs and was high enough to offset the losses from reduced tea yields. In this scenario, socio-economic conditions were
41
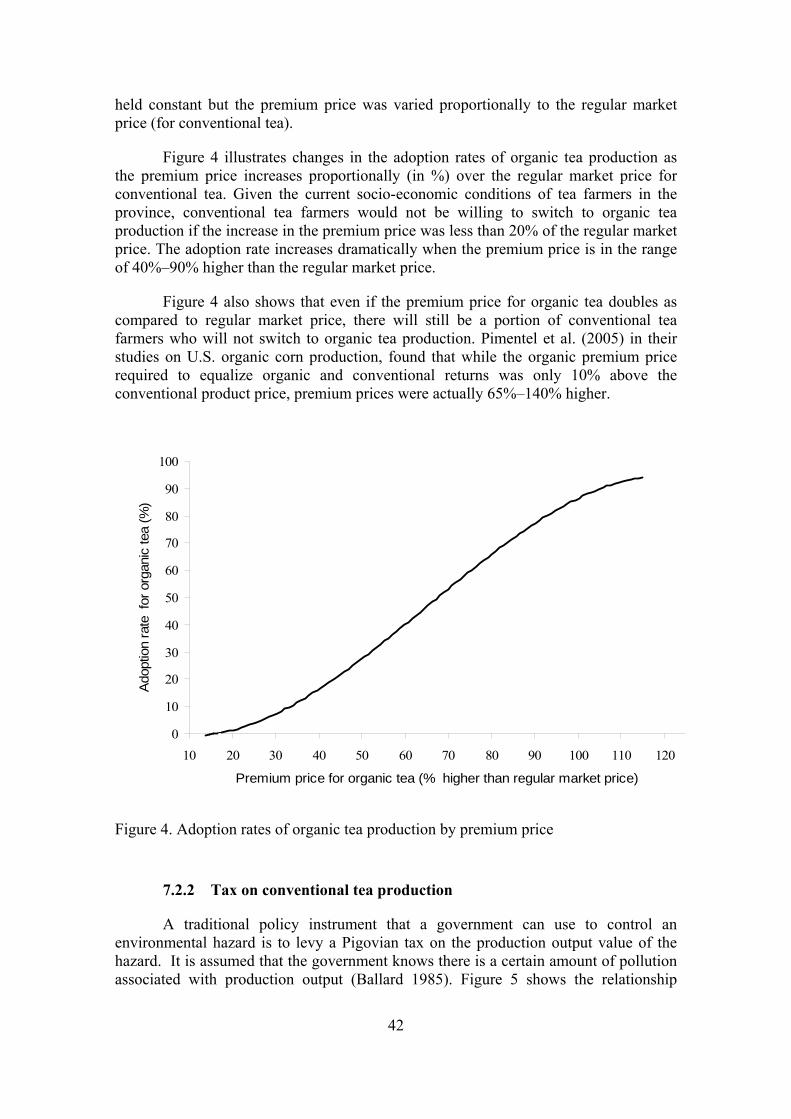
held constant but the premium price was varied proportionally to the regular market price (for conventional tea).
Figure 4 illustrates changes in the adoption rates of organic tea production as the premium price increases proportionally (in %) over the regular market price for conventional tea. Given the current socio-economic conditions of tea farmers in the province, conventional tea farmers would not be willing to switch to organic tea production if the increase in the premium price was less than 20% of the regular market price. The adoption rate increases dramatically when the premium price is in the range of 40%–90% higher than the regular market price.
Figure 4 also shows that even if the premium price for organic tea doubles as compared to regular market price, there will still be a portion of conventional tea farmers who will not switch to organic tea production. Pimentel et al. (2005) in their studies on U.S. organic corn production, found that while the organic premium price required to equalize organic and conventional returns was only 10% above the conventional product price, premium prices were actually 65%–140% higher.
0
10
20
30
40
50
60
70
80
90
100
10 20 30 40 50 60 70 80 90 100 110 120
Premium price for organic tea (% higher than regular market price)
Ado
ptio
n ra
te f
or o
rgan
ic te
a (%
)
Figure 4. Adoption rates of organic tea production by premium price
7.2.2 Tax on conventional tea production
A traditional policy instrument that a government can use to control an environmental hazard is to levy a Pigovian tax on the production output value of the hazard. It is assumed that the government knows there is a certain amount of pollution associated with production output (Ballard 1985). Figure 5 shows the relationship
42
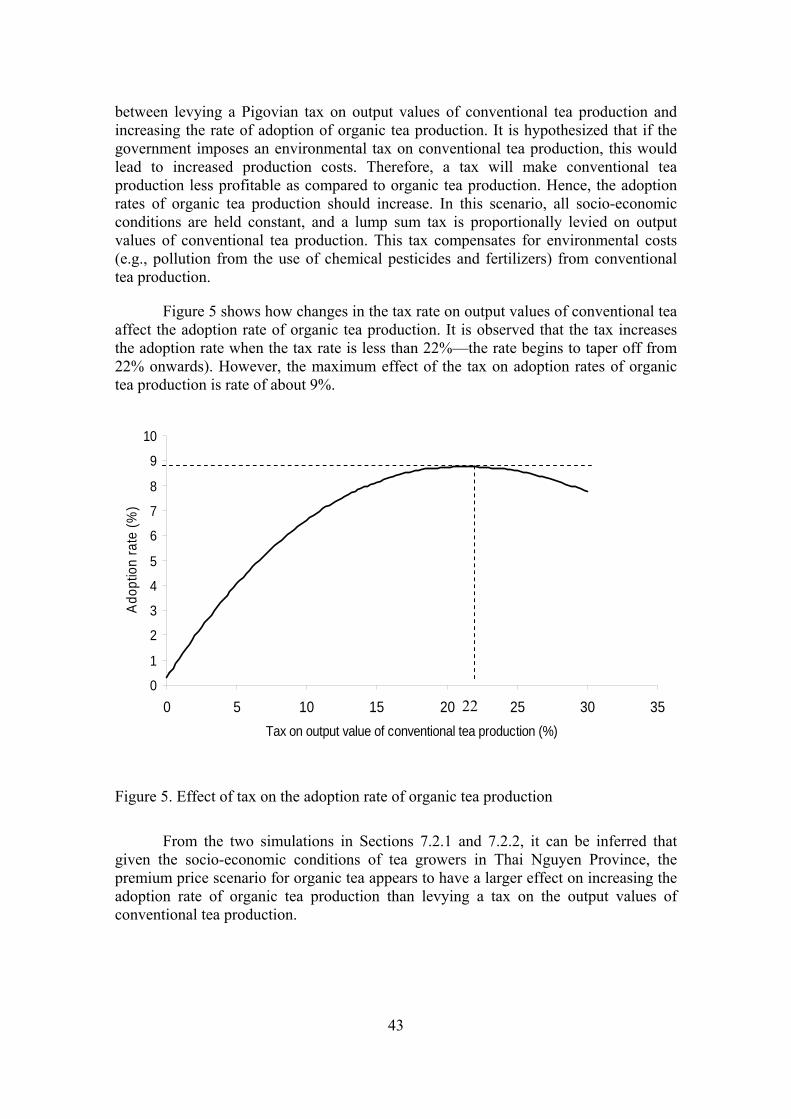
between levying a Pigovian tax on output values of conventional tea production and increasing the rate of adoption of organic tea production. It is hypothesized that if the government imposes an environmental tax on conventional tea production, this would lead to increased production costs. Therefore, a tax will make conventional tea production less profitable as compared to organic tea production. Hence, the adoption rates of organic tea production should increase. In this scenario, all socio-economic conditions are held constant, and a lump sum tax is proportionally levied on output values of conventional tea production. This tax compensates for environmental costs (e.g., pollution from the use of chemical pesticides and fertilizers) from conventional tea production.
Figure 5 shows how changes in the tax rate on output values of conventional tea affect the adoption rate of organic tea production. It is observed that the tax increases the adoption rate when the tax rate is less than 22%—the rate begins to taper off from 22% onwards). However, the maximum effect of the tax on adoption rates of organic tea production is rate of about 9%.
0
1
2
3
4
5
6
7
8
9
10
0 5 10 15 20 25 30 35Tax on output value of conventional tea production (%)
Ado
ptio
n ra
te (%
)
22
Figure 5. Effect of tax on the adoption rate of organic tea production
From the two simulations in Sections 7.2.1 and 7.2.2, it can be inferred that given the socio-economic conditions of tea growers in Thai Nguyen Province, the premium price scenario for organic tea appears to have a larger effect on increasing the adoption rate of organic tea production than levying a tax on the output values of conventional tea production.
43

7.3 Changes in Expected Profits for Different Tea Production Methods
7.3.1 Changes in expected profits for organic tea production
The basic equation used in the profit efficiency analysis for tea production is Equation 24:
π = py – wTx
The profit equation for organic tea production per hectare can be rewritten as:
vπ = py- labcost-fercost-pecost-hercost-hcost-ocost (33)
where vπ = profit for tea production (thousand VND/ha),
p = price of fresh organic tea (thousand VND/kg),
y = fresh tea yield (kg/ha),
labcost = labor expenditure as suggested by Yotopoulos and Lau (1973) (thousand VND/ha),
fercost = fertilizer expenditure (thousand VND/ha),
pecost = expenditure for pest and disease control7 (thousand VND),
hercost = herbicide expenditure (thousand VND/ha),
hcost = expenditure for health-care and hospitalization (thousand VND) as an indirect measure of environmental costs, and
ocost = other costs in thousand VND (fuel, irrigation fees, etc.).
Figure 6 shows the simulations for tea price changes, with and without premium pricing. It can be seen that, given the observed socio-economic conditions of the organic tea farms in Thai Nguyen Province and the current premium price for organic tea (about 30% higher than the regular market price), the probability that organic tea farmers will make a profit of less than 10 million VND/ha is about zero. However, if the premium price is removed, the probability that organic tea farmers will have negative profits is about 30%. In the same scenario, the cumulative probability density function for profit shifts to the left in parallel fashion, and the probability of profit being less than 10 million VND/ha (about 600 USD/ha) increases from zero to 60%. This result is consistent with the observations in Sections 6.2.1 and 7.1.1 that premium pricing creates an economic incentive for farmers to switch to organic tea production.
7 Since pesticides are not allowed in organic tea production, for convenience in calculations and analyses, the total expenditure for pest and disease control was used to replace pesticide costs.
44

0.0
0.1
0.2
0.3
0.4
0.5
0.6
0.7
0.8
0.9
1.0
-40 -20 0 20 40 60 80 100 120 140
Profit (million VND)
Cum
ulat
ive
prob
abili
ty d
ensi
ty fu
nctio
n
____With premium price ------ Without premium price
Figure 6. Profits for organic tea production with and without premium pricing
7.3.2 Changes in expected profits for clean tea production
The profit equation for clean tea production per hectare used was:
vπ = py- labcost-fercost-pecost-hercost-hcost-ocost (34)
where the definitions are the same as for organic tea production in Section 7.3.1, except that the tea involved here is clean tea.
Similar to the results from the analysis in Section 7.1.1, Figure 7 shows that, given the observed socio-economic conditions for clean tea farms, if there is no premium price for clean tea products, then the probability of making a loss is about 30%, similar to organic production. However, the probability of profits being less than 10 million VND increases by 39% (from 20% to 59%). This effect is less severe in comparison to the effect of removing the premium price on organic tea production (where the probability of profit being less than 10 million VND increased by 60%). This result implies that removing the premium price will produce higher risks for organic tea producers than for clean tea producers.
45
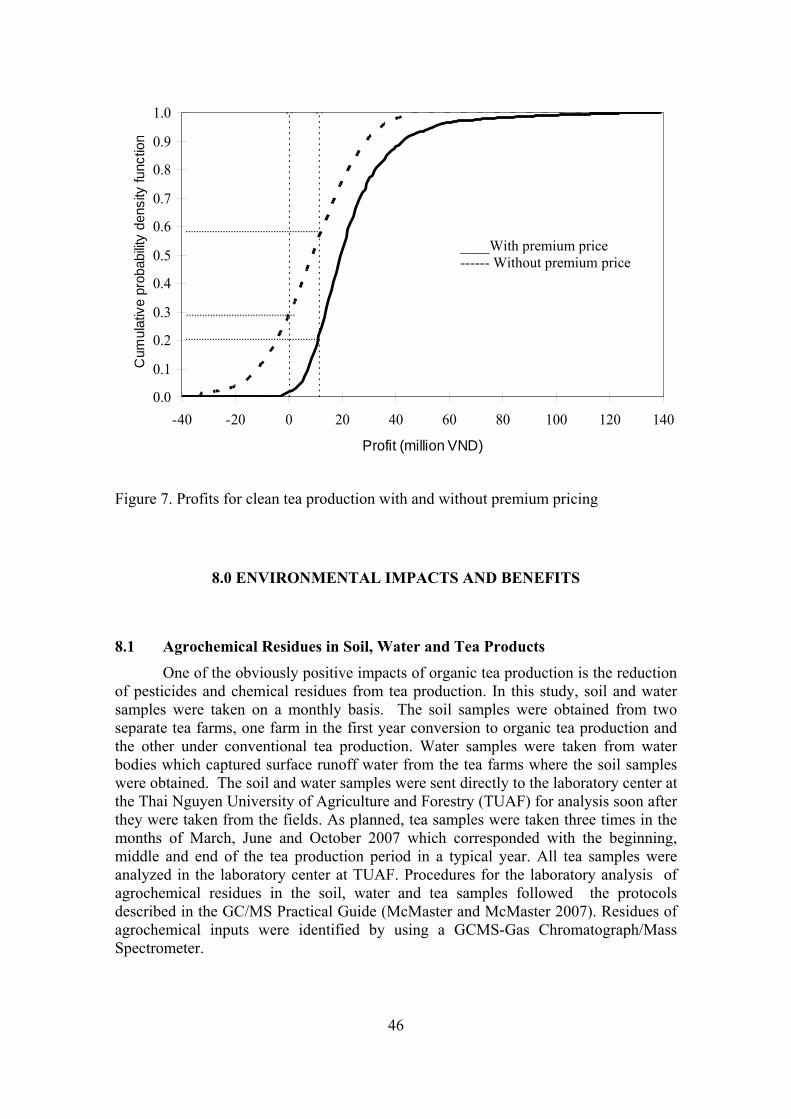
0.0
0.1
0.2
0.3
0.4
0.5
0.6
0.7
0.8
0.9
1.0
-40 -20 0 20 40 60 80 100 120 140
Profit (million VND)
Cum
ulat
ive
prob
abilit
y de
nsity
func
tion
____With premium price ------ Without premium price
Figure 7. Profits for clean tea production with and without premium pricing
8.0 ENVIRONMENTAL IMPACTS AND BENEFITS
8.1 Agrochemical Residues in Soil, Water and Tea Products One of the obviously positive impacts of organic tea production is the reduction
of pesticides and chemical residues from tea production. In this study, soil and water samples were taken on a monthly basis. The soil samples were obtained from two separate tea farms, one farm in the first year conversion to organic tea production and the other under conventional tea production. Water samples were taken from water bodies which captured surface runoff water from the tea farms where the soil samples were obtained. The soil and water samples were sent directly to the laboratory center at the Thai Nguyen University of Agriculture and Forestry (TUAF) for analysis soon after they were taken from the fields. As planned, tea samples were taken three times in the months of March, June and October 2007 which corresponded with the beginning, middle and end of the tea production period in a typical year. All tea samples were analyzed in the laboratory center at TUAF. Procedures for the laboratory analysis of agrochemical residues in the soil, water and tea samples followed the protocols described in the GC/MS Practical Guide (McMaster and McMaster 2007). Residues of agrochemical inputs were identified by using a GCMS-Gas Chromatograph/Mass Spectrometer.
46

8.1.1 Agrochemical residues in the soil
One reason for converting to organic tea production is to improve the quality of the environment by eliminating synthetic agrochemical residues in it. Soil samples from an organic tea farm and a conventional tea farm nearing the end of its transition period (at least two years as required by the Vietnamese Tea Association) are expected to be free of synthetic agrochemical residues. The laboratory analysis of the soil samples revealed changes in pesticide residues in the soil for two different farming practices; organic tea production and conventional tea production, over an eight-month period (from March to October 2007) in the Tan Cuong Commune of Thai Nguyen Province (Table 15).
Table 15. Agrochemical residues in tea-cultivated soil in Tan Cuong Commune Residue concentration level (ppb) March October Common name of
pesticide Health hazard
ratinga
Conv’l Organic Conv’l Organic 2,5 Dichloraniline Toxic, 3 6.8 7.8 4.3 2.0 2,3 Dichloraniline Toxic, 3 6.2 6.0 5.7 2.0 Propanil Moderate 0.0 2.3 0.0 0.0 Fenobucarb Moderate 2.0 0.0 0.0 0.0 Diocacarb High 0.0 0.0 1.0 0.0
Notes: (1) a: Health hazard rating according to European Union Commission Directive 2001/59/EC. (2) Conv’l = samples taken from a conventional tea farm
Table 15 indicates a significant reduction in agrochemical residues in the soil during the first year of an organic tea farm, although after more than eight months of conversion, some traces of toxic chemicals were still found in the soil (see the trends plotted in Appendix 2). It will take time for chemical elements that are strongly tied to the soil structure to be completely removed or to leach into the deeper layers.
8.1.2 Agrochemical residues in the water
A water sample analysis was conducted for both the conventional and organic farms by taking water samples from water bodies (namely, ponds) on the farms. The results, presented in Table 16, show an obvious improvement in water quality in the organic tea farm. Almost all of the toxic agrochemical residues found in the first month of the production season (March) were not found at the end of the production season (October). While there were different toxic agrochemical residues present in water samples taken from the conventional tea farm at the end of the production period (October), only a trace of carbetamide was found in the water samples taken from the organic farm. This observation suggests that chemical residues stay longer in the soil than in water bodies like lakes, streams and rivers. Unlike soil, where chemical components are strongly absorbed by soil structural adhesives, chemicals in water can
47

be easily diluted and transported out of water bodies (for details, please see Appendix 2).
Table 16. Agrochemical residues in water samples from tea farms in Tan Cuong Commune
Residue concentration level (ppb)
March October Common name of
pesticide Health hazard
ratinga
Conv’l Organic Conv’l Organic Chloroneb Slight 4.0 4.0 0.0 0.0 Fenobucarb Moderate 1.0 9.0 0.0 0.0 2,5 Dichloranilin Toxic, 3 0.0 7.0 2.1 0.0 2,3 Dichloranilin Toxic, 3 0.0 7.0 3.0 0.0 Carbetamide Moderate 0.0 9.0 4.2 1.0 Dimethipin Very slight 2.0 0.0 1.0 0.0 Bifenox Moderate 2.0 0.0 0.0 0.0
Notes: (1) a: Health hazard rating according to European Union Commission Directive 2001/59/EC. (2) Conv’l = samples taken from a conventional tea farm
8.1.3 Agrochemical residues in tea samples
Tea samples were taken and tested from the same conventional and organic farms as in 8.1.1 and 8.1.2 in March and October 2007. The results of the analysis, shown in Table 17, indicates that while two toxic chemical residues in the tea samples taken from the conventional tea farm (2,5 Dichloranilin. 2,3 Dichloranilin) were found in both samples in March and October, their quantities were significantly reduced in the October sample. In the case of organic tea samples, these two chemicals were not found in the October 2007 sample at all.
Table 17 also shows that there was still the presence of carbetamide in the organic tea sample in October. Probably, this chemical remained in the deeper layers of the soil. In the case of the samples taken from the conventional farm, there were less carbetamide residues in the October sample as compared to the March sample. A plausible reason for this is the advent of cooler weather in October reduces the presence of pests on tea farms and necessitates less use of pesticides (Do and Le 2000).
The results of the analyses in this section illustrate that after eight months of conversion to organic tea production, agrochemical residues in the soil were significantly reduced while they were almost completely eliminated from water bodies and tea products.
48

Table 17. Agrochemical residues in tea products from Tan Cuong Commune
Concentration in tea product (ppb)
March October Common name of
pesticide Health hazard
ratinga
Conv’l Organic Conv’l Organic 2,5 Dichloranilin Toxic, 3 8.7 5.4 3.0 0.0 2,3 Dichloranilin Toxic, 3 7.4 4.6 2.1 0.0 Carbetamide Moderate 6.0 3.0 4.2 1.0 Propanil Toxic, 3 5.0 0.0 0.0 0.0
Notes: (1) a: Health hazard rating according to European Union Commission Directive 2001/59/EC. (2) Conv’l = samples taken from a conventional tea farm
8.2 Cost-benefit Analysis of Alternative Tea Production Systems
As discussed in Section 2.5, there is an important distinction to be made between private and social costs (benefits). Coase (1960, p.7) argued that “the private product is the value of the additional product resulting from a particular activity of a business. The social product equals the private product minus the fall in the value of production elsewhere for which no compensation is paid”. In calculating the net present value (NPV) of returns from switching from conventional tea production to organic or clean tea production, a distinction must be made between private and public benefits and costs. This distinction will provide information on how different tea production methods determine benefits or costs under both private and social perspectives. As a profit maximizer, the individual tea producer is primarily interested in private NPV whereas social planners are more likely to be interested in social NPV.
Helfert (2003) and Pearce, Atkinson and Mourato (2006) discuss the time-horizon (i.e., how far into the future impacts would be estimated) and the importance of this concept when applying CBA to assess a project or an investment. In this research, two time periods were used to estimate both private and social NPVs of three tea production methods—organic, clean and conventional8. A short-run analysis (for a five-year period) was used to compare the private and social NPVs of the different tea production methods during the transition period from conventional to organic tea production. According to Helfert (2003) and Pearce, Atkinson and Mourato (2006), the time-horizon is determined by the physical or economic life of an investment. Although tea has an economic life of 100 years, it has a sub-economic cycle of 30 years9 (Do
8 Although clean and conventional tea production do not need a transition period, we had to include them in the both the short and long-term analyses in order to make the private and social NPVs of the three production methods comparable. 9 A sub-economic cycle here means that every 30 years, tea plants reach a very low yield and need to be cut close to the base so that new, young shoots will grow for the next harvest.
49
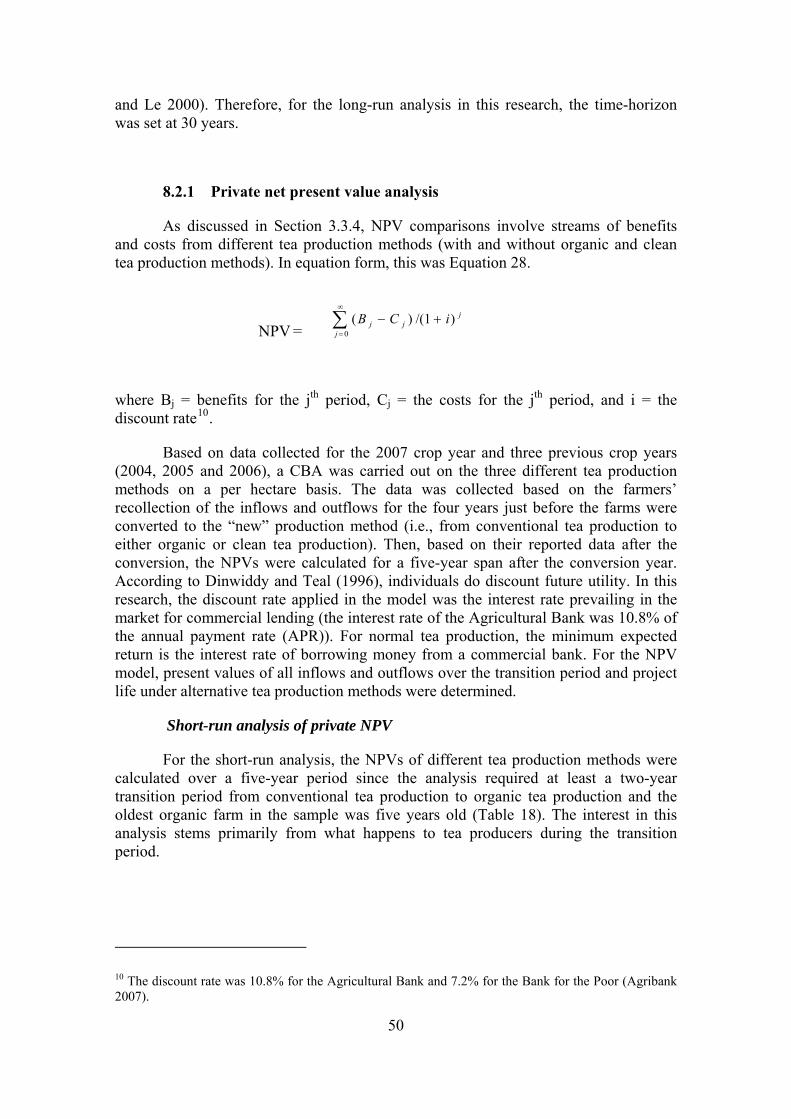
and Le 2000). Therefore, for the long-run analysis in this research, the time-horizon was set at 30 years.
8.2.1 Private net present value analysis
As discussed in Section 3.3.4, NPV comparisons involve streams of benefits and costs from different tea production methods (with and without organic and clean tea production methods). In equation form, this was Equation 28.
j
jj
j iCB )1/()(0
+−∑∞
= NPV =
where Bj = benefits for the jth period, Cj = the costs for the jth period, and i = the discount rate10.
Based on data collected for the 2007 crop year and three previous crop years (2004, 2005 and 2006), a CBA was carried out on the three different tea production methods on a per hectare basis. The data was collected based on the farmers’ recollection of the inflows and outflows for the four years just before the farms were converted to the “new” production method (i.e., from conventional tea production to either organic or clean tea production). Then, based on their reported data after the conversion, the NPVs were calculated for a five-year span after the conversion year. According to Dinwiddy and Teal (1996), individuals do discount future utility. In this research, the discount rate applied in the model was the interest rate prevailing in the market for commercial lending (the interest rate of the Agricultural Bank was 10.8% of the annual payment rate (APR)). For normal tea production, the minimum expected return is the interest rate of borrowing money from a commercial bank. For the NPV model, present values of all inflows and outflows over the transition period and project life under alternative tea production methods were determined.
Short-run analysis of private NPV
For the short-run analysis, the NPVs of different tea production methods were calculated over a five-year period since the analysis required at least a two-year transition period from conventional tea production to organic tea production and the oldest organic farm in the sample was five years old (Table 18). The interest in this analysis stems primarily from what happens to tea producers during the transition period.
10 The discount rate was 10.8% for the Agricultural Bank and 7.2% for the Bank for the Poor (Agribank 2007).
50
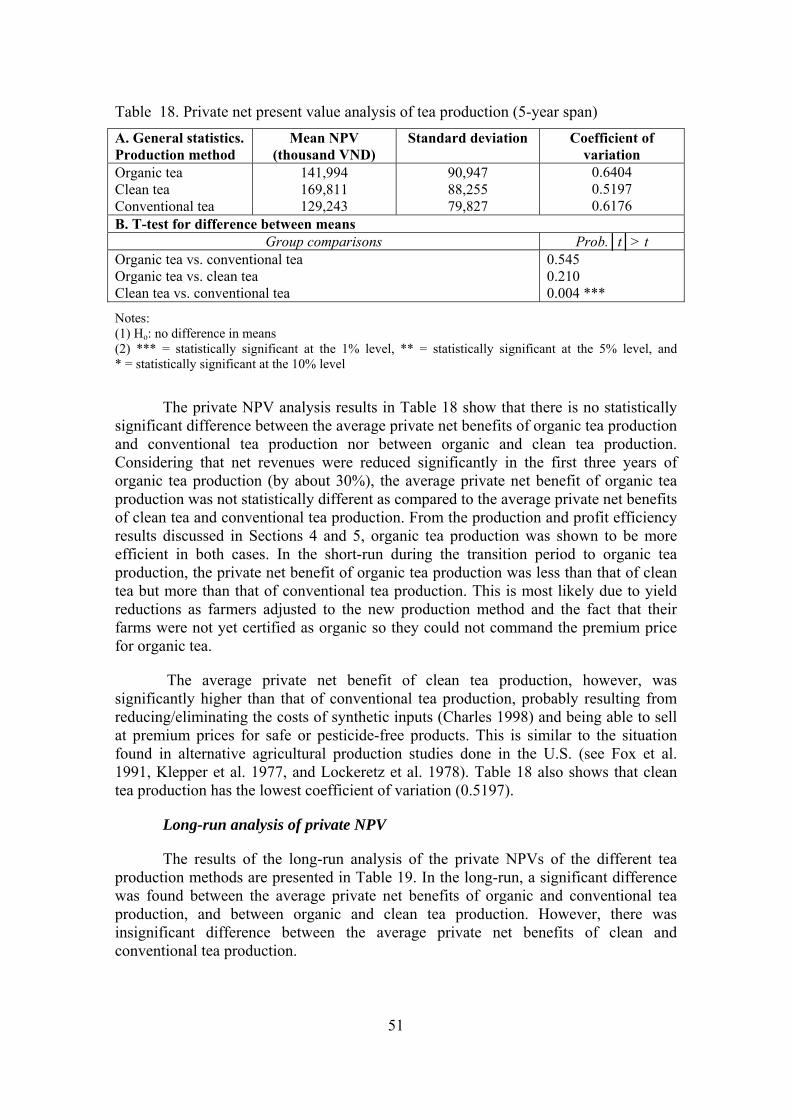
Table 18. Private net present value analysis of tea production (5-year span) A. General statistics. Production method
Mean NPV (thousand VND)
Standard deviation
Coefficient of variation
Organic tea Clean tea Conventional tea
141,994 169,811 129,243
90,947 88,255 79,827
0.6404 0.5197 0.6176
B. T-test for difference between means Group comparisons Prob.│t│> t
Organic tea vs. conventional tea Organic tea vs. clean tea Clean tea vs. conventional tea
0.545 0.210 0.004 ***
Notes: (1) Ho: no difference in means (2) *** = statistically significant at the 1% level, ** = statistically significant at the 5% level, and * = statistically significant at the 10% level
The private NPV analysis results in Table 18 show that there is no statistically significant difference between the average private net benefits of organic tea production and conventional tea production nor between organic and clean tea production. Considering that net revenues were reduced significantly in the first three years of organic tea production (by about 30%), the average private net benefit of organic tea production was not statistically different as compared to the average private net benefits of clean tea and conventional tea production. From the production and profit efficiency results discussed in Sections 4 and 5, organic tea production was shown to be more efficient in both cases. In the short-run during the transition period to organic tea production, the private net benefit of organic tea production was less than that of clean tea but more than that of conventional tea production. This is most likely due to yield reductions as farmers adjusted to the new production method and the fact that their farms were not yet certified as organic so they could not command the premium price for organic tea.
The average private net benefit of clean tea production, however, was significantly higher than that of conventional tea production, probably resulting from reducing/eliminating the costs of synthetic inputs (Charles 1998) and being able to sell at premium prices for safe or pesticide-free products. This is similar to the situation found in alternative agricultural production studies done in the U.S. (see Fox et al. 1991, Klepper et al. 1977, and Lockeretz et al. 1978). Table 18 also shows that clean tea production has the lowest coefficient of variation (0.5197).
Long-run analysis of private NPV
The results of the long-run analysis of the private NPVs of the different tea production methods are presented in Table 19. In the long-run, a significant difference was found between the average private net benefits of organic and conventional tea production, and between organic and clean tea production. However, there was insignificant difference between the average private net benefits of clean and conventional tea production.
51
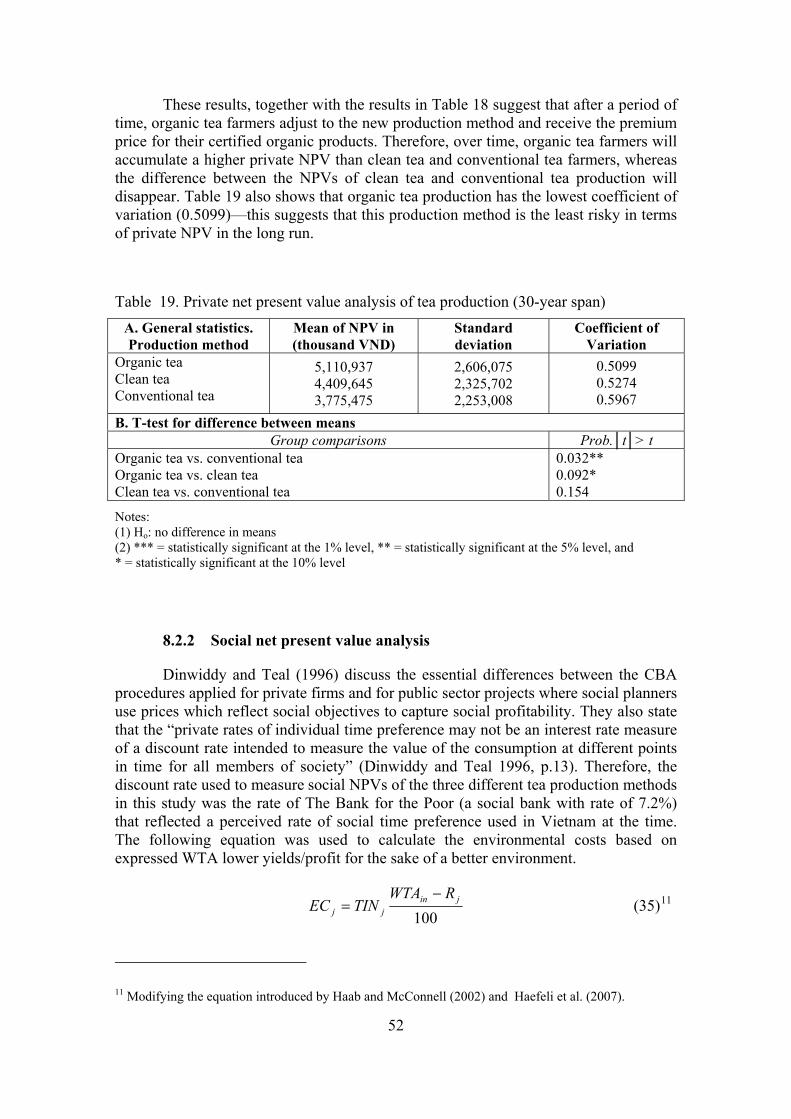
These results, together with the results in Table 18 suggest that after a period of time, organic tea farmers adjust to the new production method and receive the premium price for their certified organic products. Therefore, over time, organic tea farmers will accumulate a higher private NPV than clean tea and conventional tea farmers, whereas the difference between the NPVs of clean tea and conventional tea production will disappear. Table 19 also shows that organic tea production has the lowest coefficient of variation (0.5099)—this suggests that this production method is the least risky in terms of private NPV in the long run.
Table 19. Private net present value analysis of tea production (30-year span) A. General statistics. Production method
Mean of NPV in (thousand VND)
Standard deviation
Coefficient of Variation
Organic tea Clean tea Conventional tea
5,110,937 4,409,645 3,775,475
2,606,075 2,325,702 2,253,008
0.5099 0.5274 0.5967
B. T-test for difference between means Group comparisons Prob.│t│> t
Organic tea vs. conventional tea Organic tea vs. clean tea Clean tea vs. conventional tea
0.032** 0.092* 0.154
Notes: (1) Ho: no difference in means (2) *** = statistically significant at the 1% level, ** = statistically significant at the 5% level, and * = statistically significant at the 10% level
8.2.2 Social net present value analysis
Dinwiddy and Teal (1996) discuss the essential differences between the CBA procedures applied for private firms and for public sector projects where social planners use prices which reflect social objectives to capture social profitability. They also state that the “private rates of individual time preference may not be an interest rate measure of a discount rate intended to measure the value of the consumption at different points in time for all members of society” (Dinwiddy and Teal 1996, p.13). Therefore, the discount rate used to measure social NPVs of the three different tea production methods in this study was the rate of The Bank for the Poor (a social bank with rate of 7.2%) that reflected a perceived rate of social time preference used in Vietnam at the time. The following equation was used to calculate the environmental costs based on expressed WTA lower yields/profit for the sake of a better environment.
100
jinjj
RWTATINEC
−= (35)11
11 Modifying the equation introduced by Haab and McConnell (2002) and Haefeli et al. (2007).
52

where, ECj = the estimated environmental cost (thousand VND) paid by the jth farm, TINj = the income from tea production from the jth farm, WTAin
12 = the average willingness to accept a reduction in income to have a “safe” environment in (%), and Rj = the actual stated reduction in income (in %) when switching to the new production method. Health-care costs were also included as a part of environmental costs in this calculation.
Short-run analysis of social NPV
The results showed that organic and clean tea production had significantly higher average social net benefits than conventional tea production in the short-run of five years (Table 20). There was no significant difference, however, between the social NPVs of organic tea and clean tea production. One explanation is that by reducing the use of pesticides and chemical inputs, clean tea production produces less negative externalities to the environment in the short run. Therefore, clean tea producers pay lower environmental costs while the tea yield for clean tea is not affected by the reduction in pesticide use (because clean tea farmers still can use pesticides if other pest control measures do not work to maintain their tea yields). Also, the results suggest that clean tea production is a viable intermediate tea production method as farmers switch from conventional tea to organic tea production.
Table 20. Social net present value analysis of tea production (5-year span) A. General statistics.Production method
Mean of NPV (thousand VND) Standard deviation
Coefficient of Variation
Organic tea Clean tea Conventional tea
141,520 110,561 44,730
89920 77650 64042
0.63538 0.7023 1.4317
B. T-test for difference between means Group comparisons Prob.│t│> t
Organic tea vs. conventional tea Organic tea vs. clean tea Clean tea vs. conventional tea
0.000*** 0.149 0.000***
Notes: (1) Ho: no difference in means (2) *** = statistically significant at the 1% level, ** = statistically significant at the 5% level, and * = statistically significant at the 10% level
12 Average WTA is considered as socially accepted WTA (environmental cost) in the surveyed area (see Haab and McConnell 2002).
53
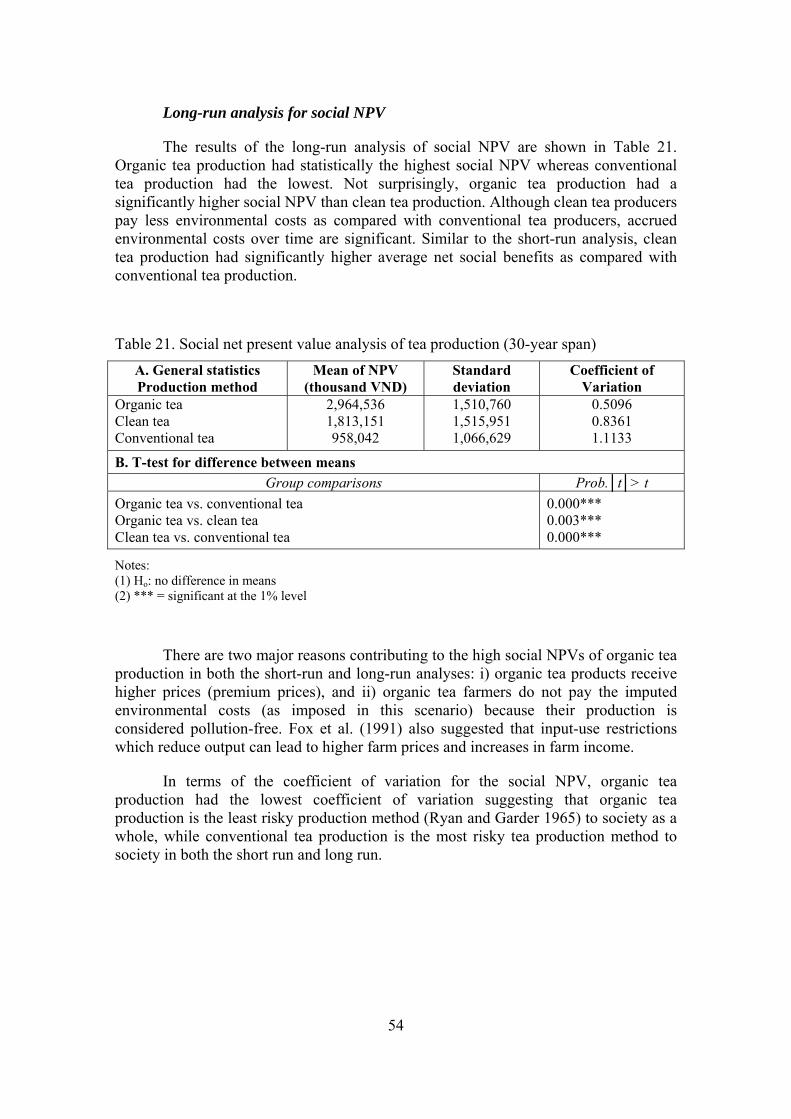
Long-run analysis for social NPV
The results of the long-run analysis of social NPV are shown in Table 21. Organic tea production had statistically the highest social NPV whereas conventional tea production had the lowest. Not surprisingly, organic tea production had a significantly higher social NPV than clean tea production. Although clean tea producers pay less environmental costs as compared with conventional tea producers, accrued environmental costs over time are significant. Similar to the short-run analysis, clean tea production had significantly higher average net social benefits as compared with conventional tea production.
Table 21. Social net present value analysis of tea production (30-year span) A. General statistics Production method
Mean of NPV (thousand VND)
Standard deviation
Coefficient of Variation
Organic tea Clean tea Conventional tea
2,964,536 1,813,151 958,042
1,510,760 1,515,951 1,066,629
0.5096 0.8361 1.1133
B. T-test for difference between means Group comparisons Prob.│t│> t
Organic tea vs. conventional tea Organic tea vs. clean tea Clean tea vs. conventional tea
0.000*** 0.003*** 0.000***
Notes: (1) Ho: no difference in means (2) *** = significant at the 1% level
There are two major reasons contributing to the high social NPVs of organic tea production in both the short-run and long-run analyses: i) organic tea products receive higher prices (premium prices), and ii) organic tea farmers do not pay the imputed environmental costs (as imposed in this scenario) because their production is considered pollution-free. Fox et al. (1991) also suggested that input-use restrictions which reduce output can lead to higher farm prices and increases in farm income.
In terms of the coefficient of variation for the social NPV, organic tea production had the lowest coefficient of variation suggesting that organic tea production is the least risky production method (Ryan and Garder 1965) to society as a whole, while conventional tea production is the most risky tea production method to society in both the short run and long run.
54
9.0 CONCLUSIONS AND POLICY IMPLICATIONS
9.1 Conclusions
9.1.1 Efficiency analysis
Production efficiency
Organic tea farmers are very production efficient farmers (Table 6). For the sampled organic tea farms, labor, family size, tea stand and capital had significant and positive effects on tea production efficiency. For clean tea production, two production factors, pesticide use and tea stand, had a significant effect on the production efficiency of clean tea production as did family size, an inefficiency factor.
The highest mean production efficiency was obtained from organic tea production while conventional tea production had the lowest mean production efficiency (Table 7). There was no statistically significant difference in the average production efficiency levels between clean tea production and conventional tea production.
Profit efficiency
Organic tea farmers were not only highly production efficient but also very profit efficient (Table 10). Factors having significant effects on profit efficiency for organic tea farms included pest control costs and tea growing experience. Pest control costs (non-chemical alternatives for organic tea production) had a significant and negative effect on profit efficiency indicating that pest control was a major concern in organic tea production. Meanwhile, tea growing experience had a significant and positive effect on profit efficiency for organic tea production indicating that more experienced farmers had higher profit efficiency.
Fertilizer prices, health-care related costs and distance to the local market were significant and negatively related to profit efficiency for clean tea production while other input costs (labor, pesticide, and other costs) did not have significant effects. Farm size had a significant and positive effect on profit efficiency for clean tea production.
The highest mean profit efficiency was obtained from organic tea production while conventional tea production had the lowest mean profit efficiency (Table 11). The mean profit efficiency for clean tea production was also statistically higher than for conventional tea production.
55
9.1.2 Adoption analysis
There were statistically significant and positive relationships between the probability of adopting organic tea production and the following variables: tea yield, the premium price for organic tea products, the value of capital investment in tea production, WTA and outside support. There was a significant and negative relationship between the probability of adopting organic tea production and health related costs. Table 14 refers.
For clean tea production, the premium price, outside support and WTA were positive and statistically significant variables explaining the adoption rates of clean tea production. Unlike organic tea production, tea yield did not have a significant effect on farmers’ decisions on whether or not to adopt clean tea production.
9.1.3 Risk analysis
Risks of adoption
The results of the risk analysis showed that the probability of adopting organic tea production was very sensitive to the premium price for organic tea products and outside support for organic tea production (Figures 2, 3 and 4). Without the premium price, the probability of adopting organic tea production would be zero and without outside support, the probability of adopting organic tea production would be only about 0.7%. The premium price should be at least 20% higher than the regular market price for conventional tea to entice farmers to switch to organic farming and it appears to be the most effective in the range from 40%-90% above the regular market price.
A Pigovian tax on output values of conventional tea production would also increase the adoption rates of organic tea production. However, the magnitude of the effect is limited to a maximum of a 9% increase in adoption rates of organic tea production (Figure 5). Also, the Pigovian tax only has the effect of increasing organic tea adoption rates when the tax is less than 22% of the output values of conventional tea production.
The probability of adopting clean tea production is also sensitive to premium pricing and outside support. Without the premium price, the probability of adopting clean tea production would be about 10%, whereas without outside support, the probability of adopting clean tea production would be 5.5% (Figures 2 and 3).
Risks and profits in tea production
Given the observed socio-economic conditions of organic tea farms in Thai Nguyen Province at the time of the survey, by removing the premium price for the organic tea product, the probability that organic tea farmers will incur a negative profit or economic loss will be about 30% while the probability of profits being less than 10 million VND/ha (about $600/ha) will increase by 60% (Figure 6).
56
As for the clean tea farms, if there is no premium price for clean tea products, then, the probability of having negative profits or losses is about 30%. However, the probability of profits being less than 10 million VND increases by 39% (from 20% to 59%—see Figure 7). The effect of removing the premium price on profit reduction is thus less severe for clean tea production than for organic tea production because clean tea receives a lower premium price than organic tea (currently the premium prices are about 10% and 30% higher than the regular market prices for clean and organic tea products respectively).
9.1.4 Agrochemical residues
There was found to be a significant reduction in agrochemical residues in the soil after eight months of organic tea production. However, traces of some toxic chemicals still remained in the soil samples. While there were significant findings of toxic pesticide residues in the water samples taken from the conventional tea farm, hardly any of these toxic chemicals were found in the water samples from the organic farm at the end of the growing season in October, 2007, except for traces of carbetamide. This was also true for the tea product samples. However, at least three toxic chemicals were still found in the tea product samples taken from the conventional farm in October, 2007 (Tables 15, 16 and 17).
9.1.5 Cost-benefit Analysis
Private NPV
In the analysis over a five-year period (Table 18), there was no statistically significant difference between the private net benefits of organic tea production and clean tea production, and between organic tea production and conventional tea production. However, the private NPV of clean tea production was significantly higher than that of conventional tea production. On the other hand, the private NPVs were significantly higher than the social net benefits of the clean tea and conventional tea production methods but not organic tea production in the short-run analysis (Table 20).
For the 30-year period (Table 19), the private NPV of organic tea production was significantly higher than the NPVs of clean tea and conventional tea production. However, the private NPV of clean tea production was not significantly different from conventional tea production in the long run.
Social NPV
Both organic and clean tea production had statistically significant higher social NPVs as compared to conventional tea production (Table 20). However, there was insignificant difference between the social NPVs of organic tea production and clean tea production in the short-run analysis.
57
In the long-run analysis (Table 21), organic tea production had statistically, the highest social NPV among the three production methods tested. Also, clean tea production had a significantly higher social NPV than conventional tea production.
9.1.6 Overall results
Novick and Marr (2001) suggested using the ranking technique as a prioritization method to rank interventions. For this technique, each intervention is ranked based on a set of criteria and the overall score for each intervention is calculated by summing the score (rank) received for each criterion. The lowest summed score is judged to be the best (i.e., a “1” is assigned if ranked first, a “2” is assigned if ranked second, and so on).
The overall results for this analytical framework are shown in Table 22 which applies Novick and Marr’s ranking technique. For the production efficiency criterion, organic tea production is ranked as being first (receiving one point) for having the highest mean production efficiency (Section 4.2.5). Since there was no significant difference between the production efficiencies of clean tea and conventional tea production, each production method receives 2.5 points from a total of six points assigned for each criterion. Likewise, one, two and three points were assigned to organic tea, clean tea and conventional tea production respectively, according to their mean profit efficiency ranking (Section 5.2.4). Here, like the production efficiency criterion, the production method with the highest profit efficiency i.e., organic production, is ranked as first (one point).
For outside support dependency, three points are given to organic tea production for having the lowest probability of adoption when outside support is removed, two points go to clean tea production, and one point to conventional tea production (Section 7.1.2).
For the market risk criterion, three points (third ranking) are given to organic tea production because it has the highest risk of having profits below 10 million VND/ha when the premium price is removed (Section 7.3.1). Two points are given to clean tea production (Section 7.3.2) and one point to conventional tea production.
For the private and social NPV criteria (Sections 8.2.1 and 8.2.2 respectively), conventional tea production had the lowest NPVs for both the long and short-run analyses and so receive three points for each criterion. Clean tea production had the highest in the short-run (1 point) and the second highest in the long run (2 points) for private NPV. Organic tea production receives 2 points for the short-run private NPV and 1 point for the long-run private NPV. The social NPV of clean tea production was not significantly different from organic tea production but both NPVs were significantly higher than that of conventional tea production; therefore, each receives 1.5 points for social NPV in the short-run. For the long run, however, organic tea production ranks first (1 point).
Lastly, in terms of environmental impact, organic tea production has the lowest mean environmental cost (smallest gap between private NPV and social NPV) and is
58
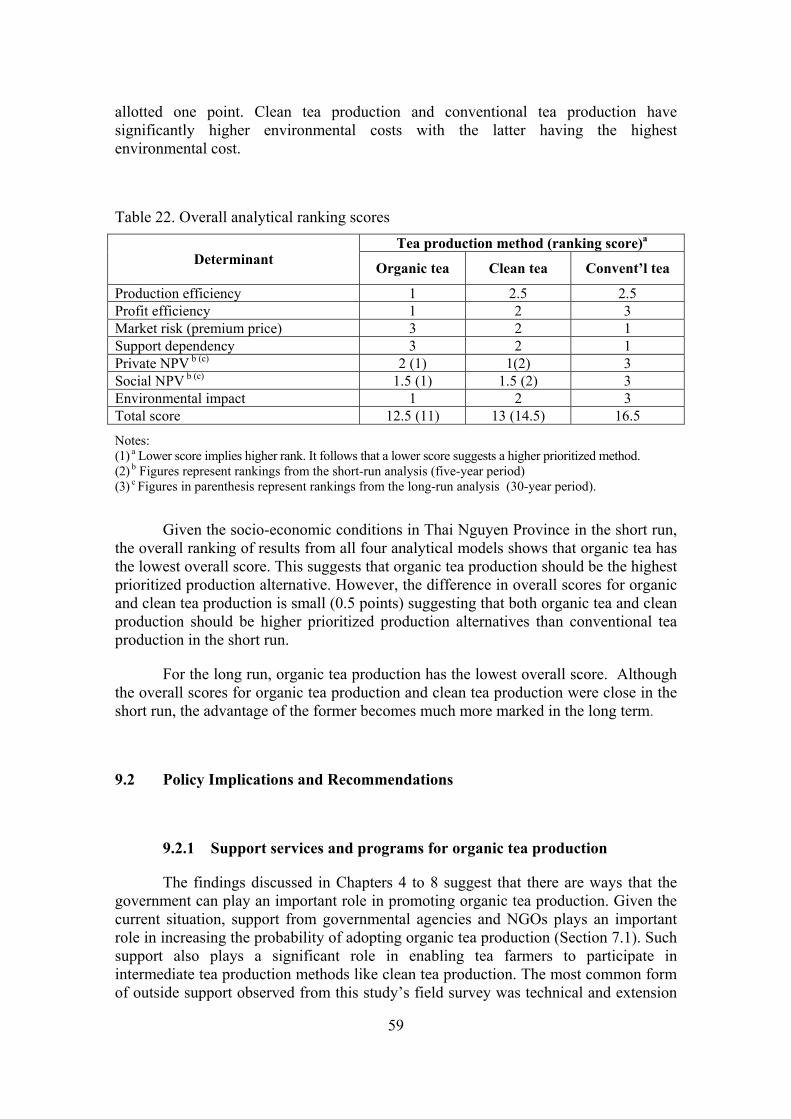
allotted one point. Clean tea production and conventional tea production have significantly higher environmental costs with the latter having the highest environmental cost.
Table 22. Overall analytical ranking scores Tea production method (ranking score)a
Determinant Organic tea Clean tea Convent’l tea
Production efficiency 1 2.5 2.5 Profit efficiency 1 2 3 Market risk (premium price) 3 2 1 Support dependency 3 2 1 Private NPV b (c) 2 (1) 1(2) 3 Social NPV b (c) 1.5 (1) 1.5 (2) 3 Environmental impact 1 2 3 Total score 12.5 (11) 13 (14.5) 16.5
Notes:
(1) a Lower score implies higher rank. It follows that a lower score suggests a higher prioritized method. (2) b Figures represent rankings from the short-run analysis (five-year period) (3) c Figures in parenthesis represent rankings from the long-run analysis (30-year period).
Given the socio-economic conditions in Thai Nguyen Province in the short run, the overall ranking of results from all four analytical models shows that organic tea has the lowest overall score. This suggests that organic tea production should be the highest prioritized production alternative. However, the difference in overall scores for organic and clean tea production is small (0.5 points) suggesting that both organic tea and clean production should be higher prioritized production alternatives than conventional tea production in the short run.
For the long run, organic tea production has the lowest overall score. Although the overall scores for organic tea production and clean tea production were close in the short run, the advantage of the former becomes much more marked in the long term.
9.2 Policy Implications and Recommendations
9.2.1 Support services and programs for organic tea production
The findings discussed in Chapters 4 to 8 suggest that there are ways that the government can play an important role in promoting organic tea production. Given the current situation, support from governmental agencies and NGOs plays an important role in increasing the probability of adopting organic tea production (Section 7.1). Such support also plays a significant role in enabling tea farmers to participate in intermediate tea production methods like clean tea production. The most common form of outside support observed from this study’s field survey was technical and extension
59

services (i.e., technical training, on-farm monitoring, non-pesticide pest control training, etc.). Other forms of support included providing channels to market organic tea products, subsidizing certification costs, and providing organic farm inputs that satisfy certification requirements for organic tea farmers. However, these support programs by themselves may not be enough to ensure sustained growth in organic tea production in the long run.
9.2.2 A premium price for organic tea
The other form of government intervention would be the creation of a market mechanism that guarantees a premium price for organic tea products. As shown in Section 7.1.2, the premium price level that begins to increase the adoption rate of organic tea production is about 20% higher than the regular market price. Removal of the premium price would reduce the probability of adopting organic tea production to zero. At present, the premium price for organic tea in Thai Nguyen Province is set by a sponsoring company, Ecolink Co., which purchases the products from organic tea farmers through contracts signed at the beginning of the tea production year. The premium price mechanism has been a sustainable way to promote organic production so far. Pimentel et al. (2005) reported that the premium price for organic corn in the US required the equalization of organic and conventional returns which was estimated to be 10% above the price of the conventional product. However, premium prices for organic US corn actually ranged from 65% to 140% (Pimentel et al. 2005).
There are market niches for organic tea products in the domestic market. Raising awareness of the health and environmental benefits from organic tea or requiring product labeling with quality control certification would create a higher and more competitive price for organic tea products domestically in the long run.
9.2.3 Tax on conventional tea output
One government intervention aimed at reducing environmental externalities is to internalize the externality by imposing a Pigovian tax on polluters (conventional tea producers in this case). The discussion in Section 7.2.2 suggests that a tax on conventional tea output may shift some conventional tea producers to organic tea production, but the increase in the adoption probability is limited to 9%. Thus, the effect of imposing a tax on conventional tea output is small in terms of prompting conventional tea farmers to switch to organic production given current socio-economic conditions.
9.2.4 Clean tea production as an intermediate alternative
As discussed in Chapter 1, organic tea production is a way to satisfy consumer demands for higher quality products and improving health in a highly competitive market. However, not all conventional tea farmers can immediately switch to organic
60

tea production because of various factors affecting this decision. As an intermediate solution between the two production extremes; organic production on one hand, without using chemical and synthetic inputs, and conventional production on the other hand, with intensive use of farm inputs, clean tea production stands as a viable compromise.
As shown from earlier analyses, clean tea production has significantly higher production and profit efficiencies and social and private net present values than conventional tea production. Clean tea production also has a higher probability of adoption, even without outside support or premium prices as compared to organic tea production. However, clean tea production is less efficient and has a lower social net benefit than organic tea production. Introducing clean tea production as an intermediate alternative, with fewer restrictions on pesticide and other chemical input usage as compared with organic production, will help prepare tea farmers in terms of production adjustments and attitude changes as they move toward organic tea production.
The ranking analysis of all four analytical models (i.e., efficiency, adoption, risk and cost-benefit models) (Table 22) suggests that clean tea production can be a viable alternative tea production method in the short run (five-year period) in terms of satisfying higher quality standards and improving the profitability of tea growers in Thai Nguyen Province. However, in the long run (30-year period), organic tea production is the best tea production method in terms of satisfying both the needs of individual tea producers (in terms of income security) and society (in terms of a having a safer environment).
9.3 Recommendations for Future Research
This study combines four different analytical models in an integrated analytical framework to provide insights into the current situation of tea production in Thai Nguyen Province and the consequences of switching to organic tea production. Although the findings of this research provide useful information on the economic and environmental impacts of the transition from conventional tea production to organic tea production in the province, it is still limited in geographical area to only two districts. Expanding this study to other tea growing areas of Vietnam to test these findings before applying them at the national level is necessary.
As discussed in Section 6, if organic tea yields increase, then the adoption of organic tea production will also increase. This finding suggests a research opportunity in terms of selecting tea varieties or cropping technologies that produce higher organic tea yields and higher product quality. Also, the discussion in Section 5.2.1 highlighted that one of the effective ways to increase the profit efficiency or profitability of organic tea production would be to reduce its pest and disease control costs. Tea varieties more resistant to pests and disease while producing higher yields and a higher quality product can contribute to cost reductions in pest and disease control. This potential research would encourage organic tea production in Vietnam.
With time and resource constraints, this research focused primarily on the supply side of organic tea production, thus another area for future research would be to
61
look at the demand side. This could include research questions like: How much would consumers be willing to pay for organic tea products in domestic markets? What marketing schemes could organic tea producers utilize in order to expand their market share domestically and globally?
Although this research did provide information about how organic tea production could contribute to a reduction of agrochemical residues in the soil, water and tea products, the data was limited to one organic tea farm and one conventional tea farm, over a short period of time (eight months). It would be better and more persuasive if other research were to be conducted involving more tea producing farms (at least three replicates for each type of tea production including clean tea farms) over a longer duration (say, a two-year transition period). Also, the results of such research would be more useful in calculating an environmental abatement payment or an environmental cost in the net present value analysis.
The policy analysis in Section 7.2 underscores the important role that the government can play in promoting organic tea production in Vietnam, i.e., setting a premium price for organic products and levying a tax on conventional tea output. These results open up another research area—to determine an appropriate payment vehicle for environmental benefits in the case of organic tea production in particular and organic production in general.
Last but not least, a more accurate data collection system for such studies in Vietnam should be developed compared to the present one based on the information recall of interviewees. Often, it is quite difficult for farmers to recall the inflow and outflow details of their production in the years prior to the current production year. It would be good to be able to cross-check survey data with actual accounting records or with the results of an artificial market experiment.
62

REFERENCES
Abdulai, A., and W. E. Huffman. 2000. Structural Adjustment and Efficiency of Rice Farmers in Northern Ghana. Economic Development and Cultural Change. 48(3). 503-521.
Aigner, D.; C. A. K. Lovell; and P. Schmidt. 1977. Formulation and Estimation of Stochastic Frontier Production Function Models. Journal of Econometrics. 6. 21-37.
Ali, M. and J. C. Flinn. 1989. Profit Efficiency among Basmati Rice Producers in Pakistan Punjab. American Journal of Agricultural Economics. 71(2). 303-310.
Ali, M. and Byerlee, D. (1991). Economic Efficiency of Small Farmers in a Changing World: A Survey of Recent Evidence. Journal of International Development. 3 (1). 1-27.
Alston, J. M.; C. Chan-Kang; M. C. Marra; P. G. Pardey; and T. J. Wyatt. 2000. A Meta- Analysis of Rates of Return to Agricultural R & D: Ex Pede Herculem (No. 113). International Food Policy Research Institute. Washington D.C. USA.
Agribank. 2007. Cho vay cá nhân & Hộ gia đình, Ngân hàng nông nghiệp và phát triển nông thôn Việt Nam (Vietnam Bank for Agriculture and Rural Development. Retrieved November 12, 2007, from http://www.agribank.com.vn/Agribank/eServices/ServiceDetails.aspx?CatId=72&Service=true.
Arrow, K. J. and R. C. Lind. 1970. Uncertainty and the Evaluation of Public Investment Decisions. American Economic Review. 60. 364-378.
Arsham, H. 2007. Sample Size Determination. Retrieved Jan 16, 2008, from home.ubalt.edu/ntsbarsh/index.html.
Ballard, C. L. 1985. A General Equilibrium Model for Tax Policy Evaluation. University of Chicago Press. Chicago. USA.
Besley, T. J. and A. Case. 1993. Modeling Technology Adoption Decisions in Developing Countries. American Economic Review. 82(2). 396-402.
Boardman, A. E.; D. H. Greenberg; A. R. Vining; and D. L. Weimer. (eds). 2006. Cost Benefit Analysis: Concepts and Practice (3rd ed.). Prentice Hall. Upper Saddle River. NJ. USA.
Bravo-Ureta, B. E. and A. E. Pinheiro. 1997. Technical, Allocative and Economic Efficiency in Peasant Farming: Evidence from the Dominican Republic. The Developing Economies. 35(1). 48-67.
Bravo-Ureta, B. E. and L. Rieger. 1991. Dairy Farm Efficiency Measurement Using Stochastic Frontiers and Neo-classical Duality. American Journal of Agricultural Economics. 73 (2). 421-428.
63
Charles, B. 1998. Organic Farming: Facing Choices at the Crossroads. University Center, University of Guelph. Guelph. Ontario. Canada.
Charles, W. A. ; A. R. Brian ; and J. E. Donald. 1992. Valuing Environmental Quality Change Using Averting Expenditure: An Application to Groundwater Contamination. Land Economics. 68. 163-169.
Coase, H. R. 1960. The Problem of Social Cost. Journal of Law & Economics. 3. 1-44.
Crocker, T.; J. Shogren; and P. Turner. 1998. Incomplete Beliefs and Non-market Valuation. Resources and Energy Economics. 20. 139-162
Dinwiddy, C. L. and F. Teal. 1996. Principles of Cost-Benefit Analysis for Developing Countries. Cambridge University Press. Cambridge. New York. USA.
Do, N. Q. and T. K. Le. 2000. Giao trinh Cay Che: San Xuat, Che Bien va Tieu Thu (Textbook of Tea Plantation: Field Management, Process and Marketing Product). Nha Xuat Ban Nong Nghiep (Agriculture Publisher). Hanoi, Vietnam. (In Vietnamese)
Farrell, M. J. 1957. The Measurement of Production Efficiency. Journal of the Royal Statistical Society. 120. Series A (General), Part III.
FAO (Food and Agriculture Organization). (2003). Project on Livestock Industrialization, Trade and Social-Health-Environment Impacts in Developing Countries. Retrieved Jan. 15, 2007, from http://www.fao.org/docrep/meeting/009/j0307e.htm.
Fox, G.; A. Weersink; G. Sarwar; S. Duff; and B. Deen. 1991. Comparative Economic of Alternative agricultural Production Systems: A Review. Northeastern Journal of Agricultural and Resource Economics. 20(1). 124-142.
Fried, H.O.; C. A. K. Lovell; and S. S. Schmitz. 1993. The Measurement of Productive Efficiency: Techniques and Application. Oxford University Press. Oxford. UK.
Garson, D. 2006. Multiple Regressions. Retrieved March 29, 2006, from http://www2.chass.ncsu.edu/garson/pa765/regress.htm
Goldberger, A. S. 1964. Econometric Theory. John Wiley and Sons. New York. USA.
GSO (General Statistics Office). 2008. Statistical Year Book 2007. Statistical Publishing House. Hanoi. Vietnam.
Greene, W. H. 1990. Econometric Analysis. Macmillan. New York. USA.
Gwenaelle, L.G. and S. Alberik. 2001. Organic Farming: Guide to Community Rules. Office for Official Publication of European Communities. Luxembourg.
Haab, T. C. and K. E. McConnell. 2002. Valuing Environmental and Natural Resources: The Econometrics of Non-Market Valuation. Edward Elgar. Cheltenham. UK.
Hadi, A. S. 1992. Identifying Multiple Outliers in Multivariate Data. Journal of the Royal Statistical Society. Series B (Methodological). 54(3). 761-771.
64
Haefeli, M.; A. Elfering; E. McIntosh; A. Gray; A. Sukthankar; and N. Boos. 2007. A
Cost-Benefit Analysis Using Contingent Valuation Techniques: A Feasibility Study in Spinal Surgery. Value in Health. Retrieved November 17, 2007, from http://www.blackwell-synergy.com/doi/abs/10.1111/j.1524-4733.2007.00282.x
Helfert, E. A. 2003. Techniques of Financial Analysis: A Guide to Value Creation (11th ed.). McGraw-Hill/Irwin. Boston. USA.
Helton, J. C. 2005. Sampling-Based Methods for Uncertainty and Sensitivity Analysis. Temple, AZ 85287-1804. Department of Mathematics and Statistics. Arizona State University. Arizona. USA.
IFOAM (International Federation of Organic Agriculture Movement). 2005. General Assembly of IFOAM Approves Principles of Organic Agriculture. IFOAM News/Press. Retrieved November 17, 2007 from: http://www.ifoam.org/webEdition/we_cmd.php?we_cmd%5B0%5D=show&we_cmd%5B1%5D=13920&we_cmd%5B4%5D=381
Jondrow, K.; C. A. K. Lovell; I. Materov; and P. Schmidt. 1982. On the Estimation of Technical Inefficiency in the Stochastic Frontier Production Function Model. Journal of Econometrics. 19(2/3). 233-238.
Johnson, D. H. 1980. The Comparison of Usage and Availability Measurements for Evaluating Resource Preference. Ecology. 61(2). 65-71.
Kammen, D. M. and D. M. Hassenzahl. 2001. Should We Risk It? Exploring Environmental, Health, and Technological Problem Solving. Princeton University Press. New Jersey. USA.
Kenneth, E. B. 1968. Economics as a Moral Science. The Institute of Behavioral Science, University of Chicago. Chicago. Illinois. USA.
Klepper, R.; W. Lockeretz; B. Commoner; M. Gertler; S. Fast; D. O'Leary et al. 1977. Economic Performance and Energy Intensiveness on Organic and Conventional Farms in the Corn Belt: A Preliminary Comparison. American Journal of Agricultural Economics. 59. 1-12.
Kolawole, O. 2006. Determinants of Profit Efficiency among Small Scale Rice Farmers in Nigeria: A Profit Function Approach. Paper presented at the International Association of Agricultural Economists Conference, Gold Coast, Australia, August 12-18, 2006. International Association of Agricultural Economists.
Kumbhakar, S. C. and C. A. K. Lovell. 2000. Stochastic Frontier Analysis. Cambridge University Press. New York. USA.
Kuosmanen, T.; T. Post; and S. Scholtes. 2007. Non-parametric Tests of Productive Efficiency with Errors-in-Variables. Journal of Econometrics. 136. 131-162.
65

Lockeretz, W.; G. Shearer; R. Kleppler; and G. P. Sweeney. 1978. Field Crop Production on Organic Farms in the Midwest. Journal of Soil and Water Conservation. 33. 130-134.
McMaster, M., and C. McMaster. 2007. GC/MS: Practical User's Guide. Weimarx: Culinary and Hospitality Industry Publication Service. Wiley. New York. USA.
Mendola, M. 2007. Agricultural Technology Adoption and Poverty Reduction: A Propensity-Score Matching Analysis for Rural Bangladesh. Food Policy. 32(3). 372-393.
Meeusen, W. And J. van den Broeck. 1977. Efficiency Estimation from Cobb-Douglas Production Function With Composed Error. International Economic Review. 18 (2). 435-444.
Neter, J.; W. Wasserman; and M. H. Kutner. 1989. Applied Linear Regression Models (2nd ed.). Homewood, III. Irwin. USA.
Nga, N.T (2007) Bao cao Thuc trang Phat Trien Vung Che Thai Nguyen (The Report of Actual Tea Production Area of Thai Nguyen Province). Department of Agriculture and Rural Development of Thai Nguyen Province. Thai Nguyen City, Vietnam. (In Vietnamese)
Nick, H. and F. S. Jason. 2005. Is Cost-Benefit Analysis Anomaly-Proof? Environmental & Resource Economics. 32. 13-34.
Novick, L. F. and J. S. Marr. 2001. Public Health Issues Disaster Preparedness: Focus on Bioterrorism. Jones and Bartlett Publishers. Sudbury. Massachusetts. USA.
Pearce, D. W.; G. Atkinson; and S. Mourato. 2006. Cost-Benefit Analysis and the Environment: Recent Developments. Organization for Economic Co-operation and Development. Paris. France.
Pimentel, D.; P. Hepperly; B. Hanson; D. Douds; and R. Seidel. 2005. Environmental, Energetic, and Economic Comparisons of Organic and Conventional Farming Systems. BioScience. 55(7). 573-583.
Pindyck, R. S. and D. L. Rubinfeld. 1981. Econometric Models and Econometric Forecasts. McGraw-Hill Book Co. New York. USA.
Phuong, M. N. and K. N. Trung. 2004. The Vietnamese Tea Industry. National Tea Co-operation. Hanoi. Vietnam
Que, N. T. and N. N. Que. 2000. Effects of Trade Liberalization on Agriculture in Vietnam: Commodity Aspects. Working Paper Series. The Coarse, Grains, Pulses, Roots and Tuber Crops (CGPRT) Center. Bangkok. Thailand.
Romero, C. and T. Rehmen. 1989. Multiple Criteria Analysis for Agricultural Decisions. Elsevier. New York. USA.
66
Roumasset, J. A. 1981. Positive Methods of Agricultural Decision Analysis. Australian
National University. Distributed by ANU Press. Canberra. Australia.
Ryan, J. M. and A. O. Garder. 1965. The Measurement of Dynamic Risk. Southern Economic Journal. 31(3). 207.
Sharma, K. R.; P. Leung; and H. M. Zaleski. 1997. Productive Efficiency of the Swine Industry in Hawaii: Stochastic Frontier vs. Data Envelopment Analysis. Journal of Productivity Analysis. 8(4). 447-459.
Sheskin, D. 2004. Handbook of Parametric and Nonparametric Statistical Procedures (3rd ed.). Boca Raton, Fla. Chapman & Hall/CRC. London. UK.
Shuwu, H. T. (2006). Profit Efficiency Among Rice Producers in Eastern and Northern Uganda. Makerere University. Kampala. Africa.
Sweeney, G. P. 1987. Innovation, Entrepreneurs and Regional Development. St. Martin’s Press. New York. USA.
Tornatzky, L. G.; M. Fleisher; and A. K. Chakrabarti. 1990. The Processes of Technological Innovation. Lexington Books. Lexington. MA. USA.
Varian, H. R. 1992. Microeconomic Analysis (3rd ed.). Norton. New York. USA.
Vinatea (Vietnam National Tea Cooperation). 2005. Tea News. Retrieved December 21, 2007 from http://www.vietnamtea.net.
Wooldridge, J. M. 2003. Introductory Econometrics: A Modern Approach (2nd ed.). South-Western College Publisher. Cincinnati. USA.
Yamane, T. (ed). 1967. Statistics: An Introductory Analysis (2nd ed.). Harper and Row. New York. USA.
Yansaneh, I. I. 2007. Household Sample Surveys in Developing and Transition Countries. Retrieved Jan. 14, 2007, from http://unstats.un.org/unsd/HHsurveys/pdf/Chapter_2.pdf
Yotopoulos, P. A. and L. J. Lau. 1973. A Test for Relative Economic Efficiency: Some Further Results. American Economic Review. 63(1). 214-223.
Zandstra, H.G.; E. C. Price; J. A. Litsinger; and R. A. Morris. 1981. A Methodology for On-Farm Cropping Systems Research. IRRI (International Rice Research Institute). Los Baños. The Philippines.
67
APPENDICES
Appendix 1. Standards and Requirements for Organic Tea Production in Vietnam
This guide for organic (tea) farming practices is provided by Vietnam Ecolink Co. Ltd. (2005).
1. The use of synthetic fertilizers, which are those produced artificially and which contain nutrients such as nitrogen (N), phosphorus (P), and potassium (K) is prohibited. When applying these inorganic fertilizers, plants grow fast, but soils soon become compacted, acidic, and degraded.
2. The use of plant protective chemicals is prohibited. Plant protective chemicals (pesticides, herbicides, and fungicides, etc.) are toxic substances that pollute the environment. These chemicals not only kill insects; they also kill pest predators such as lady bugs, birds, and pest-eating ants. They can also be toxic to domestic animals such as chickens, ducks, buffaloes, and cows, and even to humans.
3. The use of growth regulators that have harmful effects on human health is prohibited.
4. The use of production tools and equipment, such as sprayers, that were previously used for inorganic production (of vegetables, rice, or conventional tea) for organic tea production is prohibited. Farmers must have separate tools and equipment to be used only for organic tea production.
5. Other production tools, such as hoes, shovels, baskets, knives, and carrying tools, must be cleaned before being used on organic tea farms.
6. Farmers are required to record and keep track of all details of inputs used to produce organic tea including input sources, quantities, dates of purchase, dates of applying inputs, and quantities applied each time.
7. Organic tea growers are prohibited from producing both organic and inorganic tea simultaneously because it is easy to mix both products up.
8. A buffer zone is required to separate organic tea farms from other inorganic farms. The buffer zone can be green fences or trenches and the organic farm must be at least two meters away from the buffer zone.
9. If there are potential effects from the wind, the buffer zone must include tall trees that can protect the organic tea crop. The trees grown in the buffer zone must be different from the tea family. If there are potential effects from water sources, the buffer zone must include ditches to prevent outside water from getting into the organic farm.
10. The cutting of natural forests in order to farm organic tea is prohibited.
68
11. Perennial crops (e.g., tea, litchi, and longan) are subject to at least a two-year transition period before converting to organic production.
12. The use genetically modified crops in organic tea production is prohibited.
13. Seeds for propagation on organic tea farms and green manure applied to organic tea crops must come from an organic farm.
14. The use of any chemicals in seed germination treatment is prohibited.
15. The burning of crop residues in the fields is prohibited.
16. The use of human waste as manure for organic farming is prohibited.
17. If manure from poultry is used on the organic farm, it must not be from an industrial poultry-raising source.
18. The use of treated urban waste as manure for organic farming is prohibited.
19. Organic tea growers must combine different farming practices to control erosion (e.g., planting forest trees, intercropping green manure trees with tea, etc.).
20. The use of artificial chemicals in storing organic tea and other organic products is prohibited.
21. The use of bio-pesticides produced from plant material such as neem leaves and hot chili roots is allowed.
69
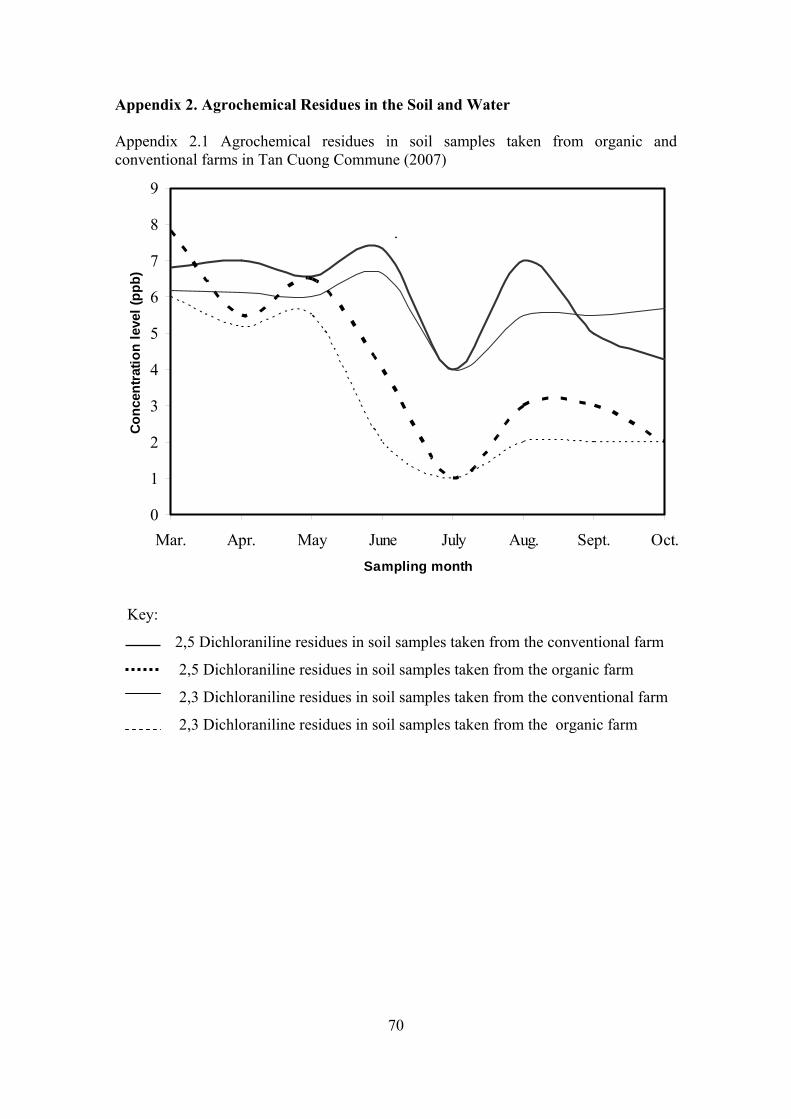
Appendix 2. Agrochemical Residues in the Soil and Water Appendix 2.1 Agrochemical residues in soil samples taken from organic and conventional farms in Tan Cuong Commune (2007)
.
0
1
2
3
4
5
6
7
8
9
Mar. Apr. May June July Aug. Sept. Oct.Sampling month
Conc
entra
tion
leve
l (pp
b)
Key:
2,5 Dichloraniline residues in soil samples taken from the conventional farm
2,5 Dichloraniline residues in soil samples taken from the organic farm
2,3 Dichloraniline residues in soil samples taken from the conventional farm
2,3 Dichloraniline residues in soil samples taken from the organic farm
70

Appendix 2.2. Agrochemical residues in water samples taken from organic and conventional farms in Tan Cuong Commune (2007)
0123456789
10
Mar. Apr. May June July Aug. Sept. Oct.
Sampling month
Con
cent
ratio
n le
vel (
ppb)
Key:
Carbetamide residues in water samples taken from the conventional farm
Carbetamide residues in water samples taken from the organic farm
2,3 Dichloraniline residues in water samples taken from the conventional farm
------- 2,3 Dichloraniline residues in water samples taken from the organic farm
71
Related Documents


![The Robert Fleming Fonds - Library and Archives Canada Cataloguing in Publication Data National Library of Canada The Robert Fleming fonds: numerical list [computer file] Issued also](https://static.cupdf.com/doc/110x72/5aff46e07f8b9a8b4d9029d6/the-robert-fleming-fonds-library-and-archives-cataloguing-in-publication-data.jpg)


