WATER RESOURCES PROFILE SERIES The Water Resources Profile Series synthesizes information on water resources, water quality, the water-related dimen- sions of climate change, and water governance and provides an overview of the most critical water resources challenges and stress factors within USAID Water for the World Act High Priority Countries. The profile includes: a summary of avail- able surface and groundwater resources; analysis of surface and groundwater availability and quality challenges related to water and land use practices; discussion of climate change risks; and synthesis of governance issues affecting water resources management institutions and service providers. Liberia Water Resources Profile Overview Liberia has abundant water resources throughout the country. Water availability per capita is the third highest in Sub-Saharan Africa at 49,028 m 3 and is significantly higher than the Falkenmark i threshold for water stress. Water abstractions are also quite low. The ratio of water withdrawals to renewable supply is less than one percent. ii Groundwater is generally accessible due to high water tables and is the primary drinking water source in rural and urban areas. However, groundwater quality is threatened by the high prevalence of unprotected wells and pit latrines, which are easily contaminated by sewage, especially during wet season flooding. Contamination of shallow groundwater can pose serious health risks to communities who depend on the resource for drinking water supply. Artisanal and large-scale mining operations and rubber plantations are key sources of surface water pollution and watershed degradation. Poor sanitation systems and limited solid waste management in cities have degraded wetlands and biodiversity and impacted public health. Climate change will increase rainfall intensity and flood risks, increasing risks of waterborne disease outbreaks in urban areas, especially in informal settlements. Rising sea levels will lead to more intrusive seasonal storm and tidal surges, and threaten to inundate coastal wetlands and mangroves, destroy infrastructure, and displace coastal populations. i The Falkenmark Water Stress Index measures water scarcity as the amount of renewable freshwater that is available for each person each year. A country is said to be experiencing water stress when water availability is below 1,700 m 3 per person per year; below 1,000 m 3 is considered water scarcity; and below 500 m 3 is absolute or severe water scarcity. ii SDG 6.4.2 measures water stress as the percentage of freshwater withdrawals against total renewable freshwater resources. The water stress thresholds are: no stress <25%, low 25%-50%, medium 50%-75%, high 75%-100%, and critical >100%. Despite having abundant surface water, dry season flows can be low. Low flows on the St. Paul River significantly reduces hydropower generation at the Mount Coffee Dam, which is the largest source of municipal power and a major source of electricity for Monrovia. There is limited data on surface and groundwater availability, quality, water use, as well as understanding of the groundwater balance in urban areas. This increases uncertainty about potential risks to water supply and public health and undermines management systems. Water resource management responsibilities are distributed across several management entities however the sector does not have a ministry dedicated to water resources. Limited coordination across these entities impedes water management efforts. Low funding and limited technical capacity also undermine implementation of Liberia’s Integrated Water Resources Management (IWRM) Policy.

Welcome message from author
This document is posted to help you gain knowledge. Please leave a comment to let me know what you think about it! Share it to your friends and learn new things together.
Transcript
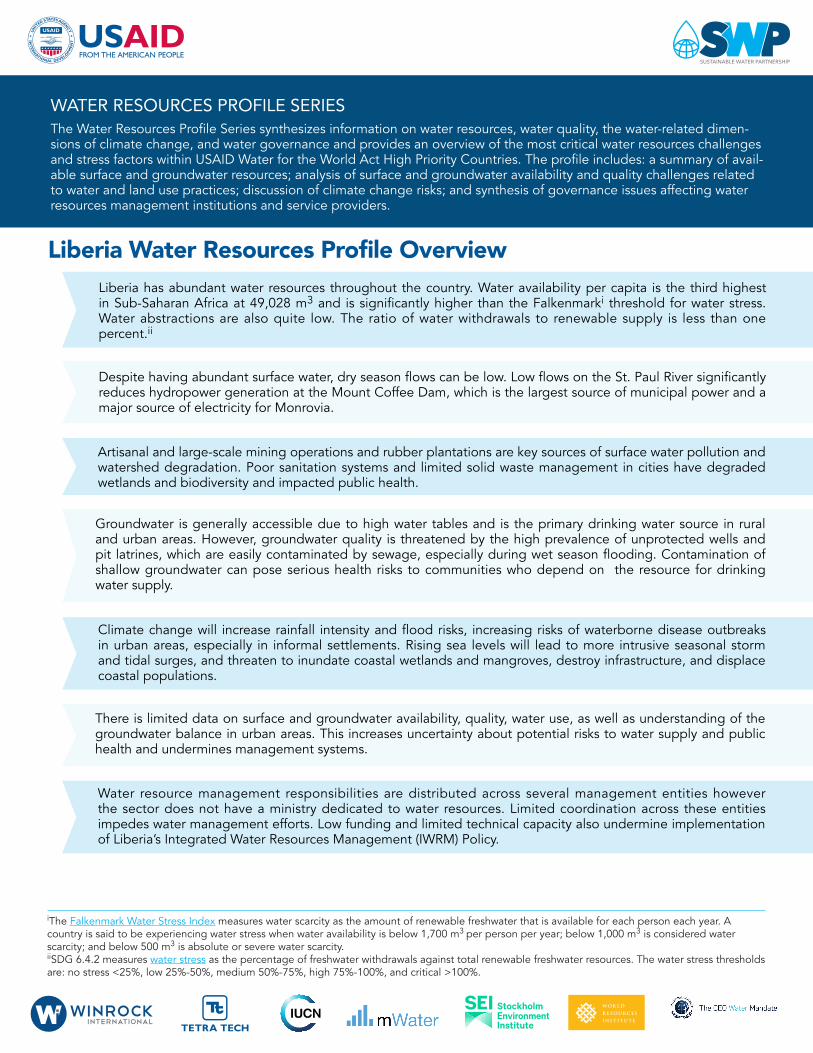
WATER RESOURCES PROFILE SERIESThe Water Resources Profile Series synthesizes information on water resources, water quality, the water-related dimen-sions of climate change, and water governance and provides an overview of the most critical water resources challenges and stress factors within USAID Water for the World Act High Priority Countries. The profile includes: a summary of avail-able surface and groundwater resources; analysis of surface and groundwater availability and quality challenges related to water and land use practices; discussion of climate change risks; and synthesis of governance issues affecting water resources management institutions and service providers.
Liberia Water Resources Profile OverviewLiberia has abundant water resources throughout the country. Water availability per capita is the third highest in Sub-Saharan Africa at 49,028 m3 and is significantly higher than the Falkenmarki threshold for water stress. Water abstractions are also quite low. The ratio of water withdrawals to renewable supply is less than one percent.ii
Groundwater is generally accessible due to high water tables and is the primary drinking water source in rural and urban areas. However, groundwater quality is threatened by the high prevalence of unprotected wells and pit latrines, which are easily contaminated by sewage, especially during wet season flooding. Contamination of shallow groundwater can pose serious health risks to communities who depend on the resource for drinking water supply.
Artisanal and large-scale mining operations and rubber plantations are key sources of surface water pollution and watershed degradation. Poor sanitation systems and limited solid waste management in cities have degraded wetlands and biodiversity and impacted public health.
Climate change will increase rainfall intensity and flood risks, increasing risks of waterborne disease outbreaks in urban areas, especially in informal settlements. Rising sea levels will lead to more intrusive seasonal storm and tidal surges, and threaten to inundate coastal wetlands and mangroves, destroy infrastructure, and displace coastal populations.
iThe Falkenmark Water Stress Index measures water scarcity as the amount of renewable freshwater that is available for each person each year. A country is said to be experiencing water stress when water availability is below 1,700 m3 per person per year; below 1,000 m3 is considered water scarcity; and below 500 m3 is absolute or severe water scarcity.iiSDG 6.4.2 measures water stress as the percentage of freshwater withdrawals against total renewable freshwater resources. The water stress thresholds are: no stress <25%, low 25%-50%, medium 50%-75%, high 75%-100%, and critical >100%.
Despite having abundant surface water, dry season flows can be low. Low flows on the St. Paul River significantly reduces hydropower generation at the Mount Coffee Dam, which is the largest source of municipal power and a major source of electricity for Monrovia.
There is limited data on surface and groundwater availability, quality, water use, as well as understanding of the groundwater balance in urban areas. This increases uncertainty about potential risks to water supply and public health and undermines management systems.
Water resource management responsibilities are distributed across several management entities however the sector does not have a ministry dedicated to water resources. Limited coordination across these entities impedes water management efforts. Low funding and limited technical capacity also undermine implementation of Liberia’s Integrated Water Resources Management (IWRM) Policy.
Water Resources Availability
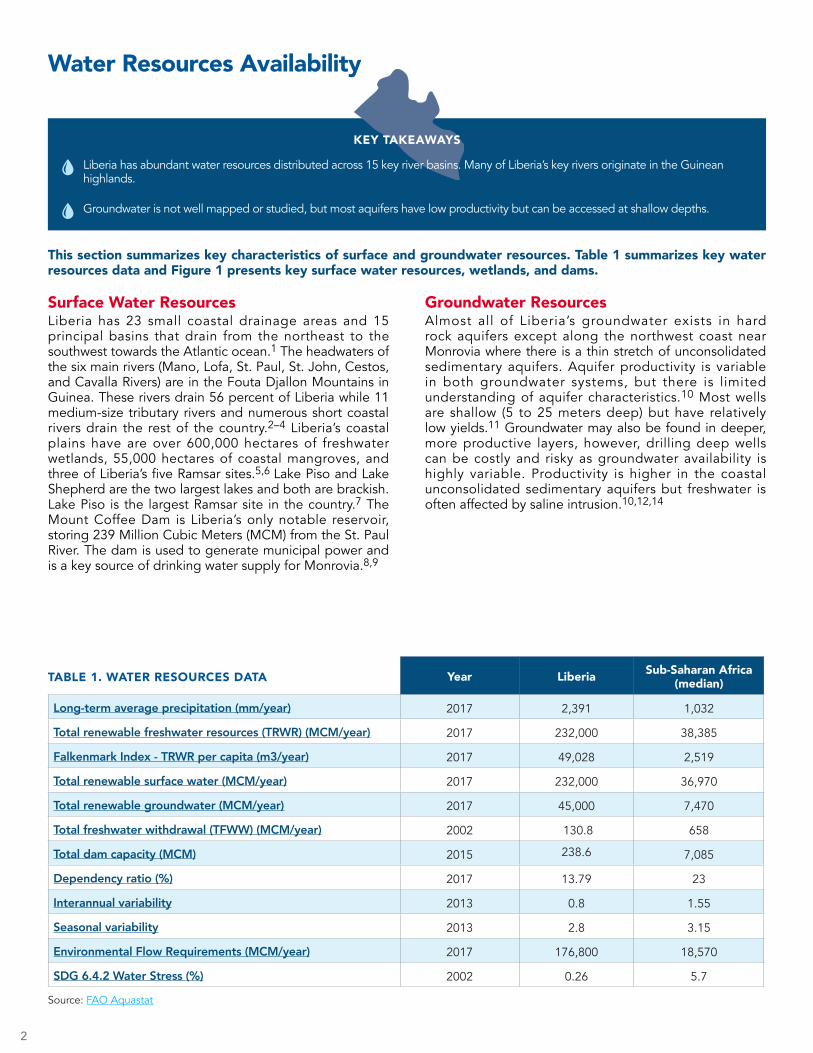
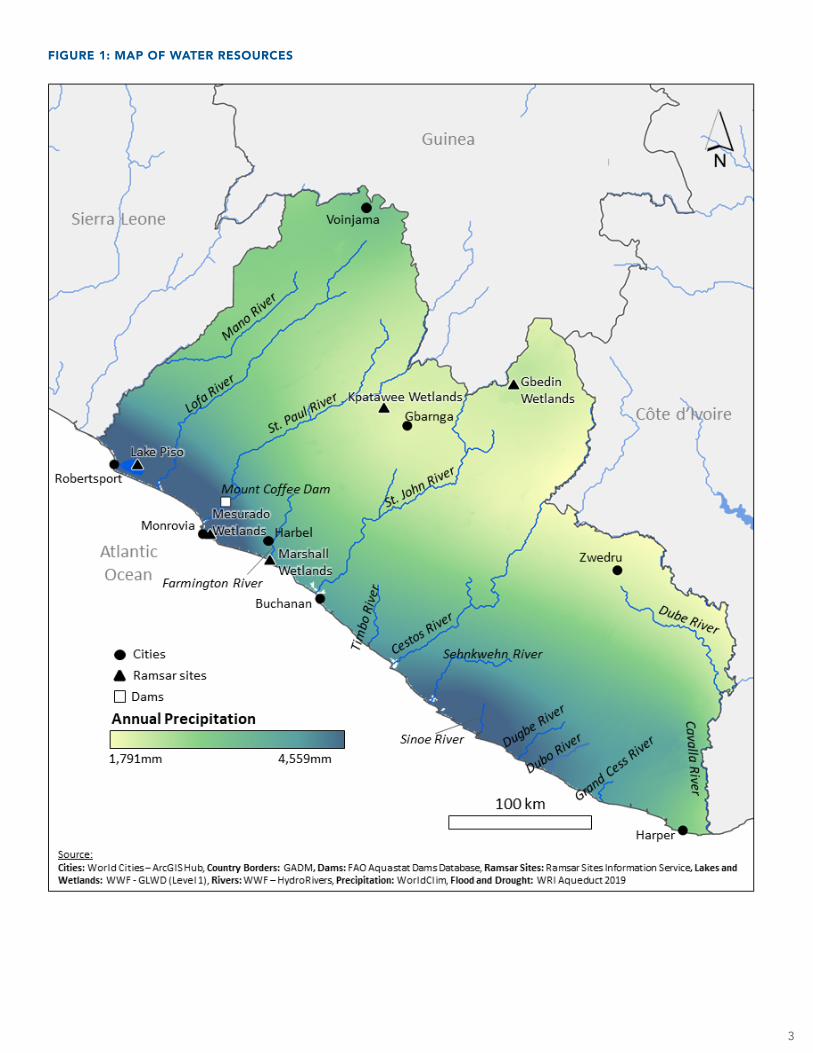
This section summarizes key characteristics of surface and groundwater resources. Table 1 summarizes key water resources data and Figure 1 presents key surface water resources, wetlands, and dams.
2
Year Liberia Sub-Saharan Africa (median)
Long-term average precipitation (mm/year) 2017 2,391 1,032
Total renewable freshwater resources (TRWR) (MCM/year) 2017 232,000 38,385
Falkenmark Index - TRWR per capita (m3/year) 2017 49,028 2,519
Total renewable surface water (MCM/year) 2017 232,000 36,970
Total renewable groundwater (MCM/year) 2017 45,000 7,470
Total freshwater withdrawal (TFWW) (MCM/year) 2002 130.8 658
Total dam capacity (MCM) 2015 238.6 7,085
Dependency ratio (%) 2017 13.79 23
Interannual variability 2013 0.8 1.55
Seasonal variability 2013 2.8 3.15
Environmental Flow Requirements (MCM/year) 2017 176,800 18,570
SDG 6.4.2 Water Stress (%) 2002 0.26 5.7
TABLE 1. WATER RESOURCES DATA
Source: FAO Aquastat
Surface Water ResourcesLiberia has 23 small coastal drainage areas and 15 principal basins that drain from the northeast to the southwest towards the Atlantic ocean.1 The headwaters of the six main rivers (Mano, Lofa, St. Paul, St. John, Cestos, and Cavalla Rivers) are in the Fouta Djallon Mountains in Guinea. These rivers drain 56 percent of Liberia while 11 medium-size tributary rivers and numerous short coastal rivers drain the rest of the country.2–4 Liberia’s coastal plains have are over 600,000 hectares of freshwater wetlands, 55,000 hectares of coastal mangroves, and three of Liberia’s five Ramsar sites.5,6 Lake Piso and Lake Shepherd are the two largest lakes and both are brackish. Lake Piso is the largest Ramsar site in the country.7 The Mount Coffee Dam is Liberia’s only notable reservoir, storing 239 Million Cubic Meters (MCM) from the St. Paul River. The dam is used to generate municipal power and is a key source of drinking water supply for Monrovia.8,9
KEY TAKEAWAYS
Liberia has abundant water resources distributed across 15 key river basins. Many of Liberia’s key rivers originate in the Guinean highlands.
Groundwater is not well mapped or studied, but most aquifers have low productivity but can be accessed at shallow depths.
Groundwater Resources Almost all of Liberia’s groundwater exists in hard rock aquifers except along the northwest coast near Monrovia where there is a thin stretch of unconsolidated sedimentary aquifers. Aquifer productivity is variable in both groundwater systems, but there is limited understanding of aquifer characteristics.10 Most wells are shallow (5 to 25 meters deep) but have relatively low yields.11 Groundwater may also be found in deeper, more productive layers, however, drilling deep wells can be costly and risky as groundwater availability is highly variable. Productivity is higher in the coastal unconsolidated sedimentary aquifers but freshwater is often affected by saline intrusion.10,12,14
3
FIGURE 1: MAP OF WATER RESOURCES
4
Surface Water Outlook
This section describes key sources of demand and uses of surface water, and associated challenges stemming from water availability and water quality challenges.
Municipal water supply and industry are the main sources of demand for freshwater water but there is limited data on surface water abstractions. Surface water is used in municipal supply systems in Robertsport, Monrovia, Voinjama, and Sanniquellie.19,20 Little information is available about industrial demand for water but major industries include iron and gold mining and processing of agro-industrial products such as rubber. Smaller gold mining operations often rely on surface water and are clustered along the coast and the Lofa, St. Paul, Cess, and Dubo Rivers.22 Irrigation demand is low as most farmers rely on rainfed agriculture and plans indicate modest increases in irrigation.16,17
Surface water supply is highly seasonal for most rivers, but impacts are limited, except on the St. Paul River where hydropower generation capacity diminishes during the dry season. The St. Paul River’s average flow rate in September exceeds 1,400 m3/s and declines to 50 m3/s in February.23 The Mount Coffee Dam on the St. Paul River is a key source of electricity for Monrovia, producing 70 percent of the nation’s municipal power supply, and is the only dam with appreciable storage capacity in the country.8,25 The Dam usually operates at full capacity with all four turbines, but hydroelectric generation declines sharply in the dry season as low reservoir water levels force the shutdown of three turbines.26
Mining contamination has reduced surface water quality and has been linked to environmental disasters and public health impacts. Recent studies in Cape Mount County and Bong County documented mercury levels there were up to 150 times higher than WHO guideline values for drinking water near small-scale gold mining operations.27,28 Large-scale gold mining has also been implicated in decreasing pH and higher concentrations of cyanide.27 Two major chemical spills between 2015 and 2017 killed aquatic species, displaced populations, and contaminated drinking water supply in the St. John River and Mafa River-Lake Piso Basins.27 The 2017 spill discharged an estimated three million gallons of untreated mine tailings into the Sien
Creek (St. John River Basin), which is used for drinking water by Sayewheh Town.29 Many of the 1,900 residents were affected by chemical irritants while bathing and reported acute gastrointestinal impacts from drinking the polluted water.29,30 In 2019, the Ministry of Mines and Energy (MME) banned river dredging for gold and diamond mining, as well as the use of mercury in gold processing.31
Direct discharge of untreated sewage and solid waste are degrading key wetlands around cities. Most urban areas do not have wastewater treatment plants or extensive sewerage systems. In Monrovia, a small sewerage system services 30 percent of the population, but the Fiamah Wastewater Treatment Plant has not been operational for over 20 years.32,33 Solid municipal waste is often deposited at makeshift landfills in brackish swamps outside of cities, which threaten surface water quality. The Marshall Wetlands in the Farmington River Basin34 and the Mesurado Wetlands in Monrovia (St. Paul River-Farmington River coastal drainage area) have been severely degraded by municipal waste and wastewater.35
The rapidly growing agro-industrial sector is degrading water quality and watersheds. Long-term agro-industrial concessions for rubber, palm oil, and logging, which are found in all 15 counties and cover more than 25 percent of the country, are impacting downstream water quality and biodiversity in freshwater wetlands and coastal mangroves, including Ramsar sites.5,6 The largest rubber concessions are in the Lofa, St. Paul, Cavalla, Timbo River, and the St. John Basins, whereas palm oil concessions primarily affect the Lofa, St. Paul, Sinoe, and Sehnkwehn Basins.37,38 Logging concessions are mostly in the Cestos Basin and in the upper parts of the Cavalla, Sehnkwehn, Dugbe, Grand Cess, Dubo Basins.37,38
Monocrop agriculture on these plantations reduce primary forest cover. Deforestation rates have quadrupled in recent years, with approximately 1.5 million hectares deforested between 2001 and 2018.39 Accelerating deforestation has increased erosion and sedimentation
KEY TAKEAWAYS
Total surface water demand is low but data on surface water abstraction across sectors is limited. Municipal water supply and industry are the main sources of demand for freshwater.
River flows fluctuate greatly between the wet and dry season. This can significantly reduce generation of hydroelectricity on the St. Paul River.
Surface water is polluted by chemical toxins from large-scale and artisanal mining, and agro-industrial operations such as rubber processing plants. Poor sanitation systems and limited solid waste management have contaminated key wetlands and degraded biodiversity.
55
in downstream watercourses.39,40 Further, agro-industrial processing facilities often release chemical pollutants into water sources.40 Rubber plantations and processing facilities commonly use chemicals such as sulfuric
acid, ammonia, formic acid, and lye, which can harm wetland biodiversity and public health if effluent is not treated.42,43
KEY TAKEAWAYS
Groundwater is the primary source of drinking water in rural and urban areas. Data on groundwater use and availability is limited, although risks of over-exploitation are low.
Groundwater quality is not comprehensively monitored although pathogenic contamination is widespread in urban aquifers due to poor sanitation systems. Shallow groundwater, which are a key source of drinking water supply, are particularly susceptible to contamination.
Groundwater Outlook
This section describes key sources of demand and uses of groundwater, and associated challenges stemming from water availability and water quality challenges.
Groundwater resources are not well understood but it is a principal source of drinking water, particularly through shall, hand-dug wells. Assessments of aquifers and hydrogeological characteristics assessments are limited. Groundwater is the primary source of drinking water in rural and urban areas and is used by over 70 percent of the population. However, data on groundwater use by sector is limited.18 Most municipal water systems were damaged during the civil wars,18 which forced most people to obtain water through shallow, hand-dug wells.
Limited sanitat ion infrastructure and a high prevalence of unprotected, hand-dug wells have significantly increased the risks of pathogenic contamination in groundwater, particularly in major
cities. Limited drinking water quality studies indicate widespread risks from microbial contamination. A 2011 survey of groundwater quality in Monrovia found that E. Coli was present in all of the unprotected wells, 52 percent of protected hand dug wells, and 44 percent of drilled wells.45 Similar studies on Monrovia also found high levels of nitrates, which likely derive from by poor sanitation systems.46,47 High concentrations of lead caused by poor solid waste management and industrial pollution have also been documented in Monrovia, Robertsport, Voinjama, and Sanniquellie.19,45 Coastal groundwater is also threatened by rising sea levels, coastal erosion, and inland storm surges that increase the salinity in key sources of drinking water.
Water Resources and Climate
This section covers climate variability and climate change, their impacts on water availability and water quality, and the risks they pose to local communities and their economies.
KEY TAKEAWAYS
Climate change’s impacts on total rainfall are uncertain, although more intense rainfall will increase risks of flooding and outbreaks of waterborne diseases, especially in coastal cities.
Sea level rise will worsen the impacts of damaging storm surges, submerge coastal wetlands and mangroves, and threaten coastal communities.
Climate change impacts on total rainfall is uncertain, although increasing rainfall intensity will worsen flooding and contribute to outbreaks of infectious diseases. Liberia has high annual precipitation with a wet season from May–October and a cooler, dry season from November–April.50 Rainfall is highest along the coast where it peaks at 1,000 mm/month.50 Liberia’s climate has already warmed by an average of 0.8°C and an additional increase of 1.4-2.4°C is expected by the end of the century. Total rainfall has decreased since the 1960s, however,
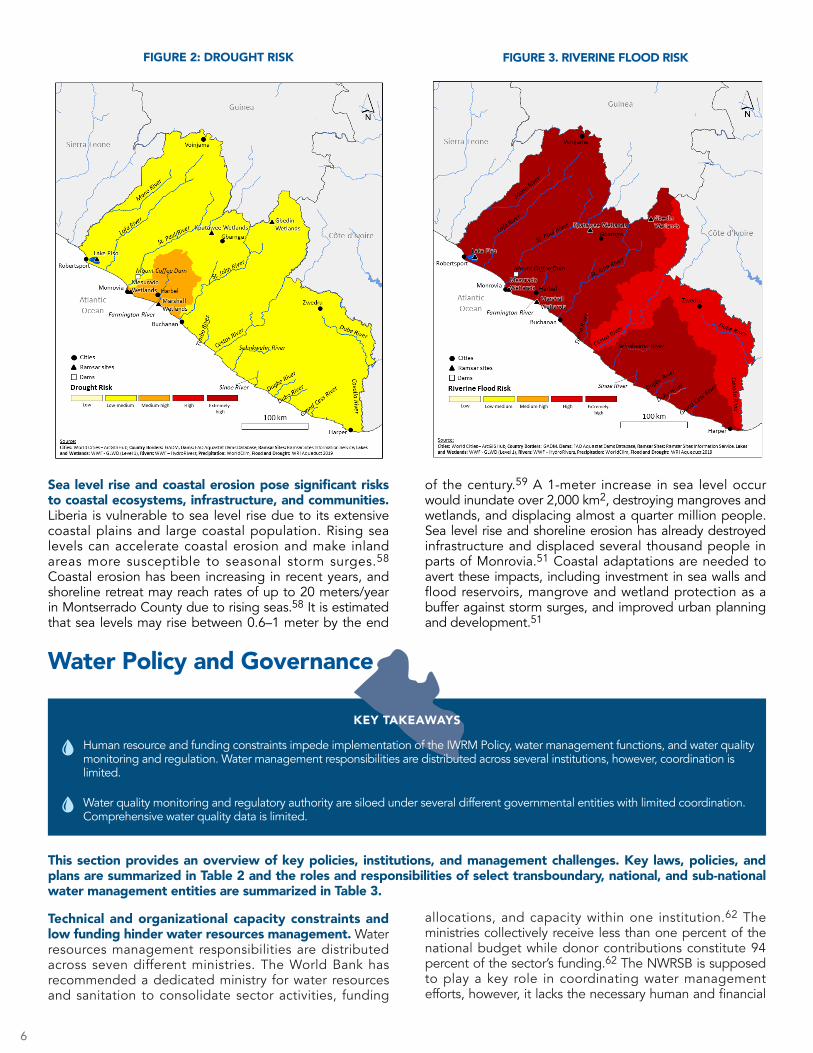
future changes to total rainfall are uncertain.51–53 Riverine flood risks are high throughout Liberia and impacts have worsened in recent years.54 Climate change will increase rainfall intensity, which will worsen flooding and outbreaks of waterborne diseases.48,51 Informal settlements in cities such as Monrovia are most at risk from flooding and public health crises, especially cholera outbreaks. Almost 85,000 Cholera cases have been reported in recent decades, with over 18,000 cases in 2003 alone.55,56
6
FIGURE 2: DROUGHT RISK FIGURE 3. RIVERINE FLOOD RISK
Water Policy and Governance
Sea level rise and coastal erosion pose significant risks to coastal ecosystems, infrastructure, and communities. Liberia is vulnerable to sea level rise due to its extensive coastal plains and large coastal population. Rising sea levels can accelerate coastal erosion and make inland areas more susceptible to seasonal storm surges.58
Coastal erosion has been increasing in recent years, and shoreline retreat may reach rates of up to 20 meters/year in Montserrado County due to rising seas.58 It is estimated that sea levels may rise between 0.6–1 meter by the end
of the century.59 A 1-meter increase in sea level occur would inundate over 2,000 km2, destroying mangroves and wetlands, and displacing almost a quarter million people. Sea level rise and shoreline erosion has already destroyed infrastructure and displaced several thousand people in parts of Monrovia.51 Coastal adaptations are needed to avert these impacts, including investment in sea walls and flood reservoirs, mangrove and wetland protection as a buffer against storm surges, and improved urban planning and development.51
KEY TAKEAWAYS
Human resource and funding constraints impede implementation of the IWRM Policy, water management functions, and water quality monitoring and regulation. Water management responsibilities are distributed across several institutions, however, coordination is limited.
Water quality monitoring and regulatory authority are siloed under several different governmental entities with limited coordination. Comprehensive water quality data is limited.
This section provides an overview of key policies, institutions, and management challenges. Key laws, policies, and plans are summarized in Table 2 and the roles and responsibilities of select transboundary, national, and sub-national water management entities are summarized in Table 3.
Technical and organizational capacity constraints and low funding hinder water resources management. Water resources management responsibilities are distributed across seven different ministries. The World Bank has recommended a dedicated ministry for water resources and sanitation to consolidate sector activities, funding
allocations, and capacity within one institution.62 The ministries collectively receive less than one percent of the national budget while donor contributions constitute 94 percent of the sector’s funding.62 The NWRSB is supposed to play a key role in coordinating water management efforts, however, it lacks the necessary human and financial

TABLE 2. KEY LAWS, POLICIES, AND PLANS
Name Year Purpose
Integrated Water Resources Management (IWRM) Policy
2007 Establishes framework for implementing IWRM. Organized around transboundary and national river basin units as well as sub-national and local administrative boundaries.
Environment Protection and Management Law (EPML)
2002 Empowers the Liberia Environmental Protection Agency to establish water quality standards, water quality monitoring procedures, and the regulation of effluent discharge in consultation with related ministries.
Public Health Law of Liberia 1976 Prohibits discharge of sewage, agricultural, or industrial wastes into Liberian waters without permission. Empowers County Health Administrations to take legal action against polluters when they endanger public health.
7
resources.62 National and local management entities and institutions generally lack sufficient levels of staffing.63 The national IWRM Policy cites ‘brain drain’ as a key challenge to the sector.20
The impacts of low funding and technical capacity are far reaching and elevate risks from flooding and water pollution, especially in Monrovia. Like many other cities, Monrovia has poorly developed storm water management infrastructure, wastewater treatment and sewerage systems, and inadequate urban planning, zoning, and policy enforcement. With underdeveloped sanitation and flood control measures, the wet season routinely disperses sewage and solid waste throughout Monrovia, deteriorating public health, livelihoods, and infrastructure.65,66
Water Quality MonitoringWater quality monitoring and data management responsibilities are shared between the LHS, Ministry of Public Works (MPW), MoHSW, and the Liberia
EPA. The LHS is broadly responsible for surface and groundwater quality monitoring per the IWRM Policy, while the MoHSW and MPW share mandates for monitoring drinking water quality. Additionally, the EPML requires that the Liberia EPA regulate and monitor industrial effluent discharge, harmonize environmental regulations across various ministries, and establish water quality standards based on water use. While most standards are still in the draft stage,68 the Liberia EPA has adopted WHO standards as interim drinking water quality standards until national standards are approved. Drinking water quality standards used by the MoHSW, however, are more stringent than the WHO standards used by the Liberia EPA.20,30,69 Key sectoral entities such as the LWSC have called for regulatory authority of drinking water to be consolidated under one single agency, in addition to water quality monitoring mandates.32 Comprehensive water quality assessments are scarce. In 2017, the MPW completed a survey of over 20,000 water points across all counties, although the survey provided only limited water quality data related to fecal coliforms and basic chemical parameters.70

8
Mandate Institution Roles and Responsibilities
Transboundary Mano River Union (MRU)
Originally established as a bilateral association between Liberia and Sierra Leone to manage the Mano River. MRU membership has expanded to include Cote d’Ivoire and Guinea and addresses transboundary basin management of all rivers shared between member states.
National
National Water Resources & Sanitation Board (NWRSB)
Responsible for streamlining planning and implementation of water sector programs and projects, mediating water use disputes, and coordinating investments related to irrigation, hydroelectric generation, fluvial navigation, and water service delivery. Chaired by the MME with members from all relevant ministries and agencies.
Ministry of Mines and Energy (MME)
Broadly responsible for all water resource management decisions, including water allocation and permitting, water policy development and implementation. Leads inter-ministerial collaboration for water sector. Creates Local Water Coordination Units (WACUs) and supports capacity building.
Liberian Hydrological Service (LHS)
Housed within the Department of Mineral Exploration and Environmental Research (DMER) in the MEE, charged with water resources management and data collection. Measures rainfall and flow of major rivers. Also responsible for monitoring groundwater balance, as well as surface and groundwater quality and dissemination of data to public.
Environmental Protection Agency (EPA)
Sets drinking and surface water quality standards, conducts environmental impact assessments, approves effluent discharge permits, and enforces environmental laws and penalties when water quality infractions are detected. Streamlines segmented environmental regulations and programs within different ministries
Ministry of Health & Social Welfare (MoHSW)
Monitors water quality and sets regulatory standards for drinking and environmental waters, overlapping with the Liberia EPA water quality standards
Sub-national
National River Basin Management Units In charge of basin-level development under the supervision of the MEE. Most basins do not have operational Basin Management Units.
River Basin Management Committees (RBMC)
Stakeholder engagement platform at the basin-level, composed of government representatives from water sector. Most basins do not have an RBMC.
Water Resources and Sanitation Committees
Sub-committees within County Development Committees, District Development Committees, and Community Development Councils. Develop and manage budgets for water resources projects, water regulations, and water development plans.
TABLE 3: WATER RESOURCES MANAGEMENT ENTITIES
References (1) Liberian Hydrological Service. Liberia River Basins 2016: Drainage Divisions and River Basin Boundaries; Monrovia, 2016.(2) Liberia Environmental Protection Agency. Liberia National Drought Plan; Monrovia, 2019.(3) Balarin, J. National Reviews for Aquaculture Development in Africa; FAO: Rome, 1984.(4) Liberian Hydrological Service. Rivers.(5) Gatter, W. The Coastal Wetlands of Liberia: Their Importance for Wintering Water Birds. International Council for Bird Preservation; UCBP: Cambridge, 1988.(6) USAID. Liberia- Environmental Threats and Opportunities; Washington, D.C., 2014.(7) The Ramsar Convention Secretariat. Annotated List of Wetlands of International Importance Liberia https://www.ramsar.org/wetland/liberia (accessed Jul 10, 2020).(8) FAO. AQUASTAT - FAO’s Global Information System on Water and Agriculture http://www.fao.org/aquastat/en/databases/dams (accessed Aug 19, 2020).(9) U.S. Embassy in Liberia. U.S. Government Supports Start of Power Generation at Mount Coffee https://lr.usembassy.gov/u-s-governments- millennium-challenge-corporation-investment-supports-start-power-generation-mount-coffee/ (accessed Aug 3, 2021).(10) Earthwise British Geological Survey. Hydrogeology of Liberia http://earthwise.bgs.ac.uk/index.php/Hydrogeology_of_Liberia (accessed Aug 3, 2021).
9
(11) Faillace, C. Hydrogeology of Hard Rocks in Some Eastern and Western African Countries. In Groundwater in Fractured Rock; Krásný, J., Sharp, J., Eds.; CRC Press: Boca Raton, 2007.(12) Elster, D.; Holman, I.; Parker, A.; Rudge, L. An Investigation of the Basement Complex Aquifer System in Lofa County, Liberia, for the Purpose of Siting Boreholes. J. Eng. Geol. Hydrogeol. 2014, 47 (2), 159–167. https://doi.org/10.1017/CBO9781107415324.004.(13) Kumpel, E.; Albert, J.; Peletz, R.; De Waal, D.; Hirn, M.; Danilenko, A.; Uhl, V.; Daw, A.; Khush, R. Urban Water Services in Fragile States: An Analysis of Drinking Water Sources and Quality in Port Harcourt, Nigeria, and Monrovia, Liberia. Am. J. Trop. Med. Hyg. 2016, 95 (1), 229–238. https://doi.org/10.4269/ajtmh.15-0766.(14) PRACTICA Foundation; Relief International; UNICEF. Republic of Liberia Feasibility Study for Manual Drilling Mapping of Favourable Zones; Monrovia, 2010.(15) FAO. Aquastat Main Database http://www.fao.org/nr/water/aquastat/data/query/results.html (accessed Jul 8, 2020).(16) Büyükcangaz, H.; Alhassan, M.; Harris, J. Modernized Irrigation Technologies in West Africa. Turkish J. Agric. 2017, 5 (12), 1524–1527. https://doi. org/10.24925/turjaf.v5i12.1524-1527.1429.(17) Ministry of Agriculture. LIBERIAN AGRICULTURAL SECTOR INVESTMENT PLAN (LASIP II); Monrovia, 2018.(18) Government of Liberia. Water, Sanitation & Hygiene (WASH) Sector Performance Report; Monrovia, 2014.(19) USAID. Situational Analysis Report: Liberia Municipal Water Project; 2012.(20) Ministry of Lands Mines and Energy. The Republic of Liberia Water Supply and Sanitation Policy; Monrovia, 2009.(21) Wilson, S. T. K.; Wang, H.; Kabenge, M.; Qi, X. The Mining Sector of Liberia: Current Practices and Environmental Challenges. Environ. Sci. Pollut. Res. 2017, 24 (23), 18711–18720. https://doi.org/10.1007/s11356-017-9647-4.(22) Ministry of Mines and Energy. Online Repository https://portal.mme.gov.lr/map (accessed Jul 30, 2020).(23) Liberian Hydrological Service. Discharge Data: Water Data http://lhsliberia.com/water-data/st-john-river-at-mt-finlay-2/#map (accessed Jul 10, 2020).(24) The International Bank for Reconstruction and Development/ The World Bank Group. Options for the Development of Liberia’s Energy Sector; Washington, D.C., 2011.(25) USAID. Liberia: Power Africa Fact Sheet https://www.usaid.gov/powerafrica/liberia (accessed Jul 14, 2020).(26) POYRY. Mount Coffee HPP ESIA and RAP Environmental and Social Impact Assessment and Resettlement Action Plan; Cotonou, 2012.(27) Dorko, K. Environmental Impacts of Gold Mining in Liberia : A Case Study of New Liberty and MNG Kokoya Gold Mines; Monrovia, 2018.(28) WHO. Guidelines for Drinking-Water Quality: Fourth Edition Incorporating the First Addendum; WHO: Geneva, 2017.(29) Senkpeni, A. Liberia: Cyanide Polluted Towns In Bong County Sue MNG Gold For US$285 Million In Damages https://frontpageafricaonline.com/ front-slider/liberia-cyanide-polluted-towns-in-bong-county-sue-mng-gold-for-us285-million-in-damages/ (accessed Jul 24, 2020).(30) Liberia Environmental Protection Agency. Guidelines for the Operation & Monitoring of Drinking Water Production; Monrovia, 2017.(31) Ministry of Mines and Energy. News https://mme.gov.lr/news/ (accessed Jul 15, 2020).(32) Liberia Water & Sewer Corporation. The Liberia Urban Water Supply Project : Environmental and Social Impact Assessment; Monrovia, 2019.(33) African Water Facility. Fostering Innovative Sanitation and Hygiene in Monrovia, Liberia; Abidjan, 2012.(34) Japan International Cooperation Agency; Yachiyo Engineering Co., L.; Katachira & Engineers International. The Master Plan Study on Urban Facilities Restoration and Improvement in Monrovia in the Republic of Liberia Final Report Executive Summary; Monrovia, 2009.(35) David, V.; Jiang, W.; John, Y.; Hossain, S. Sewage Sludge Management A Case Study of Monrovia, Montserrado County Liberia. Int. J. Sci. Eng. Res. 2016, 7 (11), 170–175.(36) WHO/UNICEF Joint Monitorring Programme. People practicing open defecation, rural (% of rural population) https://data.worldbank.org/ indicator/SH.STA.ODFC.RU.ZS (accessed Jul 21, 2020).(37) Liberian Hydrological Service. Basins Report http://lhsliberia.com/publications-and-reports/basins-report/ (accessed Jul 31, 2020).(38) Trimble. Liberia National Concession Portal http://portals.landfolio.com/Liberia/ (accessed Jul 30, 2020).(39) Mongabay. Deforestation Statistics for Liberia https://rainforests.mongabay.com/deforestation/archive/Liberia.htm (accessed Mar 8, 2021).(40) Siakor, S. Uncertain Futures: The Impacts of Sime Darby on Communities in Liberia; 2012.(41) Mighty Earth. A Bridge Too Far? Social and Environmental Concerns in Bridgestone’s Liberian Rubber Plantation and a Plan for Remediation; Washington, D.C., 2020.(42) Woods, R. Information Sheet on Ramsar Wetlands (RIS).(43) United Nations Mission in Liberia. Human Rights in Liberia’s Rubber Plantations: Tapping into the Future; Monrovia, 2006.(44) Japan International Cooperation Agency; Yachiyo Engineering Co., K. & E. I. The Master Plan Study on Urban Facilities Restoration and Improvement in Montrovia in the Republic of Liberia. Final Report Executive Summary; 2009.(45) Uhl, V.; Daw, A.; Baron, J. How a City Gets Its Drinking Water A Case Study - Capital City of Monrovia , Liberia; Lambertville, 2011.(46) Arno, Z. Geochemical and Microbial Controls of Groundwater Quality in Northwestern Liberia, University of Nevada, 2017.(47) McClain, J.; Skrip, L.; Paye, P. Exploratory Study of Groundwater Quality Use for Drinking in the Duport Road and Soul Clinic Diamond Creek Communities, Paynesville City, Republic of Liberia. Int. J. Sci. Res. Sci. Technol. 2018, 4 (5), 1224–1227. https://doi.org/10.13140/ RG.2.2.35761.53600.(48) USAID. Climate Change Adaptation in Liberia; Washington, D.C., 2017.(49) Earth Resources Observation and Science (EROS) Center. Ecoregions and Topography of Liberia https://eros.usgs.gov/westafrica/ecoregions-and- topography/ecoregions-and-topography-liberia (accessed Aug 5, 2021).(50) Liberia Environmental Protection Agency. National Policy and Response Strategy on Climate Change Liberia; Monrovia, 2018.(51) World Bank Group. Climate Risk Country Profile Liberia; Washington, D.C., 2021.(52) USAID. Climate Risks in Food for Peace Geographies: Liberia; 2017.(53) World Bank Group. Climate Change Knowledge Portal https://climateknowledgeportal.worldbank.org/country/liberia/climate-data-projections (accessed Sep 15, 2020).(54) International Federation of Red Cross and Red Crescent Societies. Emergency Plan of Action Final Report Liberia: Montserrado & Margibi Floods; 2017.(55) ACAPS. Liberia: Risks; 2015.(56) Rebaudet, Stanislas; Sudre, Bertrand; Faucher, Benoit; Piarroux, R. Cholera in Coastal Africa: A Systematic Review of Its Heterogeneous Environmental Determinants. J. Infect. Dis. 2013, 208 (1). https://doi.org/10.1093/infdis/jit202.(57) Green Climate Fund. Project Preparation Funding Application: Preparatory Assessments for the Monrovia Metropolitan Climate Resilience Project (MMCRP); Incheon City, 2018.(58) UNDP. Coastal Zone Development https://www.adaptation-undp.org/thematic-areas/coastal-zone-development (accessed Jul 16, 2020).(59) USAID. Climate Change Adaptation in Liberia; Washington, D.C., 2011.(60) IUCN; GEF. Mano River Ecosystem Conservation and International Water Resources Management (IWRM) Project.(61) FrontPageAfrica. Mano River Union Establishes Transboundary Water Resources National Advisory C’ttee https://frontpageafricaonline.com/news/ mano-river-union-establishes-transboundary-water-resources-national-advisory-cttee/ (accessed Feb 22, 2021).(62) The World Bank. Liberia Gov Constraints to Service Delivery WASH Sector Financing; Washington, D.C., 2019.
ABOUT THIS PROFILEThis profile was produced by USAID's Sustainable Water Partnership activity.
DISCLAIMERThe author’s views expressed in this publication do not necessarily reflect the views of the United States Agency for International Development or the United States Government
(63) National Water Sanitation and Hygiene Promotion Committee. Capacity Development Plan; Monrovia, 2012.(64) Obediah, J. Liberia Water & Sewer Corporation Employees Hold Mass Meeting on Delay in The Payment of Five Months’ Salary Arrears, Others https://frontpageafricaonline.com/news/liberia-water-sewer-corporation-employees-hold-mass-meeting-on-delay-in-the-payment-of-five- months-salary-arrears-others/ (accessed Jul 21, 2020).(65) Bangura, K. A. Liberia Water Supply and Sanitation Rehabilitation Programme. Environmental and Social Management Plan https://documents1. worldbank.org/curated/en/122901468772189437/text/E17310AfDB1ESMP0for0Infoshop0disclosure.txt.(66) National Disaster Management Agency. National Disaster Management Policy; Monrovia, 2012.(67) Liberian Hydrological Service. LHS http://lhsliberia.com/operational-hydrology/lhs/ (accessed Mar 10, 2021).(68) Liberia Environmental Protection Agency. EPA Final 2019 Consolidated Annual Report; Monrovia, 2019.(69) Liberia Electricity Corporation. Liberia Accelerated Electricity Expansion Project (LACEEP): Environmental and Social Impact Assessment for Paynesville – Kakata 66KV Transmission Line; Monrovia, 2014. https://doi.org/10.1016/j.physletb.2014.06.013.(70) WASH Liberia. General water point characteristics https://wash-liberia.org/water-point-data/water-point-characteristics/ (accessed Mar 17, 2021).
Related Documents