råáp råáîÉêëáíó çÑ pìêêÉó Discussion Papers in Economics Department of Economics University of Surrey Guildford Surrey GU2 7XH, UK Telephone +44 (0)1483 689380 Facsimile +44 (0)1483 689548 Web www.econ.surrey.ac.uk LIABILITY, INSURANCE AND DEFENSIVE MEDICINE: NEW EVIDENCE By Paul Fenn (Nottingham University Business School) Alastair Gray (Health Economics Research Centre, University of Oxford) & Neil Rickman (University of Surrey and CEPR) DP 03/04

Welcome message from author
This document is posted to help you gain knowledge. Please leave a comment to let me know what you think about it! Share it to your friends and learn new things together.
Transcript
råáp=== = = ======råáîÉêëáíó=çÑ=pìêêÉó
Discussion Papers in Economics
Department of Economics University of Surrey
Guildford Surrey GU2 7XH, UK
Telephone +44 (0)1483 689380 Facsimile +44 (0)1483 689548 Web www.econ.surrey.ac.uk
LIABILITY, INSURANCE AND DEFENSIVE MEDICINE: NEW EVIDENCE
By
Paul Fenn
(Nottingham University Business School)
Alastair Gray (Health Economics Research Centre, University of Oxford)
& Neil Rickman
(University of Surrey and CEPR)
DP 03/04

Liability, insurance and defensive medicine: new evidence1
Paul Fenn
Nottingham University Business School
Alastair Gray Health Economics Research Centre, University of Oxford
Neil Rickman
University of Surrey and CEPR
17 July 2004 Abstract
For the first time, we test for effects of liability on hospital care using measures of current perceptions of litigation risk at hospital level; in particular, the risk-sharing arrangements agreed between hospitals and their insurers. GMM and ML estimators are used to allow for possible endogeneity of risk-sharing arrangements. Our findings are consistent with the exercise of liability-induced discretion by hospitals, especially regarding use of costly diagnostic imaging. Hospitals facing higher expected litigation costs also use these tests more frequently, after controlling for activity levels, casemix and treatment outcome; the latter indicating that defensive medicine may be present. We also find evidence of fewer new claims against these hospitals, given adverse events, which may indicate the increased use of claims management processes by hospital managers concerned at the expected cost of litigation. KEYWORDS: Medical malpractice, defensive care, insurance, litigation JEL Classification: I18, K13
1 Corresponding author Paul Fenn, Nottingham University Business School, Jubilee Campus, Wollaton Rd, Nottingham NG8 1BB, UK. Email: [email protected]. We are grateful to seminar participants at Edinburgh University Management School and CMPO, Bristol, UK for comments on an earlier draft.

1 Introduction
Health care providers in many countries can face significant costs arising from
the need to compensate patients who have suffered from negligent care. The
incentive to avoid these costs is arguably a means by which health care quality
can be governed. At the same time, it is possible that providers will over-
supply care to minimise the risk of successful claims. Were it to occur, such
“defensive” behaviour would constitute a misallocation of scarce health
resources. Understandably, policy makers have been exercised by this issue,
most recently in the US and the UK.2
Empirical work by Kessler and McClellan (1996) notes that tort liability
reform throughout the US in the ‘80s and ‘90s should have influenced
treatment levels because of associated changes in physicians’ exposure to
litigation risk. Using data on heart treatments in 1984, 1987 and 1990, they
estimate that reforms aimed at relaxing tort (e.g. damage caps, contingency fee
caps, shifts to no-fault) decreased expenditure on heart treatments by between
5% and 9% over the period, without any significant impact on health
outcomes. From this they infer that the expenditure incurred was unnecessary
from the health care perspective and was therefore evidence of so-called
“defensive medicine”. Similarly, Dubay et al (1999, 2001) report evidence of
“defensive” cesarian sections and prenatal care in response to malpractice
fears, but of smaller magnitude, while results from an Office of Technology
Assessment study, based on physician surveys about hypothetical clinical
scenarios, found that approximately 8% of diagnostic testing was “consciously
2 For example: “When I first came to Washington, I wasn't sure if the proper role of the federal government was to get involved with medical liability reform. Then I saw what frivolous lawsuits and the defensive practice of medicine do to the federal budgets. They cost us a lot of money. And it's a national issue, therefore. And so Congress needs to pass medical liability reform -- not only to send a message that tort reform is vital, but also to help us control the cost of medicine…” (President Bush to Newspaper Association of America Annual Convention, April 21st, 2004). In the UK, see the Chief Medical Officer’s recent report on reform options for medical malpractice (CMO, 2003).
2
defensive” (OTA, 1994). However, a Congressional Budget Office analysis
failed to replicate Kessler and McClellan’s findings when extended to other
patient groups (Beider and Hagen, 2004).3 More recently, Kessler and
McClellan have extended their research by exploring the mechanisms by
which tort reforms affect the behaviour of health care providers, and find that
the main effect is on the reduction of claim frequency and cost (Kessler and
McClellan, 2000). It seems that US health care providers responded to
changes in “malpractice pressure” primarily through using more diagnostic
procedures in order to manage claims rather than improving health
outcomes.4
The premise underpinning this notion of defensive medicine is that more
diagnostic procedures may help providers establish in court that sufficient care
was taken in order to disprove claims of negligence, even where these
procedures have no proven impact on treatment outcomes.5 However, the
incentive for providers to behave in this way could be diluted to the extent
that they are covered by liability insurance, given that the insurer will bear
(some of) the cost of each claim. This paper is concerned with the impact on
defensive medicine of risk-sharing provisions imposed by liability insurers.
The paper presents evidence on the effect of insurance deductibles (or
“excesses”) on the extent to which individual hospitals successfully manage
the risk of litigation, and whether this is associated with any discernable
impact on treatment outcomes and/or the utilization of diagnostic
procedures.
3 Similar ambiguity also appears in earlier work on defensive medicine: see Localio et al (1993), Klingman et al (1996), Baldwin et al (1995) and Sloan et al (1997). For broader overviews of the area see Danzon (2000a) and (2000b), Weiler (1991) and Weiler et al (1993). 4 Moreover, it could be argued that US health care providers were better able to pursue this strategy because of the predominance of fee-for-service (“indemnity”) health insurance, and that the advent of managed care may remove some of the opportunities for undertaking diagnostic procedures which are not cost-justified from the perspective of the plan (Kessler and McClellan, 2002). 5 This of course implies a failure of the courts to apply an appropriate test of the standard of care required – namely one which equated the marginal cost of care with its marginal benefit in terms of improved outcomes.
3
The paper makes two contributions. First, information on liability insurance
excess levels provides a unique insight into the variying litigation risk to which
individual providers are exposed. Previously, a number of variables have been
used to proxy the extent of this risk: Kessler and McClellan’s work uses state-
level variations in tort regime; Localio et al. use area-wide variations in
physician insurance premiums; Sloan et al. use previous claims experience.
Each of these presents difficulties relating to the potential remoteness of the
measure from current incentives for care. We believe that we are able to
measure a hospital’s perceived litigation risk more accurately than previous
work because insurance deductibles (observed at hospital level) provide a
direct link with the expected cost of litigation arising from a given claim. In
addition, while insurance coverage decisions, claims experience and tort
reforms are all potentially endogenous (see Sloan et al, 1997; Cummins et al,
2001), hospital level data are more likely to yield suitable instrumental
variables as a means of addressing this problem convincingly, and our paper
draws on this potential6
Our second contribution is to note that defensive behaviour in the face of tort
risk may encompass managerial decisions, such as those identified as
“informal dispute resolution” techniques by Farber and White (1991). In
principle, the effects of insurance excesses on the hospital’s investment in
both clinical and managerial decisions will depend on whether these inputs are
complements or substitutes: for example, does additional informal dispute
resolution effort increase or decrease the need for treatment care? For the
first time, we consider this empirically by examining the link between
insurance excesses and claims experience (on the assumption that such
managerial decisions are aimed at decreasing the likelihood of a claim arising
for a given level of care).
6 Sloan et al (1997) test for endogeneity using instrumental variables, but these are drawn from county level data.
4
The paper is structured as follows. Section 2 gives some basic theory. Section
3 reviews data available to us from UK hospitals, and the following section
outlines the estimation methodology by which we test hypotheses concerning
the effect of litigation risk on diagnostic procedures and treatment outcomes.
Section 5 presents our results and a final section concludes.
2 Theory
Treatment failures (y) can be reduced if those involved take care (x) to avoid
them. We assume that y=y(x), and yx<0, yxx>0. However, to the extent that
care is costly, health care providers may need to be given incentives to provide
it. One natural incentive against insufficient care levels is to make the
provider causing the harm (assuming causation can be determined) liable for
the costs involved, if that provider fails to supply care beyond a sufficient
threshold (i.e. behaves ‘negligently’). In theory, for each treatment episode, the
socially optimal level of care minimises total expected accident costs x +
p(x)D, where D is the resulting damages, and p(x) is the probability of a
treatment failure, assumed to be decreasing in x, but at a decreasing rate. The
socially optimal level of care solves 1 + p′(x*)D = 0: the marginal social
benefit from an extra unit of care should equal its marginal social cost.7 If
courts are concerned with efficiency, they will set the legal standard of care at
x*. If a patient suffers a treatment failure, and it can be shown that the
provider delivered care below x*, it will be liable to pay D as compensation to
the patient.
When the level of care is observable to all, and a claim for damages is made if
x<x*, it is straightforward to show that negligence liability would produce
7 See Miceli (1997) for more sophisticated models of liability rules.
5
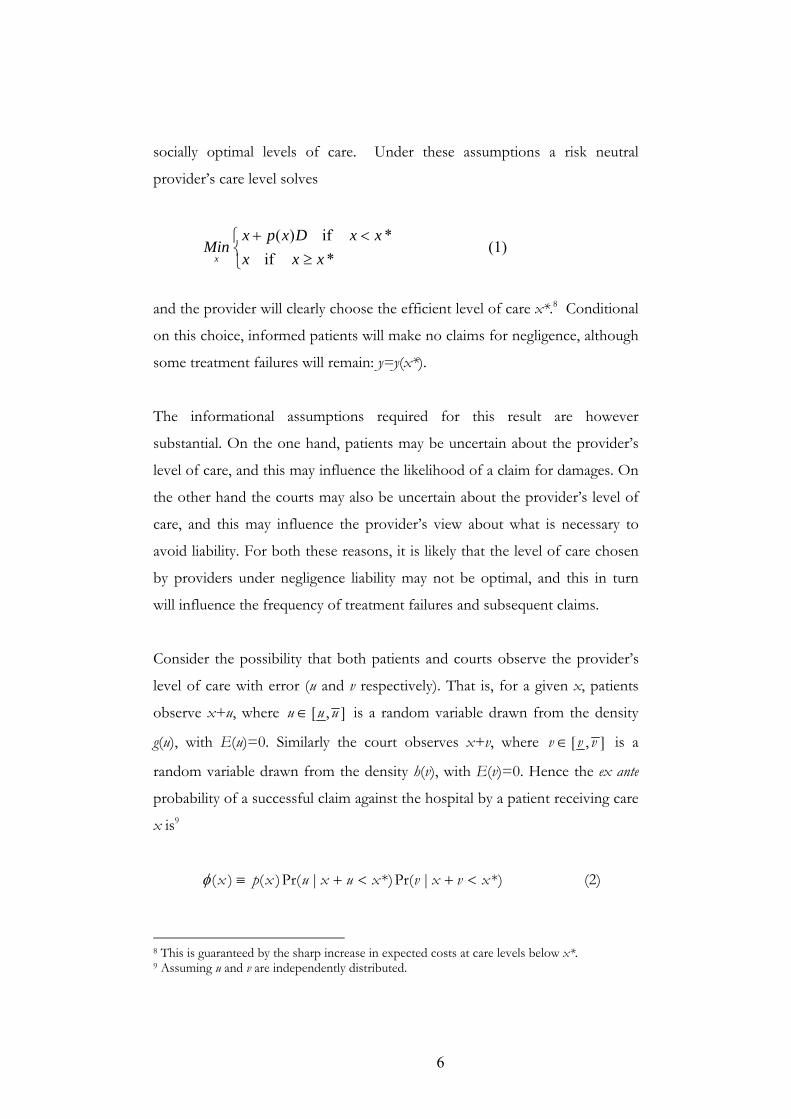
socially optimal levels of care. Under these assumptions a risk neutral
provider’s care level solves
(1) ⎩⎨⎧
≥<+
*if*if)(
xxxxxDxpx
Minx
and the provider will clearly choose the efficient level of care x*.8 Conditional
on this choice, informed patients will make no claims for negligence, although
some treatment failures will remain: y=y(x*).
The informational assumptions required for this result are however
substantial. On the one hand, patients may be uncertain about the provider’s
level of care, and this may influence the likelihood of a claim for damages. On
the other hand the courts may also be uncertain about the provider’s level of
care, and this may influence the provider’s view about what is necessary to
avoid liability. For both these reasons, it is likely that the level of care chosen
by providers under negligence liability may not be optimal, and this in turn
will influence the frequency of treatment failures and subsequent claims.
Consider the possibility that both patients and courts observe the provider’s
level of care with error (u and v respectively). That is, for a given x, patients
observe x+u, where [ , ]u u u∈ is a random variable drawn from the density
g(u), with E(u)=0. Similarly the court observes x+v, where [ , ]v v v∈ is a
random variable drawn from the density h(v), with E(v)=0. Hence the ex ante
probability of a successful claim against the hospital by a patient receiving care
x is9
( ) ( )Pr( | *)Pr( | *)x p x u x u x v x v xφ ≡ + < + < (2)
8 This is guaranteed by the sharp increase in expected costs at care levels below x*. 9 Assuming u and v are independently distributed.
6
where = Pr( | *)u x u x+ <*
( )x x
ug u du
−
∫ is the probability of a patient claim
conditional on the occurrence of a treatment failure, and Pr( = | *)v x v x+ <
*( )
x x
vh v dv
−
∫ is the probability that the claim succeeds in court. It follows
from the above assumptions that 0xφ < . The risk neutral provider’s care level
now solves
( )x
Min x x Dφ+ (3)
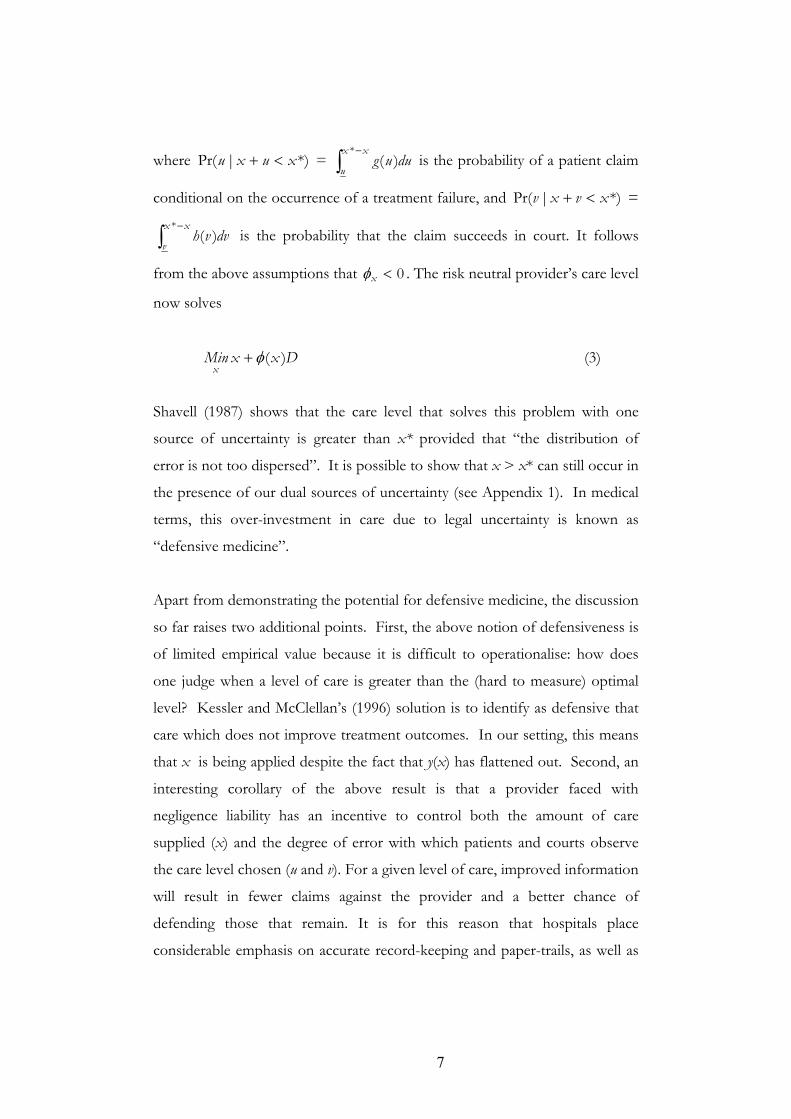
Shavell (1987) shows that the care level that solves this problem with one
source of uncertainty is greater than x* provided that “the distribution of
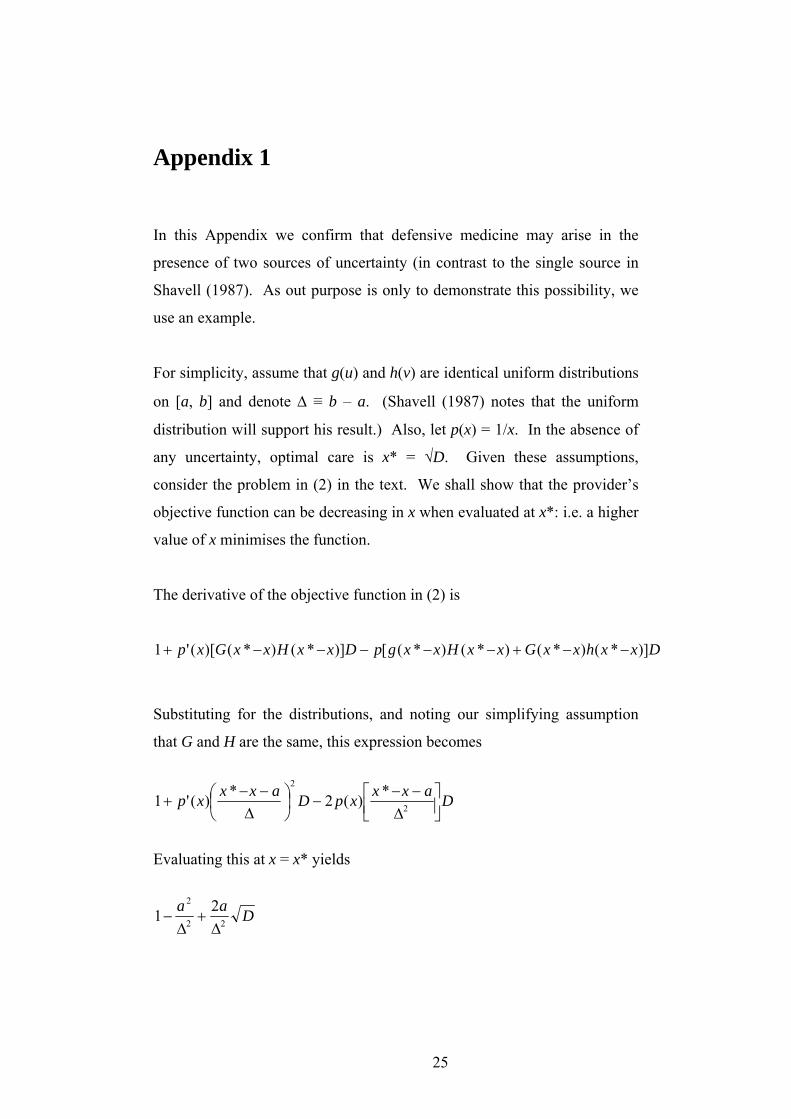
error is not too dispersed”. It is possible to show that x > x* can still occur in
the presence of our dual sources of uncertainty (see Appendix 1). In medical
terms, this over-investment in care due to legal uncertainty is known as
“defensive medicine”.
Apart from demonstrating the potential for defensive medicine, the discussion
so far raises two additional points. First, the above notion of defensiveness is
of limited empirical value because it is difficult to operationalise: how does
one judge when a level of care is greater than the (hard to measure) optimal
level? Kessler and McClellan’s (1996) solution is to identify as defensive that
care which does not improve treatment outcomes. In our setting, this means
that x is being applied despite the fact that y(x) has flattened out. Second, an
interesting corollary of the above result is that a provider faced with
negligence liability has an incentive to control both the amount of care
supplied (x) and the degree of error with which patients and courts observe
the care level chosen (u and v). For a given level of care, improved information
will result in fewer claims against the provider and a better chance of
defending those that remain. It is for this reason that hospitals place
considerable emphasis on accurate record-keeping and paper-trails, as well as
7
run a variety of complaints and mediation procedures in order to prevent
treatment failures developing into legal claims (Farber and White, 1991).
Activities of this nature are sometimes also discussed under the heading
“defensive medicine”, but we prefer to reserve that term for the (over) use of
diagnostic or treatment procedures in response to the threat of litigation.10 In
the context of our model, the provision of such information will alter the
distribution of court and patient errors and, potentially, change the provider’s
need to supply defensive levels of care. As claims management procedures
are, like care, costly to operate, we would expect providers to use a
combination of these measures in order to reduce their litigation risk.11
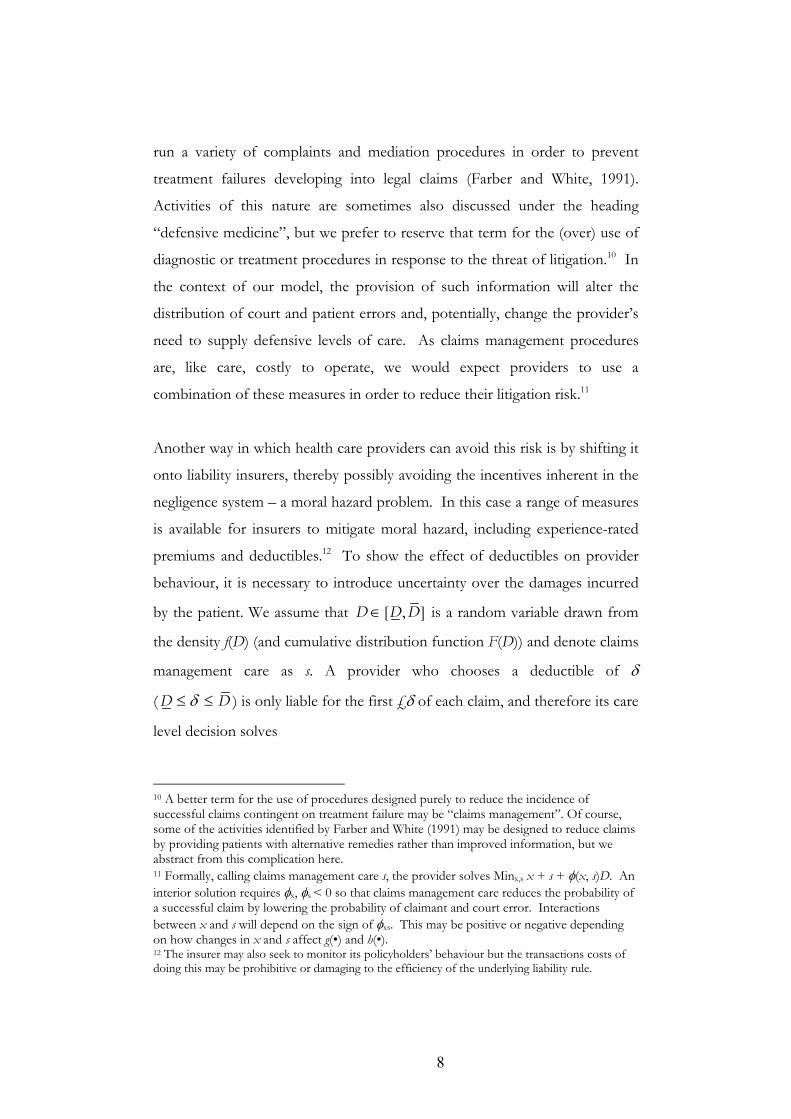
Another way in which health care providers can avoid this risk is by shifting it
onto liability insurers, thereby possibly avoiding the incentives inherent in the
negligence system – a moral hazard problem. In this case a range of measures
is available for insurers to mitigate moral hazard, including experience-rated
premiums and deductibles.12 To show the effect of deductibles on provider
behaviour, it is necessary to introduce uncertainty over the damages incurred
by the patient. We assume that [ , ]D D D∈ is a random variable drawn from
the density f(D) (and cumulative distribution function F(D)) and denote claims
management care as s. A provider who chooses a deductible of δ
( D Dδ≤ ≤ ) is only liable for the first £δ of each claim, and therefore its care
level decision solves
10 A better term for the use of procedures designed purely to reduce the incidence of successful claims contingent on treatment failure may be “claims management”. Of course, some of the activities identified by Farber and White (1991) may be designed to reduce claims by providing patients with alternative remedies rather than improved information, but we abstract from this complication here. 11 Formally, calling claims management care s, the provider solves Minx,s x + s + φ(x, s)D. An interior solution requires φx, φs < 0 so that claims management care reduces the probability of a successful claim by lowering the probability of claimant and court error. Interactions between x and s will depend on the sign of φxs. This may be positive or negative depending on how changes in x and s affect g(•) and h(•). 12 The insurer may also seek to monitor its policyholders’ behaviour but the transactions costs of doing this may be prohibitive or damaging to the efficiency of the underlying liability rule.
8

)|(),(,
δφ DEsxsxMinsx
++ (4)
where
( | ) ( ) [1 ( )]D
E D Df D dD Fδ
δ δ δ= + −∫ (5)
While one might expect providers facing a larger share of their liability risk as
a consequence of a large deductible to increase both treatment and claims
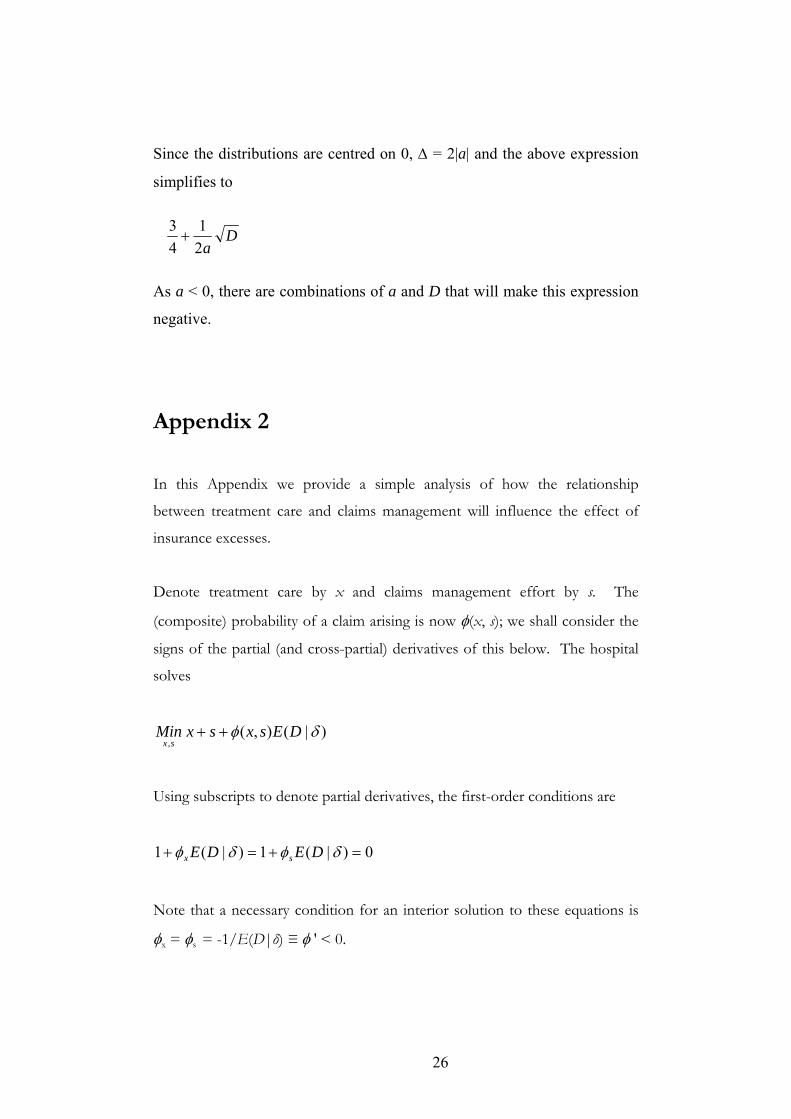
management care, the effects of δ on x and s are generally ambiguous,
depending on the sign of φxs. In Appendix 2, a necessary condition for δ to
increase both care levels is shown to be φxs < max{φxx, φss}: the care levels are
complements or ‘moderate’ substitutes. An intuitive (if extreme) example of a
failure to meet this condition would be the case where claims management is
so effective that claims rarely proceed, rendering treatment care relatively
redundant. In this case, the latter may not need to increase with the risk of
litigation.
To summarise our discussion, providers facing a litigation risk may take a
number of steps to reduce this. In the presence of patient and court error in
the observation of care levels, these are likely to include the defensive over-
supply of treatment as well as investment in a variety of claims management
processes (including detailed record keeping). Such activities seek to reduce
the impact of uncertainty on the likelihood of facing a claim and, conditional
on such a claim, on the likelihood of losing the case. We would typically
(though not necessarily) expect providers who face a higher litigation risk (say,
through a high deductible) to supply more care and to take more measures to
reduce claims. These predictions are, in themselves, of considerable interest
as they make clear that providers can adopt a variety of costly responses to
changes in their risk of litigation. Accordingly, it is important to take all of
these into account when assessing the effects of such changes in risk. Further,
9
to the extent that any extra treatment care supplied does not affect treatment
outcomes, there may be evidence of defensive medicine. Below, we describe
the data and methods we use to test these predictions, and the results.
3 Data
3.1 Excess levels
All hospitals in the UK face the same system of civil law, and the basis of
liability has remained unchanged for centuries. However, it hospitals have not
all faced the same expected cost of litigation. Since 1990, the health service in
the UK has been decentralised to a significant degree such that individual
hospitals have acquired considerable financial autonomy and have adopted
commercial accounting practices. Over the same period, moreover, the
responsibility for compensating injured patients has, almost unnoticed, shifted
first from the individual clinician to the hospital13, and now finally to the
National Health Service Litigation Authority (NHSLA) as the central agency
set up to pool litigation risks through what is known as the Clinical
Negligence Scheme for Trusts (CNST). The NHSLA has, from April 2002,
taken financial responsibility for 100% of all claims against NHS hospitals.
Prior to this date, under the terms of the CNST, hospitals had to retain part of
the cost through choosing an “excess” level (i.e. a deductible), below which
they were responsible for the patient’s claim. Thus, each hospital until
recently has chosen an excess level under the pooling scheme (the CNST), and
this determines the subsequent exposure to liability risk. The payment for
CNST cover varies depending on the hospital’s casemix, the excess level
13 So called “NHS indemnity” was introduced in 1990; in effect, the NHS accepted vicarious liability for negligent errors made by its employees and clinicians. In a broader context, it is this focussing of liability on the organization rather than the individual that has come to be known as “enterprise liability”.
10

chosen, and, to a limited degree, the risk management standards applied and
the claims experience observed over previous years.14 Hospitals with low
excess levels faced a lower expected cost from litigation than those with high
excess levels. Consequently we have a unique opportunity to test whether this
variation in liability risk had an impact on claim frequency, treatment failures
and the use of diagnostic tests. Table 1 shows the variation in CNST excess
levels across all English hospitals in the scheme:
Table 1 here
One fundamental issue for the subsequent analysis of these data is the
potential endogeneity of the chosen excess level. It is quite plausible that the
perception of liability risk is an important consideration when hospital
management decides upon the appropriate CNST excess level to choose, with
a consequent risk of simultaneity bias in the estimates.15 For this reason in
what follows we have tested for and, where necessary, used appropriate
estimators in order to allow for the endogeneity of this variable.
3.2 Claims experience
Claims experience can be measured in a number of ways. For a sample of
English hospitals in the CNST, we obtained data on the number of opened
claims, the number of paid claims, and the number of claims currently
outstanding (Fenn et al, 2001). Of these, the number of CNST claims newly
opened is likely to be the best reflection of current care levels, given the long
14 Discounts of up to 25% of assessed contributions are given to hospitals who can demonstrate that they have in place certain risk management procedures. Contributions may also be varied by +/- 10% if there is evidence that their recent claims experience is substantially different from what was expected based on their casemix. 15 Hospitals which feel they are at high risk of litigation, and who believe they can do little about this, may optimally choose low deductibles. Hospitals which believe they have taken effective action to control the risk of litigation may optimally choose high deductibles. For both these reasons, the measures we investigate below (claims, treatment failures, diagnostic tests) may be simultaneously determined with the excess level.
11
delay between claim initiation and claim payment for many medical
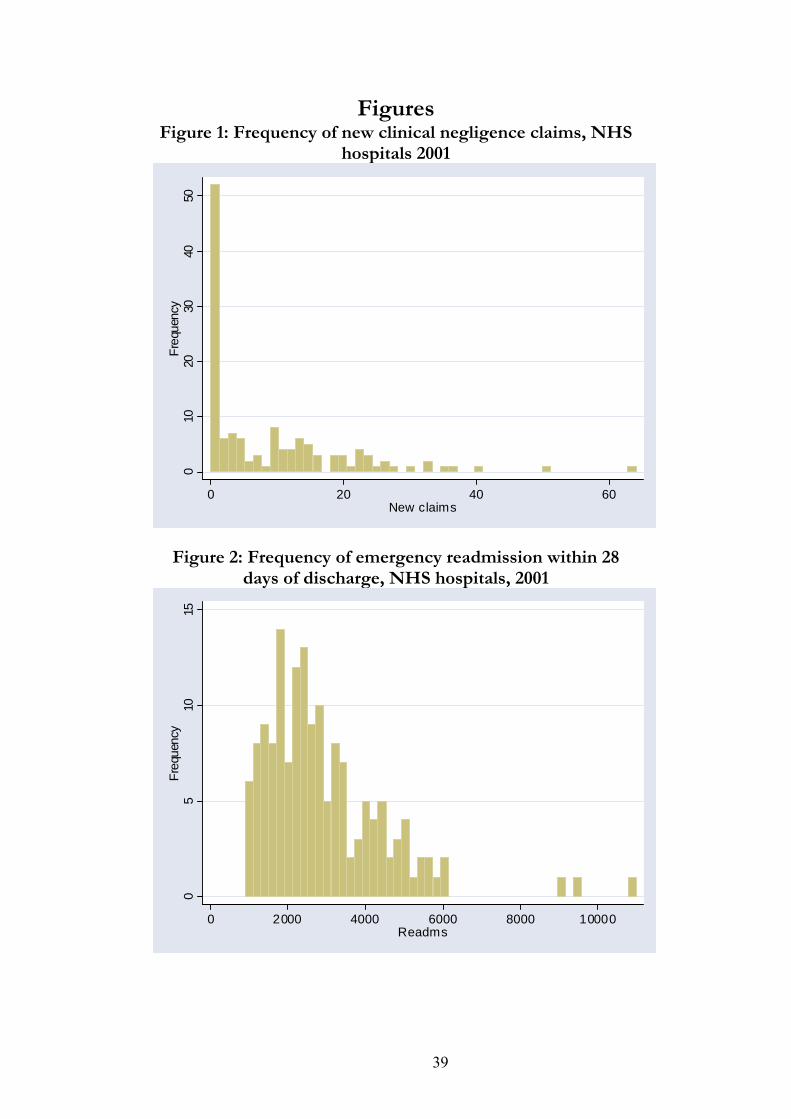
malpractice claims. Figure 1 below shows the distribution of the number of
new claims in 2001 for those hospitals that responded to our survey:
Figure 1 here
3.3 Care
The level of care taken by individual clinicians and health care providers is not
generally observable. However, the Department of Health (DoH) does collect
data from all hospitals on the numbers of certain types of diagnostic
procedures – in particular the various types of imaging and scanning
procedures which are available for diagnostic purposes.16 These vary
numerically from the very frequent and routine use of radio-graphs (“X-rays”)
and obstetric ultrasound scans, to the less common but growing techniques
such as MRI scans and fluoroscopy. Table 2 shows descriptive statistics for
these procedures.
Table 2 here
3.4 Treatment failures
Direct measures of the number of treatment failures arising from activity in
each hospital are not available in the UK. However, as part of its emphasis on
performance measurement at hospital level, the DoH routinely publishes data
for each hospital on a range of outcome measures, such as 30-day mortality
rates following specific types of admission. In addition they also publish the
numbers of 28-day emergency readmissions following discharge. For our
purpose this is a candidate proxy measure for the number of treatment failures
16 Department of Health Form KH12: “Imaging and radiodiagnostic examinations and tests”.
12
in each hospital. Figure 2 below shows the distribution of readmissions in
2001 for all English hospital trusts.
Figure 2 here
3.5 Exposure
As far as factors potentially influencing inter-hospital variations in claims,
treatment failures and diagnostic tests are concerned, the most important of
these relate to the size and type of the hospital – direct measures of exposure
to litigation risk in the absence of liability insurance. Clearly, raw activity level
measures such as the number of admissions or treatment episodes at a
particular hospital will be a factor determining the number of procedures and
treatment failures, and therefore the number of claims made by patients. In
addition, the nature of the treatment episodes will presumably influence the
frequency and cost of claims: maternity hospitals, and those with a large
proportion of acute beds, may be more open to litigation than others, for
instance. Table 3 summarises the data we have in relation to hospital size
(measured by the number of “finished consultant episodes” or FCEs) and
type.
Table 3 here
In what follows we use the broad casemix variables summarised here as one
way of proxying the risk type of individual hospitals – that is, their exposure
to litigation. However, these represent a very rough classification of risk, and
an alternative possibility arises from the way the NHSLA calculates the CNST
contributions for each hospital in the scheme. In practice, this involves each
hospital submitting a breakdown of its whole-time equivalent staff by specialty
area, and then allocating a weight to each of these specialty groups based on
prior evidence on the litigation risk of each group. This gives the base
13

contribution, which prior to April 2002 was reduced in relation to the
hospital’s chosen deductible/excess. This provides us with an alternative way
of proxying risk type: we ran a regression of assessed contributions against a
measure of hospital size and its excess, and used the residual from this
regression as a means of revealing the NHSLA’s assessment of risk.17
4 Estimation
4.1 New claims
For a given hospital, the process over time by which observed data are
generated on the numbers of new claims could be characterised as a Poisson
process with a constant rate of occurrence, µ. The observed number of claims
would clearly depend on the population exposed to risk – such as the number
of treatment episodes in a given year, N. Consequently, the expected number
of new claims occurring in a given year at a given hospital would be the
product Nπ, where π represents the mean probability of a treatment episode
resulting in a claim. Given an assumed Poisson process, this would imply that
the observed number of events (y) in a hospital in a given year is distributed
with density
( )( ; , )!
N ye Nf y Ny
π ππ−
= (6)
While we can observe N for each hospital, the parameter π is a latent variable,
which can nevertheless be modelled as a function of observed covariates and
unobserved random variables. With a conventional loglinear specification of
17 The relevant OLS regression was: Contribution (£000) = 38.08[4.27] + 0.0055[33.78].FCEs - 0.0011[4.55].excess. The R2 was 0.81 and the t-statistics are in square parentheses.
14
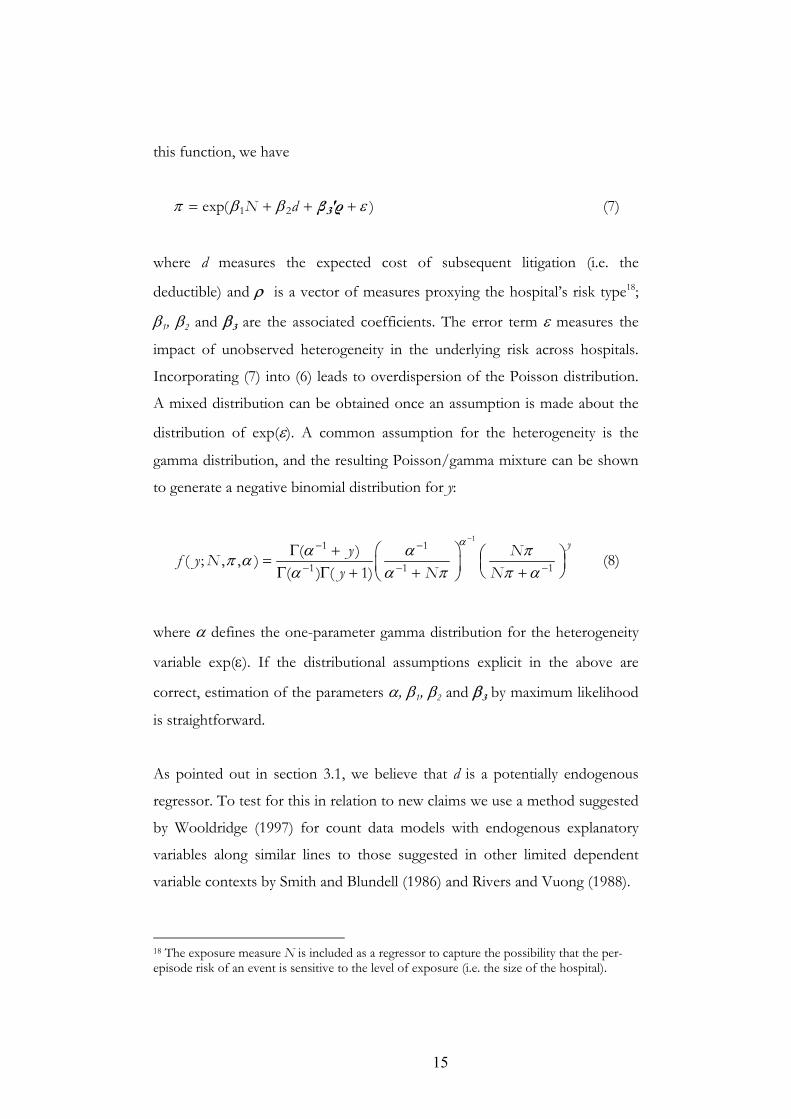
this function, we have
1 2exp( )N dπ β β= + + 3β 'ρ ε+ (7)
where d measures the expected cost of subsequent litigation (i.e. the
deductible) and ρ is a vector of measures proxying the hospital’s risk type18;
β1, β2 and β3 are the associated coefficients. The error term ε measures the
impact of unobserved heterogeneity in the underlying risk across hospitals.
Incorporating (7) into (6) leads to overdispersion of the Poisson distribution.
A mixed distribution can be obtained once an assumption is made about the
distribution of exp(ε). A common assumption for the heterogeneity is the
gamma distribution, and the resulting Poisson/gamma mixture can be shown
to generate a negative binomial distribution for y:
1
1 1
1 1( )( ; , , )
( ) ( 1)
yy Nf y Ny N N
αα α ππ αα α π π α
−− −
− −Γ + ⎛ ⎞ ⎛= ⎜⎜ ⎟Γ Γ + + +⎝ ⎠⎝ ⎠ 1−
⎞⎟
(8)
where α defines the one-parameter gamma distribution for the heterogeneity
variable exp(ε). If the distributional assumptions explicit in the above are
correct, estimation of the parameters α, β1, β2 and β3 by maximum likelihood
is straightforward.
As pointed out in section 3.1, we believe that d is a potentially endogenous
regressor. To test for this in relation to new claims we use a method suggested
by Wooldridge (1997) for count data models with endogenous explanatory
variables along similar lines to those suggested in other limited dependent
variable contexts by Smith and Blundell (1986) and Rivers and Vuong (1988).
18 The exposure measure N is included as a regressor to capture the possibility that the per-episode risk of an event is sensitive to the level of exposure (i.e. the size of the hospital).
15
For a given explanatory variable d which is potentially endogenous, it is
possible to estimate a reduced form regression equation of the form
d ν= +z'θ (9)
where z represents a vector of exogenous variables including at least one not
included in ρ for identification purposes, is the corresponding vector of
reduced form coefficients and ν is the reduced form error term for the i’th
hospital. If it is possible to obtain as a consistent estimator for ,
Wooldridge shows that the residuals
θ
θ̂ θ
ν̂ defined by ˆˆ dν = − z'θ can be
included as an additional covariate in a maximum likelihood estimator for the
count data model, and that a significant coefficient on this covariate in the
augmented regression is a robust test of the endogeneity of d. If the null of
exogeneity cannot be rejected on the basis of a t-test on the relevant
coefficient, the efficient estimator is the (non-augmented) negative binomial
regression.
4.2 Diagnostic tests and readmissions
While the data available to us on diagnostic tests and readmissions, as
summarized in section 3 above, are also in principle generated by a count data
process, the frequency of counts across hospitals in these cases is relatively
high. Because the conditional means of these variables are correspondingly
high, it is likely that the standard linear IV estimator in the face of endogeneity
is available to us, and would be robust to alternative distributional forms.
However, because the underlying count data process has an intrinsic
heteroskedasticity, and because the standard linear IV estimator is inconsistent
in the presence of endogeneity together with heteroskedasticity of uncertain
origin, we prefer to begin with a more general estimator such as linear GMM,
16
which is fully robust and asymptotically efficient (Baum et al, 2003).
We have grounds to believe that both issues may be relevant here. In
particular, as discussed above, there is good reason to suspect that the
deductible chosen by the hospital management is chosen with full knowledge
of the litigation risks faced, and the actions planned to deal with these risks.
Moreover, in addition to the intrinsic heteroskedasticity referred to above, the
hospitals in our sample vary considerably in size and diversity, so arbitrary
heteroskedasticity is likely. For these reasons we take the following approach
to estimation: first, we estimate a GMM model for each event. Simultaneously,
we test for heteroskedasticity and endogeneity in order to determine whether
GMM is indicated. If neither endogeneity nor heteroskedasticity is present, we
consider an alternative OLS estimator in order to improve the small sample
estimation performance.
5 Results
5.1 Instrumental variables
To begin with, it is necessary to find ways of testing for the potential
endogeneity of the deductible. To do this, some instruments are needed which
fulfil the usual requirements of relevance and exogeneity. Fortunately,
possibilities exist as a legacy of the initial regulations governing the choice of
deductible. When the CNST was first brought into existence in 1995,
restrictions were put in place on the minimum deductible permitted for
different classes of hospital. For instance very large acute hospitals were
initially not permitted to choose a deductible lower than £100,00019, which in
effect meant that they were exposed to the risk of paying for the great 19 £1 = $1.8 (May 2004)
17
majority of claims. However, as the scheme matured over the following six
years, the rules were relaxed, and by 2001 most hospitals were permitted to
choose deductibles as low as £10,000. Nevertheless, through natural inertia
and administrative delay, some hospitals decided to leave their deductible
where it stood, rather than enter into financial calculations as to the optimal
deductible for their particular risk profile. For this reason, the deductibles in
place in our year of analysis (2001) were correlated with the class of hospital
for reasons which were independent of the hospital’s inherent risk type. To
demonstrate the relevance of these instruments, Table 4 shows the results of a
reduced form OLS regression explaining variations in the CNST excess level
across NHS trusts in terms of the hospitals’ DoH classification, and their
casemix (proxied in two different ways). This regression shows a strong
influence of hospital class on the excess level, and the F-test of the joint
significance of the four class indicator variables is high.
Table 4 here
Having established the relevance of the candidate instruments, these are now
used to test for the endogeneity of the deductible in regressions explaining the
inter-hospital variation in litigation-related events: new claims, diagnostic tests,
and treatment failures.
5.2 New claims
We now consider whether providers respond to litigation risk by seeking to
reduce the likelihood of facing claims (perhaps through the provision of
information in an informal dispute resolution system, as described by Farber
and White, 1991). Table 5 presents the results of negative binomial ML
regressions for the number of new claims as they vary across hospitals; again
18

two models are estimated corresponding to two different ways of proxying
casemix.
Table 5 here
In columns (1) and (3) of the Table, the results are given for a regression
augmented with the residuals from the relevant reduced form regression
estimators. In both cases, the null of exogeneity cannot be rejected on the
basis of a t-test. Consequently our preferred specifications are the non-
augmented models, as reported in columns (2) and (4). The exposure variable
(FCEs) is highly significant and positive as expected, and the coefficients on
the deductible are significantly negative in both models, implying that a high
exposure to the expected cost of litigation is correlated with a lower frequency
of new claims.
5.3 Diagnostic tests
Next, we explore whether there is a link between exposure to litigation risk (as
measured by the hospital’s deductible) and the supply of care. Tables 6 and 7
present GMM estimates for regressions on the numbers of diagnostic imaging
procedures of various kinds (as described above). Model 1 (in Table 6) uses
three casemix measures to proxy risk type; model 2 (in Table 7) uses the
residual from a regression of CNST contributions on hospital size and its
deductible as a proxy for risk type. The test statistics show, respectively, the F-
test for the overall fit of the regressions; the Pagan-Hall χ2 test for
heteroskedasticity; the Wu-Hausman F-test for the endogeneity of the
deductible; and Hansen’s J-test of overidentifying restrictions (a test of
instrument exogeneity). The null of exogeneity of the deductible is rejected
strongly in five of the seven regressions in model 1 and six of the seven in
19

model 2. In all but one case where exogeneity is rejected, the J-test of
overidentifying restrictions does not allow us to reject the null of instrument
orthogonality, which confirms the instrument set as both relevant and
exogenous. Moreover, the null of homoskedasticity is strongly rejected in four
of the seven regressions in model 2, indicating that standard IV regressions
would not be suitable for all these data.
Tables 6 and 7 here
The results seem to suggest a separation of diagnostic imaging tests into two
groups. First, those which are routinely undertaken in large numbers, such as
ultrasound scans (both obstetric and non-obstetric) and radiographs; second
those which are undertaken far less frequently on a less routine basis, such as
CT/MRI imaging, and fluoroscopy. The latter group consistently have
positive and significant coefficients on the hospital’s deductible, implying that
a greater exposure to potentially costly litigation encourages more of these
tests to be undertaken (after taking account of the endogenous nature of the
deductible in this context). With the former group, the coefficients on the
deductible are much weaker, although generally positive. These tests are
strongly determined by activity levels and casemix, and not apparently by fear
of litigation.
These results provide insight into hospital reactions to litigation risk. They
may also provide evidence of defensive medicine: hospitals appear to supply
more discretionary types of care when their litigation risk is higher. In order
to consider this possibility further, we end by exploring Kessler and
McClellan’s (1996) suggestion that genuinely defensive care will not impact
upon treatment outcomes.
20

5.4 Treatment failures
Table 8 shows the results for GMM and OLS regressions on the number of
emergency readmissions within 28 days of discharge. The statistics at the end
of the GMM results show, as before, tests for overall fit, heteroskedasticity,
endogeneity of the deductible, and instrument exogeneity. Both GMM models
are significant overall, but it is not possible in either model to reject the null
hypotheses that the deductible is exogenous and the disturbances are
homoskedastic. In effect this means that GMM carries no advantages as an
estimator, and OLS is preferred as a result of an improved small sample
performance. Here the results are dominated by a strong impact of the
exposure measure, and little else. In practice, the number of readmissions
varies across hospitals only in relation to the number of patients admitted to
treatment. There is not even a significant impact of hospital risk type (i.e.
casemix).
Table 8 here
It appears from these results that the high incidence of diagnostic procedures
in hospitals facing high litigation costs is not matched by a corresponding
improvement in treatment outcomes, insofar as these can be measured by
readmission rates. Whilst it is important to recognise that the lack of a
correspondence between the use of diagnostic procedures and readmission
rates does not rule out a relationship with other, longer term health outcomes,
these results are consistent with the increased use of diagnostic procedures
being “excessive”, and designed only to reduce the likelihood of successful
litigation.
21
5.5 Elasticities
Our findings can best be summarised by inspection of the following table of
elasticities derived from the results reported in the previous sub-sections. The
table shows the sensitivity of claims, various diagnostic procedures and
readmissions to the relevant measures of activity and the insurance deductible
respectively. The elasticities with respect to activity levels are indicators of the
extent to which the adverse events considered here are simply driven by
variations in the number of patients treated. The elasticities with respect to the
deductible are indicators of the extent to which the events are driven by the
expected cost of litigation, after controlling for hospital activity levels and
casemix.
Table 9 here
As might be expected, both claims and readmissions are broadly proportional
to the hospital’s activity level: that is, a 10% increase in a hospital’s treatment
episodes results in an 11-12% increase in its emergency readmissions and
negligence claims respectively. In the case of claims, there is some evidence
that this would be supplemented by a 2% reduction in new claims conditional
on a 10% increase in the deductible. By contrast there is no evidence of any
significant impact of the deductible on the level of readmissions.
As far as diagnostic imaging procedures are concerned, the relatively
infrequent, non-routine procedures are highly sensitive to the deductible, and
presumably, therefore, to the litigation threat. The most sensitive tests are
MRI/CT scans, radio-isotopes and fluoroscopy. The results suggest, for
example, that a hospital with a £100,000 CNST excess used in the region of
50% more CT scans than hospitals with a £50,000 excess, after controlling for
activity levels and casemix. By contrast the more routine procedures such as
22

ultrasound scans and radiographs are mainly driven by the underlying activity
levels rather than by the expected cost of litigation.
6 Conclusion
Under negligence liability, hospitals face the prospect of paying for harm
caused to patients unless they can show that they (managers and clinicians)
behaved reasonably in taking care to avoid the harm. Unfortunately, the
courts’ interpretation of reasonable care is not always easy to predict, and the
uncertainty over the standard of care required is one explanation for the
claimed existence of so-called “defensive medicine” and for administrative
expenditures devoted purely to the management of patient claims.
The recent past has opened up a unique opportunity for research on this topic
using UK NHS hospital data. A combination of financial autonomy at
hospital level and risk-sharing arrangements in the years from 1995 to 2002
means that data exist on the extent to which different hospitals faced differing
expected litigation costs arising from their mistakes. Evidently, we would
expect hospitals facing greater litigation risks to be more likely to take action
to minimise these risks. Such hospitals could take more care, which would
include both increased monitoring of clinical practice and increased use of
diagnostic tests designed to ensure that appropriate decisions are made.
Depending on the underlying technology, this increase in care may or may not
have a significant impact on health outcomes at the margin. Hospitals faced
with higher expected litigation costs may also engage in activities to minimise
the number and success rate of claims consistent with a given level of care.
The results reported in this paper are consistent with the exercise of litigation-
induced discretion in relation to the use of costly advances in certain types of
23
diagnostic imaging. Those hospitals which faced a higher expected cost of
litigation were those which used these tests more frequently. The fact that
these additional tests did not apparently translate into a lower readmission rate
may suggest that they were being used “defensively”. That is, driven by
uncertainty over the legal standard of care, providers have extended the use of
such tests beyond the point at which they have significant benefits to
patients.20 Moreover, the finding that hospitals facing higher expected
litigation costs reduced the number of new claims in spite of the absence of
any impact on readmission rates may indicate the presence of a “Farber and
White” effect, by which claims are “managed” through improved patient
communication and informal dispute resolution measures.
To conclude, this paper has shown rigorously using unique hospital-level data
that the threat of litigation has an impact on both clinical and managerial
discretion. Our results suggest that this impact may extend to the supply of
defensive levels of treatment care, with associated wasteful expenditures. Of
course, the policy implications of these results need careful thought. For
example, we believe it is unwise to ignore the possible incentive effects of
liability rules on clinical practice and hospital management. The fact that we
have identified hospitals responding to liability-induced incentives for
increased care suggests that tort rules can be a powerful force for
improvements in patient safety, even when they are filtered through liability
insurance arrangements. Such insights need to be borne in mind when
evaluating alternative mechanisms for compensating medical injuries.
20 It is of course possible that diagnostic tests have an impact on securing the most suitable intervention for patients, with better long term outcomes, and that this does not show up in data on acute, short term emergency responses to treatment failures.
24
Appendix 1
In this Appendix we confirm that defensive medicine may arise in the
presence of two sources of uncertainty (in contrast to the single source in
Shavell (1987). As out purpose is only to demonstrate this possibility, we
use an example.
For simplicity, assume that g(u) and h(v) are identical uniform distributions
on [a, b] and denote ∆ ≡ b – a. (Shavell (1987) notes that the uniform
distribution will support his result.) Also, let p(x) = 1/x. In the absence of
any uncertainty, optimal care is x* = √D. Given these assumptions,
consider the problem in (2) in the text. We shall show that the provider’s
objective function can be decreasing in x when evaluated at x*: i.e. a higher
value of x minimises the function.
The derivative of the objective function in (2) is
DxxhxxGxxHxxgpDxxHxxGxp )]*()*()*()*([)]*()*()[('1 −−+−−−−−+
Substituting for the distributions, and noting our simplifying assumption
that G and H are the same, this expression becomes
DaxxxpDaxxxp ⎥⎦⎤
⎢⎣⎡
∆−−
−⎟⎠⎞
⎜⎝⎛
∆−−
+ 2
2 *)(2*)('1
Evaluating this at x = x* yields
Daa22
2 21∆
+∆
−
25
Since the distributions are centred on 0, ∆ = 2|a| and the above expression
simplifies to
Da2
143+
As a < 0, there are combinations of a and D that will make this expression
negative.
Appendix 2
In this Appendix we provide a simple analysis of how the relationship
between treatment care and claims management will influence the effect of
insurance excesses.
Denote treatment care by x and claims management effort by s. The
(composite) probability of a claim arising is now φ(x, s); we shall consider the
signs of the partial (and cross-partial) derivatives of this below. The hospital
solves
)|(),(,
δφ DEsxsxMinsx
++
Using subscripts to denote partial derivatives, the first-order conditions are
0)|(1)|(1 =+=+ δφδφ DEDE sx
Note that a necessary condition for an interior solution to these equations is
φx = φs = -1/E(D|δ) ≡ φ ′ < 0.
26

Using the first-order conditions, the effects of a change in δ are
⎥⎦
⎤⎢⎣
⎡′′
=⎥⎦
⎤⎢⎣
⎡⎥⎦
⎤⎢⎣
⎡δφδφ
φφφφ
δ
δ
dEdE
dsdx
EEEE
sssx
xsxx
where E ≡ E(D|δ), Eδ > 0 and the first matrix is the Hessian (which we denote
∆ below) and a sufficient second-order condition for a minimum requires |∆|
> 0. Therefore
)(||
)(||
sxxx
ssxs
EEdds
EEddx
φφφ
δ
φφφ
δ
δ
δ
+−∆
′=
−∆
′=
The sufficient second-order conditions for a minimum give φxx > 0 and φss >
0, and the results reported in Section 2 follow directly from this.
27
References
Baldwin, L. M., Hart, L. G., Lloyd, M., Fordyce, M., & Rosenblatt, R. A. (1995): "Defensive medicine and obstetrics", Journal of the American Medical Association, 274(20):1606-1610. Baum, C, Shaffer M, Stillman S (2003), “Instrumental variables and GMM: estimation and testing” Boston College Dept. of Economics, Working Paper No. 545 Beider, P. & Hagen, S (2004): “ Limiting Tort Liability for Medical Malpractice”, Congressional Budget Office, Washington DC, 8 Jan. 2004. CMO (2003): Making Amends: A Consultation Paper Setting Out Proposals for Reforming the Approach to Clinical Negligence in the NHS. A Report of the Chief Medical Officer. Department of Health, London. Cummins, J.D., Weiss, M.A. amd Phillips, R.D (2001): “The incentive effects of no-fault automobile insurance”, Journal of Law and Economics, 44(2): 427-464 Danzon, P. M. (2000a): “Liability reform: Traditional and radical alternatives”, American Health Care: Government, Market Processes and the Public Interest, edited by R. D. Feldman, The Independent Institute: California. Danzon, P. M. (2000b): “Liability for medical malpractice”, Handbook of Health Economics, Volume 1B, edited by A. J. Culyer and J. P. Newhouse, Elsevier North Holland: Amsterdam. Department of Health (2003): “Making Amends: A consultation paper setting out proposals for reforming the approach to clinical negligence in the NHS. A report by the Chief Medical Officer”, Department of Health: London. Dubay, L., Kaestner, R., Waidmann, T. (1999) “The impact of malpractice fears on cesarian section rates”, Journal of Health Economics 18(4):491-522. Dubay, L., Kaestner, R., Waidmann, T. (2001) “Medical Malpractice Liability and Its Effect on Prenatal Care Utilization and Infant Health”, Journal of Health Economics 20(4): 591-611. Farber, H.S. & White, M. (1991): “Medical Malpractice: An Empirical Examination of the Litigation Process”, RAND Journal of Economics 22(2): 199-217 Fenn, P., Gray, A., Rickman, N. (2004): “The economics of clinical negligence reform in England”, Economic Journal 114 (June):F272-F292.
28
Kessler, D. & McClellan, M. (1996): “Do doctors practice defensive medicine?”, Quarterly Journal of Economics, 111(2): 353-390. Kessler, D. & McClellan, M. (2002): “Medical liability, managed care, and defensive medicine”, Journal of Public Economics 84 (2): 175-197 Kessler, D. & McClellan, M. (2000): “How liability law affects medical productivity”, NBER Working Papers Series, Working Paper 7533. Klingman, D., Localio, A. R., Sugarman, J., Wagner, J. L., Polishuk, P. T., Wolfe, L., & Corrigan, J. A. (1996): "Measuring defensive medicine using clinical scenario surveys", Journal of Health Politics, Policy and Law, 21(2): 185-217. Localio, A. R., Lawthers, A. G., Bengtson, J. M., Hebert, L. E., Weaver, S. L., Brennan, T. A., & Landis, J. R. (1993): "Relationship between malpractice claims and cesarean delivery", Journal of the American Medical Association, 269(3): 366-373. Miceli, T.J. (1997) Economics of the law. Oxford: Oxford University Press. OTA (1994): “Defensive medicine and medical malpractice”. US Congress, Office of Technology Assessment. OTA-H-602 Government Printing Office July 1994. Rivers, D. and Vuong, Q. (1988). “Limited Information Estimators and Exogeneity Tests for Simultaneous Probit Models”. Journal of Econometrics, 39(3): 347-366. Shavell, S. (1987) “Economic Analysis of Accident Law”. Harvard University Press: Cambridge, MA. Sloan, F. A., Entman, S. S., Reilly, B. A., Glass, C. A., Hickson, G. B. & Zhang, H. H. (1997): “Tort liability and obstetricians’ care levels”, International Review of Law and Economics, 17: 245—260. Smith, R. and Blundell, R. (1986). “An Exogeneity Test for a Simultaneous Equation Tobit-Model with an Application to Labor Supply”. Econometrica, 54( 3): 679-685. Weiler, P. C. (1991): “Medical Malpractice on Trial”, Harvard University Press: Cambridge, MA. Weiler, P. C., Hiatt, H. H., Newhouse, J. P., Johnson, W. G., Brennan, T. A. & Leape, L. (1993): “A Measure of Malpractice: Medical Injury, Malpractice
29

Litigation and Patient Compensation”, Harvard University Press: Cambridge, MA. Wooldridge, J. (1997). “Quasi-maximum likelihood methods for count data!”. In Pesaran, H. and Schmidt, P. (eds.) Handbook of Applied Econometrics, Vol II, Oxford; Blackwells.
30

Tables
Table 1: Excess levels for NHS hospitals, 2001
Excess (£) Freq. Percent 10000 159 44.5425000 125 35.0150000 46 12.61100000 27 7.56Total 357 100.00
Table 2: Diagnostic imaging procedures in NHS hospitals, 2001
Variable Obs Mean Std. Dev. Min Max CT scans 156 7681 5873 9 48845 MRI scans 140 3603 3098 1 20960 Obst u/s scans 152 10453 5815 20 37273 Other u/s scans 174 15909 11717 269 100045 R-isotopes 132 3127 2495 1 16710 R-graphs 176 89457 54837 597 363409 Fluoroscopy 165 5959 4256 35 25635
Table 3: Treatment episodes and casemix variables, NHS hospitals 2001
Variable Obs Mean Std. Dev. Min Max Finished Consultant Episodes 304 39451 37857 3 207764 Propn acute beds 357 .434 .377 0 1 Propn general beds 357 .137 .178 0 1 Propn maternity beds 357 .028 .047 0 .525
31

Table 4: Reduced form estimates for CNST excess levels,
NHS hospitals 2001
(1) (2) CNST excess CNST excess
Small/medium acute hospital 741 2,392 (0.22) (0.87) Large acute hospital 6,367 7,784 (2.04) (2.93) Very large acute hospital 19,464 20,555 (4.47) (5.59) Acute teaching hospital 50,530 52,137 (5.80) (6.07) Proportion maternity beds 29.341 (0.19) Proportion acute beds 42.231 (1.16) Proportion general beds -3.326 (0.08) Contribution residual -10.666 (0.49)
Observations 356 303 R-squared 0.34 0.34 F stat (β1=β2=β3=β4=0) 13.59 16.71 Prob>F 0.00 0.00
32
33
Table 5: Negative binomial regression estimates and endogeneity tests for new claims, NHS hospitals 2001
(1) (2) (3) (4) New claims New claims New claims New claimsFCEs 2001 0.000036 0.000033 0.000033 0.000031 (7.12) (7.93) (4.75) (5.43)CNST excess -0.000019 -0.000008 -0.000012 -0.000006 (2.12) (2.50) (1.23) (2.00)Excess residual 0.000013 0.000007 (1.24) (0.58) Proportion maternity beds 0.020950 0.023870 (1.97) (1.81) Proportion acute beds -0.000803 -0.001221 (0.12) (0.19) Proportion general beds -0.020361 -0.018879 (1.75) (1.64) Contribution residual 0.000620 0.000707 (0.61) (0.71)Observations 112 112 112 112Wald test 107.95 109.37 42.13 39.54Pr>Chi2 0.00 0.00 0.00 0.00alpha 0.71 0.72 0.78 0.78
Table 6: GMM estimates and tests for diagnostic imaging procedures (Model 1), NHS hospitals 2001
(1) (2) (3) (5)(4) (6) (7) CT scans MRI scans Obst scans Other
scansR-
isotopesR-graphs Fluoros
CNST excess 0.104 0.075 0.008 0.073 0.053 0.024 0.109
(2.49) (2.77) (0.26) (1.68)(1.33) (0.12) (3.18)FCEs 2001 0.043 0.009 0.108 0.233 0.019 1.467 0.049
(1.71) (0.50) (6.42) (1.25)(7.45) (14.39) (2.72)Proportion maternity beds
-31.576 -154.175 563.666 176.949 -29.226 -620.329 -38.150(0.22) (1.47) (6.56) (0.38)(2.69) (2.80) (1.10)
Proportion acute beds
46.969 30.414 0.582 7.469 2.632 132.982 28.250(2.91) (2.39) (0.04) (0.26)(0.36) (2.08) (2.31)
Proportion general beds
24.306 20.296 3.623 71.740 -1.469 72.329 34.669(0.84) (0.86) (0.15) (0.07)(1.49) (0.65) (1.40)
Observations 153 137 149 171 129 173 162F test 15.58 6.19 60.67 57.82 5.25 171.66 24.45Pr>F 0.00 0.00 0.00 0.00 0.00 0.00 0.00Wu-Hausman F test 14.93 30.93 0.50 11.25 33.22 0.51 53.50Pr>F [H0: chosenxs is exogenous] 0.00 0.00 0.48 0.00 0.00 0.47 0.00Pagan-Hall Chi2 test 47.20 18.62 39.76 49.85 23.79 46.10 22.06Pr>Chi2 [H0: disturbance is homoskedastic]
0.07 0.99 0.23 0.04 0.90 0.08 0.94
Hansen's J test 2.85 6.79 2.14 2.64 2.66 4.53 2.85Pr>Chi2 [H0: instruments are orthogonal]
0.42 0.08 0.54 0.45 0.45 0.21 0.42

35
Table 7: GMM estimates and tests for diagnostic imaging procedures (Model 2), NHS hospitals 2001
(1) (2) (3) (5)(4) (6) (7) CT scans MRI
scans Other
scansObst scans
R-isotopes R-graphs Flouros
CNST excess 0.090 0.064 -0.045 0.045 0.047 0.013 0.100
(2.66) (3.17) (1.21) (1.77)(1.17) (0.07) (3.35)FCEs 2001 0.060 0.018 0.145 0.254 0.021 1.502 0.059
(3.04) (1.22) (10.47) (1.74)(12.82) (17.47) (4.00)Contribution residual
12.703 7.480 28.594 24.758 4.924 70.271 2.847(3.06) (2.70) (6.55) (1.59)(4.76) (3.00) (0.77)
Observations 153 137 149 171 129 173 162F test 21.98 10.74 72.88 112.10 10.09
239.60 32.20
Pr>F 0.00 0.00 0.00 0.00 0.00 0.00 0.00Wu-Hausman F test 11.40 21.95 7.00 5.56 27.88 0.00 50.69Pr>F [H0: chosenxs is exogenous] 0.00 0.00 0.01 0.02 0.00 0.99 0.00Pagan-Hall Chi2 test 34.51 22.35 66.26 57.57 19.79 63.66 21.75
Pr>Chi2 [H0: disturbance is homoskedastic]
0.01 0.17 0.00 0.00 0.28 0.00 0.19
Hansen's J test 5.30 13.48 4.27 1.13 4.68 2.54 3.68Pr>Chi2 [H0: instruments are orthogonal]
0.15 0.00 0.23 0.77 0.20 0.47 0.30

Table 8: Regression estimates and associated diagnostic tests for readmissions, NHS hospitals 2001
(GMM) (OLS) (GMM) (OLS) Readms Readms Readms ReadmsCNST excess 0.001315 -0.000475 0.001897 -0.000494 (0.36) (0.27) (0.57) (0.28)Admissions 2001 0.063378 0.065228 0.062912 0.065383 (24.96) (31.06) (25.02) (32.35)Proportion maternity beds -22.907771 -20.354383 (1.34) (1.14) Proportion acute beds 2.708149 2.772787 (0.87) (0.88) Proportion general beds 4.069535 2.291333 (0.86) (0.57) Contribution residual -0.400460 -0.299287 (1.07) (0.83)Observations 154 154 154 154F test 235.91 347.79 Pr>F 0.00 0.00 Wu-Hausman F test 1.30 2.33 Pr>F [H0: chosenxs is exogenous] 0.26 0.13 Pagan-Hall Chi2 test 38.29 32.58 Pr>Chi2 [H0: disturbance is homoskedastic]
0.12 0.00
Hansen's J test 3.14 3.51 Pr>Chi2 [H0: instruments are orthogonal]
0.21 0.17
R-squared 0.92 0.92

Table 9: Elasticities of event numbers with respect to activity and excess levels, NHS hospitals 2001
Model 1 Model 2 Activity Excess Activity Excess
New claims 1.235 -0.219 1.164 -0.170 CT scans 0.350 0.529 0.508 0.472 MRI scans 0.161 0.830 0.349 0.758 Obst u/s scans 0.614 0.027 0.826 -0.153 Other u/s scans 0.809 0.164 0.880 0.102 R-isotopes 0.379 0.653 0.427 0.585 R-graphs 0.877 0.009 0.899 0.005 Fluoroscopy 0.476 0.678 0.576 0.621 Readmissions 1.091 -0.006 1.093 -0.006
38
Figures Figure 1: Frequency of new clinical negligence claims, NHS
hospitals 2001
010
2030
4050
Freq
uenc
y
0 20 40 60New claims
Figure 2: Frequency of emergency readmission within 28 days of discharge, NHS hospitals, 2001
05
1015
Freq
uenc
y
0 2000 4000 6000 8000 10000Readms
39
Related Documents