Li & Fung Limited Annual Report 2017 170 Financial Statements Financial Statements 228 25 Reserves 230 26 Perpetual Capital Securities 230 27 Long-term Liabilities 231 28 Post-employment Benefit Obligations 235 29 Deferred Taxation 238 30 Notes to the Consolidated Cash Flow Statement 240 31 Discontinued Operations 245 32 Contingent Liabilities from Continuing Operations 246 33 Commitments from Continuing Operations 246 34 Charges on Assets from Continuing Operations 247 35 Related Party Transactions from Continuing Operations 248 36 Financial Risk Management 252 37 Capital Risk Management 252 38 Fair Value Estimation 255 39 Balance Sheet and Reserve Movement of the Company 257 40 Benefits and Interests of Directors (Disclosures Required by Section 383 of the Hong Kong Companies Ordinance (Cap. 622), Companies (Disclosure of Information about Benefits of Directors) Regulation (Cap. 622G) and HK Listing Rules) 260 41 Events after Balance Sheet Date 260 42 Approval of Financial Statements 260 43 Principal Subsidiaries, Associated Companies and Joint Venture 171 Consolidated Profit and Loss Account 173 Consolidated Statement of Comprehensive Income 174 Consolidated Balance Sheet 176 Consolidated Statement of Changes in Equity 178 Consolidated Cash Flow Statement Notes to the Financial Statements 180 1 Basis of Preparation and Principal Accounting Policies 200 2 Critical Accounting Estimates and Judgments 202 3 Segment Information 207 4 Operating Profit from Continuing Operations 208 5 Interest Expenses from Continuing Operations 209 6 Taxation from Continuing Operations 209 7 Earnings/(Losses) per Share 210 8 Dividends 210 9 Staff Costs Including Directors’ Emoluments from Continuing Operations 211 10 Directors’ and Senior Management’s Emoluments 212 11 Intangible Assets 215 12 Property, Plant and Equipment 217 13 Prepaid Premium for Land Leases 217 14 Associated Companies 217 15 Joint Venture 218 16 Available-for-sale Financial Assets 218 17 Inventories 218 18 Due from/(to) Related Companies 219 19 Derivative Financial Instruments 219 20 Trade and Other Receivables 221 21 Cash and Cash Equivalents 222 22 Trade and Other Payables 223 23 Bank Borrowings 224 24 Share Capital, Share Options and Award Shares

Welcome message from author
This document is posted to help you gain knowledge. Please leave a comment to let me know what you think about it! Share it to your friends and learn new things together.
Transcript

Li & Fung Limited Annual Report 2017170 Financial Statements
Financial Statements
228 25 Reserves230 26 Perpetual Capital Securities230 27 Long-term Liabilities231 28 Post-employment Benefit Obligations235 29 Deferred Taxation238 30 Notes to the Consolidated Cash Flow Statement240 31 Discontinued Operations245 32 Contingent Liabilities from Continuing Operations246 33 Commitments from Continuing Operations246 34 Charges on Assets from Continuing Operations247 35 Related Party Transactions from Continuing Operations248 36 Financial Risk Management252 37 Capital Risk Management252 38 Fair Value Estimation255 39 Balance Sheet and Reserve Movement of
the Company257 40 Benefits and Interests of Directors (Disclosures
Required by Section 383 of the Hong Kong Companies Ordinance (Cap. 622), Companies (Disclosure of Information about Benefits of Directors) Regulation (Cap. 622G) and HK Listing Rules)
260 41 Events after Balance Sheet Date260 42 Approval of Financial Statements260 43 Principal Subsidiaries, Associated Companies
and Joint Venture
171 Consolidated Profit and Loss Account173 Consolidated Statement of Comprehensive Income174 Consolidated Balance Sheet176 Consolidated Statement of Changes in Equity178 Consolidated Cash Flow Statement
Notes to the Financial Statements180 1 Basis of Preparation and Principal Accounting Policies200 2 Critical Accounting Estimates and Judgments202 3 Segment Information207 4 Operating Profit from Continuing Operations208 5 Interest Expenses from Continuing Operations209 6 Taxation from Continuing Operations209 7 Earnings/(Losses) per Share210 8 Dividends210 9 Staff Costs Including Directors’ Emoluments from
Continuing Operations211 10 Directors’ and Senior Management’s Emoluments212 11 Intangible Assets215 12 Property, Plant and Equipment217 13 Prepaid Premium for Land Leases217 14 Associated Companies217 15 Joint Venture218 16 Available-for-sale Financial Assets218 17 Inventories218 18 Due from/(to) Related Companies219 19 Derivative Financial Instruments219 20 Trade and Other Receivables221 21 Cash and Cash Equivalents222 22 Trade and Other Payables223 23 Bank Borrowings224 24 Share Capital, Share Options and Award Shares

171Li & Fung Limited Annual Report 2017Consolidated Profit and Loss Account
Consolidated Profit and Loss AccountFor the year ended 31 December 2017
2017 2016Note US$’000 US$’000
(Restated)
Continuing Operations
Turnover 3 13,534,209 14,751,222
Cost of sales (12,185,061) (13,276,977)
Gross profit 1,349,148 1,474,245
Other income 37,124 20,782
Total margin 1,386,272 1,495,027
Selling and distribution expenses (395,279) (470,012)
Merchandising and administrative expenses (635,141) (706,614)
Core operating profit 3 355,852 318,401
Gain on remeasurement of contingent consideration payable 4 31,492 –
Amortization of other intangible assets 4 (23,327) (20,011)
Gain on disposal of business 4 – 7,871
One-off reorganization costs 4 (33,945) (5,863)
Operating profit 4 330,072 300,398
Interest income 12,261 15,713
Interest expenses 5
Non-cash interest expenses (3,284) (3,971)
Cash interest expenses (66,477) (86,477)
(69,761) (90,448)
Share of profits less losses of associated companies and joint venture 14&15 1,898 1,748
Profit before taxation 274,470 227,411
Taxation 6 (40,830) (32,288)
Profit for the year from Continuing Operations 233,640 195,123
Discontinued Operations
(Loss)/profit for the year from Discontinued Operations 31(a) (543,045) 61,068
Net (loss)/profit for the year (309,405) 256,191
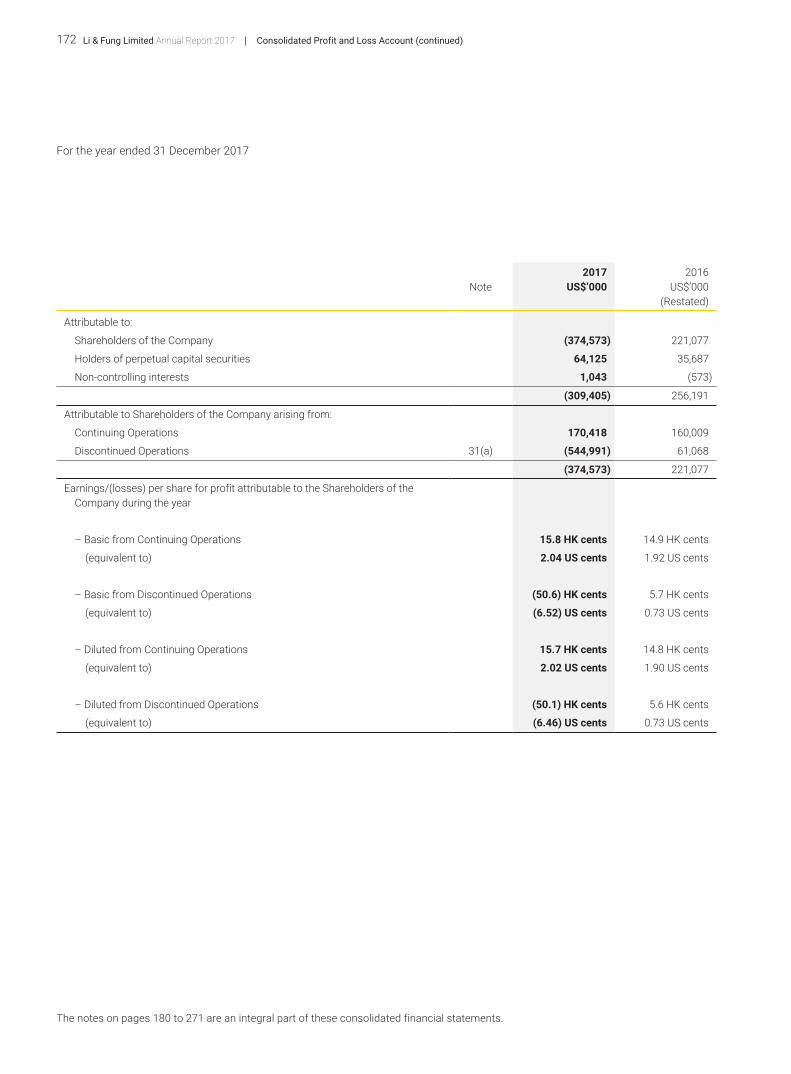
Li & Fung Limited Annual Report 2017172 Consolidated Profit and Loss Account (continued)
For the year ended 31 December 2017
The notes on pages 180 to 271 are an integral part of these consolidated financial statements.
2017 2016Note US$’000 US$’000
(Restated)
Attributable to:
Shareholders of the Company (374,573) 221,077
Holders of perpetual capital securities 64,125 35,687
Non-controlling interests 1,043 (573)
(309,405) 256,191
Attributable to Shareholders of the Company arising from:
Continuing Operations 170,418 160,009
Discontinued Operations 31(a) (544,991) 61,068
(374,573) 221,077
Earnings/(losses) per share for profit attributable to the Shareholders of the Company during the year
– Basic from Continuing Operations 15.8 HK cents 14.9 HK cents
(equivalent to) 2.04 US cents 1.92 US cents
– Basic from Discontinued Operations (50.6) HK cents 5.7 HK cents
(equivalent to) (6.52) US cents 0.73 US cents
– Diluted from Continuing Operations 15.7 HK cents 14.8 HK cents
(equivalent to) 2.02 US cents 1.90 US cents
– Diluted from Discontinued Operations (50.1) HK cents 5.6 HK cents
(equivalent to) (6.46) US cents 0.73 US cents

173Li & Fung Limited Annual Report 2017Consolidated Statement of Comprehensive Income
Consolidated Statement of Comprehensive IncomeFor the year ended 31 December 2017
2017 2016Note US$’000 US$’000
(Restated)
Net (Loss)/Profit for the Year (309,405) 256,191
Other Comprehensive Income/(Expense):
Item that will not be reclassified to profit or loss
Remeasurement of post-employment benefit obligations recognized in reserve, net of tax 6 (2,991)
Items that may be reclassified subsequently to profit or loss
Currency translation differences * 82,191 (137,745)
Net fair value (losses)/gains on cash flow hedges, net of tax (6,959) 4,373
Net fair value gains on available-for-sale financial assets, net of tax 174 310
Total Items that may be Reclassified Subsequently to Profit or Loss 75,406 (133,062)
Total Other Comprehensive Income/(Expense) for the Year, Net of Tax 75,412 (136,053)
Total Comprehensive (Expense)/Income for the Year (233,993) 120,138
Attributable To:
Shareholders of the Company (299,185) 85,572
Holders of perpetual capital securities 64,125 35,687
Non-controlling interests 1,067 (1,121)
Total Comprehensive (Expense)/Income for the Year (233,993) 120,138
Attributable to the Shareholders of the Company arising from:
Continuing Operations 217,611 79,384
Discontinued Operations 31(a) (516,796) 6,188
(299,185) 85,572
* Exchange differences resulting from translation of the results and financial positions of the Group entities with functional currencies other than the Group’s presentation currency.
The notes on pages 180 to 271 are an integral part of these consolidated financial statements.
Li & Fung Limited Annual Report 2017174 Consolidated Balance Sheet
Consolidated Balance SheetAs at 31 December 2017
As at 31 December As at2017 2016 1 January 2016
Note US$’000 US$’000 US$’000(Restated) (Restated)
Non-current Assets
Intangible assets 11 2,347,011 3,896,973 4,266,863
Property, plant and equipment 12 208,221 221,550 241,626
Prepaid premium for land leases 13 67 127 1,942
Associated companies 14 12,393 11,005 10,070
Joint venture 15 996 760 313
Available-for-sale financial assets 16 4,338 4,164 3,854
Other receivables, prepayments and deposits 20 27,738 27,458 26,217
Deferred tax assets 29 17,456 16,419 36,527
2,618,220 4,178,456 4,587,412
Current Assets
Inventories 17 147,803 277,841 566,002
Due from related companies 18 463,163 487,033 486,939
Trade and bills receivable 20 1,148,560 1,547,208 1,689,413
Other receivables, prepayments and deposits 20 150,252 218,504 268,012
Derivative financial instruments 19 – 10,697 4,272
Cash and bank balances 21 348,940 985,039 342,243
2,258,718 3,526,322 3,356,881
Assets Classified as Held for Sale 31(d) 1,641,065 – –
Current Liabilities
Due to related companies 18 124 2,093 1,038
Trade and bills payable 22 1,733,661 2,083,875 2,464,785
Accrued charges and sundry payables 22 468,089 553,292 635,579
Purchase consideration payable for acquisitions 27 42,166 67,794 86,266
Taxation 43,908 55,711 56,463
Bank advances for discounted bills 20 1,724 22,773 33,681
Short-term bank loans 23 22,970 29,180 95,819
Derivative financial instruments 19 5,355 – –
Current portion of long-term notes 27 – 499,819 –
2,317,997 3,314,537 3,373,631
Liabilities Associated with Assets Classified as Held for Sale 31(d) 466,570 – –
Net Current Assets/(Liabilities) 1,115,216 211,785 (16,750)
Total Assets Less Current Liabilities 3,733,436 4,390,241 4,570,662

175Li & Fung Limited Annual Report 2017Consolidated Balance Sheet (continued)
As at 31 December As at2017 2016 1 January 2016
Note US$’000 US$’000 US$’000(Restated) (Restated)
Financed by:
Share capital 24 13,574 13,487 13,487
Reserves 1,734,172 2,287,893 2,466,130
Shareholders’ funds attributable to the Company’s Shareholders 1,747,746 2,301,380 2,479,617
Holders of perpetual capital securities 26 1,158,687 1,158,687 503,000
Written put option on non-controlling interests (67,000) – –
Non-controlling interests 74,262 (1,083) 4,293
Total Equity 2,913,695 3,458,984 2,986,910
Non-current Liabilities
Long-term notes 27 752,432 753,458 1,253,823
Purchase consideration payable for acquisitions 27 19,417 93,742 156,236
Other long-term liabilities 27 29,034 32,589 116,420
Post-employment benefit obligations 28 14,165 22,517 21,909
Deferred tax liabilities 29 4,693 28,951 35,364
819,741 931,257 1,583,752
3,733,436 4,390,241 4,570,662
William Fung Kwok Lun Spencer Theodore Fung
Group Chairman Group Chief Executive Officer
The notes on pages 180 to 271 are an integral part of these consolidated financial statements.

Li & Fung Limited Annual Report 2017176 Consolidated Statement of Changes in Equity
Consolidated Statement of Changes in EquityFor the year ended 31 December 2017
The notes on pages 180 to 271 are an integral part of these consolidated financial statements.
Attributable to Shareholders of the Company
Share Capital
Share Premium
Other Reserves
Retained Earnings Total
Holders of Perpetual
Capital Securities
Written Put Option on
Non-controlling
Interests
Non-Controlling
InterestsTotal
EquityUS$’000 US$’000 US$’000 US$’000 US$’000 US$’000 US$’000 US$’000 US$’000
(Note 24) (Note 25) (Note 26)
Balance at 1 January 2017, as previously reported 13,487 714,536 431,450 1,166,071 2,325,544 1,158,687 – (1,083) 3,483,148
Impact of adoption of HKFRS 15 – – (3,073) (21,091) (24,164) – – – (24,164)
Balance at 1 January 2017, as restated 13,487 714,536 428,377 1,144,980 2,301,380 1,158,687 – (1,083) 3,458,984
Comprehensive (Expense)/Income
Profit or loss – – – (374,573) (374,573) 64,125 – 1,043 (309,405)
Other Comprehensive Income/(Expense)
Currency translation differences – – 82,167 – 82,167 – – 24 82,191
Net fair value gains on available-for-sale financial assets, net of tax – – 174 – 174 – – – 174
Net fair value losses on cash flow hedges, net of tax – – (6,959) – (6,959) – – – (6,959)
Remeasurement of post-employment benefit obligations recognized in reserve, net of tax – – 6 – 6 – – – 6
Total other comprehensive income, net of tax – – 75,388 – 75,388 – – 24 75,412
Total Comprehensive Income/(Expense) – – 75,388 (374,573) (299,185) 64,125 – 1,067 (233,993)
Transactions with Owners in their Capacity as Owners
Purchase of shares for Share Award Scheme – – (1,706) – (1,706) – – – (1,706)
Issuance of shares for Share Award Scheme 87 – (87) – – – – – –
Employee Share Option and Share Award Scheme:
– value of employee services – – 16,735 – 16,735 – – – 16,735
– vesting of shares for Share Award Scheme – 13,991 (13,991) – – – – – –
Distribution to holders of perpetual capital securities – – – – – (64,125) – – (64,125)
Transfer to capital reserve – – 4,861 (4,861) – – – – –
2016 final dividend paid – – – (130,136) (130,136) – – – (130,136)
2017 interim dividend paid – – – (120,064) (120,064) – – – (120,064)
Written put option on non-controlling interests – – – – – – (67,000) – (67,000)
Non-controlling interests arising from business combination – – – – – – – 55,000 55,000
Transactions with non-controlling interests – – – (19,278) (19,278) – – 19,278 –
Total Transactions with Owners in their Capacity as Owners 87 13,991 5,812 (274,339) (254,449) (64,125) (67,000) 74,278 (311,296)
Balance at 31 December 2017 13,574 728,527 509,577 496,068 1,747,746 1,158,687 (67,000) 74,262 2,913,695

177Li & Fung Limited Annual Report 2017Consolidated Statement of Changes in Equity (continued)
Attributable to Shareholders of the Company
Share Capital
Share Premium
Other Reserves
Retained Earnings Total
Holders of Perpetual
Capital Securities
Non-controlling
InterestsTotal
EquityUS$’000 US$’000 US$’000 US$’000 US$’000 US$’000 US$’000 US$’000
(Note 24) (Note 25) (Note 26)
Balance at 1 January 2016, as previously reported 13,487 704,618 554,903 1,229,865 2,502,873 503,000 4,293 3,010,166
Impact of adoption of HKFRS 15 – – (4,234) (19,022) (23,256) – – (23,256)
Balance at 1 January 2016, as restated 13,487 704,618 550,669 1,210,843 2,479,617 503,000 4,293 2,986,910
Comprehensive Income/(Expense)
Profit or loss – – – 221,077 221,077 35,687 (573) 256,191
Other Comprehensive (Expense)/Income
Currency translation differences – – (137,197) – (137,197) – (548) (137,745)
Net fair value gains on available-for-sale financial assets, net of tax – – 310 – 310 – – 310
Net fair value gains on cash flow hedges, net of tax – – 4,373 – 4,373 – – 4,373
Remeasurement of post-employment benefit obligations recognized in reserve, net of tax – – (2,991) – (2,991) – – (2,991)
Total other comprehensive expense, net of tax – – (135,505) – (135,505) – (548) (136,053)
Total Comprehensive (Expense)/Income – – (135,505) 221,077 85,572 35,687 (1,121) 120,138
Transactions with Owners in their Capacity as Owners
Purchase of shares for Share Award Scheme – – (12) – (12) – – (12)
Employee Share Option and Share Award Scheme:
– value of employee services – – 22,664 – 22,664 – – 22,664
– vesting of shares for Share Award Scheme – 9,918 (9,918) – – – – –
Issuance of perpetual capital securities – – – – – 650,000 – 650,000
Transaction costs related to issuance of perpetual capital securities – – – (4,500) (4,500) – – (4,500)
Distribution to holders of perpetual capital securities – – – – – (30,000) – (30,000)
Transfer to capital reserve – – 479 (479) – – – –
2015 final dividend paid – – – (162,670) (162,670) – – (162,670)
2016 interim dividend paid – – – (119,291) (119,291) – – (119,291)
Disposal of business – – – – – – (4,255) (4,255)
Total Transactions with Owners in their Capacity as Owners – 9,918 13,213 (286,940) (263,809) 620,000 (4,255) 351,936
Balance at 31 December 2016 13,487 714,536 428,377 1,144,980 2,301,380 1,158,687 (1,083) 3,458,984
The notes on pages 180 to 271 are an integral part of these consolidated financial statements.

Li & Fung Limited Annual Report 2017178 Consolidated Cash Flow Statement
Consolidated Cash Flow StatementFor the year ended 31 December 2017
2017 2016Note US$’000 US$’000
(Restated)
Continuing Operations
Operating Activities
Net cash inflow generated from operations 30(a) 359,619 304,396
Hong Kong profits tax paid, net of refund (6,647) (3,408)
Overseas taxation paid (40,102) (29,252)
Net Cash Inflow from Operating Activities 312,870 271,736
Investing Activities
Purchases of property, plant and equipment (71,689) (47,197)
Payments for system development, software, license and other intangible assets (18,900) (6,997)
Settlement of consideration payable for prior years acquisitions of businesses (67,811) (87,271)
Disposal of business – 316,196
Proceeds from disposal of property, plant and equipment and prepaid premium for land leases 6,289 4,879
Interest income 12,261 15,713
Dividends received from associated companies 14 821 835
Investing in a joint venture 15 (529) (612)
Other investing activities – (1,494)
Net Cash (Outflow)/inflow from Investing Activities (139,558) 194,052
Net Cash Inflow before Financing Activities 173,312 465,788
Financing Activities
Interest paid (66,477) (86,477)
Net proceeds from issuance of perpetual capital securities, net of transaction cost – 645,500
Distributions made to holders of perpetual capital securities (64,125) (30,000)
Repayment of long-term notes 30(b) (500,000) –
Dividends paid (250,200) (281,961)
Purchase of shares for Share Award Scheme (1,706) (12)
Net repayment of bank loans 30(b) (938) (168,193)
Net Cash (Outflow)/Inflow from Financing Activities (883,446) 78,857
(Decrease)/Increase in Cash and Cash Equivalents from Continuing Operations (710,134) 544,645
Discontinued Operations
Increase in Cash and Cash Equivalents from Discontinued Operations 31(e) 251,474 105,289
(Decrease)/Increase in Cash and Cash Equivalents (458,660) 649,934

179Li & Fung Limited Annual Report 2017Consolidated Cash Flow Statement (continued)
2017 2016Note US$’000 US$’000
(Restated)
Cash and Cash Equivalents at 1 January
Continuing Operations 830,558 222,783
Discontinued Operations 154,481 119,460
985,039 342,243
(Decrease)/Increase in Cash and Cash Equivalents (458,660) 649,934
Effect of foreign exchange rate changes 15,139 (7,138)
Cash and cash equivalents classified as assets held for sale (192,578) –
Cash and Cash Equivalents of Continuing Operations as of 31 December 348,940 985,039
Analysis of the balances of cash and cash equivalents
Cash and bank balances 21 348,940 985,039
The notes on pages 180 to 271 are an integral part of these consolidated financial statements.

Li & Fung Limited Annual Report 2017180 Notes to the Financial Statements
Notes to the Financial Statements
1 Basis of Preparation and Principal Accounting PoliciesThe basis of preparation and principal accounting policies applied in the preparation of these consolidated financial statements are set out below. These policies have been consistently applied to all the years presented, unless otherwise stated.
On 31 January 2018, the Independent Shareholders approved in the special general meeting (the “SGM”) to divest the three Product Verticals. The financial results of the three Product Verticals for the year ended 31 December 2017 were presented as Discontinued Operations and comparatives for the year ended 31 December 2016 have been restated accordingly.
1.1 Basis of PreparationThe consolidated financial statements of Li & Fung Limited have been prepared in accordance with all applicable Hong Kong Financial Reporting Standards (“HKFRSs”). They have been prepared under the historical cost convention, as modified by the revaluation of available-for-sale financial assets at fair value through other comprehensive income, financial assets and financial liabilities (including derivative instruments, contingent consideration payable and written put option liabilities) at fair value through profit or loss.
The preparation of financial statements in conformity with HKFRSs requires the use of certain critical accounting estimates. It also requires management to exercise its judgement in the process of applying the Group’s accounting policies. The areas involving a higher degree of judgement or complexity, or areas where assumptions and estimates are significant to the consolidated financial statements, are disclosed in Note 2.
(A) AMENDMENTS TO EXISTING STANDARDS ADOPTED BY THE GROUPThe following amendments to existing standards are mandatory for accounting periods beginning on or after 1 January 2017:
HKAS 7 Amendment Disclosure Initiative
HKAS 12 Amendment Recognition of Deferred Tax Assets for Unrealised Losses
HKFRS 12 Amendment Disclosure of Interest in Other Entities
The application of the above revised HKFRSs in the current year has had no material effect on the Group’s reported financial performance and position for the current and prior years and/or disclosures set out in these consolidated financial statements.
(B) NEW STANDARD THAT IS EARLY ADOPTED BY THE GROUP
Early adoption of HKFRS 15, Revenue from Contracts with CustomersThe Group has elected to apply HKFRS 15 Revenue from Contracts with Customers as issued in July 2014. In accordance with the transition provisions in HKFRS 15, the new rules have been adopted retrospectively and comparative figures have been restated. HKFRS 15 replaces the previous revenue standards.
The accounting policies for the Group’s main types of revenue are explained in Note 1.21.

181Li & Fung Limited Annual Report 2017Notes to the Financial Statements (continued)
1 Basis of Preparation and Principal Accounting Policies (continued)
1.1 Basis of Preparation (continued)
(B) NEW STANDARD THAT IS EARLY ADOPTED BY THE GROUP (continued)
Early adoption of HKFRS 15, Revenue from Contracts with Customers (continued)
The impact of the adoption of HKFRS 15 on the Group are as follows:
(i) HKFRS 15 provides clear guidance to determine the timing of control of goods transferred to customers. This change has resulted in decrease in retained earnings as at 1 January 2016 and 31 December 2016 by US$19,022,000 and US$21,091,000, and increase in other receivables as at 1 January 2016 and 31 December 2016 respectively by US$11,194,000 and US$11,894,000 respectively, increase in sundry payables as at 1 January 2016 and 31 December 2016 by US$34,450,000 and US$36,058,000 respectively and decrease in exchange reserve as at 1 January 2016 and 31 December 2016 by US$4,234,000 and US$3,073,000 respectively, and decrease in operating profit for the year ended 31 December 2016 by US$2,069,000.
(ii) HKFRS 15 provides guidance on determining whether the nature of the promise in the contract is a performance obligation to provide the specified goods or services itself or to arrange for those goods or services to be provided by the other party. This change has resulted in decrease in turnover and cost of sales for the year ended 31 December 2016 by US$94,377,000.
(C) NEW STANDARDS, NEW INTERPRETATIONS AND AMENDMENTS TO EXISTING STANDARDS THAT HAVE BEEN ISSUED BUT ARE NOT YET EFFECTIVE AND HAVE NOT BEEN EARLY ADOPTED BY THE GROUPThe following new standards, new interpretations and amendments to existing standards have been issued and are mandatory for the Group’s accounting periods beginning on or after 1 January 2018 or later periods, but the Group has not early adopted them:
HKAS 28 Amendment Long-term Interests in Associates and Joint Ventures2
HKAS 40 Amendment Transfer of Investment Property1
HKFRS 2 Amendment Classification and Measurement of Share-based Payment Transactions1
HKFRS 4 Amendment Applying HKFRS 9 Financial Instruments with HKFRS 4 Insurance Contracts1
HKFRS 9 Financial Instruments1
HKFRS 9 Amendment Prepayment Features with Negative Compensation2
HKFRS 10 and HKAS 28 Amendment
Sale or Contribution of Assets between an Investor and its Associate or Joint Venture4
HKFRS 16 Leases2
HKFRS 17 Insurance Contracts3
HK(IFRIC) – Int 22 Foreign Currency Transactions and Advance Consideration1
HK(IFRIC) – Int 23 Uncertainty over Income Tax Treatments2
Annual Improvement Project Annual Improvements 2014-2016 Cycle1
Annual Improvement Project Annual Improvements 2015-2017 Cycle2
NOTES:1 Effective for financial periods beginning on or after 1 January 20182 Effective for financial periods beginning on or after 1 January 20193 Effective for financial periods beginning on or after 1 January 20214 Effective date to be determined

Li & Fung Limited Annual Report 2017182 Notes to the Financial Statements (continued)
1 Basis of Preparation and Principal Accounting Policies (continued)
1.1 Basis of Preparation (continued)
(C) NEW STANDARDS, NEW INTERPRETATIONS AND AMENDMENTS TO EXISTING STANDARDS THAT HAVE BEEN ISSUED BUT ARE NOT YET EFFECTIVE AND HAVE NOT BEEN EARLY ADOPTED BY THE GROUP (continued)
None of these is expected to have a significant effect on the consolidated financial statements of the Group, except the following set out below:
HKFRS 9, ‘Financial Instruments’The new standard addresses the classification, measurement and derecognition of financial assets and financial liabilities, introduces new rules for hedge accounting and a new impairment model for financial assets.
There are no significant impact on the Group’s accounting for financial liabilities. The derecognition rules have been transferred from HKAS 39 Financial Instruments: Recognition and Measurement and have not been changed.
The new hedge accounting rules will align the accounting for hedging instruments more closely with the Group’s risk management practices. As a general rule, more hedge relationships might be eligible for hedge accounting, as the standard introduces a more principles-based approach. The Group has confirmed that its current hedge relationships would qualify as continuing hedges upon the adoption of HKFRS 9. Accordingly, there are no significant impact on the accounting for hedging relationships.
The new impairment model requires the recognition of impairment provisions based on expected credit losses rather than only incurred credit losses as is the case under HKAS 39. It applies to financial assets classified at amortised cost, debt instruments measured at fair value through other comprehensive income, contract assets under HKFRS 15 Revenue from Contracts with Customers, lease receivables, loan commitments and certain financial guarantee contracts. Based on the assessments undertaken to date, there will be an earlier recognition of credit losses for trade debtors.
The new standard also introduces expanded disclosure requirements and changes in presentation. These are expected to change the nature and extent of the Group’s disclosures about its financial instruments particularly in the year of the adoption of the new standard.
HKFRS 9 must be applied for financial years commencing on or after 1 January 2018. Based on the transitional provisions in the completed HKFRS 9, early adoption in phases was only permitted for annual reporting periods beginning before 1 February 2015. After that date, the new rules must be adopted in their entirety. The Group does not intend to adopt HKFRS 9 before its mandatory date.

183Li & Fung Limited Annual Report 2017Notes to the Financial Statements (continued)
1 Basis of Preparation and Principal Accounting Policies (continued)
1.1 Basis of Preparation (continued)
(C) NEW STANDARDS, NEW INTERPRETATIONS AND AMENDMENTS TO EXISTING STANDARDS THAT HAVE BEEN ISSUED BUT ARE NOT YET EFFECTIVE AND HAVE NOT BEEN EARLY ADOPTED BY THE GROUP (continued)
HKFRS 16, ‘Leases’HKFRS 16 will result in almost all leases being recognized on the balance sheet, as the distinction between operating and finance leases is removed. Under the new standard, an asset (the right to use the leased item) and a financial liability to pay rentals are recognized. The only exceptions are short-term and low-value leases.
The accounting for lessors will not significantly change.
The standard will affect primarily the accounting for Group’s operating leases. As at the reporting date, the Group’s Continuing Operations has non-cancellable operating lease commitments of US$516,055,000, see Note 33. However, the Group has not yet determined to what extent these commitments will result in the recognition of an asset and a liability for future payments and how this will affect the Group’s profit and classification of cash flows.
Some of the commitments may be covered by the exception for short-term and low value leases and some commitments may relate to arrangements that will not qualify as leases under HKFRS 16.
The new standard is mandatory for financial years commencing on or after 1 January 2019. At this stage, the Group does not intend to adopt the standard before its effective date.
The Group is in the process of making an assessment of the impact of these new standards, new interpretations and amendments to existing standards upon initial application.
1.2 ConsolidationThe consolidated financial statements include the financial statements of the Company and all its subsidiaries made up to 31 December 2017.
(A) SUBSIDIARIESSubsidiaries are all entities (including structured entities) over which the Group has control. The Group controls an entity when the Group is exposed to, or has rights to, variable returns from its involvement with the entity and has the ability to affect those returns through its power over the entity.
Subsidiaries are fully consolidated from the date on which control is transferred to the Group. They are de-consolidated from the date that control ceases.

Li & Fung Limited Annual Report 2017184 Notes to the Financial Statements (continued)
1 Basis of Preparation and Principal Accounting Policies (continued)
1.2 Consolidation (continued)
(A) SUBSIDIARIES (continued)
The Group uses the acquisition method of accounting to account for business combinations. The consideration for the acquisition of a subsidiary is the aggregate of the fair values of the assets transferred, the liabilities incurred and the equity interests issued by the Group. The consideration transferred includes the fair value of any asset or liability resulting from a contingent consideration arrangement. Acquisition-related costs are expensed as incurred. Identifiable assets acquired and liabilities and contingent liabilities assumed in a business combination are measured initially at their fair values at the acquisition date. On an acquisition-by-acquisition basis, the Group recognizes any non-controlling interest in the acquiree either at fair value or at the non-controlling interest’s proportionate share of the acquiree’s net assets.
Any contingent consideration to be transferred by the Group is recognized at fair value at the acquisition date. Subsequent changes to the fair value of the contingent consideration that is deemed to be an asset or liability is recognized in accordance with HKAS 39 either in profit or loss or as a change to other comprehensive income. Contingent consideration that is classified as equity is not remeasured, and its subsequent settlement is accounted for within equity.
The excess of the consideration transferred, the amount of any non-controlling interest in the acquiree and the acquisition-date fair value of any previous equity interest in the acquiree over the fair value of the identifiable net assets acquired is recorded as goodwill (Note 1.6). If this is less than the fair value of the net assets of the subsidiary acquired in the case of a bargain purchase, the difference is recognized directly in the statement of comprehensive income.
Inter-company transactions, balances and unrealized gains on transactions between group companies are eliminated. Unrealized losses are also eliminated unless the transaction provides evidence of an impairment of the asset transferred. Accounting policies and financial information of subsidiaries have been changed where necessary to ensure consistency with the policies adopted by the Group.
Investments in subsidiaries are accounted for at cost less impairment. Cost is adjusted to reflect changes in consideration arising from contingent consideration amendments. Cost also includes direct attributable costs of investment.
In the Company’s balance sheet the investments in subsidiaries are stated at cost less provision for impairment losses (Note 1.7). The results of subsidiaries are accounted for by the Company on the basis of dividend received and receivable.
(B) TRANSACTIONS WITH NON-CONTROLLING INTERESTSThe Group treats transactions with non-controlling interests that do not result in loss of control as transactions with equity owners of the Group. For purchases from non-controlling interests, the difference between any consideration paid and the relevant share acquired of the carrying value of net assets of the subsidiary is recorded in equity. Gains or losses on disposals to non-controlling interests are also recorded in equity.

185Li & Fung Limited Annual Report 2017Notes to the Financial Statements (continued)
1 Basis of Preparation and Principal Accounting Policies (continued)
1.2 Consolidation (continued)
(C) ASSOCIATED COMPANIESAssociated companies are all entities over which the Group has significant influence but not control, generally accompanying a shareholding of between 20% and 50% of the voting rights. Investments in associated companies are accounted for using the equity method of accounting and are initially recognized at cost, and the carrying amount is increased or decreased to recognize the investor’s share of the profit or loss of the investee after the date of acquisition. The Group’s investment in associated companies includes goodwill (net of any accumulated impairment loss) identified on acquisition (Note 1.6).
The Group’s share of its associated companies’ post-acquisition profits or losses is recognized in the consolidated profit and loss account, and its share of post-acquisition movements in other comprehensive income is recognized in other comprehensive income. The cumulative post-acquisition movements are adjusted against the carrying amount of the investment.
When the Group’s share of losses in an associate equals or exceeds its interest in the associate, including any other unsecured receivables, the Group does not recognize further losses, unless it has incurred legal or constructive obligations or made payments on behalf of the associate.
The Group determines at each reporting date whether there is any objective evidence that the investment in the associate is impaired. If this is the case, the Group calculates the amount of impairment as the difference between the recoverable amount of the associate and its carrying value and recognizes the amount adjacent to “share of profits less losses of associated companies and joint venture” in the consolidated profit and loss account.
Unrealized gains on transactions between the Group and its associated companies are eliminated to the extent of the Group’s interests in the associated companies. Unrealized losses are also eliminated unless the transaction provides evidence of an impairment of the asset transferred. The financial information of associated companies has been changed where necessary to ensure consistency with the policies adopted by the Group.
Dilution gains and losses in associates are recognized in the consolidated profit and loss account.
(D) JOINT VENTUREUnder the equity method of accounting, interest in joint venture is initially recognized at cost and adjusted thereafter to recognize the Group’s share of the post-acquisition profits or losses and movements in other comprehensive income. When the Group’s share of losses in joint venture equals or exceeds its interests in the joint venture (which includes any long-term interests that, in substance, form part of the Group’s net investment in the joint ventures), the Group does not recognize further losses, unless it has incurred obligations or made payments on behalf of the joint venture.
Unrealized gains on transactions between the Group and its joint venture is eliminated to the extent of the Group’s interest in the joint venture. Unrealized losses are also eliminated unless the transaction provides evidence of an impairment of the asset transferred.
1.3 Segment ReportingOperating segments are reported in a manner consistent with the internal reporting provided to the chief operating decision-maker. The chief operating decision-maker, who is responsible for allocating resources and assessing performance of the operating segments, has been identified for making strategic decisions.

Li & Fung Limited Annual Report 2017186 Notes to the Financial Statements (continued)
1 Basis of Preparation and Principal Accounting Policies (continued)
1.4 Foreign Currency Translation(A) FUNCTIONAL AND PRESENTATION CURRENCY
Items included in the financial statements of each of the Group’s entities are measured using the currency of the primary economic environment in which the entity operates (“the functional currency”). The consolidated financial statements are presented in US dollar, which is the Company’s functional and presentation currency.
(B) TRANSACTIONS AND BALANCESForeign currency transactions are translated into the functional currency using the exchange rates prevailing at the dates of the transactions or revaluation where items are remeasured. Foreign exchange gains and losses resulting from the settlement of such transactions and from the translation at year-end exchange rates of monetary assets and liabilities denominated in foreign currencies are recognized in the consolidated profit and loss account, except when deferred in equity as qualifying cash flow hedges or qualifying net investment hedges.
Changes in the fair value of monetary securities denominated in foreign currency classified as available-for-sale are analyzed between translation differences resulting from changes in the amortized cost of the security and other changes in the carrying amount of the security. Translation differences related to changes in the amortized cost are recognized in profit or loss, and other changes in the carrying amount are recognized in other comprehensive income.
Translation differences on non-monetary financial assets and liabilities such as equities held at fair value through profit or loss are recognized in profit or loss as part of the fair value gain or loss. Translation differences on non-monetary financial assets such as equities classified as available-for-sale are included in the available-for-sale reserve in other comprehensive income.
(C) GROUP COMPANIESThe results and financial position of all the Group entities (none of which has the currency of a hyperinflationary economy) that have a functional currency different from the presentation currency are translated into the presentation currency as follows:
(i) assets and liabilities for each balance sheet presented are translated at the closing rate at the date of that balance sheet;
(ii) income and expenses for each profit and loss account are translated at average exchange rates (unless this average is not a reasonable approximation of the cumulative effect of the rates prevailing on the transaction dates, in which case income and expenses are translated at the rate on the dates of the transactions); and
(iii) all resulting exchange differences are recognized in other comprehensive income.
On consolidation, exchange differences arising from the translation of the net investment in foreign operations, and of borrowings and other currency instruments designated as hedges of such investments, are taken to other comprehensive income.

187Li & Fung Limited Annual Report 2017Notes to the Financial Statements (continued)
1 Basis of Preparation and Principal Accounting Policies (continued)
1.4 Foreign Currency Translation (continued)
(C) GROUP COMPANIES (continued)
On the disposal of a foreign operation (that is, a disposal of the group’s entire interest in a foreign operation, or a disposal involving loss of control over a subsidiary that includes a foreign operation, a disposal involving loss of joint control over a joint venture that includes a foreign operation, or a disposal involving loss of significant influence over an associate that includes a foreign operation), all of the exchange differences accumulated in equity in respect of that operation attributable to the equity holders of the Company are reclassified to profit or loss.
In the case of a partial disposal that does not result in the Group losing control over a subsidiary that includes a foreign operation, the proportionate share of accumulated exchange differences is re-attributed to non-controlling interests and is not recognized in profit or loss. For all other partial disposals (that is, reductions in the Group’s ownership interest in associates or joint ventures that do not result in the Group losing significant influence or joint control) the proportionate share of the accumulated exchange difference is reclassified to profit or loss.
Goodwill and fair value adjustments arising on the acquisition of a foreign entity are treated as assets and liabilities of the foreign entity and translated at the closing rate. Exchange differences arising are recognized in equity.
1.5 Property, Plant and Equipment(A) LAND AND BUILDINGS
Freehold land is stated at cost less impairment.
Buildings are stated at cost less accumulated depreciation and accumulated impairment losses.
(B) OTHER PROPERTY, PLANT AND EQUIPMENTOther property, plant and equipment, comprising leasehold improvements, furniture, fixtures and equipment, plant and machinery, motor vehicles and company boat, are stated at cost less accumulated depreciation and accumulated impairment losses.

Li & Fung Limited Annual Report 2017188 Notes to the Financial Statements (continued)
1 Basis of Preparation and Principal Accounting Policies (continued)
1.5 Property, Plant and Equipment (continued)
(C) DEPRECIATION AND IMPAIRMENTFreehold land is not depreciated. Other classes of property, plant and equipment are depreciated at rates sufficient to allocate their costs less accumulated impairment losses to their residual values over their estimated useful lives on a straight-line basis. The principal annual rates are as follows:
Leasehold land shorter of lease term or useful life
Buildings and leasehold improvements 2% – 20%
Furniture, fixtures and equipment 62/3% – 331/3%
Plant and machinery 10% – 15%
Motor vehicles and company boat 15% – 20%
The assets’ residual values and useful lives are reviewed, and adjusted if appropriate, at the end of each reporting period. An asset’s carrying amount is written down immediately to its recoverable amount if the asset’s carrying amount is greater than its estimated recoverable amount (Note 1.7). Subsequent costs are included in the asset’s carrying amount or recognized as a separate asset, as appropriate, only when it is probable that future economic benefits associated with the item will flow to the Group and the cost of the item can be measured reliably. The carrying amount of the replaced part is derecognized. All other repair and maintenance costs are expensed in the consolidated profit and loss account during the financial period in which they are incurred.
(D) GAIN OR LOSS ON DISPOSALThe gain or loss on disposal of property, plant and equipment is the difference between the net sales proceeds and the carrying amount of the relevant item, and is recognized in the consolidated profit and loss account.
1.6 Intangible Assets(A) GOODWILL
Goodwill represents the excess of the considerations transferred over the net fair value of the Group’s share of the net identifiable assets/liabilities and contingent liabilities of the acquired business/associated company/joint venture at the date of acquisition (Note 1.2(a)). Goodwill on acquisitions of subsidiaries is included in intangible assets. Goodwill on acquisitions of associated companies and joint venture is included in interests in associated accompanies and joint venture and is tested annually for impairment as part of the overall balance. Separately recognized goodwill is tested annually for impairment and carried at cost less accumulated impairment losses. Impairment losses on goodwill are not reversed. Gains and losses on the disposal of an entity include the carrying amount of goodwill relating to the entity sold.
Goodwill is allocated to cash-generating units for the purpose of impairment testing. The allocation is made to those cash-generating units or groups of cash-generating units that are expected to benefit from the business combination in which the goodwill arose identified according to operating segment. Each unit or groups of units to which the goodwill is allocated represents the lowest level within the entity at which the goodwill is monitored for internal management purpose.
Goodwill impairment reviews are undertaken annually or more frequently if events or changes in circumstances indicate a potential impairment. The carrying value of goodwill is compared to the recoverable amount, which is the higher of value in use and the fair value less costs to sell. Any impairment is recognized immediately as an expense and is not subsequently reversed.

189Li & Fung Limited Annual Report 2017Notes to the Financial Statements (continued)
1 Basis of Preparation and Principal Accounting Policies (continued)
1.6 Intangible Assets (continued)
(B) SYSTEM DEVELOPMENT, SOFTWARE AND OTHER LICENSE COSTSAcquired computer software licences are capitalized on the basis of the costs incurred to acquire and bring to use the specific software. These costs are amortized over the estimated useful lives of 3 to 10 years.
Costs associated with developing or maintaining computer software programmes are recognized as an expense as incurred. Costs that are directly associated with the development of identifiable and unique software products controlled by the Group, and that will probably generate economic benefits exceeding costs beyond one year, are recognized as intangible assets. Costs include the employee costs incurred as a result of developing software and an appropriate portion of relevant overheads.
System development costs recognized as assets are amortized over their estimated useful lives of 3 to 10 years.
Brand licenses are license contracts entered into with the brandholders by the Group in the capacity as licensee. Brand licenses are capitalized based on the upfront costs incurred and the present value of guaranteed royalty payments to be made subsequent to the inception of the license contracts. Brand licenses are amortized based on expected usage from the date of first commercial usage over the remaining licence periods ranging from approximately 1 to 10 years.
(C) OTHER INTANGIBLE ASSETSIntangible assets, other than goodwill, identified on business combinations are capitalized at their fair values. They represent mainly trademarks, buying agency agreements secured, and relationships with customers and licensors. Intangible assets arising from business combinations with definite useful lives are amortized on a straight-line basis from the date of acquisition over their estimated useful lives ranging from 5 to 20 years.
1.7 Impairment of Investments in Subsidiaries, Associated Companies, Joint Venture and Non-Financial AssetsAssets that have an indefinite useful life, for example goodwill, are not subject to amortization and are tested annually for impairment. Assets are reviewed for impairment whenever events or changes in circumstances indicate that the carrying amount may not be recoverable. An impairment loss is recognized for the amount by which the asset’s carrying amount exceeds its recoverable amount. The recoverable amount is the higher of an asset’s fair value less costs to sell and value in use. For the purposes of assessing impairment, assets are grouped at the lowest levels for which there are separately identifiable cash flows (cash-generating units). Non-financial assets other than goodwill that suffer an impairment are reviewed for possible reversal of the impairment at each reporting date.
Impairment testing of the investments in subsidiaries, associated companies or joint venture is required upon receiving dividends from these investments if the dividend exceeds the total comprehensive income of the subsidiaries, associated companies or joint venture in the period the dividend is declared or if the carrying amount of the investment in the separate financial statements exceeds the carrying amount in the consolidated financial statements of the investee’s net assets including goodwill.
Li & Fung Limited Annual Report 2017190 Notes to the Financial Statements (continued)
1 Basis of Preparation and Principal Accounting Policies (continued)
1.8 Financial AssetsCLASSIFICATIONThe Group classifies its financial assets as either loans and receivables or available-for-sale. The classification depends on the purpose for which the financial assets were acquired. Management determines the classification of its financial assets at initial recognition.
(A) Loans and receivablesLoans and receivables are non-derivative financial assets with fixed or determinable payments that are not quoted in an active market. They are included in current assets, except for maturities greater than 12 months after the balance sheet date. These are classified as non-current assets. The Group’s loans and receivables comprise “trade and bills receivable”, “other receivables, prepayments and deposits”, “cash and bank balances” and “amounts due from related companies” in the balance sheet (Notes 1.11 and 1.13).
(B) Available-for-sale financial assetsAvailable-for-sale financial assets are non-derivatives that are either designated in this category or not classified in any other category. They are included in non-current assets unless management intends to dispose of the investment within 12 months of the balance sheet date.
RECOGNITION AND MEASUREMENTRegular purchases and sales of financial assets are recognized on the trade-date – the date on which the Group commits to purchase or sell the asset. Investments are initially recognized at fair value plus transaction costs for all financial assets not carried at fair value through profit or loss. Financial assets are derecognized when the rights to receive cash flows from the investments have expired or have been transferred and the Group has transferred substantially all risks and rewards of ownership. Available-for-sale financial assets are subsequently carried at fair value. Loans and receivables are subsequently carried at amortized cost using the effective interest method.
Changes in the fair value of monetary securities denominated in a foreign currency and classified as available-for-sale are analyzed between translation differences resulting from changes in amortized cost of the security and other changes in the carrying amount of the security. The translation differences on monetary securities are recognized in consolidated profit or loss; translation differences on non-monetary securities are recognized in other comprehensive income. Changes in the fair values of monetary and non-monetary securities classified as available-for-sale are recognized in other comprehensive income.
When securities classified as available-for-sale are sold or impaired, the accumulated fair value adjustments recognized in equity are included in the consolidated profit and loss account as net investment loss.
Interest on available-for-sale securities calculated using the effective interest method is recognized in the consolidated profit and loss account as part of interest income. Dividends on available-for-sale equity instruments are recognized in the consolidated profit and loss account as part of other income when the Group’s right to receive payments is established.

191Li & Fung Limited Annual Report 2017Notes to the Financial Statements (continued)
1 Basis of Preparation and Principal Accounting Policies (continued)
1.9 Impairment of Financial Assets(A) ASSETS CLASSIFIED AS LOANS AND RECEIVABLES CARRIED AT AMORTIZED COST
The Group assesses at the end of each reporting period whether there is objective evidence that a financial asset or group of financial assets is impaired. A financial asset or a group of financial assets is impaired and impairment losses are incurred only if there is objective evidence of impairment as a result of one or more events that occurred after the initial recognition of the asset (a ‘loss event’) and that loss event (or events) has an impact on the estimated future cash flows of the financial asset or group of financial assets that can be reliably estimated.
The criteria that the Group uses to determine that there is objective evidence of an impairment loss include:
• Significant financial difficulty of the issuer or obligor;
• A breach of contract, such as a default or delinquency in interest or principal payments;
• The Group, for economic or legal reasons relating to the borrower’s financial difficulty, granting to the borrower a concession that the lender would not otherwise consider;
• It becomes probable that the borrower will enter bankruptcy or other financial reorganization;
• The disappearance of an active market for that financial asset because of financial difficulties; or
• Observable data indicating that there is a measurable decrease in the estimated future cash flows from a portfolio of financial assets since the initial recognition of those assets, although the decrease cannot yet be identified with the individual financial assets in the portfolio, including:
(i) adverse changes in the payment status of borrowers in the portfolio;
(ii) national or local economic conditions that correlate with defaults on the assets in the portfolio.
The Group first assesses whether objective evidence of impairment exists.
The amount of the loss is measured as the difference between the asset’s carrying amount and the present value of estimated future cash flows (excluding future credit losses that have not been incurred) discounted at the financial asset’s original effective interest rate. The asset’s carrying amount is reduced and the amount of the loss is recognized in the consolidated profit and loss account. If a loan has a variable interest rate, the discount rate for measuring any impairment loss is the current effective interest rate determined under the contract. As a practical expedient, the Group may measure impairment on the basis of an instrument’s fair value using an observable market price.
If, in a subsequent period, the amount of the impairment loss decreases and the decrease can be related objectively to an event occurring after the impairment was recognized (such as an improvement in the debtor’s credit rating), the reversal of the previously recognized impairment loss is recognized in the consolidated profit and loss account.

Li & Fung Limited Annual Report 2017192 Notes to the Financial Statements (continued)
1 Basis of Preparation and Principal Accounting Policies (continued)
1.9 Impairment of Financial Assets (continued)
(B) ASSETS CLASSIFIED AS AVAILABLE-FOR-SALEThe Group assesses at the end of each reporting period whether there is objective evidence that a financial asset or a group of financial assets is impaired. For debt securities, the Group uses the criteria refer to (a) above. In the case of equity investments classified as available-for-sale, a significant or prolonged decline in the fair value of the security below its cost is also evidence that the assets are impaired. If any such evidence exists for available-for-sale financial assets, the cumulative loss – measured as the difference between the acquisition cost and the current fair value, less any impairment loss on that financial asset previously recognized in profit or loss – is removed from equity and recognized in the consolidated profit and loss account. Impairment losses recognized in the consolidated profit and loss account on equity instruments are not reversed through the consolidated profit and loss account. If, in a subsequent period, the fair value of a debt instrument classified as available-for-sale increases and the increase can be objectively related to an event occurring after the impairment loss was recognized in profit or loss, the impairment loss is reversed through the consolidated profit and loss account.
1.10 InventoriesInventories comprise raw materials and finished goods and are stated at the lower of cost and net realizable value. Cost, calculated on a first-in, first-out (FIFO) basis, comprises purchase prices of inventories and direct costs (based on normal operating capacity). It excludes borrowing costs. Net realizable value is the estimated selling price in the ordinary course of business less applicable variable selling expenses.
1.11 Trade and Other ReceivablesTrade and other receivables are recognized initially at fair value and subsequently measured at amortized cost using the effective interest method, less provision for impairment. If collection of trade and other receivables is expected in one year or less (or in the normal operating cycle of the business if longer), they are classified as current assets. If not, they are presented as non-current assets. A provision for impairment of trade and other receivables is established when there is objective evidence that the Group will not be able to collect all amounts due according to the original terms of the receivables. Significant financial difficulties of the debtor, probability that the debtor will enter bankruptcy or financial reorganization, and default or delinquency in payments (more than 30 days overdue) are considered indicators that the trade receivable is impaired. The amount of the provision is the difference between the asset’s carrying amount and the present value of estimated future cash flows, discounted at the original effective interest rate. The carrying amount of the assets is reduced through the use of an allowance account, and the amount of the loss is recognized in the consolidated profit and loss account within selling expenses. When a trade receivable is uncollectible, it is written off against the allowance account for trade receivables. Subsequent recoveries of amounts previously written off are credited against selling expenses in the consolidated profit and loss account.
1.12 Share CapitalOrdinary shares are classified as equity.
Incremental costs directly attributable to the issue of new shares or options are shown in equity as a deduction, net of tax, from the proceeds.

193Li & Fung Limited Annual Report 2017Notes to the Financial Statements (continued)
1 Basis of Preparation and Principal Accounting Policies (continued)
1.13 Cash and Cash EquivalentsCash and cash equivalents include cash in hand, deposits held at call with banks and bank overdrafts.
1.14 BorrowingsBorrowings are recognized initially at fair value, net of transaction costs incurred. Borrowings are subsequently stated at amortized cost; any difference between the proceeds (net of transaction costs) and the redemption value is recognized in the consolidated profit and loss account over the period of the borrowings using the effective interest method.
Fees paid on the establishment of loan facilities are recognized as transaction costs of the loan to the extent that it is probable that some or all of the facility will be drawn down. In this case, the fee is deferred until the draw-down occurs. To the extent there is no evidence that it is probable that some or all of the facility will be drawn down, the fee is capitalized as a prepayment for liquidity services and amortized over the period of the facility to which it relates.
Borrowings are classified as current liabilities unless the Group has an unconditional right to defer settlement of the liability for at least 12 months after the balance sheet date.
1.15 Current and Deferred TaxThe tax expense for the period comprises current and deferred tax. Tax is recognized in the consolidated profit and loss account, except to the extent that it relates to items recognized in other comprehensive income or directly in equity. In this case the tax is also recognized in other comprehensive income or directly in equity, respectively.
The current tax charge is calculated on the basis of the tax laws enacted or substantively enacted at the balance sheet date in the countries where the Company’s subsidiaries and associates operate and generate taxable income. Management periodically evaluates positions taken in tax returns with respect to situations in which applicable tax regulation is subject to interpretation and establishes provisions where appropriate on the basis of amounts expected to be paid to the tax authorities.
Deferred tax is provided, using the liability method, on temporary differences arising between the tax bases of assets and liabilities and their carrying amounts in the consolidated financial statements. However, the deferred tax is not accounted for if it arises from initial recognition of an asset or liability in a transaction other than a business combination that at the time of the transaction affects neither accounting nor taxable profit or loss. Deferred tax is determined using tax rates (and laws) that have been enacted or substantively enacted by the balance sheet date and are expected to apply when the related deferred tax asset is realized or the deferred tax liability is settled.
Deferred tax assets are recognized to the extent that it is probable that future taxable profit will be available against which the temporary differences can be utilized.
Deferred tax is provided on temporary differences arising on investments in subsidiaries, associates, except for deferred tax liability where the timing of the reversal of the temporary difference is controlled by the Group and it is probable that the temporary difference will not reverse in the foreseeable future.
Deferred tax assets and liabilities are offset when there is a legally enforceable right to offset current tax assets against current tax liabilities and when the deferred taxes assets and liabilities relate to income taxes levied by the same taxation authority on either the taxable entity or different taxable entities where there is an intention to settle the balances on a net basis.

Li & Fung Limited Annual Report 2017194 Notes to the Financial Statements (continued)
1 Basis of Preparation and Principal Accounting Policies (continued)
1.16 Employee Benefits(A) EMPLOYEE LEAVE ENTITLEMENTS
Employee entitlements to annual leave are recognized when they accrue to employees. A provision is made for the estimated liability for annual leave entitlements as a result of services rendered by employees up to the balance sheet date.
Employee entitlements to sick leave and maternity leave are not recognized until the time of leave.
(B) DISCRETIONARY BONUSThe expected costs of discretionary bonus payments are recognized as a liability when the Group has a present legal or constructive obligation as a result of services rendered by employees and a reliable estimate of the obligation can be made.
Liabilities for discretionary bonus are expected to be settled within 12 months and are measured at the amounts expected to be paid when they are settled.
(C) POST-EMPLOYMENT BENEFIT OBLIGATIONSThe Group participates in a number of defined contribution plans and defined benefit plans throughout the world, the assets of which are generally held in separate trustee-administrated funds. The defined benefit pension plans are generally funded by payments from employees and by the relevant Group companies, taking into account of the recommendations of independent qualified actuaries.
The Group’s contributions to the defined contribution plans are charged to the consolidated profit and loss account in the year to which the contributions relate.
For defined benefit plans, pension costs are assessed using the projected unit credit method. Under this method, the cost of providing pensions is charged to the consolidated profit and loss account so as to spread the regular cost over the service lives of employees in accordance with the advice of the actuaries who carry out a full valuation of the plans on an annual basis. The pension obligation is measured as the present value of the estimated future cash outflows, discounted by reference to market yields on high-quality corporate bonds which have terms to maturity approximating the terms of the related liabilities. In countries where there is no deep market in such bonds, the market yields on government bonds are used. Actuarial gains and losses arising from experience adjustments and changes in actuarial assumptions are charged or credited to equity in other comprehensive income in the period in which they arise. Past-service costs are recognized immediately in the consolidated profit and loss account.
The Group’s net obligation in respect of long-service payments on cessation of employment in certain circumstances under the Hong Kong Employment Ordinance is the amount of future benefit that employees have earned in return for their service in the current and prior periods; that benefit is discounted to determine the present value and reduced by entitlements accrued under the Group’s retirement plans that are attributable to contributions made by the Group. The obligation is calculated using the projected unit credit method by a qualified actuary. The discount rate is determined by reference to market yields on high-quality corporate bonds which have terms to maturity approximating the terms of the related liabilities. In countries where there is no deep market in such bonds, the market yields on government bonds are used.
195Li & Fung Limited Annual Report 2017Notes to the Financial Statements (continued)
1 Basis of Preparation and Principal Accounting Policies (continued)
1.16 Employee Benefits (continued)
(D) SHARE-BASED COMPENSATIONThe Group operates an equity-settled, share-based compensation plan. The fair value of the employee services received in exchange for the grant of the Share Options/Award Shares is recognized as an expense. The total amount to be expensed over the vesting period is determined by reference to the fair value of the options/share awards granted:
• including any market performance conditions;
• excluding the impact of any service and non-market performance vesting conditions (for example, profitability, sale growth targets and remaining an employee of the entity over a specified time period); and
• including the impact of any non-vesting conditions (for example, the requirement for employees to save).
Non-market performance vesting conditions are included in assumptions about the number of Share Options/Award shares that are expected to vest. The total expense is recognized over the vesting period, which is the period over which all of the specified vesting conditions are to be satisfied. At each balance sheet date, the Group revises its estimates on the number of Share Options/Award Shares that are expected to vest. It recognizes the impact of the revision of original estimates, if any, in the consolidated profit and loss account, with a corresponding adjustment to employee share-based compensation reserve.
The proceeds received net of any directly attributable transaction costs are credited to share capital (nominal value) and share premium when the options are exercised.
(E) SHARE-BASED PAYMENT TRANSACTIONS AMONG GROUP ENTITIESThe grant by the Company of Share Options/Award Shares over its equity instruments to the employees of subsidiary undertakings in the Group is treated as a capital contribution. The fair value of employee services received, measured by reference to the grant date fair value, is recognized over the vesting period as an increase to investment in subsidiary undertakings, with a corresponding credit to equity in the parent entity’s financial statements.
1.17 ProvisionsProvisions are recognized when: the Group has a present legal or constructive obligation as a result of past events; it is probable that an outflow of resources will be required to settle the obligation; and the amount has been reliably estimated. Provisions are not recognized for future operating losses.
Where there are a number of similar obligations, the likelihood that an outflow will be required in settlement is determined by considering the class of obligations as a whole. A provision is recognized even if the likelihood of an outflow with respect to any one item included in the same class of obligations may be small.
Provisions are measured at the present value of the expenditures expected to be required to settle the obligation using a pre-tax discount rate that reflects current market assessments of the time value of money and the risks specific to the obligation. The increase in the provision due to passage of time is recognized as interest expense.

Li & Fung Limited Annual Report 2017196 Notes to the Financial Statements (continued)
1 Basis of Preparation and Principal Accounting Policies (continued)
1.18 Contingent Liabilities and Contingent AssetsA contingent liability is a possible obligation that arises from past events and whose existence will only be confirmed by the occurrence or non-occurrence of one or more uncertain future events not wholly within the control of the Group. It can also be a present obligation arising from past events that is not recognized because it is not probable that outflow of economic resources will be required or the amount of obligation cannot be measured reliably.
A contingent liability is not recognized but is disclosed in the notes to the financial statements. When a change in the probability of an outflow occurs so that outflow is probable, it will then be recognized as a provision.
A contingent asset is a possible asset that arises from past events and whose existence will be confirmed only by the occurrence or non-occurrence of one or more uncertain events not wholly within the control of the Group.
Contingent assets are not recognized but are disclosed in the notes to the financial statements when an inflow of economic benefits is probable. When inflow is virtually certain, an asset is recognized.
1.19 Total MarginTotal margin includes gross profit and other recurring income relating to Services segment, Onshore Wholesale business of Products segment and Divested Asia Consumer and Healthcare Distribution Business.
1.20 Core Operating ProfitCore operating profit is the profit before taxation generated from the Group’s Services segment, Onshore Wholesale business of Products segment and Divested Asia Consumer and Healthcare Distribution Business excluding share of results of associated companies and joint venture, interest income, interest expenses, taxation, material gains or losses which are of capital nature or non-operational related and acquisition related cost. This also excludes gain or loss on remeasurement of contingent consideration payable and amortization of other intangible assets and one-off re-organization costs which are non-cash items.
1.21 Revenue Recognition(A) TURNOVER FROM SALES OF GOODS
Turnover from sales of goods are primarily generated by the Supply Chain Solutions of the Services segment and the Products segment. Supply Chain Solutions provides end-to-end sourcing solutions of goods through the global network to a diverse portfolio of global brands and retail customers, while Products segment focuses on furniture, beauty and sweaters product verticals and Onshore Wholesale business.
Revenues are recognized when control of the goods has been transferred, being when the goods are delivered to the customers, the customers has full discretion over the channel and price to sell the goods, and there is no unfulfilled obligation that could affect the customers’ acceptance of the goods. Delivery occurs when the goods have been shipped to the location specified by customer, the risks of obsolescence and loss have been transferred to the customers, and either the customer has accepted the goods in accordance with the sales contract, the acceptance provisions have lapsed, or the Group has objective evidence that all criteria for acceptance have been satisfied. Revenue is shown net of value-added tax, returns, claims and discounts and after eliminating sales within the Group.
The goods are often sold with volume rebate based on aggregate sales over a specific period. Revenue from these sales is recognized based on the price specified in the contract, net of the estimated volume rebate. Accumulated experience is used to estimate and provide for the discounts, using the expected value method, and revenue is only recognized to the extent that it is highly probable that a significant reversal will not occur. A contract liability is recognized for expected volume rebate payable to customers in relation to sales made until the end of the reporting period.
197Li & Fung Limited Annual Report 2017Notes to the Financial Statements (continued)
1 Basis of Preparation and Principal Accounting Policies (continued)
1.21 Revenue Recognition (continued)
(A) TURNOVER FROM SALES OF GOODS (continued)
A contract liability is also recognized when the customers pay deposits before the Group transfers control of the goods to the customers.
A receivable is recognized when the goods are delivered as this is the point in time that the consideration is unconditional because only the passage of time is required before the payment is due.
(B) SERVICES FEE FROM LOGISTICS BUSINESSLogistics business of the Services segment includes in-country logistics and global freight management. In-country logistics business offers logistics services including distribution center management, order management and local transportation. Global freight management offers full services international freight solutions. Service income is recognized in the accounting period in which the provision of services occurs. Customers are invoiced upon the completion of services or on a regular basis.
Some contracts include multiple performance obligations and do not include any integration services. They are therefore accounted for as separate performance obligations. Revenue from each of the performance obligations is recognized at the stand-alone service price.
No element of financing is deemed present as the sales are made with a credit term up to 120 days, which is consistent with market practice.
1.22 Borrowing CostsBorrowing costs that are directly attributable to the acquisition, construction or production of qualifying asset that necessarily takes a substantial period of time to get ready for its intended use or sale are capitalized as part of the cost of that asset, until such time as the assets are substantially ready for their intended use or sale.
Investment income earned on the temporary investment of specific borrowings pending their expenditure on qualifying assets is deducted from the borrowing costs eligible for capitalisation.
All other borrowing costs are charged to the consolidated profit and loss account in the year in which they are incurred.
1.23 Operating LeasesLeases in which a significant portion of the risks and rewards of ownership are retained by the lessor are classified as operating leases. Payments made under operating leases (net of any incentives received from the lessor) are charged to the consolidated profit and loss account on a straight-line basis over the period of the lease. The upfront prepayments made for leasehold land and land use rights are amortized on a straight-line basis over the period of the lease or where there is impairment, the impairment is expensed in the consolidated profit and loss account.

Li & Fung Limited Annual Report 2017198 Notes to the Financial Statements (continued)
1 Basis of Preparation and Principal Accounting Policies (continued)
1.24 Derivative Financial Instruments and Hedging ActivitiesDerivatives are initially recognized at fair value on the date a derivative contract is entered into and are subsequently remeasured at their fair value. The method of recognizing the resulting gain or loss depends on whether the derivative is designated as a hedging instrument, and if so, the nature of the item being hedged. The Group designates certain derivatives as hedges of a particular risk associated with a recognized liability or a highly probable forecast transaction (cash flow hedge).
The Group documents, at the inception of the transaction, the intended relationship between hedging instruments and hedged items, as well as its risk management objectives and strategy for undertaking various hedge transactions. The Group also documents its assessment, both at hedge inception and on an ongoing basis, of whether the derivatives that are used in hedging transactions are highly effective in offsetting changes in fair values or cash flows of hedged items.
Movements in the fair values of hedging derivatives are included within shareholders’ equity. The full fair value of a hedging derivative is classified as a non-current asset or liability when the remaining maturity of the hedged item is more than 12 months. Trading derivatives are classified as a current asset or liability.
(A) CASH FLOW HEDGEThe effective portion of changes in the fair value of derivatives that are designated and qualify as cash flow hedges are recognized in other comprehensive income. The gain or loss relating to the ineffective portion is recognized immediately in the consolidated profit and loss account.
Amounts accumulated in equity are recycled to the consolidated profit and loss account in the periods when the hedged item affects profit or loss (for example, when the forecast sale that is hedged takes place). The gain or loss relating to the effective portion of forward foreign exchange contracts hedging export sales is recognized in the consolidated profit and loss account within sales. The gain or loss relating to the ineffective portion is recognized in the consolidated profit and loss account within other gains/(losses) – net. However, when the forecast transaction that is hedged results in the recognition of a non-financial asset (for example, inventory or property, plant and equipment), the gains and losses previously deferred in equity are transferred from equity and included in the initial measurement of the cost of the asset. The deferred amounts are ultimately recognized in cost of goods sold in case of inventory, or in depreciation in case of property, plant and equipment.
When a hedging instrument expires or is sold, or when a hedge no longer meets the criteria for hedge accounting, any cumulative gain or loss existing in equity at that time remains in equity and is recognized when the forecast transaction is ultimately recognized in the consolidated profit and loss account. When a forecast transaction is no longer expected to occur, the cumulative gain or loss that was reported in equity is immediately transferred to the consolidated profit and loss account.
(B) DERIVATIVES AT FAIR VALUE THROUGH PROFIT OR LOSSDerivatives financial instruments recognized at fair value through profit or loss include certain derivative instruments that do not qualify for hedge accounting which is initially recognized at fair value on the date a derivative contract is entered into and are subsequently remeasured at their fair value. Changes in the fair values of derivative financial instruments are recognized immediately in the consolidated profit and loss account.

199Li & Fung Limited Annual Report 2017Notes to the Financial Statements (continued)
1 Basis of Preparation and Principal Accounting Policies (continued)
1.25 Trade PayablesTrade payables are obligations to pay for goods or services that have been acquired in the ordinary course of business from suppliers. Trade payables are classified as current liabilities if payment is due within one year or less (or in the normal operating cycle of the business if longer). If not, they are presented as non-current liabilities.
Trade payables are recognized initially at fair value and subsequently measured at amortized cost using the effective interest method.
1.26 Dividend DistributionDividend distribution to the Company’s shareholders is recognized as a liability in the Group’s and Company’s financial statements in the period in which the dividends are approved by the Company’s shareholders.
1.27 Treasury SharesIn relation to certain business combinations and Share Award Scheme, the Company may issue or purchase shares to escrow agents for the settlement of acquisition consideration payables and to the trustee of Share Award Scheme. The shares, valued at the agreed upon issue price or purchase price, including any directly attributable incremental costs, are presented as “treasury shares” and deducted from total equity. The number of shares held by escrow agent for settlement of acquisition consideration and by the trustee of Share Award Scheme would be eliminated against the corresponding amount of share capital issued in the calculation of the earnings per share for profit attributable to the shareholders of the Company.
1.28 Financial Guarantee ContractFinancial guarantees are initially recognized in the financial statements at fair value on the date the guarantee was given. The Company’s liabilities under such guarantees are subsequently measured at the higher of the initial amount, less amortization of fees recognized in accordance with HKAS 18, and the best estimate of the amount required to settle the guarantee. These estimates are determined based on the experience of similar transactions and history of past losses, supplemented by the judgement of management. The fee income earned is recognized on a straight-line basis over the life of the guarantee. Any increase in the liability relating to guarantees is reported in the consolidated profit and loss account within administrative expenses.
1.29 Non-Current Assets Held-For-Sale and Discontinued OperationsNon-current assets (or disposal groups) are classified as held for sale when their carrying amount is to be recovered principally through a sale transaction and a sale is considered highly probable. The non-current assets (or disposal groups), except for certain assets as explained below, are stated at the lower of carrying amount and fair value less costs to sell. Deferred tax assets, assets arising from employee benefits, and financial assets (other than investments in subsidiaries and associates), which are classified as held for sale, would continue to be measured in accordance with the policies set out elsewhere in Note 1.
A discontinued operation is a component of the Group’s business, the operations and cash flows of which can be clearly distinguished from the rest of the Group and which represents a separate major line of business or geographic area of operations, or is part of a single co-ordinated plan to dispose of a separate major line of business or geographical area of operations, or is a subsidiary acquired exclusively with a view to resale.
When an operation is classified as discontinued, a single amount is presented in the profit and loss account, which comprises the post-tax profit or loss of the discontinued operation and the post-tax gain or loss recognized on the measurement to fair value less costs to sell, or on the disposal, of the assets (or disposal groups) constituting the discontinued operation.

Li & Fung Limited Annual Report 2017200 Notes to the Financial Statements (continued)
1 Basis of Preparation and Principal Accounting Policies (continued)
1.30 Written Put Option LiabilitiesThe Discontinued Operations has granted a put option to a non-controlling interest shareholder of a subsidiary for the right to sell its full non-controlling interests to the Discontinued Operations. The Discontinued Operations recognizes the written put option liabilities initially at the present value of the redemption amount, which are determined in accordance with the terms under those relevant agreements and with reference to the estimated post-acquisition performance of the acquired business, and a corresponding debit in equity. The written put option liability is subsequently remeasured at fair value, with changes in measurement recognized in profit and loss.
2 Critical Accounting Estimates and JudgmentsEstimates and judgments are continually evaluated and are based on historical experience and other factors, including expectations of future events that are believed to be reasonable under the circumstances.
The Group makes estimates and assumptions concerning the future. The resulting accounting estimates will, by definition, seldom equal the related actual results. The estimates and assumptions that have a significant risk of causing a material adjustment to the carrying amounts of assets and liabilities within the next financial year are discussed below.
(A) Estimated Impairment of Intangible Assets Including GoodwillThe Group tests annually whether goodwill has suffered any impairment, in accordance with the accounting policy stated in Note 1.6. The recoverable amounts of cash-generating units have been determined based on value-in-use calculations. These calculations require the use of estimates (Note 11).
(B) Useful Lives of Intangible AssetsThe Group amortizes its intangible assets with finite useful lives on a straight-line basis over their estimated useful lives. The estimated useful lives reflect the management’s estimates of the periods that the Group intends to derive future economic benefits from the use of these intangible assets.
(C) Income TaxesThe Group is subject to income taxes in numerous jurisdictions. Significant judgment is required in determining the worldwide provision for income taxes. There are many transactions and calculations for which the ultimate tax determination is uncertain during the ordinary course of business. The Group recognizes liabilities for anticipated tax audit issues based on estimates of whether additional taxes will be due. Where the final tax outcome of these matters is different from the amounts that were initially recorded, such differences will impact the income tax and deferred tax provisions in the period in which such determination is made.

201Li & Fung Limited Annual Report 2017Notes to the Financial Statements (continued)
2 Critical Accounting Estimates and Judgments (continued)
(D) Contingent Considerations of AcquisitionsCertain of the Group’s business acquisitions have involved post-acquisition performance-based contingent considerations. HKFRS 3 (Revised) is effective prospectively to business combinations for which the acquisition date is on or after the beginning of the first annual reporting period beginning on or after 1 July 2009. The Group follows the requirement of HKFRS 3 (Revised) to recognize the fair value of those contingent considerations for acquisitions, as of their respective acquisition dates as part of the consideration transferred in exchange for the acquired businesses/subsidiaries. These fair value measurements require, among other things, significant estimation of post-acquisition performance of the acquired subsidiaries/business and significant judgment about the time value of money. Contingent considerations shall be remeasured at their fair value resulting from events or factors emerging after the acquisition date, with any resulting gain or loss recognized in the consolidated profit and loss account in accordance with HKFRS 3 (Revised).
The basis of the contingent consideration differs for each acquisition; generally, however the contingent consideration reflects a specified multiple of the post-acquisition financial profitability of the acquired business. Consequently, the actual additional consideration payable may vary according to the future performance of each individual acquired business, and the liabilities provided reflect estimates of such future performances.
Due to the number of acquisitions for which additional consideration remains outstanding and the variety of bases of determination, it is not practicable to provide any meaningful sensitivity in relation to the critical assumptions concerning future profitability of each acquired business and the potential impact on the gain or loss on remeasurement of contingent consideration payables and goodwill for each acquired business.
However, if the total actual contingent consideration payables are 10% lower or higher than the total contingent consideration payables estimated by management, the resulting aggregate impact to the gain or loss on remeasurement of contingent consideration payables for acquisitions would be US$6 million.

Li & Fung Limited Annual Report 2017202 Notes to the Financial Statements (continued)
3 Segment InformationThe Company is domiciled in Bermuda. The Company is a limited liability company incorporated in Bermuda. The address of its registered office is Canon’s Court, 22 Victoria Street, Hamilton HM 12, Bermuda and its Hong Kong office is at 11/F, Li Fung Tower, 888 Cheung Sha Wan Road, Kowloon, Hong Kong.
The Group is principally engaged in managing the supply chain for retailers and brands worldwide with over 230 offices and distribution centers in more than 40 economies spanning across the Americas, Europe, Africa and Asia. Turnover represents revenue generated from sales and services rendered at invoiced value to customers outside the Group less discounts and returns.
In 2016, the Group divested the Asia consumer and healthcare distribution business from the Trading Network segment to refocus resources on core businesses.
At the beginning of 2017, the Group reorganized the business into two segments: Services and Products. The Services segment consists of the Supply Chain Solutions and Logistics businesses. The Products segment consists of the Onshore Wholesale business and the three Product Verticals (furniture, beauty and sweaters) representing our principal-to-principal business, which were previously under the Trading network.
On 14 December 2017, the Group announced the strategic divestment of the three Product Verticals to further simplify our business and facilitate sharper focus on the core sourcing business. The strategic divestment was approved by the Company’s Independent Shareholders on 31 January 2018 and is targeted to close during first half of 2018, subject to regulatory approval. The three Product Verticals are classified as Discontinued Operations and their net results for the year and the comparatives are excluded from the Products segment and presented separately as one-line item below net profit of the Continuing Operations. Further details of financial information of the Discontinued operations are set out in Note 31 to the financial statements.
The Group’s management (Chief Operating Decision-Marker) considers the business of the Continuing Operations principally from the perspective of Services segment and the Products segment with the exclusion of the strategic divestment. Prior year comparative segment information has been restated to conform with the current period presentation accordingly.
The Group’s management assesses the performance of the operating segments based on a measure of operating profit, referred to as core operating profit. This measurement basis includes profit of the operating segments before share of results of associated companies and joint venture, interest income, interest expenses, taxation, material other gains or losses which are of capital nature, non-operational related or acquisition related. This also excludes any gain or loss on remeasurement of contingent consideration payable and amortization of other intangible assets which are non-cash items. Other information provided to the Group’s management is measured in a manner consistent with that in these consolidated financial statements.

203Li & Fung Limited Annual Report 2017Notes to the Financial Statements (continued)
3 Segment Information (continued)
Services Products Elimination TotalUS$’000 US$’000 US$’000 US$’000
Year ended 31 December 2017
Continuing Operations
Turnover 12,013,024 1,551,680 (30,495) 13,534,209
Total margin 1,085,908 300,364 1,386,272
Operating costs (783,551) (246,869) (1,030,420)
Core operating profit 302,357 53,495 355,852
Gain on remeasurement of contingent consideration payable 31,492
Amortization of other intangible assets (23,327)
One-off reorganization costs (33,945)
Operating profit 330,072
Interest income 12,261
Interest expenses
Non-cash interest expenses (3,284)
Cash interest expenses (66,477)
(69,761)
Share of profits less losses of associated companies and joint venture 1,898
Profit before taxation 274,470
Taxation (40,830)
Net profit for the year from Continuing Operations 233,640
Discontinued Operations
Net loss for the year from Discontinued Operations (543,045)
Net loss for the year (309,405)
Depreciation and amortization (Continuing Operations) 52,590 18,108 70,698
31 December 2017
Non-current assets (other than available-for-sale financial assets and deferred tax assets) 1,821,217 775,209 2,596,426
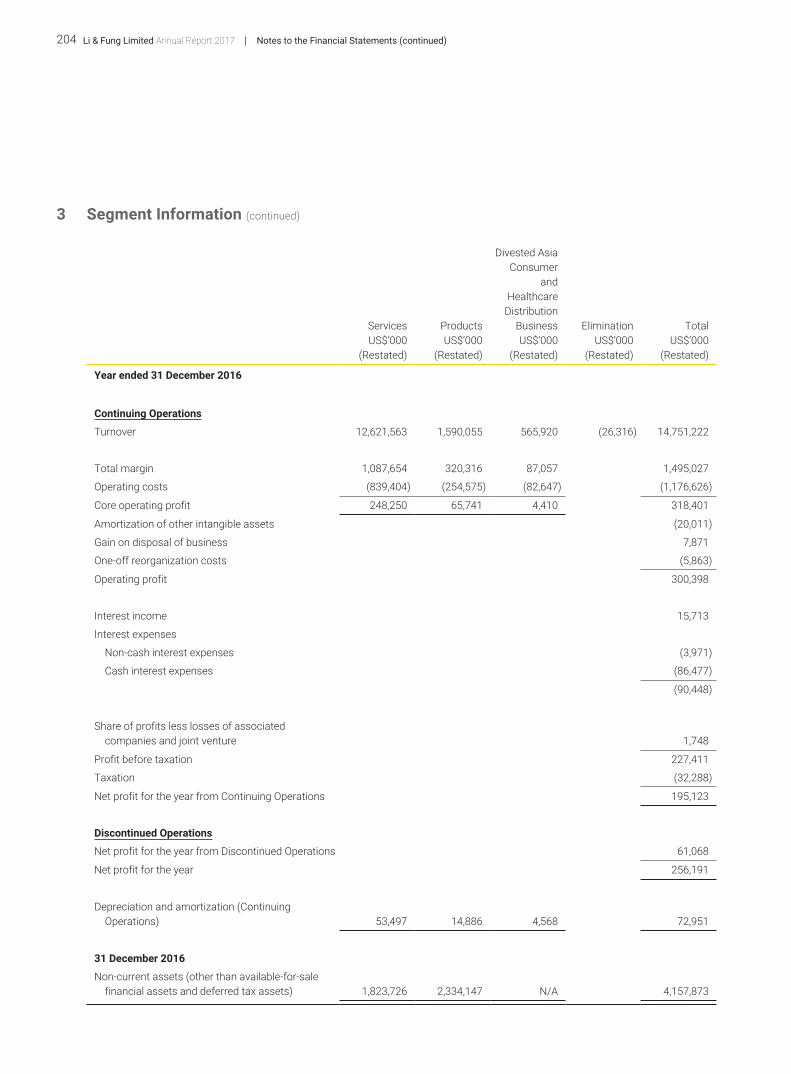
Li & Fung Limited Annual Report 2017204 Notes to the Financial Statements (continued)
3 Segment Information (continued)
Services Products
Divested Asia Consumer
and Healthcare
Distribution Business Elimination Total
US$’000 US$’000 US$’000 US$’000 US$’000(Restated) (Restated) (Restated) (Restated) (Restated)
Year ended 31 December 2016
Continuing Operations
Turnover 12,621,563 1,590,055 565,920 (26,316) 14,751,222
Total margin 1,087,654 320,316 87,057 1,495,027
Operating costs (839,404) (254,575) (82,647) (1,176,626)
Core operating profit 248,250 65,741 4,410 318,401
Amortization of other intangible assets (20,011)
Gain on disposal of business 7,871
One-off reorganization costs (5,863)
Operating profit 300,398
Interest income 15,713
Interest expenses
Non-cash interest expenses (3,971)
Cash interest expenses (86,477)
(90,448)
Share of profits less losses of associated companies and joint venture 1,748
Profit before taxation 227,411
Taxation (32,288)
Net profit for the year from Continuing Operations 195,123
Discontinued Operations
Net profit for the year from Discontinued Operations 61,068
Net profit for the year 256,191
Depreciation and amortization (Continuing Operations) 53,497 14,886 4,568 72,951
31 December 2016
Non-current assets (other than available-for-sale financial assets and deferred tax assets) 1,823,726 2,334,147 N/A 4,157,873
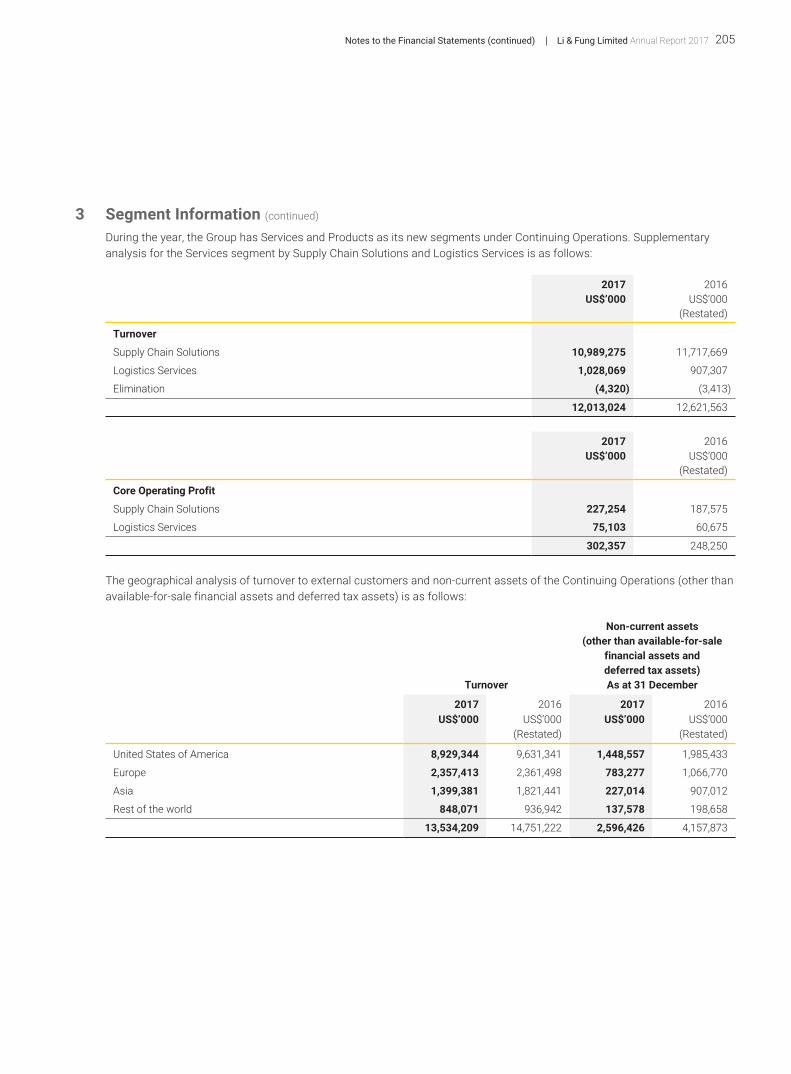
205Li & Fung Limited Annual Report 2017Notes to the Financial Statements (continued)
3 Segment Information (continued)
During the year, the Group has Services and Products as its new segments under Continuing Operations. Supplementary analysis for the Services segment by Supply Chain Solutions and Logistics Services is as follows:
2017 2016US$’000 US$’000
(Restated)
Turnover
Supply Chain Solutions 10,989,275 11,717,669
Logistics Services 1,028,069 907,307
Elimination (4,320) (3,413)
12,013,024 12,621,563
2017 2016US$’000 US$’000
(Restated)
Core Operating Profit
Supply Chain Solutions 227,254 187,575
Logistics Services 75,103 60,675
302,357 248,250
The geographical analysis of turnover to external customers and non-current assets of the Continuing Operations (other than available-for-sale financial assets and deferred tax assets) is as follows:
Turnover
Non-current assets(other than available-for-sale
financial assets and deferred tax assets)As at 31 December
2017 2016 2017 2016US$’000 US$’000 US$’000 US$’000
(Restated) (Restated)
United States of America 8,929,344 9,631,341 1,448,557 1,985,433
Europe 2,357,413 2,361,498 783,277 1,066,770
Asia 1,399,381 1,821,441 227,014 907,012
Rest of the world 848,071 936,942 137,578 198,658
13,534,209 14,751,222 2,596,426 4,157,873

Li & Fung Limited Annual Report 2017206 Notes to the Financial Statements (continued)
3 Segment Information (continued)
Turnover to external customers consists of sales of goods of Supply Chain Solutions business, logistics services income, sales of goods of Products segment, and sales of goods of the divested Asia consumer and healthcare distribution business as follows:
2017 2016US$’000 US$’000
(Restated)
Sales of goods of Supply Chain Solutions business 10,977,574 11,699,917
Logistics services income 1,014,958 904,498
Sales of goods of Products segment 1,541,677 1,580,887
Sales of goods of divested Asia consumer and healthcare distribution business – 565,920
13,534,209 14,751,222
Turnover to external customers consists of sales of soft goods, hard goods and logistics services income as follows:
2017 2016US$’000 US$’000
(Restated)
Sales of soft goods 9,298,376 9,841,522
Sales of hard goods 3,220,875 4,005,202
Logistics services income 1,014,958 904,498
13,534,209 14,751,222
For the year ended 31 December 2017, approximately 15% (2016 (restated): 15%) of the total turnover of the Group’s Continuing Operations is derived from a single external customer, of which 15% (2016 (restated): 15%) and less than 1% (2016 (restated): less than 1%) are attributable to Services and Products segments respectively.
Segment information for the Discontinued Operations is set out in Note 31(b).
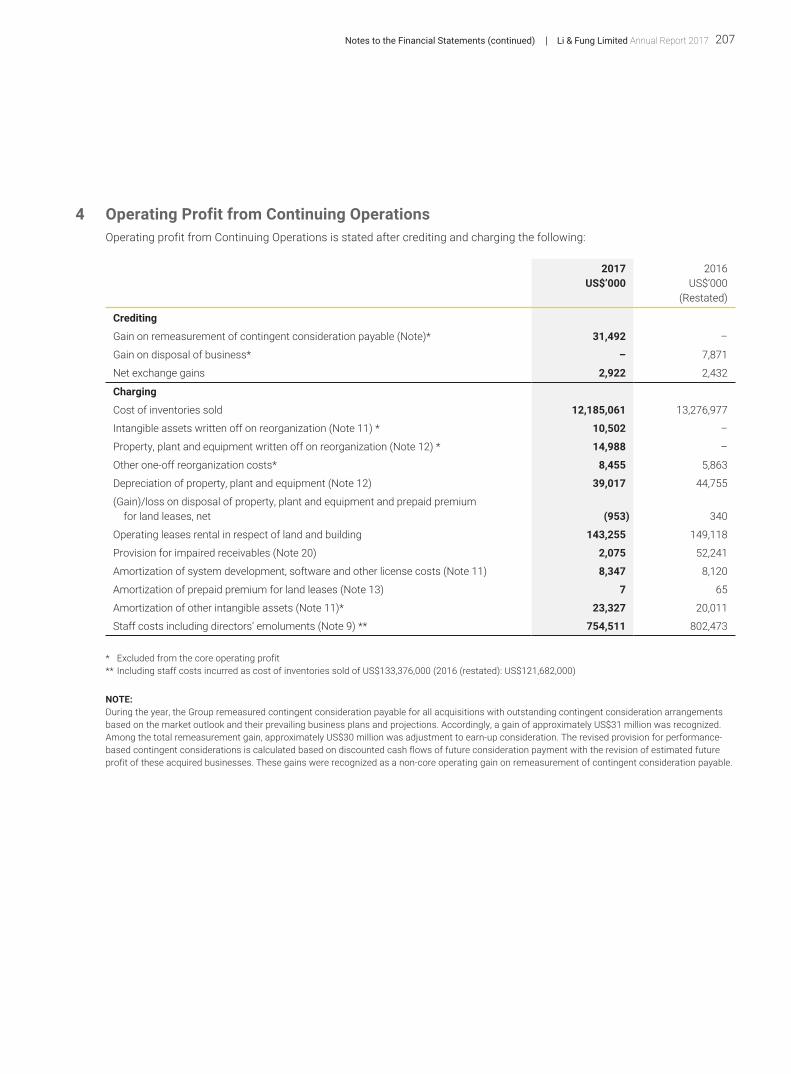
207Li & Fung Limited Annual Report 2017Notes to the Financial Statements (continued)
4 Operating Profit from Continuing OperationsOperating profit from Continuing Operations is stated after crediting and charging the following:
2017 2016US$’000 US$’000
(Restated)
Crediting
Gain on remeasurement of contingent consideration payable (Note)* 31,492 –
Gain on disposal of business* – 7,871
Net exchange gains 2,922 2,432
Charging
Cost of inventories sold 12,185,061 13,276,977
Intangible assets written off on reorganization (Note 11) * 10,502 –
Property, plant and equipment written off on reorganization (Note 12) * 14,988 –
Other one-off reorganization costs* 8,455 5,863
Depreciation of property, plant and equipment (Note 12) 39,017 44,755
(Gain)/loss on disposal of property, plant and equipment and prepaid premium for land leases, net (953) 340
Operating leases rental in respect of land and building 143,255 149,118
Provision for impaired receivables (Note 20) 2,075 52,241
Amortization of system development, software and other license costs (Note 11) 8,347 8,120
Amortization of prepaid premium for land leases (Note 13) 7 65
Amortization of other intangible assets (Note 11)* 23,327 20,011
Staff costs including directors’ emoluments (Note 9) ** 754,511 802,473
* Excluded from the core operating profit** Including staff costs incurred as cost of inventories sold of US$133,376,000 (2016 (restated): US$121,682,000)
NOTE:During the year, the Group remeasured contingent consideration payable for all acquisitions with outstanding contingent consideration arrangements based on the market outlook and their prevailing business plans and projections. Accordingly, a gain of approximately US$31 million was recognized. Among the total remeasurement gain, approximately US$30 million was adjustment to earn-up consideration. The revised provision for performance-based contingent considerations is calculated based on discounted cash flows of future consideration payment with the revision of estimated future profit of these acquired businesses. These gains were recognized as a non-core operating gain on remeasurement of contingent consideration payable.

Li & Fung Limited Annual Report 2017208 Notes to the Financial Statements (continued)
4 Operating Profit from Continuing Operations (continued)
The remuneration to the auditors for audit and non-audit services is as follows:
2017 2016US$’000 US$’000
(Restated)
Audit services 2,778 3,090
Non-audit services
– due diligence reviews on acquisitions – 57
– taxation services 638 2,079
– others 1,685 537
Total remuneration to auditors charged to consolidated profit and loss account 5,101 5,763
NOTE:Of the above audit and non-audit services fees, US$2,727,000 (2016 (restated): US$3,081,000) and US$2,323,000 (2016 (restated): US$2,673,000), respectively are payable to the Company’s auditor.
Remuneration to the auditors for audit and non-audit services for the Discontinued Operations is set out in Note 31(c).
5 Interest Expenses from Continuing Operations
2017 2016US$’000 US$’000
(Restated)
Non-cash interest expenses on purchase consideration payable for acquisitions and long-term notes
3,284 3,971
Cash interest on bank loans, overdrafts and long-term notes 66,477 86,477
69,761 90,448

209Li & Fung Limited Annual Report 2017Notes to the Financial Statements (continued)
6 Taxation from Continuing OperationsHong Kong profits tax has been provided for at the rate of 16.5% (2016: 16.5%) on the estimated assessable profits for the year. Taxation on overseas profits has been calculated on the estimated assessable profits for the year at the rates of taxation prevailing in the countries in which the Group operates.
The amount of taxation charged to the consolidated profit and loss account represents:
2017 2016US$’000 US$’000
(Restated)
Current taxation
– Hong Kong profits tax 4,046 4,814
– Overseas taxation 35,411 37,948
Under/(over) provision in prior years 3,049 (1,433)
Deferred taxation (Note 29) (1,676) (9,041)
40,830 32,288
The taxation on the Group’s profit before taxation differs from the theoretical amount that would arise using the taxation rate of the home country of the Company as follows:
2017 2016% %
(Restated)
Calculated at a taxation rate of 16.5 16.5
Effect of different taxation rates in other countries (10.4) (10.4)
Expenses net of income not subject to taxation 6.6 7.8
Under/(over) provision in prior years 1.2 (0.6)
Utilization of previously unrecognized tax losses (0.6) (0.4)
Unrecognized tax losses 1.6 1.3
Effective tax rate 14.9 14.2
7 Earnings/(Losses) per ShareThe calculation of basic earnings/(losses) per share is based on the Group’s profit attributable to Shareholders arising from the Continuing Operations of US$170,418,000 (2016 (restated): US$160,009,000) and the Group’s losses attributable to Shareholders arising from the Discontinued Operations of US$544,991,000 (2016 (restated): profit of US$61,068,000) and on the weighted average number of 8,364,801,000 (2016: 8,354,893,000) shares in issue during the year.
The diluted earnings/(losses) per share was calculated by adjusting the weighted average number of 8,364,801,000 (2016: 8,354,893,000) ordinary shares in issue by 76,342,000 (2016: 56,573,000) to assume conversion of all dilutive potential ordinary shares granted under the Company’s Share Option and Share Award Scheme. For the determination of dilutive potential ordinary share granted under the Company, a calculation is done to determine the number of shares that could have been acquired at fair value (determined as the average annual market share price of the Company’s shares) based on the monetary value of the subscription rights attached to outstanding Share Options. The number of shares calculated as above is compared with the number of shares that would have been issued assuming the exercise of the Share Options and vesting of Award Shares.

Li & Fung Limited Annual Report 2017210 Notes to the Financial Statements (continued)
8 Dividends
2017 2016US$’000 US$’000
Interim, paid, of HK$0.11 (equivalent to US$0.014) (2016: HK$0.11 (equivalent to US$0.014)) per ordinary share
120,064 119,291
Final, proposed, of HK$0.02 (equivalent to US$0.003) (2016: HK$0.12 (equivalent to US$0.015)) per ordinary share (Note (a)) 21,830 130,136
Special, declared, of HK$0.476 (equivalent to US$0.0614) (2016: Nil) (Note (b)) 519,549 –
661,443 249,427
NOTES:(a) At a meeting held on 22 March 2018, the Directors proposed a final dividend of HK$0.02 (equivalent to US$0.003) per share. The proposed dividend
is not reflected as a dividend payable in these financial statements, but will be reflected as appropriation of retained earnings for the year ending 31 December 2017.
(b) The Board of Directors declared that a special dividend of 47.6 HK cents per share absorbing approximately US$520 million, payable out of part of the proceeds from the strategic divestment of Product Verticals business, be distributed to the Shareholders subject to Closing (as defined in the Circular).
9 Staff Costs including Directors’ Emoluments from Continuing Operations
2017 2016US$’000 US$’000
(Restated)
Salaries and bonuses 653,193 693,582
Staff benefits 34,621 34,831
Pension costs of defined contribution plans (Note (a)) 51,484 54,472
Employee share option and share award expenses 13,020 17,064
Pension costs of defined benefit plans (Note 28(ii)) 1,832 2,161
Long-service payments 361 363
754,511 802,473
NOTES:(a) Forfeited contributions totalling US$62,000 (2016 (restated): US$457,000) were utilized during the year and no remaining amount was available at
the year-end to reduce future contributions.
(b) Staff costs of the Continuing Operations US$483,548,000 (2016 (restated): US$530,474,000), US$137,587,000 (2016 (restated): US$150,317,000) and US$133,376,000 (2016 (restated): US$121,682,000) has been expensed in merchandising and administrative expenses, selling and distribution expenses and cost of sales respectively.

211Li & Fung Limited Annual Report 2017Notes to the Financial Statements (continued)
10 Directors’ and Senior Management’s Emoluments
(a) Five Highest Paid IndividualsThe five individuals whose emoluments were the highest in the Group for the year include three (2016: three) Directors whose emoluments are reflected in the analysis shown in Note 40. The emoluments payable to the remaining two individuals (2016: two individuals) during the year are as follows:
2017 2016US$’000 US$’000
Basic salaries, housing allowances, share awards, other allowances and benefits-in-kind
2,454 1,896
Discretionary bonuses 1,162 900
Contributions to pension scheme 10 4
3,626 2,800
Number of individuals
Emolument bands 2017 2016
US$1,346,001 – US$1,410,000 (HK$10,500,001 – HK$11,000,000) – 1
US$1,410,001 – US$1,474,000 (HK$11,000,001 – HK$11,500,000) – 1
US$1,602,001 – US$1,667,000 (HK$12,500,001 – HK$13,000,000) 1 –
US$1,667,001 – US$1,731,000 (HK$13,000,001 – HK$13,500,000) – –
US$1,922,001 – US$1,986,000 (HK$15,000,001 – HK$15,500,000) 1 –
There is no amount paid or payable to the directors as inducement to join the Group and compensation for loss of office as directors.
(b) Senior Management’s EmolumentsThe emoluments payable to the senior management during the year fell within the following bands:
Number of individuals
Emolument bands 2017 2016
Below US$1,000,000 6 3
US$1,000,001 – US$1,500,000 8 7
US$1,500,001 – US$2,000,000 1 –

Li & Fung Limited Annual Report 2017212 Notes to the Financial Statements (continued)
11 Intangible Assets
Other Intangible Assets
Goodwill
SystemDevelopment,Software and
Other LicenseCosts
BuyingAgency
AgreementsCustomer
Relationships
Patents,Trademarks
andBrandnames Others Total
US$’000 US$’000 US$’000 US$’000 US$’000 US$’000 US$’000
At 1 January 2017
Cost 3,557,240 73,949 67,867 381,183 45,305 12,063 4,137,607
Accumulated amortization – (51,060) (29,181) (143,532) (14,462) (2,399) (240,634)
Net Book Amount 3,557,240 22,889 38,686 237,651 30,843 9,664 3,896,973
Year ended 31 December 2017
Opening net book amount 3,557,240 22,889 38,686 237,651 30,843 9,664 3,896,973
Continuing Operations
Exchange differences 43,827 690 – 1,479 329 – 46,325
Adjustments to provisional values for acquisition (Note(i)) 437 – – (890) – – (453)
Additions – 24,097 – – – – 24,097
Disposals – (554) – – – – (554)
Write off – (10,502) – – – – (10,502)
Amortization (Note 4) – (8,347) (5,780) (13,250) (3,522) (775) (31,674)
Discontinued Operations
Exchange differences 18,288 208 – 1,793 1,095 – 21,384
Acquisition of business 28,576 – – 5,800 – – 34,376
Additions – 5,269 – – – – 5,269
Amortization (Note 31) – (2,633) – (12,229) (1,422) (8) (16,292)
Classified as assets held for sale (1,480,290) (7,079) – (120,119) (14,365) (85) (1,621,938)
Closing Net Book Amount 2,168,078 24,038 32,906 100,235 12,958 8,796 2,347,011
At 31 December 2017
Cost 2,168,078 49,629 67,867 196,363 25,528 11,940 2,519,405
Accumulated amortization – (25,591) (34,961) (96,128) (12,570) (3,144) (172,394)
Net Book Amount 2,168,078 24,038 32,906 100,235 12,958 8,796 2,347,011
NOTE:(i) These were adjustments to net asset values related to acquisition of business in 2016, which were previously determined on a provisional basis.
During the measurement period of twelve months following the transaction, the Group recognized adjustments to the provisional amounts at the acquisition date. The corresponding adjustments to goodwill and other intangible assets stated above were adjusting other assets/liabilities of the same amount for the year ended 31 December 2017.
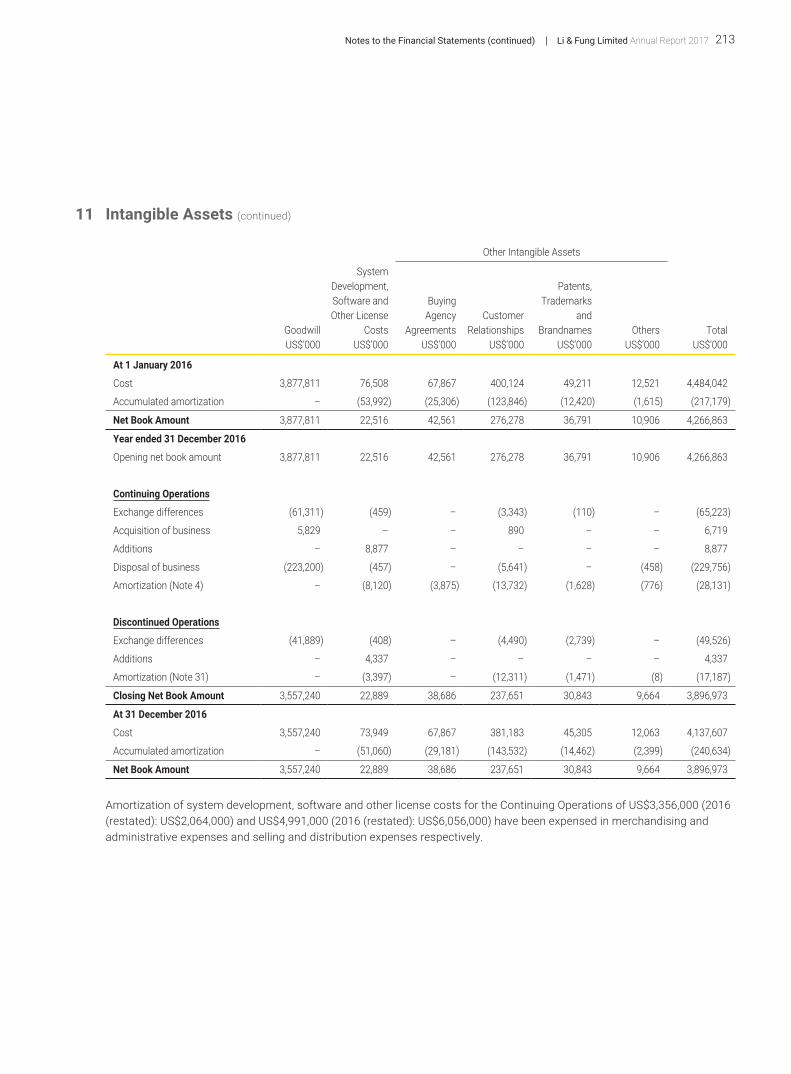
213Li & Fung Limited Annual Report 2017Notes to the Financial Statements (continued)
11 Intangible Assets (continued)
Other Intangible Assets
Goodwill
SystemDevelopment,Software andOther License
Costs
BuyingAgency
AgreementsCustomer
Relationships
Patents,Trademarks
andBrandnames Others Total
US$’000 US$’000 US$’000 US$’000 US$’000 US$’000 US$’000
At 1 January 2016
Cost 3,877,811 76,508 67,867 400,124 49,211 12,521 4,484,042
Accumulated amortization – (53,992) (25,306) (123,846) (12,420) (1,615) (217,179)
Net Book Amount 3,877,811 22,516 42,561 276,278 36,791 10,906 4,266,863
Year ended 31 December 2016
Opening net book amount 3,877,811 22,516 42,561 276,278 36,791 10,906 4,266,863
Continuing Operations
Exchange differences (61,311) (459) – (3,343) (110) – (65,223)
Acquisition of business 5,829 – – 890 – – 6,719
Additions – 8,877 – – – – 8,877
Disposal of business (223,200) (457) – (5,641) – (458) (229,756)
Amortization (Note 4) – (8,120) (3,875) (13,732) (1,628) (776) (28,131)
Discontinued Operations
Exchange differences (41,889) (408) – (4,490) (2,739) – (49,526)
Additions – 4,337 – – – – 4,337
Amortization (Note 31) – (3,397) – (12,311) (1,471) (8) (17,187)
Closing Net Book Amount 3,557,240 22,889 38,686 237,651 30,843 9,664 3,896,973
At 31 December 2016
Cost 3,557,240 73,949 67,867 381,183 45,305 12,063 4,137,607
Accumulated amortization – (51,060) (29,181) (143,532) (14,462) (2,399) (240,634)
Net Book Amount 3,557,240 22,889 38,686 237,651 30,843 9,664 3,896,973
Amortization of system development, software and other license costs for the Continuing Operations of US$3,356,000 (2016 (restated): US$2,064,000) and US$4,991,000 (2016 (restated): US$6,056,000) have been expensed in merchandising and administrative expenses and selling and distribution expenses respectively.

Li & Fung Limited Annual Report 2017214 Notes to the Financial Statements (continued)
11 Intangible Assets (continued)
Impairment Test for GoodwillGoodwill is allocated to the Group’s cash-generating units (“CGUs”) identified according to operating segment.
A summary of goodwill by reporting segment is presented below:
As at 31 December
2017 2016US$’000 US$’000
(Restated)
Services 1,468,517 1,500,080
Products 699,561 2,057,160
2,168,078 3,557,240
In accordance with HKAS 36 “Impairment of Assets”, the Group completed its annual impairment test for goodwill allocated to the Group’s various CGUs by comparing their recoverable amounts to their carrying amounts as at the balance sheet date. Goodwill impairment reviews have been performed at the lowest level of CGU which generates cash flow independently. The recoverable amount of a CGU is determined based on value-in-use calculations. These calculations use cash flow projections based on a one-year financial budget approved by management, extrapolated perpetually with an estimated general long-term continuous annual growth of not more than 5%. The discount rate used of approximately 11% is pre-tax and reflects specific risks related to the relevant segments. The budgeted gross margin and net profit margin are determined by management for each individual CGU based on past performance and its expectations for market development. Management believes that any reasonably foreseeable changes in any of the above key assumptions would not cause the carrying amount of goodwill to exceed the recoverable amount.

215Li & Fung Limited Annual Report 2017Notes to the Financial Statements (continued)
12 Property, Plant and Equipment
Land andBuildings
LeaseholdImprovements
Furniture,Fixtures and
EquipmentPlant and
Machinery
MotorVehicles
andCompany
Boat TotalUS$’000 US$’000 US$’000 US$’000 US$’000 US$’000
At 1 January 2017
Cost 7,613 192,025 187,292 138,287 4,917 530,134
Accumulated depreciation (956) (139,755) (119,446) (47,310) (1,117) (308,584)
Net Book Amount 6,657 52,270 67,846 90,977 3,800 221,550
Year ended 31 December 2017
Opening net book amount 6,657 52,270 67,846 90,977 3,800 221,550
Continuing Operations
Exchange differences 352 283 3,830 4,256 165 8,886
Additions 82 22,584 32,427 16,403 193 71,689
Disposals (3,774) (696) (381) (276) (155) (5,282)
Write off – – (14,988) – – (14,988)
Depreciation (Note 4) (130) (10,799) (13,197) (13,679) (1,212) (39,017)
Discontinued Operations
Exchange differences (316) 400 100 81 4 269
Acquisition of business – 22 854 – – 876
Additions – 3,569 4,105 4,959 39 12,672
Disposals – (4) (418) (59) – (481)
Depreciation (Note 31) (119) (2,865) (3,767) (2,465) (47) (9,263)
Classified as assets held for sale (1,554) (9,715) (9,961) (17,390) (70) (38,690)
Closing Net Book Amount 1,198 55,049 66,450 82,807 2,717 208,221
At 31 December 2017
Cost 1,214 154,940 102,129 104,980 4,394 367,657
Accumulated depreciation (16) (99,891) (35,679) (22,173) (1,677) (159,436)
Net Book Amount 1,198 55,049 66,450 82,807 2,717 208,221

Li & Fung Limited Annual Report 2017216 Notes to the Financial Statements (continued)
12 Property, Plant and Equipment (continued)
Land andBuildings
LeaseholdImprovements
Furniture,Fixtures and
EquipmentPlant and
Machinery
MotorVehicles
andCompany
Boat TotalUS$’000 US$’000 US$’000 US$’000 US$’000 US$’000
At 1 January 2016
Cost 14,801 197,765 186,443 132,573 7,508 539,090
Accumulated depreciation (1,134) (132,204) (118,421) (44,402) (1,303) (297,464)
Net Book Amount 13,667 65,561 68,022 88,171 6,205 241,626
Year ended 31 December 2016
Opening net book amount 13,667 65,561 68,022 88,171 6,205 241,626
Continuing Operations
Exchange differences (1,166) (3,247) (1,897) (4,671) (32) (11,013)
Acquisition of business – 322 75 – 1 398
Additions 189 8,196 22,502 38,276 515 69,678
Disposal of business (2,674) (3,436) (2,011) (17,911) (1,223) (27,255)
Disposals (3,002) (1,033) (229) (794) (161) (5,219)
Depreciation (Note 4) (266) (14,746) (20,266) (8,029) (1,448) (44,755)
Discontinued Operations
Exchange differences 55 (70) (296) (35) (1) (347)
Additions – 4,702 5,014 2,326 – 12,042
Disposal (18) (135) (252) (44) – (449)
Depreciation (Note 31) (128) (3,844) (2,816) (6,312) (56) (13,156)
Closing Net Book Amount 6,657 52,270 67,846 90,977 3,800 221,550
At 31 December 2016
Cost 7,613 192,025 187,292 138,287 4,917 530,134
Accumulated depreciation (956) (139,755) (119,446) (47,310) (1,117) (308,584)
Net Book Amount 6,657 52,270 67,846 90,977 3,800 221,550
Depreciation for the Continuing Operations of US$17,555,000 (2016 (restated): US$21,032,000), US$21,436,000 (2016 (restated): US$19,635,000) and US$26,000 (2016 (restated): US$4,088,000) has been expensed in merchandising and administrative expenses, selling and distribution expenses and cost of sales respectively.
At 31 December 2017, the Group had no land and buildings pledged as security for bank borrowings (31 December 2016: US$Nil).

217Li & Fung Limited Annual Report 2017Notes to the Financial Statements (continued)
13 Prepaid Premium for Land LeasesThe Group’s interests in leasehold land and land use rights represent prepaid operating lease payments and their net book value is analyzed as follows:
2017 2016US$’000 US$’000
Beginning of the year 127 1,942
Disposal of business – (1,853)
Disposals (54) –
Amortization (Note 4) (7) (65)
Exchange differences 1 103
End of the year 67 127
Amortization of US$7,000 (2016:US$65,000) has been expensed in selling and distribution expenses.
14 Associated Companies
2017 2016US$’000 US$’000
Beginning of the year 11,005 10,070
Share of profits less losses of associated companies 2,173 1,921
Dividend received (821) (835)
Exchange differences 36 (151)
Total interests in associated companies 12,393 11,005
Details of principal associated companies are set out in Note 43.
15 Joint Venture
2017 2016US$’000 US$’000
Beginning of the year 760 313
Capital injection 529 612
Share of loss of the joint venture (275) (173)
Exchange differences (18) 8
Total interest in the joint venture 996 760
Details of the joint venture is set out in Note 43.
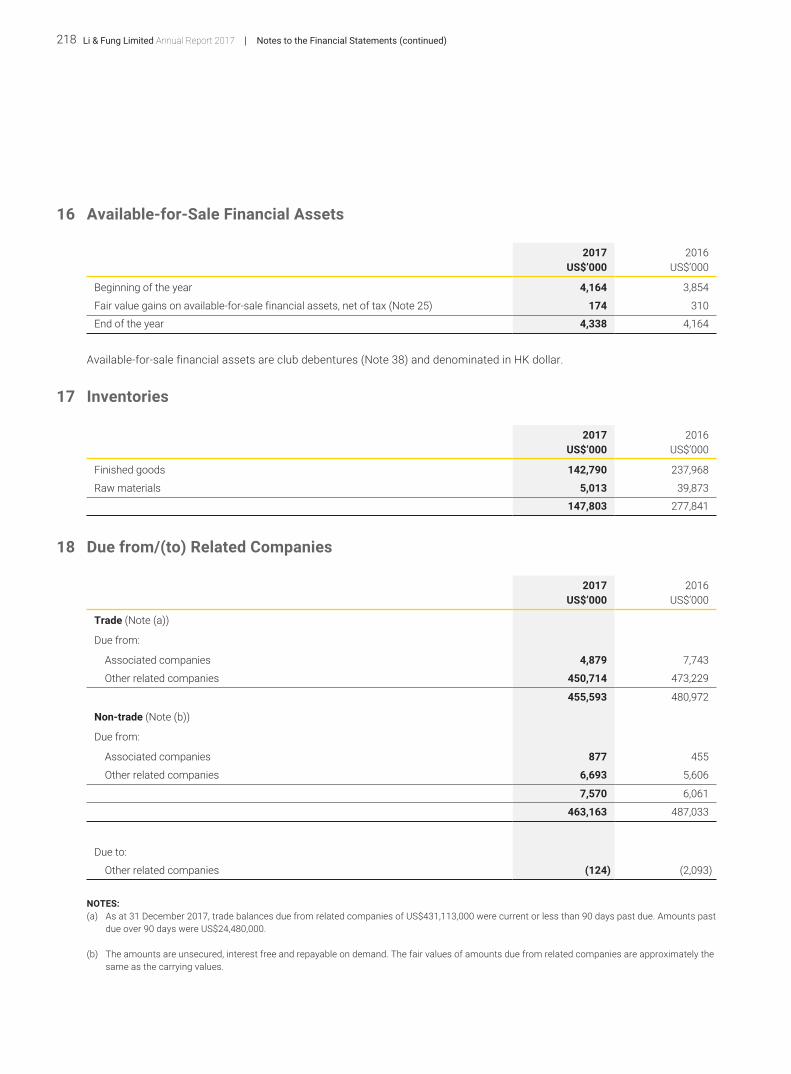
Li & Fung Limited Annual Report 2017218 Notes to the Financial Statements (continued)
16 Available-for-Sale Financial Assets
2017 2016US$’000 US$’000
Beginning of the year 4,164 3,854
Fair value gains on available-for-sale financial assets, net of tax (Note 25) 174 310
End of the year 4,338 4,164
Available-for-sale financial assets are club debentures (Note 38) and denominated in HK dollar.
17 Inventories
2017 2016US$’000 US$’000
Finished goods 142,790 237,968
Raw materials 5,013 39,873
147,803 277,841
18 Due from/(to) Related Companies
2017 2016US$’000 US$’000
Trade (Note (a))
Due from:
Associated companies 4,879 7,743
Other related companies 450,714 473,229
455,593 480,972
Non-trade (Note (b))
Due from:
Associated companies 877 455
Other related companies 6,693 5,606
7,570 6,061
463,163 487,033
Due to:
Other related companies (124) (2,093)
NOTES:(a) As at 31 December 2017, trade balances due from related companies of US$431,113,000 were current or less than 90 days past due. Amounts past
due over 90 days were US$24,480,000.
(b) The amounts are unsecured, interest free and repayable on demand. The fair values of amounts due from related companies are approximately the same as the carrying values.

219Li & Fung Limited Annual Report 2017Notes to the Financial Statements (continued)
19 Derivative Financial Instruments
2017 2016US$’000 US$’000
Forward foreign exchange contracts
– (liabilities)/assets (Note 38) (5,355) 10,697
Gain in equity of US$226,000 (2016: US$7,185,000) on forward foreign exchange contracts as of 31 December 2017 will be released to the consolidated profit and loss account at various dates between one month to one year from the balance sheet date. (Note 25).
For the years ended 31 December 2017 and 2016, no material amounts were recognized in the consolidated profit and loss account arising from ineffective cash flow hedges.
20 Trade and Other Receivables
As at31 December
2017
As at31 December
2016
As at1 January
2016US$’000 US$’000 US$’000
(Restated) (Restated)
Trade and bills receivable – net 1,148,560 1,547,208 1,689,413
Other receivables, prepayments and deposits 177,990 245,962 294,229
1,326,550 1,793,170 1,983,642
Less: non-current portion other receivables, prepayments and deposits (27,738) (27,458) (26,217)
1,298,812 1,765,712 1,957,425
The fair values of the Group’s trade and other receivables were approximately the same as their carrying values as at 31 December 2017.
A significant portion of the Group’s business is on sight letter of credit, usance letter of credit up to a tenor of 120 days, documents against payment or customers’ letter of credit to suppliers. The balance of the business is on open account terms which is often covered by customers’ standby letters of credit, bank guarantees, credit insurance or under a back-to-back payment arrangement with suppliers. The ageing of trade and bills receivable based on invoice date is as follows:
As at31 December
2017
As at31 December
2016
As at1 January
2016US$’000 US$’000 US$’000
Up to 90 days 1,058,741 1,442,127 1,595,433
91 to 180 days 72,515 87,280 83,376
181 to 360 days 11,115 15,154 7,900
Over 360 days 6,189 2,647 2,704
1,148,560 1,547,208 1,689,413
There is no concentration of credit risk with respect to trade and bills receivable, as the Group has a large number of customers internationally dispersed.

Li & Fung Limited Annual Report 2017220 Notes to the Financial Statements (continued)
20 Trade and Other Receivables (continued)
As of 31 December 2017, trade receivables of US$1,130,958,000 (31 December 2016: US$1,529,486,000 and 1 January 2016: US$1,673,045,000) that were current or less than 90 days past due were not considered impaired. Trade receivables of US$17,602,000 (31 December 2016: US$17,722,000 and 1 January 2016: US$16,368,000) were past due over 90 days but not considered to be impaired. These relate to a number of independent customers for whom there is no recent history of default. The past due ageing of these trade receivables is as follows:
As at31 December
2017
As at31 December
2016
As at1 January
2016US$’000 US$’000 US$’000
91 to 180 days 6,998 3,651 7,596
Over 180 days 10,604 14,071 8,772
17,602 17,722 16,368
As of 31 December 2017, outstanding trade receivables of US$11,765,000 (31 December 2016: US$56,599,000 and 1 January 2016: US$35,252,000) and other receivables of US$3,315,000 (31 December 2016: US$17,452,000 and 1 January 2016: US$11,316,000) were considered impaired and were fully provided for.
Movements in the Group’s provision for impairment of trade and other receivables are as follows:
2017 2016US$’000 US$’000
At 1 January 74,051 46,568
Continuing Operations
Provision for receivable impairment (Note 4) 3,416 53,661
Provision written off against receivables (60,068) (21,771)
Unused amounts reversed (Note 4) (1,341) (1,420)
Disposal of business – (3,400)
Exchange difference 186 109
Discontinued Operations
Provision for receivable impairment (Note 31) 6,510 1,302
Provision written off against receivables (952) (944)
Unused amounts reversed (Note 31) (42) (54)
Classified as assets held for sale (6,680) –
At 31 December 15,080 74,051

221Li & Fung Limited Annual Report 2017Notes to the Financial Statements (continued)
20 Trade and Other Receivables (continued)
The creation and release of provision for impaired receivables have been included in “Selling and distribution expenses” in the consolidated profit and loss account (Note 4). Amounts charged to the allowance account are generally written off, when there is no expectation of recovering additional cash.
Save as disclosed as above, the other classes within trade and other receivables do not contain impaired assets.
The maximum exposure to credit risk at the reporting date is the fair value of each class of receivables mentioned above.
Certain subsidiaries of the Group transferred bills receivable balances amounting to US$1,724,000 (31 December 2016: US$22,773,000 and 1 January 2016: US$33,681,000) to banks in exchange for cash as at 31 December 2017. The transactions have been accounted for as collateralized bank advances.
The carrying amounts of the Group’s trade and other receivables are denominated in the following currencies:
As at31 December
2017
As at31 December
2016
As at1 January
2016US$’000 US$’000 US$’000
(Restated) (Restated)
US dollar 939,738 1,214,170 1,185,258
HK dollar 55,131 52,401 121,486
Euro 52,982 208,810 217,040
Pound sterling 28,618 82,235 75,001
Renminbi 92,507 85,802 143,031
Malaysia Ringgit 5,839 7,929 35,798
Thailand Baht 15,328 23,275 54,206
Others 108,669 91,090 125,605
1,298,812 1,765,712 1,957,425
The Group has recognized revenue related contract assets amounting to US$11,380,000 (31 December 2016 (restated): US$11,894,000 and 1 January 2016 (restated): US$11,194,000).
21 Cash and Cash Equivalents
2017 2016US$’000 US$’000
Cash and bank balances 348,940 985,039
The effective interest rate at the balance sheet date on bank balances was 0.8% (2016: 0.8%) per annum; these deposits have an average maturity period of 2 days (2016: 5 days).

Li & Fung Limited Annual Report 2017222 Notes to the Financial Statements (continued)
22 Trade and Other Payables
As at31 December
2017
As at31 December
2016
As at1 January
2016US$’000 US$’000 US$’000
(Restated) (Restated)
Trade and bills payable 1,733,661 2,083,875 2,464,785
Accrued charges and sundry payables 468,089 553,292 635,579
2,201,750 2,637,167 3,100,364
The fair values of the Group’s trade and other payables were approximately the same as their carrying values as at 31 December 2017.
At the balance sheet date, the ageing of trade and bills payable based on invoice date is as follows:
As at31 December
2017
As at31 December
2016
As at1 January
2016US$’000 US$’000 US$’000
Up to 90 days 1,645,884 2,003,134 2,365,315
91 to 180 days 66,176 60,532 80,822
181 to 360 days 9,552 10,814 2,885
Over 360 days 12,049 9,395 15,763
1,733,661 2,083,875 2,464,785
The Group has recognized revenue related contract liabilities amounting to US$96,188,000 (31 December 2016 (restated): US$80,849,000 and 1 January 2016 (restated): US$99,414,000).

223Li & Fung Limited Annual Report 2017Notes to the Financial Statements (continued)
23 Bank Borrowings
2017 2016US$’000 US$’000
Long-term bank loans
– Unsecured (Note 27) 1,558 –
Short-term bank loans
– Unsecured 22,970 29,180
Total bank borrowings 24,528 29,180
The fair values of the Group’s borrowings were approximately the same as their carrying values as at 31 December 2017.
The effective interest rates at the balance sheet date were as follows:
2017 2016
PHP IDR Others PHP IDR Others
Long-term bank loans – – 10.0% – – –
Short-term bank loans 3.1% 6.6% 2.2% 3.1% 8.0% 2.1%
The Group’s contractual repricing dates for borrowings are all three months or less.
The carrying amounts of the borrowings are denominated in the following currencies:
2017 2016US$’000 US$’000
Philippine Peso 11,469 14,581
Indonesian Rupiah 4,736 7,400
Others 8,323 7,199
24,528 29,180

Li & Fung Limited Annual Report 2017224 Notes to the Financial Statements (continued)
24 Share Capital, Share Options and Award Shares
No. of Shares Equivalent(in thousand) HK$’000 US$’000
Authorized
At 1 January 2016, ordinary shares of HK$0.0125 each 12,000,000 150,000 19,231
At 31 December 2016, ordinary shares of HK$0.0125 each 12,000,000 150,000 19,231
At 1 January 2017, ordinary shares of HK$0.0125 each 12,000,000 150,000 19,231
At 31 December 2017, ordinary shares of HK$0.0125 each 12,000,000 150,000 19,231
Issued and Fully Paid
At 1 January 2016, ordinary shares of HK$0.0125 each 8,415,447 105,193 13,487
At 31 December 2016, ordinary shares of HK$0.0125 each 8,415,447 105,193 13,487
At 1 January 2017, ordinary shares of HK$0.0125 each 8,415,447 105,193 13,487
Issue of new Shares of HK$0.0125 each pursuant to Share Award Scheme (Note) 54,509 681 87
At 31 December 2017, ordinary shares of HK$0.0125 each 8,469,956 105,874 13,574
NOTE:The closing market price per Share on the date of issue of new Shares on 13 July 2017 was HK$2.83 per Share.
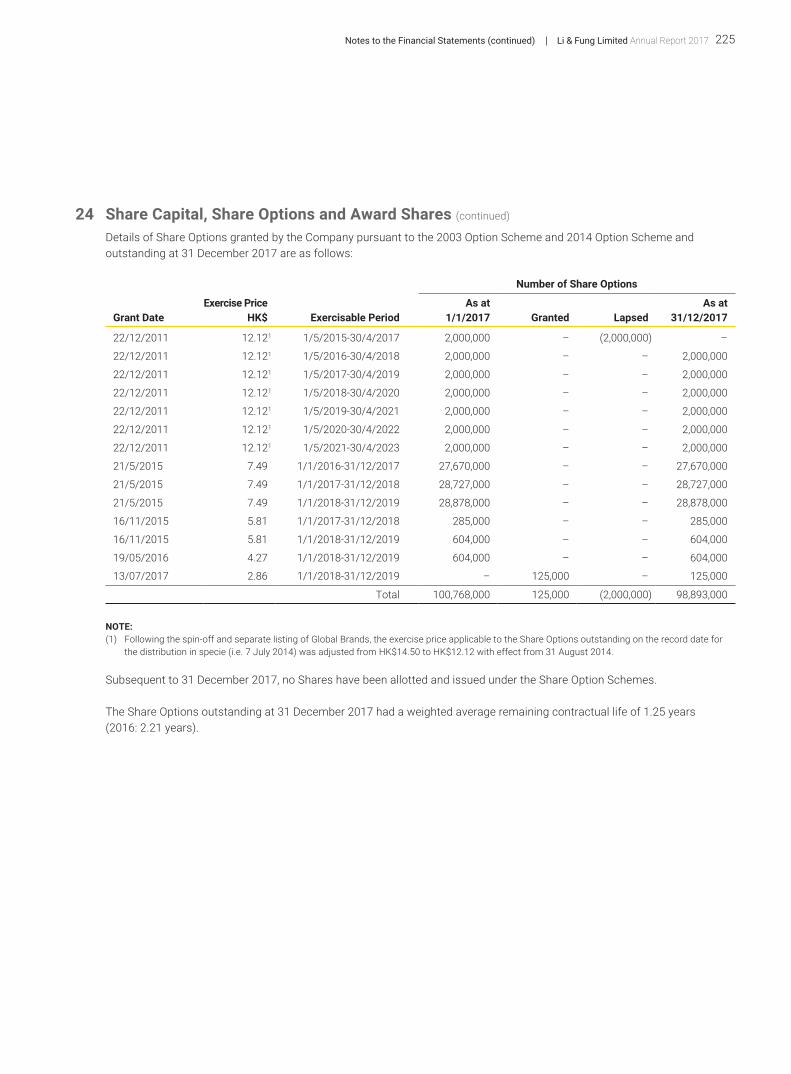
225Li & Fung Limited Annual Report 2017Notes to the Financial Statements (continued)
24 Share Capital, Share Options and Award Shares (continued)
Details of Share Options granted by the Company pursuant to the 2003 Option Scheme and 2014 Option Scheme and outstanding at 31 December 2017 are as follows:
Number of Share Options
Grant DateExercise Price
HK$ Exercisable PeriodAs at
1/1/2017 Granted LapsedAs at
31/12/2017
22/12/2011 12.121 1/5/2015-30/4/2017 2,000,000 – (2,000,000) –
22/12/2011 12.121 1/5/2016-30/4/2018 2,000,000 – – 2,000,000
22/12/2011 12.121 1/5/2017-30/4/2019 2,000,000 – – 2,000,000
22/12/2011 12.121 1/5/2018-30/4/2020 2,000,000 – – 2,000,000
22/12/2011 12.121 1/5/2019-30/4/2021 2,000,000 – – 2,000,000
22/12/2011 12.121 1/5/2020-30/4/2022 2,000,000 – – 2,000,000
22/12/2011 12.121 1/5/2021-30/4/2023 2,000,000 – – 2,000,000
21/5/2015 7.49 1/1/2016-31/12/2017 27,670,000 – – 27,670,000
21/5/2015 7.49 1/1/2017-31/12/2018 28,727,000 – – 28,727,000
21/5/2015 7.49 1/1/2018-31/12/2019 28,878,000 – – 28,878,000
16/11/2015 5.81 1/1/2017-31/12/2018 285,000 – – 285,000
16/11/2015 5.81 1/1/2018-31/12/2019 604,000 – – 604,000
19/05/2016 4.27 1/1/2018-31/12/2019 604,000 – – 604,000
13/07/2017 2.86 1/1/2018-31/12/2019 – 125,000 – 125,000
Total 100,768,000 125,000 (2,000,000) 98,893,000
NOTE:(1) Following the spin-off and separate listing of Global Brands, the exercise price applicable to the Share Options outstanding on the record date for
the distribution in specie (i.e. 7 July 2014) was adjusted from HK$14.50 to HK$12.12 with effect from 31 August 2014.
Subsequent to 31 December 2017, no Shares have been allotted and issued under the Share Option Schemes.
The Share Options outstanding at 31 December 2017 had a weighted average remaining contractual life of 1.25 years (2016: 2.21 years).

Li & Fung Limited Annual Report 2017226 Notes to the Financial Statements (continued)
24 Share Capital, Share Options and Award Shares (continued)
Employee share option expenses charged to the consolidated profit and loss account are determined using the Black-Scholes valuation model based on the following assumptions:
Date of grant 22/12/2011 21/5/2015 16/11/2015 19/05/2016 13/07/2017
Option value US$0.53–US$0.77 US$0.13–US$0.17 US$0.10–US$0.11 US$0.08 US$0.05
Share price at date of grant HK$14.14 HK$7.49 HK$5.33 HK$4.27 HK$2.83
Exercisable price HK$12.12 (Note (i))
HK$7.49 HK$5.81 HK$4.27 HK$2.86
Standard deviation 49% 33% 31% 31% 35%
Annual risk-free interest rate 0.15%-1.35% 0.08%-1.22% 0.08%-1.25% 0.53%-0.84% 0.53%-0.84%
Life of options 5–12 years 2–5 years 3–5 years 3–4 years 2–4 years
Dividend yield 2.39% 4.06% 4.06% 4.33% 6.36%
NOTE:(i) Following the spin-off and separate listing of Global Brands, the exercise price applicable to the Share Options outstanding on the record date for
the distribution in specie (i.e. 7 July 2014) was adjusted from HK$14.50 to HK$12.12 with effect from 31 August 2014.

227Li & Fung Limited Annual Report 2017Notes to the Financial Statements (continued)
24 Share Capital, Share Options and Award Shares (continued)
Details of Award Shares granted by the Company pursuant to the Share Award Scheme and outstanding at 31 December 2017 are as follows:
Grant Date
Fair Valueper Share
HK$ Vesting Date
Number of Award Shares
As at 1/1/2017 Granted Vested
Unvested/Forfeited
As at 31/12/2017
21/5/2015 7.49 31/12/2017 18,269,500 – (16,620,400) (1,649,100) –
21/5/2015 7.49 31/12/2018 12,634,400 – – (1,173,300) 11,461,100
21/5/2015 7.49 31/12/2019 6,350,900 – – (592,600) 5,758,300
16/11/2015 5.33 31/12/2017 312,700 – (263,800) (48,900) –
16/11/2015 5.33 31/12/2018 309,100 – – (48,300) 260,800
16/11/2015 5.33 31/12/2019 222,800 – – (33,800) 189,000
19/5/2016 4.27 31/12/2017 382,800 – (333,500) (49,300) –
19/5/2016 4.27 31/12/2018 370,600 – – (47,600) 323,000
19/5/2016 4.27 31/12/2019 362,600 – – (46,100) 316,500
14/11/2016 3.53 31/12/2017 67,600 – (63,800) (3,800) –
14/11/2016 3.53 31/12/2018 64,700 – – (3,600) 61,100
14/11/2016 3.53 31/12/2019 64,700 – – (3,600) 61,100
13/7/2017 2.83 31/12/2017 – 13,000 (12,200) (800) –
13/7/2017 2.83 31/12/2018 – 23,910,000 – (1,548,600) 22,361,400
13/7/2017 2.83 31/12/2019 – 22,977,000 – (1,402,600) 21,574,400
13/7/2017 2.83 31/12/2020 – 22,965,000 – (1,402,000) 21,563,000
Total 39,412,400 69,865,000 (17,293,700) (8,054,000) 83,929,700
The fair value of the Award Shares was calculated based on the market price of the Company’s Shares at the respective grant date.
During the year, a total of 69,865,000 Award Shares were awarded to eligible persons pursuant to the Share Award Scheme, and out of which 8,734,000 Award Shares were awarded to connected persons. A total of 10,702,818 Shares held by the trustee of the Share Award Scheme in two separate funds had been applied to satisfy 4,080,918 Award Shares to connected persons and 6,621,900 Award Shares to non-connected persons in accordance with the terms of the Share Award Scheme. The remaining 4,653,082 Award Shares were purchased from the open market to satisfy awards to connected persons and 54,509,100 new Shares were allotted and issued by the Company to satisfy awards to non-connected persons pursuant to the terms of the Share Award Scheme.

Li & Fung Limited Annual Report 2017228 Notes to the Financial Statements (continued)
25 Reserves
Treasury Shares
CapitalReserve
ContributionSurplus
EmployeeShare-based
CompensationReserve
RevaluationReserve
HedgingReserve
DefinedBenefit
ObligationReserve
ExchangeReserve Total
US$’000 US$’000 US$’000 US$’000 US$’000 US$’000 US$’000 US$’000 US$’000(Note (iii)) (Note (i)) (Note (ii))
Balance at 1 January 2017, as previously reported (11,653) 2,785 710,000 65,749 3,155 7,185 (14,120) (331,651) 431,450
Impact of adoption of HKFRS 15 – – – – – – – (3,073) (3,073)
Balance at 1 January 2017, as restated (11,653) 2,785 710,000 65,749 3,155 7,185 (14,120) (334,724) 428,377
Other Comprehensive Income/(Expense)
Currency translation differences – – – – – – – 82,167 82,167
Net fair value gains on available-for-sale financial assets, net of tax (Note 16) – – – – 174 – – – 174
Net fair value losses on cash flow hedges, net of tax – – – – – (6,959) – – (6,959)
Remeasurement of post-employment benefit obligations recognized in reserve, net of tax – – – – – – 6 – 6
Transactions with Owners in their Capacity as Owners
Purchase of shares for Share Award Scheme (1,706) – – – – – – – (1,706)
Issuance of shares for Share Award Scheme (87) – – – – – – – (87)
Employee Share Option and Share Award Scheme:
– value of employee services – – – 16,735 – – – – 16,735
– vesting of shares for Share Award Scheme 2,450 – – (16,441) – – – – (13,991)
Transfer to capital reserve – 4,861 – – – – – – 4,861
Balance at 31 December 2017 (10,996) 7,646 710,000 66,043 3,329 226 (14,114) (252,557) 509,577

229Li & Fung Limited Annual Report 2017Notes to the Financial Statements (continued)
25 Reserves (continued)
Treasury Shares
Capital Reserve
Contribution Surplus
Employee Share-based
Compensation Reserve
Revaluation Reserve
Hedging Reserve
Defined Benefit
Obligation Reserve
Exchange Reserve Total
US$’000 US$’000 US$’000 US$’000 US$’000 US$’000 US$’000 US$’000 US$’000(Note (iii)) (Note (i)) (Note (ii))
Balance at 1 January 2016, as previously reported (13,300) 2,306 710,000 54,662 2,845 2,812 (11,129) (193,293) 554,903
Impact of adoption of HKFRS 15 – – – – – – – (4,234) (4,234)
Balance at 1 January 2016, as restated (13,300) 2,306 710,000 54,662 2,845 2,812 (11,129) (197,527) 550,669
Other Comprehensive (Expense)/Income
Currency translation differences – – – – – – – (137,197) (137,197)
Net fair value gains on available-for-sale financial assets, net of tax (Note 16) – – – – 310 – – – 310
Net fair value gains on cash flow hedges, net of tax – – – – – 4,373 – – 4,373
Remeasurement of post-employment benefit obligations recognized in reserve, net of tax – – – – – – (2,991) – (2,991)
Transactions with Owners in their Capacity as Owners
Purchase of shares for Share Award Scheme (12) – – – – – – – (12)
Employee Share Option and Share Award Scheme:
– value of employee services – – – 22,664 – – – – 22,664
– vesting of shares for Share Award Scheme 1,659 – – (11,577) – – – – (9,918)
Transfer to capital reserve – 479 – – – – – – 479
Balance at 31 December 2016, as restated (11,653) 2,785 710,000 65,749 3,155 7,185 (14,120) (334,724) 428,377
NOTES:(i) Capital reserve represents amount set aside from the profit of certain overseas subsidiaries of the Group in accordance with local statutory
requirements.
(ii) Contribution surplus arises from the transfer from share premium of US$3,000,000,000 offset by the distribution in specie of US$2,290,000,000 in prior years.
(iii) Treasury shares represent the excess shares issued for settlement of consideration for certain prior year acquisitions and shares issued and purchased for Share Award Scheme held by the escrow agent.

Li & Fung Limited Annual Report 2017230 Notes to the Financial Statements (continued)
26 Perpetual Capital SecuritiesOn 3 November 2016 and 8 November 2012, the Company issued perpetual subordinated capital securities (the “Perpetual Capital Securities”) with an aggregate principal amount of US$650 million and US$500 million respectively. The Perpetual Capital Securities do not have maturity date and the distribution payments can be deferred at the discretion of the Company. Therefore, the Perpetual Capital Securities were classified as equity instruments and recorded in equity in the consolidated balance sheet. The amounts as at 31 December 2017 and 2016 included the accrued distribution payments.
27 Long-term Liabilities
2017 2016US$’000 US$’000
Long-term bank loan – unsecured (Note 23) 1,558 –
Long-term notes – unsecured 752,432 1,253,277
Purchase consideration payable for acquisitions 61,583 161,536
Other non-current liabilities 27,476 32,589
843,049 1,447,402
Current portion of long-term notes – unsecured – (499,819)
Current portion of purchase consideration payable for acquisitions (42,166) (67,794)
800,883 879,789
Unsecured long-term notes issued to independent third parties in 2010 of US$752,432,000 will mature in 2020 and bear annual coupon of 5.25%.
Non-current portion of purchase consideration payable for acquisitions is unsecured, interest-free and not repayable within twelve months. Balance of purchase consideration payable for acquisitions as at 31 December 2017 amounted to US$61,583,000 (2016: US$161,536,000), of which US$44,162,000 (2016: US$105,598,000) was primarily earn-out and US$17,421,000 (2016: US$55,938,000) was earn-up. Earn-out is a contingent consideration that will be realized if the acquired businesses achieve their respective base year profit target, calculated on certain predetermined basis, during the designated period of time. Earn-up is contingent consideration that will be realized if the acquired businesses achieve certain growth targets, calculated based on the base year profits, during the designated period of time. Details of earn-out and earn-up remeasurement are set out in Note 4 and Note 38.
The maturity of financial liabilities is as follows:
2017 2016US$’000 US$’000
Within 1 year 42,166 567,613
Between 1 and 2 years 15,730 92,184
Between 2 and 5 years 763,311 759,023
Wholly repayable within 5 years 821,207 1,418,820
Over 5 years 21,842 28,582
843,049 1,447,402
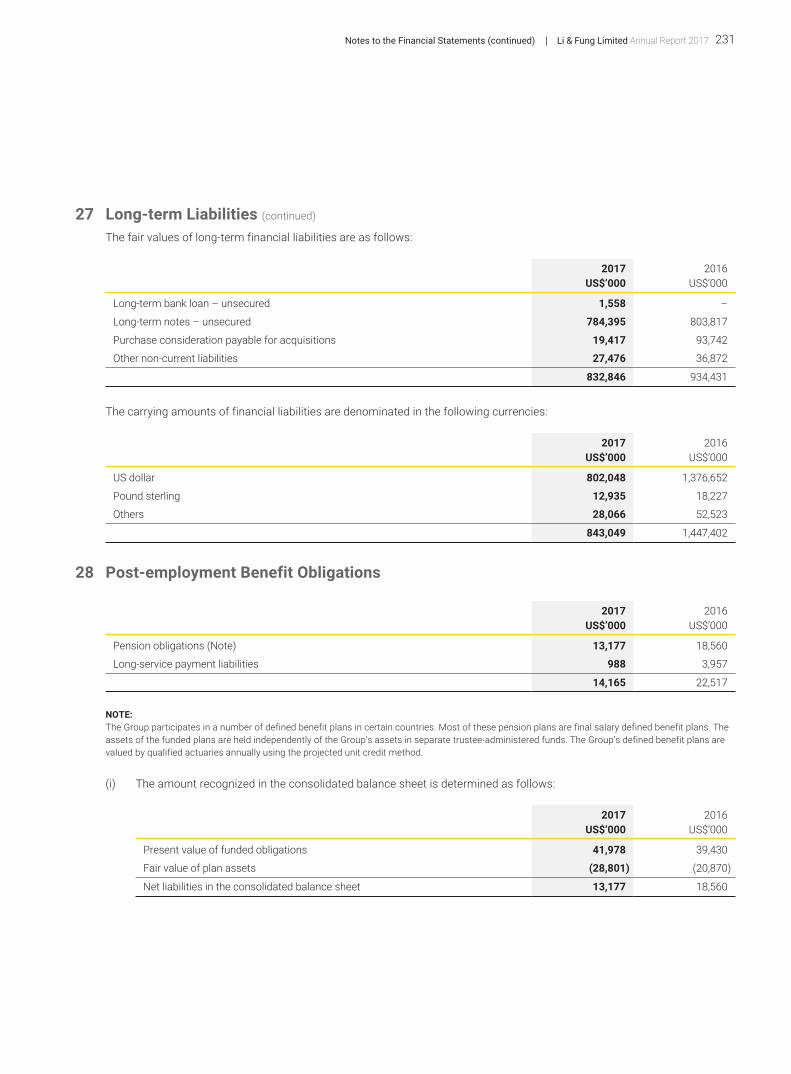
231Li & Fung Limited Annual Report 2017Notes to the Financial Statements (continued)
27 Long-term Liabilities (continued)
The fair values of long-term financial liabilities are as follows:
2017 2016US$’000 US$’000
Long-term bank loan – unsecured 1,558 –
Long-term notes – unsecured 784,395 803,817
Purchase consideration payable for acquisitions 19,417 93,742
Other non-current liabilities 27,476 36,872
832,846 934,431
The carrying amounts of financial liabilities are denominated in the following currencies:
2017 2016US$’000 US$’000
US dollar 802,048 1,376,652
Pound sterling 12,935 18,227
Others 28,066 52,523
843,049 1,447,402
28 Post-employment Benefit Obligations
2017 2016US$’000 US$’000
Pension obligations (Note) 13,177 18,560
Long-service payment liabilities 988 3,957
14,165 22,517
NOTE:The Group participates in a number of defined benefit plans in certain countries. Most of these pension plans are final salary defined benefit plans. The assets of the funded plans are held independently of the Group’s assets in separate trustee-administered funds. The Group’s defined benefit plans are valued by qualified actuaries annually using the projected unit credit method.
(i) The amount recognized in the consolidated balance sheet is determined as follows:
2017 2016US$’000 US$’000
Present value of funded obligations 41,978 39,430
Fair value of plan assets (28,801) (20,870)
Net liabilities in the consolidated balance sheet 13,177 18,560

Li & Fung Limited Annual Report 2017232 Notes to the Financial Statements (continued)
28 Post-employment Benefit Obligations (continued)
(ii) The amount recognized in the consolidated profit and loss account is determined as follows:
2017 2016US$’000 US$’000
Current service cost 1,450 1,618
Past service cost and (gain)/loss on settlements (105) 40
Administrative expenses paid 64 110
Net interest expense 423 393
Total, included in staff costs (Note 9) 1,832 2,161
(iii) The movements in the fair value of plan assets during the year are as follows:
2017 2016US$’000 US$’000
At 1 January 20,870 22,829
Interest income 490 590
Exchange differences 1,738 (2,267)
Administrative expenses paid (64) (110)
Contributions 7,073 1,446
Benefits paid (2,496) (2,092)
Actuarial gain on plan assets 1,190 832
Disposal of business – (358)
At 31 December 28,801 20,870
(iv) Movements in the defined benefit obligation are as follows:
2017 2016US$’000 US$’000
At 1 January 39,430 39,642
Current service cost 1,450 1,618
Interest cost 913 983
Past service cost and (gain)/loss on settlements (105) 40
Actuarial (gains)/losses from changes in experiences (547) 751
Actuarial losses from changes in financial assumptions 1,288 3,169
Actuarial losses/(gains) from changes in demographic assumptions 16 (34)
Exchange differences 3,006 (3,063)
Benefits paid (3,473) (3,281)
Disposal of business – (395)
At 31 December 41,978 39,430

233Li & Fung Limited Annual Report 2017Notes to the Financial Statements (continued)
28 Post-employment Benefit Obligations (continued)
(v) The movements in net defined benefit liabilities recognized in the consolidated balance sheet are as follows:
2017 2016US$’000 US$’000
At 1 January 18,560 16,813
Exchange differences 1,268 (796)
Total expense charged in the consolidated profit and loss account 1,832 2,161
Remeasurement (gains)/losses recognized in other comprehensive income (433) 3,054
Contributions paid (7,073) (1,446)
Benefits paid (977) (1,189)
Disposal of business – (37)
At 31 December 13,177 18,560
(vi) The principal actuarial assumptions used for accounting purposes are:
2017 2016% %
Discount rate 0.9-6.9 1.2-8.2
Salary growth rate 2.4-8.0 2.4-8.0
Pension growth rate 1.0-4.5 1.5-4.5
The sensitivity of the defined benefit obligation to changes in the principal assumption is:
Impact on defined benefit obligation
Change in assumption
Increase in assumption
Decrease in assumption
Discount rate ±0.25% –2.70% +2.83%
The above sensitivity analysis is based on a change in an assumption while holding all other assumptions constant. In practice, this is unlikely to occur, and changes in some of the assumptions may be correlated. When calculating the sensitivity of the defined benefit obligation to significant actuarial assumptions the same method has been applied as when calculating the pension liability recognized within the consolidated balance sheet.
The methods and types of assumptions used in preparing the sensitivity analysis did not change compared to the previous period.

Li & Fung Limited Annual Report 2017234 Notes to the Financial Statements (continued)
28 Post-employment Benefit Obligations (continued)
(vii) Plan assets comprised:
2017 2016US$’000 US$’000
Quoted assets
Cash and cash equivalents 12,584 7,327
Equity instruments
European 2,947 2,563
American 625 622
Asian 980 713
Global 138 4
Debt instruments
Government securities 6,092 4,380
Other securities and debt instruments 3,908 3,584
Investment funds
Unit investment trust funds 620 596
Investment bond funds 688 790
Mutual funds 41 141
Others 178 150
28,801 20,870
The weighted average duration of the defined benefit obligation ranges from 8.5 to 18.9 years.
(viii) Expected maturity analysis of benefit payments:
At 31 December 2017Within
10 yearsBetween
10-20 yearsBeyond
20 yearsUS$’000 US$’000 US$’000
Expected benefit payments 26,730 28,879 27,468
The Group is exposed to a number of risks in relation to the defined benefit obligation, the most significant of which are detailed below:
Investment risk The defined benefit pension holds investments in asset classes, such as equities, which have volatile market values and while these assets are expected to provide real returns over the long term, the short term volatility can cause additional funding to be required if a deficit emerges.
Interest rate risk The defined benefit pension’s liabilities are assessed using market yields on high quality corporate bonds to discount the liabilities. In countries where there is no deep market in such bonds, the market yields on government bonds are used. As the defined benefit pension holds assets such as equities, the value of the assets and liabilities may not move in the same way.
Inflation risk A significant proportion of the benefits under the defined benefit pension are linked to inflation. Although the defined benefit pension’s assets are expected to provide a good hedge against inflation over the long term, movements over the short term could lead to deficits emerging.
Mortality risk In the event that members live longer than assumed, a deficit will emerge in the defined benefit pension.
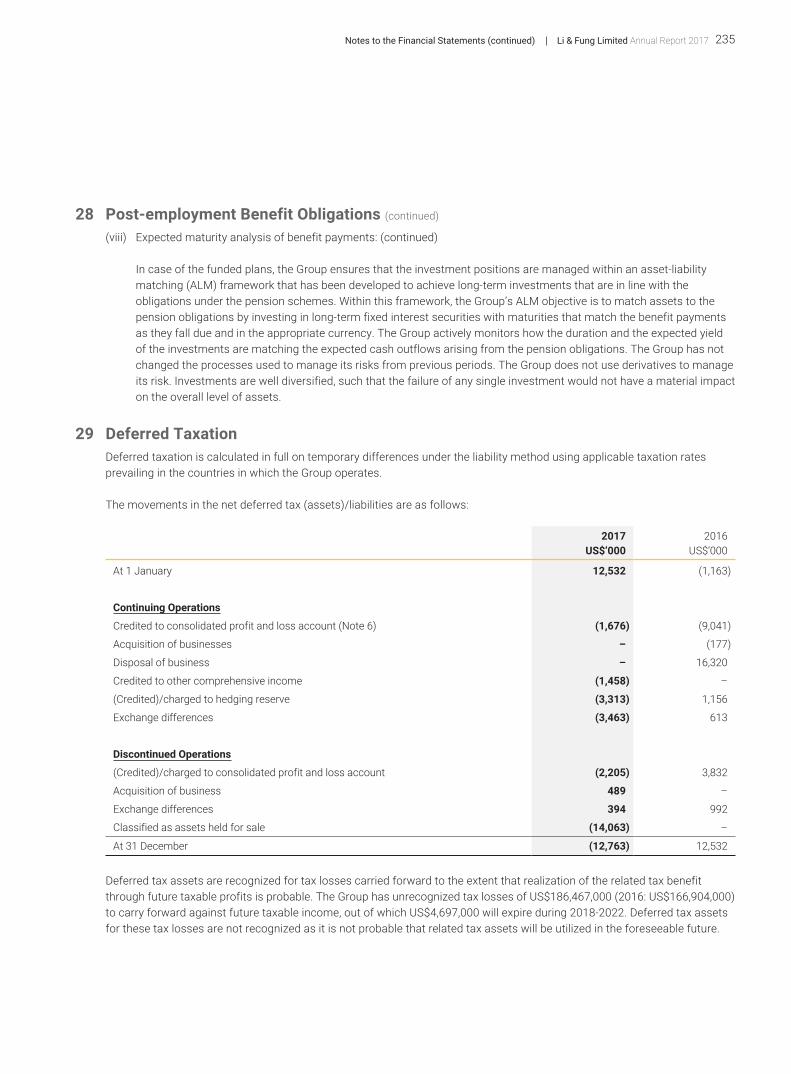
235Li & Fung Limited Annual Report 2017Notes to the Financial Statements (continued)
28 Post-employment Benefit Obligations (continued)
(viii) Expected maturity analysis of benefit payments: (continued)
In case of the funded plans, the Group ensures that the investment positions are managed within an asset-liability matching (ALM) framework that has been developed to achieve long-term investments that are in line with the obligations under the pension schemes. Within this framework, the Group’s ALM objective is to match assets to the pension obligations by investing in long-term fixed interest securities with maturities that match the benefit payments as they fall due and in the appropriate currency. The Group actively monitors how the duration and the expected yield of the investments are matching the expected cash outflows arising from the pension obligations. The Group has not changed the processes used to manage its risks from previous periods. The Group does not use derivatives to manage its risk. Investments are well diversified, such that the failure of any single investment would not have a material impact on the overall level of assets.
29 Deferred TaxationDeferred taxation is calculated in full on temporary differences under the liability method using applicable taxation rates prevailing in the countries in which the Group operates.
The movements in the net deferred tax (assets)/liabilities are as follows:
2017 2016US$’000 US$’000
At 1 January 12,532 (1,163)
Continuing Operations
Credited to consolidated profit and loss account (Note 6) (1,676) (9,041)
Acquisition of businesses – (177)
Disposal of business – 16,320
Credited to other comprehensive income (1,458) –
(Credited)/charged to hedging reserve (3,313) 1,156
Exchange differences (3,463) 613
Discontinued Operations
(Credited)/charged to consolidated profit and loss account (2,205) 3,832
Acquisition of business 489 –
Exchange differences 394 992
Classified as assets held for sale (14,063) –
At 31 December (12,763) 12,532
Deferred tax assets are recognized for tax losses carried forward to the extent that realization of the related tax benefit through future taxable profits is probable. The Group has unrecognized tax losses of US$186,467,000 (2016: US$166,904,000) to carry forward against future taxable income, out of which US$4,697,000 will expire during 2018-2022. Deferred tax assets for these tax losses are not recognized as it is not probable that related tax assets will be utilized in the foreseeable future.

Li & Fung Limited Annual Report 2017236 Notes to the Financial Statements (continued)
29 Deferred Taxation (continued)
The movements in deferred tax assets and liabilities during the year, without taking into consideration the offsetting of balances within the same tax jurisdiction, are as follows:
ProvisionsDecelerated Tax
Depreciation Allowances Tax Losses Others Total
2017 2016 2017 2016 2017 2016 2017 2016 2017 2016Deferred Tax Assets US$’000 US$’000 US$’000 US$’000 US$’000 US$’000 US$’000 US$’000 US$’000 US$’000
At 1 January 20,202 24,037 7,715 9,682 13,925 22,580 4,677 3,475 46,519 59,774
Continuing Operations
(Charged)/credited to consolidated profit and loss account (9,619) 3,226 (2,597) (697) 7,957 7,248 770 1,288 (3,489) 11,065
Credited to other comprehensive income – – – – – – 1,458 – 1,458 –
Disposal of business – (6,739) – (115) – (12,262) – (145) – (19,261)
Exchange differences 3,360 (599) 209 (324) 576 (320) 20 22 4,165 (1,221)
Discontinued Operations
(Charged)/credited to consolidated profit and loss account (852) 292 (412) (127) 454 (3,058) 201 63 (609) (2,830)
Acquisition of business 468 – – – – – – – 468 –
Exchange differences 276 (15) 170 (704) 308 (263) 28 (26) 782 (1,008)
Classified as held for sale (2,771) – (3,871) – (4,755) – (413) – (11,810) –
At 31 December 11,064 20,202 1,214 7,715 18,465 13,925 6,741 4,677 37,484 46,519

237Li & Fung Limited Annual Report 2017Notes to the Financial Statements (continued)
29 Deferred Taxation (continued)
Accelerated Tax Depreciation Allowances
Intangible Assets Arising from Business
Combinations Others Total
2017 2016 2017 2016 2017 2016 2017 2016Deferred Tax Liabilities US$’000 US$’000 US$’000 US$’000 US$’000 US$’000 US$’000 US$’000
At 1 January 5,160 6,496 50,528 49,030 3,363 3,085 59,051 58,611
Continuing Operations
Charged/(credited) to consolidated profit and loss account 2,057 1,732 (7,471) 1,257 249 (965) (5,165) 2,024
Acquisition of businesses – (177) – – – – – (177)
Disposal of business – (2,538) – (403) – – – (2,941)
(Credited)/charged to hedging reserve – – – – (3,313) 1,156 (3,313) 1,156
Exchange differences 143 (441) 25 – 534 (167) 702 (608)
Discontinued Operations
(Credited)/charged to consolidated profit and loss account (20) 95 (2,654) 653 (140) 254 (2,814) 1,002
Acquisition of business – – 957 – – – 957 –
Exchange differences 111 (7) 1,026 (9) 39 – 1,176 (16)
Classified as held for sale (597) – (25,123) – (153) – (25,873) –
At 31 December 6,854 5,160 17,288 50,528 579 3,363 24,721 59,051
After offsetting balances within the same tax jurisdiction, the balances as disclosed in the consolidated balance sheet are as follows:
2017 2016US$’000 US$’000
Deferred tax assets 17,456 16,419
Deferred tax liabilities (4,693) (28,951)
12,763 (12,532)
The amounts shown in the consolidated balance sheet include the following:
2017 2016US$’000 US$’000
Deferred tax assets to be recovered after more than 12 months 9,893 4,038
Deferred tax assets to be recovered within 12 months 7,563 12,381
Deferred tax liabilities to be settled after more than 12 months 4,603 24,967
Deferred tax liabilities to be settled within 12 months 90 3,984

Li & Fung Limited Annual Report 2017238 Notes to the Financial Statements (continued)
30 Notes to the Consolidated Cash Flow Statement
(a) Reconciliation of Profit Before Taxation to Net Cash Inflow Generated from Operations
2017 2016US$’000 US$’000
(Restated)
Profit before taxation 274,470 227,411
Interest income (12,261) (15,713)
Interest expenses 69,761 90,448
Depreciation 39,017 44,755
Amortization of system development, software and other license costs 8,347 8,120
Amortization of other intangible assets 23,327 20,011
Amortization of prepaid premium for land leases 7 65
Property, plant and equipment written off on reorganization 14,988 –
Intangible assets written off on reorganization 10,502 –
Share of profits less losses of associated companies and joint venture (1,898) (1,748)
Employee share option and share award expenses 13,020 17,064
Gain on disposal of business – (7,871)
(Gain)/loss on disposal of property, plant and equipment and prepaid premium for land leases, net (953) 340
Gain on remeasurement of contingent consideration payable (31,492) –
Operating profit before working capital changes 406,835 382,882
Decrease in inventories 20,411 48,938
Decrease/(increase) in trade and bills receivable, other receivables, prepayments and deposits and amounts due from related companies 93,728 (42,709)
Decrease in trade and bills payable, accrued charges and sundry payables and amounts due to related companies (161,355) (84,715)
Net cash inflow generated from operations 359,619 304,396
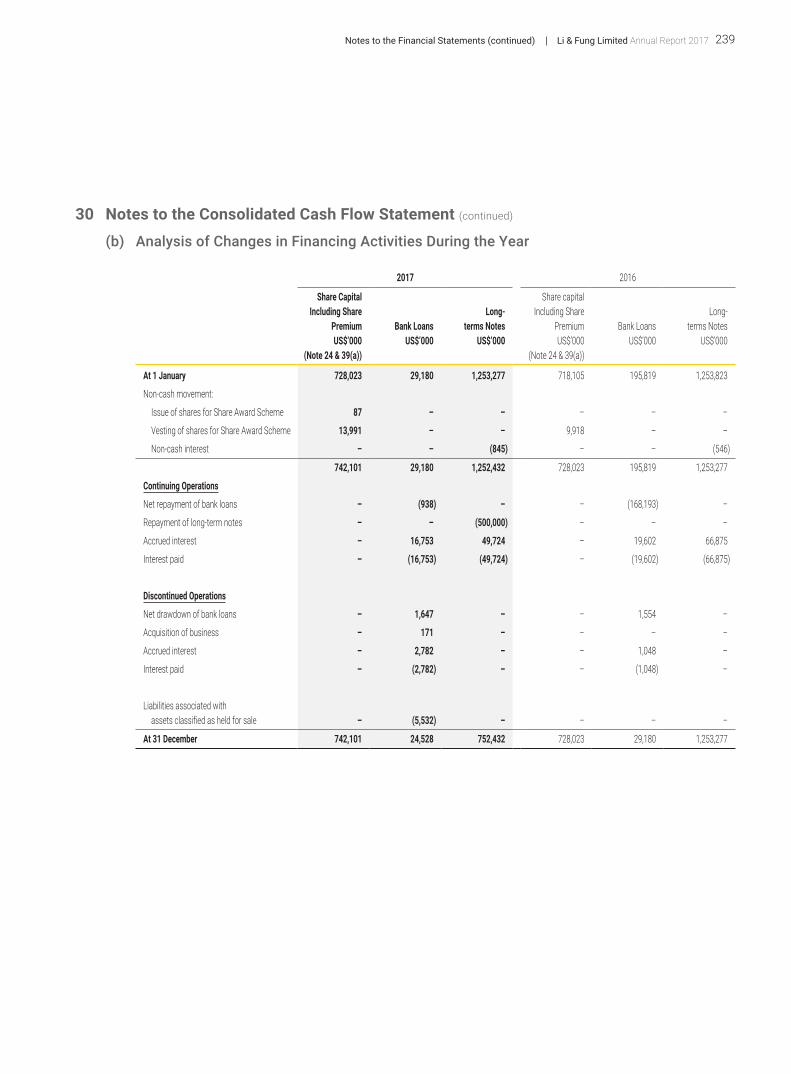
239Li & Fung Limited Annual Report 2017Notes to the Financial Statements (continued)
30 Notes to the Consolidated Cash Flow Statement (continued)
(b) Analysis of Changes in Financing Activities During the Year
2017 2016
Share Capital Including Share
Premium Bank LoansLong-
terms Notes
Share capital Including Share
Premium Bank LoansLong-
terms NotesUS$’000 US$’000 US$’000 US$’000 US$’000 US$’000
(Note 24 & 39(a)) (Note 24 & 39(a))
At 1 January 728,023 29,180 1,253,277 718,105 195,819 1,253,823
Non-cash movement:
Issue of shares for Share Award Scheme 87 – – – – –
Vesting of shares for Share Award Scheme 13,991 – – 9,918 – –
Non-cash interest – – (845) – – (546)
742,101 29,180 1,252,432 728,023 195,819 1,253,277
Continuing Operations
Net repayment of bank loans – (938) – – (168,193) –
Repayment of long-term notes – – (500,000) – – –
Accrued interest – 16,753 49,724 – 19,602 66,875
Interest paid – (16,753) (49,724) – (19,602) (66,875)
Discontinued Operations
Net drawdown of bank loans – 1,647 – – 1,554 –
Acquisition of business – 171 – – – –
Accrued interest – 2,782 – – 1,048 –
Interest paid – (2,782) – – (1,048) –
Liabilities associated with assets classified as held for sale – (5,532) – – – –
At 31 December 742,101 24,528 752,432 728,023 29,180 1,253,277

Li & Fung Limited Annual Report 2017240 Notes to the Financial Statements (continued)
31 Discontinued OperationsThe results of the three Product Verticals of the Company (the “Business”) are presented in the consolidated profit and loss account as Discontinued Operations in accordance with HKFRS 5 “Non-current Assets Held for Sale and Discontinued Operations”. The consolidated statement of comprehensive income and consolidated cash flow statement distinguish the Discontinued Operations from the Continuing Operations and the assets classified as held for sale and liabilities associated with assets classified as held for sale.
(a) Results of the Discontinued Operations have been included in the consolidated profit and loss accounts as follows:
2017 2016US$’000 US$’000
Turnover 1,926,795 1,939,118
Cost of sales (1,470,150) (1,474,118)
Gross profit 456,645 465,000
Selling and distribution expenses (120,575) (121,093)
Merchandising and administrative expenses (257,843) (252,379)
Core operating profit 78,227 91,528
Amortization of other intangible assets (13,659) (13,790)
Operating profit 64,568 77,738
Interest income 563 611
Interest expenses (2,782) (1,048)
Profit before taxation 62,349 77,301
Taxation (13,031) (16,233)
Profit after taxation 49,318 61,068
Remeasurement loss on assets classified as held for sale (592,363) –
Net (loss)/profit for the year (543,045) 61,068
Attributable to:
Shareholders of the Business (544,991) 61,068
Non-controlling interest 1,946 –
(543,045) 61,068

241Li & Fung Limited Annual Report 2017Notes to the Financial Statements (continued)
31 Discontinued Operations (continued)
(a) Results of the Discontinued Operations have been included in the consolidated profit and loss accounts as follows: (continued)
STATEMENT OF COMPREHENSIVE INCOME OF THE DISCONTINUED OPERATIONS
2017 2016US$’000 US$’000
Net (Loss)/Profit for the Year (543,045) 61,068
Other Comprehensive Income/(Expense):
Items that may be reclassified subsequently to profit or loss
Currency translation differences 28,157 (55,244)
Net fair value gains on cash flow hedges, net of tax 38 364
Total Items That May Be Reclassified Subsequently to Profit or Loss 28,195 (54,880)
Total Other Comprehensive Income/(Expense) for the Year, Net of Tax 28,195 (54,880)
Total Comprehensive (Expense)/Income for the Year (514,850) 6,188
Attributable to:
Shareholders of the Business (516,796) 6,188
Non-controlling interest 1,946 –
(514,850) 6,188
(b) Geographical Analysis of Turnover of the Discontinued OperationsThe turnover consists of sales to United States of America of US$1,010,500,000 (2016: US$1,005,932,000), Europe of US$558,522,000 (2016: US$620,370,000), Asia of US$239,961,000 (2016: US$192,764,000) and Rest of the world US$117,812,000 (2016: US$120,052,000).

Li & Fung Limited Annual Report 2017242 Notes to the Financial Statements (continued)
31 Discontinued Operations (continued)
(c) Operating Profit of the Discontinued OperationsOperating profit of the Discontinued Operations is stated after charging/(crediting) the following:
2017 2016US$’000 US$’000
Charging/(Crediting)
Cost of inventories sold 1,470,150 1,474,118
Amortization of system development, software and other license costs 2,633 3,397
Amortization of other intangible assets (excluded from the core operating profit) 13,659 13,790
Depreciation of property, plant and equipment 9,263 13,156
Loss on disposal of property, plant and equipment 241 449
Operating leases rental in respect of land and building 14,237 15,477
Provision for impaired receivables (Note 20) 6,468 1,248
Staff costs 161,276 167,852
Net exchange (gains)/losses (795) 66
Remeasurement loss on assets classified as held for sale (excluded from the core operating profit) * 592,363 –
* The three Product Verticals were recognized as assets held for sale in accordance with HKFRS 5 Non-current Assets Held for Sale and Discontinued Operations, and were required to be marked down to the lower of their carrying value and fair value less costs to sell. In such respect, an unrealized non-cash remeasurement loss of US$592 million was recognized as of 31 December 2017, estimated based on the carrying value of the relevant goodwill and other asset/liabilities of the three Product Verticals as of 31 December 2017, on cash free/debt free basis and adjusted for relevant closing adjustments.
The remuneration to the auditors of the Discontinued Operations is as follows:
2017 2016US$’000 US$’000
Audit services 960 673
Non-audit services
– due diligence reviews on acquisitions 61 –
– taxation services 549 526
– others 620 –
Total remuneration to auditors charged to Discontinued Operations profit and loss account 2,190 1,199
NOTE:Of the above audit and non-audit services fees, US$922,000 (2016: US$673,000) and US$1,230,000 (2016: US$526,000), respectively are payable to the Company’s auditor.

243Li & Fung Limited Annual Report 2017Notes to the Financial Statements (continued)
31 Discontinued Operations (continued)
(d) Assets and Liabilities of the Discontinued OperationsThe assets and liabilities related to the Discontinued Operations have been presented as assets classified as held for sale and liabilities associated with assets classified as held for sale. The Discontinued Operations’ assets and liabilities were measured at the lower of carrying amount and fair value less costs to sell at the date of held for sale classification. The major classes of assets and liabilities of the Discontinued Operations are as follows:
31 December2017
US$’000
(i) Assets Classified as Held for Sale
Intangible assets 1,621,938
Property, plant and equipment 38,690
Other non-current assets 7,702
Inventories 125,270
Trade and other receivables 247,228
Other current assets 22
Cash and bank balances 192,578
2,233,428
Remeasurement loss on assets classified as held for sale (592,363)
Assets classified as held for sale after remeasurement loss 1,641,065
(ii) Liabilities Associated with Assets Classified as Held for Sale
Trade and other payables 347,372
Other current liabilities 18,906
Short-term bank loans 5,532
Other non-current liabilities 94,760
466,570

Li & Fung Limited Annual Report 2017244 Notes to the Financial Statements (continued)
31 Discontinued Operations (continued)
(e) An analysis of the cash flows of the Discontinued Operations is as follows:
2017 2016US$’000 US$’000
Net cash inflow from operating activities 258,647 117,857
Net cash outflow from investing activities (6,038) (13,074)
Net cash (outflow)/inflow from financing activities* (1,135) 506
Total cash flow 251,474 105,289
* Amounts adjusted to eliminate impact from financing activities between the Discontinued Operations and the Continuing Operations.
(f) Contingent Liabilities
2017 2016US$’000 US$’000
Guarantees in respect of banking facilities granted to:
Trading partners 387 –
(g) Commitments(i) OPERATING LEASE COMMITMENTS
The Discontinued Operations has total future aggregated minimum lease payments under non-cancellable operating leases as follows:
2017 2016US$’000 US$’000
Within one year 2,843 2,666
In the second to fifth year inclusive 7,311 6,986
After the fifth year 6,234 7,726
16,388 17,378
(ii) CAPITAL COMMITMENTS
2017 2016US$’000 US$’000
Contracted but not provided for:
Property, plant and equipment 5,663 107

245Li & Fung Limited Annual Report 2017Notes to the Financial Statements (continued)
31 Discontinued Operations (continued)
(h) Related Party TransactionsThe Discontinued Operations has the following related party transactions during the year ended 31 December 2017:
2017 2016US$’000 US$’000
Distribution and sales of goods 883 2,788
Pursuant to the master distribution and sales of goods agreement entered into on 5 December 2014 with FH (1937) for a term of three years ending 31 December 2017, certain distribution and sales of goods was made on mutually agreed normal commercial terms with FH (1937) and its associates.
(i) Transactions with Non-controlling InterestsThe Group treats transactions with non-controlling interests that do not result in loss of control as transactions with equity owners of the Group. For purchases from non-controlling interests, the difference between any consideration paid and the relevant share acquired of the carrying value of net assets of the combined entity is recorded in equity. Gains or losses on disposals to non-controlling interests are also recorded in equity.
In August 2017, the Group formed a joint venture with South Ocean Knitters Holdings Limited (“South Ocean”), a company incorporated with limited liability under the laws of the British Virgin Islands, which engages in knitwear manufacturing, spinning, dying, knitting, and finishing. Since completion of the transaction on 30 September 2017, the joint venture vehicle, Cobalt Fashion Holding Limited, is owned 62% by the Discontinued Operations and 38% by South Ocean. No cash consideration was paid by the Group in connection with the combination of these two businesses. Other than joint venture Cobalt Fashion Holding Limited, no other assets or shares subject to the strategic divestment of the three Product Verticals have been acquired in the past 12 months.
32 Contingent Liabilities from Continuing Operations
2017 2016US$’000 US$’000
Guarantees in respect of banking facilities granted to:
Associated companies 750 750

Li & Fung Limited Annual Report 2017246 Notes to the Financial Statements (continued)
33 Commitments from Continuing Operations
(a) Operating Lease Commitments from Continuing OperationsThe Continuing Operations of the Group leases various offices and warehouses under non-cancellable operating lease agreements. The lease terms are between 1 and 18 years. At 31 December 2017, the Continuing Operation of the Group had total future aggregate minimum lease payments under non-cancellable operating leases as follows:
2017 2016US$’000 US$’000
(Restated)
Within one year 145,887 112,430
In the second to fifth year inclusive 286,877 220,075
After the fifth year 83,291 76,750
516,055 409,255
(b) Capital Commitments from Continuing Operations
2017 2016US$’000 US$’000
(Restated)
Contracted but not provided for:
Property, plant and equipment 4,510 2,558
System development, software and other license costs 5,030 3,134
9,540 5,692
34 Charges on Assets from Continuing OperationsSave as disclosed in Note 12, there were no charges on the assets and undertakings of the Group as at 31 December 2017 and 2016.

247Li & Fung Limited Annual Report 2017Notes to the Financial Statements (continued)
35 Related Party Transactions from Continuing OperationsThe Continuing Operations of the Group had the following material transactions with its related parties during the year ended 31 December 2017 and 2016:
2017 2016Note US$’000 US$’000
(restated)
Distribution and sales of goods (i) 14,954 17,302
Operating leases rental and license fee paid (ii) 24,437 26,242
Operating lease rental and license fee received (ii) 1,370 –
Sourcing and supply chain management services income (iii) 1,328,648 1,412,770
Rental and license fee paid (iv) – 1,027
Rental and license fee received (iv) – 3,282
Logistics related services income (v) 16,598 15,530
Sourcing and supply chain management services income (vi) 48,630 –
(i) Pursuant to the master distribution and sales of goods agreement entered into on 5 December 2014 with FH (1937) for a term of three years ending 31 December 2017, certain distribution and sales of goods was made on mutually agreed normal commercial terms with FH (1937) and its associates.
(ii) Pursuant to the master lease agreement (the “Master Lease Agreement”) for leasing of properties or sub-leasing and/or licensing arrangement dated 14 November 2016 entered into with FH (1937) and its associates for a term of three years ending 31 December 2019, the Group had rental charge for certain properties leased from FH (1937) and its associates during the period based on mutually agreed normal commercial terms. For the year ended 31 December 2017, aggregate operating lease rental and license fee paid to and from one another approximated to US$25,807,000 (2016: US$26,242,000).
(iii) Pursuant to the buying agency agreement (the “Old Buying Agency Agreement”) entered into with Global Brands on 24 June 2014, the Group provided sourcing and supply chain management services to Global Brands Group and its associates for a term of three years from the listing date of Global Brands. In view of the expiry of the Old Buying Agency Agreement, the Group has entered into the amended and restated buying agency agreement (the “Amended and Restated Buying Agency Agreement”) on 14 November 2016 for a term commencing on 9 July 2017 and ending on 31 March 2020. For the year ended 31 December 2017, the Group provided sourcing and supply chain management services to Global Brands Group with an aggregate income of approximately US$1,328,648,000 (2016: US$1,412,770,000).
(iv) Pursuant to the master property agreement entered into with Global Brands on 24 June 2014, the Group and Global Brands Group had rental and license fee to and from one another for certain properties and license offices, showroom and warehouse premises on mutually agreed terms from the listing date of Global Brands to 31 December 2016. In view of expiry of the existing Master Lease Agreement, the Company has entered into the renewal Master Lease Agreement as aforementioned in (ii). For the year ended 31 December 2016, aggregate rental and license fee paid to and from one another approximated to US$4,309,000.
(v) Pursuant to the master agreement for provision of logistics related services entered into on 20 August 2015, the Group provided certain logistics related services to FH (1937) and its associates during the year. The aggregate service income, excluding the passed-through costs for direct freight forwarding, approximated to US$16,598,000 (2016: US$15,530,000).
(vi) Pursuant to the sourcing and supply chain management agreement entered into with Trinity on 7 June 2017, the Group provided sourcing and supply chain management services to Trinity and its associates for a term from 1 June 2017 to 31 December 2019. For the year ended 31 December 2017, the commission received for sourcing and supply chain management services to Trinity was US$5,219,000 (2016: Nil) and the underlying FOB value of the ordered products was US$43,411,000 (2016: Nil).

Li & Fung Limited Annual Report 2017248 Notes to the Financial Statements (continued)
35 Related Party Transactions from Continuing Operations (continued)
During 2016, a subsidiary of the Group disposed of the entire issued share capital of a property company which solely owns the property to a subsidiary of FH (1937) for a cash consideration of approximately US$4,375,000. The Group also entered into a leaseback agreement at an annual rental of approximately US$288,000 for a term up to 30 December 2019.
On 14 December 2017, the Company entered into a sale and purchase Agreement with True Sage Limited, an entity incorporated in the British Virgin Islands, which will be owned by United Strength Element Limited, (“USEL”) (an investment holding company wholly-owned by Hony Capital, an independent third party), FH (1937) (a substantial shareholder of the Company) and Fung Investments Limited, to divest the three Product Verticals under the Products segment for a total cash consideration of US$1,100 million on a cash free/debt free basis, subject to closing adjustment. This strategic divestment was approved by the Company’s Independent Shareholders on 31 January 2018 and is targeted to close during first half of 2018, subject to regulatory approval.
The foregoing related party transactions also fall under the definition of continuing connected transactions of the Company as stipulated in the Listing Rules on the Stock Exchange.
No transactions have been entered with the directors of the Company (being the key management personnel) during the year other than the emoluments paid to them (being the key management personnel compensation) as disclosed in Notes 10 and 40.
Save as above, the Group had no material related party transactions during the year.
36 Financial Risk ManagementThe Group’s activities expose it to a variety of financial risks: market risk (including foreign exchange risk, fair value interest rate risk, cash flow interest rate risk and price risk), credit risk, and liquidity risk. The Group’s overall risk management program focuses on the unpredictability of financial markets and seeks to minimize potential adverse effects on the Group’s financial performance. The Group uses derivative financial instruments to hedge certain risk exposures.
(a) Market Risk(i) FOREIGN EXCHANGE RISK
Most of the Group’s cash balances are in HK dollar and US dollar deposits with major global financial institutions, and most of the Group’s borrowings are denominated in US dollars.
The Group’s revenues and payments were transacted predominantly in US dollars. Therefore, it considers there is no significant risk exposure in relation to foreign exchange rate fluctuations. There are small portion of sales and purchases transacted in different currencies, for which the Group arranges hedging through foreign exchange forward contracts.
For transactions that are subject to foreign exchange risk, the Group hedge its foreign currency exposure once it receives confirmed orders or enter into customer transactions. To mitigate the impact from changes in foreign exchange rates, the Group regularly reviews the operations in these countries and makes necessary hedging arrangements in certain currencies against the US dollar.

249Li & Fung Limited Annual Report 2017Notes to the Financial Statements (continued)
36 Financial Risk Management (continued)
(a) Market Risk (continued)
(i) FOREIGN EXCHANGE RISK (continued)
However, the Group does not enter into foreign currency hedges with respect to the local financial results and long-term equity investments of its non-US dollar foreign operations for either the income statements or balance sheet reporting purposes. Since the Group’s functional currency is the US dollar, it is subject to exchange rate exposure from the translation of foreign operations’ local results to US dollars at the average rate for the period of group consolidation. The net equity investments in non-US dollar-denominated businesses is also subject to unrealized translation gain or loss on consolidation. Fluctuation of relevant currencies against the US dollar will result in unrealized gain or loss from time to time, which is reflected as movement in exchange reserve in the consolidated statement of changes in equity.
From a medium-to long-term perspective, the Group manages its operations in the most cost-effective way possible within the global network.
Other than this, the Group strictly prohibits any financial derivative arrangement merely for speculation.
At 31 December 2017, if the major foreign currencies, such as Euro and Pound Sterling, to which the Group had exposure had strengthened/weakened by 10% (2016: 10%) against US and HK dollar with all other variables held constant, profit for the year and equity would have been approximately 1.1% (2016 (restated): 1.8%) and 2.8% (2016 (restated): 2.8%) higher/lower, mainly as a result of foreign exchange gains/losses on translation of foreign currencies denominated trade receivables, borrowings and intangible assets.
(ii) PRICE RISKThe Group is exposed to price risk because of investments held by the Group and classified on the consolidated balance sheet as available-for-sale financial assets. The Group maintains these investments for long-term strategic purposes and the Group’s overall exposure to price risk is not significant.
At 31 December 2017 and up to the report date of the financial statements, the Group held no material financial derivative instruments except for certain foreign exchange forward contracts entered into for hedging of foreign exchange risk exposure on sales and purchases transacted in different currencies. At 31 December 2017, the fair value of foreign exchange forward contracts entered into by the Group amounted to US$5,333,000 (2016: US$10,697,000 assets), which has been reflected in full in the Group’s consolidated balance sheet as derivative financial instruments liabilities.
(iii) CASH FLOW AND FAIR VALUE INTEREST RATE RISKAs the Group has no significant interest-bearing assets, the Group’s income and operating cash flows are substantially independent of changes in market interest rates.
The Group’s interest rate risk arises mainly from US dollar denominated bank borrowings and the US dollar denominated long-term notes issued. Bank borrowings at variable rates expose the Group to cash flow interest rate risk. The Group’s policy is to maintain a diversified mix of variable and fixed rate borrowings based on prevailing market conditions.
At 31 December 2017, if the variable interest rates on the bank borrowings had been 0.1% higher/lower with all other variables held constant, profit for the year and equity would have been approximately US$1,076,000 (2016: US$1,401,000) lower/higher, mainly as a result of higher/lower interest expenses on floating rate borrowings.

Li & Fung Limited Annual Report 2017250 Notes to the Financial Statements (continued)
36 Financial Risk Management (continued)
(b) Credit RiskCredit risk mainly arises from trade and other receivables as well as cash and bank balances of the Group. The Group’s principal trading business carries a higher credit risk profile given that the Group is acting as a supplier and therefore takes full counterparty risk for the customers in terms of accounts receivable and inventory.
In addition, as the Group provides working capital solutions to the suppliers via LF Credit by selectively settling accounts payable earlier at a discount, it also assumes direct counterparty risk for the customers for such receivables. With the increased insolvency risk among global brands and retail customers, the Group has deployed a global credit risk management framework with a tightened risk profile, and applied prudent policies to manage the credit risk with such receivables that include, but are not limited to, the measures set out below:
(i) The Group selects customers in a cautious manner. Its credit control team uses a risk assessment system to evaluate the financial strengths of individual customers prior to agreeing on trade terms. It is not uncommon that the Group requires securities (such as standby or commercial letter of credit, or bank guarantee) from customers that fall short of the required minimum score under its risk assessment system;
(ii) A significant portion of trade receivable balances is covered by trade credit insurance or factored to external financial institutions on a non-recourse basis;
(iii) It has established a credit risk system with a dedicated team, and tightened policies to ensure on-time recoveries from trade debtors; and
(iv) It has put in place rigid internal policies that govern provisions made for both inventories and receivables to motivate its business managers to step up efforts in these two areas so as to avoid any significant impact on their financial performance.
The Group’s five largest customers of the Group, in aggregate, account for 36% of the Group’s business. Transactions with these customers are entered into within the credit limits designated by the Group.
Except for trade receivables of US$11,765,000 (2016: US$56,599,000) and other receivables of US$3,315,000 (2016: US$17,452,000), which were considered impaired and fully provided, none of the other financial assets including available-for-sale financial assets (Note 16) and due from related companies (Note 18) are considered impaired as there is no recent history of default of the counterparties. The maximum exposure of these other financial assets to credit risk at the reporting date is their carrying amounts.
(c) Liquidity RiskPrudent liquidity risk management implies maintaining sufficient cash on hand and the availability of funding through an adequate amount of committed credit facilities from the Group’s bankers.
Management monitors rolling forecasts of the Group’s liquidity reserves (comprises undrawn borrowing facilities and cash and cash equivalents (Note 21)) on the basis of expected cash flow.
The table below analyzes the liquidity impact of the Group’s non-derivative financial liabilities (including annual coupons payable for the long-term notes) into relevant maturity groupings based on the remaining period from the balance sheet date to the contractual maturity date. The amounts disclosed in the table are the contractual undiscounted cash flows and these amounts will not reconcile to the amounts disclosed on the consolidated balance sheet and in Note 27 for long-term liabilities.

251Li & Fung Limited Annual Report 2017Notes to the Financial Statements (continued)
36 Financial Risk Management (continued)
(c) Liquidity Risk (continued)
Less than 1 year
Between 1 and 2 years
Between 2 and 5 years Over 5 years
US$’000 US$’000 US$’000 US$’000
At 31 December 2017
Purchase consideration payable for acquisitions 42,166 14,900 5,531 –
Long-term bank loan – – 1,558 –
Long-term notes – unsecured 39,375 56,574 782,837 24,612
Trade and bills payable 1,733,661 – – –
Accrued charges and sundry payables 468,089 – – –
Financial guarantee contract 750 – – –
Due to related companies 124 – – –
Bank advances for discounted bills 1,724 – – –
Short-term bank loans 22,970 – – –
At 31 December 2016
Purchase consideration payable for acquisitions 71,121 97,575 894 3,983
Long-term notes – unsecured 553,125 39,375 809,063 –
Trade and bills payable 2,083,875 – – –
Accrued charges and sundry payables 553,292 – – –
Financial guarantee contract 750 – – –
Due to related companies 2,093 – – –
Bank advances for discounted bills 22,773 – – –
Short-term bank loans 29,180 – – –
At 1 January 2016
Purchase consideration payable for acquisitions 87,433 70,271 94,538 –
Long-term bank loans – 100,000 – –
Long-term notes – unsecured 66,875 553,125 848,438 –
Trade and bills payable 2,464,785 – – –
Accrued charges and sundry payables 635,579 – – –
Financial guarantee contract 750 – – –
Due to related companies 1,038 – – –
Bank advances for discounted bills 33,681 – – –
Short-term bank loans 95,819 – – –
All of the Group’s gross settled derivative financial instruments are in hedge relationships and are due to settle within 12 months of the balance sheet date. These contracts require undiscounted contractual cash inflows of US$248,798,000 (31 December 2016 (restated): US$299,688,000 and 1 January 2016 (restated): US$212,734,000) and undiscounted contractual cash outflows of US$254,175,000 (31 December 2016 (restated): US$288,570,000 and 1 January 2016 (restated): US$208,742,000).

Li & Fung Limited Annual Report 2017252 Notes to the Financial Statements (continued)
37 Capital Risk ManagementThe Group’s objectives when managing capital are to safeguard the Group’s ability to continue as a going concern in order to provide returns for shareholders and benefits for other stakeholders and to maintain an optimal capital structure to reduce the cost of capital.
In order to maintain or adjust the capital structure, the Group may adjust the amount of dividends paid to shareholders, return capital to shareholders, issue new shares or sell assets to reduce debt.
Consistent with others in the industry, the Group monitors capital on the basis of the gearing ratio. This ratio is calculated as net debt divided by total capital. Net debt is calculated as total borrowings (including short-term bank loans (Note 23), long-term bank loan (Note 23) and long-term notes (Note 27) less cash and cash equivalents (Note 21). Total capital is calculated as total equity, as shown in the consolidated balance sheet, plus net debt.
The Group’s strategy is to maintain a gearing ratio not exceeding 35%. The gearing ratios at 31 December 2017 and 2016 were as follows:
2017 2016US$’000 US$’000
(Restated)
Long-term bank loan (Note 23) 1,558 –
Short-term bank loans (Note 23) 22,970 29,180
Long-term notes (Note 27) 752,432 1,253,277
776,960 1,282,457
Less: Cash and cash equivalents (Note 21) (348,940) (985,039)
Net debt 428,020 297,418
Total equity 2,913,695 3,458,984
Total capital 3,341,715 3,756,402
Gearing ratio 13% 8%
38 Fair Value EstimationThe table below analyses financial instruments carried at fair value, by valuation method. The different levels have been defined as follows:
• Quoted prices (unadjusted) in active markets for identical assets or liabilities (level 1).
• Inputs other than quoted prices included within level 1 that are observable for the asset or liability, either directly (that is, as prices) or indirectly (that is, derived from prices) (level 2).
• Inputs for the asset or liability that are not based on observable market data (that is, unobservable inputs) (level 3).

253Li & Fung Limited Annual Report 2017Notes to the Financial Statements (continued)
38 Fair Value Estimation (continued)
The following table presents the Group’s assets and liabilities that are measured at fair value at 31 December 2017.
Level 1 Level 2 Level 3 TotalUS$’000 US$’000 US$’000 US$’000
Assets
Available-for-sale financial assets (Note 16)
– Club debentures – – 4,338 4,338
Total Assets – – 4,338 4,338
Liabilities
Derivative financial instrument used for hedging (Note 19) – 5,355 – 5,355
Purchase consideration payable for acquisitions – – 61,583 61,583
Total Liabilities – 5,355 61,583 66,938
The following table presents the Group’s assets and liabilities that are measured at fair value at 31 December 2016.
Level 1 Level 2 Level 3 TotalUS$’000 US$’000 US$’000 US$’000
Assets
Available-for-sale financial assets (Note 16)
– Club debentures – – 4,164 4,164
Derivative financial instrument used for hedging (Note 19) – 10,697 – 10,697
Total Assets – 10,697 4,164 14,861
Liabilities
Purchase consideration payable for acquisitions – – 161,536 161,536
Total Liabilities – – 161,536 161,536
The fair values of financial instruments traded in active markets are based on quoted market prices at the balance sheet date. A market is regarded as active if quoted prices are readily and regularly available from an exchange, dealer, broker, industry group, pricing service, or regulatory agency, and those prices represent actual and regularly occurring market transactions on an arm’s length basis. The quoted market price used for financial assets held by the Group is the current bid price. These instruments are included in level 1.
The fair values of financial instruments that are not traded in an active market (for example, over-the-counter derivatives) are determined by using valuation techniques. These valuation techniques maximize the use of observable market data where it is available and rely as little as possible on entity specific estimates. If all significant inputs required to fair value an instrument are observable, the instrument is included in level 2.
If one or more of the significant inputs is not based on observable market data, the instrument is included in level 3.

Li & Fung Limited Annual Report 2017254 Notes to the Financial Statements (continued)
38 Fair Value Estimation (continued)
Specific valuation techniques used to value financial instruments include:
• Quoted market prices or dealer quotes for similar instruments.
• The fair value of forward foreign exchange contracts is determined using forward exchange rates at the balance sheet date, with the resulting value discounted back to present value.
• Other techniques, such as discounted cash flow analysis, are used to determine fair value for the remaining financial instruments.
There were no significant transfer of assets between level 1, level 2 and level 3 fair value hierarchy classifications during the year.
The following summarizes the major methods and assumptions used in estimating the fair values of the significant assets and liabilities classified as level 2 or 3 and the valuation process for assets and liabilities classified as level 3:
Derivative Financial Instruments Used for HedgingThe Group relies on bank valuations to determine the fair value of financial assets/liabilities which in turn are determined using discounted cash flow analysis. These valuations maximize the use of observable market data. Foreign currency exchange prices are the key observable inputs in the valuation.
Purchase Consideration Payable for AcquisitionsThe Group recognizes the fair value of those purchase considerations for acquisitions, as of their respective acquisition dates as part of the consideration transferred in exchange for the acquired businesses. These fair value measurements require, among other things, significant estimation of post-acquisition performance of the acquired businesses and significant judgment on time value of money. These calculations use cash flow projections for post-acquisition performance. The discount rate used is based on the then prevailing incremental cost of borrowings of the Group at time of acquisitions, which approximated to 2.5%.
The following table presents the changes in level 3 instruments for the year ended 31 December 2017 and 2016.
2017 2016
Purchase Consideration
Payable for Acquisitions Others
Purchase Consideration
Payable for Acquisitions Others
US$’000 US$’000 US$’000 US$’000
Opening balance 161,536 4,164 242,502 3,854
Fair value gains – 174 – 310
Additions – – 6,747 –
Settlement (67,811) – (89,058) –
Remeasurement of acquisitions payable (31,492) – – –
Others (650) – 1,345 –
Closing balance 61,583 4,338 161,536 4,164
Total gain for the year included in profit or loss 31,492 – – –
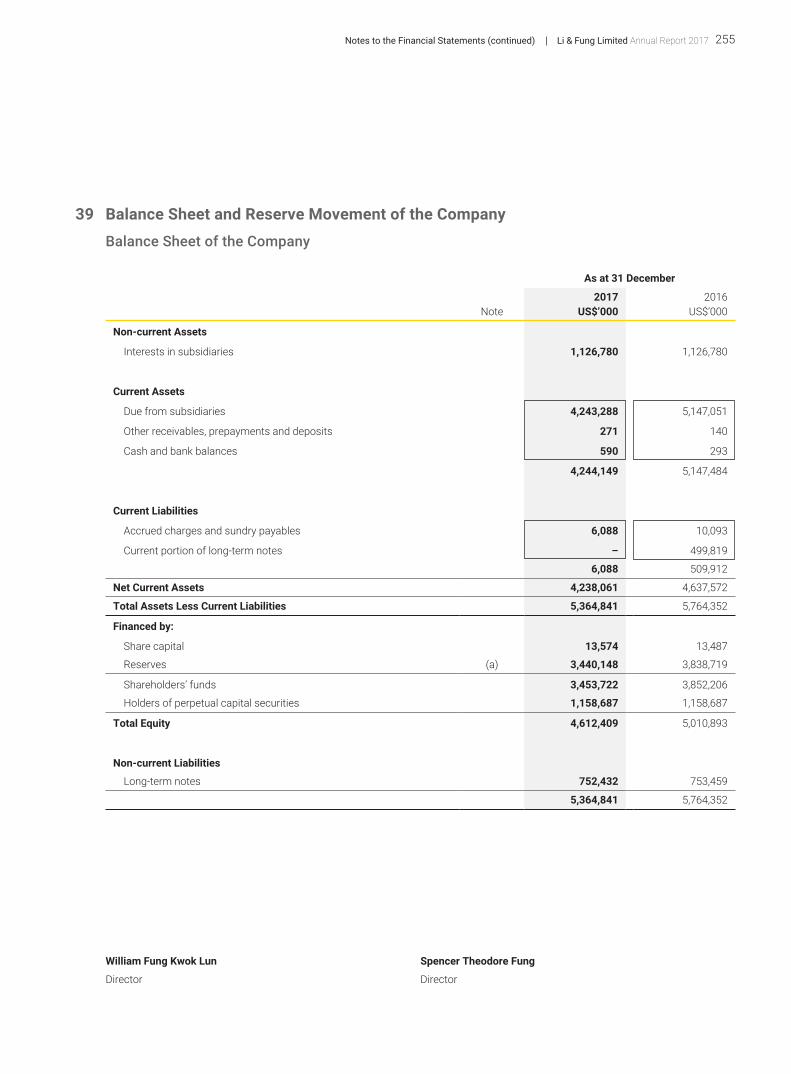
255Li & Fung Limited Annual Report 2017Notes to the Financial Statements (continued)
39 Balance Sheet and Reserve Movement of the Company
Balance Sheet of the Company
As at 31 December
2017 2016Note US$’000 US$’000
Non-current Assets
Interests in subsidiaries 1,126,780 1,126,780
Current Assets
Due from subsidiaries 4,243,288 5,147,051
Other receivables, prepayments and deposits 271 140
Cash and bank balances 590 293
4,244,149 5,147,484
Current Liabilities
Accrued charges and sundry payables 6,088 10,093
Current portion of long-term notes – 499,819
6,088 509,912
Net Current Assets 4,238,061 4,637,572
Total Assets Less Current Liabilities 5,364,841 5,764,352
Financed by:
Share capital 13,574 13,487
Reserves (a) 3,440,148 3,838,719
Shareholders’ funds 3,453,722 3,852,206
Holders of perpetual capital securities 1,158,687 1,158,687
Total Equity 4,612,409 5,010,893
Non-current Liabilities
Long-term notes 752,432 753,459
5,364,841 5,764,352
William Fung Kwok Lun Spencer Theodore Fung
Director Director

Li & Fung Limited Annual Report 2017256 Notes to the Financial Statements (continued)
39 Balance Sheet and Reserve Movement of the Company (continued)
(a) Reserve Movement of the Company
SharePremium
Treasury Shares
ContributionSurplus
EmployeeShare-based
CompensationReserve
RetainedEarnings Total
US$’000 US$’000 US$’000 US$’000 US$’000 US$’000(Note 25 (iii)) (Note (i))
Balance at 1 January 2017 714,536 (11,653) 974,189 65,749 2,095,898 3,838,719
Loss for the year – – – – (163,313) (163,313)
Purchase of shares for Share Award Scheme – (1,706) – – – (1,706)
Issuance of shares for Share Award Scheme – (87) – – – (87)
Employee Share Option and Share Award Scheme:
– value of employee services – – – 16,735 – 16,735
– vesting of shares for Share Award Scheme 13,991 2,450 – (16,441) – –
2016 final dividend paid – – – – (130,136) (130,136)
2017 interim dividend paid – – – – (120,064) (120,064)
Balance at 31 December 2017 728,527 (10,996) 974,189 66,043 1,682,385 3,440,148
Balance at 1 January 2016 704,618 (13,300) 974,189 54,662 2,027,652 3,747,821
Profit for the year – – – – 354,707 354,707
Purchase of shares for Share Award Scheme – (12) – – – (12)
Employee Share Option and Share Award Scheme:
– value of employee services – – – 22,664 – 22,664
– vesting of shares for Share Award Scheme 9,918 1,659 – (11,577) – –
Transaction costs related to issuance of perpetual capital securities – – – – (4,500) (4,500)
2015 final dividend paid – – – – (162,670) (162,670)
2016 interim dividend paid – – – – (119,291) (119,291)
Balance at 31 December 2016 714,536 (11,653) 974,189 65,749 2,095,898 3,838,719
NOTE:(i) The contribution surplus of the Company represents:
(1) The difference between the nominal value of the Company’s shares issued in exchange for the issued ordinary shares of Li & Fung (B.V.I.) Limited and the value of net assets of the underlying subsidiaries acquired as at 2 June 1992 amounting to US$14,232,000. At Group level, the amount is reclassified into its components of reserves of the underlying subsidiaries.
(2) The difference between the issue price and the nominal value of the Company’s shares issued in connection with the acquisition of Colby in 2000 amounting to US$249,957,000. At Group level, the amount is set off against goodwill arising from the acquisition.
(3) Contributed surplus arises from the transfer from share premium of US$3,000,000,000 offset by the distribution in specie of US$2,290,000,000 in prior years.

257Li & Fung Limited Annual Report 2017Notes to the Financial Statements (continued)
40 Benefits and Interests of Directors (Disclosures Required by Section 383 of the Hong Kong Companies Ordinance (Cap. 622), Companies (Disclosure of Information about Benefits of Directors) Regulation (Cap. 622G) and HK Listing Rules)
(a) Directors’ and Chief Executive’s EmolumentsThe remuneration of every director and the chief executive is set out below:
For the year ended 31 December 2017:
Emoluments Paid or Receivable in respect of a Person’s Services as a Director, whether of the Company or its Subsidiary Undertaking:
Emoluments Paid or
Receivable in respect of
Director’s Other Services in Connection
with theManagement
of the Affairs of
the Company or its
Subsidiary UndertakingName Fees Salary
Discretionary Bonuses
Housing Allowance
AwardShares Gain
Estimated Money
Value of Other Benefits
Employer’s Contribution to
a Retirement Benefit
Scheme
Remunerations Paid or
Receivable in respect
of Accepting Office as Director Total
US$’000 US$’000 US$’000 US$’000 US$’000 US$’000 US$’000 US$’000 US$’000 US$’000(Note (i)) (Note (ii)) (Note (iii))
Executive Directors
William Fung Kwok Lun 39 618 1,453 – 16 – – – – 2,126
Spencer Theodore Fung 39 653 1,958 – 179 – 2 – – 2,831
Marc Robert Compagnon 39 603 1,736 34 152 – 2 – – 2,566
Non-executive Directors
Victor Fung Kwok King 58 – – – – – – – – 58
Paul Edward Selway-Swift (Note (iv)) 24 – – – – – – – – 24
Allan Wong Chi Yun 71 – – – – – – – – 71
Martin Tang Yue Nien 71 – – – – – – – – 71
Margaret Leung Ko May Yee 69 – – – – – – – – 69
Cheung Chih Tin (Note (v)) 26 – – – – – – – – 26
NOTES:(i) The amounts are accrued discretionary bonuses for 2017.
(ii) Award Shares gain is determined based on the market price at the vesting date.
(iii) Other benefits include mortgage interest subsidy.
(iv) Retired as Independent Non-executive Director with effect from 1 June 2017.
(v) Appointed as Independent Non-executive Director with effect from 14 July 2017.
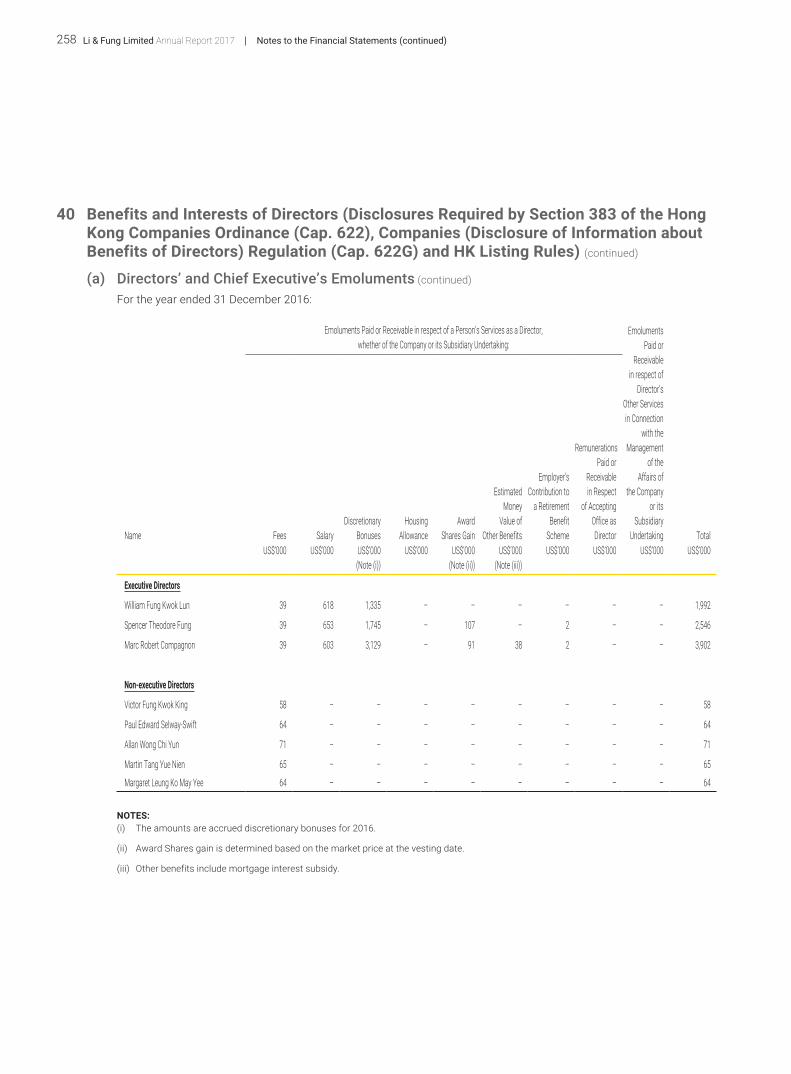
Li & Fung Limited Annual Report 2017258 Notes to the Financial Statements (continued)
40 Benefits and Interests of Directors (Disclosures Required by Section 383 of the Hong Kong Companies Ordinance (Cap. 622), Companies (Disclosure of Information about Benefits of Directors) Regulation (Cap. 622G) and HK Listing Rules) (continued)
(a) Directors’ and Chief Executive’s Emoluments (continued)
For the year ended 31 December 2016:
Emoluments Paid or Receivable in respect of a Person’s Services as a Director, whether of the Company or its Subsidiary Undertaking:
Emoluments Paid or
Receivable in respect of
Director’s Other Services in Connection
with theManagement
of the Affairs of
the Company or its
Subsidiary UndertakingName Fees Salary
Discretionary Bonuses
Housing Allowance
AwardShares Gain
Estimated Money
Value of Other Benefits
Employer’s Contribution to
a Retirement Benefit
Scheme
Remunerations Paid or
Receivable in Respect
of Accepting Office as Director Total
US$’000 US$’000 US$’000 US$’000 US$’000 US$’000 US$’000 US$’000 US$’000 US$’000(Note (i)) (Note (ii)) (Note (iii))
Executive Directors
William Fung Kwok Lun 39 618 1,335 – – – – – – 1,992
Spencer Theodore Fung 39 653 1,745 – 107 – 2 – – 2,546
Marc Robert Compagnon 39 603 3,129 – 91 38 2 – – 3,902
Non-executive Directors
Victor Fung Kwok King 58 – – – – – – – – 58
Paul Edward Selway-Swift 64 – – – – – – – – 64
Allan Wong Chi Yun 71 – – – – – – – – 71
Martin Tang Yue Nien 65 – – – – – – – – 65
Margaret Leung Ko May Yee 64 – – – – – – – – 64
NOTES:(i) The amounts are accrued discretionary bonuses for 2016.
(ii) Award Shares gain is determined based on the market price at the vesting date.
(iii) Other benefits include mortgage interest subsidy.

259Li & Fung Limited Annual Report 2017Notes to the Financial Statements (continued)
40 Benefits and Interests of Directors (Disclosures Required by Section 383 of the Hong Kong Companies Ordinance (Cap. 622), Companies (Disclosure of Information about Benefits of Directors) Regulation (Cap. 622G) and HK Listing Rules) (continued)
(a) Directors’ and Chief Executive’s Emoluments (continued)
During the year, no Share (2016: Nil) was issued to any Directors of the Company under the 2003 Option Scheme and 2014 Option Scheme.
As at 31 December 2017, certain Directors held the following Share Options to acquire Shares of the Company:
No. of Share Options Exercise Price Exercisable Period
12,000,000 (2016: 14,000,000) HK$12.121 Exercisable in six equal tranches during the period from 1/5/2016 to 30/4/2023 with each tranche having an exercisable period of two years
16,023,000 (2016: 16,023,000) HK$7.49 Exercisable in two equal tranches during the period from 1/1/2017 to 31/12/2019 with each tranche having an exercisable period of two years
NOTE:(1) Following the spin-off and separate listing of Global Brands, the exercise price applicable to the Share Options outstanding on the record
date for the distribution in specie (i.e. 7 July 2014) was adjusted from HK$14.50 to HK$12.12 with effect from 31 August 2014.
The closing market price of the Shares as at 29 December 2017 was HK$4.29.
(b) Directors’ Termination BenefitsNo termination benefit was provided to or receivable by any director during the year as compensation for the early termination of appointment (2016: None).
(c) Consideration Provided to Third Parties for Making Available Directors’ ServicesNo consideration was provided to or receivable by third parties for making available directors’ services (2016: None).
(d) Information about Loans, Quasi-Loans and other Dealings in Favour of Directors, Controlled Bodies Corporate by and Connected Entities with Such DirectorsThere are no loans, quasi-loans or other dealings in favour of directors, their controlled bodies corporate and connected entities (2016: None).
(e) Directors’ Material Interests in Transactions, Arrangements or ContractsNo significant transactions, arrangements and contracts in relation to the Group’s business to which the Company was a party and in which a director of the Company had a material interest, whether directly or indirectly, subsisted at the end of the year or at any time during the year.

Li & Fung Limited Annual Report 2017260 Notes to the Financial Statements (continued)
41 Events after Balance Sheet DateThe strategic divestment of the three Product Verticals was approved by the Independent Shareholders on 31 January 2018. The financial results for the three Product Verticals were presented as loss from Discontinued Operations on net basis. Comparatives for the year ended 31 December 2016 have been restated accordingly.
42 Approval of Financial StatementsThe financial statements were approved by the Board of Directors on 22 March 2018.
43 Principal Subsidiaries, Associated Companies and Joint Venture
Place ofIncorporation and Operation
Issued and FullyPaid Share Capital
Percentage ofEquity Held
by the Company Principal Activities
Note Principal Subsidiaries
Held Directly
(1) Integrated Distribution Services Group Limited
Bermuda Ordinary US$12,000 100 Investment holding
(1) LF Centennial Limited British Virgin Islands Ordinary US$50,000 100 Investment holding
(1) LF Credit Limited Bermuda Ordinary US$12,000 100 Investment holding
Li & Fung (B.V.I.) Limited British Virgin Islands Ordinary US$400,010 100 Marketing services and investment holding
Held Indirectly
(1) AGI Logistics Foreign Holdings LLC U.S.A. Capital contribution US$1 100 Investment holding
Algreta Solutions Limited England Ordinary GBP10,527 100 Sale and distribution of security products
(1) Appleton Holdings Ltd. British Virgin Islands Ordinary US$1 100 Investment holding
(1) B.G.S. Limited Thailand Ordinary Baht 288,000 Preference Baht 712,000
100 Provision of laboratory services
Black Cat Fireworks Limited England Ordinary GBP15,500,000 100 Wholesaling
Camberley Enterprises Limited Hong Kong Ordinary HK$250,000 100 Manufacturing and trading
Camberley Trading Service (Shenzhen) Limited
The People’s Republic of China
RMB1,500,000 100 foreign-owned
enterprise
Export trading services
(1) Catalyst Direct Sarl France EUR10,000 100 Wholesaling
(1) Catalyst Tags Inc. U.S.A. Common stock US$10,000 100 Distribution
(1) Centennial (Luxembourg) S.a.r.l. Luxembourg EUR8,931,250 100 Investment holding
Character Direct Limited Hong Kong Ordinary HK$2 100 Design and marketing
Chuan Jui Chuan Logistics Co., Ltd. Taiwan NT$25,000,000 100 Transportation
Chuan Jui Fu Logistics Co., Ltd. Taiwan NT$25,000,000 100 Transportation
(1) Cobalt Fashion Holding Limited British Virgin Islands Ordinary US$100 62 Investment holding
Cobalt Fashion (Hong Kong) Limited (formerly known as LF Fashion (Hong Kong) Limited)
Hong Kong Ordinary HK$1 62 Export trading services

261Li & Fung Limited Annual Report 2017Notes to the Financial Statements (continued)
Place ofIncorporation and Operation
Issued and FullyPaid Share Capital
Percentage ofEquity Held
by the Company Principal Activities
Note Principal Subsidiaries
(1) Cobalt Fashion (Shenzhen) Limited The People’s Republic of China
RMB2,000,000 62 Export trading services
Cobalt Fashion Management Limited Hong Kong Ordinary HK$1 62 Investment holding
(1) Colby Group Holdings Limited British Virgin Islands Ordinary US$45,000 100 Investment holding
(1) Colby Property Holdings Limited British Virgin Islands Ordinary US$1 100 Investment holding
Comet Feuerwerk GmbH Germany EUR1,000,000 100 Fireworks wholesaling
Concept 3 Limited Hong Kong Ordinary HK$2 100 Investment holding
(1) Covo Design (Dongguan) Co., Ltd. The People’s Republic of China
US$4,000,000 100 foreign-owned
enterprise
Sample production and exporting trading services
(1) Crimzon Rose Accessories (Shenzhen) Co. Ltd.
The People’s Republic of China
HK$1,500,000 100 foreign-owned
enterprise
Wholesaling
CS International Limited Hong Kong Ordinary HK$1,000,000 100 Provision of supply chain management and consultancy services
Definitive Sourcing (India) Private Limited India Rs100,000 100 Buying services for sourcing goods
(1) Direct Sourcing Group Holdings Limited British Virgin Islands Ordinary US$1 100 Investment holding
(1) Direct Sourcing Group Investment Limited British Virgin Islands Ordinary US$1 100 Investment holding
Direct Sourcing Group Pte. Ltd. Singapore Ordinary S$10,000 100 Export trading
Dodwell (Mauritius) Limited Hong Kong Ordinary “A” HK$300,000 Ordinary “B” HK$200,000
60 Export trading
(1) Dodwell (Singapore) Pte. Ltd. Singapore Ordinary S$200,000 100 Export trading
(1) Dongguan LF Beauty Manufacturing Services Limited
The People’s Republic of China
HK$11,220,000 100 foreign-owned
enterprise
Trading and manufacturing
(1) Dongguan LF Products Trading Limited The People’s Republic of China
RMB5,000,000 100 foreign-owned
enterprise
Sample design and exporting trading services
DSG (Bangladesh) Limited Bangladesh Ordinary TK$3,750,000 100 Export trading services
DSG (Hong Kong) Limited Hong Kong Ordinary HK$1 100 Provision of management support services
DSG (Shenzhen) Limited The People’s Republic of China
RMB3,000,000 100 foreign-owned
enterprise
Export trading services
43 Principal Subsidiaries, Associated Companies and Joint Venture (continued)

Li & Fung Limited Annual Report 2017262 Notes to the Financial Statements (continued)
Place ofIncorporation and Operation
Issued and FullyPaid Share Capital
Percentage ofEquity Held
by the Company Principal Activities
Note Principal Subsidiaries
(1) DSG (US) Inc. U.S.A. Common stock US$1 100 Sourcing service
Estuary Logistics Group Limited England Ordinary “A” GBP95 Ordinary “B” (Non-voting) GBP5
100 Investment holding
Estuary Logistics Limited England Ordinary “A” GBP200 Ordinary “B” (Non-voting) GBP100
100 Provision of logistics services
Far East Logistics (Shenzhen) Co. Ltd The People’s Republic of China
HK$1,500,000 100 foreign-owned
enterprise
Wholesaling
Fenix Fashion Limited Hong Kong Ordinary HK$1 62 Export trading
(1) Fireworks Holding Limited British Virgin Islands Ordinary US$1 100 Holding company
GMR (Hong Kong) Limited Hong Kong Ordinary HK$2 100 Export trading
(1) Golden Gate CAV, Ltd Cayman Islands Ordinary US$250 100 Investment holding
(1) Golden Gate Fireworks Inc. U.S.A. Common stock US$600,000 100 Commission agent and investment holding
(1) Golden Gate Holding Limited British Virgin Islands Ordinary US$1 100 Investment holding
Golden Horn N.V. Curacao US$6,100 100 Investment holding
Goodwest Enterprises Limited Hong Kong Ordinary HK$2 100 Export trading
GSCM (HK) Limited Hong Kong Ordinary HK$140,000 62 Export trading
(1) GSCM LLC U.S.A. Capital contribution US$1 62 Trading of apparel
Hanson Im-und Export GmbH Germany EUR26,000 100 Wholesaling
(1) Homeworks (Europe) B.V. The Netherlands Ordinary EUR18,000 100 Export trading
Homeworks Asia Limited Hong Kong Ordinary HK$2 100 Export trading
HTL Fashion (UK) Limited England Ordinary GBP1 100 Design and export trading
HTL Fashion Hazir Giyim Sanayi ve Ticaret Limited Sirketi
Turkey YTL25,000 100 Manufacturing
(1) IDS Group Limited British Virgin Islands Ordinary US$949,166 100 Investment holding
Imagine POS Limited Hong Kong Ordinary “A” HK$2,000,000 Ordinary “B” HK$757,471
100 Export trading
Imagine POS UK Limited England Ordinary GBP100 100 Cosmetic estate management services
International Sources Trading Limited Hong Kong Ordinary HK$2 100 Export trading
Jackel Cosmetics Limited Hong Kong Class “A” HK$9,950,645 Class “B” non-voting HK$13,890
100 Export trading
Jackel International (Asia) Limited Hong Kong Ordinary “A” HK$346,650 Ordinary “B” HK$86,850
100 Investment holding
43 Principal Subsidiaries, Associated Companies and Joint Venture (continued)

263Li & Fung Limited Annual Report 2017Notes to the Financial Statements (continued)
Place ofIncorporation and Operation
Issued and FullyPaid Share Capital
Percentage ofEquity Held
by the Company Principal Activities
Note Principal Subsidiaries
(1) Jackel, Inc. U.S.A. Class “A” voting common stock US$1Class “B” non-voting common stock US$99
100 Export trading
JV Cosmetics Company Limited Hong Kong Ordinary HK$1,000,000 100 Investment holding
Kariya Industries Limited Hong Kong Ordinary HK$1,000,000 100 Export trading
Lenci Calzature SpA Italy Equity shares EUR206,400 100 Design, marketing and sourcing
LF (Philippines), Inc. The Philippines Common shares Pesos 21,000,000 100 Provision of logistics services
(1) LF Americas Holding Limited British Virgin Islands Ordinary US$1 100 Investment holding
(1) LF Asia Direct Holding Limited British Virgin Islands Ordinary US$1 100 Investment holding
LF Asia Direct Management Limited Hong Kong Ordinary HK$1 100 Investment holding
(1) LF Beauty (Germany) Gmbh Germany EUR25,000 100 Investment holding
(1) LF Beauty (Shenzhen) Limited The People’s Republic of China
HK$8,500,000 100 foreign-owned
enterprise
Export trading services
LF Beauty (Thailand) Limited Thailand Ordinary Baht 469,500,000 100 Manufacturing of household, pharmaceutical and personal care products
LF Beauty (UK) Limited England Ordinary GBP100 100 Design, marketing and manufacturing
(1) LF Beauty France SAS France Ordinary EUR48,000 100 Export trading
(1) LF Beauty Holding Limited British Virgin Islands Ordinary US$1 100 Investment holding
(1) LF Beauty Inc. U.S.A. Common stock US$1 100 Investment holding
LF Beauty Limited Hong Kong Ordinary HK$1 100 Export trading
(1) LF Beauty Management Limited Hong Kong Ordinary HK$1 100 Investment holding
(1) LF Beauty Manufacturing China Co. Ltd.
The People’s Republic of China
HK$105,000,000 100foreign-owned
enterprise
Manufacturing and trading
LF Centennial Pte. Ltd. Singapore Ordinary S$100,000 100 Export trading services
LF Centennial Services (Hong Kong) Limited
Hong Kong Ordinary HK$1 100 Provision of management support services
43 Principal Subsidiaries, Associated Companies and Joint Venture (continued)

Li & Fung Limited Annual Report 2017264 Notes to the Financial Statements (continued)
Place ofIncorporation and Operation
Issued and FullyPaid Share Capital
Percentage ofEquity Held
by the Company Principal Activities
Note Principal Subsidiaries
(1) LF Corporate Capital (I) Limited British Virgin Islands Ordinary US$1 100 Investment holding
LF Credit Pte. Ltd. Singapore Ordinary S$1,000,000 100 Provision of trade-related credit services
(1) LF Distribution Holding Inc. U.S.A. Common stock US$1 100 Investment holding
LF Distribution International Holding Limited Hong Kong Ordinary US$1 100 Investment holding
(1) LF Distribution International Inc. U.S.A. Common stock US$1 100 Investment holding
(1) LF Distribution Limited Bermuda Ordinary US$100 100 Investment holding
LF Europe (Germany) Services GmbH Germany EUR25,000 100 Provision of accounting services
(1) LF Europe Holding Limited British Virgin Islands Ordinary US$1 100 Investment holding
LF Europe Limited England Ordinary GBP26,788,000 100 Investment holding
LF Europe Trading Limited England Ordinary GBP100 100 Service company
LF Fashion Pte. Ltd. Singapore Ordinary S$10,000 62 Export trading
LF Freight (Hong Kong) Limited Hong Kong Ordinary HK$2 100 Provision of management support services
(1) LF Furniture Holding Limited British Virgin Islands Ordinary US$1 100 Investment holding
(1) LF Furniture Management Limited Hong Kong Ordinary HK$1 100 Investment holding
(1) LF Furniture Holding (Europe) B.V. The Netherlands EUR1 100 Investment holding
(1) LF Furniture Holding Inc. U.S.A. US$1 100 Investment holding
LF Home Limited Hong Kong Ordinary HK$2 100 Export trading
(1) LF International Inc. U.S.A. Common stock US$30,002 100 Investment management
LF Logistics (Bangladesh) Limited Bangladesh Ordinary TK$10,000,000 100 Provision of freight forwarding services
LF Logistics (Cambodia) Limited Cambodia Ordinary Riels 20,000,000 100 Provision of freight forwarding and other logistics services
LF Logistics (China) Co., Ltd The People’s Republic of China
RMB50,000,000 100 foreign-owned
enterprise
Provision of freight forwarding and other logistics services
43 Principal Subsidiaries, Associated Companies and Joint Venture (continued)

265Li & Fung Limited Annual Report 2017Notes to the Financial Statements (continued)
Place ofIncorporation and Operation
Issued and FullyPaid Share Capital
Percentage ofEquity Held
by the Company Principal Activities
Note Principal Subsidiaries
(1) LF Logistics (Guangzhou) Co., Ltd. The People’s Republic of China
RMB10,000,000 100 foreign-owned
enterprise
Provision of logistics services
LF Logistics (Hong Kong) Limited Hong Kong Ordinary HK$10,000 100 Provision of logistics services
(1) LF Logistics (India) Private Limited India Ordinary Rs15,000,000 100 Logistics, supply chain management and freight forwarding
LF Logistics (Jiangsu) Co., Ltd. The People’s Republic of China
RMB10,000,000 100 foreign-owned
enterprise
Provision of logistics services
LF Logistics (Taiwan) Limited Hong Kong Ordinary HK$200 100 Provision of logistics and packaging services
LF Logistics (Thailand) Limited Thailand Ordinary Baht 307,750,000 100 Freight forwarding and other logistics services
LF Logistics (UK) Limited England Ordinary GBP25,050,000 100 Provision of logistics services
(1) LF Logistics (Vietnam) Company Limited Vietnam Charter capital US$300,000 100 Storage and Warehousing Services
LF Logistics Holding (Thailand) Limited Thailand Ordinary Baht 50,000,000 100 Investment holding
(1) LF Logistics Holding Limited British Virgin Islands Ordinary US$1 100 Investment holding
LF Logistics Holdings (UK) Limited England Ordinary GBP2 100 Investment holding
(1) LF Logistics Japan Limited Japan Ordinary JPY10,000,000 100 Provision of logistics services
(1) LF Logistics Korea Limited Korea Common stock KRW300,000,000 100 Provision of freight forwarding and other logistics services
(1) LF Logistics Limited Bermuda Ordinary US$100 100 Investment holding
LF Logistics Management Limited Hong Kong Ordinary HK$692,473,210 100 Provision of management and consultancy services
(1) LF Logistics Pakistan (Private) Limited Pakistan Ordinary Rs5,000,000 100 Provision of freight forwarding and other logistics services
LF Logistics Services (M) Sdn. Bhd. Malaysia Ordinary RM2,000,000 100 Provision of logistics services
LF Logistics Services Pte. Ltd. Singapore Ordinary S$28,296,962 100 Provision of freight forwarding, warehousing and distribution services, agency and supply chain management services
43 Principal Subsidiaries, Associated Companies and Joint Venture (continued)

Li & Fung Limited Annual Report 2017266 Notes to the Financial Statements (continued)
Place ofIncorporation and Operation
Issued and FullyPaid Share Capital
Percentage ofEquity Held
by the Company Principal Activities
Note Principal Subsidiaries
(1) LF Logistics USA LLC U.S.A. Capital contribution US$1 100 Provision of freight forwarding and other logistics services
(1) LF Men’s Group LLC U.S.A. Capital contribution US$1 100 Wholesaling
(1) LF Pegasus Limited British Virgin Islands Ordinary US$100 100 Investment Holding
LF Performance Services Sdn. Bhd. Malaysia Ordinary RM250,000 70 House Royal Custom’s bonded warehouse licence
LF Products (Hong Kong) Limited Hong Kong Ordinary HK$1 100 Provision of management support services
LF Products (Shanghai) Limited The People’s Republic of China
RMB5,000,000 100 foreign-owned
enterprise
Export, import and domestics trading
(1) LF Products International (Shanghai) Limited
The People’s Republic of China
RMB5,000,000 100 foreign-owned
enterprise
Export, import and domestics trading
LF Products Pte. Ltd. Singapore Ordinary S$10,000 100 Export trading
(1) LF Sourcing (Millwork) LLC U.S.A. Capital contribution US$1 100 Sourcing and export trading
(1) LF Sourcing Sportswear LLC U.S.A. Capital contribution US$1 100 Wholesaling
LFL Management (Thailand) Limited Thailand Ordinary Baht 10,000,000 100 Investment holding
LFL Services (Thailand) Limited Thailand Ordinary Baht 2,000,000 100 Investment holding
Licus Gmbh (formerly known as Phil Henson Gmbh)
Germany EUR50,000 100 Importer
(1) Li & Fung (Australia) Proprietary Limited Australia Ordinary AU$1 100 Marketing liaison
Li & Fung (Bangladesh) Limited Bangladesh Ordinary TK$9,500,000 100 Export trading services
(1) Li & Fung (Brasil) Trading, Importacao E Exportacao Ltda
Brazil Common shares R$333,559 100 Service provider
(1) Li & Fung (Cambodia) Limited Cambodia Ordinary Riels 120,000,000 100 Export trading services
(1) Li & Fung (Chile) Limitada Chile Chilean Pesos $5,500,000 100 Export trading
Li & Fung (Europe) Holding Limited England Ordinary GBP100 100 Investment holding
Li & Fung (Exports) Limited Hong Kong Ordinary HK$10,000Non-voting deferred HK$8,600,000
100 Investment holding
(1) Li & Fung (Guatemala) S.A. Guatemala Nominative shares Q5,000 100 Export trading services
(1) Li & Fung (Honduras) Limited Honduras Nominative common shares Lps25,000
100 Export trading services
Li & Fung (India) Private Limited India Equity shares Rs64,000,200 100 Export trading services
Li & Fung (Korea) Limited Korea Common stock KRW 200,000,000 100 Export trading services
43 Principal Subsidiaries, Associated Companies and Joint Venture (continued)

267Li & Fung Limited Annual Report 2017Notes to the Financial Statements (continued)
Place ofIncorporation and Operation
Issued and FullyPaid Share Capital
Percentage ofEquity Held
by the Company Principal Activities
Note Principal Subsidiaries
(1) Li & Fung (Mauritius) Limited Mauritius “A” Shares Rs750,000 “B” Shares Rs500,000
60 Export trading services
(1) Li & Fung (Morocco) SARL Morocco Ordinary Dirhams10,000 100 Export trading services
(1) Li & Fung (Nicaragua), Sociedad Anonima Nicaragua Nominative shares C$500,000 100 Export trading
(1) Li & Fung (Philippines) Inc. The Philippines Common shares Peso 1,000,000 100 Export trading services
(1) Li & Fung (Portugal) Limited England Ordinary GBP100 100 Investment holding
(1) Li & Fung (Singapore) Private Limited Singapore Ordinary S$25,000 100 Export trading services
Li & Fung (Taiwan) Limited Taiwan NT$175,000,000 100 Sourcing and inspection
(1) Li & Fung (Thailand) Limited Thailand Ordinary Baht 20,000,000 100 Export trading services
Li & Fung (Trading) Limited Hong Kong Ordinary HK$200 Non-voting deferred HK$10,000,000
100 Export trading services and investment holding
(1) Li & Fung (Vietnam) Limited Vietnam Charter capital US$800,000 100 Export trading services
Li & Fung Agencia de Compras em Portugal, Limitada
Portugal EUR99,759.58 100 Export trading services
Li & Fung Foundation Limited Hong Kong – 100 Charity
(1) Li & Fung Mexico S.A. de C.V. Mexico Common nominative shares MXP150,000
100 Service and import trading
Li & Fung Mumessillik Pazarlama Limited Sirketi
Turkey YTL45,356,100 100 Export trading services
(1) Li & Fung Pakistan (Private) Limited Pakistan Ordinary Rs10,000,000 100 Export trading services
Li & Fung South Africa (Proprietary) Limited South Africa Ordinary Rand 100 100 Export trading services
Li & Fung Taiwan Holdings Limited Taiwan NT$287,996,000 100 Investment holding
(1) Li & Fung Trading (Italia) S.r.l. Italy EUR100,000 100 Export trading services
Li & Fung Trading (Shanghai) Limited The People’s Republic of China
RMB50,000,000 100 foreign-owned
enterprise
Export trading
(1) Li & Fung Trading Service (Guangzhou) Limited
The People’s Republic of China
RMB10,000,000 100 foreign-owned
enterprise
Export trading services
Li & Fung Trading Service (Shanghai) Company Limited
The People’s Republic of China
US$6,000,000 100 foreign-owned
enterprise
Export trading services
Li & Fung Trading Service (Shenzhen) Limited
The People’s Republic of China
RMB3,000,000 100 foreign-owned
enterprise
Export trading services
43 Principal Subsidiaries, Associated Companies and Joint Venture (continued)

Li & Fung Limited Annual Report 2017268 Notes to the Financial Statements (continued)
Place ofIncorporation and Operation
Issued and FullyPaid Share Capital
Percentage ofEquity Held
by the Company Principal Activities
Note Principal Subsidiaries
(1) Li & Fung Trading Services (Malaysia) Sdn. Bhd.
Malaysia Ordinary RM 500,000 100 Sourcing services
Lighthouse Asia Limited Hong Kong Ordinary HK$10,000 100 Investment holding
Lion Rock (Hong Kong) Limited Hong Kong Ordinary HK$10,000 100 Investment holding
Lion Rock Far East (1972) Limited Hong Kong Ordinary HK$20 100 Investment holding
Lion Rock International Trading & Co. Hong Kong Capital contribution HK$3,000,000 100 Provision of management services
Lion Rock Services (Far East) & Co. Hong Kong Capital contribution HK$17,000,000 100 Merchandising agent
Lion Rock Services (Switzerland) AG Switzerland CHF3,400,000 100 Export trading services
Lloyd Textile Trading Limited Hong Kong Ordinary HK$1,000,000 100 Manufacturing and trading
Lornamead Acquisitions Limited England Ordinary GBP1,000 100 Investment holding
Lornamead GmbH Germany EUR25,000 100 Manufacturing of perfumes and toilet preparations
Lornamead Group Limited England Ordinary GBP1,000 100 Investment holding
(1) Lornamead Inc. U.S.A. Common stock US$5.96 100 Wholesaling
Lornamead UK Limited England Ordinary GBP100 100 Manufacturing of perfumes and toilet preparations
(1) Macau CS Textile Limited Macau MOP$1,000,000 62 Provision of technical & advisory service on knitwear production
(1) Mercury (BVI) Holdings Limited British Virgin Islands Ordinary US$1 100 Investment holding
Meredith Associates Limited Hong Kong Ordinary US$1,327,932 100 Investment holding
(1) Mighty Hurricane Holdings Inc. U.S.A. Common stock US$100 100 Wholesaling
Miles Fashion Asia Pte. Ltd. Singapore Ordinary S$1 100 Export trading
Miles Fashion Group France EURL France EUR10,000 100 Wholesaling
(1) Miles Fashion USA, Inc. U.S.A. Common stock US$1,000 100 Importer
Miles GmbH Germany EUR11,000,000 100 Importer
(1) Millwork Holdings Co., Inc. U.S.A. Common stock US$1 100 Investment holding
Modium Konfeksiyon Sanayi ve Ticaret Anonim Sirketi
Turkey A Shares YTL2,249,975 B Shares YTL25
100 Manufacturing
Ningbo Zhicheng Customs Brokerage Co., Ltd.
The People’s Republic of China
RMB1,500,000 100 Provision of Customs brokerage services
(1) P.T. Lifung Indonesia Indonesia Ordinary US$500,000 100 Export trading services
Paco Trading (International) Limited Hong Kong Ordinary HK$2 100 Export trading
43 Principal Subsidiaries, Associated Companies and Joint Venture (continued)

269Li & Fung Limited Annual Report 2017Notes to the Financial Statements (continued)
Place ofIncorporation and Operation
Issued and FullyPaid Share Capital
Percentage ofEquity Held
by the Company Principal Activities
Note Principal Subsidiaries
(1) PATCH Licensing LLC U.S.A. Capital contribution US$1 66.67 Export trading services
Perfect Trading Inc. Egypt LE2,480,000 60 Export trading services
Peter Black Footwear & Accessories Limited England Ordinary GBP202,000 100 Design, marketing and sourcing
Peter Black Holdings Limited England Ordinary GBP0.25 100 Investment holding
Peter Black International Limited England Ordinary GBP0.01 100 Investment holding
Peter Black Overseas Holdings Limited England Ordinary GBP2 100 Investment holding
Product Development Partners Limited Hong Kong Ordinary HK$2 100 Export trading
PromOcean France SAS France EUR4,030,303 100 Wholesaling
PromOcean GmbH Germany EUR25,570 100 Wholesaling
PromOcean No 1 Limited England Ordinary GBP1 100 Investment holding
PromOcean Spain SL Spain EUR3,005.06 100 Wholesaling
PromOcean The Netherlands B.V. The Netherlands EUR39,379.5 100 Wholesaling
PromOcean UK Limited England Ordinary GBP1 100 Wholesaling
(1) PT Direct Sourcing Indonesia Indonesia Ordinary US$250,000 100 Export trading services
PT. LF Beauty Manufacturing Indonesia Indonesia Ordinary Rp453,600,000 100 Manufacturing of personal care,household and cosmetic products
(1) PT. LF Services Indonesia Indonesia Ordinary Rp5,000,000,000 100 Logistics, transport and other services
(1) Ralsey Group Ltd. U.S.A. Common stock US$1 62 Wholesaling
(1) Ratners Enterprises Ltd. British Virgin Islands Ordinary US$1 100 Investment holding
(1) Region Giant Holdings Limited British Virgin Islands Ordinary US$31 100 Investment holding
RMS Trading GmbH Germany EUR25,000 100 General trading of merchandise
RT Sourcing (Shenzhen) Limited The People’s Republic of China
HK$1,000,000 100 foreign-owned
enterprise
Export trading services
Shanghai IDS Distribution Co., Ltd. The People’s Republic of China
US$3,100,000 100 foreign-owned
enterprise
Storage and logistic transportation management
(1) Shenzhen Catalyst Trading Co., Ltd. The People’s Republic of China
US$120,000 100 foreign-owned
enterprise
Security tag trading
Shiu Fung Fireworks Company Limited Hong Kong Ordinary “A” HK$1,100,000 Ordinary “B” HK$1,100,000
100 Export trading
Shiu Fung Fireworks Trading (Changsha) Limited
The People’s Republic of China
RMB4,000,000 100 foreign-owned
enterprise
Export trading
Silvereed (Hong Kong) Limited Hong Kong Ordinary HK$1 100 Export trading
43 Principal Subsidiaries, Associated Companies and Joint Venture (continued)

Li & Fung Limited Annual Report 2017270 Notes to the Financial Statements (continued)
Place ofIncorporation and Operation
Issued and FullyPaid Share Capital
Percentage ofEquity Held
by the Company Principal Activities
Note Principal Subsidiaries
(1) Simkar 2 Limited Cayman Islands Ordinary US$50,000 100 Investment holding
(1) Simkar Limited Cayman Islands Ordinary US$49,999.75 100 Investment holding
Sky Million International Limited Hong Kong Ordinary HK$2 100 Property investment
South Ocean Knitters Limited Hong Kong Ordinary HK$94,678,000 62 Trading of sweater
(1) STS Shenzhen Testing Service Limited The People’s Republic of China
US$660,000 100 foreign-owned
enterprise
Testing and technology consultation
(1) Tantallon Enterprises Limited British Virgin Islands Ordinary US$1 100 Investment holding
Texnorte II – Industrias Texteis, Limitada Portugal EUR5,000 100 Export trading services
Texnorte Industrial Limited Hong Kong Ordinary HK$2 100 Export trading
(1) Toy Island (USA) LLC U.S.A. Capital contribution US$100 100 Marketing
Visage Group Limited England Ordinary GBP100,000 100 Investment holding
Visage Holdings (2010) Limited England Ordinary GBP2 100 Investment holding
Visage Limited England Ordinary GBP54,100 100 Design, marketing and sourcing
W S Trading Limited Hong Kong Ordinary HK$1,000,000 100 Export trading
Whalen Limited Hong Kong Ordinary HK$62,000,000 100 Design and marketing
(1) Whalen LLC U.S.A. Capital contribution US$1 100 Wholesaling
Wilson Textile Limited Hong Kong Ordinary HK$1 100 Export trading
(1) Zhuhai Fong Ying Textiles Trading Co. Ltd.
The People’s Republic of China
HK$10,000,000 62 Trading of sweater
NOTE:(1) Subsidiaries not audited by PricewaterhouseCoopers. The aggregate net assets of subsidiaries not audited/reviewed by PricewaterhouseCoopers
amounted to less than 5% of the Group’s total net assets.
The above table lists out the principal subsidiaries of the Company as at 31 December 2017 which, in the opinion of the directors, principally affected the results for the year or form a substantial portion of the net assets of the Group. To give details of other subsidiaries would, in the opinion of the directors, result in particulars of excessive length.
43 Principal Subsidiaries, Associated Companies and Joint Venture (continued)

271Li & Fung Limited Annual Report 2017Notes to the Financial Statements (continued)
43 Principal Subsidiaries, Associated Companies and Joint Venture (continued)
Place ofIncorporationand Operation
Issued and FullyPaid Share Capital
Percentage ofEquity Indirectly
Held bythe Company Principal Activities
Note Principal Associated Companies
Blue Work Trading Company Limited Hong Kong Ordinary HK$4,000,000 50 Export trading# Fireworks Management, Inc. U.S.A. Common stock US$60,000 25 Investment holding# Gulf Coast Fireworks Sales, LLC U.S.A. Capital contribution US$3,198,308 30 Fireworks wholesaling# Marshall Fireworks, Inc. U.S.A. Common stock US$10,000 30 Convenience and store# Ningbo Penavico-CCL International
Freight Forwarding Co., Ltd.The People’s
Republic of ChinaUS$1,000,000 40 Provision of freight
forwarders services# Winco Fireworks International, LLC U.S.A. Capital contribution US$11,838,364 30 Wholesaling# Winco Fireworks Mississippi, LLC U.S.A. Capital contribution US$331,494 30 Wholesaling# Winco of Tennessee, LLC U.S.A. Capital contribution US$224,302 30 Fireworks wholesaling
and retailing
Note Joint Venture
* Red Sun Company Limited The People’s Republic of China
RMB48,000,000 20 Domestic and export trading
# The associated companies are not audited by PricewaterhouseCoopers.
* The joint venture is not audited by PricewaterhouseCoopers.
Although the Group owns less than half of the equity interests in Red Sun Company Limited, it is able to exercise joint control by virtue of an agreement with other investors.
The above table lists out the principal associated companies and joint venture of the Company as at 31 December 2017 which, in the opinion of the directors, principally affected the results for the year or form a substantial portion of the net assets of the Group. To give details of other associated companies would, in the opinion of the directors, result in particulars of excessive length.
Related Documents