(LF) Fund of Funds A mutual investment fund organised under the laws of the Grand Duchy of Luxembourg Audited Annual Report December 31, 2015 RCS Number: B115125 No subscription can be received on the basis of financial reports. Subscriptions are only valid if made on the basis of the current prospectus accompanied by the latest annual report and the most recent semi-annual report, if published thereafter. Past performance is not necessarily an indication of future performance.

Welcome message from author
This document is posted to help you gain knowledge. Please leave a comment to let me know what you think about it! Share it to your friends and learn new things together.
Transcript

(LF) Fund of Funds A mutual investment fund organised under the laws
of the Grand Duchy of Luxembourg
Audited Annual Report December 31, 2015
RCS Number: B115125
No subscription can be received on the basis of financial reports. Subscriptions are only valid if made on the basis of the current prospectus accompanied by the latest annual report and the most recent semi-annual report, if published thereafter. Past performance is not necessarily an indication of future performance.
2
Table of Contents Organisation of the Fund 3 Board of Directors of the Management Company 4 Activity Report 5 Audit Report 11 Statement of Net Assets 13 Statement of Operations 15 Statement of Changes in Net Assets 17 Schedule of investments
• (LF) Fund of Funds - Balanced Blend Europe 19 • (LF) Fund of Funds - Equity Blend 20 • (LF) Fund of Funds - Global Emerging Market 21 • (LF) Fund of Funds - Balanced Blend Global 22 • (LF) Fund of Funds - Real Estate 23 • (LF) Fund of Funds - Dynamic Fixed Income 24 • (LF) Fund of Funds - Global Low 25 • (LF) Fund of Funds - Global Medium 26 • (LF) Fund of Funds - Global High 27 • (LF) Fund of Funds - Balanced Blend US 28 • (LF) Fund of Funds - Tactical Allocation 29
Notes to the financial statements 30 Further unaudited information 37

3
(LF) Fund of Funds Organisation of the Fund Management Company Eurobank Fund Management Company (Luxembourg) S.A. 5, rue Jean Monnet L-2180 Luxembourg Grand Duchy of Luxembourg
Custodian, Administrative, Registrar, Transfer, Luxembourg Paying and Domiciliation Agent Eurobank Private Bank Luxembourg S.A. 5, rue Jean Monnet L-2180 Luxembourg Grand Duchy of Luxembourg Investment Manager Eurobank Asset Management Mutual Fund Management Company S.A. 10, Stadiou Str., GR 105 64 Athens Greece
Auditor PricewaterhouseCoopers, Société coopérative 2, rue Gerhard Mercator B.P. 1443 L-1014 Luxembourg Grand Duchy of Luxembourg Distributor Eurobank Ergasias S.A. 8, Othonos Street 10557 Athens Greece

4
(LF) Fund of Funds Board of Directors of the Management Company Mr. Theofanis Mylonas (Since 8th May 2015) Chairman Chief Executive Officer Chairman of the Board of Directors Eurobank Asset Management Mutual Fund Management Company S.A., Greece Mr. Ioannis Kontopoulos (Until 8 th May 2015) Chairman Chief Executive Officer Chairman of the Board of Directors Eurobank Asset Management Mutual Fund Management Company S.A., Greece Mr. Agamemnon Kotrozos Vice Chairman Chief executive Officer Eurobank Fund Management Company (Luxembourg) S.A., Grand Duchy of Luxembourg Mr. Georgios Vlachakis Director Managing Director Eurobank Fund Management Company (Luxembourg) S.A., Grand Duchy of Luxembourg Mr. Dimosthenis Archontidis (Since 20th February 2015) Director General Manager Global Markets & Wealth Management Eurobank Ergasias S.A., Greece Mr. Fokion Karavias (Until 20th February 2015) Director General Manager Capital Markets & Wealth Management Eurobank Ergasias S.A., Greece Mrs. Eleni Koritsa Director Deputy Chief Executive Officer Eurobank Asset Management Mutual Fund Management Company S.A., Greece

5
Activity Report As at December 31, 2015 (LF) Fund of Funds - Balanced Blend Europe
During 2015, most major asset classes rallied. Property/REITS outperformed followed by Global Equities and Euro Bonds while Cash and Commodities had an overall negative return in Euro terms. Over the same period, European equities underperformed Global equities. Europe’s equity markets peaked in April and then corrected on concerns about global growth, the burst of the Chinese domestic equity bubble and the Eurozone crisis. The drift by mid-July turned into a massive sell-off during August as the renminbi depreciation heightened concerns about Chinese and EM growth as well as the looming US rates decision. Sentiment recovered in October after the Fed’s decision to delay the rate hikes. The year-end rally ended in December with another selloff. The broader Bond market had a similar pattern. Peeked in April, sold off to June-July and then embarked for a second half rally before giving back some gains in December. Volatility awakens is the subtitle for 2015. The (LF) Fund of Funds - Balanced Blend Europe/Eurobank class recorded an annual return of +6.13% for the year ending 31/12/2015, exceeding the performance of the composite index used as the FOF’s Benchmark (50% MSCI EUROPE + 50% BofA ML EMU BROAD MARKET INDEX). We have tried to keep the sub-fund invested as new money flowed in, particularly during the first quarter of the year. During the year, we have favored equities over bonds and thus the portfolio was primarily underweight in bonds. Over the twelve months ending 31/12/2015 average equity and fixed-income exposure was 48.1% and 42.5% respectively.
(LF) Fund of Funds - Equity Blend
Global equities had yet another positive year in Euro terms in 2015. Global Equity markets had a strong start in the beginning of the year on the back of optimism for US growth, the announcement of ECB’s QE program and strong domestic inflows into Chinese equities markets. Markets peaked in April and then corrected on concerns about global growth, the burst of the Chinese domestic equity bubble and the Eurozone crisis. The drift turned into a sell-off during August as the renminbi depreciation heightened concerns about Chinese and EM growth as well as the looming US rates decision. Sentiment recovered in October after the Fed’s decision to delay the rate hikes. Markets resumed their slide in December. The strengthening of the USD flattered the flat performance of the US large cap indices and helped them to outperform European markets in Euro terms despite the positive performance of the later. Japan was the best performing developed market. The main underperformers were the Emerging Markets, beset by falling commodity prices, currency volatility, and decelerating growth. The (LF) Fund of Funds - Equity Blend/Eurobank class returned +9.97% in the year ending 31/12/2015, better than the composite index used as the fund’s benchmark (90% MSCI ACWI +10% EONIA TR INDEX). During the year the average Equity exposure was around 91.4% slightly above that of the benchmark. We kept and increased overall market position in equities during the first months of the year and then reduced positions to underweight levels in June. Exposure was increased again at the end of August and finally cut to underweight levels in December. Exposure to Europe and Japan remained at elevated levels for most of the year whereas exposure to US equities was initially underweight but then increased to overweight during the last quarter of the year. Exposure to Emerging Markets was further significantly reduced in November.

6
Activity Report As at December 31, 2015 (Continued)
(LF) Fund of Funds - Global Emerging Markets
2015 was a difficult year for Emerging Markets. After a strong start, the MSCI Emerging Markets Index peaked in April and then corrected sharply during the summer. Then, after stabilizing in September, it staged a moderate recovery rally in October but then started drifting again by mid November to year-end. The negative price action was compounded by the depreciation of most EM currencies against the USD and eventually the Euro. Among the main factors that have negatively affected Emerging Markets were the fall of commodity prices, concerns about growth in China, currency volatility, fears about the liquidity effect of tighter financial conditions in the US as well as local macro imbalances. For yet another year there was a wide dispersion of returns among markets although the overall picture was clearly negative. The effects of falling oil and other commodity prices had a major negative effect on commodity producers (Brazil, South Africa, and Indonesia). In China flows from domestic investors fuelled a domestic equities rally which drove valuations to excessive levels. A sharp correction ensued in the summer months triggered by the depreciation of the renminbi and concerns about the sustainability of the growth rates. Chinese shares in Hong Kong were less volatile but followed the direction of the domestic market. India was among the outperformers on strong growth and reform expectations, the market outperformed during the sharp summer correction and demonstrated lower volatility. Russia was among the main outperformers in the first half of the year. However, low oil prices had a negative effect in the second half of the year. Low valuations and decent growth led to the outperformance of South Korea. Brazil was among the main underperformers as the economy remained mired in recession.
The (LF) Fund of Funds - Global Emerging Markets/Eurobank class had a -1.55% total return in 2015 considerably better than that of the MSCI Emerging Markets Index in Euro terms. On average, the fund had a 92.3% exposure to EM Equities, with allocations picking in May and in September. Positions were reduced during June and finally in December. China was the main overweight position until June when India became the main overweight position. Positions in Asian Markets were reduced in June and increased again between the end of August and September. The main overweight positions during 2015 were India, China and South Korea.
(LF) Fund of Funds - Balanced Blend Global
During 2015, most major asset classes rallied. Property/REITS outperformed for yet another year followed by Global Equities and Euro Bonds while Cash and Commodities had an overall negative return in Euro terms. Over the same period, US and Japanese equities outperformed European and GEM ones as well as Euro bonds at large. Global equity markets twin peaked both in April and May but then corrected heavily on concerns about global growth, the burst of the Chinese domestic equity bubble and the Eurozone crisis. During August, the renminbi depreciation heightened concerns about Chinese and EM growth and a looming US rates decision helped accelerate the sell-off. Sentiment recovered in early October and after the Fed’s decision to delay the rate hikes. This last quarter rally ended in November. The broader Bond market had a similar pattern. Peeked in April, sold off to June-July and then embarked for a second half rally before giving back some gains in December. Commodities had a terrible year with oil losing almost 1/3 of its value in the twelve months ending 31/12/2015. Volatility awakens is the subtitle for 2015. (LF) Fund of Funds – Balanced Blend Global/Eurobank class recorded a +3.44% annual return in 2015, exceeding its composite index used as a benchmark (40% MSCI AC WORLD + 45% BofA ML EMU BROAD MARKET INDEX + 10% BLOOMBERG COMMODITY INDEX + 5% FTSE EPRA/NAREIT DEVELOPED INDEX).

7
Activity Report As at December 31, 2015 (Continued) (LF) Fund of Funds - Balanced Blend Global (continued) We started the year with an underweight position in equities in anticipation of a market correction. As this didn't materialize we increased allocation in equities. For most of 2015 we kept an overweight position in equities and an underweight one in fixed income and commodities. The overweight position in equities was reduced to underweight by the end of the year, starting October. During the year, we were barely underweight in US equities, neutral to overweight in European equities and clearly overweight in Japanese ones. Exposure to Japanese equities was reduced close to neutral levels towards the end of the year. Within fixed income, we were overweight in exposure to corporate bonds and high yields versus an underweight in sovereigns. Over the twelve months ending 31/12/2015 average equity and fixed-income exposure was 39.6% and 36.3% respectively. At the same time, we kept an underweight position in commodities (average exposure 4.8%) and a slightly overweight position in real estate securities which was reduced to neutral during the second half of the year (average exposure 5%)
(LF) Fund of Funds - Real Estate
Real Estate securities had a comparable performance to Global Equities in 2015, as correlation with other sectors increased. The asset class had a particularly strong start in the year during January that coincided with the announcement of ECB’s QE policy. Real Estate securities prices peaked in April and then entered a period of correction which was particularly sharp during August. Share prices recovered during the last quarter of the year. European Real Estate securities prices outperformed during the first half of the year on ECB’ loose monetary stance. US Real Estate securities were the clear winner during the last quarter of the year, helped by the delay in the Fed’s decision to raise rates. Asian Real Estate securities participated in the broader Asian equities rally of first five months of the year but were the clear underperformer for the rest of the year, erasing all their gains. The (LF) Fund of Funds Real Estate Eurobank class returned +8.52% in 2015 outpacing the composite index used as the fund’s benchmark (50% FTSE/EPRA NAREIT Developed + 50% FTSE/EPRA NAREIT N. America). On average the fund had a 93.9% exposure to Real Estate equities. For most of 2015 we kept an overweight position in European RE equities (average overweight exposure 4.4%). Exposure to Asian RE equities was elevated to overweight until July and then reduced to underweight for the rest of the year. Exposure to US/North American RE equities has remained in underweight territory throughout the year although increased (less underweight) during the second half bringing the average underweight exposure to -14.7% versus the benchmark implied exposure. Overall, exposure was reduced in November.
(LF) Fund of Funds - Dynamic Fixed Income
Global bonds markets advanced modestly in 2015 as investors awaited the Fed’s rate hike decision. On this side of the Atlantic, the ECB's stimulus measures sparked a debt rally for much of the year that pushed down yields for many government and corporate bonds. By mid-year, the trend reversed as most high yield and emerging market debt sectors declined on global growth deceleration fears heightened by the renminbi depreciation.

8
Activity Report As at December 31, 2015 (Continued) (LF) Fund of Funds - Dynamic Fixed Income (continued) (LF) Fund of Funds - Dynamic Fixed Income invests in at least 10 of the top ranked fixed income funds according to our selection process and unless required, each of the selected investment carries an equal weight (at rebalancing). Rebalancing takes place at least four times a year, within the first month of each calendar quarter, or more often if so is deemed necessary.
Throughout the year we remained fully invested, allocating between 93 and 98% of the sub-fund’s total assets in the selected funds. That, according to our look through analysis with Morningstar data, led to an average exposure of almost 75.2% in bonds. The sub-fund, Eurobank I class, recorded a +5.78% return during the year ending 31/12/2015, lagging the performance of the benchmark index (BOFA ML GLOBAL BROAD MARKET INDEX).
(LF) Fund of Funds - Global Low
During 2015, most major asset classes rallied. Property/REITS outperformed for yet another year followed by Global Equities and Euro Bonds while Cash and Commodities had an overall negative return in Euro terms. Over the same period, US and Japanese equities outperformed European and GEM ones as well as Euro bonds at large. Global equity markets twin peaked both in April and May but then corrected heavily on concerns about global growth, the burst of the Chinese domestic equity bubble and the Eurozone crisis. During August, the renminbi depreciation heightened concerns about Chinese and EM growth and a looming US rates decision helped accelerate the sell-off. Sentiment recovered in early October and after the Fed’s decision to delay the rate hikes. This last quarter rally ended in late November. The broader Bond market had a similar pattern. Peeked in April, sold off to June-July and then embarked for a second half rally before giving back some gains in December. Commodities had a terrible year with oil losing almost 1/3 of its value in the twelve months ending 31/12/2015. Volatility awakens is the subtitle for 2015. The sub-fund’s Eurobank class recorded an annual return of 0.41% for the year ending December 31, 2015, slightly lower than the composite index used as the sub-fund’s benchmark (10% MSCI AC WORLD + 25% BofA ML EMU BROAD MARKET INDEX + 65% EONIA TR INDEX). At the beginning of the year, the fund had an underweight exposure in equities which we increased close to neutral soon after January. During the last quarter of the year, exposure in equities further increased to overweight and then reduced to underweight by year-end. The average exposure in equities was kept between 7.9% and 13.1%. During the year, we were gradually increasing exposure to bonds from 26.2% to 37.2% thus staying overweight but with very low duration, much lower compared to one implied by the benchmark.
(LF) Fund of Funds - Global Medium
During 2015, most major asset classes rallied. Property/REITS outperformed for yet another year followed by Global Equities and Euro Bonds while Cash and Commodities had an overall negative return in Euro terms. Over the same period, US and Japanese equities outperformed European and GEM ones as well as Euro bonds at large. Global equity markets twin peaked both in April and May but then corrected heavily on concerns about global growth, the burst of the Chinese domestic equity bubble and the Eurozone crisis. During August, the renminbi depreciation heightened concerns about Chinese and EM growth and a looming US rates decision helped accelerate the sell-off. Sentiment recovered in early October and after the Fed’s decision to delay the rate hikes. This last quarter rally ended in late November. The broader Bond market had a similar pattern. Peeked in April, sold off to June-July and then embarked for a second half rally before giving back some gains in December. Commodities had a terrible year with oil losing almost 1/3 of its value in the twelve months ending 31/12/2015. Volatility awakens is the subtitle for 2015.

9
Activity Report As at December 31, 2015 (Continued)
(LF) Fund of Funds - Global Medium (continued)
The sub-fund’s Eurobank class recorded a 1.96% annual return for the year ending December 31, 2015, lower than the composite index used as the sub-fund’s benchmark (30% MSCI AC WORLD + 55% BofA ML EMU BROAD MARKET INDEX + 15% EONIA TR INDEX). At the beginning of the year, the fund had an underweight exposure in equities which we increased close to neutral soon after January. During the last quarter of the year, exposure in equities has further increased to marginally overweight and then reduced again by year-end. The average exposure in equities was kept between 25.6% and 31.4% while we were mostly underweight in bonds with the average exposure ranging between 44.3% and 51.3%. During the last quarter, the underweight exposure in bonds was significantly reduced.
(LF) Fund of Funds - Global High
During 2015, most major asset classes rallied. Property/REITS outperformed for yet another year followed by Global Equities and Euro Bonds while Cash and Commodities had an overall negative return in Euro terms. Over the same period, US and Japanese equities outperformed European and GEM ones as well as Euro bonds at large. Global equity markets twin peaked both in April and May but then corrected heavily on concerns about global growth, the burst of the Chinese domestic equity bubble and the Eurozone crisis. During August, the renminbi depreciation heightened concerns about Chinese and EM growth and a looming US rates decision helped accelerate the sell-off. Sentiment recovered in early October and after the Fed’s decision to delay the rate hikes.
This last quarter rally ended in late November. The broader Bond market had a similar pattern. Peeked in April, sold off to June-July and then embarked for a second half rally before giving back some gains in December. Commodities had a terrible year with oil losing almost 1/3 of its value in the twelve months ending 31/12/2015. Volatility awakens is the subtitle for 2015. The sub-fund’s Eurobank class recorded a 4.23% annual return, for the year ending December 31, 2015, lower than the composite index used as the sub-fund’s benchmark (65% MSCI AC WORLD + 30% BofA ML EMU BROAD MARKET INDEX + 5% EONIA TR INDEX). At the beginning of the year, the fund had an underweight exposure in equities which we increased close to neutral soon after January. During the last quarter of the year, exposure in equities has further increased to marginally overweight and then reduced again by year-end. The average exposure in equities was kept between 58.9% and 65.5%, mostly close to the benchmark while we were underweight in bonds with an average exposure between 18.6% and 27.4%. During the last quarter, the underweight exposure in bonds was significantly reduced.
(LF) Fund of Funds - Balanced Blend US
During 2015, most major asset classes rallied. Property/REITS outperformed followed by Global Equities and Global Bonds while Cash and Commodities had an overall negative return in Euro terms. Over the same period, US equities outperformed both Global equities and the bond market at large. US equity markets peaked in April but remained within a very tight range (in dollar terms) until mid-August and then they fall on concerns about global growth and the burst of the Chinese domestic equity bubble as the renminbi depreciation heightened global slowdown fears on top of a looming US rates decision. Sentiment recovered in October after the Fed’s decision to delay the rate hikes. The year-end rally ended early in December.

10
Activity Report As at December 31, 2015 (Continued) (LF) Fund of Funds - Balanced Blend US (continued) The broader USD aggregate market had a similar but more volatile pattern. Peeked in February and then again in April, sold off to mid June-July and then embarked for a second half rally before giving back some gains during the last quarter. Volatility awakens is the subtitle for 2015. (LF) Fund of Funds - Balanced Blend US/Eurobank class recorded a +9.36% annual return in 2015, lagging its composite index used as a benchmark (50% MSCI USA + 50% BofA ML US BROAD MARKET). We have tried to keep the sub-fund invested as new money flowed in, particularly during the first half of the year. During 2015, we have favoured equities over bonds and thus the portfolio was underweight in fixed income. Over the twelve months ending 31/12/2015 average equity and fixed-income exposure was 48.3% and 38.7% respectively.
(LF) Fund of Funds - Tactical Allocation
The sub-fund was launched on July 10th, 2015. The fund follows a tactical allocation strategy with a maximum VaR limit and is associated with no benchmark.
The figures stated in this report are historical and not necessarily indicative of future performance.
Luxembourg, April 20, 2016

PricewaterhouseCoopers, Société coopérative, 2 rue Gerhard Mercator, B.P. 1443, L-1014 Luxembourg
T: +352 494848 1, F:+352 494848 2900, www.pwc.lu
Cabinet de révision agréé. Expert-comptable (autorisation gouvernementale n°10028256) 11
R.C.S. Luxembourg B 65 477 - TVA LU25482518
Audit report To the Unitholders of (LF) Fund of Funds
We have audited the accompanying financial statements of (LF) Fund of Funds and of each of its sub-funds, which comprise the statement of net assets and the schedule of investments as at December 31, 2015 and the statement of operations and the statement of changes in net assets for the year then ended, and a summary of significant accounting policies and other explanatory notes to the financial statements. Responsibility of the Board of Directors of the Management Company for the financial statements The Board of Directors of the Management Company is responsible for the preparation and fair presentation of these financial statements in accordance with Luxembourg legal and regulatory requirements relating to the preparation of the financial statements and for such internal control as the Board of Directors of the Management Company determines is necessary to enable the preparation of financial statements that are free from material misstatement, whether due to fraud or error. Responsibility of the “Réviseur d’entreprises agréé” Our responsibility is to express an opinion on these financial statements based on our audit. We conducted our audit in accordance with International Standards on Auditing as adopted for Luxembourg by the “Commission de Surveillance du Secteur Financier”. Those standards require that we comply with ethical requirements and plan and perform the audit to obtain reasonable assurance about whether the financial statements are free from material misstatement. An audit involves performing procedures to obtain audit evidence about the amounts and disclosures in the financial statements. The procedures selected depend on the judgment of the “Réviseur d’entreprises agréé”, including the assessment of the risks of material misstatement of the financial statements, whether due to fraud or error. In making those risk assessments, the “Réviseur d’entreprises agréé” considers internal control relevant to the entity’s preparation and fair presentation of the financial statements in order to design audit procedures that are appropriate in the circumstances, but not for the purpose of expressing an opinion on the effectiveness of the entity’s
internal control. An audit also includes evaluating the appropriateness of accounting policies used and the reasonableness of accounting estimates made by the Board of Directors of the Management Company, as well as evaluating the overall presentation of the financial statements.

wc
We believe that the audit evidence we have obtained is sufficient and appropriate to provide a basis forour audit opinion.
Opinion
In our opinion, the financial statements give a true and fair view of the financial position of (LF) Fundof Funds and of each of its sub-funds as of December 81, 2o1S, and of the results of their operationsand changes in their net assets for the year then ended in accordance with Luxembourg legal andregulatory requirements relating to the preparation of the financial statements.
Othermqtters
Supplementary information included in the annual report has been reviewed in the context of ourmandate but has not been subject to specific audit procedures carried out in accordance with thestandards described above. Consequently, we e)ipress no opinion on such information. Howwer, wehave no observation to make concerning such information in the context of the financial statementstaken as a whole.
PricewaterhouseCoopers, Soci6t6 coop6rativeRepresented by
Luxembourg, April zo, zo16
GhThierryBlondeau
t2

Statement of Net AssetsAs at December 31, 2015
(LF) Fund of Funds (LF) Fund of Funds - Balanced Blend Europe
(LF) Fund of Funds - Equity Blend
(LF) Fund of Funds - Global Emerging
Market
(LF) Fund of Funds - Balanced Blend
Global
(LF) Fund of Funds - Real Estate
Combined
Currency Notes EUR EUR EUR EUR EUR EUR
Assets
Securities portfolio at market value 2 492 273 030.85 19 102 967.85 45 690 441.45 34 338 796.78 120 430 316.76 7 195 909.40 Cash at bank 56 250 090.71 242 788.01 4 815 485.47 2 259 058.84 4 120 250.25 292 305.79 Receivable on interest and dividends 2 27 180.83 5.18 5 995.97 12.89 1 684.80 - Receivable on subscriptions 27 014.21 5 700.00 - - 2 000.00 2 000.00 Other assets 42 036.08 233.71 1 716.32 1 355.99 3 427.51 16 390.11
Total assets 548 619 352.68 19 351 694.75 50 513 639.21 36 599 224.50 124 557 679.32 7 506 605.30
Liabilities
Redemptions to be paid 393 015.65 3 286.38 63 414.30 35 312.16 14 157.77 - Other payable and accrued expenses 1 152 328.69 31 928.13 141 617.21 78 817.46 193 313.09 14 786.92
Total liabilities 1 545 344.34 35 214.51 205 031.51 114 129.62 207 470.86 14 786.92
Total net assets at the end of the year/period 547 074 008.34 19 316 480.24 50 308 607.70 36 485 094.88 124 350 208.46 7 491 818.38
Information summaryUnits outstanding Eurobank 1 721 329.114 37 381 410.796 13 588 782.637 82 577 556.564 202 949.268 Units outstanding Eurobank USD - 1 353 731.943 768 324.082 4 359 879.425 76 563.176 Units outstanding Eurobank I 19 994.801 13 306.696 15 146 450.831 2 210 384.692 - Units outstanding Private Banking 65 025.665 420 133.543 68 083.388 1 376 353.439 574.719 Units outstanding Private Banking USD - 3 564.223 - 27 581.451 736.947 Units outstanding Private Banking DIS - - - - - Units outstanding Interamerican - - 15 644 771.153 15 060.726 140 778.866 Units outstanding Postbank - 319 896.380 314 741.079 473 350.735 9 843.520 Units outstanding Postbank BGN - - - - - Units outstanding Postbank USD - - - - 959.003 Units outstanding Bancpost RON - - - - - Units outstanding Bancpost - 895 845.724 107 283.927 259 000.798 9 932.032 Net asset value per unit : Eurobank EUR 10.6928 EUR 1.2470 EUR 0.7772 EUR 1.3610 EUR 16.9246Net asset value per unit : Eurobank USD - USD 1.3573 USD 0.8458 USD 1.4812 USD 18.4400Net asset value per unit : Eurobank I EUR 10.7728 EUR 1.3508 EUR 0.8452 EUR 1.4151 - Net asset value per unit : Private Banking EUR 10.6925 EUR 1.2470 EUR 0.7772 EUR 1.3609 EUR 16.9529Net asset value per unit : Private Banking USD - USD 1.3575 - USD 1.4813 USD 18.4225Net asset value per unit : Private Banking DIS - - - - - Net asset value per unit : Interamerican - - EUR 0.7773 EUR 1.3610 EUR 16.9502Net asset value per unit : Postbank - EUR 1.1903 EUR 0.7333 EUR 1.3223 EUR 16.9838Net asset value per unit : Postbank BGN - - - - - Net asset value per unit : Postbank USD - - - - USD 18.6036Net asset value per unit : Bancpost RON - - - - - Net asset value per unit : Bancpost - EUR 1.2051 EUR 0.7511 EUR 1.3311 EUR 16.9341
Cost of securities portfolio 463 322 054.74 19 281 598.08 34 465 135.20 31 705 829.52 108 409 650.70 6 302 281.17
Total net assets at year/period ended:31/12/2013 160 140 025.69 - 41 495 029.54 35 431 854.01 50 613 111.14 3 943 178.93 31/12/2014 277 594 425.36 988 011.58 45 040 087.98 40 174 808.40 82 649 321.93 5 813 104.29 31/12/2015 547 074 008.34 19 316 480.24 50 308 607.70 36 485 094.88 124 350 208.46 7 491 818.38
N.A.V. per unit at year/period ended "Eurobank" unit :31/12/2013 - EUR 0.9984 EUR 0.7322 EUR 1.2024 EUR 11.833431/12/2014 EUR 10.0749 EUR 1.1339 EUR 0.7894 EUR 1.3158 EUR 15.595331/12/2015 EUR 10.6928 EUR 1.2470 EUR 0.7772 EUR 1.3610 EUR 16.9246
N.A.V. per unit at year/period ended "Eurobank USD" unit :31/12/2013 - USD 1.3770 USD 1.0098 USD 1.6580 USD 16.335631/12/2014 - USD 1.3765 USD 0.9584 USD 1.5971 USD 18.951231/12/2015 - USD 1.3573 USD 0.8458 USD 1.4812 USD 18.4400
N.A.V. per unit at year/period ended "Eurobank I" unit :31/12/2013 - EUR 1.0595 EUR 0.7801 EUR 1.2353 - 31/12/2014 EUR 10.0853 EUR 1.2151 EUR 0.8498 EUR 1.3593 - 31/12/2015 EUR 10.7728 EUR 1.3508 EUR 0.8452 EUR 1.4151 -
N.A.V. per unit at year/period ended "Private Banking" unit :31/12/2013 - - - - - 31/12/2014 EUR 10.0751 EUR 1.1339 EUR 0.7894 EUR 1.3158 EUR 15.595431/12/2015 EUR 10.6925 EUR 1.2470 EUR 0.7772 EUR 1.3609 EUR 16.9529
N.A.V. per unit at year/period ended "Private Banking USD" unit :31/12/2013 - - - - - 31/12/2014 - - - USD 1.5971 USD 18.933831/12/2015 - USD 1.3575 - USD 1.4813 USD 18.4225
N.A.V. per unit at year/period ended "Interamerican" unit :31/12/2013 - - EUR 0.7322 - EUR 11.833131/12/2014 - - EUR 0.7895 - EUR 15.595131/12/2015 - - EUR 0.7773 EUR 1.3610 EUR 16.9502
N.A.V. per unit at year/period ended "Postbank" unit :31/12/2013 - EUR 0.9587 EUR 0.6978 EUR 1.1752 EUR 11.857431/12/2014 - EUR 1.0851 EUR 0.7486 EUR 1.2816 EUR 15.626731/12/2015 - EUR 1.1903 EUR 0.7333 EUR 1.3223 EUR 16.9838
N.A.V. per unit at year/period ended "Postbank BGN" unit :31/12/2013 - BGN 1.8463 BGN 1.3601 - - 31/12/2014 - - - - - 31/12/2015 - - - - -
N.A.V. per unit at year/period ended "Postbank USD" unit :31/12/2013 - - - - USD 16.391131/12/2014 - - - - USD 19.080231/12/2015 - - - - USD 18.6036
N.A.V. per unit at year/period ended "Bancpost" unit :31/12/2013 - EUR 0.9707 EUR 0.7148 EUR 1.1829 EUR 11.823231/12/2014 - EUR 1.0986 EUR 0.7668 EUR 1.2901 EUR 15.581231/12/2015 - EUR 1.2051 EUR 0.7511 EUR 1.3311 EUR 16.9341
The accompanying notes form an integral part of these financial statements.
13

Statement of Net AssetsAs at December 31, 2015 (Continued)
(LF) Fund of Funds - Dynamic Fixed Income
(LF) Fund of Funds - Global Low
(LF) Fund of Funds - Global Medium
(LF) Fund of Funds - Global High
(LF) Fund of Funds - Balanced Blend US
(LF) Fund of Funds - Tactical Allocation
Currency Notes EUR EUR EUR EUR EUR EUR
Assets
Securities portfolio at market value 2 1 688 001.97 179 738 649.14 43 750 056.90 11 327 801.28 28 871 952.61 138 136.71 Cash at bank 105 871.27 40 169 914.17 2 347 956.19 534 270.27 1 340 609.82 21 580.63 Receivable on interest and dividends 2 - 16 695.36 83.74 - 2 702.89 - Receivable on subscriptions - 9 314.21 - - 8 000.00 - Other assets 4 253.05 11 472.00 1 846.57 567.90 772.92 -
Total assets 1 798 126.29 219 946 044.88 46 099 943.40 11 862 639.45 30 224 038.24 159 717.34
Liabilities
Redemptions to be paid - 183 684.51 44 005.87 28 407.27 20 747.39 - Other payable and accrued expenses 1 890.94 238 092.51 59 935.45 17 413.26 374 505.52 28.20
Total liabilities 1 890.94 421 777.02 103 941.32 45 820.53 395 252.91 28.20
Total net assets at the end of the year/period 1 796 235.35 219 524 267.86 45 996 002.08 11 816 818.92 29 828 785.33 159 689.14
Information summaryUnits outstanding Eurobank - 20 194 034.106 3 777 533.481 901 445.726 1 712 762.122 - Units outstanding Eurobank USD - - - - 876 597.882 - Units outstanding Eurobank I 153 473.778 - - - 20 357.477 - Units outstanding Private Banking - 358 211.673 184 523.573 19 108.582 91.677 - Units outstanding Private Banking USD - - - - 6 281.926 - Units outstanding Private Banking DIS 18 648.714 4 334.483 - Units outstanding Interamerican - - - - - 16 256.007 Units outstanding Postbank - - - - - - Units outstanding Postbank BGN - 84 288.679 - - - - Units outstanding Postbank USD - - - - - - Units outstanding Bancpost RON - 7 668.501 85 893.599 67 503.054 - - Units outstanding Bancpost - - - - - - Net asset value per unit : Eurobank - EUR 10.6241 EUR 11.3507 EUR 11.9589 EUR 11.4014 - Net asset value per unit : Eurobank USD - - - - USD 12.4125 - Net asset value per unit : Eurobank I EUR 11.7039 - - - EUR 11.4922 - Net asset value per unit : Private Banking - EUR 10.6234 EUR 11.3502 EUR 11.9586 EUR 11.3938 - Net asset value per unit : Private Banking USD - - - - USD 12.4118 - Net asset value per unit : Private Banking DIS - EUR 10.6237 EUR 11.3506 - Net asset value per unit : Interamerican - - - - - EUR 9.8234Net asset value per unit : Postbank - - - - - - Net asset value per unit : Postbank BGN - BGN 20.7775 - - - - Net asset value per unit : Postbank USD - - - - - - Net asset value per unit : Bancpost RON - RON 48.0623 RON 51.3493 RON 54.1514 - - Net asset value per unit : Bancpost - - - - - -
Cost of securities portfolio 1 694 249.81 179 557 328.15 43 312 974.15 11 132 989.17 27 319 372.79 140 646.00
Total net assets at year/period ended:31/12/2013 1 821 520.00 12 929 032.30 4 899 127.09 1 624 197.120 - - 31/12/2014 2 552 740.45 68 803 644.11 19 830 392.75 5 477 336.26 6 264 977.61 - 31/12/2015 1 796 235.35 219 524 267.86 45 996 002.08 11 816 818.92 29 828 785.33 159 689.14
N.A.V. per unit at year/period ended "Eurobank" unit :31/12/2013 - EUR 10.2181 EUR 10.3665 EUR 10.4928 - - 31/12/2014 - EUR 10.5811 EUR 11.1320 EUR 11.4731 EUR 10.4256 - 31/12/2015 - EUR 10.6241 EUR 11.3507 EUR 11.9589 EUR 11.4014 -
N.A.V. per unit at year/period ended "Eurobank USD" unit :31/12/2013 - - - - - - 31/12/2014 - - - - USD 12.6585 - 31/12/2015 - - - - USD 12.4125 -
N.A.V. per unit at year/period ended "Eurobank I" unit :31/12/2013 EUR 10.0424 - - - - - 31/12/2014 EUR 11.0639 - - - EUR 10.4416 - 31/12/2015 EUR 11.7039 - - - EUR 11.4922 -
N.A.V. per unit at year/period ended "Private Banking" unit :31/12/2013 - - - - - - 31/12/2014 - EUR 10.5805 EUR 11.1314 - - - 31/12/2015 - EUR 10.6234 EUR 11.3502 EUR 11.9586 EUR 11.3938 -
N.A.V. per unit at year/period ended "Private Banking DIS" unit :31/12/2013 - - - - - - 31/12/2014 - - - - - - 31/12/2015 - EUR 10.6237 EUR 11.3506 - - -
N.A.V. per unit at year/period ended "Private Banking USD" unit :31/12/2013 - - - - - - 31/12/2014 - - - - - - 31/12/2015 - - - - USD 12.4118 -
N.A.V. per unit at year ended "Postbank BGN" unit :31/12/2013 - - - - - - 31/12/2014 - - - - - - 31/12/2015 - BGN 20.7775 - - - -
N.A.V. per unit at year ended "Bancpost RON" unit :31/12/2013 - - - - - - 31/12/2014 - - - - - - 31/12/2015 - RON 48.0623 RON 51.3493 RON 54.1514 - -
N.A.V. per unit at year ended "Interamerican" unit :31/12/2013 - - - - - 31/12/2014 - - - - - 31/12/2015 - - - - - EUR 9.8234
The accompanying notes form an integral part of these financial statements.
14

Statement of Operationsfor the year ended December 31, 2015
720 730 740 750
(LF) Fund of Funds
(LF) Fund of Funds -
(LF) Fund of Funds -
(LF) Fund of Funds -
(LF) Fund of Funds -
(LF) Fund of Funds -
Consolidated Balanced Blend Europe
Equity Blend Global Emerging
Market
Balanced Blend Global
Real Estate
Currency Notes EUR EUR EUR EUR EUR EUR
Income 863 232.00 31 342.56 58 006.16 1 637.11 56 082.60 70 847.18
Income on portfolio / dividends 2 548 850.23 29 336.55 54 206.20 12.40 8 892.00 61 920.82 Bank interest 2 306 046.21 1 734.66 3 799.70 1 347.25 47 190.25 1 140.47 Other income 8 335.56 271.35 0.26 277.46 0.35 7785.89
Expenses 7 002 869.55 231 422.47 1 054 654.08 789 479.42 1 736 413.62 155 890.56
Management fees 3 6 000 480.79 201 123.51 957 061.08 699 950.39 1 554 989.86 136 162.69 Custodian fees 4 89 227.21 1 619.62 10 911.80 8 381.01 12 575.06 1 715.67 Subscription tax 6 89 238.11 2 164.70 6 075.00 1 449.28 18 366.04 2 030.92 Amortisation of formation expenses 2 1 574.64 - - - - - Other expenses 295 696.98 7 138.46 35 430.94 45 000.82 70 853.07 5 638.02 Brokerage and transaction fees 7 493 924.66 15 158.71 43 647.52 33 524.39 77 869.06 10 093.19 Other taxes 32 727.16 4 217.47 1 527.74 1 173.53 1 760.53 250.07
Net investment gain/(loss) (6 139 637.55) (200 079.91) (996 647.92) (787 842.31) (1 680 331.02) (85 043.38)
Net realised gain/(loss) 14 581 374.33 (75 708.47) 6 914 382.03 2 785 579.10 1 686 708.44 700 652.07
- on portfolio 2 8 743 924.61 (75 708.47) 5 709 602.77 96 394.11 777 518.65 395 215.67 - on currencies 2 5 837 449.72 - 1 204 779.26 2 689 184.99 909 189.79 305 436.40
Net realised gain/(loss) for the year/period 8 441 736.79 (275 788.38) 5 917 734.11 1 997 736.79 6 377.42 615 608.70
Change in net unrealised appreciation / (depreciation) (2 885 016.99) (185 318.98) (1 358 576.16) (2 239 667.50) 1 321 393.23 (133 313.28)
- on portfolio 2 (2 815 848.29) (185 318.98) (1 358 372.19) (2 221 166.35) 1 362 725.81 (131 997.26) - on currencies 2 (69 168.70) - (203.97) (18 501.15) (41 332.58) (1 316.02)
5 556 719.80Result of operations for the year/period 5 556 719.80 (461 107.36) 4 559 157.95 (241 930.71) 1 327 770.65 482 295.42
The accompanying notes form an integral part of these financial statements.
15

Statement of Operationsfor the year ended December 31, 2015 (Continued)
820 830 840 860 861 862
(LF) Fund of Funds -
(LF) Fund of Funds -
(LF) Fund of Funds -
(LF) Fund of Funds -
(LF) Fund of Funds -
(LF) Fund of Funds -
Dynamic Fixed Income
Global Low Global Medium
Global High Balanced Blend US
Tactical allocation *1)
NotesCurrency EUR EUR EUR EUR EUR EUR
Income 151.44 427 131.30 110 909.00 54 219.00 52 848.06 57.59
Income on portfolio / dividends 2 - 200 592.75 96 680.70 52 407.94 44 743.28 57.59 Bank interest 2 151.44 226 538.35 14 228.30 1 811.01 8 104.78 - Other income - 0.20 - 0.05 - -
Expenses 20 072.44 1 897 557.48 525 062.74 164 487.32 427 622.89 206.53
Management fees 3 16 623.79 1 496 323.81 424 541.66 133 738.52 379 965.48 - Custodian fees 4 443.22 39 902.18 8 490.73 2 139.78 3 045.02 3.12 Subscription tax 6 89.30 44 483.54 7 724.40 2 798.24 4 046.15 10.54 Amortisation of formation expenses 2 - 1 018.35 392.04 164.25 - - Other expenses 1 745.90 88 956.93 20 159.12 5 593.85 15 173.20 6.67 Brokerage and transaction fees 7 1 108.25 210 944.50 57 370.61 19 055.91 24 966.68 185.84 Other taxes 61.98 15 928.17 6 384.18 996.77 426.36 0.36
Net investment gain/(loss) (19 921.00) (1 470 426.18) (414 153.74) (110 268.32) (374 774.83) (148.94)
Net realised gain/(loss) 448 879.32 896 365.25 600 270.13 263 311.59 360 934.84 0.03
- on portfolio 172 910.56 764 737.50 610 338.95 273 575.44 19 339.43 - - on currencies 275 968.76 131 627.75 (10 068.82) (10 263.85) 341 595.41 0.03
Net realised gain/(loss) for the year/period 428 958.32 (574 060.93) 186 116.39 153 043.27 (13 839.99) (148.91)
Change in net unrealised appreciation / (depreciation) (252 131.26) (760 152.45) (479 136.54) (184 221.95) 1 388 617.13 (2 509.23)
- on portfolio (248 618.40) (758 309.93) (480 430.77) (184 813.30) 1 392 962.37 (2 509.29) - on currencies (3 512.86) (1 842.52) 1 294.23 591.35 (4 345.24) 0.06
176 827.06Result of operations for the year/period 176 827.06 (1 334 213.38) (293 020.15) (31 178.68) 1 374 777.14 (2 658.14)
*1) launched as of July 10th 2015
The accompanying notes form an integral part of these financial statements.
16

Statement of Changes in Net AssetsFor the year ended December 31, 2015
710 720 730
(LF) Fund of Funds
(LF) Fund of Funds -
(LF) Fund of Funds -
(LF) Fund of Funds -
(LF) Fund of Funds -
(LF) Fund of Funds -
Consolidated Balanced Blend Europe
Equity Blend Global Emerging Market
Balanced Blend Global
Real Estate
Currency EUR EUR EUR EUR EUR EUR
Total net assets at the beginning of the year 277 594 425.36 988 011.58 45 040 087.98 40 174 808.40 82 649 321.93 5 813 104.29
Net investment gain / (loss) (6 139 637.55) (200 079.91) (996 647.92) (787 842.31) (1 680 331.02) (85 043.38)
Net realised gain/(loss) 14 581 374.33 (75 708.47) 6 914 382.03 2 785 579.10 1 686 708.44 700 652.07
Change in net unrealised appreciation / (depreciation) (2 885 016.99) (185 318.98) (1 358 576.16) (2 239 667.50) 1 321 393.23 (133 313.28)
Movement on capital account 263 922 863.19 18 789 576.02 709 361.77 (3 447 782.81) 40 373 115.88 1 196 418.68 Subscriptions 417 585 157.83 23 731 490.57 18 846 716.90 2 108 566.09 79 521 464.65 7 621 114.59 Redemptions (153 662 294.64) (4 941 914.55) (18 137 355.13) (5 556 348.90) (39 148 348.77) (6 424 695.91)
Total changes in net assets 269 479 582.98 18 328 468.66 5 268 519.72 (3 689 713.52) 41 700 886.53 1 678 714.09 547 074 008.34
Total net assets at the end of the year/period 547 074 008.34 19 316 480.24 50 308 607.70 36 485 094.88 124 350 208.46 7 491 818.38
Units in issue
Units outstanding at the beginning of year 2013 Eurobank - 41 502 365.438 28 543 434.288 27 903 080.513 173 753.699 Units outstanding at the beginning of year 2013 Eurobank USD - 247 946.874 362 907.692 1 401 491.175 78 329.731 Units outstanding at the beginning of year 2013 Eurobank I - 12 879.519 17 181 089.083 1 810 397.438 - Units outstanding at the beginning of year 2013 Interamerican - - 24 488 861.199 - 62 355.361 Units outstanding at the beginning of year 2013 Postbank - 129 084.573 396 005.883 105 671.549 301.575 Units outstanding at the beginning of year 2013 Postbank BGN - 1 169.393 2 356.167 - - Units outstanding at the beginning of year 2013 Postbank USD - - - - 76.201 Units outstanding at the beginning of year 2013 Polbank EUR - - - 6 513.876 - Units outstanding at the beginning of year 2013 Polbank PLN - - 6 711 338.990 2 456.598 90 042.718 Units outstanding at the beginning of year 2013 Bancpost - 199 814.796 290 490.281 164.502 176.638 Units outstanding at the end of year 2013 Eurobank - 39 708 810.000 18 996 763.351 34 024 756.702 155 401.074 Units outstanding at the end of year 2013 Eurobank USD - 1 390 278.913 335 354.564 4 405 949.818 78 700.148 Units outstanding at the end of year 2013 Eurobank I - 14 739.170 9 905 105.259 3 383 213.082 - Units outstanding at the end of year 2013 Interamerican - - 17 980 617.272 - 96 359.138 Units outstanding at the end of year 2013 Postbank 244 957.139 390 035.793 189 123.421 816.033 Units outstanding at the end of year 2013 Postbank BGN - 3 523.478 3 415.051 - - Units outstanding at the end of year 2013 Postbank USD - - - - 1 686.442 Units outstanding at the end of year 2013 Polbank EUR - - - - - Units outstanding at the end of year 2013 Polbank PLN - - - - - Units outstanding at the end of year 2013 Bancpost - 213 164.231 154 330.832 1 279.802 176.638
Units outstanding at the beginning of year 2014 Eurobank - 39 708 810.000 18 996 763.351 34 024 756.702 155 401.074 Units outstanding at the beginning of year 2014 Eurobank USD - 1 390 278.913 335 354.564 4 405 949.818 78 700.148 Units outstanding at the beginning of year 2014 Eurobank I - 14 739.170 9 905 105.259 3 383 213.082 - Units outstanding at the beginning of year 2014 Interamerican - - 17 980 617.272 - 96 359.138 Units outstanding at the beginning of year 2014 Postbank - 244 957.139 390 035.793 189 123.421 816.033 Units outstanding at the beginning of year 2014 Postbank BGN - 3 523.478 3 415.051 - - Units outstanding at the beginning of year 2014 Postbank USD - - - - 1 686.442 Units outstanding at the beginning of year 2014 Bancpost - 213 164.231 154 330.832 1 279.802 176.638 Units outstanding at the end of year 2014 Eurobank 74 081.98 37 842 067.326 16 549 607.962 54 872 876.732 176 658.699 Units outstanding at the end of year 2014 Eurobank USD - 1 358 608.056 1 095 673.574 5 830 060.322 71 652.435 Units outstanding at the end of year 2014 Eurobank I 19 994.80 12 664.372 15 140 726.104 1 513 437.972 - Units outstanding at the end of year/period 2014 Private Banking 3 969.57 95 702.937 135 401.265 236 383.399 190.092 Units outstanding at the end of year 2014 Private Banking USD - - - 12 092.945 736.947 Units outstanding at the end of year 2014 Interamerican - - 16 380 380.102 - 121 108.861 Units outstanding at the end of year 2014 Postbank - 237 859.203 334 271.286 233 116.355 1 650.756 Units outstanding at the end of year 2014 Postbank BGN - - - - - Units outstanding at the end of year 2014 Postbank USD - - - - 18.580 Units outstanding at the end of year 2014 Bancpost - 191 543.654 117 715.149 75 601.099 665.170
Units outstanding at the beginning of year 2015 Eurobank 74 081.98 37 842 067.326 16 549 607.962 54 872 876.732 176 658.699 Units outstanding at the beginning of year 2015 Eurobank USD - 1 358 608.056 1 095 673.574 5 830 060.322 71 652.435 Units outstanding at the beginning of year 2015 Eurobank I 19 994.80 12 664.372 15 140 726.104 1 513 437.972 - Units outstanding at the beginning of year 2015 Private Banking 3 969.57 95 702.937 135 401.265 236 383.399 190.092 Units outstanding at the beginning of year 2015 Private Banking USD - - - 12 092.945 736.947 Units outstanding at the beginning of year 2015 Interamerican - - 16 380 380.102 - 121 108.861 Units outstanding at the beginning of year 2015 Postbank - 237 859.203 334 271.286 233 116.355 1 650.756 Units outstanding at the beginning of year 2015 Postbank BGN - - - - - Units outstanding at the beginning of year 2015 Postbank USD - - - - 18.580 Units outstanding at the beginning of year 2015 Bancpost - 191 543.654 117 715.149 75 601.099 665.170 Units outstanding at the end of year/period 2015 Eurobank 1 721 329.114 37 381 410.796 13 588 782.637 82 577 556.564 202 949.268 Units outstanding at the end of year 2015 Eurobank USD - 1 353 731.943 768 324.082 4 359 879.425 76 563.176 Units outstanding at the end of year/period 2015 Eurobank I 19 994.801 13 306.696 15 146 450.831 2 210 384.692 - Units outstanding at the end of year/period 2015 Private Banking 65 025.665 420 133.543 68 083.388 1 376 353.439 574.719 Units outstanding at the end of year 2015 Private Banking USD - 3 564.223 - 27 581.451 736.947 Units outstanding at the end of year 2015 Private Banking DIS - - - - - Units outstanding at the end of year 2015 Interamerican - - 15 644 771.153 15 060.726 140 778.866 Units outstanding at the end of year 2015 Postbank - 319 896.380 314 741.079 473 350.735 9 843.520 Units outstanding at the end of year 2015 Postbank BGN - - - - - Units outstanding at the end of year 2015 Postbank USD - - - - 959.003 Units outstanding at the end of year 2015 Bancpost - 895 845.724 107 283.927 259 000.798 9 932.032 Units outstanding at the end of year 2015 Bancpost RON - - - - -
The accompanying notes form an integral part of these financial statements.
17

Statement of Changes in Net AssetsFor the year ended December 31, 2015 (Continued)
(LF) Fund of Funds -
(LF) Fund of Funds - (LF) Fund of Funds - (LF) Fund of Funds -
(LF) Fund of Funds - (LF) Fund of Funds -
Dynamic Fixed Income
Global Low Global Medium Global High Balanced Blend US Tactical Allocation *1)
Currency EUR EUR EUR EUR EUR EUR
Total net assets at the beginning of the year 2 552 740.45 68 803 644.11 19 830 392.75 5 477 336.26 6 264 977.61 -
Net investment gain / (loss) (19 921.00) (1 470 426.18) (414 153.74) (110 268.32) (374 774.83) (148.94)
Net realised gain/(loss) 448 879.32 896 365.25 600 270.13 263 311.59 360 934.84 0.03
Change in net unrealised appreciation / (depreciation) (252 131.26) (760 152.45) (479 136.54) (184 221.95) 1 388 617.13 (2 509.23)
Movement on capital account (933 332.16) 152 054 837.13 26 458 629.48 6 370 661.34 22 189 030.58 162 347.28 Subscriptions 280 000.00 204 010 797.54 36 552 689.41 9 926 354.18 34 823 616.62 162 347.28 Redemptions (1 213 332.16) (51 955 960.41) (10 094 059.93) (3 555 692.84) (12 634 586.04) -
Total changes in net assets (756 505.10) 150 720 623.75 26 165 609.33 6 339 482.66 23 563 807.72 159 689.14 #REF!Total net assets at the end of the year/period 1 796 235.35 219 524 267.86 45 996 002.08 11 816 818.92 29 828 785.33 159 689.14
Units in issue
Units outstanding at the beginning of year 2013 Eurobank - - - - - - Units outstanding at the beginning of year 2013 Eurobank USD - - - - - - Units outstanding at the beginning of year 2013 Eurobank I 129 885.854 - - - - - Units outstanding at the beginning of year 2013 Interamerican - - - - - - Units outstanding at the beginning of year 2013 Postbank - - - - - - Units outstanding at the beginning of year 2013 Postbank BGN - - - - - - Units outstanding at the beginning of year 2013 Postbank USD - - - - - - Units outstanding at the beginning of year 2013 Polbank EUR - - - - - - Units outstanding at the beginning of year 2013 Polbank PLN - - - - - - Units outstanding at the beginning of year 2013 Bancpost - - - - - - Units outstanding at the end of year 2013 Eurobank - 1 265 303.488 472 590.383 154 791.368 - - Units outstanding at the end of year 2013 Eurobank USD - - - - - - Units outstanding at the end of year 2013 Eurobank I 181 382.305 - - - - - Units outstanding at the end of year 2013 Interamerican - - - - - - Units outstanding at the end of year 2013 Postbank - - - - - - Units outstanding at the end of year 2013 Postbank BGN - - - - - - Units outstanding at the end of year 2013 Postbank USD - - - - - - Units outstanding at the end of year 2013 Polbank EUR - - - - - - Units outstanding at the end of year 2013 Polbank PLN - - - - - - Units outstanding at the end of year 2013 Bancpost - - - - - -
Units outstanding at the beginning of year 2014 Eurobank - 1 265 303.488 472 590.383 154 791.368 - - Units outstanding at the beginning of year 2014 Eurobank USD - - - - - - Units outstanding at the beginning of year 2014 Eurobank I 181 382.305 - - - - - Units outstanding at the beginning of year 2014 Interamerican - - - - - - Units outstanding at the beginning of year 2014 Postbank - - - - - - Units outstanding at the beginning of year 2014 Postbank BGN - - - - - - Units outstanding at the beginning of year 2014 Postbank USD - - - - - - Units outstanding at the beginning of year 2014 Bancpost - - - - - - Units outstanding at the end of year 2014 Eurobank - 6 371 274.435 1 739 373.693 477 406.317 192 931.679 - Units outstanding at the end of year 2014 Eurobank USD - - - - 387 576.140 - Units outstanding at the end of year 2014 Eurobank I 230 727.494 - - - 20 357.477 - Units outstanding at the end of year/period 2014 Private Banking - 131 210.570 42 007.969 - - - Units outstanding at the end of year 2014 Private Banking USD - - - - - - Units outstanding at the end of year 2014 Interamerican - - - - - - Units outstanding at the end of year 2014 Postbank - - - - - - Units outstanding at the end of year 2014 Postbank BGN - - - - - - Units outstanding at the end of year 2014 Postbank USD - - - - - - Units outstanding at the end of year 2014 Bancpost - - - - - -
Units outstanding at the beginning of year 2015 Eurobank - 6 371 274.435 1 739 373.693 477 406.317 192 931.679 - Units outstanding at the beginning of year 2015 Eurobank USD - - - - 387 576.140 - Units outstanding at the beginning of year 2015 Eurobank I 230 727.494 - - - 20 357.477 - Units outstanding at the beginning of year 2015 Private BankingUnits outstanding at the beginning of year 2015 Private Banking USDUnits outstanding at the beginning of year 2015 Interamerican - 131 210.570 42 007.969 - - - Units outstanding at the beginning of year 2015 Postbank - - - - - - Units outstanding at the beginning of year 2015 Postbank BGN - - - - - - Units outstanding at the beginning of year 2015 Postbank USD - - - - - - Units outstanding at the beginning of year 2015 Bancpost - - - - - - Units outstanding at the end of year/period 2015 Eurobank - 20 194 034.106 3 777 533.481 901 445.726 1 712 762.122 - Units outstanding at the end of year/period 2015 Eurobank USD - - - - 876 597.882 - Units outstanding at the end of year/period 2015 Eurobank I 153 473.778 - - - 20 357.477 - Units outstanding at the end of year/period 2015 Private Banking - 358 211.673 184 523.573 19 108.582 91.677 - Units outstanding at the end of year 2015 Private Banking USD - - - - 6 281.926 - Units outstanding at the end of year 2015 Private Banking DIS - 18 648.714 4 334.483 - - - Units outstanding at the end of year 2015 Interamerican - - - - - 16 256.007 Units outstanding at the end of year 2015 Postbank - - - - - - Units outstanding at the end of year 2015 Postbank BGN - 84 288.679 - - - - Units outstanding at the end of year 2015 Postbank USD - - - - - - Units outstanding at the end of year 2015 Bancpost - - - - - - Units outstanding at the end of year 2015 Bancpost RON - 7 668.501 85 893.599 67 503.054 - -
*1) launched as of July 10th 2015
The accompanying notes form an integral part of these financial statements.
18

(LF) Fund of Funds - Balanced Blend Europe
Schedule of investmentsAs at December 31, 2015(All figures in Euros)
Cost Market % of NetCurrency Shares Name Price Price Assets
Transferable securities admitted to an official exchange listing
Investment Funds
EUR 4 000.000 ISHARES DAX 424 226.67 379 880.00 1.97%EUR 18 749.168 (LF) I - MM FUND RESERVE 188 382.72 188 241.65 0.97%EUR 16 070.560 BGF - EUROPEAN VALUE (D€) 1 135 484.48 1 106 779.47 5.73%EUR 44 889.400 BGF EUROPEAN FOCUS FD 1 152 378.25 1 131 212.88 5.86%EUR 239.663 BNP-INSTICASH EUR (I€?1) 24 386.45 24 373.70 0.13%EUR 700 000.000 BNY MELLON GL-EUROLAND BF (C€-Acc) 1 425 910.32 1 364 370.00 7.06%EUR 64 135.530 FF - EURO BOND FUND 996 600.00 970 370.57 5.02%EUR 68 395.120 FIDELITY FD-EUR DYN G-Y ACC 1 087 700.00 1 164 768.89 6.03%EUR 77 129.204 GS EUROPE CORE EQUITY PORTFOLIO INSTL AC 1 117 000.00 1 120 687.33 5.80%EUR 74 672.810 INVESCO PAN EUR STRUC EQTY - C 1 418 000.00 1 409 822.65 7.30%EUR 57 890.940 INVESCO PAN EUROPEAN SMALL CAP EQUITY 1 380 500.00 1 479 692.43 7.66%EUR 7 000.000 ISHARES B EURO AGG BOND 865 139.08 841 820.00 4.36%EUR 16 000.000 ISHARES DJ EURO STOXX 50 571 672.38 529 520.00 2.74%EUR 45 790.189 M&G European Corporate Bond (C€-Acc) 874 500.00 849 014.21 4.40%EUR 20 210.614 MORGAN STANLEY-EURO STRAT BOND 803 000.00 781 140.23 4.04%EUR 21 040.227 MS EURO CORPORATE BD FUND (Z€-Acc) 858 000.00 836 138.62 4.33%EUR 17 500.000 MS INVF - EUROPEAN PROPERTY FND (Z€) 767 703.72 782 425.00 4.05%EUR 4 323.752 PARVEST BD EURO GOVERNMENT 894 292.69 880 359.14 4.56%EUR 8 000.000 PIONEER FDS EUR STRATEGIC BOND (I-I€) 829 221.32 819 440.00 4.24%EUR 132 674.187 PIONEER FDS EURO BOND (I-Acc-€) 1 502 000.00 1 479 317.19 7.66%EUR 355.581 PIONEER SF- EURO CURVE 1-3 (I-I€) 400 000.00 400 366.43 2.07%EUR 8 803.18 SCHRODER INTL EUROPEAN EQ ALPHA (C-Acc) 565 500.00 563 227.46 2.92%
Total Investments in Investment Funds 19 281 598.08 19 102 967.85 98.89%
Total Investments 19 281 598.08 19 102 967.85 98.89%96.26
Portfolio breakdownAs at December 31, 2015
By countries
Germany 4.76%Ireland 11.55%Luxembourg 79.25%United Kingdom 4.44%
Total 100.00%
By type of investments
Investment Funds 100.00%
Total 100.00%
The accompanying notes form an integral part of these financial statements. 19

(LF) Fund of Funds - Equity Blend
Schedule of investmentsAs at December 31, 2015(All figures in Euros)
Cost Market % of NetCurrency Shares Name Price Price Assets
Transferable securities admitted to an official exchange listing
Investment Funds
EUR 6 440.104 (LF) EQUITY - MENA FUND (ERB I €) 100 000.00 84 054.31 0.17%EUR 1 937 000.000 (LF) I EQUITY- GLOBAL EQUTIES FUND 1 650 432.41 2 258 348.30 4.49%EUR 702 772.639 (LF)I EQUITY- EMERGING EUROPE FUND 674 127.18 479 009.83 0.95%EUR 23 088.600 BGF - EUROPEAN VALUE (D€) 1 290 964.83 1 590 111.88 3.16%EUR 5 191.325 BNP-INSTICASH EUR (I€?1) 528 182.22 527 956.69 1.05%EUR 182 668.410 FIDELITY FDS-EURO SM-Y ACC€ 3 101 384.09 3 693 555.25 7.34%EUR 57 400.000 ISHARES MCSI NORTH AMERICA 1 559 880.00 2 053 198.00 4.08%EUR 383 647.277 PIONEER FDS US PIONEER (I-Acc-€) 2 109 446.77 3 383 768.98 6.73%EUR 30 000.000 PowerShares Global EQQQ Nasdaq 1 945 650.00 3 146 700.00 6.25%EUR 69 279.880 SCHRODER INTL EURO EQT(C€-ACC) 2 650 590.04 2 633 328.24 5.23%EUR 25 913.640 SCHRODER INTL EUROPEAN EQ ALPHA (C-Acc) 1 356 573.52 1 657 954.69 3.30%EUR 196 565.940 SCHRODER INTL JAPANESE EQ ALPHA (C€-Acc) 2 000 000.00 2 040 354.46 4.06%EUR 4 666.874 SILK-ROAD FRONTIERS FUND 440 000.00 443 819.72 0.88%
19 407 231.06 23 992 160.35 47.69%
USD 380 107.66 FIDELITY FUNDS-AMERICA-Y ACC 2 949 565.21 6 102 950.21 12.13%USD 60 851.38 FIDELITY-CHINA FOCUS FUND (Y$-Acc) 1 012 040.96 847 906.16 1.69%USD 71 384.23 FRANKLIN U.S. OPPORTUNITIES FUND (I$) 2 027 324.81 2 006 390.68 3.99%USD 119 800.41 INVESCO JAPANESE EQUITY CORE(C$H) 2 080 113.45 2 450 587.98 4.87%USD 177 100.47 MORGAN STANLEY US EQUITY GROWTH (Z$-Acc) 5 145 637.37 8 307 634.02 16.51%USD 44 117.87 MS INVEST F -GLOBAL OPPORT 1 843 222.34 1 982 812.05 3.94%
15 057 904.14 21 698 281.10 43.13%
Total Investments in Investment Funds 34 465 135.20 45 690 441.45 90.82%
Total Investments 34 465 135.20 45 690 441.45 90.82%96.26
Portfolio breakdownAs at December 31, 2015
By countries
Ireland 16.74%Luxembourg 83.26%
Total 100.00%
By type of investments
Investment Funds 100.00%
Total 100.00%
The accompanying notes form an integral part of these financial statements. 20

(LF) Fund of Funds - Global Emerging Market
Schedule of investmentsAs at December 31, 2015(All figures in Euros)
Cost Market % of NetCurrency Shares Name Price Price Assets
Transferable securities admitted to an official exchange listing
Investment Funds
EUR 11 000.0000 (LF) EQUITY - MENA FUND (ERB I €) 134 281.19 143 568.70 0.39%EUR 17 432.5080 BARING ASEAN FRONTIER-I 2 764 693.23 2 733 417.25 7.49%EUR 64 212.8700 BGF INDIA FUND 1 588 000.03 1 767 138.18 4.84%EUR 24 700.0040 FRANKLIN TEMP INV FRONTIER MKTS FND (I€) 470 028.73 529 321.09 1.45%EUR 138 837.4680 HSBC GIF-MEXICO EQUITY (I€) 1 500 000.00 1 342 558.32 3.68%EUR 7 883.3050 JPM ASEAN EQUITY (EUR) (C-ACC) 900 000.00 836 655.16 2.29%EUR 34 168.3800 PARVEST EQUITY RUSSIA (I€) 3 349 999.82 2 969 573.91 8.14%EUR 0.4940 PARVEST EQUITY TURKEY (CEUR) 91.27 86.77 0.00%EUR 10 000.0000 RBS MSCI FRONTIER MKTS 558 127.82 558 500.00 1.53%
11 265 222.09 10 880 819.38 29.82%
USD 228 383.0500 FIDELITY- INDIA FOCUS FUND (Y$-ACC) 2 436 279.58 2 628 492.35 7.20%USD 130 701.9500 FIDELITY-CHINA FOCUS FUND (Y$-Acc) 1 490 694.86 1 821 207.48 4.99%USD 45 000.0000 FTIF-FRANKLIN MENA FUND (I$) 226 605.71 263 709.01 0.72%USD 22 000.0000 FTIF-TEMPLETON AFRICA FUND 194 661.60 171 158.26 0.47%USD 156 569.1920 HSBC GIF-KOREA EQUITY I-C$ 2 151 013.07 1 926 374.88 5.28%USD 45 000.0000 INVESCO GRTER CHINE EQTY - C 1 268 083.61 1 990 631.03 5.46%USD 101 945.4310 JP MORGAN GREATER CHINA (C$) 2 332 867.13 2 674 346.94 7.33%USD 42 354.4860 JPMF - KOREA EQUITY FUND (C$) 3 160 890.63 3 326 657.57 9.12%USD 54 097.2030 MORGAN STANLEY INVEST F-INDIAN EQUITY Z$ 1 937 668.32 1 902 122.65 5.21%USD 18 532.7710 PARVEST EQUITY BRAZIL-I 1 594 513.54 1 020 008.85 2.80%USD 8 978.6009 PF (LUX) GREATER CHINA - I $ 2 256 555.17 3 716 713.57 10.19%USD 47 799.3300 SCHRODER INTL GREATER CHINA (C$-Acc) 1 390 774.21 2 016 554.81 5.53%
20 440 607.43 23 457 977.40 64.29%
Total Investments in Investment Funds 31 705 829.52 34 338 796.78 94.12%
Total Investments 31 705 829.52 34 338 796.78 94.12%57 216 761.26 61 006 444.80 98.40
Portfolio breakdownAs at December 31, 2015
By countries
Ireland 7.96%Luxembourg 92.04%
Total 100.00%
By type of investments
Investment Funds 100.00%
Total 100.00%
The accompanying notes form an integral part of these financial statements. 21

(LF) Fund of Funds - Balanced Blend Global
Schedule of investmentsAs at December 31, 2015(All figures in Euros)
Cost Market % of NetCurrency Shares Name Price Price Assets
Transferable securities admitted to an official exchange listing
Investment Funds
EUR 31 032.15 BGF - EUROPEAN VALUE (D€) 1 912 059.27 2 137 184.17 1.72%EUR 76 848.60 BGF EUROPEAN FOCUS FD 1 681 394.80 1 936 584.72 1.56%EUR 4 092 914.73 BNY MELLON GL-EUROLAND BF (C€-Acc) 7 562 094.51 7 977 500.10 6.42%EUR 1 068 440.20 EUROBANK I (LF) ABSOLUTE RETURN FUND 1 380 354.37 1 419 102.27 1.14%EUR 122 270.56 EUROBANK I (LF) GREEK GOVMNT BOND 2 400 000.00 2 242 857.86 1.80%EUR 57 877.00 FIDELITY FDS-EURO SM-Y ACC€ 1 049 225.60 1 170 272.94 0.94%EUR 292 301.76 INVESCO EURO CORPORATE BOND (C-Acc) 4 570 902.31 5 129 194.36 4.12%EUR 109 185.59 INVESCO PAN EUR STRUC EQTY - C 1 571 406.97 2 061 423.94 1.66%EUR 10 000.00 ISHARES B EURO AGG BOND 1 207 800.00 1 202 600.00 0.97%EUR 384 510.13 M&G European Corporate Bond (C€-Acc) 6 066 546.32 7 129 356.05 5.73%EUR 550 000.17 M&G GLOBAL CONVERTIBLE (C€-Acc) 7 311 371.84 9 460 332.86 7.61%EUR 36 760.67 MS INVF - EUROPEAN PROPERTY FND (Z€) 1 370 000.00 1 643 569.56 1.32%EUR 19 657.95 PARVEST BD EURO GOVERNMENT 3 999 999.87 4 002 555.40 3.22%EUR 5 186.90 PF EUR CORPORATE BONDS (I€-Acc) 990 000.00 1 032 348.79 0.83%EUR 67 072.93 PIONEER FDS EUR STRATEGIC BOND (I-I€) 7 000 000.00 6 870 279.81 5.52%EUR 915 967.35 PIONEER FDS EURO BOND (I-Acc-€) 9 740 284.86 10 213 036.00 8.21%EUR 600.00 PIONEER FDS EURO HIGH YLD-I€ 928 625.85 1 058 292.00 0.85%EUR 1 000.00 PIONEER FDS -GLOBAL SELECT (I€) 1 519 980.73 1 425 199.95 1.15%EUR 852 502.03 PIONEER FDS US PIONEER (I-Acc-€) 5 649 062.86 7 519 067.91 6.05%EUR 60 129.27 TEMPLETON ASIAN GROWTH FUND (I €) 1 577 655.89 1 450 317.99 1.17%
69 488 766.05 77 081 076.68 61.99%
USD 39 293.97 BGF - WORLD FIN. EQTY FUND (D$) 660 210.73 772 019.86 0.62%USD 200 000.72 FF GLOBAL OPPORTUNITIES FUND (Y$-ACC) 2 508 503.23 2 639 855.19 2.12%USD 148 531.74 FIDELITY FNDS-LATIN AM-Y AC$ 1 165 888.70 890 208.14 0.72%USD 500 545.76 FIDELITY FUNDS-AMERICA-Y ACC 5 598 553.75 8 036 685.85 6.46%USD 147 053.10 FRANKLIN U.S. OPPORTUNITIES FUND (I$) 3 292 593.31 4 133 209.15 3.32%USD 1 806 175.97 INVESCO JAPANESE EQUITY CORE (C-$Acc) 3 100 095.31 3 218 500.40 2.59%USD 30 000.00 JPM INV-GLB CONV/BLE (USD) (C$-ACC) 4 220 746.88 4 913 750.34 3.95%USD 74 566.12 MORGAN STANLEY GLOBAL PROPERTY (Z$-Acc) 1 874 672.98 2 403 348.30 1.93%USD 38 373.03 MORGAN STANLEY US EQUITY GROWTH (Z$-Acc) 1 307 932.75 1 800 046.66 1.45%USD 298.86 NN L - GLOBAL RE (I$) 1 271 754.66 1 575 067.69 1.27%USD 50 000.40 PARVEST CONVERTIBLE BOND WORLD 6 643 214.54 6 995 555.64 5.63%USD 128 725.15 PARVEST WRD COMMODITIES IC 7 276 717.81 5 970 992.86 4.80%
38 920 884.65 43 349 240.08 34.86%
Total Investments in Investment Funds 108 409 650.70 120 430 316.76 96.85%
Total Investments 108 409 650.70 120 430 316.76 96.85%33 570 973.17 96.80
Portfolio breakdownAs at December 31, 2015
By countries
Ireland 10.30%Luxembourg 75.92%United Kingdom 13.78%
Total 100.00%
By type of investments
Investment Funds 100.00%
Total 100.00%
The accompanying notes form an integral part of these financial statements. 22

(LF) Fund of Funds - Real Estate
Schedule of investmentsAs at December 31, 2015(All figures in Euros)
Cost Market % of NetCurrency Shares Name Price Price Assets
Transferable securities admitted to an official exchange listing
Investment Funds
EUR 37 680.000 ISHARES EPRA US PROPTY YLD 835 812.93 969 883.20 12.95%EUR 8 000.000 LYXOR ETF FTSE EPRA/NAREIT United States 259 706.25 387 760.00 5.18%EUR 5 410.000 LYXOR ETF MSCI WLD REAL EST 183 415.57 236 308.80 3.15%EUR 8 705.128 MS INVF - EUROPEAN PROPERTY FND (Z€) 382 166.87 389 206.27 5.20%EUR 121.198 NN L-EUROPE RE EST-I 141 660.42 144 497.10 1.93%
1 802 762.04 2 127 655.37 28.40%
USD 61 075.782 JANUS CAPITAL GLOBAL RE-I$IN 644 186.99 736 028.53 9.82%USD 8 000.000 MORGAN STANLEY GLOBAL PROPERTY (Z$-Acc) 180 030.01 257 848.81 3.44%USD 26 950.215 MORGAN STANLEY SICAV - US PROPERTY FUND 1 210 730.73 1 412 243.75 18.85%USD 84 298.954 NEUBERGER BERMAN US REAL ESTATE 1 210 663.69 1 388 334.94 18.53%USD 155.247 NN L - GLOBAL RE (I$) 769 764.08 818 204.59 10.92%USD 3 409.200 SCHRODER ISF-ASIA PACIFIC PROPERTY (C$) 484 143.63 455 593.41 6.08%
4 499 519.13 5 068 254.03 67.65%
Total Investments in Investment Funds 6 302 281.17 7 195 909.40 96.05%
Total Investments 6 302 281.17 7 195 909.40 96.05%
4 352 076.74 4 749 980.92 96.24%
Portfolio breakdownAs at December 31, 2015
By countries
France 8.67%Ireland 23.71%Luxembourg 48.33%United-States 19.29%
Total 100.00%
By type of investments
Investment Funds 100.00%
Total 100.00%
The accompanying notes form an integral part of these financial statements. 23
(LF) Fund of Funds - Dynamic Fixed Income
Schedule of investmentsAs at December 31, 2015(All figures in Euros)
Cost Market % of NetCurrency Shares Name Price Price Assets
Transferable securities admitted to an official exchange listing
Investment Funds
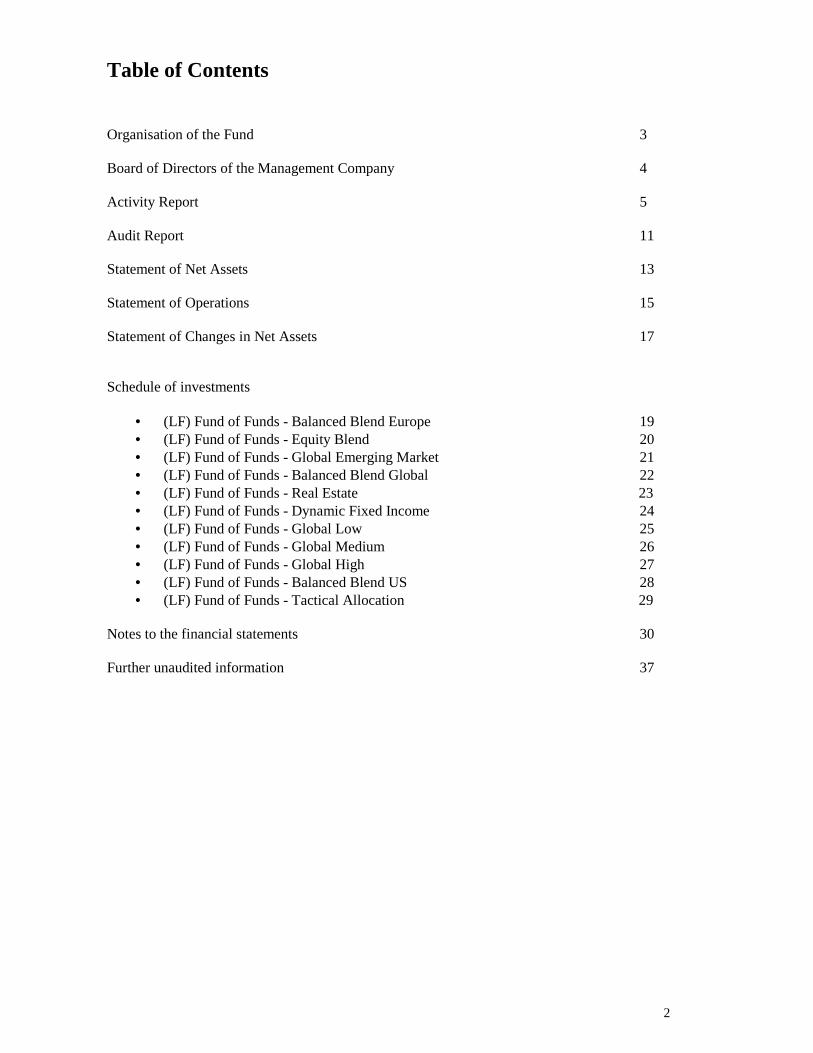
EUR 105.516 AMUNDI BOND EURO INFLATION (I) 166 498.97 163 982.42 9.13%EUR 4 585.146 EUROBANK I (LF) GREEK GOVMNT BOND 90 000.00 84 107.17 4.68%EUR 16 761.460 INVESCO GL INV GR CORPORATE BND 166 500.00 166 441.30 9.27%EUR 724.546 PARVEST BOND EURO INFLATION LINKED 83 250.33 82 025.85 4.56%
506 249.30 496 556.74 27.64%
USD 73.728 AMUNDI BOND GLOBAL CORP (IUC) 170 292.95 169 699.01 9.45%USD 159 953.677 BNY MELLON GL-GLB DYNAMIC BF (C$-Acc) 170 293.33 172 118.80 9.58%USD 17 139.349 FTIF FRANK GLOB AGGG BOND FND 170 293.33 171 283.29 9.54%USD 17 199.248 FTIF TEMP GL AGG INV GRADE 166 106.93 166 826.54 9.29%USD 6 002.596 MSIM GLOBAL FIXED INC OPP-Z 170 293.33 171 912.32 9.57%USD 27.516 NN L-GLOBAL BOND OPPORTUNITIES (I$) 170 427.31 167 209.43 9.31%USD 9 629.931 PIMCO GLOBAL BOND EX-US FUND (I$) 170 293.33 172 395.84 9.60%
1 188 000.51 1 191 445.23 66.33%
Total Investments in Investment Funds 1 694 249.81 1 688 001.97 93.97%
Total Investments 1 694 249.81 1 688 001.97 93.97%
1 246 609.59 1 244 715.46 95.89%
Portfolio breakdownAs at December 31, 2015
By countries
Ireland 20.41%Luxembourg 79.59%
Total 100.00%
By type of investments
Investment Funds 100.00%
Total 100.00%
The accompanying notes form an integral part of these financial statements. 24

(LF) Fund of Funds - Global Low
Schedule of investmentsAs at December 31, 2015(All figures in Euros)
Cost Market % of NetCurrency Shares Name Price Price Assets
Transferable securities admitted to an official exchange listing
Investment Funds
EUR 1 923 216.585 (LF) I EQUITY- GLOBAL EQUTIES FUND 2 121 652.84 2 242 278.22 1.02%EUR 2 283 964.539 (LF) I - MM FUND RESERVE 22 948 764.95 22 931 003.97 10.45%EUR 175 957.467 BNP-INSTICASH EUR (I€?1) 17 904 295.42 17 894 839.03 8.15%EUR 1 774 664.341 EUROBANK I (LF) ABSOLUTE RETURN FUND 2 337 381.35 2 357 109.18 1.07%EUR 214 704.826 EUROBANK I (LF) GREEK GOVMNT BOND 4 000 000.00 3 938 416.51 1.79%EUR 83 300.000 ISHARES B EURO AGG BOND 10 117 079.61 10 017 658.00 4.56%EUR 50 150.000 ISHARES DJ EURO STOXX 50 1 724 428.16 1 659 714.25 0.76%EUR 31 700.000 ISHARES MCSI NORTH AMERICA 1 091 690.77 1 133 909.00 0.52%EUR 100 000.000 ISHARES MSCI ACWI (ETF) 3 257 084.19 3 335 000.00 1.52%EUR 55 500.000 ISHARES MSCI JAPAN ETF 586 799.46 628 260.00 0.29%EUR 91 026.351 PARVEST BD EURO GOVERNMENT 18 682 189.58 18 533 875.33 8.44%EUR 199 767.378 PARVEST ENHANCED CASH 6 MONTHS (I€) 22 399 999.47 22 463 841.66 10.23%EUR 934 917.007 PIMCO EUR SHORT TERM-INS-ACC 11 501 222.43 11 434 035.00 5.21%EUR 65 714.794 PIONEER FDS EUR STRATEGIC BOND (I-I€) 6 873 401.29 6 731 166.35 3.07%EUR 1 844 029.806 PIONEER FDS EURO BOND (I-Acc-€) 20 648 160.37 20 560 932.34 9.37%EUR 4 150.027 PIONEER FDS -GLOBAL SELECT (I€) 6 016 004.16 5 914 618.27 2.69%
152 210 154.05 151 776 657.11 69.14%
USD 112 279.948 MS INVEST F -GLOBAL OPPORT 4 483 352.10 5 046 255.03 2.30%
Total Investments in Investment Funds 156 693 506.15 156 822 912.14 71.44%
Bonds
EUR 3 000 000 OTE PLC 2/12/2019 4.375 FIXED 2 973 180.00 2 984 370.00 1.36%EUR 5 000 000 HELLENIC T-BILL 11/3/2016 0 ZERO COUPON 4 966 100.00 4 983 800.00 2.27%EUR 5 000 000 HELLENIC T-BILL 10/6/2016 0 ZERO COUPON 4 926 050.00 4 949 075.00 2.25%
Total Investments in Bonds 12 865 330.00 12 917 245.00 5.88%
Total transferable securities admitted to an official exchange listing 169 558 836.15 169 740 157.14 77.32%
Other transferable securities and money market instruments
Money Market Instruments
EUR 50 000.000 ECP AXA 29/03/2016 4 998 736.43 4 998 736.43 2.28%EUR 50 000.000 ECP BAT INTIL FIN 19/01/2016 4 999 755.57 4 999 755.57 2.28%
Total Investments in Money Market Instruments 9 998 492.00 9 998 492.00 4.55%
Total other transferable securities and money market instruments 9 998 492.00 9 998 492.00 4.55%
Total Investments 179 557 328.15 179 738 649.14 81.88%
190 611 655.77
Portfolio breakdownAs at December 31, 2015
By countries
France 2.78%Germany 3.71%Greece 5.53%Ireland 14.77%Luxembourg 71.55%United Kingdom 1.66%
Total 100.00%
By type of investments
Bonds 7.19%Commercial Papers 5.56%Investment Funds 87.25%
Total 100.00%
The accompanying notes form an integral part of these financial statements. 25

(LF) Fund of Funds - Global Medium
Schedule of investmentsAs at December 31, 2015(All figures in Euros)
Cost Market % of NetCurrency Shares Name Price Price Assets
Transferable securities admitted to an official exchange listing
Investment Funds
EUR 1 212 537.394 (LF) I EQUITY- GLOBAL EQUTIES FUND 1 374 748.37 1 413 697.35 3.07%EUR 92 942.490 (LF) I - MM FUND RESERVE 933 855.91 933 142.60 2.03%EUR 23 957.228 BNP-INSTICASH EUR (I€?1) 2 437 728.00 2 436 445.24 5.30%EUR 1 490 000.844 EUROBANK I (LF) ABSOLUTE RETURN FUND 1 952 752.16 1 979 019.12 4.30%EUR 192 988.000 EUROBANK I (LF) GLOBAL BOND 2 290 751.86 2 375 045.42 5.16%EUR 41 750.000 ISHARES B EURO AGG BOND 5 039 728.16 5 020 855.00 10.92%EUR 26 000.000 ISHARES DJ EURO STOXX 50 910 721.11 860 470.00 1.87%EUR 31 500.000 ISHARES MCSI NORTH AMERICA 1 051 005.14 1 126 755.00 2.45%EUR 120 350.000 ISHARES MSCI ACWI (ETF) 3 772 863.55 4 013 672.50 8.73%EUR 36 450.000 ISHARES MSCI JAPAN ETF 370 218.08 412 614.00 0.90%EUR 26 301.379 PARVEST BD EURO GOVERNMENT 5 299 999.83 5 355 223.78 11.64%EUR 19 711.493 PARVEST ENHANCED CASH 6 MONTHS (I€) 2 209 999.79 2 216 557.39 4.82%EUR 81 168.831 PIMCO EUR SHORT TERM-INS-ACC 1 000 000.00 992 694.80 2.16%EUR 40 967.211 PIONEER FDS EUR STRATEGIC BOND (I-I€) 4 300 000.00 4 196 271.42 9.12%EUR 478 804.359 PIONEER FDS EURO BOND (I-Acc-€) 5 343 885.11 5 338 668.60 11.61%EUR 2 000.000 PIONEER FDS -GLOBAL SELECT (I€) 2 925 617.98 2 850 399.90 6.20%
41 213 875.05 41 521 532.12 90.27%
USD 49 585.018 MS INVEST F -GLOBAL OPPORT 2 099 099.10 2 228 524.78 4.85%
Total Investments in Investment Funds 43 312 974.15 43 750 056.90 95.12%
Total Investments 43 312 974.15 43 750 056.90 95.12%
1 246 609.59 1 244 715.46 95.89
Portfolio breakdownAs at December 31, 2015
By countries
Luxembourg 71.60%Germany 1.96%Ireland 26.44%
Total 100.00%
By type of investments
Investment Funds 100.00%
Total 100.00%
The accompanying notes form an integral part of these financial statements. 26

(LF) Fund of Funds - Global High
Schedule of investmentsAs at December 31, 2015(All figures in Euros)
Cost Market % of NetCurrency Shares Name Price Price Assets
Transferable securities admitted to an official exchange listing
Investment Funds
EUR 4 177.438 (LF) EQUITY - MENA FUND (ERB I €) 56 192.19 54 522.67 0.46%EUR 506 132.000 (LF) I EQUITY- GLOBAL EQUTIES FUND 534 625.21 590 099.30 4.99%EUR 455 869.617 (LF)I EQUITY- EMERGING EUROPE FUND 378 839.65 310 720.73 2.63%EUR 1 666.695 BNP-INSTICASH EUR (I€?1) 169 591.57 169 502.57 1.43%EUR 361 400.000 EUROBANK I (LF) ABSOLUTE RETURN FUND 474 737.62 480 011.48 4.06%EUR 9 040.000 ISHARES B EURO AGG BOND 1 105 049.69 1 087 150.40 9.20%EUR 24 750.000 ISHARES DJ EURO STOXX 50 879 213.75 819 101.25 6.93%EUR 34 400.000 ISHARES MCSI NORTH AMERICA 1 128 127.31 1 230 488.00 10.41%EUR 43 000.000 ISHARES MSCI ACWI (ETF) 1 359 712.69 1 434 050.00 12.14%EUR 28 500.000 ISHARES MSCI JAPAN ETF 290 479.82 322 620.00 2.73%EUR 11 081.060 PIONEER FDS EUR STRATEGIC BOND (I-I€) 1 150 000.00 1 135 032.98 9.61%EUR 83 597.029 PIONEER FDS EURO BOND (I-Acc-€) 930 000.00 932 106.87 7.89%EUR 952.016 PIONEER FDS -GLOBAL SELECT (I€) 1 366 763.05 1 356 813.16 11.48%
9 823 332.55 9 922 219.41 83.97%
USD 31 274.412 MS INVEST F -GLOBAL OPPORT 1 309 656.62 1 405 581.87 11.89%
Total Investments in Investment Funds 11 132 989.17 11 327 801.28 95.86%
Total Investments 11 132 989.17 11 327 801.28 95.86%
1 246 609.59 1 244 715.46 95.89
Portfolio breakdownAs at December 31, 2015
By countries
Luxembourg 56.80%Germany 7.23%Ireland 35.97%
Total 100.00%
By type of investments
Investment Funds 100.00%
Total 100.00%
The accompanying notes form an integral part of these financial statements. 27

(LF) Fund of Funds - Balanced Blend US
Schedule of investmentsAs at December 31, 2015(All figures in Euros)
Cost Market % of NetCurrency Shares Name Price Price Assets
Transferable securities admitted to an official exchange listing
Investment Funds
EUR 18 000.000 ISHARES BAR CAP US AGG BOND ETF 1 620 242.22 1 685 520.00 5.65%EUR 7 300.000 ISHARES MSCI USA UCITS ETF 1 114 239.00 1 265 090.00 4.24%EUR 193 550.135 PIONEER FDS US PIONEER (I-Acc-€) 1 700 000.00 1 707 112.19 5.72%EUR 13 300.000 PowerShares Global EQQQ Nasdaq 1 144 315.00 1 395 037.00 4.68%
5 578 796.22 6 052 759.19 20.29%
USD 112 821.240 FIDELITY FUNDS-AMERICA-Y ACC 1 658 340.14 1 811 440.50 6.07%USD 66 085.955 FRANKLIN U.S. OPPORTUNITIES FUND (I$) 1 636 979.28 1 857 472.42 6.23%USD 103 923.387 FT- STRATEGIC INCOME (I ACC$) 1 407 136.47 1 386 026.99 4.65%USD 82 093.993 FTIF-FRANK MUT BEACON FUND (I$-Acc) 1 371 072.65 1 404 050.84 4.71%USD 160 433.843 FTIF-FRANK US GOVERNMENT FUND (I$-Acc) 1 877 781.39 2 018 869.89 6.77%USD 121 600.807 GS US EQUITY PORTFOLIO (I$-Acc) 1 629 425.32 1 714 496.54 5.75%USD 40 000.000 MORGAN STANLEY SICAV - US PROPERTY FUND 2 065 379.13 2 096 077.89 7.03%USD 41 307.297 MORGAN STANLEY US EQUITY GROWTH (Z$-Acc) 1 711 161.11 1 937 690.51 6.50%USD 14 859.934 PARVEST BOND USD GOV CLASSIC MD 2 165 217.95 2 263 727.57 7.59%USD 2 584.748 PICTET-USD GOVERNMENT BONDS (I$) 1 531 748.98 1 502 083.55 5.04%USD 82 146.414 PIMCO GIS Diversified Income Inst USD 1 450 312.75 1 435 883.40 4.81%USD 963.643 PIONEER FDS $ AGG BD 1 869 014.14 1 953 866.45 6.55%USD 13 288.730 PIONEER FDS STRATEGIC INCOME (I€) 1 367 007.26 1 437 506.87 4.82%
21 740 576.57 22 819 193.42 76.50%
Total Investments in Investment Funds 27 319 372.79 28 871 952.61 96.79%
Total Investments 27 319 372.79 28 871 952.61 96.79%
1 246 609.59 1 244 715.46 95.89%
Portfolio breakdownAs at December 31, 2015
By countries
Germany 5.83%Ireland 14.19%Luxembourg 79.98%
Total 100.00%
By type of investments
Investment Funds 100.00%
Total 100.00%
The accompanying notes form an integral part of these financial statements. 28

(LF) Fund of Funds - Tactical Allocation
Schedule of investmentsAs at December 31, 2015(All figures in Euros)
Cost Market % of NetCurrency Shares Name Price Price Assets
Transferable securities admitted to an official exchange listing
Investment Funds
EUR 2 598.389 (LF) I - MM FUND RESERVE 26 090.00 26 087.83 16.34%EUR 19 972.969 EUROBANK I (LF) ABSOLUTE RETURN FUND 26 600.00 26 528.10 16.61%EUR 1 997.512 EUROBANK I (LF) GLOBAL BOND 24 890.00 24 582.78 15.39%EUR 200.000 ISHARES B EURO AGG BOND 24 268.00 24 052.00 15.06%EUR 400.000 ISHARES DJ EURO STOXX 50 14 090.00 13 238.00 8.29%EUR 100.000 ISHARES MCSI NORTH AMERICA 3 750.00 3 577.00 2.24%EUR 500.000 ISHARES MSCI ACWI (ETF) 17 430.00 16 675.00 10.44%EUR 300.000 ISHARES MSCI JAPAN ETF 3 528.00 3 396.00 2.13%
Total Investments in Investment Funds 140 646.00 138 136.71 86.50%
Total Investments 140 646.00 138 136.71 86.50%
1 246 609.59 1 244 715.46 95.89%
Portfolio breakdownAs at December 31, 2015
By countries
Germany 9.57%Ireland 34.53%Luxembourg 55.90%
Total 100.00%
By type of investments
Investment Funds 100.00%
Total 100.00%
The accompanying notes form an integral part of these financial statements. 29
30
Notes to the financial statements As at December 31, 2015
1. General (LF) Fund of Funds (“the Fund”) is an open-ended investment fund and has been created on September 18, 2006 as a mutual investment fund (“Fonds Commun de Placement”) organised under Part I of the Luxembourg Law of December 17, 2010, as amended, relating to Undertakings for Collective Investment (the “2010 Law”). The Fund is managed by Eurobank Fund Management Company (Luxembourg) S.A. (the “Management Company”), a company incorporated under the laws of Luxembourg and having its registered office in Luxembourg. The Management Company may issue units in several classes (collectively “Classes” and each a “Class”) in each Sub-Fund having: (i) a specific sales and redemption charge structure and/or (ii) a specific management or advisory fee structure and/or (iii) different distribution, unitholder servicing or other fees and/or (iv) different types of targeted investors or distribution channels and/or (v) a different hedging structure and/or (vi) such other features as may be determined by the Board of Directors of the Management Company from time to time. As at December 31, 2015, the following sub-funds are active.
Sub-Funds - Classes of Units Launched
Date (LF) Fund of Funds - Balanced Blend Europe - Eurobank 01/10/2014
(LF) Fund of Funds - Balanced Blend Europe - Eurobank I 14/10/2014
(LF) Fund of Funds - Balanced Blend Europe - Private Banking 04/12/2014
(LF) Fund of Funds - Equity Blend - Eurobank 18/09/2006
(LF) Fund of Funds - Equity Blend - Eurobank (USD) 20/09/2011
(LF) Fund of Funds - Equity Blend - Eurobank I 18/09/2006
(LF) Fund of Funds - Equity Blend - Private Banking 15/10/2014
(LF) Fund of Funds - Equity Blend - Postbank (BGN) 18/12/2007
(LF) Fund of Funds - Equity Blend - Bancpost 14/12/2009
(LF) Fund of Funds - Equity Blend - Private Banking (USD) 21/05/2015
(LF) Fund of Funds - Global Emerging Markets - Eurobank 28/09/2007
(LF) Fund of Funds - Global Emerging Markets - Eurobank (USD) 20/09/2011
(LF) Fund of Funds - Global Emerging Markets - Eurobank I 21/09/2007
(LF) Fund of Funds - Global Emerging Markets - Private Banking 15/10/2014
(LF) Fund of Funds - Global Emerging Markets - Interamerican 26/11/2007
(LF) Fund of Funds - Global Emerging Markets - Postbank (BGN) 18/12/2007
(LF) Fund of Funds - Global Emerging Markets - Bancpost 12/10/2009
(LF) Fund of Funds - Balanced Blend Global - Eurobank 28/01/2008
(LF) Fund of Funds - Balanced Blend Global - Eurobank (USD) 20/09/2011
(LF) Fund of Funds - Balanced Blend Global - Eurobank I 03/03/2008
(LF) Fund of Funds - Balanced Blend Global - Private Banking 14/10/2014
(LF) Fund of Funds - Balanced Blend Global - Private Banking USD 14/10/2014
(LF) Fund of Funds - Balanced Blend Global - Postbank 03/03/2008
(LF) Fund of Funds - Balanced Blend Global - Bancpost 01/10/2010
(LF) Fund of Funds - Balanced Blend Global - Interamerican 02/12/2015

31
Notes to the financial statements As at December 31, 2015 (continued) 1. General (continued) (LF) Fund of Funds - Real Estate - Eurobank 21/06/2010
(LF) Fund of Funds - Real Estate - Eurobank (USD) 09/07/2010
(LF) Fund of Funds - Real Estate - Private Banking 23/12/2014
(LF) Fund of Funds - Real Estate - Private Banking USD 30/10/2014
(LF) Fund of Funds - Real Estate - Interamerican 09/12/2010
(LF) Fund of Funds - Real Estate - Postbank 29/09/2010
(LF) Fund of Funds - Real Estate - Postbank (USD) 29/09/2010
(LF) Fund of Funds - Real Estate - Bancpost 30/09/2010
(LF) Fund of Funds - Dynamic Fixed Income - Eurobank I 10/09/2012
(LF) Fund of Funds - Global Low - Eurobank 16/09/2013
(LF) Fund of Funds - Global Low - Private Banking 10/10/2014
(LF) Fund of Funds - Global Low - Private Banking Dis 05/06/2015
(LF) Fund of Funds - Global Low - Bancpost (RON) 12/05/2015
(LF) Fund of Funds - Global Low - Postbank (BGN) 17/04/2015
(LF) Fund of Funds - Global Medium - Eurobank 16/09/2013
(LF) Fund of Funds - Global Medium - Private Banking 08/10/2014
(LF) Fund of Funds - Global Medium - Private Banking DIS 08/06/2015
(LF) Fund of Funds - Global Medium - Bancpost (RON) 12/05/2015
(LF) Fund of Funds - Global High - Eurobank 16/09/2013
(LF) Fund of Funds - Global High - Private Banking 14/01/2015
(LF) Fund of Funds - Global High - Bancpost (RON) 12/05/2015
(LF) Fund of Funds - Balanced Blend US - Eurobank 01/10/2014
(LF) Fund of Funds - Balanced Blend US - Eurobank I 14/10/2014
(LF) Fund of Funds - Balanced Blend US - Eurobank USD 03/10/2014
(LF) Fund of Funds - Balanced Blend US - Private banking 16/01/2015
(LF) Fund of Funds - Balanced Blend US - Private banking (USD) 04/02/2015
(LF) Fund of Funds - Tactical Allocation - Interamerican 10/07/2015
2. Summary of significant accounting policies The financial statements are prepared in accordance with Luxembourg regulations relating to undertakings for collective investments. a) Basis of presentation of the financial statements The financial statements of each sub-fund are kept in the following currency
- (LF) Fund of Funds - Balanced Blend Europe EUR - (LF) Fund of Funds - Equity Blend EUR - (LF) Fund of Funds - Global Emerging Markets EUR - (LF) Fund of Funds - Balanced Blend Global EUR - (LF) Fund of Funds - Real Estate EUR - (LF) Fund of Funds - Dynamic Fixed Income EUR - (LF) Fund of Funds - Global Low EUR

32
Notes to the financial statements As at December 31, 2015 (continued) 2. Summary of significant accounting policies (Continued) - (LF) Fund of Funds - Global Medium EUR - (LF) Fund of Funds - Global High EUR - (LF) Fund of Funds - Balanced Blend US EUR - (LF) Fund of Funds - Tactical Allocation EUR The consolidated financial statements of the Fund reflecting the assets and liabilities of all portfolios are expressed in Euro. b) Security Valuation Securities quoted or dealt in on any stock exchange or another regulated market are valued at the latest available price. When such prices are not representative of the fair value of the relevant securities and in the case of unquoted securities, the valuation is based on the respective reasonable foreseeable sales price as determined prudently and in good faith by the Board of Directors of the Management Company of the Fund. Cash equivalent or money market instruments with a remaining maturity of 60 days or less are stated at amortized cost, which approximates market value.
Investments in open-ended UCIs are valued on the basis of the last available NAV of the units or shares of such UCIs. c) Realised gains and losses on sales of investments in securities Investments in securities are accounted for on a trade date basis. Realised gains and losses on sales of investments in securities are based on the average cost basis. d) Foreign currency translation The cost of investments and the transactions during the year, expressed in foreign currencies, are converted into the reporting currency of each Sub-Fund at the rate of exchange ruling at the time of the purchase or transaction. The market value of investments and other assets and other liabilities, expressed in foreign currencies, are translated into the reporting currency of each Sub-Fund at year-end exchange rates. Exchange differences arising on foreign currency translation are taken to statement of operations. The consolidated statement is calculated at year-end exchange rates.

33
Notes to the financial statements As at December 31, 2015 (continued) d) Foreign currency translation(continued) Closing exchange rates as at December 31, 2015 relating to EUR are: 1 USD = 0.9185 EUR 1 BGN = 0.5113 EUR 1 RON = 0.2210 EUR 1 PLN = 0.2345 EUR e) Interest and Dividend income Interest income is recognized on an accrual basis, net of any irrecoverable withholding tax. Dividends are recorded on an ex-dividend basis and net of any irrecoverable withholding tax. f) Formation expenses Formation expenses are amortised over a period of 5 years and are allocated to the relevant Sub-Funds or are allocated to the different Sub-Funds in proportion to their respective weight in the total net assets at the end of their related subscription period. 3. Management fees Management fees are due by each Sub-Fund to the Management Company and are calculated daily based on the net assets of each class of Units during the month and are payable monthly. As at December 31, 2015 the following rates are applicable per annum: (LF) Fund of Funds - Balanced Blend Europe - Eurobank 1.25%
(LF) Fund of Funds - Balanced Blend Europe - Eurobank I 0.63%
(LF) Fund of Funds - Balanced Blend Europe - Private Banking 1.25%
(LF) Fund of Funds - Equity Blend - Eurobank 1.75%
(LF) Fund of Funds - Equity Blend - Eurobank (USD) 1.75%
(LF) Fund of Funds - Equity Blend - Eurobank I 0.70%
(LF) Fund of Funds - Equity Blend - Private Banking 1.75%
(LF) Fund of Funds - Equity Blend - Postbank 2.00%
(LF) Fund of Funds - Equity Blend - Bancpost 2.00%
(LF) Fund of Funds - Equity Blend - Private Banking (USD) 1.75% (A)
(LF) Fund of Funds - Global Emerging Markets - Eurobank 2.00%
(LF) Fund of Funds - Global Emerging Markets - Eurobank (USD) 2.00%
(LF) Fund of Funds - Global Emerging Markets - Eurobank I 1.00%
(LF) Fund of Funds - Global Emerging Markets - Interamerican 2.00%
(LF) Fund of Funds - Global Emerging Markets - Private Banking 2.00%
(LF) Fund of Funds - Global Emerging Markets - Postbank 2.50%
(LF) Fund of Funds - Global Emerging Markets - Bancpost 2.50%
(LF) Fund of Funds - Balanced Blend Global - Eurobank 1.25%
(LF) Fund of Funds - Balanced Blend Global - Eurobank (USD) 1.25%
(LF) Fund of Funds - Balanced Blend Global - Eurobank I 0.63%
(LF) Fund of Funds - Balanced Blend Global - Interamerican 1.25% (K)
(LF) Fund of Funds - Balanced Blend Global - Private Banking 1.25%
vipalaor

34
Notes to the financial statements As at December 31, 2015 (continued) 3. Management fees (continued) (LF) Fund of Funds - Balanced Blend Global - Private Banking USD 1.25%
(LF) Fund of Funds - Balanced Blend Global - Postbank 1.50%
(LF) Fund of Funds - Balanced Blend Global - Bancpost 1.50%
(LF) Fund of Funds - Real Estate - Eurobank 1.75% (B)
(LF) Fund of Funds - Real Estate - Eurobank (USD) 1.75% (B)
(LF) Fund of Funds - Real Estate - Private Banking 1.75% (B)
(LF) Fund of Funds - Real Estate - Private Banking USD 1.75% (B)
(LF) Fund of Funds - Real Estate - Interamerican 1.50%
(LF) Fund of Funds - Real Estate - Postbank 1.50%
(LF) Fund of Funds - Real Estate - Postbank (USD) 1.50%
(LF) Fund of Funds - Real Estate - Bancpost 1.50%
(LF) Fund of Funds - Dynamic Fixed Income - Eurobank I 0.75%
(LF) Fund of Funds - Global Low - Eurobank 0.75%
(LF) Fund of Funds - Global Low - Private Banking 0.75%
(LF) Fund of Funds - Global Low - Private banking DIS 0.75% (C)
(LF) Fund of Funds - Global Low - Bancpost (RON) 0.75% (D)
(LF) Fund of Funds - Global Low - Postbank (BGN) 0.75%
(LF) Fund of Funds - Global Medium - Eurobank 1.00%
(LF) Fund of Funds - Global Medium - Private Banking 1.00%
(LF) Fund of Funds - Global medium - Private Banking DIS 1% (E)
(LF) Fund of Funds - Global Medium - Bancpost (RON) 1% (F)
(LF) Fund of Funds - Global High - Eurobank 1.25%
(LF) Fund of Funds - Global High - Private Banking 1.25% (G)
(LF) Fund of Funds - Global High - Bancpost (RON) 1.25% (H)
(LF) Fund of Funds - Balanced Blend US - Eurobank 1.25%
(LF) Fund of Funds - Balanced Blend US - Eurobank I 0.63%
(LF) Fund of Funds - Balanced Blend US - Eurobank USD 1.25%
(LF) Fund of Funds - Balanced Blend US - Private Banking 1.25% (I)
(LF) Fund of Funds - Balanced Blend US - Private Banking (USD) 1.25% (J)
(LF) Fund of Funds - Tactical Allocation - Interamerican 0.00%
(A) : 0% until 21/05/15 ; 1.75% from 22/05/15 (B) : 1.5% until 31/05/15 ; 1.75% from 01/06/15 (C) : 0% until 05/06/15 ; 0.75% from 06/06/15 (D) : 0% until 12/05/15 ; 0.75% from 13/05/15 (E) : 0% until 08/06/15 ; 1% from 09/06/15 (F) : 0% until 12/05/15 ; 1% from 13/05/15 (G) : 0% until 14/01/15 ; 1.25% from 15/01/15 (H) : 0% until 12/05/15 ; 1.25% from 13/05/15 (I) : 0% until 16/01/15 ; 1.25% from 17/01/15 (J) : 0% until 04/02/15 ; 1.25% from 05/02/15 (K) : 1.25% from 03/12/15
vipalaor

35
Notes to the financial statements As at December 31, 2015 (continued) 3. Management fees (continued) Subscription, redemption and conversion fees payable to distributors are not included in the management fee. The Management Company shall pay, out of the management fees and expenses: - the fees and expenses due to the investment manager and any granted sub-investment manager; - the fees and expenses due to the administrative and registrar agent; - the fees and expenses due to the distributors. Management fees may be charged at both levels (the Sub-Fund and target UCITS/UCIs) but the aggregate amount of management fees on the portion of assets invested in target UCITS/UCIs will not exceed 4% p.a. of the net assets.
4. Custodian fees In consideration for its services, the Custodian is entitled to receive out of the assets of the relevant Sub-Fund a fee (the “Depositary Fee”) payable at the end of each month in arrears at an annual rate not exceeding the percentage amount indicated in the Appendix of the Prospectus relevant to each Sub-Fund. This percentage amount will be calculated on a daily basis on the Net Asset Value of that day of the relevant Class over the period by reference to which the fee is calculated. The Custodian may also receive transaction-based fees. 5. Administrative fees and Registrar Agent The Management Company shall pay, out of the Management Fee, the fees and expenses due to the Administrative and Registrar Agent. The Administrative and Registrar Agent may also receive from the Fund transaction-based fees, which will be payable in addition to the Management Fee. 6. Taxation The Fund is liable in Luxembourg to an annual tax (the "taxe d'abonnement") of 0.05%, calculated and payable quarterly, on the aggregate Net Asset Value of the outstanding units of the Fund at the end of each quarter. This annual tax is however reduced to 0.01% on the aggregate Net Asset Value of the units in the Classes reserved to institutional investors as well as in Sub-Funds that invest exclusively in certain short-term transferable debt securities and other instruments pursuant to the Grand-Ducal Regulation of April 14, 2004. This rate is reduced to 0% for the portion of the assets of the Fund invested in other Luxembourg undertakings for collective investment already submitted to an annual tax. No tax is payable in Luxembourg on realised or unrealised capital appreciation of the assets of the Fund. 7. Brokerage and transaction fees Transaction fees incurred by the Fund relating to purchase or sale of transferable securities, money market instruments, derivatives or other eligible assets are mainly composed of (Broker Fees, Transfer Fee, Stock Exchange Fee). For purchase or sale on bonds there are no transaction fees. The amounts of the transaction fees are reflected in the Statement of Operations in the line “Brokerage and transaction fees”.

36
Notes to the financial statements As at December 31, 2015 (continued) 8. Statement of changes in investments A list, for each Sub-Fund, specifying for each investment the total purchases and sales which occurred during the year under review, may be obtained free of charge, upon request, at the Registered Office of the Management Company.

Su
b-F
un
d N
am
eG
lob
al
Ex
po
sure
Me
tho
dC
urr
en
t In
tern
al
Va
R L
imit
Low
est
Va
R
Uti
liza
tio
n
(re
gu
lato
ry
lim
it)
Hig
he
st V
aR
Uti
liza
tio
n
(re
gu
lato
ry
lim
it)
Av
era
ge
Va
R
Uti
liza
tio
n
(re
gu
lato
ry
lim
it)
RIS
K_
BM
KT
yp
e o
f M
od
el
Co
nfi
de
nce
Lev
el
Ho
ldin
g
Pe
rio
d
Ob
serv
ati
o
n P
eri
od
Lev
era
ge
Me
tho
dLe
ve
rag
e
Lim
it
Av
era
ge
Lev
era
ge
Fu
nd
of
Fu
nd
s
(LF
) F
UN
D O
F F
UN
DS
- B
ALA
NC
ED
BLE
ND
EU
RO
PE
Re
lati
ve
Va
R1
80
% o
f B
en
chm
ark
Va
R2
3.0
2%
47
.02
%3
5.7
1%
50
% M
SC
I E
UR
OP
E +
50
% M
L E
MU
BR
OA
D I
ND
EX
His
tori
cal
Sim
ula
tio
n9
9%
21
Da
ys
1 Y
ea
rS
um
of
No
tio
na
ls1
00
%0
.00
%
(LF
) F
UN
D O
F F
UN
DS
- B
ALA
NC
ED
BLE
ND
GLO
BA
L
Re
lati
ve
Va
R1
80
% o
f B
en
chm
ark
Va
R3
0.2
0%
52
.40
%4
0.9
8%
40
% M
SC
I A
C W
OR
LD
+ 4
5%
ML
EM
U B
RO
AD
IN
DE
X+
10
% B
LOO
MB
ER
G C
OM
MO
DIT
Y I
ND
EX
+
5%
FT
SE
EP
RA
/NA
RE
IT D
EV
ELO
PE
D I
ND
EX
His
tori
cal
Sim
ula
tio
n9
9%
21
Da
ys
1 Y
ea
rS
um
of
No
tio
na
ls1
00
%0
.00
%
(LF
) F
UN
D O
F F
UN
DS
- B
ALA
NC
ED
BLE
ND
US
Re
lati
ve
Va
R1
80
% o
f B
en
chm
ark
Va
R3
6.3
1%
52
.08
%4
6.6
8%
50
% M
SC
I U
SA
+ 5
0%
ML
US
BR
OA
D I
ND
EX
His
tori
cal
Sim
ula
tio
n9
9%
21
Da
ys
1 Y
ea
rS
um
of
No
tio
na
ls1
00
%0
.00
%
(LF
) F
UN
D O
F F
UN
DS
- D
YN
AM
IC F
IXE
D I
NC
OM
ER
ela
tiv
e V
aR
18
0%
of
Be
nch
ma
rk V
aR
32
.92
%9
0.2
2%
50
.38
%G
BM
I M
L G
LOB
AL
BR
OA
D M
AK
ET
IN
DE
XH
isto
rica
l S
imu
lati
on
99
%2
1 D
ay
s1
Ye
ar
Su
m o
f N
oti
on
als
10
0%
0.0
0%
(LF
) F
UN
D O
F F
UN
DS
- E
QU
ITY
BLE
ND
Re
lati
ve
Va
R1
80
% o
f B
en
chm
ark
Va
R4
2.4
1%
63
.11
%4
8.7
0%
90
% M
SC
I A
C W
OR
LD
+ 1
0%
EO
NIA
TR
IN
DE
XH
isto
rica
l S
imu
lati
on
99
%2
1 D
ay
s1
Ye
ar
Su
m o
f N
oti
on
als
10
0%
0.0
0%
(LF
) F
UN
D O
F F
UN
DS
- G
LOB
AL
EM
ER
GIN
G M
AR
KE
TS
Re
lati
ve
Va
R1
80
% o
f B
en
chm
ark
Va
R4
1.8
1%
55
.64
%4
8.4
3%
MS
CI
ΕΜ
ER
GIN
G M
AR
KE
TS
IN
DE
XH
isto
rica
l S
imu
lati
on
99
%2
1 D
ay
s1
Ye
ar
Su
m o
f N
oti
on
als
10
0%
0.0
0%
(LF
) F
UN
D O
F F
UN
DS
– G
LOB
AL
HIG
HR
ela
tiv
e V
aR
18
0%
of
Be
nch
ma
rk V
aR
37
.26
%6
8.5
0%
48
.65
%6
5%
MS
CI
AC
WO
RLD
+ 3
0%
ME
RR
ILL
LYN
CH
EM
U B
RO
AD
MA
RK
ET
IN
DE
X
+ 5
% E
ON
IA T
R I
ND
EX
His
tori
cal
Sim
ula
tio
n9
9%
21
Da
ys
1 Y
ea
rS
um
of
No
tio
na
ls1
00
%0
.00
%
(LF
) F
UN
D O
F F
UN
DS
– G
LOB
AL
LOW
Re
lati
ve
Va
R1
80
% o
f B
en
chm
ark
Va
R2
4.1
9%
75
.53
%4
2.8
2%
10
% M
SC
I A
C W
OR
LD +
25
% M
ER
RIL
L LY
NC
H E
MU
BR
OA
D M
AR
KE
T I
ND
EX
+ 6
5%
EO
NIA
TR
IN
DE
XH
isto
rica
l S
imu
lati
on
99
%2
1 D
ay
s1
Ye
ar
Su
m o
f N
oti
on
als
10
0%
0.0
0%
(LF
) F
UN
D O
F F
UN
DS
– G
LOB
AL
ME
DIU
MR
ela
tiv
e V
aR
18
0%
of
Be
nch
ma
rk V
aR
26
.23
%7
1.0
8%
41
.67
%3
0%
MS
CI
AC
WO
RLD
+ 5
5%
ME
RR
ILL
LYN
CH
EM
U B
RO
AD
MA
RK
ET
IN
DE
X
+ 1
5%
EO
NIA
TR
IN
DE
XH
isto
rica
l S
imu
lati
on
99
%2
1 D
ay
s1
Ye
ar
Su
m o
f N
oti
on
als
10
0%
0.0
0%
(LF
) F
UN
D O
F F
UN
DS
- R
EA
L E
ST
AT
ER
ela
tiv
e V
aR
18
0%
of
Be
nch
ma
rk V
aR
30
.72
%5
1.5
3%
43
.29
%5
0%
FT
SE
EP
RA
/NA
RE
IT D
EV
ELO
PE
D I
ND
EX
+ 5
0%
FT
SE
EP
RA
/NA
RE
IT N
AM
ER
ICA
IN
DE
XH
isto
rica
l S
imu
lati
on
99
%2
1 D
ay
s1
Ye
ar
Su
m o
f N
oti
on
als
10
0%
0.0
0%
(LF
) F
UN
D O
F F
UN
DS
- T
AC
TIC
AL
ALL
OC
AT
ION
Ab
solu
te V
aR
1 M
ON
TH
AB
SO
LUT
E V
aR
LIM
IT 9
.5%
35
.11
%4
0.2
0%
36
.65
%1
MO
NT
H A
BS
OLU
TE
Va
R L
IMIT
His
tori
cal
Sim
ula
tio
n9
9%
21
Da
ys
1 Y
ea
rS
um
of
No
tio
na
ls1
00
%0
.00
%
37
9. Further unaudited information
Value at Risk (VaR)
Related Documents