Leveraging Performance Counters and Execution Logs to Diagnose Memory‐Related Performance Issues Mark D. Syer, Zhen Ming Jiang, Meiyappan Nagappan, Ahmed E. Hassan, Mohamed Nasser and Parminder Flora [email protected] 1

Leveraging performance counters and execution logs to diagnose memory related performance issues
Aug 14, 2015
Welcome message from author
This document is posted to help you gain knowledge. Please leave a comment to let me know what you think about it! Share it to your friends and learn new things together.
Transcript

Leveraging Performance Countersand Execution Logs to Diagnose
Memory‐Related Performance Issues
Mark D. Syer, Zhen Ming Jiang, Meiyappan Nagappan, Ahmed E. Hassan, Mohamed Nasser and Parminder Flora
1

2

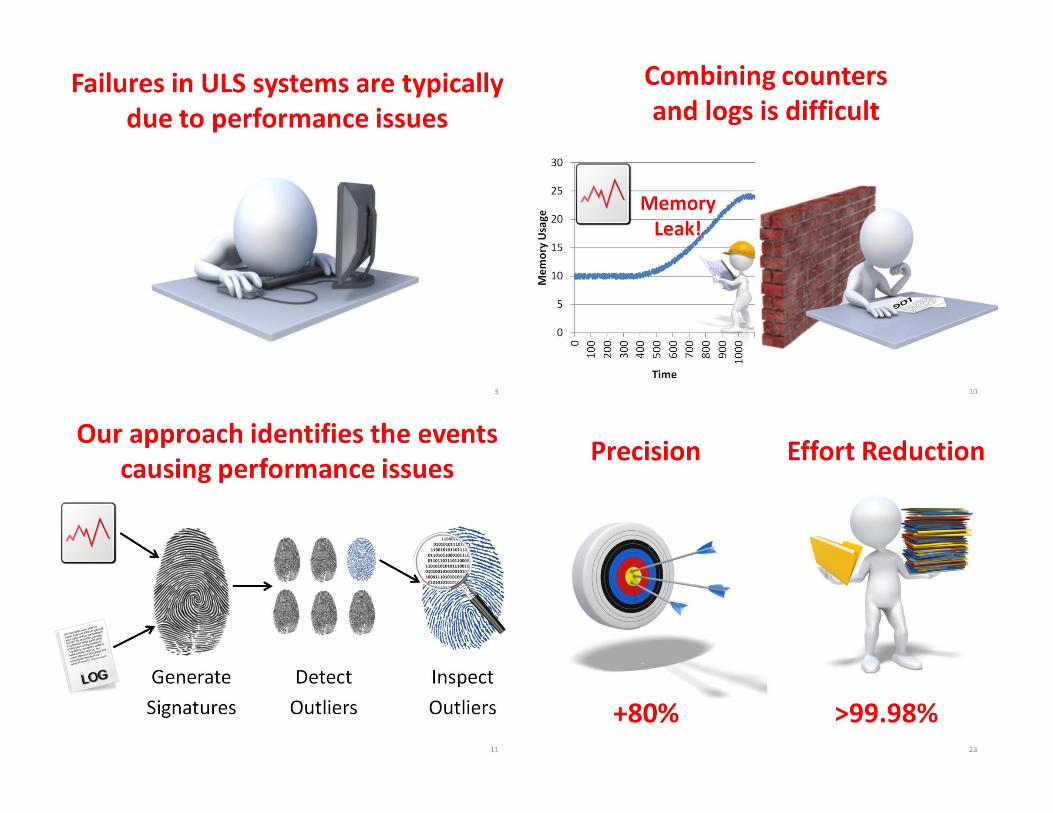
Failures in ULS systems are typically due to performance issues
3

4

“...triggered a latent memory leak… By Mondaymorning, the rate of memory loss became quitehigh and consumed enough memory on theaffected storage servers that they were unableto keep up with normal request handlingprocesses.”
5
Load testing may detect
failures before they occur in the field
6

7
Performance analysts collectcounters & logs

0
5
10
15
20
25
30
0100
200
300
400
500
600
700
800
900
1000
Mem
ory Usage
Time8
Memory Leak!
Diagnosing memory issues requires counters and logs

Diagnosing memory‐issues
is difficult
9
Huge amount of data
Rapidly evolving systems

0
5
10
15
20
25
30
0100
200
300
400
500
600
700
800
900
1000
Mem
ory Usage
Time10
Combining counters and logs is difficult
Memory Leak!

GenerateSignatures
DetectOutliers
InspectOutliers
Our approach identifies the events causing performance issues
11

0
5
10
15
20
00:00 00:08 00:16 00:24
Mem
ory (M
B)
Time
12
We generate a signature each time memory is sampled
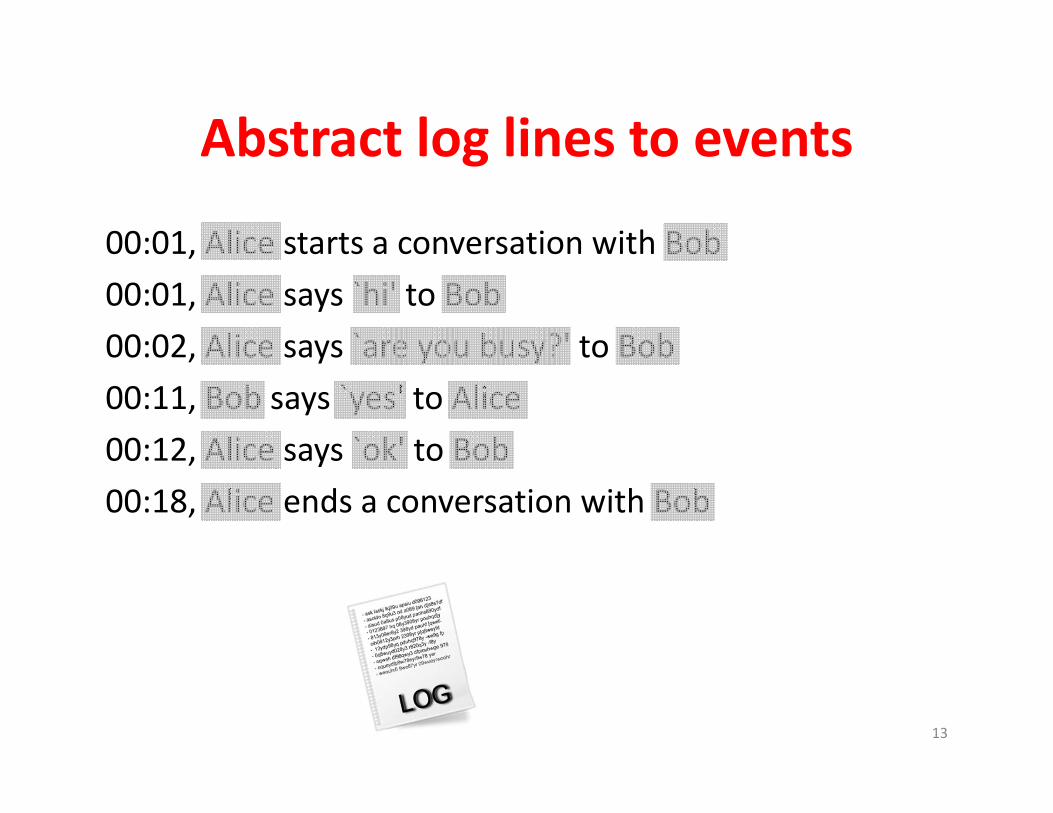
Abstract log lines to events
00:01, Alice starts a conversation with Bob00:01, Alice says `hi' to Bob00:02, Alice says `are you busy?' to Bob00:11, Bob says `yes' to Alice00:12, Alice says `ok' to Bob00:18, Alice ends a conversation with Bob
13

00:00, 5MB00:08, 15MB00:16, 15MB00:24, 5MB
Combine the counters and events
00:01, USER starts a conversation with USER 00:01, USER says MSG to USER 00:02, USER says MSG to USER 00:11, USER says MSG to USER 00:12, USER says MSG to USER 00:18, USER ends a conversation with USER
14

Count the events and calculate the memory delta in each time interval
00:08 00:16 00:24USER starts a conversation with USER 1 0 0USER says MSG to USER 2 2 0USER ends a conversation with USER 0 0 1ΔMemory 10MB 0 ‐10MB
15

DetectOutliers
InspectOutliers
We identify and inspect outlying signatures
16

Can we diagnose...
17
Memory bloat?
Memory leaks?
Memory spikes?

Effort ReductionEffort ReductionPrecision
18

Our approach flags eventswith high precision
0
20
40
60
80
100
Memory bloat Memory leak Memory spike
Precision
19

+80%
Effort ReductionPrecision
20
Precision
+80%

Our approach flags a small numberof events for expert analysis
0
1,000
2,000
3,000
4,000
5,000
6,000
# Log Lines # Flagged Events
21
5,303
1
99.98%

Our approach flags a small numberof events for expert analysis
99.9
99.92
99.94
99.96
99.98
100
Memory bloat Memory leak Memory spike
22

Effort Reduction
23
>99.98%+80%
Precision
+80%
Precision
24
Related Documents