Basic Business Finance 8.1 Leverages LESSON -8 LEVERAGES AND MEASUREMENT 8.0 Objective : The main objective of this lesson are to explain the: * Concept of leverage and types of leverages; * Measurement of different types of leverages; * EB1T-EPS analysis and point of indifference * Concept of break-even analysis and its calculations STRUCTURE: 8.1 Meaning of Leverage 8.2 Types of leverages 8.3 Measurement of Financial Leverage: 8.4 Measurement of Operating Leverage 8.5 Concept of Break-even Analysis 8.6 Combined Leverage - Meaning and Measurement 8.7 Importance of Financial and Operating Leverages 8.8 Summary 8.9 Key Words 8.10 Self - Assessment Questions 8.11 Further Readings 8.1 Meaning of leverage: The term leverage refers to ‘an increased means for accomplishing some purpose’. In financial management, the concept of leverage means the employment of an asset or resource of finance, which involves some, fixed operating cost or fixed return, which is the fulcrum of leverage. If a firm is not required to pay fixed cost or return, there will be no leverage. Thus, the Leverage influences the earnings of equity shareholders and the risk to them as well. A higher leverage results in higher earnings and greater risk and vice versa. 8.2 Types of leverages: The following are the different types of leverages, which are discussed as under: 8.2.1 Operating leverage: Operating leverage refers to the use of fixed costs in the operation of a firm. If the firm's total cost comprises fixed cost, which does not change with the volume of out put or sales, the operating leverage is said to exist. If a firm has greater amount of fixed costs when compared to

Welcome message from author
This document is posted to help you gain knowledge. Please leave a comment to let me know what you think about it! Share it to your friends and learn new things together.
Transcript
Basic Business Finance 8.1 Leverages
LESSON -8
LEVERAGES AND MEASUREMENT
8.0 Objective :The main objective of this lesson are to explain the:
* Concept of leverage and types of leverages;
* Measurement of different types of leverages;
* EB1T-EPS analysis and point of indifference* Concept of break-even analysis and its calculations
STRUCTURE:
8.1 Meaning of Leverage
8.2 Types of leverages
8.3 Measurement of Financial Leverage:
8.4 Measurement of Operating Leverage
8.5 Concept of Break-even Analysis
8.6 Combined Leverage - Meaning and Measurement
8.7 Importance of Financial and Operating Leverages
8.8 Summary
8.9 Key Words8.10 Self - Assessment Questions
8.11 Further Readings
8.1 Meaning of leverage:The term leverage refers to ‘an increased means for accomplishing some purpose’. In
financial management, the concept of leverage means the employment of an asset or resource offinance, which involves some, fixed operating cost or fixed return, which is the fulcrum ofleverage. If a firm is not required to pay fixed cost or return, there will be no leverage. Thus, theLeverage influences the earnings of equity shareholders and the risk to them as well. A higherleverage results in higher earnings and greater risk and vice versa.
8.2 Types of leverages:
The following are the different types of leverages, which are discussed as under:
8.2.1 Operating leverage:
Operating leverage refers to the use of fixed costs in the operation of a firm. If the firm'stotal cost comprises fixed cost, which does not change with the volume of out put or sales, theoperating leverage is said to exist. If a firm has greater amount of fixed costs when compared to
Centre for Distance Education 8.2 Acharya Nagarjuna University
variable cost, it will have a higher degree of operating leverage and if the fixed cost is less, it willhave a lower degree of operating leverage. Operating leverage indicates the effects of changes insales on operating profit, also known as earnings before interest and taxes (EBIT). It is bothfavorable and unfavorable. A higher operating leverage indicates that even a small change in sales(increase or decrease) will cause a greater change in operating profit.
Operating leverage is very useful in ascertaining the effect of a change in sales onoperating profit A high degree of operating leverage indicates that even a small change in saleswill have a large effect on| EBIT. In other words, a small increase in sales will have larger increasein operating income. This leverage also adversely affects the earnings of the firm. In case of highdegree of leverage, even a small fall in sales will result in a greater decrease in operating profit.Since it is very risky, no firm would like to operate under conditions of high degree of operatingleverage.
Operating risk is the risk of the firm not being able to cover its fixed operating costs.The lager the magnitude of fixed operating costs the larger is the volume of sales to cover all fixedcosts. The higher the fixed operating costs, the higher the degree of operating leverage and thehigher the break-even volume. In this context, the break-even analysis is presented here under
8.2.2 Financial leverage:
The composition of different sources of long-term funds mobilized by a firm is known ascapital structure of that firm. The use of fixed income bearing debt and preference share capitalalong with equity for the benefit of owners of the firm is called financial leverage or trading onequity. Since the cost of these funds is fixed and cheaper when compared to cost of equity, theiruse magnifies the earnings to the equity shareholders.
Trading on Equity: Financial leverage and trading on equity are generally synonymously used.However, there is a slight difference to be shown in their use. Trading on equity refers to theemployment of fixed income - bearing sources of funds for the benefit of equity shareholders.Hence, the term trading on equity should be used for financial leverage only when it is favourable
Like operating leverage, the financial leverage can be favourable or unfavorable. Debtcapital involves payment of interest at a fixed rate irrespective of the fact that the firm makesprofit or not. The preference dividend, however, is payable out of after-tax income. If there is noprofit during any particular year, the preference dividend is not payable. The equity shareholdersare entitled to the residual income. A firm is said to have a favourable financial leverage, if itsearnings are more than the cost of debt and preference capital. On the contrary, if it does not earnas much as these costs, the leverage is unfavorable.
For example, if a firm borrows debt capital at 15% and earns 20% on its capital, thedifference of 5% after payment of interest belongs to equity shareholders making their total return25% (20+5). On the other hand, if the firm earns only 12% on its capital, there will be a loss of 3%after payment of interest, which makes the rate of return available to equity shareholders lower at9% (12-3). Thus, financial leverage is a double-edged sword.
Basic Business Finance 8.3 Leverages
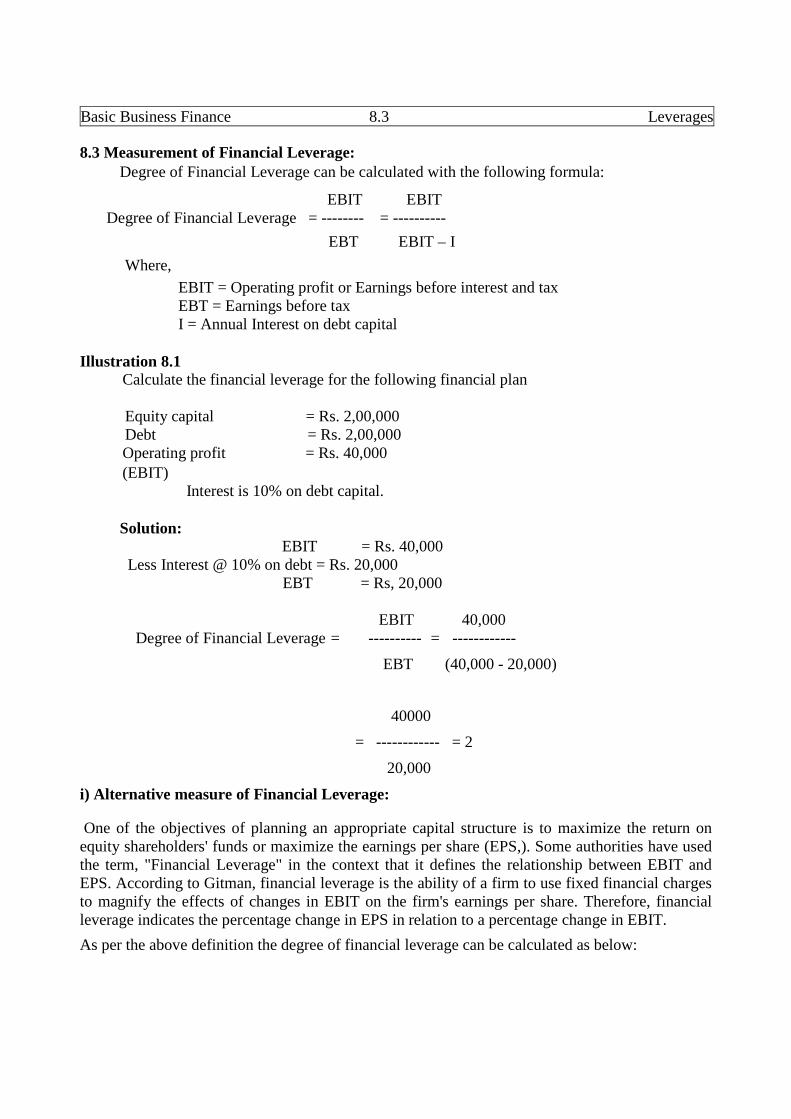
8.3 Measurement of Financial Leverage:Degree of Financial Leverage can be calculated with the following formula:
EBIT EBITDegree of Financial Leverage = -------- = ----------
EBT EBIT – I
Where,
EBIT = Operating profit or Earnings before interest and taxEBT = Earnings before taxI = Annual Interest on debt capital
Illustration 8.1Calculate the financial leverage for the following financial plan
Equity capital = Rs. 2,00,000Debt = Rs. 2,00,000Operating profit = Rs. 40,000(EBIT)
Interest is 10% on debt capital.
Solution:EBIT = Rs. 40,000
Less Interest @ 10% on debt = Rs. 20,000EBT = Rs, 20,000
EBIT 40,000Degree of Financial Leverage = ---------- = ------------
EBT (40,000 - 20,000)
40000
= ------------ = 2
20,000
i) Alternative measure of Financial Leverage:
One of the objectives of planning an appropriate capital structure is to maximize the return onequity shareholders' funds or maximize the earnings per share (EPS,). Some authorities have usedthe term, "Financial Leverage" in the context that it defines the relationship between EBIT andEPS. According to Gitman, financial leverage is the ability of a firm to use fixed financial chargesto magnify the effects of changes in EBIT on the firm's earnings per share. Therefore, financialleverage indicates the percentage change in EPS in relation to a percentage change in EBIT.
As per the above definition the degree of financial leverage can be calculated as below:
Centre for Distance Education 8.4 Acharya Nagarjuna University
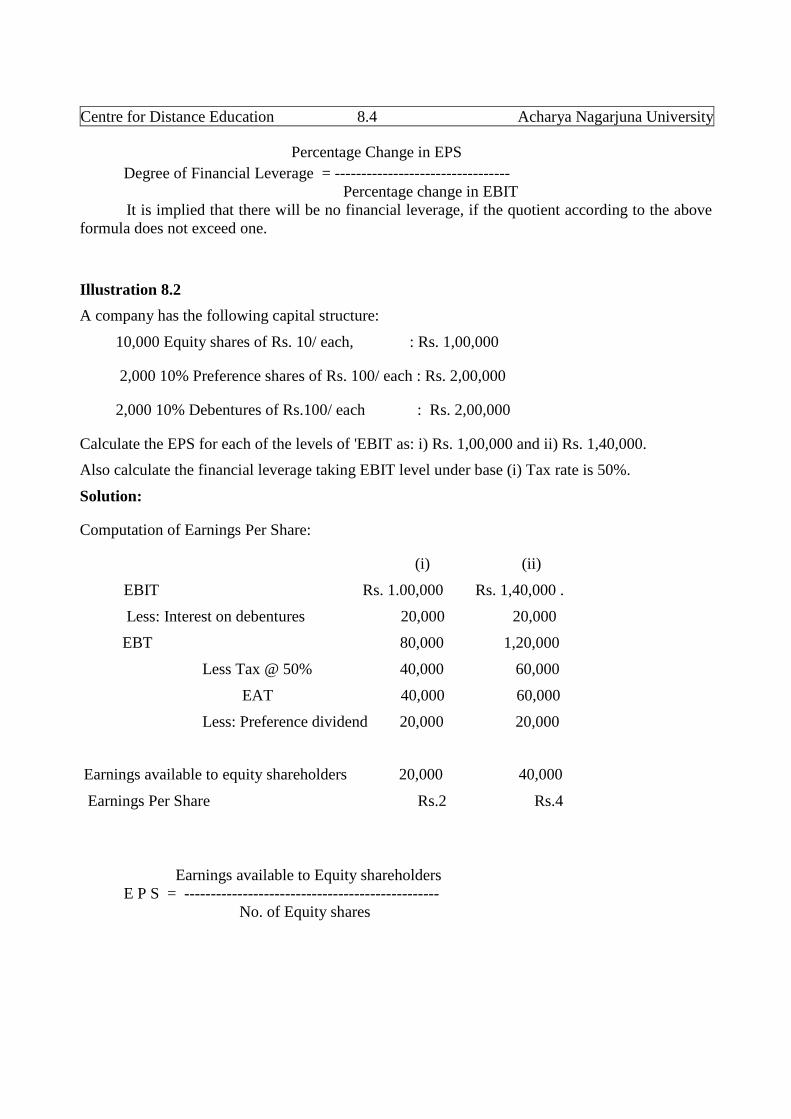
Percentage Change in EPS
Degree of Financial Leverage = ---------------------------------Percentage change in EBIT
It is implied that there will be no financial leverage, if the quotient according to the aboveformula does not exceed one.
Illustration 8.2
A company has the following capital structure:
10,000 Equity shares of Rs. 10/ each, : Rs. 1,00,000
2,000 10% Preference shares of Rs. 100/ each : Rs. 2,00,000
2,000 10% Debentures of Rs.100/ each : Rs. 2,00,000
Calculate the EPS for each of the levels of 'EBIT as: i) Rs. 1,00,000 and ii) Rs. 1,40,000.
Also calculate the financial leverage taking EBIT level under base (i) Tax rate is 50%.
Solution:
Computation of Earnings Per Share:
(i) (ii)
EBIT Rs. 1.00,000 Rs. 1,40,000 .
Less: Interest on debentures 20,000 20,000
EBT 80,000 1,20,000
Less Tax @ 50% 40,000 60,000
EAT 40,000 60,000
Less: Preference dividend 20,000 20,000
Earnings available to equity shareholders 20,000 40,000
Earnings Per Share Rs.2 Rs.4
Earnings available to Equity shareholdersE P S = ------------------------------------------------
No. of Equity shares
Basic Business Finance 8.5 Leverages
% change in EPS 100.00%Degree of Financial Leverage = --------------------------- = ------------------ = 2.5
% change in EBIT 40.00 %
ii) Financial Leverage and EBIT -EPS Analysis
Financial leverage is used to magnify the shareholder's earnings. It is based on theassumption that cost of fixed charge funds is lower than the firm's rate of return on its assets. Ananalysis of EBIT - EPS relationships helps in designing the capital structure of a firm. It is awidely' used technique to design an appropriate capital structure which will be determined on thebasis of EPS. It will help to determine the appropriate financial plan from among variousalternative financial plans, when EBIT is constant and is varying. This EBIT - EPS can beexplained with the following illustrations:
iii) Analyzing Alternative Financial Plans - Constant EBIT:
The effect of financial leverage on EPS under various alternative financial plans can beillustrated as below.
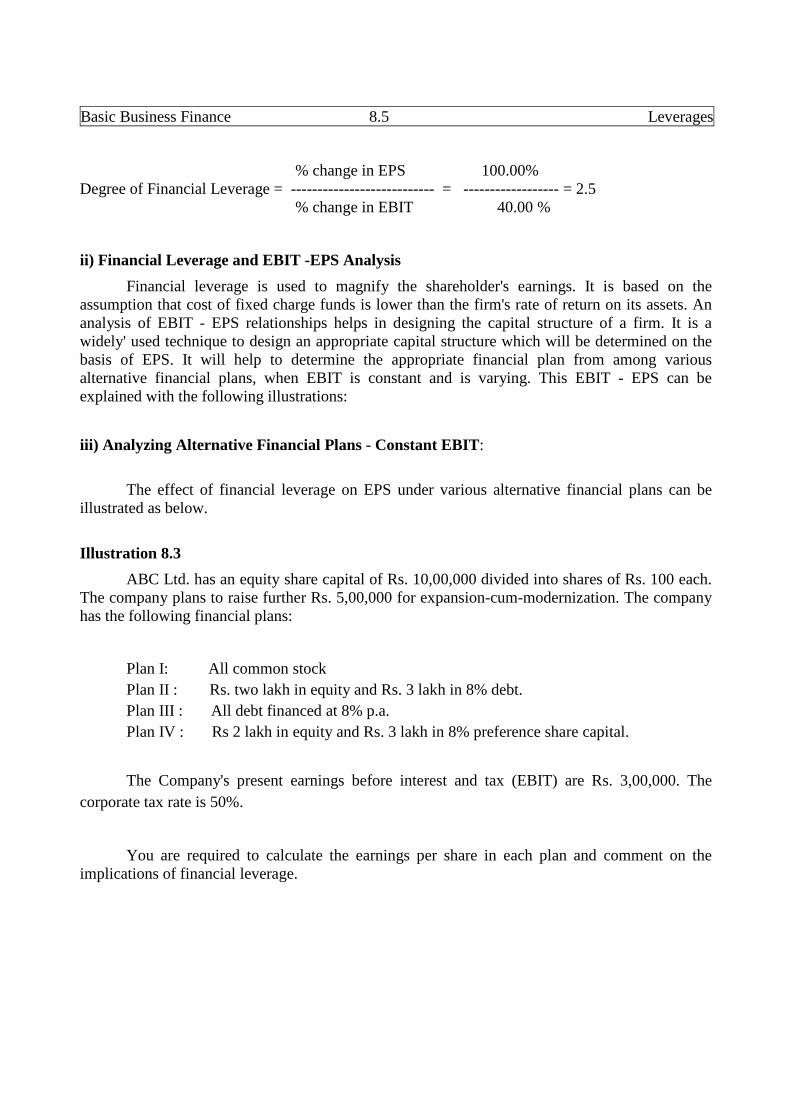
Illustration 8.3
ABC Ltd. has an equity share capital of Rs. 10,00,000 divided into shares of Rs. 100 each.The company plans to raise further Rs. 5,00,000 for expansion-cum-modernization. The companyhas the following financial plans:
Plan I: All common stock
Plan II : Rs. two lakh in equity and Rs. 3 lakh in 8% debt.
Plan III : All debt financed at 8% p.a.
Plan IV : Rs 2 lakh in equity and Rs. 3 lakh in 8% preference share capital.
The Company's present earnings before interest and tax (EBIT) are Rs. 3,00,000. The
corporate tax rate is 50%.
You are required to calculate the earnings per share in each plan and comment on theimplications of financial leverage.
Centre for Distance Education 8.6 Acharya Nagarjuna University
Solution:
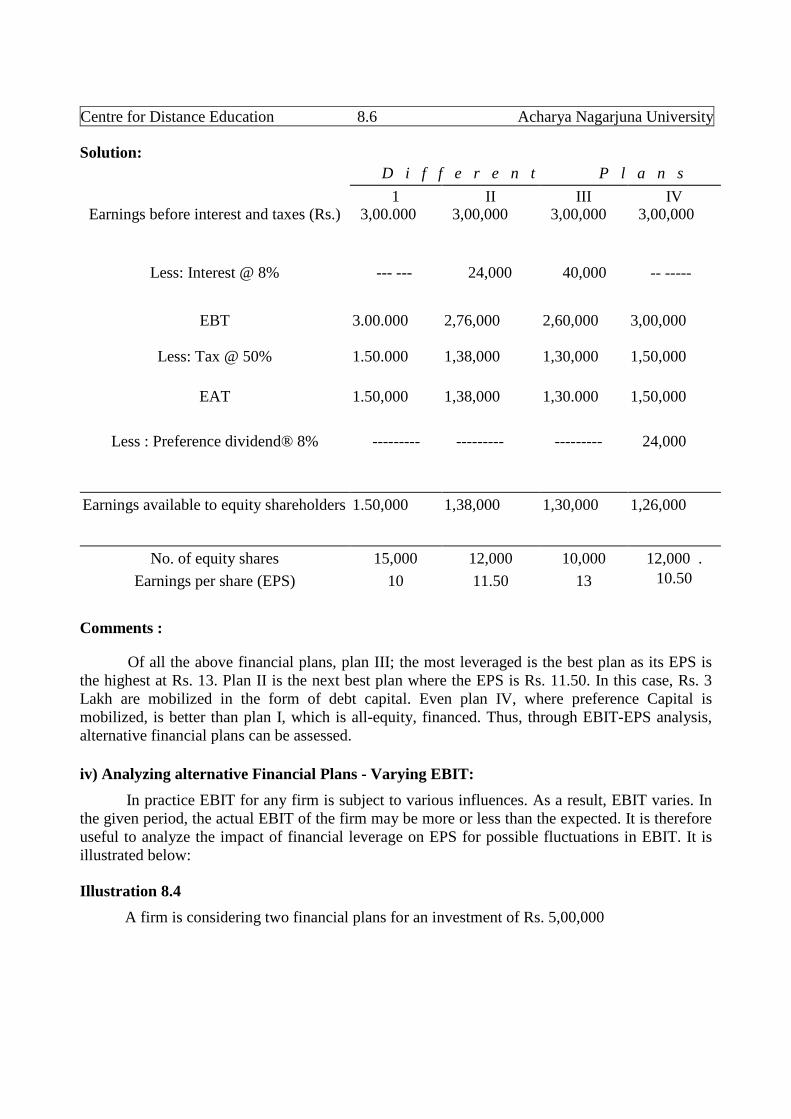
D i f f e r e n t P l a n s
1 II III IVEarnings before interest and taxes (Rs.) 3,00.000 3,00,000 3,00,000 3,00,000
Less: Interest @ 8% --- --- 24,000 40,000 -- -----
EBT 3.00.000 2,76,000 2,60,000 3,00,000
Less: Tax @ 50% 1.50.000 1,38,000 1,30,000 1,50,000
EAT 1.50,000 1,38,000 1,30.000 1,50,000
Less : Preference dividend® 8% --------- --------- --------- 24,000
Earnings available to equity shareholders 1.50,000 1,38,000 1,30,000 1,26,000
No. of equity shares
Earnings per share (EPS)
15,000
10
12,000
11.50
10,000
13
12,000 .10.50
Comments :
Of all the above financial plans, plan III; the most leveraged is the best plan as its EPS isthe highest at Rs. 13. Plan II is the next best plan where the EPS is Rs. 11.50. In this case, Rs. 3Lakh are mobilized in the form of debt capital. Even plan IV, where preference Capital ismobilized, is better than plan I, which is all-equity, financed. Thus, through EBIT-EPS analysis,alternative financial plans can be assessed.
iv) Analyzing alternative Financial Plans - Varying EBIT:
In practice EBIT for any firm is subject to various influences. As a result, EBIT varies. Inthe given period, the actual EBIT of the firm may be more or less than the expected. It is thereforeuseful to analyze the impact of financial leverage on EPS for possible fluctuations in EBIT. It isillustrated below:
Illustration 8.4
A firm is considering two financial plans for an investment of Rs. 5,00,000
Basic Business Finance 8.7 Leverages
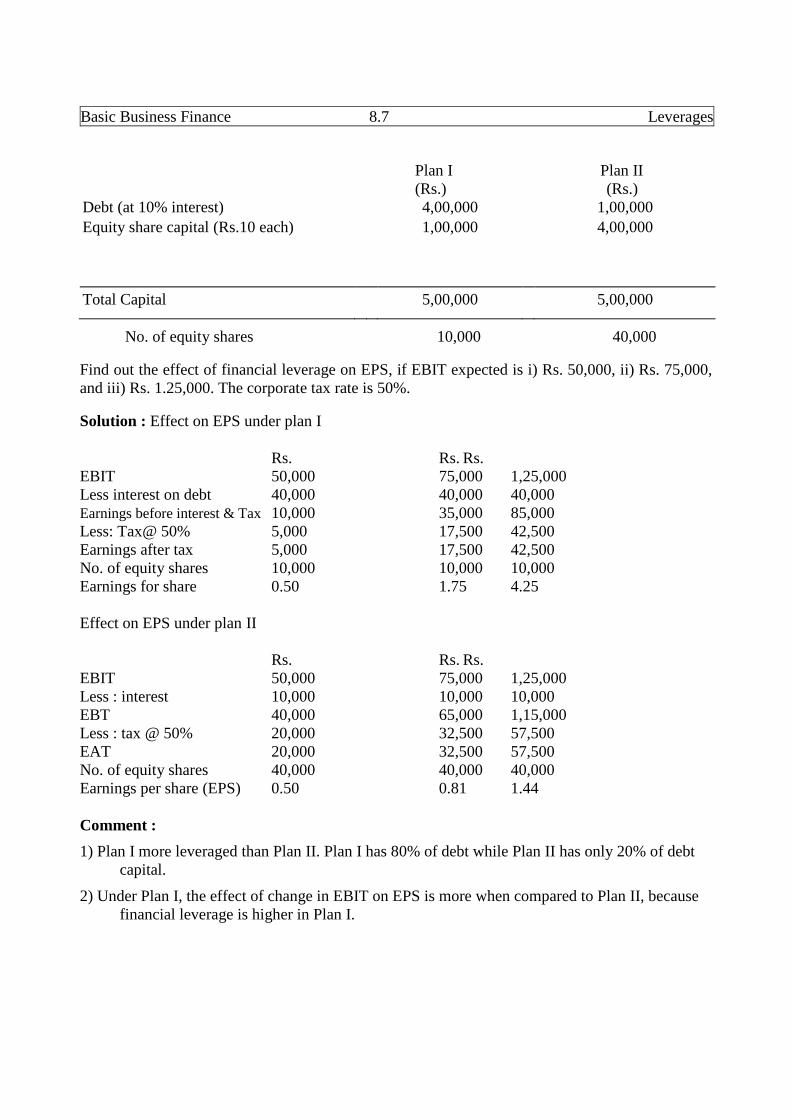
Plan I Plan II(Rs.) (Rs.)
Debt (at 10% interest)Equity share capital (Rs.10 each)
4,00,0001,00,000
1,00,0004,00,000
Total Capital 5,00,000 5,00,000
No. of equity shares 10,000 40,000
Find out the effect of financial leverage on EPS, if EBIT expected is i) Rs. 50,000, ii) Rs. 75,000,and iii) Rs. 1.25,000. The corporate tax rate is 50%.
Solution : Effect on EPS under plan I
Rs. Rs. Rs.EBIT 50,000 75,000 1,25,000Less interest on debt 40,000 40,000 40,000Earnings before interest & Tax 10,000 35,000 85,000Less: Tax@ 50% 5,000 17,500 42,500Earnings after tax 5,000 17,500 42,500No. of equity shares 10,000 10,000 10,000Earnings for share 0.50 1.75 4.25
Effect on EPS under plan II
Rs. Rs. Rs.EBIT 50,000 75,000 1,25,000Less : interest 10,000 10,000 10,000EBT 40,000 65,000 1,15,000Less : tax @ 50% 20,000 32,500 57,500EAT 20,000 32,500 57,500No. of equity shares 40,000 40,000 40,000Earnings per share (EPS) 0.50 0.81 1.44
Comment :
1) Plan I more leveraged than Plan II. Plan I has 80% of debt while Plan II has only 20% of debtcapital.
2) Under Plan I, the effect of change in EBIT on EPS is more when compared to Plan II, becausefinancial leverage is higher in Plan I.
Centre for Distance Education 8.8 Acharya Nagarjuna University
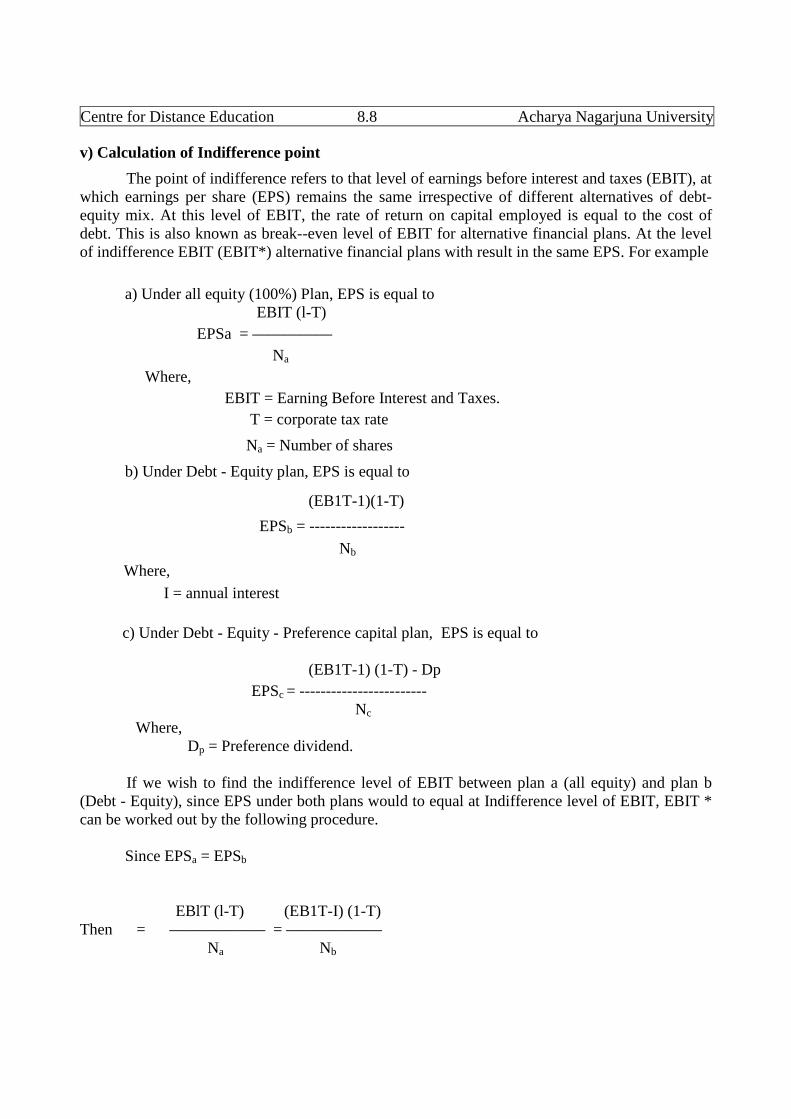
v) Calculation of Indifference point
The point of indifference refers to that level of earnings before interest and taxes (EBIT), atwhich earnings per share (EPS) remains the same irrespective of different alternatives of debt-equity mix. At this level of EBIT, the rate of return on capital employed is equal to the cost ofdebt. This is also known as break--even level of EBIT for alternative financial plans. At the levelof indifference EBIT (EBIT*) alternative financial plans with result in the same EPS. For example
a) Under all equity (100%) Plan, EPS is equal toEBIT (l-T)
EPSa = —————
Na
Where,
EBIT = Earning Before Interest and Taxes.
T = corporate tax rate
Na = Number of shares
b) Under Debt - Equity plan, EPS is equal to
(EB1T-1)(1-T)
EPSb = ------------------
Nb
Where,
I = annual interest
c) Under Debt - Equity - Preference capital plan, EPS is equal to
(EB1T-1) (1-T) - Dp
EPSc = ------------------------Nc
Where,Dp = Preference dividend.
If we wish to find the indifference level of EBIT between plan a (all equity) and plan b(Debt - Equity), since EPS under both plans would to equal at Indifference level of EBIT, EBIT *can be worked out by the following procedure.
Since EPSa = EPSb
EBlT (l-T) (EB1T-I) (1-T)Then = —————— = ——————
Na Nb
Basic Business Finance 8.9 Leverages
Given i) Number of shares under both the plans (H)
ii) Interest on debt (I)iii) Corporate tax rate (T)
We can solve EBIT, which is the indifference level of EBIT (EBIT *)
Similarly between financial plan D and C the following equation can be used.
Given i) Interest under both plans (I)
ii) Tax rate (t)
iii) Number of shares under both plansiv) Preference dividend under plan C (DP)
We can solve EBIT by using the following equation.
(EBIT - Ib) (1-T) (EBIT - Ie) (l-T)-Dp
-------------------- = -------------------------Nb Nc
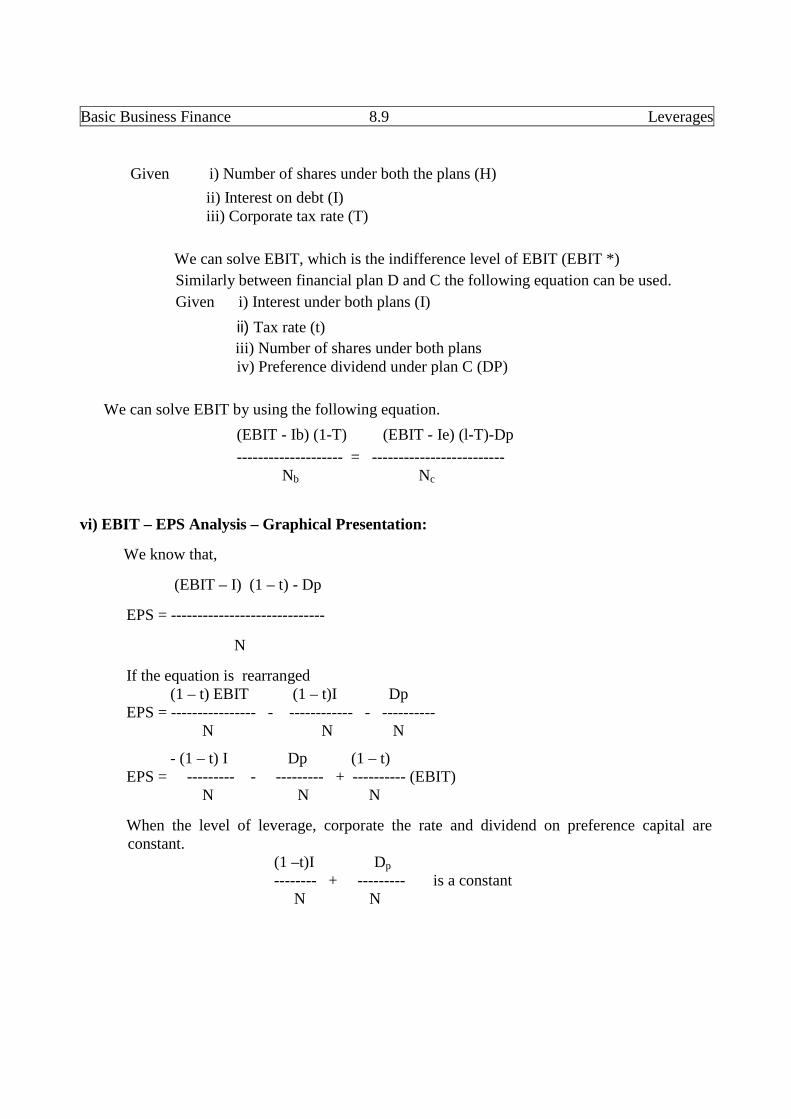
vi) EBIT – EPS Analysis – Graphical Presentation:
We know that,
(EBIT – I) (1 – t) - Dp
EPS = -----------------------------
N
If the equation is rearranged(1 – t) EBIT (1 – t)I Dp
EPS = ---------------- - ------------ - ----------N N N
- (1 – t) I Dp (1 – t)EPS = --------- - --------- + ---------- (EBIT)
N N N
When the level of leverage, corporate the rate and dividend on preference capital areconstant.
(1 –t)I Dp
-------- + --------- is a constantN N
Centre for Distance Education 8.10 Acharya Nagarjuna University
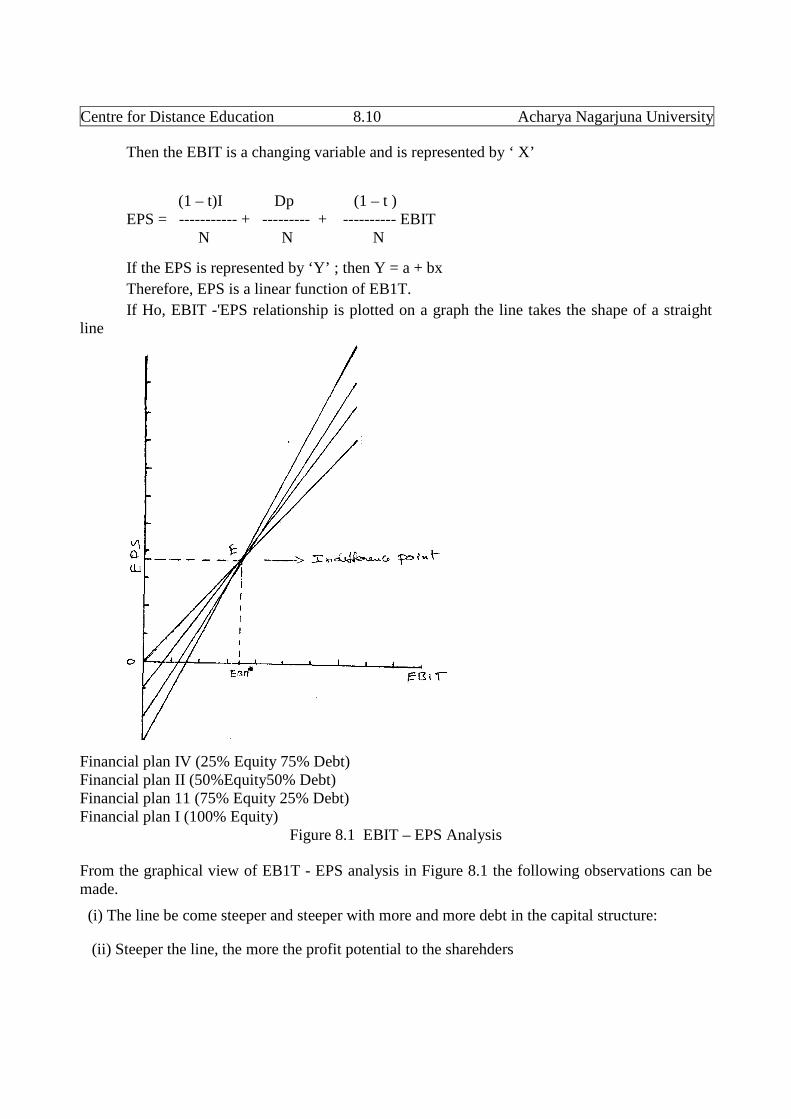
Then the EBIT is a changing variable and is represented by ‘ X’
(1 – t)I Dp (1 – t )EPS = ----------- + --------- + ---------- EBIT
N N N
If the EPS is represented by ‘Y’ ; then Y = a + bx
Therefore, EPS is a linear function of EB1T.
If Ho, EBIT -'EPS relationship is plotted on a graph the line takes the shape of a straightline
Financial plan IV (25% Equity 75% Debt)Financial plan II (50%Equity50% Debt)Financial plan 11 (75% Equity 25% Debt)Financial plan I (100% Equity)
Figure 8.1 EBIT – EPS Analysis
From the graphical view of EB1T - EPS analysis in Figure 8.1 the following observations can bemade.
(i) The line be come steeper and steeper with more and more debt in the capital structure:
(ii) Steeper the line, the more the profit potential to the sharehders
Basic Business Finance 8.11 Leverages
(iii) Point of intersection (E) is the indifference point. It is the level of EBIT at which EPS undervarious alternative financial plans is equal. It is the point where rate of
(iv) Below the indifference point, the line shifts more and more towards the right when the levelof leverage increases, indicating unfavorable effect of leverage.
(v) The line beyond point E Shifts towards left as the leverage increases indicating favourable
effect of leverage.
If the actual EBIT of the company is
Lower than EBIT - Equity financing is preferable
Equal to EBIT - all plans are equally preferable
More than EBIT - Debt financing is preferable
These situations arise because of the difference between rate of return on assets (r) and rate
of interest on debt (i) :
r is less than I - EPS decreases with every increase in debt
r is equal to I - EPS remains the same with any level of debt
r is more than I - EPS increases with increasing debt
8.4 Measurement of Operating leverage:
As it was said that the existence of fixed costs in the total cost structure of the firm results inoperating leverage. Operating leverage is a function of three factors: total fixed cost, contributionand sales volume.
The Degree of operating leverage is calculated as per the following formula:
Contribution Sales - Variable opeating costs
Operating Lreverage = ------------------- = ------------------------------------Operating Profit EBIT
Illustration 8.5
From the following information compute operating leverage and comment:
Fixed cost = Rs. 50,000; Variable cost = 70% of sales:
Sales : Rs. 2,00,000 in the previous year Rs. 2,50,000 in the current year
Centre for Distance Education 8.12 Acharya Nagarjuna University
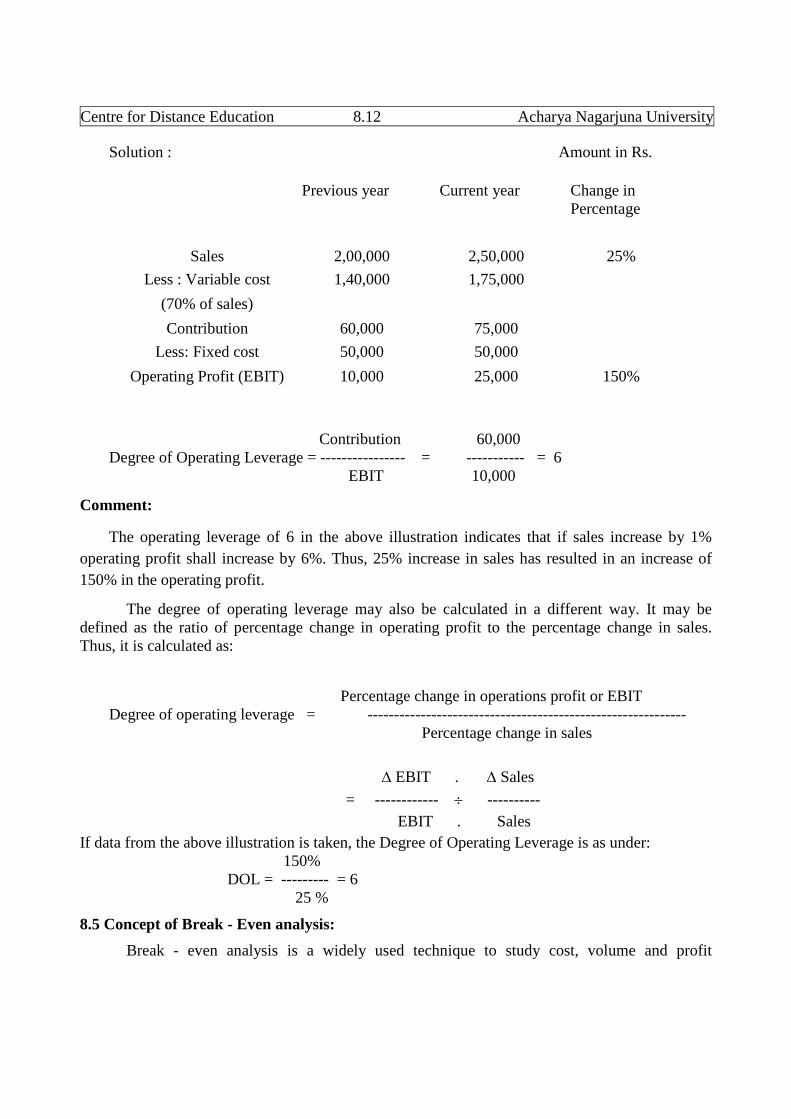
Solution : Amount in Rs.
Contribution 60,000Degree of Operating Leverage = ---------------- = ----------- = 6
EBIT 10,000
Comment:
The operating leverage of 6 in the above illustration indicates that if sales increase by 1%
operating profit shall increase by 6%. Thus, 25% increase in sales has resulted in an increase of
150% in the operating profit.
The degree of operating leverage may also be calculated in a different way. It may bedefined as the ratio of percentage change in operating profit to the percentage change in sales.Thus, it is calculated as:
Percentage change in operations profit or EBITDegree of operating leverage = ------------------------------------------------------------
Percentage change in sales
EBIT . Sales
= ------------ ----------
EBIT . Sales
If data from the above illustration is taken, the Degree of Operating Leverage is as under:150%
DOL = --------- = 625 %
8.5 Concept of Break - Even analysis:
Break - even analysis is a widely used technique to study cost, volume and profit
Previous year Current year Change inPercentage
Sales 2,00,000 2,50,000 25%
Less : Variable cost 1,40,000 1,75,000
(70% of sales)
Contribution 60,000 75,000
Less: Fixed cost 50,000 50,000
Operating Profit (EBIT) 10,000 25,000 150%
Basic Business Finance 8.13 Leverages
relationships. This is a very useful technique that helps the management of a firm in profit
planning. In a narrower sense, break - even analysis refers to the technique used for determining
that level of activity where total cost equals total revenue. But in a broader sense, it refers to that
technique which determines the probable profit at any level of activity. It portrays the relationship
between cost of production, volume of production and selling price. Hence, it is also known as
cost volume profit analysis (C-V-P Analysis).
Even though break - even analysis and CVP analysis are interchangeably used, there is a
slight difference between the two. CVP analysis is broader and it includes the entire gamut of
profit planning, while 'break - even analysis' is a techniane used in this process. Hence, CVP
analysis is the more appropriate term to be used for studying the CVP relationships. However the
term break - even analysis is so popular that these two terms are used as synonymous.
i) Assumptions of Break - Even analysis:
The technique of break - even analysis is subject to the following assumptions :
1. The total cost can be segregated into fixed and variable components.
2. Total fixed cost remains constant at all levels of output.
3. Variable cost per unit remains constant and total variable cost changes directly in proportionto sales volume.
4. Selling price per unit remains unchanged at all levels of output.
5. The firm produces, only one product or in case of multiple products, the sales - mix remainsconstant.
6. There is synchronization between production and sales. It means that there will be no opening
or closing stock.
ii) Break - Even point and its Determination:
The break - even point may be defined as that level of sales volume at which total revenue isequal to total cost. It is a point of no profit or no loss. At this point of sales, the firm's total revenuebreaks evenly with total cost, and hence the name. Any increase in sales beyond this point willfetch profits to the firm and if sales fall below this point, the firm will incur loss.
There are two approaches to compute the break - even point
a) Algebraic Formula Approach, and
b) Graphic or Chart Approach
The Algebraic formula approach:
By using algebraic formula, the break - even point can be computed,
Centre for Distance Education 8.14 Acharya Nagarjuna University
i) in terms of units of sales volume
ii) in terms of money value of sales volume, and
iii) as a percentage of estimated capacity.
If
F = Total fixed costs
V = Variable cost per unit
P = Price Per unit
Q = Quantity sold
TR = Total revenue
TC = Total Cost
Then,
TR = Price per unit X Quantity Sold P.Q
TC = Total Variable cost + Total Fixed Cost
= (Variable cost per unit X Quantity sold) + total fixed cost (V.Q + F)
At the break-even point of sales, total revenue is equal to total cost.
Therefore,
TR = TC
P.Q = V.Q + F
PQ - VQ = F
Q [P-V] = FF F
Q = ----------- = ----P – V C
Where,
Q is the break-even sales
F is the total Fixed cost
P is the Price per unit
V is the Variable cost per unitC is the Contribution per unit
Basic Business Finance 8.15 Leverages
Break - Even point (in units):
Break - even point is a point of no profit or no loss. It can be calculated with the help of thefollowing formula:
Fixed costBreak - even point (in units) = —————
Contribution per unit
Where, contribution per unit = (Selling price per unit - Variable cost per unit)
Since total contribution is equal to total fixed cost at break - even point, fixed cost is
divided by contribution per unit to get the break - even point in units.
Break - Even point (in rupees):
Break - even point in rupee value can be calculated with the help of following formula :
Fa) Break - even point (in rupees) = ——— = P
P-V
Where,
F = Fixed costP = Selling price per unit
V = Variable cost per unit
b) Break - even point can also be calculated as follows:Fixed Cost
Fixed cost Break - even point (in rupees) = ----- --------P/V ratio
Where,P/V Ratio
It is a ratio between contribution and sales which is also known as contribution ratio Thisratio indicates the extent to which sales will contribute to meet fixed cost up to break - even pointand to total profit of the firm after break - even point. It is calculated as:
P – V CP/V Ratio = ------- or ---- x 100
P PWhere,
P = Price,V= Variable costC = P - V = Contribution
Centre for Distance Education 8.16 Acharya Nagarjuna University
Since, C = P - V and V/S represents variable cost to sales ratio, the P/V ratio can also becalculated
as below:
V
P/V Ratio =1 - — or (1-Variable cost ratio)
. P
Thus, if variable cost ratio is 60% or 0.6, then P/V ratio will be 40% or .4.
Illustration 5.6:
Calculate the break - even point in units and in sales value from the following data:
Sales = 3000 units
Selling prince per unit = Rs. 30 Variable
Variable cost per unit = Rs. 20
Fixed cost = Rs. 20,000
Solution:
Rs 20,000
Rs 30-20
20,000= ----------- = 2,000 units
10Fixed Cost
Break even point in rupees = ------------ x S
S - V
Where, S = Selling Price per unit
V = Variable cost per unit
Break - even point (in units) =Fixed cost
Selling Price per unit - Variable cost per unit
Basic Business Finance 8.17 Leverages
Rs.20,000
Break - even sales = --------- X 30 = Rs. 60,000
30-20
Alternately, Break - even sales = Break - even point units x selling price
= 2000 units x Rs 30 = Rs 60,000
Break - Even point as a percentage of estimated capacity:
Break - even point can also be expressed as a percentage of estimated capacity of the firm.It is calculated as:
Break even salesBreak - even point (as percentage of capacity) = ----------------------- X 100
Estimated CapacityIllustration 8.7:
Total estimated capacity = 1,00,000 units,
Break - even point = 60,000 units,
Then find out break - even point as percentage of estimated capacity.
Solution:
Break even pointBreak - even point (as percentage of capacity) = ———————— X 100
Estimated capacity
60,000 units
= —————— x 100 = 60%
1,00,000 units
(b) Graphic or Chart Approach:
The break - even point can also be shown graphically. A break - even chart portrays a
pictorial view of the relationship between costs, volume and profits. The break - even chart shows
that the break - even point occurs where the total cost line and total revenue line intersect each
other. This chart also shows not only the break - even point but also the profit or loss at various
levels of sales.
Following steps given below draws the break - even chart:
1. Volume of output sales (units or rupees) is presented on horizontal axis or x- axis
Centre for Distance Education 8.18 Acharya Nagarjuna University
2. Costs and sales revenue are plotted on vertical or y- axis
3. Fixed cost line is drawn parallel to x-axis, as fixed costs remain constant at all levels
of activity.
4. Total cost line is drawn starting at fixed cost line touching the y- axis
5. Total revenue line is drawn starting at the origin of the two axes.
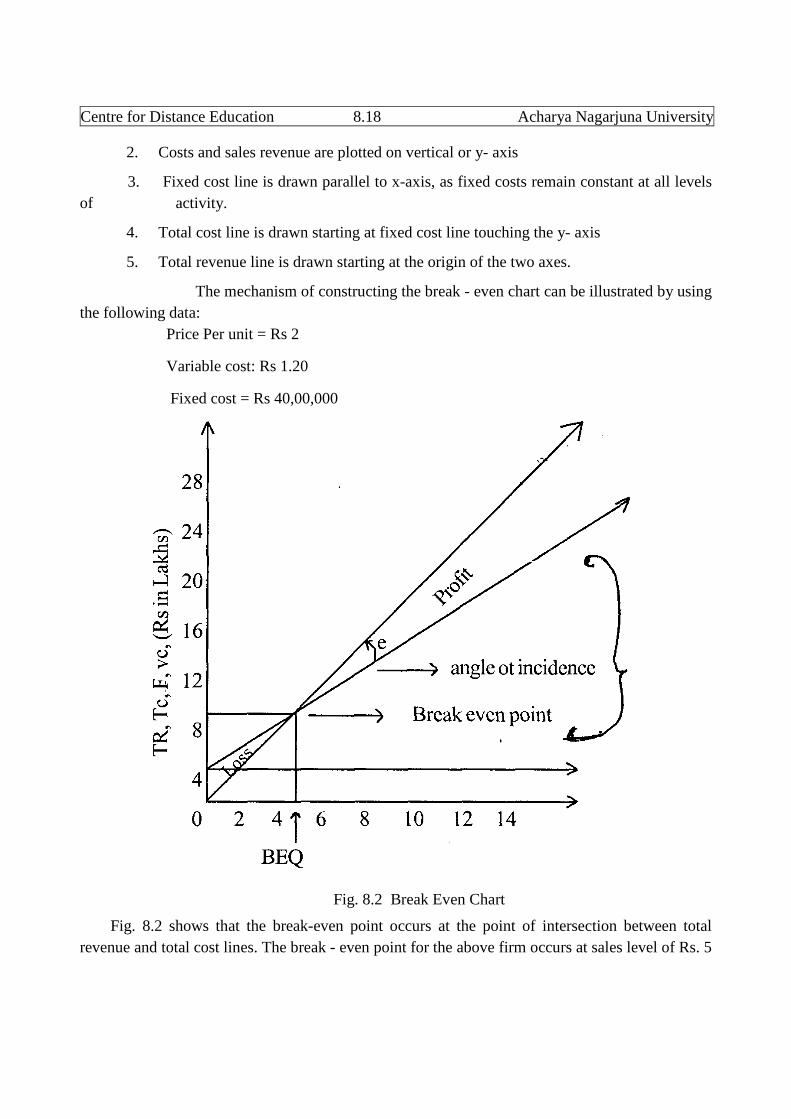
The mechanism of constructing the break - even chart can be illustrated by using
the following data:
Price Per unit = Rs 2
Variable cost: Rs 1.20
Fixed cost = Rs 40,00,000
Fig. 8.2 Break Even Chart
Fig. 8.2 shows that the break-even point occurs at the point of intersection between total
revenue and total cost lines. The break - even point for the above firm occurs at sales level of Rs. 5
Basic Business Finance 8.19 Leverages
Lakh Units. The area to the left of the break - even point represents loss zone and the area to the
right represents profit zone.
Angle of Incidence: The angle formed at the point of intersection between total cost line and total
sales line is known as the angle of incidence. This angle is significant because it gives us an idea
about the profitability of the firm after break - even point. If this angle is larger, the break - even
point will be lower and the profitability will be greater after break - even point and vice versa.
Margin of safety:
The excess of actual or budgeted sales over the break - even sales is known as the margin ofsafety. In the above illustration, margin of safety is 5 lakh units, it acted sales is 10 lakh units
The margin of safety can be expressed as a percentage of sales:
Aactual sales - Break-even salesMargin of safety = ————————————————— X 100
Total sales10,00,000 - 5,00,000
= ———————— X 100 = 50.0 %10,00,000
The margin of safety indicates the extent to which sales may fall before the firm incurs a loss. A high margin
of safety indicates a high degree of safety for the firm.
Illustration 8.8
From the following particulars, calculate
I) P/V ratio;
II) Break –even point(in units), and
III) Break even point( in rupees).
Fixed Costs Rs. 1,50,000
Variable cost per unit Rs. 10
Selling Price per unit Rs. 15
Solution:
i) P/V ratio = (Contribution / Sales) X 100
Contribution = Selling price – variable cost per unit
= Rs. 15 – Rs. 10 = Rs. 5
P/V ratio = (5/15) X 100 = 33.33 %
Centre for Distance Education 8.20 Acharya Nagarjuna University
ii) Break even point( in units) = Fixed cost / Contribution per unit
= 1,50,000 / 5 = 30,000 units
iii) Break even point (in rupees) = Fixed Cost / P/V ratio
= 1,50,000 / 33.33 = 4,50,000
Effect of changes in fixed cost:
Break - even point of a firm are is affected by the changes in fixed cost.
An increase is fixed cost results is the decrease of break-even point. The minimum quantityrequired to recover all costs rises. A change in fixed costs does not affect P/V ratio. Other factorsremaining constant; a decrease in fixed costs will lower the break-even point and raise the profits.On the other hand, an increase in fixed costs will result in a higher break-even point and loweramount of profits.
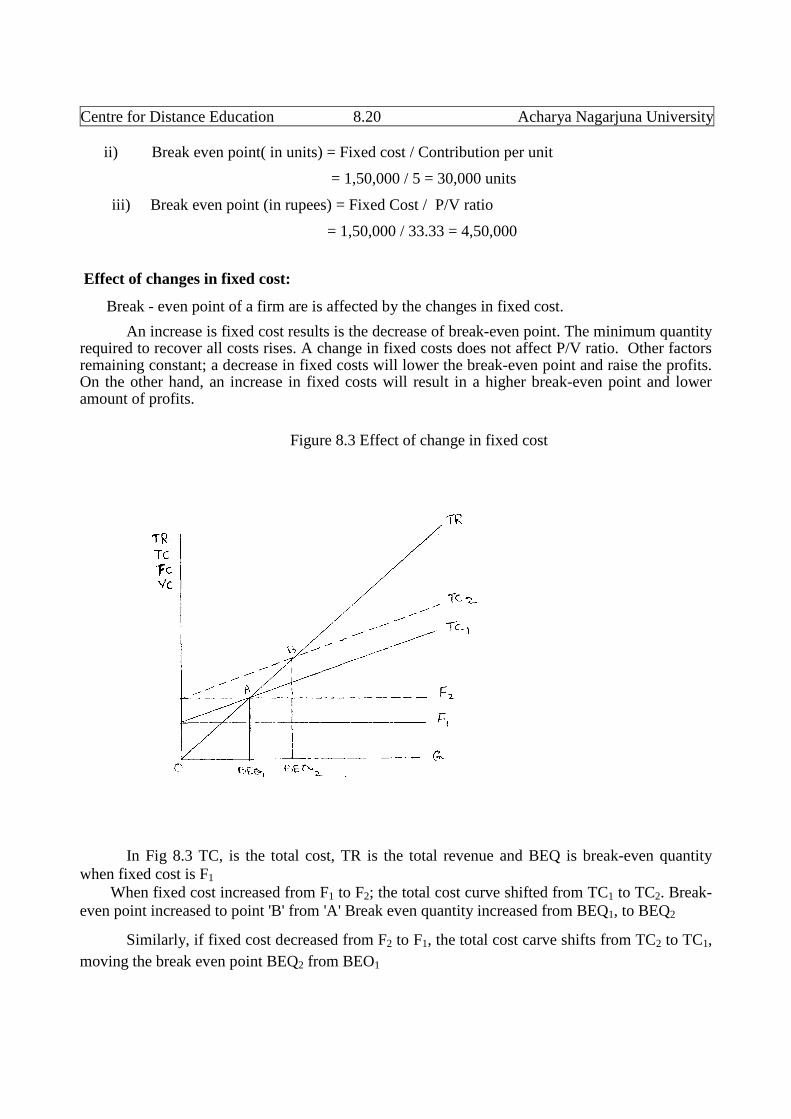
Figure 8.3 Effect of change in fixed cost
In Fig 8.3 TC, is the total cost, TR is the total revenue and BEQ is break-even quantitywhen fixed cost is F1
When fixed cost increased from F1 to F2; the total cost curve shifted from TC1 to TC2. Break-even point increased to point 'B' from 'A' Break even quantity increased from BEQ1, to BEQ2
Similarly, if fixed cost decreased from F2 to F1, the total cost carve shifts from TC2 to TC1,
moving the break even point BEQ2 from BEO1
Basic Business Finance 8.21 Leverages
Utility of Break - Even analysis:
Break - even analysis is a very useful technique of profit planning and control formanagers. It has the following advantages.
i) It is a simple technique to understand the accounting data for those business executives who areunable to understand financial statements.
ii) It helps the management in identifying causes of increasing break - even point and fallingprofits and the measures to be taken
iii) It provides the basic information that enables the management to further investigate the waysfor profit improvement.iv) It helps in considering the risk implications of alternative actions of profit planning.
Limitations of Break Even Analysis:
Break - even analysis is a useful technique, which helps the management in its profitplanning. But, it is based on certain assumptions, which limit the utility and the applicability ofthis technique. These limitations should be considered while using this technique to getmeaningful results. The CVP analysis suffers from the following limitations:
i) One important assumption of break - even analysis is that costs can be separated intofixed and variable components. But this classification is not always possible. Most of the expensesbelong to mixed category.
ii) Total fixed costs do not remain constant at different level, of output. In practice, they areconstant over a relevant range of output and would increase in a step - wise fashion.
iiii) The assumption of a constant variable cost per unit is unrealistic. Total variable costsdo not change proportionately to output.
iv) The assumption of a constant selling price may be valid under conditions of perfectcompetition. But under imperfect market conditions selling price should be reduced to sell moreunits of output.
v) The break - even analysis is best suited for a single product firm. But it is difficult to usethis technique for a multi - product firm. The break - even point for a multi - product firm as awhole is valid only if the sales mix is constant.
vi) The break - even analysis is short - term technique of profit planning and has a limiteduse in long - range planning.
vii) The break - even analysis is a static tool. It shows the relationship between costs,
volume and profit of a firm at a given point of time assuming that costs and sales to be static.
8.6 Importance of Financial and Operating Leverages:
The two important quantitative tools used by the financial experts to measure the return toequity shareholders and the market price of equity shares are the operating and financial leverages.
Centre for Distance Education 8.22 Acharya Nagarjuna University
Of these two tools, the financial leverage is considered to be superior, because it focuses theattention on the earnings of the shareholders and the market price of the shares.
A firm resorts to financial leverage or trading on equity to magnify the earnings of equityshareholders. Financial leverage is significant in the following two ways:
i) Planning of capital structure: The capital structure is concerned with the debt - equityrat-o. It helps in selecting the optimum capital structure, which gives the highest EPS.
ii) Profit planning: The earnings per share are affected by the degree of financial leverage.In case the profitability of the firm is increasing, the fixed cost funds will help in increasing theavailability of profits for equity shareholders. Thus, financial leverage is important for profitplanning.
However, a firm cannot continue to increase debt capital to magnify shareholders' earningsbecause financial leverage has the risk of adversely affecting the earnings, which is known asfinancial risk. If a firm employs more and more debt capital, it increases the financial risk.Moreover, a firm with widely fluctuating earnings cannot afford to employ more debt capital. Acompany should try to have a balance of the two leverages because they got tremendousacceleration or deceleration effect on EBIT and EPS.
A proper combination of both operating and financial leverages is a great advantage to thefirm's growth, while on inappropriate combination may prove to be a curse as explained below:
i) A very high degree of operating as well as financial leverages will make the position of afirm very risky. When both the leverages are high, it implies that the firm has high fixed operatingcost and fixed interest charges. As a result, the earnings of shareholders widely fluctuate.
ii) If a firm has a high operating leverage, it should not have a high financial leverage. Itshould have a low financial leverage.
iii) In the same way, firm with a low operating leverage will get the benefit by having ahigh financial leverage, provided it has enough profitable opportunities for the borrowed funds.
iv) If both the leverages are low, it means that the management of the firm is adopting avery cautious attitude. It results in losing a good no. of investment opportunities.
Of all the above cases, low operating leverage and high financial leverage is the idealsituation for making maximum profits with minimum of risk. So the management of the firmshould properly combine both the leverages to get the maximum advantage.
8.7 Combined Leverage - Meaning and measurement:
As discussed earlier, financial leverage measures the effect of a change in operating EBITor EPS, whereas, the operating leverage measures the effect of a change in sales on EBIT. Thus,the financial leverage explains the degree of financial leverage and the operating leverage explainsthe degree of operating risk. When these two leverages are combined it indicates the effect ofchange in sales on EPS. This combined or composite leverage can be computed as follows:
Basic Business Finance 8.23 Leverages
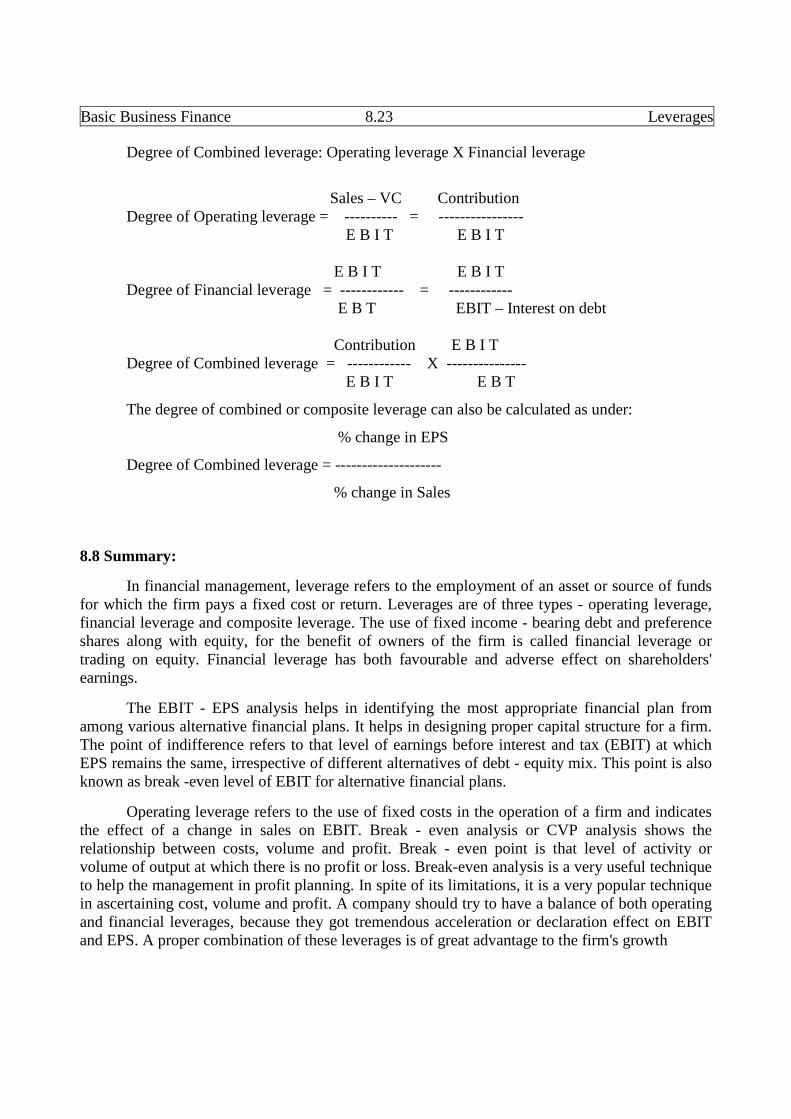
Degree of Combined leverage: Operating leverage X Financial leverage
Sales – VC ContributionDegree of Operating leverage = ---------- = ----------------
E B I T E B I T
E B I T E B I TDegree of Financial leverage = ------------ = ------------
E B T EBIT – Interest on debt
Contribution E B I TDegree of Combined leverage = ------------ X ---------------
E B I T E B T
The degree of combined or composite leverage can also be calculated as under:
% change in EPS
Degree of Combined leverage = --------------------
% change in Sales
8.8 Summary:
In financial management, leverage refers to the employment of an asset or source of fundsfor which the firm pays a fixed cost or return. Leverages are of three types - operating leverage,financial leverage and composite leverage. The use of fixed income - bearing debt and preferenceshares along with equity, for the benefit of owners of the firm is called financial leverage ortrading on equity. Financial leverage has both favourable and adverse effect on shareholders'earnings.
The EBIT - EPS analysis helps in identifying the most appropriate financial plan fromamong various alternative financial plans. It helps in designing proper capital structure for a firm.The point of indifference refers to that level of earnings before interest and tax (EBIT) at whichEPS remains the same, irrespective of different alternatives of debt - equity mix. This point is alsoknown as break -even level of EBIT for alternative financial plans.
Operating leverage refers to the use of fixed costs in the operation of a firm and indicatesthe effect of a change in sales on EBIT. Break - even analysis or CVP analysis shows therelationship between costs, volume and profit. Break - even point is that level of activity orvolume of output at which there is no profit or loss. Break-even analysis is a very useful techniqueto help the management in profit planning. In spite of its limitations, it is a very popular techniquein ascertaining cost, volume and profit. A company should try to have a balance of both operatingand financial leverages, because they got tremendous acceleration or declaration effect on EBITand EPS. A proper combination of these leverages is of great advantage to the firm's growth
Centre for Distance Education 8.24 Acharya Nagarjuna University
8.9 Key words:1. Leverage: The employment of an asset or source of funds for which a fixed cost or return
paid.2. Financial Leverage: It refers to the employment of fixed - income bearing securities in
capital structure3. Trading on Equity: Employment of debt capital for the benefit of equity shareholders.4. Indifference point: It refers to that level of EBIT at which the EPS is the same for two
financial plans.5. Operating leverage: The existence of fixed costs in the cost structure of the firm.6. Degree of operating leverage: The percentage change in operating income in response to a
percentage change in sales.
7. Break - even point: The level of activity at which there is no profit or loss.
P/V Ratio: A ratio between contribution and sales
Composite Leverage: It is the combined effect of both financial and operating leverages.
8.10 Self- Assessment Questions:
1) What is leverage? Distinguish between operating and financial leverages2) What is meant by financial leverage? Explain how it magnifies the revenue available to the
equity shareholders.
3) What is Operating Leverage? How does it help in magnifying the earnings of a firm?
4) What is break - even analysis? Explain the assumptions and limitations of the B/E technique.
5) Write short notes on:
a) P/V Ratio b) Margin of safety c) Angle of incidence
d) Financial leverage e) Trading on Equity f) Composite leverage
8.11 Further Readings:
Brigham, E.F. Fundamentals of Financial Management, Dryden Press, Chicago.
James C. Van Horne, Financial Management and Policy, Prentice Hall of India, New Delhi.
Solomon Ezra, Theory of Financial Management, Columbia University Press, New Delhi.
Pandey, I.M., Financial Management, Vikas Publishing House, New Delhi
Prasanna Chandra, Financial Management: Theory and Practice, Tata McGraw Hill, New Delhi
Khan and Jain, Financial Management, Tata Mc Graw Hill, New Delhi
KSNR
Basic Business Finance 8.25 Leverages
Related Documents