Securities Litigation and Consulting Group, Inc. © 2010. Leveraged ETFs, Holding Periods and Investment Shortfalls Ilan Guedj, PhD, Guohua Li, PhD, and Craig McCann, PhD 1 Leveraged and Inverse ETFs replicate the leveraged or the inverse of the daily returns of an index. Several papers have established that investors who hold these investments for periods longer than a day expose themselves to substantial risk as the holding period returns will deviate from the returns to a leveraged or inverse investment in the index. It is possible for an investor in a leveraged ETF to experience negative returns even when the underlying index has positive returns. In this paper, we estimate distributions of holding periods for investors in leveraged and inverse ETFs. Using standard models, we show that a substantial percentage of investors may hold these short-term investments for periods longer than one or two days, even longer than a quarter. We estimate the investment shortfall incurred by investing in leveraged and inverse ETFs compared to investing in a simple margin account to generate the same leveraged or short-selling investment strategy. We find that investors in leveraged and inverse ETFs can lose 3% of their investment in less than 3 weeks, an annualized cost of 50%. We also discuss the viability of leveraged and inverse leveraged ETFs that rebalance less often than daily and calculate their costs to investors. I. Introduction Exchange-Traded Funds (ETFs) are similar to index mutual funds but are listed and traded on exchanges similar to unit investment trusts and closed end mutual funds. Unlike mutual funds, that trade only once a day at net asset value, ETFs trade at varying prices throughout the day just like stocks. 2 1 © 2010 Securities Litigation and Consulting Group, Inc., 3998 Fair Ridge Drive, Suite 250, Fairfax, VA 22033. www.slcg.com. Dr. Guedj can be reached at 703-865-4020 or State Street Global Advisors introduced the [email protected] , Dr. Li can be reached at [email protected] and Dr. McCann can be reached at 703-246-9381 or [email protected] . 2 For an in-depth discussion of the differences between index mutual funds and ETFs, see Guedj and Huang (2010).

Welcome message from author
This document is posted to help you gain knowledge. Please leave a comment to let me know what you think about it! Share it to your friends and learn new things together.
Transcript
Securities Litigation and Consulting Group, Inc. © 2010.
Leveraged ETFs, Holding Periods
and Investment Shortfalls
Ilan Guedj, PhD, Guohua Li, PhD, and Craig McCann, PhD1
Leveraged and Inverse ETFs replicate the leveraged or the inverse of the daily returns of an index. Several papers have established that investors who hold these investments for periods longer than a day expose themselves to substantial risk as the holding period returns will deviate from the returns to a leveraged or inverse investment in the index. It is possible for an investor in a leveraged ETF to experience negative returns even when the underlying index has positive returns.
In this paper, we estimate distributions of holding periods for investors in leveraged and inverse ETFs. Using standard models, we show that a substantial percentage of investors may hold these short-term investments for periods longer than one or two days, even longer than a quarter.
We estimate the investment shortfall incurred by investing in leveraged and inverse ETFs compared to investing in a simple margin account to generate the same leveraged or short-selling investment strategy. We find that investors in leveraged and inverse ETFs can lose 3% of their investment in less than 3 weeks, an annualized cost of 50%. We also discuss the viability of leveraged and inverse leveraged ETFs that rebalance less often than daily and calculate their costs to investors.
I. Introduction
Exchange-Traded Funds (ETFs) are similar to index mutual funds but are listed
and traded on exchanges similar to unit investment trusts and closed end mutual funds.
Unlike mutual funds, that trade only once a day at net asset value, ETFs trade at varying
prices throughout the day just like stocks.2
1 © 2010 Securities Litigation and Consulting Group, Inc., 3998 Fair Ridge Drive, Suite 250, Fairfax, VA 22033. www.slcg.com. Dr. Guedj can be reached at 703-865-4020 or
State Street Global Advisors introduced the
[email protected], Dr. Li can be reached at [email protected] and Dr. McCann can be reached at 703-246-9381 or [email protected]. 2 For an in-depth discussion of the differences between index mutual funds and ETFs, see Guedj and Huang (2010).
2
Leveraged and Inverse Leveraged ETFs
first ETF in the United States – the SPDR, which tracks the S&P 500 index – in 1993.3
Since 1993, investments in ETFs have grown rapidly, from $66 billion in 2000 to $2
trillion in 2010 and their underlying portfolios have expanded beyond domestic stocks
into bonds, foreign stocks, and commodities.4
Investors can leverage purchases in or sell short ETFs in margin accounts subject
to the same margin rules that apply to purchases of most common stocks. Roughly
speaking, the Federal Reserve Board’s Regulation T prohibits the extension of credit to
purchase common stock or the withdrawal of assets from a leveraged securities account
that would reduce the investor’s equity in the account below 50% of the value of the
securities in the portfolio.
Investments in ETFs now account for
about 40% of the total amount invested in index mutual funds in the US. Many stock
exchanges around the world now also list ETFs. iShares, State Street and Vanguard are
the three largest issuers of ETFs.
5 In addition, self-regulatory organizations (“SROs”) require
that member firms issue a margin call, i.e. demand additional unencumbered customer
assets whenever the equity ratio in an account falls below a “maintenance requirement”
of 25% because of changes in the market value of the securities held in the account.6
Leveraged and inverse ETFs combine traditional ETFs with internal borrowing or
short selling to create simple leveraged or short investments. Until recently, investors in
leveraged and short ETFs could make purchases that effectively leveraged or sold short
an investment in securities without being constrained by margin rules.
7
3 SPDRs - Standard & Poor’s Depository Receipts or “Spiders” - are the largest ETF by market capitalization. The first ETF was introduced on the Toronto Stock Exchange in 1990.
For example, a
leveraged ETF portfolio manager might borrow 200% of the equity in her portfolio and
invest 300% of the equity value in securities. The equity in the ETF portfolio in that
situation is only 33% of the securities value. An investor that concentrated her account in
4 See ICI Fact book (2010) 5 http://ecfr.gpoaccess.gov/cgi/t/text/text-idx?c=ecfr&sid=40cc031a4a064ca8d3f500270b0d0fd7&rgn=div8&view=text&node=12:3.0.1.1.1.0.1.12&idno=12 6 In fact, many brokerage firms have maintenance requirements above 25%. 7 FINRA NTM 09-53 (2009) announced higher margin requirements for leveraged and inverse ETFs that take into account the underlying leveraged or short market exposures. In addition to avoiding margin requirements, leveraged and inverse ETFs allowed investors to gain leveraged or short exposure in retirement accounts.

3
Leveraged and Inverse Leveraged ETFs
a 3-to-1 leveraged ETF would effectively be using leverage that would not be allowed in
a retail margin account.
The portfolio manager of an inverse ETF effectively replicates short sales that
could also be done in a retail margin account. The inverse ETF portfolio manager
effectively borrows and sells short investments in the reference index, experiencing
market returns opposite to the returns on the index and earning interest on the portfolio’s
cash balance. If the index’s market return is negative and the net interest earned on the
cash balance is positive, the inverse ETF will have a positive return.
Leveraged and inverse open-end mutual funds similar to leveraged and inverse
ETFs had been in existence for many years prior to 2006. For example, ProFunds’
UltraBull (ULPIX) and UltraBear (URPIX) open-end mutual funds, which leverage up
and invert the daily returns to the S&P 500 respectively, were first offered in 1997. Like
leveraged and inverse ETFs, these mutual funds rebalance their portfolios to re-establish
their target exposure ratios at the end of each day.
FINRA has issued a Notice to Members and additional guidance and the SEC has
issued an Investor Alert about leveraged and inverse ETFs.8
In this paper, we describe the problems associated with the daily rebalancing and
the potential costs it may create for investors who hold these ETFs for longer than a few
days. We use a methodology from the securities class action literature (see for example
Barclay and Torchio (2001)) to infer the investors’ holding periods from the observed
trading volume. We apply this method to estimate the distribution of holding periods of
investors in five different leveraged and inverse ETFs and use our results to calculate the
shortfalls these investors have experienced compared to directly leveraging or selling
short the underlying index with an ETF.
FINRA and the SEC have
focused primarily on whether investors adequately understand that the returns to
leveraged and inverse ETFs over holding periods longer than a few days are often
significantly less than a multiple of the returns to the market index being referenced.
8 FINRA Regulatory Notice 09-31 (2009), “Non-Traditional ETFs FAQ” at www.finra.org/Industry/Regulation/Guidance/P119781 and “Leveraged and Inverse ETFs: Specialized Products with Extra Risks for Buy-and-Hold Investors” at www.sec.gov/investor/pubs/leveragedetfs-alert.htm.
4
Leveraged and Inverse Leveraged ETFs
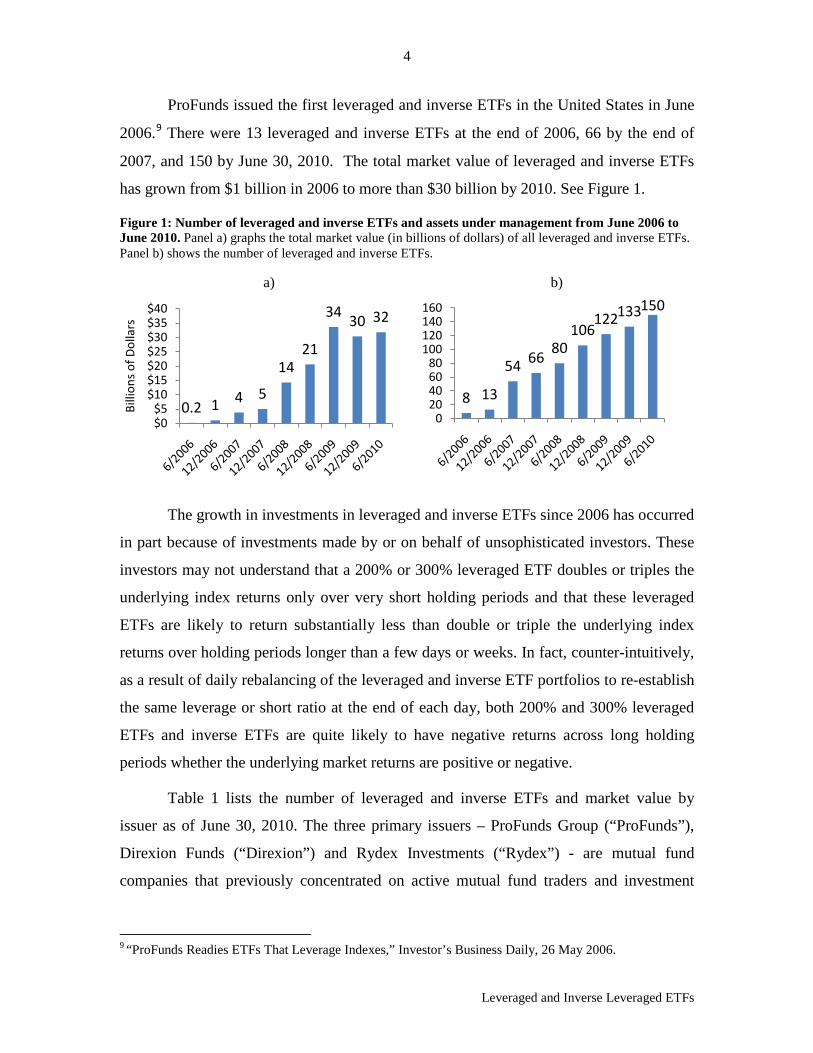
ProFunds issued the first leveraged and inverse ETFs in the United States in June
2006.9
Figure 1
There were 13 leveraged and inverse ETFs at the end of 2006, 66 by the end of
2007, and 150 by June 30, 2010. The total market value of leveraged and inverse ETFs
has grown from $1 billion in 2006 to more than $30 billion by 2010. See .
Figure 1: Number of leveraged and inverse ETFs and assets under management from June 2006 to June 2010. Panel a) graphs the total market value (in billions of dollars) of all leveraged and inverse ETFs. Panel b) shows the number of leveraged and inverse ETFs.
a) b)
The growth in investments in leveraged and inverse ETFs since 2006 has occurred
in part because of investments made by or on behalf of unsophisticated investors. These
investors may not understand that a 200% or 300% leveraged ETF doubles or triples the
underlying index returns only over very short holding periods and that these leveraged
ETFs are likely to return substantially less than double or triple the underlying index
returns over holding periods longer than a few days or weeks. In fact, counter-intuitively,
as a result of daily rebalancing of the leveraged and inverse ETF portfolios to re-establish
the same leverage or short ratio at the end of each day, both 200% and 300% leveraged
ETFs and inverse ETFs are quite likely to have negative returns across long holding
periods whether the underlying market returns are positive or negative.
Table 1 lists the number of leveraged and inverse ETFs and market value by
issuer as of June 30, 2010. The three primary issuers – ProFunds Group (“ProFunds”),
Direxion Funds (“Direxion”) and Rydex Investments (“Rydex”) - are mutual fund
companies that previously concentrated on active mutual fund traders and investment
9 “ProFunds Readies ETFs That Leverage Indexes,” Investor’s Business Daily, 26 May 2006.
0.2 1 4 5
1421
34 30 32
$0$5
$10$15$20$25$30$35$40
Billi
ons o
f Dol
lars
8 13
54 66 80106
122133150
020406080
100120140160
5
Leveraged and Inverse Leveraged ETFs
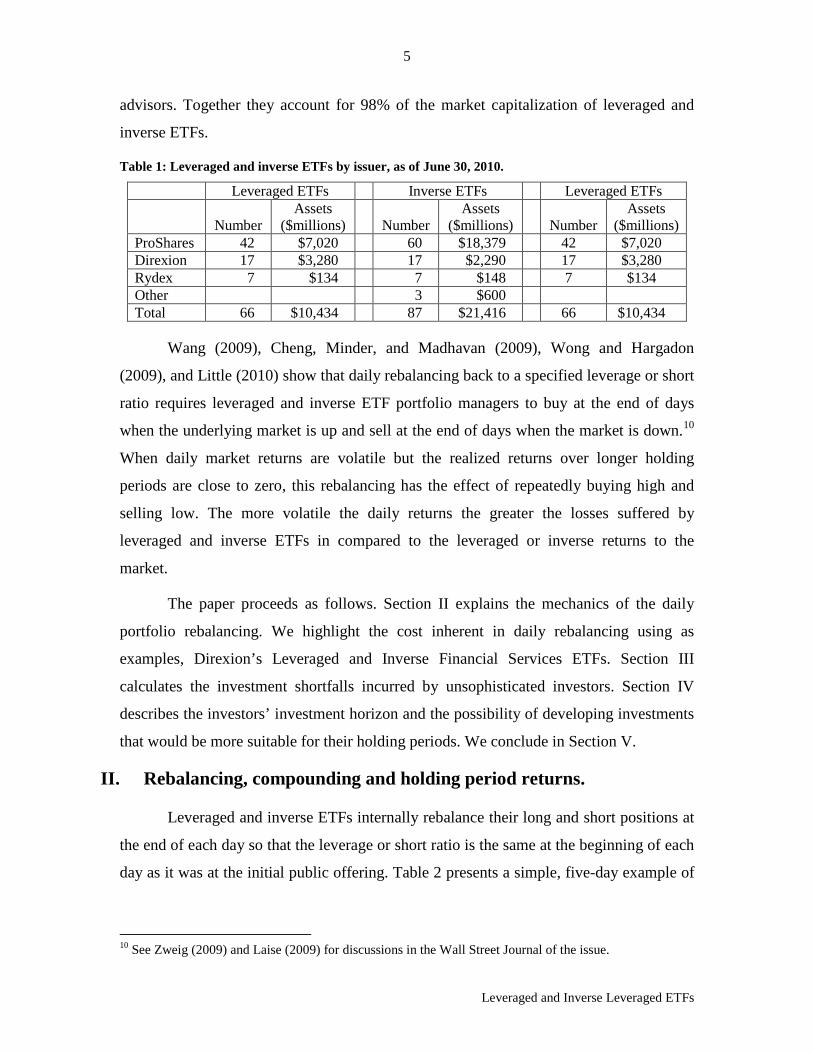
advisors. Together they account for 98% of the market capitalization of leveraged and
inverse ETFs.
Table 1: Leveraged and inverse ETFs by issuer, as of June 30, 2010.
Leveraged ETFs Inverse ETFs Leveraged ETFs
Number Assets
($millions) Number Assets
($millions) Number Assets
($millions) ProShares 42 $7,020 60 $18,379 42 $7,020 Direxion 17 $3,280 17 $2,290 17 $3,280 Rydex 7 $134 7 $148 7 $134 Other 3 $600 Total 66 $10,434 87 $21,416 66 $10,434
Wang (2009), Cheng, Minder, and Madhavan (2009), Wong and Hargadon
(2009), and Little (2010) show that daily rebalancing back to a specified leverage or short
ratio requires leveraged and inverse ETF portfolio managers to buy at the end of days
when the underlying market is up and sell at the end of days when the market is down.10
The paper proceeds as follows. Section II explains the mechanics of the daily
portfolio rebalancing. We highlight the cost inherent in daily rebalancing using as
examples, Direxion’s Leveraged and Inverse Financial Services ETFs. Section III
calculates the investment shortfalls incurred by unsophisticated investors. Section IV
describes the investors’ investment horizon and the possibility of developing investments
that would be more suitable for their holding periods. We conclude in Section V.
When daily market returns are volatile but the realized returns over longer holding
periods are close to zero, this rebalancing has the effect of repeatedly buying high and
selling low. The more volatile the daily returns the greater the losses suffered by
leveraged and inverse ETFs in compared to the leveraged or inverse returns to the
market.
II. Rebalancing, compounding and holding period returns.
Leveraged and inverse ETFs internally rebalance their long and short positions at
the end of each day so that the leverage or short ratio is the same at the beginning of each
day as it was at the initial public offering. Table 2 presents a simple, five-day example of
10 See Zweig (2009) and Laise (2009) for discussions in the Wall Street Journal of the issue.

6
Leveraged and Inverse Leveraged ETFs
the impact of rebalancing and compounding on leveraged and inverse ETF returns. The
daily returns accumulate over the five days to 0.01%.
Table 2: Example of the impact of rebalancing and compounding on ETFs.
Index Returns Traditional ETFs and Cash or Margin Debt
Leveraged and Inverse ETFs
a) b) c) d) e) f) g) Day Daily
Return Cumulative
Return Unlevered
ETF $200 cash, short
$100 ETF $200 margin,
$300 ETF 1X I-ETF 3X L-ETF
0 $100.00 $100.00 $100.00 $100.00 $100.00 1 23% 23.00% $123.00 $77.00 $169.00 $77.00 $169.00 2 -20% -1.60% $98.40 $101.60 $95.20 $92.40 $67.60 3 20% 18.08% $118.08 $81.92 $154.24 $73.92 $108.16 4 -23% -9.08% $90.92 $109.08 $72.76 $90.92 $33.53 5 10% 0.01% $100.01 $99.99 $100.03 $81.83 $43.59
Columns c), d) and e) reflect the returns that would be earned gross of fees and
expenses in a traditional ETF, from selling short a traditional ETF and from leveraging
up a traditional ETF 3-to 1. Column c) reports the value of $100 invested in an unlevered
ETF at the beginning of the week is $100.01 at the end of the week. Column d) shows
that the same $100 used to collateralize a short sale of $100 would end the week worth
$99.99 ignoring any interest earned on the proceeds of the short sale. Column e) shows
the result of leveraging up a traditional ETF 3-to-1 over the same 5-day period. We have
constructed this example so that the 5-day holding period returns to the unleveraged ETF
and to the leveraged and short investments in the ETF are all 0%.
Columns f) and g) report the results of selling short the underlying market by
investing in an inverse ETF and the result of leveraging up the underlying market by
investing in a 3X leveraged ETF. Column f) shows the result of investing $100 in an
inverse ETF over the same week. Initially the inverse ETF portfolio holds a $100 short
position in the index, $200 in collateral and $100 net equity. The resulting market
exposure is -$100. On the first day, the market return is 23%, the inverse ETF’s return is -
23%, and the 1X inverse ETF investment is worth $77 since its underlying short position
in the index is now $123 liability against its $200 in cash. The inverse ETF’s market
exposure is now -160% (i.e. -$123/$77 = -160%).

7
Leveraged and Inverse Leveraged ETFs
If the inverse ETF portfolio manager does not adjust the portfolio, the returns on
the inverse ETF for the second day will equal -160% of the index return. To re-establish
a -100% market exposure to start the second day, the portfolio manager uses $46 of the
$200 in cash to reduce the -$123 end-of-day short market exposure down to -$77. The -
20% index return on the second day reduces this short market exposure from -$77 to -
$61.60 and the inverse ETF value increases to $92.40 at the end of the second day. At the
end of the second day, because of the decrease in the value of the short position and the
increase in the net asset value, the exposure ratio has fallen to -66.67%. To restore
exposure to -100%, the inverse ETF manager must now increase back the leverage to
-100% by increasing the short exposure by $30.80.
This simple example highlights the “constant leverage trap”. Over a 5-day period,
the ETF returns, as well as the leverage, and a short investment returns in the ETF was
0%. However, an investment in a 1X inverse ETF lost 18.2% and an investment in a 3x
leveraged ETF lost 56.4%.
Cheng and Madhavan (2009) and Wang (2009) shows that the return on a
leveraged ETF is:
(1 + 𝑅𝑇𝐿−𝐸𝑇𝐹) = �1 + 𝑅𝑇𝑖𝑛𝑑𝑒𝑥�𝑥∙ 𝑒
(𝑥−𝑥2)𝜎2𝑇2
Where x is the leverage ratio, σ is the volatility of the index, and T is the time
period the investment is held. For all leveraged ETFs in the market, the scalar term
𝑒(𝑥−𝑥2)𝜎2𝑇
2� is positive, less than one and declines towards 0 the longer the holding
period. The return of the leveraged ETF is a function of the return of the underlying index
to the power of the leverage, multiplied by the scalar term. If the volatility is high
enough and the holding period is long enough, the constant will be small and the return
on the leveraged ETF will be smaller than that of its underlying index. It is possible for
an investor in a leveraged ETF to earn negative returns even when the underlying index
increases in value.
The daily rebalancing of leveraged and inverse ETFs creates a situation that for
periods longer than a day or two the return of a leveraged or inverse ETF will deviate
from the margin account benchmark. The magnitude of the deviation will depend on the
8
Leveraged and Inverse Leveraged ETFs
index characteristics for the holding period, mainly its volatility and its path. The higher
the leverage and the longer the time period, the more likely it is that this deviation will be
substantial. In general, as long as the underlying index has no clear trend, the higher the
volatility, the higher the leverage, and the longer the time period, the more the investor
will lose compared to investing in a leveraged or short position using a margin account.
The early ETF prospectuses did not fully explain the investment shortfall or warn
that investors should exercise extra caution when investing in these funds. For example,
one such prospectus stated, “The Fund’s current benchmark is 200% of the performance
of the S&P 500 Index (the “Index” or “Underlying Index”). If the Fund meets its
objectives, the value of the Fund's shares will tend to increase on a daily basis by 200%
of the value of any increase in the Underlying Index.”11 Another prospectus stated that
“The correlations sought by the Bull Funds and the Bear Funds are generally a multiple
of the returns of the target index or benchmark.”12
Direxion issued (3X) and (-3X) ETFs in November 2008. Their September 29,
2008 prospectus stated, “The Funds described in this Prospectus seek to provide daily
investment results, before fees and expenses that correspond to the performance of a
particular index or benchmark. The Funds with the word “Bull” in their name
(collectively, the “Bull Funds”) attempt to provide investment results that correlate
positively to the return of an index or benchmark, meaning the Bull Funds attempt to
move in the same direction as the target index or benchmark. The Funds with the word
“Bear” in their name (collectively, the “Bear Funds”) attempt to provide investment
results that correlate negatively to the return of an index or benchmark, meaning that the
Bear Funds attempt to move in the opposite or inverse direction of the target index or
benchmark. The correlations sought by the Bull Funds and the Bear Funds are generally
a multiple of the returns of the target index or benchmark.”
13
These statements illustrate how confusing descriptions of leveraged and inverse
ETFs can be. The prospectuses did not always clearly explain that ETFs are not suitable
for investors with investment horizons longer than one day. It was not until 2009 - after
11 www.sec.gov/Archives/edgar/data/1208211/000093506906003020/g36000_etf485a.txt 12 www.sec.gov/Archives/edgar/data/1424958/000089843208000978/direxion.htm 13 www.sec.gov/Archives/edgar/data/1424958/000089843208000978/direxion.htm
9
Leveraged and Inverse Leveraged ETFs
many leveraged ETFs suffered significant losses while the reference ETFs had significant
gains - that Rydex and ProShares ETFs improved their disclosures.14 For example,
Rydex’s December 16, 2009 prospectus emphasized the daily leveraged investment goals
and stated the leveraged ETFs were not suitable for “investors who do not intend to
actively monitor and manage their portfolios.” 15 ProShares’ June 23, 2009 prospectus
addressed investor suitability in a separate paragraph on two new products and then on all
of the leveraged and inverse leveraged ETFs in their July 31, 2009 prospectus. 16
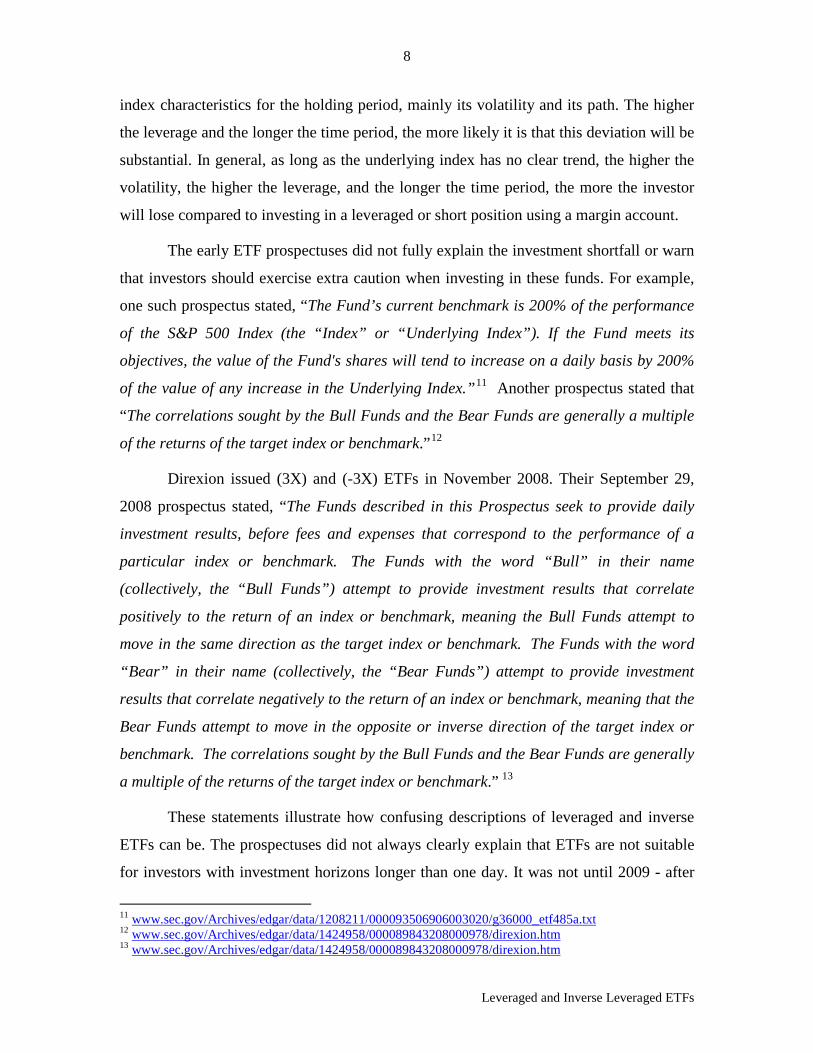
Figure 2 plots the value of an investment of $100 in Direxion Financial Bull 3X
ETF (FAS), Direxion Financial Bear 3X ETF (FAZ) and the Russell 1000 Financial
Services Index (RGUSFL).
17
Figure 2: Direxion’s FAS, FAZ, and the Russell 1000 Financial Services Index from November 6, 2008 to June 23, 2010.
FAS and FAZ were first issued on November 6, 2008. FAS
leverages up an investment in the financial services sector 3-to-1 each day, for one day.
FAZ sells 300% of the fund’s net assets short in the financial services sector each day, for
one day.
14 Direxion emphasized on investor suitability in their prospectus filed on December 17, 2008. 15 http://sec.gov/Archives/edgar/data/1208211/000089180409005431/sb47870-485b.txt 16 http://sec.gov/Archives/edgar/data/1174610/000119312509135520/d485bpos.htm http://sec.gov/Archives/edgar/data/1174610/000119312509160939/d485apos.htm 17 As of May 28, 2010, RGUSFL 10 largest constituents were JPMorgan Chase, Bank of America, Wells Fargo, Citigroup, Goldman Sachs, US Bancorp, American Express, Morgan Stanley and Visa. www.russell.com/indexes/PDF/fact_sheets/US/1000Financialservices.pdf
$0
$50
$100
$150
$200
$250
Russell 1000 Financial Services Index
Direxion 3x Financial Bull ETF (FAS)
Direxion (-3x) Financial Bear ETF (FAZ)

10
Leveraged and Inverse Leveraged ETFs
Investors who thought that FAS or FAZ were effective ways to make any more
than transitory bets on the direction of the financial services industry might be shocked
by the returns illustrated in Figure 2. The Russell 1000 Financial Services Index gained
10% over the period reflected in Figure 2, yet FAS, the (3X) leveraged ETF, rather than
returning 30% lost 72.4% and, the (-3X) inverse leveraged ETF, FAZ, rather than losing
30%, lost 97.9%. The counterintuitive pattern illustrated in Figure 2 is common for
leveraged and inverse ETFs and results from the daily rebalancing of the funds’
portfolios.
III. Potential Investment Shortfalls Incurred by Long-Term Investors
Unsophisticated investors who don’t understand that leveraged ETFs are a poor
way of leveraging or selling short an index for a period longer than a day or two may
have experienced substantial investment shortfalls compared to having directly leveraged
or shorted the underlying ETF in a margin account. The extent of the shortfall depends on
the holding period of the investment and the returns and volatility of the underlying ETF.
In order to precisely calculate the investment shortfalls caused by the mismatch between
investors’ investment horizon and the fund’s daily horizon we need to observe actual
holding periods. As these holding periods are not publicly available, we use trading
models commonly used in establishing damages in securities class action litigation to
estimate the holding periods. Barclay and Torchio (2001), Mayer (2000), McCann and
Hsu (1999), and Beaver, Malernee and Keeley (1997) among others describe the
methodology of using Trading Models and their advantages and shortcomings.
The simplest model, the Proportional Trader Model (“PTM”), assumes that each
share outstanding is equally likely to trade. Thus, shares which trade each day are drawn
from those which have recently traded and those which have not recently traded in
proportion to the relative size of these two groups. For example, assume there are 1,000
shares outstanding and in one day we observe 200 shares traded. The PTM assumes that
each investor sells proportionally 20% of their shares and are left with 80% of their
previous day’s holdings. If 100 shares are traded the next day, the PTM assumes that all
investors – including investors who just bought the day before - sold 10% of their shares.
The PTM repeats this process each day for the time period of interest and is thus able to

11
Leveraged and Inverse Leveraged ETFs
estimate the distribution of holding periods for each day’s purchases. Murray and Belfi
(2005) argue that the PTM method meets the legal criteria set by the Supreme Court for
admission as a valid legal method for calculating damages.
The Multiple Trader Model (“MTM”) assumes that there are at least two types of
investors whithin each trader type with a different level of trading activity. Shares
outstanding trade and daily trading volume are allocated among these types of traders and
the PTM is applied to each type separately. The separate PTM results are then added
together to arrive at total estimated damaged shares. Barclay and Torchio (2001) compare
different variations of the proportional trading model to demonstrate that results from the
proportional trading model can be consistent with the results of multi-trader models when
certain assumptions and parameters are used. The MTM model appears to be appropriate
for our research since a part of the ETF trades are done by market makers and
arbitrageurrs and only a part is done by individual investors. See Appendix I for a
detailed description of the procedures we follow.
We illustrate our methodology for estimating investment shortfalls with the five
leveraged and inverse ETFs listed in Table 3. We use a cross section of ETFs from three
different issuers, with a variety of positive and negative leverages, tracking a variety of
indexes, including equity indexes, broad indexes, and bond indexes.
Table 3: List of five leveraged ETFs for which we calculate investment shortfalls.
Ticker Name Issuer Leverage Index DPK Developed Markets Bear 3X Direxion -3 MSCI EAFE TYO 10-Year Treasury Bear 3X Direxion -3 NYSE 10 Year Treasury RHO Inverse 2X S&P Select Sector Health Care Rydex -2 AMEX Health Care Select SBB Short Small Cap 600 Fund ProShares -1 CBOE S&P Small cap 600 UVG Ultra Russell 1000 Value Fund ProShares 2 Russell 1000 Value
Table 4 reports the average turnover ratio for each ETF since inception and the
estimated distribution of investors’ holding periods. The average daily turnover ratio is an
indicator of the average holding period. However, the MTM method allows us to estimate
the distribution of holding periods.
As Table 4 illustrates, even leveraged and inverse ETFs that have a high daily
turnover ratio will have some investors holding the ETF for longer than a few days. We

12
Leveraged and Inverse Leveraged ETFs
describe the holding period distribution by calculating the percentage of investors who
hold the ETF for more than a week, a month, and a quarter. All five ETFs in our sample
have a substantial percentage of holding periods longer than a month, ranging from 6% to
almost 24% of the investors. More than 8% of the investors in SBB and UVG appear to
hold the ETF longer than a quarter.
Table 4: Calculated holding periods for five leveraged ETFs.
ETF Average Daily
Turnover Ratio
Leverage Ratio
Average Holding Period (days)
Purchases Held for More Than 1 Week
Purchases Held for More Than 1 Month
Purchases Held for More Than 1 Quarter
DPK 18.1% -3 5.3 16.42% 6.30% 1.22% TYO 5.5% -3 12.8 48.02% 16.39% 3.89% SBB 4.6% -1 21.4 55.49% 21.62% 8.50% RHO 2.9% -2 18.4 61.28% 27.62% 6.58% UVG 3.7% 2 22.7 54.31% 23.91% 8.90%
The daily turnover ratio is inversely related to the average holding period. SBB,
RHO and UVG have lower turnover and higher average holding periods than DPK and
TYO. However, the results of the distribution of the holding periods highlights the
importance and contribution of using MTM method to infer the investors’ holding
periods. RHO has the lowest average daily turnover (2.9%) and its estimated average
holding period (18.4 trading days) is not as long as UVG’s estimated average holding
period (22.7 days) even though UVG’s daily turnover ratio is higher (3.7%). Nonetheless,
more than 60% of purchased RHO shares are held longer than one week, while only 54%
UVG shares purchased are held longer than a week. The MTM method gives us a tool to
infer the distribution of holding periods, with is important when trying to analyze the
behavior of investors in an investment designed to be held for only a short time.
The percentage of investors that we estimate hold these short term investments
longer than a month is quite striking. More than 27% of RHO shares and more than 23%
of UVG shares purchased appear to be held for longer than a month and more than 8% of
SBB and UVG shares purchased appear to be held longer than a quarter - a very long
time for an investment that should be held for only a day or two.
DPK has the highest daily turnover ratio and the lowest average holding period, as
shown in Table 4. More than 16% of DPK shares purchased are held longer than one

13
Leveraged and Inverse Leveraged ETFs
week, more than 6% are held longer than a month, and more than 1% are held longer than
a quarter. Figure 3 contains a histogram of the distribution of estimated investor holding
periods of DPK. DPF’s prospectus states “the Funds are designed as short-term trading
vehicles for investors who intend to actively monitor and manage their portfolios.”18
Figure 3: Histogram of the holding period distribution for DPK. The horizontal axis is shown in trading days.
Despite this statement, it appears that more than 6% of investors held this ETF longer
than a month. This indicates that many investors do not understand the inherent cost
associated with holding a short-term investment for a long-term.
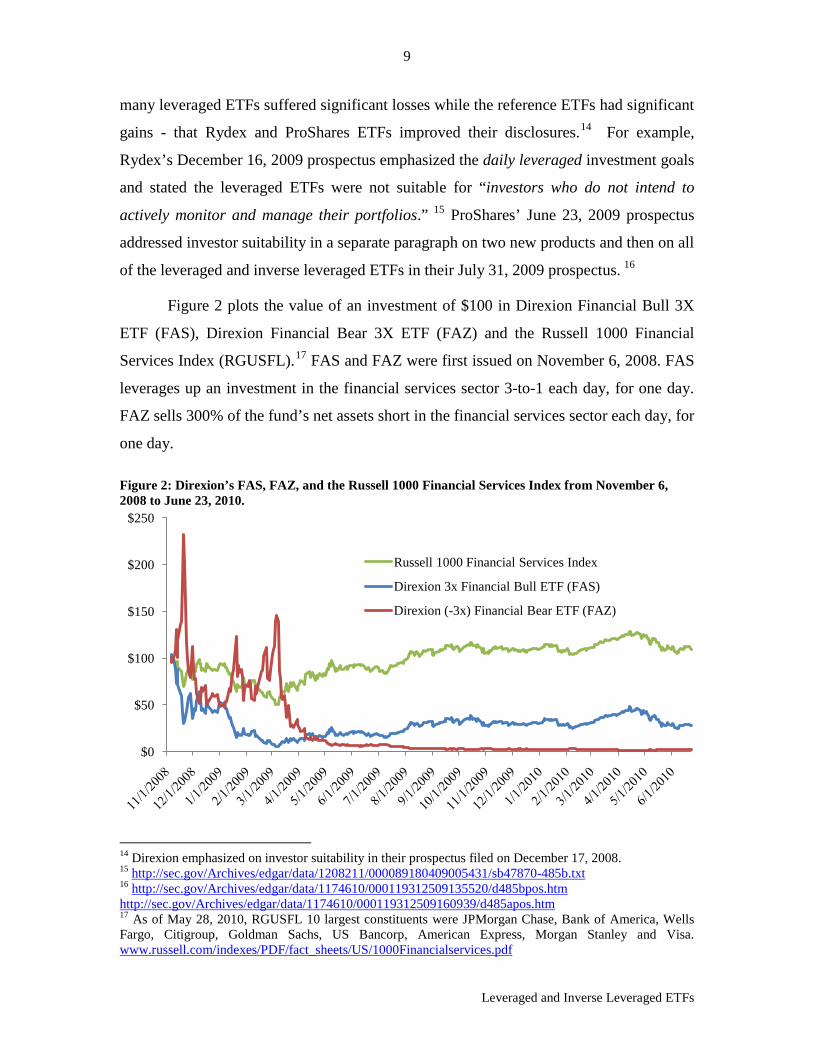
We use the MTM methodology to estimate the investment shortfall or the
difference between holding the leveraged ETF and holding a leveraged investment in the
index ETF in a margin account. In Figure 4, we present the difference between the two
strategies’ holding period returns as a function of the number of days the positions are
held. For all holding periods, DPK on average had lower returns than the leveraged
investment in the index ETF benchmark. Moreover, the longer the holding period, the
greater the investment shortfall from the benchmark. On average, an investor that held
DFK for 15 trading days lost 3% of her investment compared to the benchmark. In other
words, had the investor created the leverage themselves in a margin account they would
18 www.sec.gov/Archives/edgar/data/1424958/000089843210000945/a485bpos.htm, page 30.
0%
10%
20%
30%
40%
50%
1 2 3 4 5 6 7 8 9 10 11 12 13 14 15 16 17 18 19 20 21
14
Leveraged and Inverse Leveraged ETFs
have earned 3% more over a 3 week time period, the equivalent of more than 50% on an
annualized basis.
Figure 4: Difference between the holding period return of the margin account and the leveraged ETF (Ticker: DPK), by length of holding period. The vertical axis shows how much higher the margin account’s holding period return is relative to the leveraged ETF’s. The horizontal axis shows the length, in trading days, that the position is held.
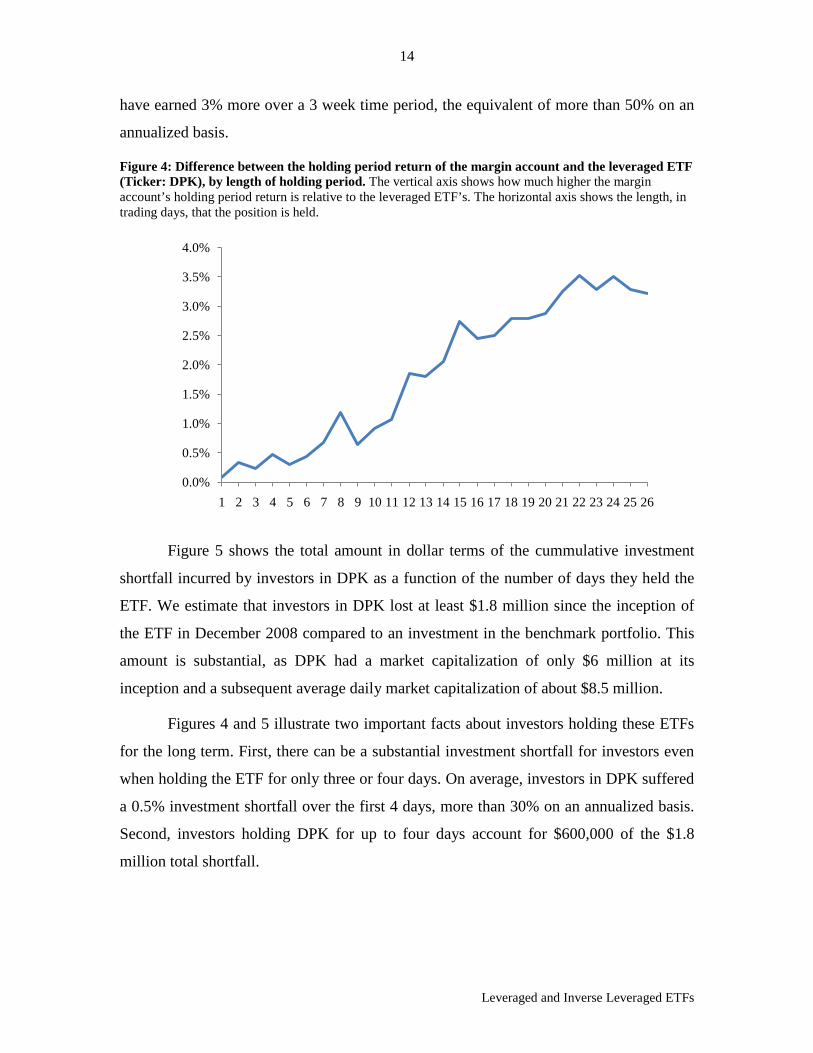
Figure 5 shows the total amount in dollar terms of the cummulative investment
shortfall incurred by investors in DPK as a function of the number of days they held the
ETF. We estimate that investors in DPK lost at least $1.8 million since the inception of
the ETF in December 2008 compared to an investment in the benchmark portfolio. This
amount is substantial, as DPK had a market capitalization of only $6 million at its
inception and a subsequent average daily market capitalization of about $8.5 million.
Figures 4 and 5 illustrate two important facts about investors holding these ETFs
for the long term. First, there can be a substantial investment shortfall for investors even
when holding the ETF for only three or four days. On average, investors in DPK suffered
a 0.5% investment shortfall over the first 4 days, more than 30% on an annualized basis.
Second, investors holding DPK for up to four days account for $600,000 of the $1.8
million total shortfall.
0.0%
0.5%
1.0%
1.5%
2.0%
2.5%
3.0%
3.5%
4.0%
1 2 3 4 5 6 7 8 9 10 11 12 13 14 15 16 17 18 19 20 21 22 23 24 25 26

15
Leveraged and Inverse Leveraged ETFs
Figure 5: Holding period cumulative total investment shortfall. The graph shows how much more the leveraged ETF (Ticker: DPK) would be worth if the ETF had been established using a margin account instead of being rebalanced daily. The horizontal axis is the number of trading days since the inception of the leveraged ETF.
Table 5 reports the estimated investment shortfalls since inception and market
capitalization of the five ETFs listed in Table 3. There is a large distribution of shortfalls
between the different funds. On average, investors experienced an investment shortfall in
each ETF. Due to the path-dependent nature of leveraged and inverse ETFs, an
investment shortfall compared to directly leveraging or short selling an ETF in a margin
account is not certain for every investor. However, our estimations indicate significant
aggregate investment shortfalls in all of our case studies. The ubiquitous nature of the
shortfalls illustrates the importance of ensuring that investors understand leveraged and
inverse ETFs and their unique risks.
Table 5: Cumulative total investment shortfall of five leveraged ETFs. We estimate the aggregate investment shortfall from the ETF’s inception through June 1, 2009.
ETF Leverage Ratio Inception
Market Capitalization at Inception
Estimated Aggregate Shortfall
DPK -3 12/17/2008 $ 6,046,000 $ 1,412,489 TYO -3 4/15/2009 $ 6,100,000 $ 745,502 RHO -2 6/12/2008 $ 7,802,000 $ 207,726 SBB -1 1/25/2007 $ 15,630,750 $ 1,573,060 UVG 2 2/22/2007 $ 10,407,000 $ 464,699
$-
$200,000
$400,000
$600,000
$800,000
$1,000,000
$1,200,000
$1,400,000
$1,600,000
1 2 3 4 5 6 7 8 9 10 11 12 13 14 15 16 17 18 19 20 21 22 23 24 25 26

16
Leveraged and Inverse Leveraged ETFs
IV. Investors’ Investment Horizon and Funds’ Rebalancing Frequency
New offerings by Direxion claim to match the investment horizon of investors
better by rebalancing their portfolios only once a month. Little (2010) explains the
concepts behind these investments.
Figure 6 plots the value of $100 leveraged 2-to-1 in an ETF that tracks the Dow
Jones U.S. Financials Index in a margin account from December 1, 2008 to December 1,
2009. This investment is what we have been referring to above in our investment
shortfall examples and calculations as the “benchmark”. Figure 5 also plots the value of
hypothetical 2-to-1 leveraged ETFs that rebalance daily, weekly, monthly and quarterly.
As we can see in Figure 6, the less frequently leveraged ETFs rebalance their portfolios,
the more closely their returns track the benchmark returns.
Figure 6: Comparison of holding returns using different compounding periods. The graph depicts the
value of the DPK ETF (over time if it used daily, weekly, monthly, or quarterly rebalancing, or no
rebalancing at all (equivalent to the margin account). DPK has 2-to-1 leverage.
$10$20$30$40$50$60$70$80$90
$100$110$120$130$140$150$160$170$180$190$200
No RebalancingDaily RebalancingWeekly RebalancingMonthly RebalancingQuarterly Rebalancing
17
Leveraged and Inverse Leveraged ETFs
Leveraged ETFs with a variety of rebalancing schedules may add value to
investors, as they may be more suited to their needs but if a leveraged ETF rebalances
monthly, investors buying in the middle of the month will invest at a time when the
ETF’s leverage might be dramatically different than its initial leverage. To be sure of its
exposure, an investor would have to check what the ETF’s leverage is on the day the
investor intends to purchase unless it coincides with the date a rebalancing is performed.
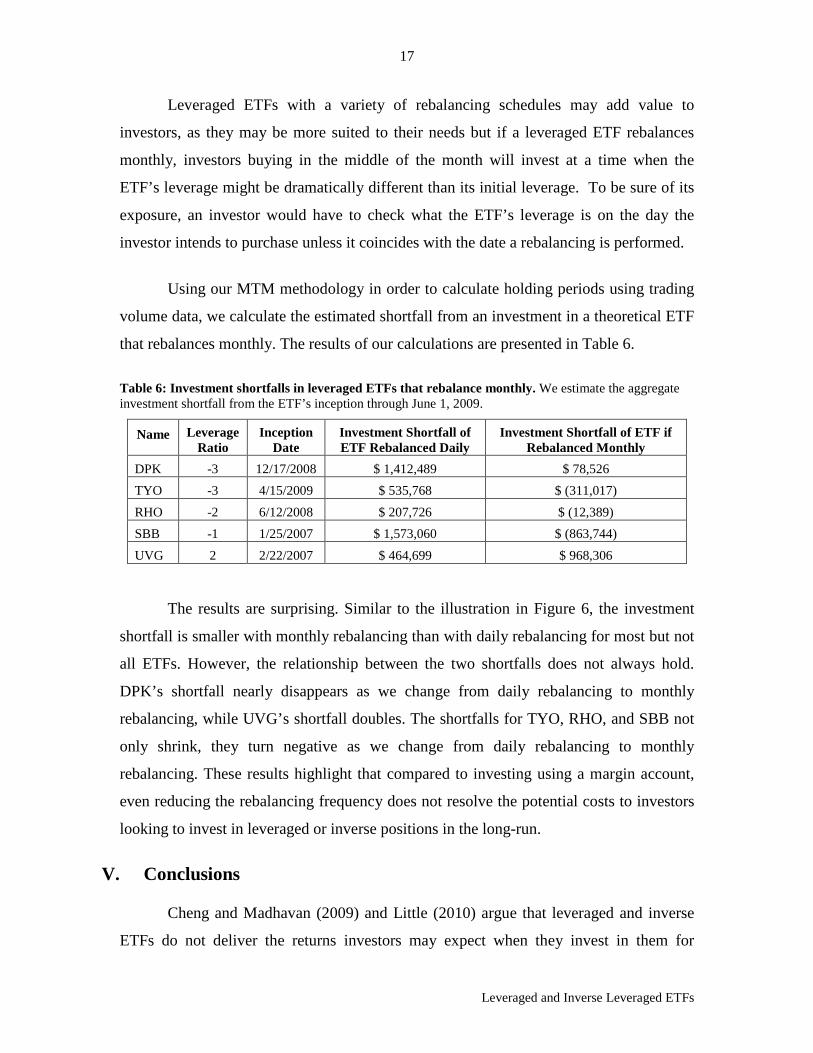
Using our MTM methodology in order to calculate holding periods using trading
volume data, we calculate the estimated shortfall from an investment in a theoretical ETF
that rebalances monthly. The results of our calculations are presented in Table 6.
Table 6: Investment shortfalls in leveraged ETFs that rebalance monthly. We estimate the aggregate investment shortfall from the ETF’s inception through June 1, 2009.
Name Leverage Ratio
Inception Date
Investment Shortfall of ETF Rebalanced Daily
Investment Shortfall of ETF if Rebalanced Monthly
DPK -3 12/17/2008 $ 1,412,489 $ 78,526 TYO -3 4/15/2009 $ 535,768 $ (311,017) RHO -2 6/12/2008 $ 207,726 $ (12,389) SBB -1 1/25/2007 $ 1,573,060 $ (863,744) UVG 2 2/22/2007 $ 464,699 $ 968,306
The results are surprising. Similar to the illustration in Figure 6, the investment
shortfall is smaller with monthly rebalancing than with daily rebalancing for most but not
all ETFs. However, the relationship between the two shortfalls does not always hold.
DPK’s shortfall nearly disappears as we change from daily rebalancing to monthly
rebalancing, while UVG’s shortfall doubles. The shortfalls for TYO, RHO, and SBB not
only shrink, they turn negative as we change from daily rebalancing to monthly
rebalancing. These results highlight that compared to investing using a margin account,
even reducing the rebalancing frequency does not resolve the potential costs to investors
looking to invest in leveraged or inverse positions in the long-run.
V. Conclusions
Cheng and Madhavan (2009) and Little (2010) argue that leveraged and inverse
ETFs do not deliver the returns investors may expect when they invest in them for
18
Leveraged and Inverse Leveraged ETFs
periods longer than a day or two. FINRA has required the issuers of leveraged and
inverse ETFs to caution their customers that these ETFs should be short-term investments
and need to be monitored carefully.
In this paper, we follow this argument and investigate it further by estimating the
distribution of the investors’ holding periods in those ETFs from publicly available data.
We find that many investors hold their leveraged ETFs for very long periods, at times
longer than three months. Further, we calculate the shortfall of such a behavior compared
to creating the leverage in a margin account. We find that some ETF investors lose up to
3% of their original investment in just a few weeks, the equivalent of a 50% annualized
return. This indicates that investors do not fully understand the risks associated with
inappropriately using leveraged and inverse ETFs as long-term investments.
Further, we investigate the value added to the marketplace by ETFs that rebalance
monthly instead of daily. We find that the average investment shortfall is smaller but
remains significant. Moreover, while we find less frequently rebalanced leveraged and
inverse ETFs tend to have returns that are more similar to investing in a margin account,
they may add risk as their leverage can vary significantly from day to day.
VI. Bibliography
Barclay, Michael and Frank C. Torchio, 2001, “A Comparison of Trading Models Used for Calculating Aggregate Damages in Securities Litigation”, Law and Contemporary Problems, 64 n.2-3, 105-36.
Beaver, William H., James K. Malernee, and Michael C. Keeley, 1997, “Stock Trading Behavior and Damage Estimation in Securities Cases”, Cornerstone Research working paper.
Cheng, Minder and Ananth Madhavan, 2009, “The Dynamics of Leveraged and Inverse-Exchange Traded Funds”, Journal of Investment Management, Winter 2009 (7)4
Cone, Kenneth R. and James E. Laurence, 1994, “How Accurate Are Estimates of Aggregate Damages in Securities Fraud Cases?” Business Law, 49: 505-526.
FINRA Regulatory Notice 09-31, 2009, “Non-Traditional ETFs: FINRA Reminds Firms of Sales Practice Obligations Relating to Leveraged and Inverse Exchange-Traded Funds”,
19
Leveraged and Inverse Leveraged ETFs
http://www.finra.org/web/groups/industry/@ip/@reg/@notice/documents/notices/p118952.pdf
FINRA Regulatory Notice 09-53, 2009, “Non-Traditional ETFs: Increased Margin Requirements for Leveraged Exchange-Traded Funds and Associated Uncovered Options”,http://www.finra.org/web/groups/industry/@ip/@reg/@notice/documents/notices/p119906.pdf
Guedj, Ilan and Jennifer Huang, 2010, “Are ETFs Replacing Index Mutual Funds?”, working paper: http://papers.ssrn.com/sol3/papers.cfm?abstract_id=1108728
ICI, 2010, “Investment Company Fact Book”, 50th Edition: http://www.icifactbook.org/
Laise, Eleanor, 2009, “Subpoenas Put Pressure on ETFs with Twist”, Wall Street Journal, August 1, 2009
Little, Patricia Knain, 2010, “Inverse and Leveraged ETFs: Not Your Father’s ETF”, The Journal of Index Investing, 1(1), 83–89.
Mayer, Marcia Kramer, 2000, “Best-Fit Estimation of Damaged Volume in Shareholder Class Actions: The Multi-Sector, Multi-Trader Model of Investor Behavior.” NERA working paper.
McCann, Craig J. and David Hsu, 1999, “Accelerated Trading Models Used in Securities Class Action Lawsuits”, Journal of Legal Economics, 1-47 (Winter 1998/1999).
Murray, Brian P. and Eric J. Belfi, 2005, The Proportionate Trading Model: Real Science or Junk Science?, Cleveland State Law Review, 52, 391-412
Wang, Zhenyu, 2009, “Market Efficiency of Leveraged ETFs”, working paper the Federal Reserve Bank of New York.
Wong, Raymund and Kara Hargadon, 2009, “Rebalancing Act: A Primer on Leveraged and Inverse ETFs”, working paper
Zweig, Jason, 2009, “How Managing Risk with ETFs can Backfire”, Wall Street Journal, February 27, 2009.
Appendix I – The Use of Trading Models to Estimate Holding Periods
The standard trading models are explained by Barclay and Torchio (2001), Mayer
(2000), McCann and Hsu (1999) and Beaver, Malernee and Keeley (1997). In this
appendix, we provide a brief sketch of our application of the methodology.
20
Leveraged and Inverse Leveraged ETFs
The Proportional Trader Model (“PTM”) assumes that each share outstanding is
equally likely to trade. Thus, shares which trade each day are drawn from those which
have recently traded and those which have not in proportion to the relative size of these
two groups. This simple assumption is extraordinarily powerful since it can be used to
generate distributions of holding periods.
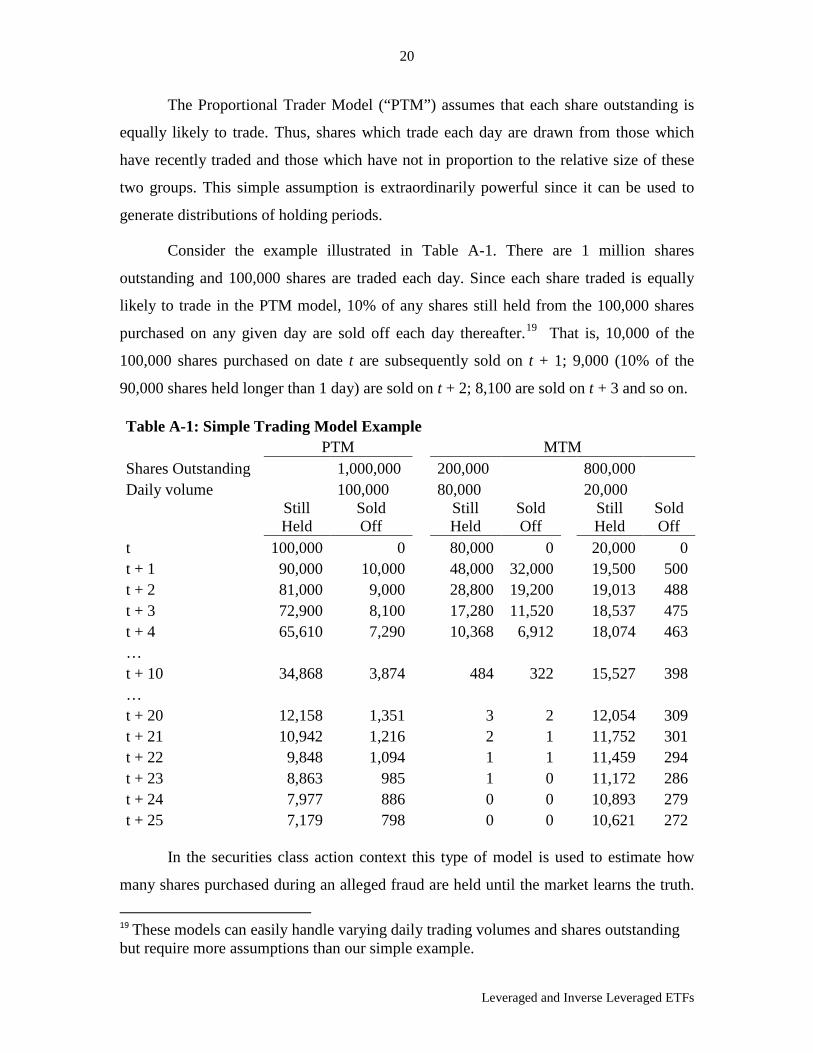
Consider the example illustrated in Table A-1. There are 1 million shares
outstanding and 100,000 shares are traded each day. Since each share traded is equally
likely to trade in the PTM model, 10% of any shares still held from the 100,000 shares
purchased on any given day are sold off each day thereafter.19
Table A-1: Simple Trading Model Example
That is, 10,000 of the
100,000 shares purchased on date t are subsequently sold on t + 1; 9,000 (10% of the
90,000 shares held longer than 1 day) are sold on t + 2; 8,100 are sold on t + 3 and so on.
PTM
MTM
Shares Outstanding
1,000,000
200,000
800,000 Daily volume
100,000
80,000
20,000
Still Held
Sold Off
Still Held
Sold Off
Still Held
Sold Off
t 100,000 0
80,000 0
20,000 0 t + 1 90,000 10,000
48,000 32,000
19,500 500
t + 2 81,000 9,000
28,800 19,200
19,013 488 t + 3 72,900 8,100
17,280 11,520
18,537 475
t + 4 65,610 7,290
10,368 6,912
18,074 463 …
t + 10 34,868 3,874
484 322
15,527 398 …
t + 20 12,158 1,351
3 2
12,054 309 t + 21 10,942 1,216
2 1
11,752 301
t + 22 9,848 1,094
1 1
11,459 294 t + 23 8,863 985
1 0
11,172 286
t + 24 7,977 886
0 0
10,893 279 t + 25 7,179 798
0 0
10,621 272
In the securities class action context this type of model is used to estimate how
many shares purchased during an alleged fraud are held until the market learns the truth. 19 These models can easily handle varying daily trading volumes and shares outstanding but require more assumptions than our simple example.
21
Leveraged and Inverse Leveraged ETFs
The same basic model provides a distribution of holding periods. In the simple example,
10% of the single day’s purchases we have illustrated are held for 1 day, 6.6% are held
for 5 days and 7.2% are held for more than 10 days. This same logic generates a
distribution of holding periods for each day’s purchases and these holding periods are
aggregated up to create a distribution of holding periods for all the observed trading days.
Table A-1 also presents an MTM analysis for our example assuming two types of
traders: a high activity type, which holds 200,000 shares and does 80% of the daily
trading, and a low activity type, which holds 800,000 shares and does 20% of the daily
trading. Consider, first, the active traders. They hold 200,000 shares and trade 80,000
shares each day. 40% of the active traders’ shares are sold each day so 32,000 of the
80,000 share bought on date t are sold off on t + 1; 19,200 (40% of the 48,000 shares held
longer than 1 day) are sold on t + 2; 11,520 are sold on t + 3 and so on.
The inactive traders’ very low trading frequency means that some of the 20,000
shares purchased by this group on date t will be held for a long time. In fact, we can see
in our example, although the MTM estimates a lot more shares than the PTM are held for
only a few days, the MTM also estimates a lot more shares than the PTM are held for a
long time.
Estimated holding periods allow us to estimate the investment shortfall for each
day’s purchases of an ETF using the ETF’s daily closing prices. These investment
shortfalls are then added up across all days to arrive at our estimate of the investment
shortfall for the ETF.
Related Documents