The Histochemical Journal 32: 139–150, 2000. © 2000 Kluwer Academic Publishers. Printed in the Netherlands. Levels, phosphorylation status and cellular localization of translational factor eIF2 in gastrointestinal carcinomas Mar´ ıa V.T. Lobo 1 , M. Elena Mart´ ın 3 , M. Isabel P´ erez 1 , F. Javier M. Alonso 1 , Clara Redondo 2 , M. Isabel ´ Alvarez 2 & Matilde Salinas 1,* 1 Departamento de Investigaci´ on, 2 Servicio de Anatom´ ıa Patol´ ogica, Hospital Ram ´ on y Cajal, 28034 Madrid, Spain 3 Departamento de Bioqu´ ımica y Biolog´ ıa Molecular, Universidad de Alcal´ a , Alcal ´ a de Henares, 28071 Madrid, Spain * Author for correspondence Received 25 May 1999 and in revised form 6 January 2000 Summary The level of expression and the phosphorylation status of the α subunit of initiation factor 2 (eIF2α) protein have been determined by comparing samples from human stomach, colon and sigma-rectum carcinomas with normal tissue from the same patients. The unphosphorylated and phosphorylated levels of cytoplasmic eIF2α, as well as the percentage of phosphorylated factor over the total, were significantly higher in stomach, colon and sigma-rectum tumours compared with normal tissue. The expression of this factor was also studied by using immunocytochemical methods, where redistribution towards the nucleus in tumour cells as compared with normal tissue was observed. Our results support a likely implication of eIF2α in gastrointestinal cancer. Introduction Increased protein synthesis is necessary for the transition of cells from quiescence to proliferation and there is now a grow- ing body of evidence that suggests links between the regula- tion of protein synthesis and the disruption of cell behaviour that typifies cancer (Clemens 1999). The dominant mecha- nisms in the control of global protein synthesis are the levels and the phosphorylation status of translational components, primary initiation and elongation factors (Pain 1996). Eukary- otic initiation factors 2 and 4E (eIF2 and eIF4E) are two of the translation initiation factors whose expression increases after mitogenic stimulation (Mao et al. 1992, Rosenwald et al. 1993). Overexpression and/or increased phosphorylation of eIF4E, now considered to be a proto-oncogene, leads to over- expression of certain proto-oncogenes, growth factors and other cell-cycle-related protein transcripts, such as NF-AT, ornithine decarboxylase, c-myc, ras, basic fibroblast growth factor, vascular permeability factor and cyclin D1 (Kevil et al. 1996, Rousseau et al. 1996, Rosenwald et al. 1999). Elevated levels of eIF4E factor have been observed in breast carcino- mas as well as in head and neck squamous cell cancers and non-Hodgkin’s lymphomas (Kerekatte et al. 1995, Graff et al. 1997, Nathan et al. 1997, Wang et al. 1999). Increased levels of eIF2α have been observed in ras, c-myc, v-src and v-abl transformed cells, suggesting that constitutive activation of the translational machinery may be a common mechanism by which various oncogenes exert their transforming func- tion (Rosenwald, 1996a,b). Up-regulation of eIF2α correlates with neoplastic transformation of mammary epithelial cells (Raught et al. 1996). Moreover, inhibition of eIF2α kinase transforms cells to a malignant phenotype (Koromilas et al. 1992). Whereas all these studies have mainly focused on the role of eIF2 and its overexpression in the mechanisms of cell trans- formation in vitro, the levels of eIF2α and its phosphorylation pattern in gastrointestinal carcinomas have not been studied. Moreover, eIF2α and eIF4E are located both in the cyto- plasm and the nucleus of different cell types (Lejbkowicz et al. 1992, DeGracia et al. 1997, Lobo et al. 1997), but pos- sible changes in the quantity or the subcellular distribution of these factors have yet to be evaluated in tumour cells. The aim of this study was to determine whether eIF2α distribu- tion, levels and/or phosphorylation status is altered in gastric and colorectal tumours, and whether or not these possible modifications can be considered as potential markers of gas- trointestinal cancer. Materials and methods Human samples We studied tissue samples from 21 patients (age 62 ± 2.4 years, 14 males and 7 females) diagnosed with carcinoma of the stomach (n = 8), colon (n = 5) and sigma-rectum (n = 8), treated with curative surgical resection at the Hospi- tal Ram ´ on y Cajal (see Table 1 for further details). All patients had a single primary tumour, and none of them had preoper- ative chemotherapy or radiation therapy. Tumour and normal adjacent tissue samples were obtained immediately after sur- gical resection (less than 1 h), with the ongoing approval of

Welcome message from author
This document is posted to help you gain knowledge. Please leave a comment to let me know what you think about it! Share it to your friends and learn new things together.
Transcript
The Histochemical Journal32: 139–150, 2000.© 2000Kluwer Academic Publishers. Printed in the Netherlands.
Levels, phosphorylation status and cellular localization of translationalfactor eIF2 in gastrointestinal carcinomas
Marıa V.T. Lobo1, M. Elena Martın3, M. Isabel Perez1, F. Javier M. Alonso1, Clara Redondo2,M. IsabelAlvarez2 & Matilde Salinas1,∗1Departamento de Investigaci´on, 2Servicio de Anatom´ıa Patologica, Hospital Ram´on y Cajal, 28034 Madrid, Spain3Departamento de Bioquımica y Biologıa Molecular, Universidad de Alcala , Alcala de Henares, 28071 Madrid, Spain
∗Author for correspondence
Received 25 May 1999 and in revised form 6 January 2000
Summary
The level of expression and the phosphorylation status of theα subunit of initiation factor 2 (eIF2α) protein have been determinedby comparing samples from human stomach, colon and sigma-rectum carcinomas with normal tissue from the same patients.The unphosphorylated and phosphorylated levels of cytoplasmic eIF2α, as well as the percentage of phosphorylated factor overthe total, were significantly higher in stomach, colon and sigma-rectum tumours compared with normal tissue. The expressionof this factor was also studied by using immunocytochemical methods, where redistribution towards the nucleus in tumourcells as compared with normal tissue was observed. Our results support a likely implication of eIF2α in gastrointestinal cancer.
Introduction
Increased protein synthesis is necessary for the transition ofcells from quiescence to proliferation and there is now a grow-ing body of evidence that suggests links between the regula-tion of protein synthesis and the disruption of cell behaviourthat typifies cancer (Clemens 1999). The dominant mecha-nisms in the control of global protein synthesis are the levelsand the phosphorylation status of translational components,primary initiation and elongation factors (Pain 1996). Eukary-otic initiation factors 2 and 4E (eIF2 and eIF4E) are two ofthe translation initiation factors whose expression increasesafter mitogenic stimulation (Maoet al. 1992, Rosenwaldet al.1993). Overexpression and/or increased phosphorylation ofeIF4E, now considered to be a proto-oncogene, leads to over-expression of certain proto-oncogenes, growth factors andother cell-cycle-related protein transcripts, such as NF-AT,ornithine decarboxylase, c-myc, ras, basic fibroblast growthfactor, vascular permeability factor and cyclin D1 (Kevilet al.1996, Rousseauet al. 1996, Rosenwaldet al. 1999). Elevatedlevels of eIF4E factor have been observed in breast carcino-mas as well as in head and neck squamous cell cancers andnon-Hodgkin’s lymphomas (Kerekatteet al. 1995, Graffet al.1997, Nathanet al. 1997, Wanget al. 1999). Increased levelsof eIF2α have been observed inras, c-myc, v-src andv-abltransformed cells, suggesting that constitutive activation ofthe translational machinery may be a common mechanismby which various oncogenes exert their transforming func-tion (Rosenwald, 1996a,b). Up-regulation of eIF2α correlateswith neoplastic transformation of mammary epithelial cells(Raughtet al. 1996). Moreover, inhibition of eIF2α kinase
transforms cells to a malignant phenotype (Koromilaset al.1992).
Whereas all these studies have mainly focused on the roleof eIF2 and its overexpression in the mechanisms of cell trans-formationin vitro, the levels of eIF2α and its phosphorylationpattern in gastrointestinal carcinomas have not been studied.Moreover, eIF2α and eIF4E are located both in the cyto-plasm and the nucleus of different cell types (Lejbkowiczet al. 1992, DeGraciaet al. 1997, Loboet al. 1997), but pos-sible changes in the quantity or the subcellular distributionof these factors have yet to be evaluated in tumour cells. Theaim of this study was to determine whether eIF2α distribu-tion, levels and/or phosphorylation status is altered in gastricand colorectal tumours, and whether or not these possiblemodifications can be considered as potential markers of gas-trointestinal cancer.
Materials and methods
Human samples
We studied tissue samples from 21 patients (age 62± 2.4years, 14 males and 7 females) diagnosed with carcinomaof the stomach (n = 8), colon (n = 5) and sigma-rectum(n = 8), treated with curative surgical resection at the Hospi-tal Ramon y Cajal (see Table 1 for further details). All patientshad a single primary tumour, and none of them had preoper-ative chemotherapy or radiation therapy. Tumour and normaladjacent tissue samples were obtained immediately after sur-gical resection (less than 1 h), with the ongoing approval of
140 M.V.T. Loboet al.
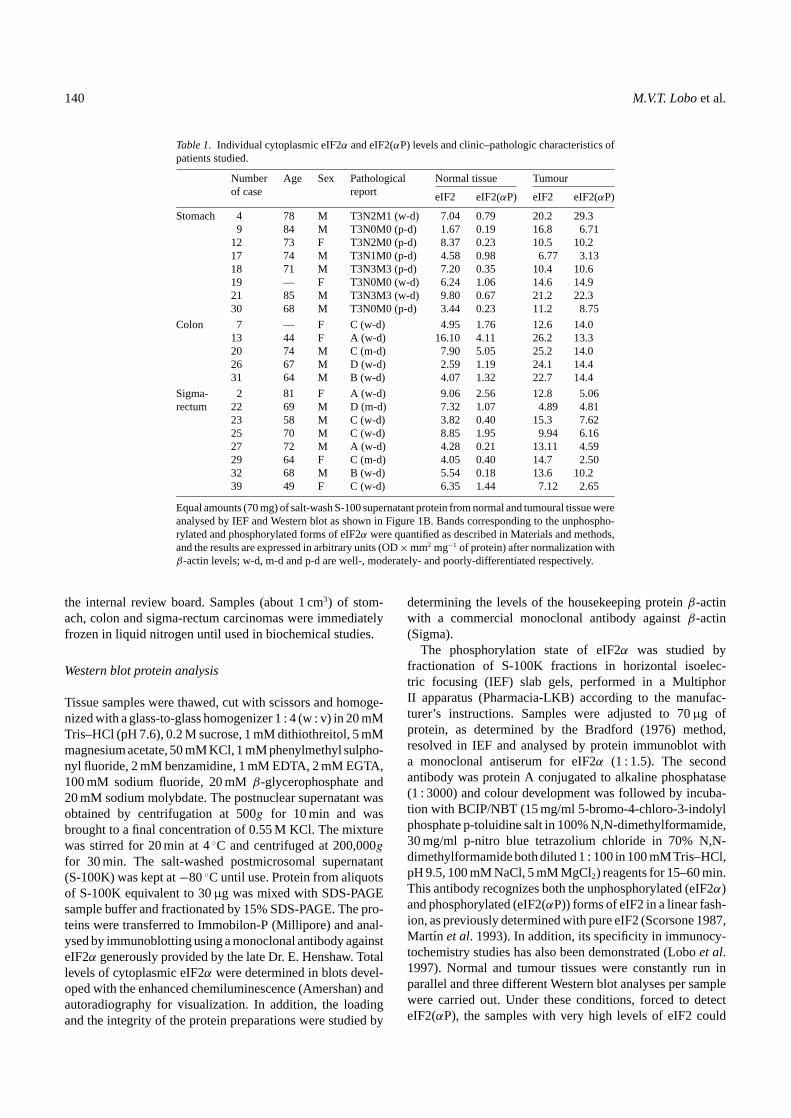
Table 1. Individual cytoplasmic eIF2α and eIF2(αP) levels and clinic–pathologic characteristics ofpatients studied.
Numberof case
Age Sex Pathologicalreport
Normal tissue Tumour
eIF2 eIF2(αP) eIF2 eIF2(αP)
Stomach 4 78 M T3N2M1 (w-d) 7.04 0.79 20.2 29.39 84 M T3N0M0 (p-d) 1.67 0.19 16.8 6.71
12 73 F T3N2M0 (p-d) 8.37 0.23 10.5 10.217 74 M T3N1M0 (p-d) 4.58 0.98 6.77 3.1318 71 M T3N3M3 (p-d) 7.20 0.35 10.4 10.619 — F T3N0M0 (w-d) 6.24 1.06 14.6 14.921 85 M T3N3M3 (w-d) 9.80 0.67 21.2 22.330 68 M T3N0M0 (p-d) 3.44 0.23 11.2 8.75
Colon 7 — F C (w-d) 4.95 1.76 12.6 14.013 44 F A (w-d) 16.10 4.11 26.2 13.320 74 M C (m-d) 7.90 5.05 25.2 14.026 67 M D (w-d) 2.59 1.19 24.1 14.431 64 M B (w-d) 4.07 1.32 22.7 14.4
Sigma- 2 81 F A (w-d) 9.06 2.56 12.8 5.06rectum 22 69 M D (m-d) 7.32 1.07 4.89 4.81
23 58 M C (w-d) 3.82 0.40 15.3 7.6225 70 M C (w-d) 8.85 1.95 9.94 6.1627 72 M A (w-d) 4.28 0.21 13.11 4.5929 64 F C (m-d) 4.05 0.40 14.7 2.5032 68 M B (w-d) 5.54 0.18 13.6 10.239 49 F C (w-d) 6.35 1.44 7.12 2.65
Equal amounts (70 mg) of salt-wash S-100 supernatant protein from normal and tumoural tissue wereanalysed by IEF and Western blot as shown in Figure 1B. Bands corresponding to the unphospho-rylated and phosphorylated forms of eIF2α were quantified as described in Materials and methods,and the results are expressed in arbitrary units (OD×mm2 mg−1 of protein) after normalization withβ-actin levels; w-d, m-d and p-d are well-, moderately- and poorly-differentiated respectively.
the internal review board. Samples (about 1 cm3) of stom-ach, colon and sigma-rectum carcinomas were immediatelyfrozen in liquid nitrogen until used in biochemical studies.
Western blot protein analysis
Tissue samples were thawed, cut with scissors and homoge-nized with a glass-to-glass homogenizer 1 : 4 (w : v) in 20 mMTris–HCl (pH 7.6), 0.2 M sucrose, 1 mM dithiothreitol, 5 mMmagnesium acetate, 50 mM KCl, 1 mM phenylmethyl sulpho-nyl fluoride, 2 mM benzamidine, 1 mM EDTA, 2 mM EGTA,100 mM sodium fluoride, 20 mMβ-glycerophosphate and20 mM sodium molybdate. The postnuclear supernatant wasobtained by centrifugation at 500g for 10 min and wasbrought to a final concentration of 0.55 M KCl. The mixturewas stirred for 20 min at 4◦C and centrifuged at 200,000gfor 30 min. The salt-washed postmicrosomal supernatant(S-100K) was kept at−80◦C until use. Protein from aliquotsof S-100K equivalent to 30µg was mixed with SDS-PAGEsample buffer and fractionated by 15% SDS-PAGE. The pro-teins were transferred to Immobilon-P (Millipore) and anal-ysed by immunoblotting using a monoclonal antibody againsteIF2α generously provided by the late Dr. E. Henshaw. Totallevels of cytoplasmic eIF2α were determined in blots devel-oped with the enhanced chemiluminescence (Amershan) andautoradiography for visualization. In addition, the loadingand the integrity of the protein preparations were studied by
determining the levels of the housekeeping proteinβ-actinwith a commercial monoclonal antibody againstβ-actin(Sigma).
The phosphorylation state of eIF2α was studied byfractionation of S-100K fractions in horizontal isoelec-tric focusing (IEF) slab gels, performed in a MultiphorII apparatus (Pharmacia-LKB) according to the manufac-turer’s instructions. Samples were adjusted to 70µg ofprotein, as determined by the Bradford (1976) method,resolved in IEF and analysed by protein immunoblot witha monoclonal antiserum for eIF2α (1 : 1.5). The secondantibody was protein A conjugated to alkaline phosphatase(1 : 3000) and colour development was followed by incuba-tion with BCIP/NBT (15 mg/ml 5-bromo-4-chloro-3-indolylphosphate p-toluidine salt in 100% N,N-dimethylformamide,30 mg/ml p-nitro blue tetrazolium chloride in 70% N,N-dimethylformamide both diluted 1 : 100 in 100 mM Tris–HCl,pH 9.5, 100 mM NaCl, 5 mM MgCl2) reagents for 15–60 min.This antibody recognizes both the unphosphorylated (eIF2α)and phosphorylated (eIF2(αP)) forms of eIF2 in a linear fash-ion, as previously determined with pure eIF2 (Scorsone 1987,Martın et al. 1993). In addition, its specificity in immunocy-tochemistry studies has also been demonstrated (Loboet al.1997). Normal and tumour tissues were constantly run inparallel and three different Western blot analyses per samplewere carried out. Under these conditions, forced to detecteIF2(αP), the samples with very high levels of eIF2 could
Eukaryotic initiation factor 2 in gastrointestinal carcinomas 141
be to some extent, underestimated, which would give evenhigher differences between normal and tumoural tissue thanreported. The stained membranes were scanned and quan-titated with an analyser equipped with a software packageRFLPrint (PDI, New York). The levels of eIF2α and eIF2(αP)obtained from IEF analysis were normalized against the levelof β-actin in each sample.
Light microscopy
Samples were fixed in 4% paraformaldehyde for 24 h andembedded in paraffin wax, following conventional meth-ods. Sections (5µm thick), mounted onto sylanized slides,were deparaffined, hydrated and incubated with trypsin (0.1%plus 0.1% CaCl2) in Tris-buffered saline (TBS) at pH 7.5,at 37◦C for 30 min. Endogenous peroxidase was inhibitedby using 3% H2O2 in H2O for 10 min, followed by 0.3%H2O2 in methanol for 20 min. Free aldehydes were reducedusing 0.4% sodium borohydride in TBS for 10 min. Non-specific binding sites were blocked using normal goat serum(NGS) plus 0.06% Triton X-100 for 30 min at room tem-perature. Sections were then incubated with the anti-eIF2α
antibody (1 : 100 in the same blocking solution) for 24 h at4 ◦C, washed in blocking solution and incubated with thesecond antibody, ready-to-use goat anti-mouse IgG (ZymedLabs, San Francisco, CA) for 30 min at room temperature.After washing in TBS, sections were incubated with per-oxidase conjugated to streptavidin (Zymed), and washed inTBS and Tris–HCl, pH 7.6. Peroxidase activity was detectedusing nickel nitrate-intensified 3-3′-diaminobenzidine (DAB)(11µl of 8% nickel nitrate solution added to 1 ml of 0.05%DAB–0.02% H2O2 in Tris–HCl, pH 7.6). After extensivewashing, sections were dehydrated, cleared in xylene andmounted without being counterstained. The specificity of theimmunohistochemical procedure was assessed by means ofdifferent controls performed: (a) omitting the primary anti-body, and (b) using non-immune serum instead of the primaryantibody. Alternatively, some sections were subjected to themicrowave antigen retrieval method after trypsin treatmentas described by Wanget al. (1999).
Electron microscopy
Additional tissue samples were fixed for 6 h at 4◦C in4% paraformaldehyde–0.5% glutaraldehyde in phosphate-buffered saline (PBS), pH 7.4, rinsed in PBS and postfixed for2 h at 4◦C in buffered 1% osmium tetroxide. Tissue blockswere partially dehydrated (in up to 80% ethanol) throughgraded ethanol series and embedded at 55◦C in Unicryl™
resin (British Biocell International, Cardiff, UK). Osmiumtetroxide was removed from the ultrathin sections, mountedon nickel grids, using 5% sodium metaperiodate for 5 minand washed in distilled-deionized water. Free aldehydes werereduced using 0.05 M sodium borohydride in TBS, pH 7.5,for 10 min. Controls to demonstrate the specificity of theimmunogold labelling and the immunolocalization of eIF2α
was performed as described in Loboet al. (1997). Anti-eIF2α
was used 1 : 100 and 15 nm gold-conjugated goat anti-mouseIgG (British Biocell Int., Cardiff, UK) was diluted up to 1 : 40;10–20 cell micrographs from each group of samples wereselected and analysed using the Image Pro-plus™ image anal-ysis software (Media Cybernetics, Silver Spring, MD, USA).Since mucous granules and empty resin were expected to beunlabelled, we used the gold particles observed over thosestructures to evaluate background. All data were expressedas the average of gold particles perµm2.
Results
Cytoplasmic eIF2α and eIF2(αP) levels in normal andtumoral tissues
The choice of gastrointestinal cancers, rather than otherhuman malignancies, to study eIF2α distribution was basedon sample availability. Large enough tumour and normal tis-sue samples from each patient were available prior to fix-ation for its histological examination in the Department ofPathology.
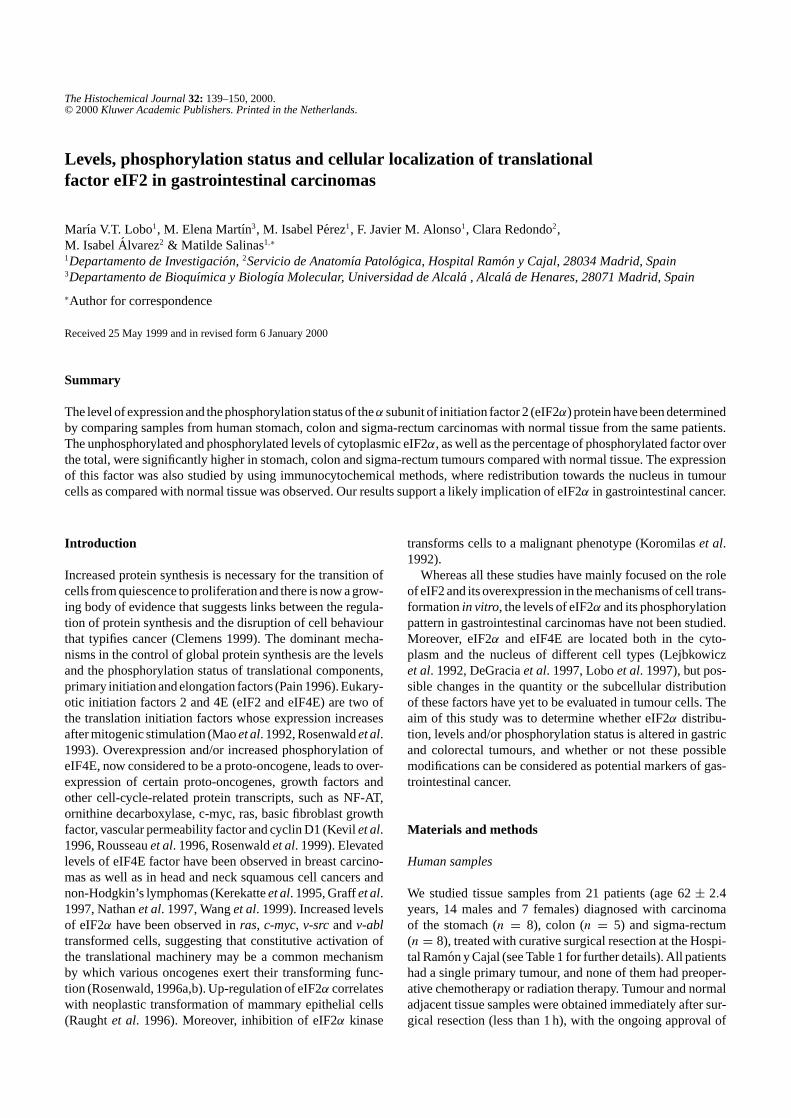
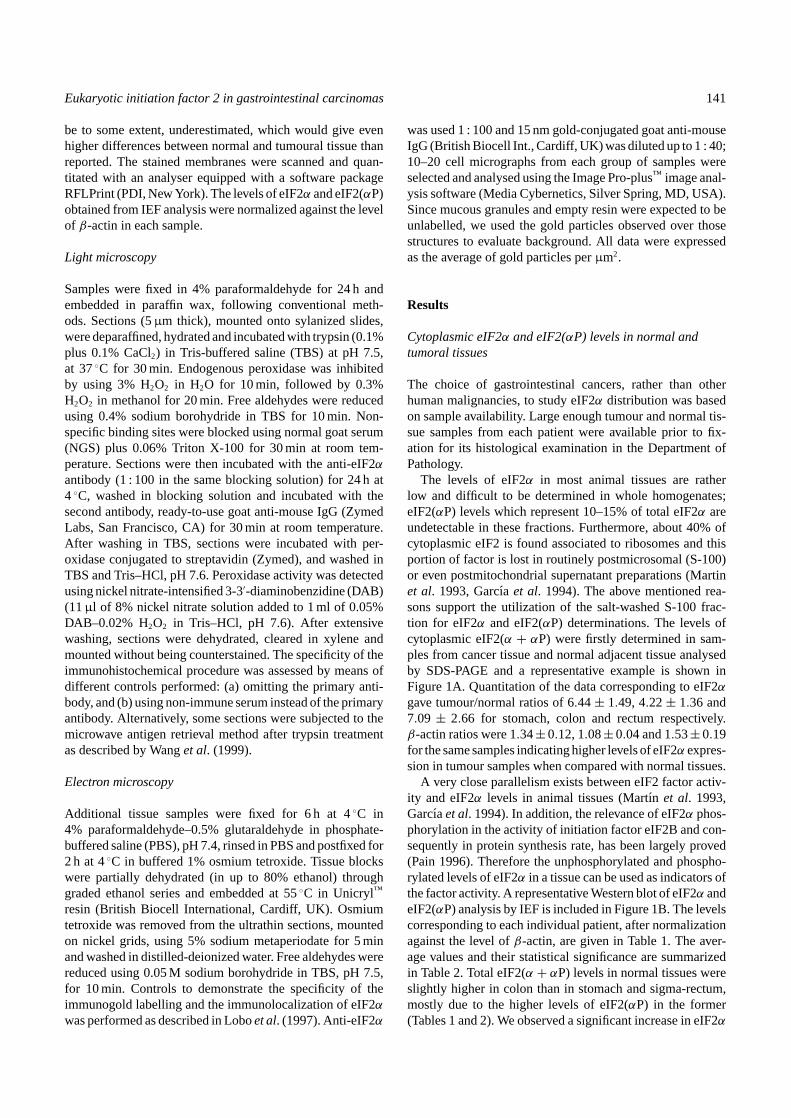
The levels of eIF2α in most animal tissues are ratherlow and difficult to be determined in whole homogenates;eIF2(αP) levels which represent 10–15% of total eIF2α areundetectable in these fractions. Furthermore, about 40% ofcytoplasmic eIF2 is found associated to ribosomes and thisportion of factor is lost in routinely postmicrosomal (S-100)or even postmitochondrial supernatant preparations (Martinet al. 1993, Garcıa et al. 1994). The above mentioned rea-sons support the utilization of the salt-washed S-100 frac-tion for eIF2α and eIF2(αP) determinations. The levels ofcytoplasmic eIF2(α + αP) were firstly determined in sam-ples from cancer tissue and normal adjacent tissue analysedby SDS-PAGE and a representative example is shown inFigure 1A. Quantitation of the data corresponding to eIF2α
gave tumour/normal ratios of 6.44± 1.49, 4.22± 1.36 and7.09 ± 2.66 for stomach, colon and rectum respectively.β-actin ratios were 1.34±0.12, 1.08±0.04 and 1.53±0.19for the same samples indicating higher levels of eIF2α expres-sion in tumour samples when compared with normal tissues.
A very close parallelism exists between eIF2 factor activ-ity and eIF2α levels in animal tissues (Martın et al. 1993,Garcıaet al. 1994). In addition, the relevance of eIF2α phos-phorylation in the activity of initiation factor eIF2B and con-sequently in protein synthesis rate, has been largely proved(Pain 1996). Therefore the unphosphorylated and phospho-rylated levels of eIF2α in a tissue can be used as indicators ofthe factor activity. A representative Western blot of eIF2α andeIF2(αP) analysis by IEF is included in Figure 1B. The levelscorresponding to each individual patient, after normalizationagainst the level ofβ-actin, are given in Table 1. The aver-age values and their statistical significance are summarizedin Table 2. Total eIF2(α + αP) levels in normal tissues wereslightly higher in colon than in stomach and sigma-rectum,mostly due to the higher levels of eIF2(αP) in the former(Tables 1 and 2). We observed a significant increase in eIF2α
142 M.V.T. Loboet al.
levels in tumours as compared to normal samples (2.3-, 3.1-and 1.6-fold for stomach, colon and sigma-rectum respec-tively). Moreover, a highly significant increase in eIF2(αP)levels in tumour samples was also observed (25-, 5.2- and 5.3-fold for stomach, colon and sigma rectum respectively). Thepercentage of eIF2(αP) over the total increased in tumourswith respect to normal tissues, this increase being highly
(A) SDS-PAGE
(B) IEF
Figure 1. Western blots showing total cytoplasmic levels (A) and phos-phorylation status of eIF2α (B), in stomach (12, 17, 18 and 21) colon(20, 22 and 26) and sigma-rectum (23, 27, 32 and 39) normal tissues andtumours. S-100K supernatants were prepared from normal and tumoursamples and equal amount of protein (30µg protein for 15% SDS-PAGEor 70µg for IEF) were analysed for protein immunoblot as describedin Materials and methods. (A) Blots were developed with the enhancedchemiluminescence (Amersham) and a representative autoradiographyis shown. (B) Representative blot developed with alkaline phosphatasereagents. Keys: numbers correspond to the individual cases as describedin Table 1. N, normal tissue; T, tumour; eIF2α and eIF2(αP), unphos-phorylated and phosphorylated forms of eIF2α; pI, isoelectric point.
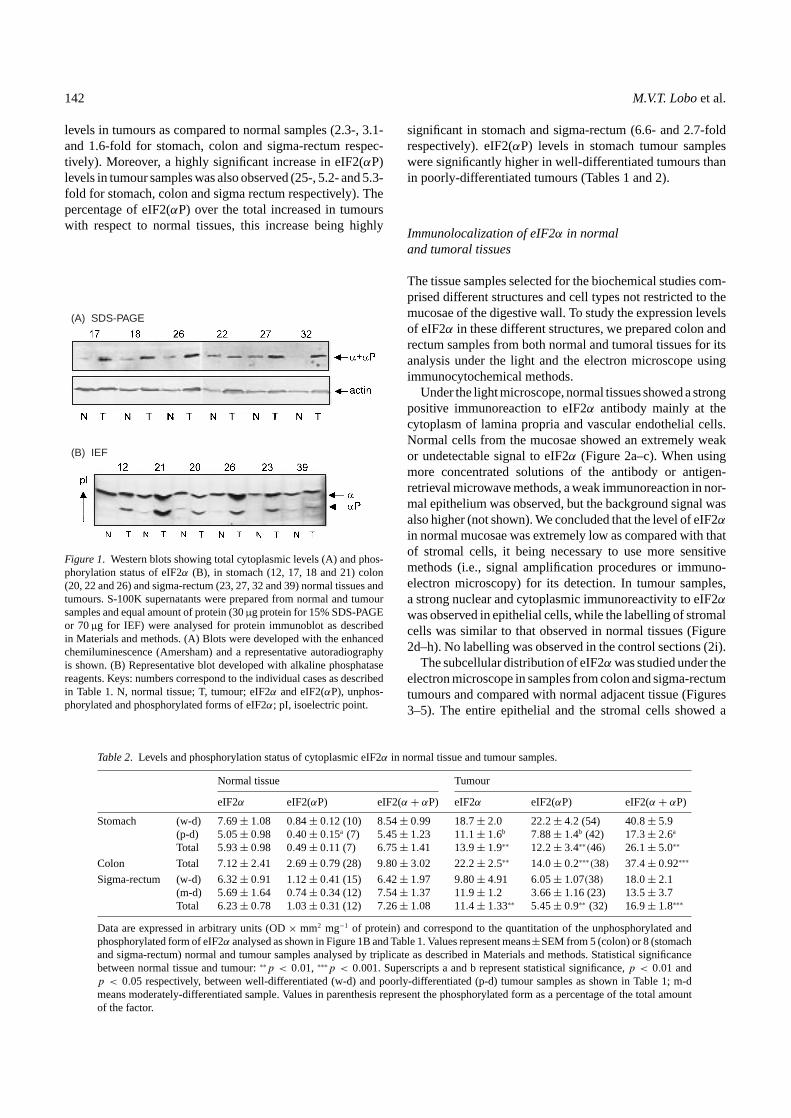
Table 2. Levels and phosphorylation status of cytoplasmic eIF2α in normal tissue and tumour samples.
Normal tissue Tumour
eIF2α eIF2(αP) eIF2(α + αP) eIF2α eIF2(αP) eIF2(α + αP)
Stomach (w-d) 7.69± 1.08 0.84± 0.12 (10) 8.54± 0.99 18.7± 2.0 22.2± 4.2 (54) 40.8± 5.9(p-d) 5.05± 0.98 0.40± 0.15a (7) 5.45± 1.23 11.1± 1.6b 7.88± 1.4b (42) 17.3± 2.6a
Total 5.93± 0.98 0.49± 0.11 (7) 6.75± 1.41 13.9± 1.9∗∗ 12.2± 3.4∗∗(46) 26.1± 5.0∗∗
Colon Total 7.12± 2.41 2.69± 0.79 (28) 9.80± 3.02 22.2± 2.5∗∗ 14.0± 0.2∗∗∗(38) 37.4± 0.92∗∗∗
Sigma-rectum (w-d) 6.32± 0.91 1.12± 0.41 (15) 6.42± 1.97 9.80± 4.91 6.05± 1.07(38) 18.0± 2.1(m-d) 5.69± 1.64 0.74± 0.34 (12) 7.54± 1.37 11.9± 1.2 3.66± 1.16 (23) 13.5± 3.7Total 6.23± 0.78 1.03± 0.31 (12) 7.26± 1.08 11.4± 1.33∗∗ 5.45± 0.9∗∗ (32) 16.9± 1.8∗∗∗
Data are expressed in arbitrary units (OD× mm2 mg−1 of protein) and correspond to the quantitation of the unphosphorylated andphosphorylated form of eIF2α analysed as shown in Figure 1B and Table 1. Values represent means±SEM from 5 (colon) or 8 (stomachand sigma-rectum) normal and tumour samples analysed by triplicate as described in Materials and methods. Statistical significancebetween normal tissue and tumour:∗∗p < 0.01, ∗∗∗p < 0.001. Superscripts a and b represent statistical significance,p < 0.01 andp < 0.05 respectively, between well-differentiated (w-d) and poorly-differentiated (p-d) tumour samples as shown in Table 1; m-dmeans moderately-differentiated sample. Values in parenthesis represent the phosphorylated form as a percentage of the total amountof the factor.
significant in stomach and sigma-rectum (6.6- and 2.7-foldrespectively). eIF2(αP) levels in stomach tumour sampleswere significantly higher in well-differentiated tumours thanin poorly-differentiated tumours (Tables 1 and 2).
Immunolocalization of eIF2α in normaland tumoral tissues
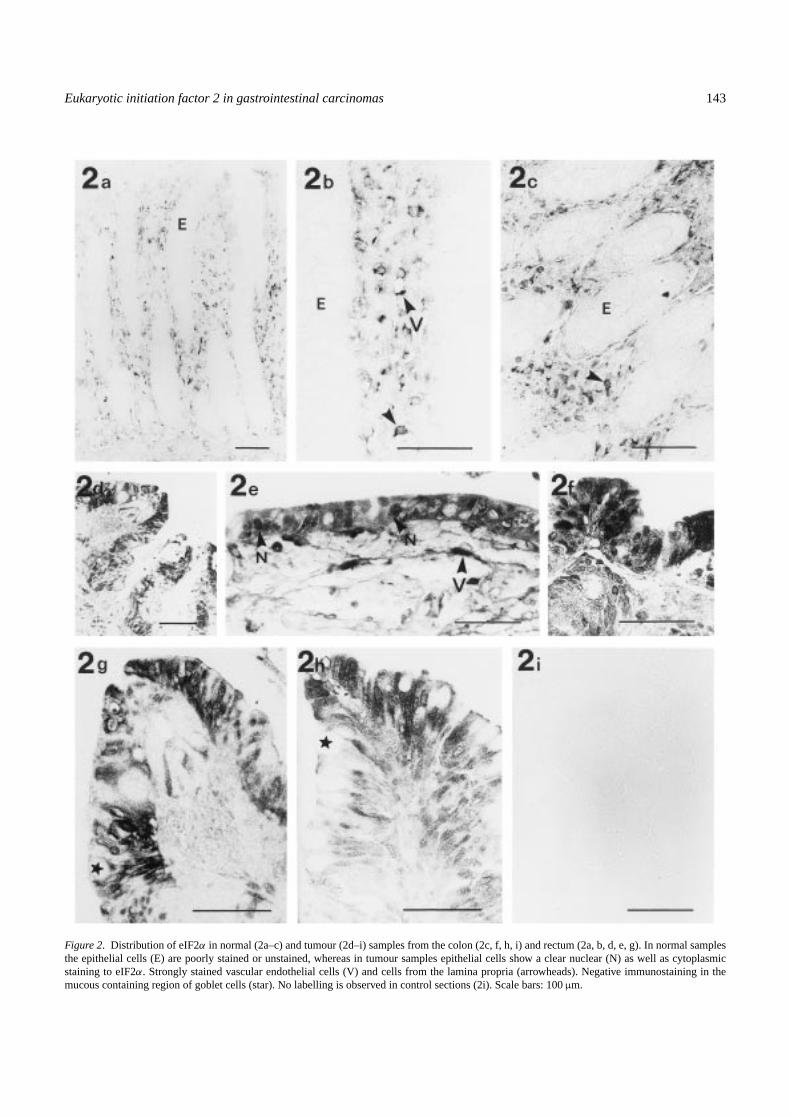
The tissue samples selected for the biochemical studies com-prised different structures and cell types not restricted to themucosae of the digestive wall. To study the expression levelsof eIF2α in these different structures, we prepared colon andrectum samples from both normal and tumoral tissues for itsanalysis under the light and the electron microscope usingimmunocytochemical methods.
Under the light microscope, normal tissues showed a strongpositive immunoreaction to eIF2α antibody mainly at thecytoplasm of lamina propria and vascular endothelial cells.Normal cells from the mucosae showed an extremely weakor undetectable signal to eIF2α (Figure 2a–c). When usingmore concentrated solutions of the antibody or antigen-retrieval microwave methods, a weak immunoreaction in nor-mal epithelium was observed, but the background signal wasalso higher (not shown). We concluded that the level of eIF2α
in normal mucosae was extremely low as compared with thatof stromal cells, it being necessary to use more sensitivemethods (i.e., signal amplification procedures or immuno-electron microscopy) for its detection. In tumour samples,a strong nuclear and cytoplasmic immunoreactivity to eIF2α
was observed in epithelial cells, while the labelling of stromalcells was similar to that observed in normal tissues (Figure2d–h). No labelling was observed in the control sections (2i).
The subcellular distribution of eIF2αwas studied under theelectron microscope in samples from colon and sigma-rectumtumours and compared with normal adjacent tissue (Figures3–5). The entire epithelial and the stromal cells showed a
Eukaryotic initiation factor 2 in gastrointestinal carcinomas 143
Figure 2. Distribution of eIF2α in normal (2a–c) and tumour (2d–i) samples from the colon (2c, f, h, i) and rectum (2a, b, d, e, g). In normal samplesthe epithelial cells (E) are poorly stained or unstained, whereas in tumour samples epithelial cells show a clear nuclear (N) as well as cytoplasmicstaining to eIF2α. Strongly stained vascular endothelial cells (V) and cells from the lamina propria (arrowheads). Negative immunostaining in themucous containing region of goblet cells (star). No labelling is observed in control sections (2i). Scale bars: 100µm.
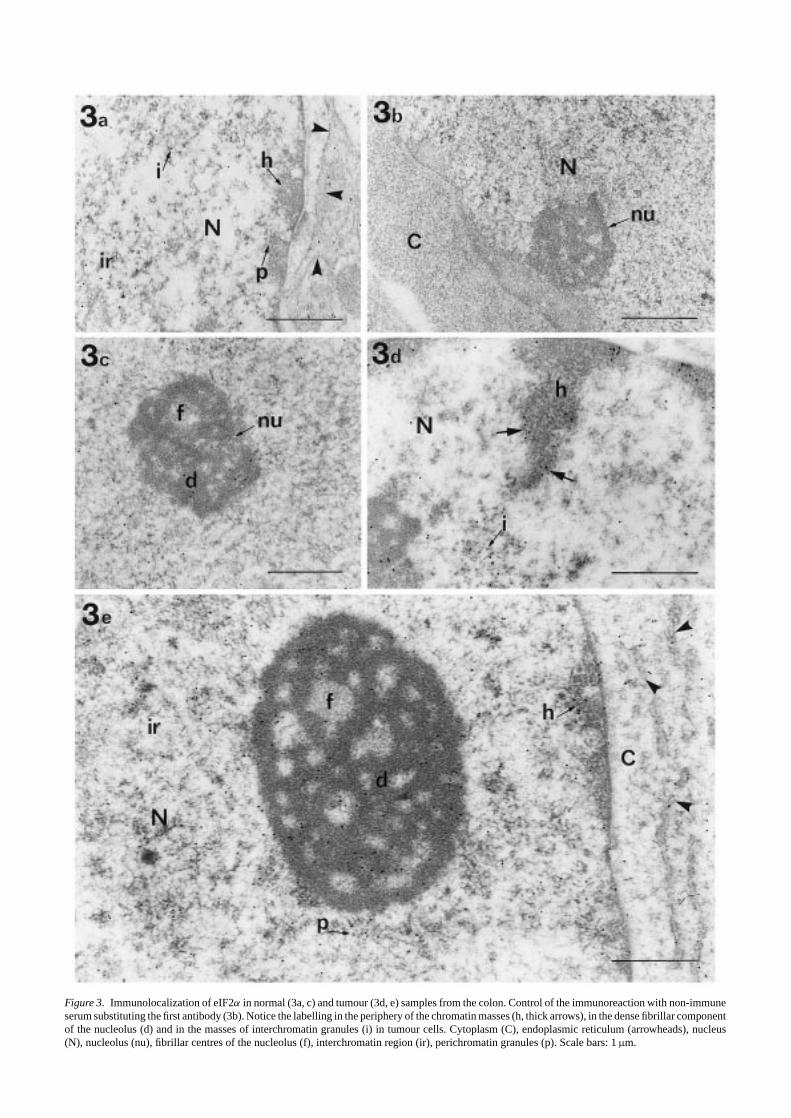
Figure 3. Immunolocalization of eIF2α in normal (3a, c) and tumour (3d, e) samples from the colon. Control of the immunoreaction with non-immuneserum substituting the first antibody (3b). Notice the labelling in the periphery of the chromatin masses (h, thick arrows), in the dense fibrillar componentof the nucleolus (d) and in the masses of interchromatin granules (i) in tumour cells. Cytoplasm (C), endoplasmic reticulum (arrowheads), nucleus(N), nucleolus (nu), fibrillar centres of the nucleolus (f), interchromatin region (ir), perichromatin granules (p). Scale bars: 1µm.
Eukaryotic initiation factor 2 in gastrointestinal carcinomas 145
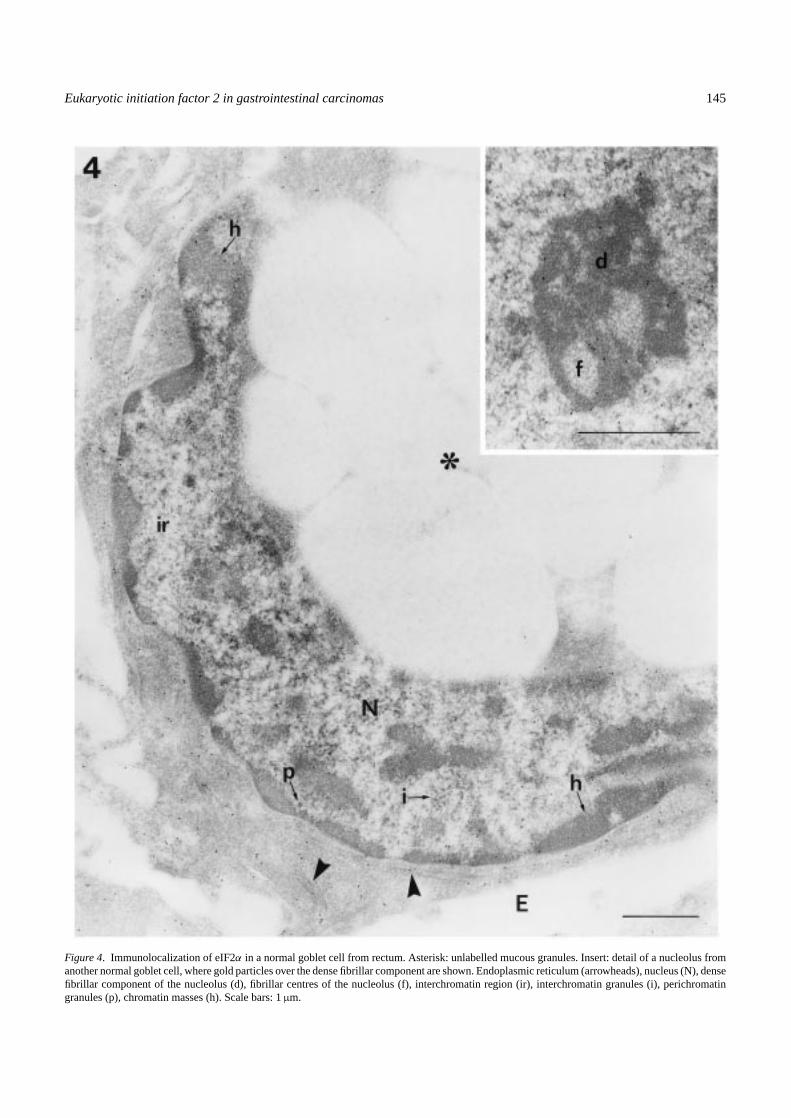
Figure 4. Immunolocalization of eIF2α in a normal goblet cell from rectum. Asterisk: unlabelled mucous granules. Insert: detail of a nucleolus fromanother normal goblet cell, where gold particles over the dense fibrillar component are shown. Endoplasmic reticulum (arrowheads), nucleus (N), densefibrillar component of the nucleolus (d), fibrillar centres of the nucleolus (f), interchromatin region (ir), interchromatin granules (i), perichromatingranules (p), chromatin masses (h). Scale bars: 1µm.
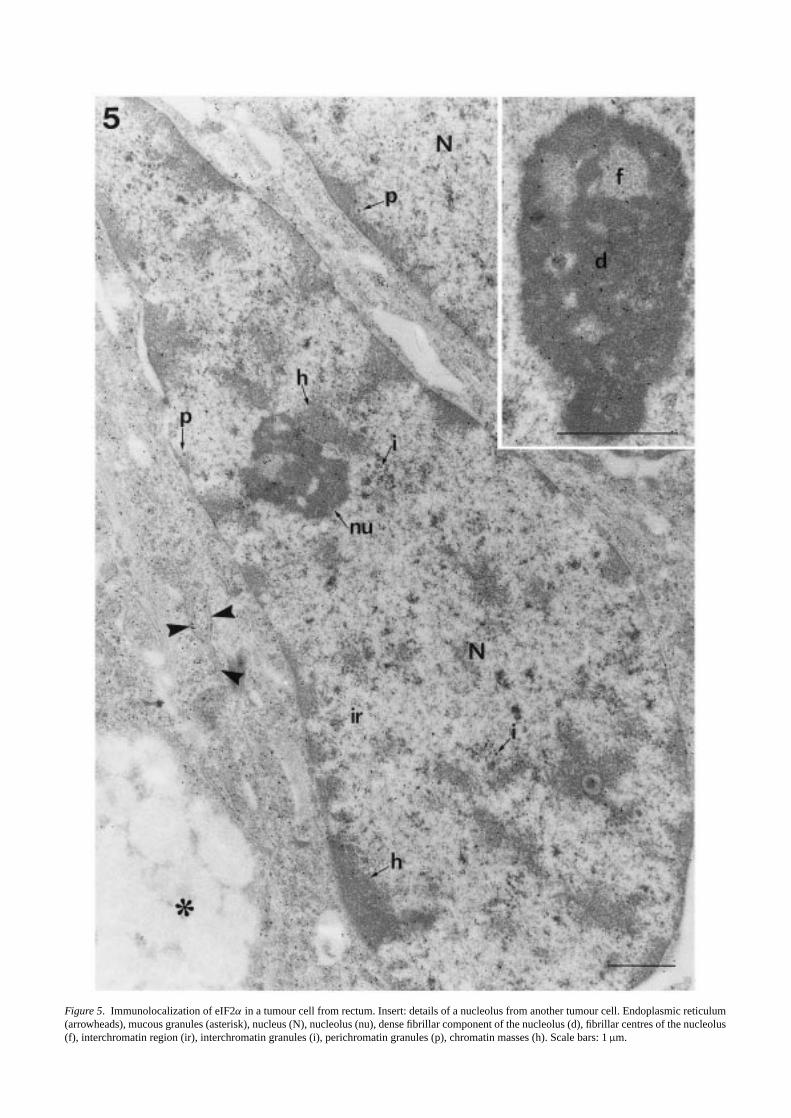
Figure 5. Immunolocalization of eIF2α in a tumour cell from rectum. Insert: details of a nucleolus from another tumour cell. Endoplasmic reticulum(arrowheads), mucous granules (asterisk), nucleus (N), nucleolus (nu), dense fibrillar component of the nucleolus (d), fibrillar centres of the nucleolus(f), interchromatin region (ir), interchromatin granules (i), perichromatin granules (p), chromatin masses (h). Scale bars: 1µm.
Eukaryotic initiation factor 2 in gastrointestinal carcinomas 147
positive immunoreaction to eIF2α both in the cytoplasm andthe nucleus. It is important to note that the general patternof eIF2α distribution was essentially the same for all theobserved cells in normal samples, being nuclear eIF2α reac-tivity not more than 25% of the total amount (not shown).These data are in agreement with our previous studies in othercell types, where eIF2α was detected for the first time in thenucleus in a concentration around 20% of the total amount inthe cell (Loboet al. 1997). Controls to demonstrate the speci-ficity of the immunogold procedure showed no or extremelyweak labelling (Figure 3b). The goblet cells of the medialpart of the crypts were selected for this study, since they areconsidered to be the most representative cell among those ofthe normal epithelium of colon and rectum.
The intensity of the immunoreaction to eIF2α was higherboth in the cytoplasm and the nucleus of epithelial tumourcells (Figures 3d and 5) than in normal tissue (Figures 3a and4). Differences in the distribution of gold particles withinthe different cell structures, mainly at the cell nucleus, wereobserved. In the cytoplasm of goblet normal cells, the num-ber of gold particles in the mucous granules was extremelylow, being similar to the background over the empty resin(Figure 4). As expected, a positive immunoreaction wasobserved in ribosome-enriched areas, the gold particles beingassociated with both free and membrane-bound ribosomes(Figures 3a and 4). In the nucleus (Figures 3a and 4), a pos-itive immunoreaction to eIF2α was observed in both nucle-olar and extranucleolar areas. In the nucleolus, some goldparticles were located in the dense fibrillar component. Inthe extranucleolar areas, gold particles were located in theinterchromatin space. The staining was weak or absent inthe periphery of the chromatin masses and perichromatin andinterchromatin granules appeared unlabelled. The distribu-tion of eIF2α in the cytoplasm of tumour cells was similarto that of the normal cells, the gold particles being associ-ated with ribosome-enriched areas (Figures 3e and 5). In thecell nucleus (Figures 3d and 5), gold particles were observedin the dense fibrillar component of the nucleolus and in theinterchromatin space. In addition, a positive immunoreac-tion was observed in the periphery of the condensed chro-matin masses, and gold particles were located in associationwith clusters of interchromatin granules. As seen in controls,perichromatin granules remained unlabelled. Figure 6 showsthe distribution pattern of eIF2α in stromal cells from normalsamples (Figure 6a,c,d) that is similar to that observed in nor-mal epithelial cells. No apparent increases in the intensity ofthe immunoreaction were observed in tumour stromal cells(Figure 6b,e).
To analyse a possible redistribution of eIF2α between thenucleus and the cytoplasm of tumour cells, semithin (1µm)sections were used. The average area of the goblet cells perplane of section, and the ratio nucleolus/nucleus/cytoplasmincluding mucous granules were determined both in nor-mal and tumour samples. The results of this morphometricanalysis were as follows: Normal tissue: 84% cytoplasm,14.6% nucleus and 1.4% nucleolus for colon cells; 89%cytoplasm, 10% nucleus and 1% nucleolus for sigma-rectum
cells. Tumours: 55.5% cytoplasm, 39.5% nucleus and 5%nucleolus for colon cells; 52% cytoplasm, 43.1% nucleusand 4.9% nucleolus for sigma-rectum. The data obtained fornormal tissues were consistent with that previously reportedby Tipoe et al. (1992). Gold particles in electron micro-graphs from immunostained normal and tumour sampleswere counted, and the amount of gold particles perµm2
was calculated after correction with the values of the sur-face per plane of section previously determined. Tumour cellslocated deeply in the lamina propria of the mucosa wereanalysed in colon and sigma-rectum. In addition, more dif-ferentiated tumour cells from sigma-rectum located in theepithelium layer of the mucosa were studied. The observedcytoplasm/nucleus/nucleolus ratios indicate a redistributionof eIF2 towards the cell nucleus. Interestingly, this distribu-tion seems to depend on the localization of the tumour cellwithin the layer of the colorectal wall. Less differentiatedtumour cells, located in the lamina propria of the mucosa, outfrom the epithelium layer, presented higher levels of nucleareIF2α than more differentiated tumour cells located in theepithelium of the mucosa, where basal lamina is well pre-served (Figure 7).
Discussion
The present study shows that the level of eIF2α increases instomach, colon and sigma-rectum carcinomas. The increasedeIF2α levels are attributable to epithelial tumour cells andnot to stromal cells as supported by our observations underthe light microscope. The overexpression of both eIF2α
and eIF2(αP) can already be detected in well-differentiatedtumours, as exemplified by case 13, a patient with coloncarcinoma (Duke’s stage A), or case 27, a patient withan early intramucosal sigma-rectum carcinoma found inci-dentally (Duke’s stage A). Both patients followed a veryfavourable clinical course. Therefore, eIF2(α+αP) appears tobe an early marker for gastrointestinal malignancy. To estab-lish the possible utility of the factor as prognostic marker, wehave tried to correlate factor levels or their phosphorylationstatus with some clinical and pathological parameters knownand evaluated, including age, sex, histological differentiation,TNM stage, Duke’s stage and survival (studied from 1994 till1997). We did not find a clear correlation between prognosis,on the one hand, and eIF2(α + αP) levels on the other hand.
A clear increase in eIF2(αP) levels, as well as an increase inthe percentage of eIF2(αP) was found in tumour cells fromthe three different tumour locations studied. This result issurprising, since as a rule in higher eukaryotes, the phospho-rylation of eIF2α under several stress conditions results indecreased overall shut-down of protein synthesis, and tumourcells in general have higher protein synthetic rates than theirnormal counterparts. Down-regulation of protein synthesis byeIF2(αP) depends on the levels of initiation factor 2B (Pain1996), higher eIF2B levels would counteract the increasedpercentage of eIF2(αP) in tumours, but changes in eIF2Blevels in tumour tissues or transformed cells have not beenreported so far.
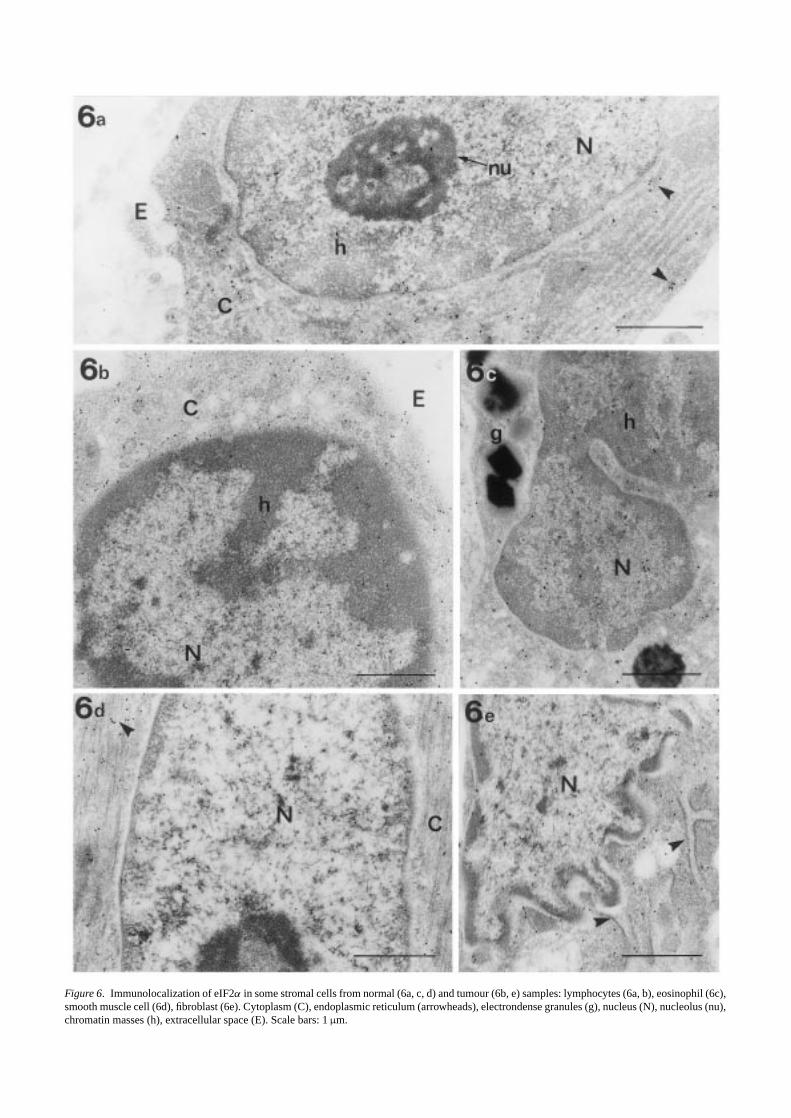
Figure 6. Immunolocalization of eIF2α in some stromal cells from normal (6a, c, d) and tumour (6b, e) samples: lymphocytes (6a, b), eosinophil (6c),smooth muscle cell (6d), fibroblast (6e). Cytoplasm (C), endoplasmic reticulum (arrowheads), electrondense granules (g), nucleus (N), nucleolus (nu),chromatin masses (h), extracellular space (E). Scale bars: 1µm.

Eukaryotic initiation factor 2 in gastrointestinal carcinomas 149
Figure 7. Subcellular distribution of eIF2α as determined by elec-tron microscope. Gold particles in 10–20 electron cell micrographs ofimmunostained samples from colon and sigma-rectum were counted.The total amount of gold particles perµm2 was calculated after correc-tion with the values of the cell surface per plane of section as describedin Materials and methods. eIF2α values were, 3.30± 0.17 (normal) and4.88± 0.28 (lamina propria tumour cells) for colon; 4.38± 0.26 (nor-mal) and 18.68± 1.41 (epithelium tumour cells) or 16.4± 1.7 (laminapropria tumour cells) for sigma-rectum. Data in the figure represent thepercentage of gold particles over the above given total values, being thevariability from cell to cell within cytoplasmic and nuclear levels lowerthan 10%. Similar results were obtained from tissue samples of two dif-ferent patients studied. N, normal; T(E), epithelium tumour cells. T(LP),lamina propria tumour cells.
The partial phosphorylation of eIF2α produced in responseto amino acid deprivation has been shown to cause a mod-est reduction in global protein synthesis, leading to a dra-matic and selective translation of GCN4 mRNA in yeast(Hinnenbusch 1996). In addition, methionine deprivationinduces an increased efficiency of c-myc non-AUG initia-tion, before any change in protein synthesis, thus support-ing the idea that eIF2α phosphorylation could be involved instart codon selection (Hann 1994). Interestingly, the small yetgrowing number of cellular eukaryotic mRNAs that initiatetranslation at a non-AUG, as well as at a downstream AUG,encode proteins with growth-regulatory properties, such asproto-oncogenes (Willis 1999). It has been described thathigher levels of eIF2α (without determining its phosphory-lation status) in mammary tumours compared with normaland hyperplastic tissues correlate with the expression of theCCATT/enhancer-binding proteinβ and the progression ofmammary epithelial cells from a hyperplastic to a neoplasticphenotype (Raughtet al. 1996).
Interestingly our data show that more aggressive (poorly-differentiated) stomach tumours present lower levels ofeIF2(αP) than well-differentiated tumours. A loss of theinterferon-inducible double-stranded RNA-activated kinase(PKR) activity, the eIF2α kinase which it has been sug-gested may function as a suppressor of cell proliferation andtumorigenesis (Koromilaset al. 1992), could be responsi-ble for the lower levels of eIF2(αP) in less-differentiatedtumours. Down-regulation of PKR activity has been observedin breast carcinoma cells (Savinovaet al. 1999). Consistentlywith our data, Singet al. (1995), looking at the levels ofPKR in human colonic adenocarcinomas from 80 patients,find out increased PKR levels in the majority of tumourswith increased cellular differentiation while those tissueswith decreased PKR, were, in general, less differentiated. Wecould make the point that in the more highly-differentiatedtumours, increased phosphorylation of eIF2αmay represent ahomeostatic response to compensate for the increased eIF2α
levels, with the compensatory mechanism lost in the high-grade/poorly-differentiated/highly-aggressive tumours. Ourstudy must be expanded by the inclusion of further biochem-istry and immunohistochemistry data regarding the degree ofcell differentiation and tumour stage to fully prove whetheror not the percentage of eIF2(αP) in malignant cells is relatedto the biologic aggressiveness of the tumour.
We have observed a redistribution of eIF2α in tumour cells,with changes in the cytoplasm/nucleus/nucleolus ratio. Theseresults have been observed only at high resolution, since bio-chemistry studies or light microscopy fail in detecting trust-worthy eIF2α levels in normal tissues. The increase in thepercentage of eIF2α located in the nucleus and nucleolusof malignant cells may suggest that this factor could play arole in the control of protein synthesis at the nuclear level.Very recent data have identified eIF2 as one of the polypep-tides that interact with the DNA-dependent protein kinase,the kinase involved in DNA double-strand break repair (Tinget al. 1998). The increased immunoreactivity to eIF2α in thedense fibrillar component of the nucleolus resembles PKRdistribution, recently described at the ultrastructural level(Besseet al. 1999). Both results could suggest a role for eIF2α
and PKR in transcriptional regulatory events that might notnecessarily be related to the mechanism of inhibition of pro-tein synthesis. It will be of great interest to know whetherthe phosphorylation state of eIF2α in the very different envi-ronment of the nucleus is the same as for the cytoplasm;antibodies specifically recognizing eIF2(αP) would help tosolve this problem.
In conclusion, our study demonstrates that the levels ofeIF2α are increased in tumours arising from the stomach,colon and sigma-rectum, and significant changes can beobserved in their phosphorylation pattern and subcellular dis-tribution. These results support a role for eIF2α in the tran-scriptional and post-transcriptional pathways involved in thedevelopment of gastrointestinal carcinomas. An increasedexpression of eIF2α and eIF2(αP) in human gastrointesti-nal cancer can not only promote a net increase in globalprotein synthesis, but could also be involved in increasing
150 M.V.T. Loboet al.
the efficiency in the translation of proteins implicated intumorigenesis. In addition, we believe that the extension ofthese studies to known premalignant lesions, such as sometypes of adenomas, will help to establish the role of eIF2α intumorigenesis and tumour progression.
Acknowledgements
This work has been supported by grants from FIS (97/2114)and DGES (PM97-0071-CO2). The two first authors haveequally participated in this work and are recipient of post-doctoral fellowships from the Comunidad de Madrid. Theauthors want to thank the late Dr. Henshaw for providing theeIF2α antibody and Joan Chafer for his editorial assistance.In addition we are extremely grateful to surgeons and nursesof the General Surgery Service at the Hospital Ramon y Cajal,for their invaluable help in supplying the tissue samples.
References cited
Besse S, Rebouillat D, Marie I, Dutilleul PD, Hovanessian AG (1998)Ultrastructural localisation of interferon-inducible double-strandedRNA-activated enzymes in human cells.Exp Cell Res239: 379–392.
Bradford MM (1976) A rapid and sensitive method for the quantificationof microgram quantities of protein utilizing the principle of protein–dye binding.Anal Biochem72: 248–254.
Clemens MJ (1999) Translational normal: the cancer connection.Int JBiochem Cell B31: 1–23.
DeGracia DJ, Sullivan JM, Neumar RW, Alousi SS, Hikade KR, PittmanJE, White BC, Rafols JA, Krause GS (1997) Effect of brain ischemiaand reperfusion on the localization of phosphorylated eukaryotic ini-tiation factor 2α. J Cereb Blood Flow Metab17: 1291–1302.
Garcıa A, Martın ME, Alcazar A, Fando JL, Salinas M (1994) Proteinsynthesis in the developing rat liver: participation of initiation factorseIF-2 and eIF-2B.Hepatology20: 706–713.
Graff JR, De Benedetti A, Olson JW, Tamez P, Casero Jr RA, ZimmerSG (1997) Translation of ODC mRNA and polyamine transport aresuppressed inras-transformed CREF cells by depleting translationinitiation factor 4E.Biochem Biophys Res Commun240: 15–20.
Hann SR (1994) Regulation and function of non-AUG-initiated proto-oncogenes.Biochimie76: 880–886.
Hinnenbusch AG (1996) Translational normal of GCN4: gene-specificregulation by phosphorylation of eIF2. In: Hershey JWB, MathewsMB, Sonenberg N eds.Translational Normal. Plainview, NY: ColdSpring Harbor, pp. 199–244.
Kerekatte V, Smiley K, Hu B, Smith A, Gelder F, De Benedetti A (1995)The proto-oncogene/translation factor eIF4E: a survey of its expressionin breast carcinomas.Int J Cancer64: 27–31.
Kevil CG, De Benedetti A, Payne DK, Coe II, Laroux FS, AlexanderJS (1996) Translational regulation of vascular permeability factor byeukaryotic initiation factor 4E: implications for tumor angiogenesis.Int J Cancer65: 785–790.
Koromilas AE, Roy S, Barber GN, Katze MG, Sonenberg N (1992)Malignant transformation by mutant of the IFN-inducible dsRNA-dependent protein kinase.Science257: 1685–1689.
Lejbkowicz F, Goyer C, Darveau A, Neron S, Lemieux R, SonenbergN (1992) A fraction of the mRNA 5′ cap-binding protein, eukaryoticinitiation factor 4E, localizes to the nucleus.Proc Natl Acad Sci USA89: 9612–9616.
Lobo MVT, Alonso FJM, Rodrıguez S, Alcazar A, Martın E, Munoz F,Santander RG, Salinas M, Fando JL (1997) Localization of eukaryoticinitiation factor 2 in neuron primary cultures and established cell lines.Histochem J29: 453–468.
Mao X, Green JM, Safer B, Lindsten T, Frederickson RM, Miyamoto S,Sonenberg N, Thompson CB (1992) Regulation of translation initiationfactor gene expression during human T cell activation.J Biol Chem267: 20444–20450.
Martın ME, Alcazar A, Fando JL, Garcıa AM, Salinas M (1993) Trans-lational initiation factor eIF2 subcellular levels and phosphorylationstatus in the developing rat brain.Neurosci Lett156: 109–112.
Nathan CAO, Liu I, Li BD, Abreo FW, Nandy Y, De Benedetti A (1997)Detection of the proto-oncogene eIF4E in surgical margins may predictrecurrence in head and neck cancer.Oncogene15: 579–584.
Pain VM (1996) Initiation of protein synthesis in eukaryotic cells.Eur JBiochem236: 747–771.
Raught B, Gingras A-C, James A, Medina D, Sonenberg N, Rosen JM(1996) Expression of a translationally regulated, dominant-negativeCCAAT/enhancer-binding proteinβ isoform and up-regulation of theeukaryotic translation factor 2α are correlated with neoplastic trans-formation of mammary epithelial cells.Cancer Res56: 4382–4386.
Rosenwald IB, Rhoads DB, Callanan LD, Isselbacher KJ, Schmidt EV(1993) Increased expression of eukaryotic translation initiation factorseIF4E and eIF2α in response to growth induction by c-myc.Proc NatlAcad Sci USA90: 6175–6178.
Rosenwald IB (1996a) Upregulated expression of the genes encodingtranslation initiation factors eIF4E and eIF2α in transformed cells.Cancer Lett102: 113–123.
Rosenwald IB (1996b) Deregulation of protein synthesis as a mechanismof neoplastic transformation.BioEssays18: 243–250.
Rosenwald IB, Chen JJ, Wang S, Savas L, London IM, Pullman J (1999)Up regulation of protein synthesis initiation factor eIF4E is an earlyevent during colon carcinogenesis.Oncogene18: 2507–2517.
Rousseau D, Kaspar R, Rosenwald IB, Gehrke I, Sonenberg N (1996)Translation initiation of ornithine decarboxylase and nucleocytoplas-mic transport of cyclin D1 mRNA are increased in cells overexpressingeukaryotic initiation factor 4E.Proc Natl Acad Sci USA93: 1065–1070.
Savinova O, Joshi B, Jagus R (1999) Abnormal levels and minimal activ-ity of the dsRNA-activated protein kinase, PKR, in breast carcinomacells.Int J Biochem Cell B31: 175–189.
Scorsone KA, Panniers R, Rowlands AG, Henshaw EC (1987) Phospho-rylation of eukaryotic initiation factor 2 during physiological stresswhich affect protein synthesis,J Biol Chem262: 14538–14543.
Sing C, Haines GK, Talamonti MS, Radosevich JA (1995) Expression ofp68 in human colon cancer.Tumour Biol16: 281–289.
Ting NS, Kao PN, Chan DW, Lintott LG, Lees-Miller SP (1998) DNA-dependent protein kinase interacts with antigen receptor response ele-ment binding proteins NF90 and NF45.J Biol Chem273: 2136–2145.
Tipoe GL, White FH, Pritchett CJ (1992) A morphometric study of his-tological variations during cellular differentiation of normal humancolorectal epithelium.J Anat181: 189–197.
Wang S, Rosenwald IB, Hutzler NJ, Pihan GA, Savas L, Chen JJ,Woda BA (1999) Expression of the eukaryotic translation initiationfactors 4E and 2α in non-Hodgkin’s lymphomas.Am J Pathol155:247–255.
Willis AE (1999) Translational normal of growth factor and proto-oncogene expression.Int J Biochem Cell B31: 73–86.
Related Documents