Asia-Pacific Population Journal, Vol. 24, No. 2 51 Levels and Trends in Child Malnutrition in Bangladesh The interventions for improving girls’ education should be strengthened since women’s education is a powerful weapon to reduce child malnutrition. Better knowledge and skills enable women to improve the way they care for and feed their infants. by Sumonkanti Das, Md. Zakir Hossain and Mossamet Kamrun Nesa* Malnutrition is a persistent problem for both children and mother throughout the world. In developing countries malnutrition is an important root of infant and young child mortality, morbidity and reduced life span. It is considered that if malnutrition cannot be reduced and prevented, it will be impossible to achieve many of the Millennium Development Goals (MDGs) including the goals on extreme poverty and hungry, primary education, child mortality, and incidence of infectious diseases. The World Summit for Children in 1990 recognized malnutrition as a contributing factor in half of all deaths occurring among young children. The nutrition goals for the decade 1990-2000 include reduction of both * Sumonkanti Das, Lecturer; Md. Zakir Hossain, Professor and Mossamet Kamrun Nesa, Lecturer, all from Department of Statistics, Shahjalal University of Science & Technology, Bangladesh, e-mails: [email protected], [email protected] and [email protected].

Welcome message from author
This document is posted to help you gain knowledge. Please leave a comment to let me know what you think about it! Share it to your friends and learn new things together.
Transcript
Asia-Pacific Population Journal, Vol. 24, No. 2 51
Levels and Trends in ChildMalnutrition in Bangladesh
The interventions for improving girls’ education should be strengthened
since women’s education is a powerful weapon to reduce child
malnutrition. Better knowledge and skills enable women to
improve the way they care for and feed their infants.
by Sumonkanti Das, Md. Zakir Hossain and
Mossamet Kamrun Nesa*
Malnutrition is a persistent problem for both children and mother throughout
the world. In developing countries malnutrition is an important root of infant and
young child mortality, morbidity and reduced life span. It is considered that if
malnutrition cannot be reduced and prevented, it will be impossible to achieve
many of the Millennium Development Goals (MDGs) including the goals on
extreme poverty and hungry, primary education, child mortality, and incidence of
infectious diseases. The World Summit for Children in 1990 recognized
malnutrition as a contributing factor in half of all deaths occurring among young
children. The nutrition goals for the decade 1990-2000 include reduction of both
* Sumonkanti Das, Lecturer; Md. Zakir Hossain, Professor and Mossamet Kamrun Nesa, Lecturer,
all from Department of Statistics, Shahjalal University of Science & Technology, Bangladesh, e-mails:
52 Asia-Pacific Population Journal, Vol. 24, No. 2
moderate and severe protein-energy malnutrition among children under five years
of age by one half of the 1990 levels (UNICEF, 1990). However, the reduction
of child malnutrition by half in a decade was one of the most ambitious goals set
by the various summits convened during the 1990s. As a result, all of the nutrition
goals were not successfully achieved during the period 1990-2000. As a step
towards building a strong foundation for attaining the internally agreed
development goals, including the MDGs, a consistent set of intermediate targets
and benchmarks during the course of the decade (2000-2010) were set to help the
unmet goals (UNICEF, 2003; United Nations, 2001). One of the most important
goals regarding nutrition during the period 2000-2010 was the one on reducing
child malnutrition among children aged under five by at least one third of the 2000
levels, with special attention paid to children under two years of age—especially
reduction of stunted and underweighted children by at least one third during the
period 2000-2010 (UNICEF, 2002).
The burden of malnutrition is much higher in South Asia compared to that
of Africa and other parts of the world (de Onis, Frongillo and Blossner, 2000;
UNICEF, 1998). In South Asia the prevalence of underweight (weight-for-age
below -2 SD from the reference median) and stunting (weight-for-age below
-2 SD from the reference median) were found to be 46 and 44 per cent, respectively
(UNICEF, 2006) which were above the threshold of “very high” prevalence
according to the World Heath Organization (WHO, 1995). Bangladesh is one
of the South Asian countries where over-population, poverty and floods are
continual and causing population vulnerability, particularly malnutrition of
children and women. Children in Bangladesh suffer from one or more forms of
malnutrition—macronutrient malnutrition (such as low birth weight, stunting,
underweight) and micronutrient malnutrition (such as iodine, iron, vitamin-A
deficiency disorders). Nearly half of the children under five years of age were
either underweighted or stunted (UNICEF, 2006). Two thirds of childhood deaths
in Bangladesh were attributable to malnutrition (Pelletier and others, 1995). The
level of severe stunting as well as severe underweight were found to be at about
28 and 21 per cent, respectively—representing among the highest levels in the
world (Mitra and others, 1997).
Regarding reduction of child malnutrition, the country’s goals are the same
as the global goals agreed to by the international community Bangladesh (MWCA,
2005). In achieving the goals of the 1990’s World Summit, Bangladesh has made
remarkable improvements with regards to child malnutrition. During the period
1990-2000, the prevalence of underweight children fell from 67 per cent to
Asia-Pacific Population Journal, Vol. 24, No. 2 53
51 per cent, and stunting came down from 66 per cent to 49 per cent. The coverage
of vitamin-A capsule supplementation had increased for children aged 12-59
months from 41 per cent in 1993 to over 90 per cent in 2003 (MWCA, 2005).
During that same period, there also have been some important improvements in
health care provisions, water supply and sanitation, girls’ education, and social
and economic opportunities for women (FAO, 1999). However, from the various
studies and surveys conducted during the last four decades, it is obvious that the
nutrition scenario was not satisfactory in Bangladesh, especially for children and
mother (HKI/IPHN, 2006; BBS, 1997; BBS-UNICEF, 2002; NIPORT and others,
2001). Malnutrition affects pregnant women, lactating mothers, and under-five
year children and its ill effects spare none.
Considering the extent and magnitude of the issue in Bangladesh, the
Government has adopted multifaceted programmes to combat the catastrophic
effects of malnutrition. Bangladesh has made significant progress in the area of
child survival and development, specifically with regard to child immunization,
vitamin-A supplementation and nutrition. UNICEF (2008) reported that Bangladesh
is on track to meet the related target under the Millennium Development Goals.
However, child malnutrition is still threatening in the country and further
improvements are required. In order to achieve the goals and targets set in several
programmes and policies, it is necessary to continuously monitor the situation.
An evaluation of children’s nutritional status is also indispensable to look at the
nutrition situation of a community and the effectiveness of nutrition interventions’
which will in turn help assess the achievement towards the related Millennium
Development Goal. The study attempts to examine the nutritional status of
Bangladeshi children in terms of three indicators; stunting, wasting and
underweight. The study also investigates trends with regard to each of the above
three malnutrition-related conditions.
Data and methodology
The study utilizes the nationwide data of Bangladesh Demographic and
Health Survey (BDHS) 2004 to assess children’s nutritional status. All the children
under five years of age were both weighed and measured by a scale and measuring
board, with different methods according to the child’s age. For infants and young
children aged below 24 months, recumbent length was recorded as opposed to
standing heights for children aged 2-5 years. A total of 6,528 children under
five years of age were eligible to be weighed and measured. However, the
anthropometric data were not available for 6 per cent of the children and deemed
54 Asia-Pacific Population Journal, Vol. 24, No. 2
unrealistic for 1.9 per cent children. Finally, completed and plausible anthropometric
data were obtained and analysed for 6,005 (weighted) children. It is to be noted
that the mother’s height and weight were not available for 110 children.
To assess the nutritional status and general health condition of infants,
children and adolescents it is necessary to compare anthropometric data with
reference growth charts. The World Health Organization (WHO) has recommended
the NCHS reference growth data as an international standard for comparing the
health and nutritional status of children across all countries throughout the world
(Gibson, 1990). However, this presents some limitation in the context of
geographic, cultural, socio-economic and genetic factors for infants (Grummer-
Strawn, 2002). By contrast, it is evident that the growth in height and weight of
well-fed, healthy children, or children experiencing unconstrained growth from
different ethnic backgrounds and continents is reasonably similar, at least for
5 years of age (Graitcher and Gentry, 1981; Martorell, 1985). Moreover, according
to Stephenson, Latham and Jansen (1983), there is little difference between the
growth curves for members of elite groups in less developed countries and those
for infants and children of similar age in industrialized nations. In this connection,
NCHS reference population is applicable for measuring the nutritional status of
children in developing countries like Bangladesh. In most of the previous study
regarding Bangladeshi children, NCHS reference population was therefore used
for assessing the nutritional status of children under age five. Since the study
deals with status and trends in child malnutrition in light of the findings of previous
studies, in calculation of anthropometric indices—height-for-age (HAZ), weight-
for-height (WHZ) and weight-for-age (WAZ) Z-scores, the study considers the
United States of America’s NCHS as a reference population. The following
formulas were used to calculate the anthropometric indices in terms of Z-scores:
HAZ =
WHZ =
WAZ =
Children are classified as severely and moderately stunted (chronic
malnutrition), wasted (acute malnutrition) and underweighted (stunted, wasted, or
(Child’s height-for-age) – (Median of reference height-for-age)
Standard deviation (SD) values of reference population
(Child’s weight-for-height) – (Median of reference weight-for-height)
SD values of reference population
(Child’s weight-for-age) – (Median of reference weight-for-age)
SD values of reference population
Asia-Pacific Population Journal, Vol. 24, No. 2 55
both) if HAZ, WHZ and WAZ are respectively below -3.0 and between -3.0 to
-2.01 according to WHO (1995).
To study the trends in child malnutrition in Bangladesh during the period
1985-2004, the results of six previous surveys have been utilized (a) Bangladesh
Household Expenditure Survey 1985-1986, (b) Bangladesh Household Expenditure
Survey 1989-1990, (c) Child Nutrition Survey of Bangladesh 1992, (d) Child
Nutrition Survey of Bangladesh 1995-1996, (e) Bangladesh Demographic and
Health Survey 1996-1997, and (f) Bangladesh Demographic and Health Survey
1999-2000. The study considers age of child, sex, place of residence, regional
settings, and mother’s education as background characteristics to study the
differences in the rates of decline in child malnutrition.
Status of anthropometric indicators for children
under 5 years of age
Among the anthropometric measurements, the study considered height and
weight of the children corresponding to their age and sex in order to measure their
nutritional status. Appropriate height and weight corresponding to each age by
sex represents better nutritional status. To identify the nutritional status, it is
required to compare the height and weight with the corresponding height and
weight of a reference population of the same age and sex. The anthropometric
indicators viz., height-for-age, weight-for-age and weight-for-height can be
constructed with the help of the anthropometric measurements.
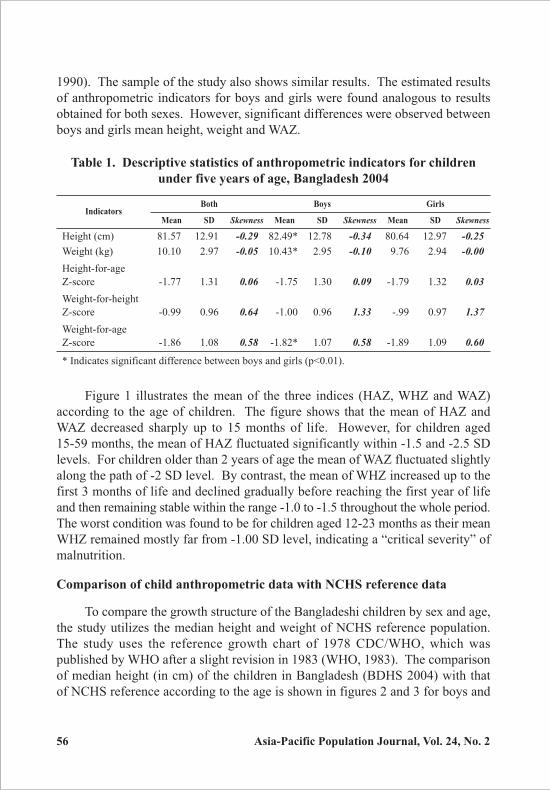
Descriptive statistics of anthropometric indicators
This section mainly explores the status of anthropometric indicators through
descriptive statistics. Table 1 shows the average value of the anthropometric
indicators (height, weight, height-for-age (HAZ), weight-for-height (WHZ) and
weight-for-age (WAZ)) with standard deviation and skewness for children aged
under five years. The estimated mean of height and weight obtained were
81.57 cm (±12.91 cm) and 10.10 kg (±2.97 kg), respectively. It is observed that
skewness of weight was found to be much closer to zero than that of height. The
mean of HAZ and WAZ was found to be above the -2 SD level. The estimated
means were found to be consistent with the previous 2005 study, that is -1.7 and
-1.8, respectively (HKI/IPHN, 2006). However, the mean of WHZ was observed
to be close to the -1 SD level indicating a “serious severity” of malnutrition for
children. The mean of HAZ also indicates that they were suffering from “critical”
malnutrition. Available literature suggests that HAZ should be symmetric (Gibson,
56 Asia-Pacific Population Journal, Vol. 24, No. 2
1990). The sample of the study also shows similar results. The estimated results
of anthropometric indicators for boys and girls were found analogous to results
obtained for both sexes. However, significant differences were observed between
boys and girls mean height, weight and WAZ.
Table 1. Descriptive statistics of anthropometric indicators for children
under five years of age, Bangladesh 2004
IndicatorsBoth Boys Girls
Mean SD Skewness Mean SD Skewness Mean SD Skewness
Height (cm) 81.57 12.91 -0.29 82.49* 12.78 -0.34 80.64 12.97 -0.25
Weight (kg) 10.10 2.97 -0.05 10.43* 2.95 -0.10 9.76 2.94 -0.00
Height-for-age
Z-score -1.77 1.31 0.06 -1.75 1.30 0.09 -1.79 1.32 0.03
Weight-for-height
Z-score -0.99 0.96 0.64 -1.00 0.96 1.33 -.99 0.97 1.37
Weight-for-age
Z-score -1.86 1.08 0.58 -1.82* 1.07 0.58 -1.89 1.09 0.60
* Indicates significant difference between boys and girls (p<0.01).
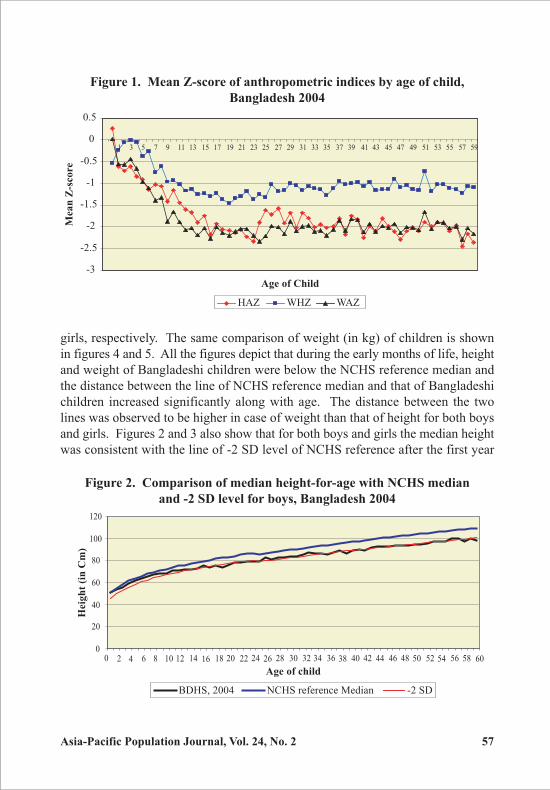
Figure 1 illustrates the mean of the three indices (HAZ, WHZ and WAZ)
according to the age of children. The figure shows that the mean of HAZ and
WAZ decreased sharply up to 15 months of life. However, for children aged
15-59 months, the mean of HAZ fluctuated significantly within -1.5 and -2.5 SD
levels. For children older than 2 years of age the mean of WAZ fluctuated slightly
along the path of -2 SD level. By contrast, the mean of WHZ increased up to the
first 3 months of life and declined gradually before reaching the first year of life
and then remaining stable within the range -1.0 to -1.5 throughout the whole period.
The worst condition was found to be for children aged 12-23 months as their mean
WHZ remained mostly far from -1.00 SD level, indicating a “critical severity” of
malnutrition.
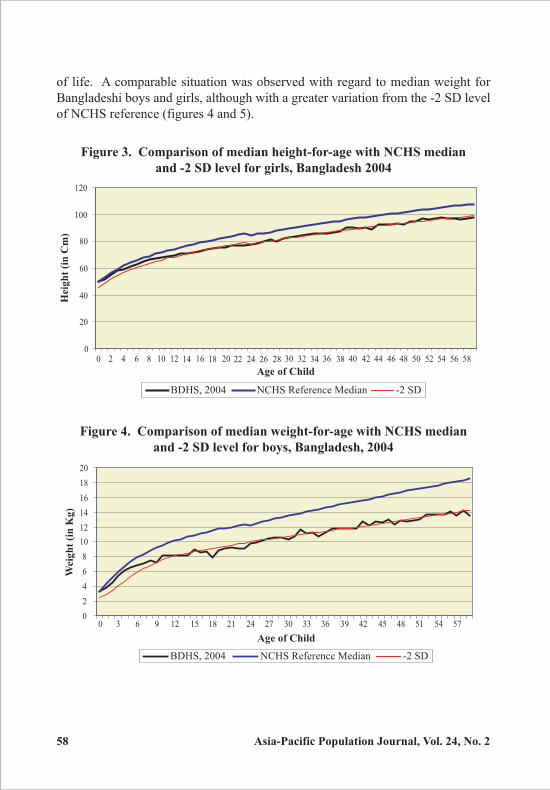
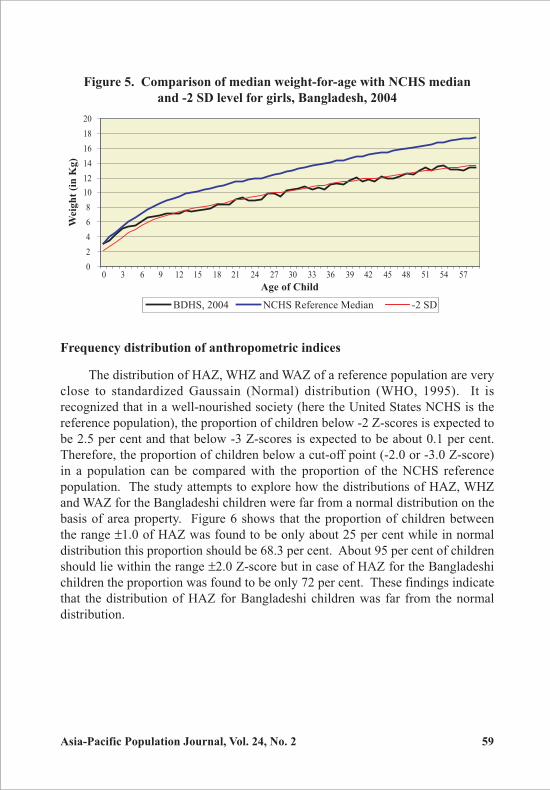
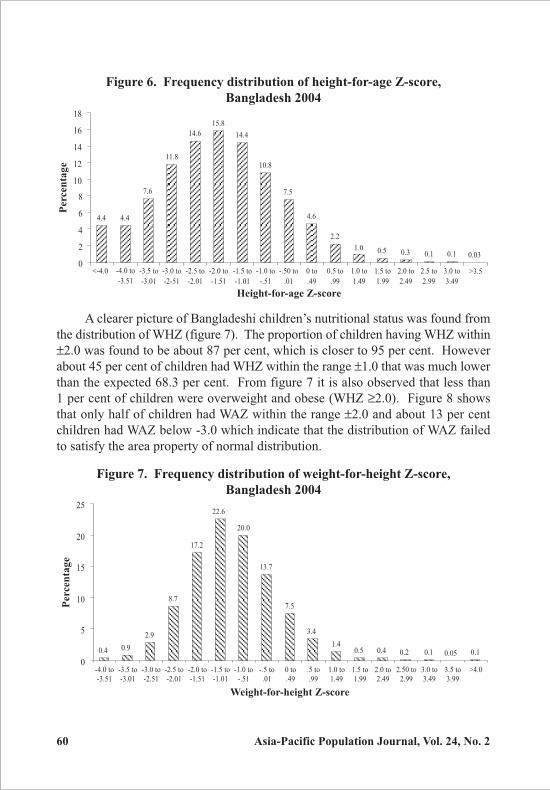
Comparison of child anthropometric data with NCHS reference data
To compare the growth structure of the Bangladeshi children by sex and age,
the study utilizes the median height and weight of NCHS reference population.
The study uses the reference growth chart of 1978 CDC/WHO, which was
published by WHO after a slight revision in 1983 (WHO, 1983). The comparison
of median height (in cm) of the children in Bangladesh (BDHS 2004) with that
of NCHS reference according to the age is shown in figures 2 and 3 for boys and
Asia-Pacific Population Journal, Vol. 24, No. 2 57
girls, respectively. The same comparison of weight (in kg) of children is shown
in figures 4 and 5. All the figures depict that during the early months of life, height
and weight of Bangladeshi children were below the NCHS reference median and
the distance between the line of NCHS reference median and that of Bangladeshi
children increased significantly along with age. The distance between the two
lines was observed to be higher in case of weight than that of height for both boys
and girls. Figures 2 and 3 also show that for both boys and girls the median height
was consistent with the line of -2 SD level of NCHS reference after the first year
Figure 1. Mean Z-score of anthropometric indices by age of child,
Bangladesh 2004
-3
-2.5
-2
-1.5
-1
-0.5
0
0.5
1 3 5 7 9 11 13 15 17 19 21 23 25 27 29 31 33 35 37 39 41 43 45 47 49 51 53 55 57 59
HAZ WHZ WAZ
Age of Child
Mea
n Z
-sco
re
Figure 2. Comparison of median height-for-age with NCHS median
and -2 SD level for boys, Bangladesh 2004
0
20
40
60
80
100
120
BDHS, 2004 NCHS reference Median -2 SD
Age of child
Heig
ht
(in
Cm
)
0 582 4 6 8 10 12 14 16 18 20 22 24 26 28 30 32 34 36 38 40 42 44 46 48 50 52 54 56 60
58 Asia-Pacific Population Journal, Vol. 24, No. 2
Figure 3. Comparison of median height-for-age with NCHS median
and -2 SD level for girls, Bangladesh 2004
of life. A comparable situation was observed with regard to median weight for
Bangladeshi boys and girls, although with a greater variation from the -2 SD level
of NCHS reference (figures 4 and 5).
0 2 4 6 8 10 12 14 16 18 20 22 24 26 28 30 32 34 36 38 40 42 44 46 48 50 52 54 56 580
20
40
60
80
100
120
BDHS, 2004 NCHS Reference Median -2 SD
Heig
ht
(in
Cm
)
Age of Child
Figure 4. Comparison of median weight-for-age with NCHS median
and -2 SD level for boys, Bangladesh, 2004
0
2
4
6
8
10
12
14
16
18
20
0 3 6 9 12 15 18 21 24 27 30 33 36 39 42 45 48 51 54 57
BDHS, 2004 NCHS Reference Median -2 SD
Age of Child
Weig
ht
(in
Kg
)
Asia-Pacific Population Journal, Vol. 24, No. 2 59
Frequency distribution of anthropometric indices
The distribution of HAZ, WHZ and WAZ of a reference population are very
close to standardized Gaussain (Normal) distribution (WHO, 1995). It is
recognized that in a well-nourished society (here the United States NCHS is the
reference population), the proportion of children below -2 Z-scores is expected to
be 2.5 per cent and that below -3 Z-scores is expected to be about 0.1 per cent.
Therefore, the proportion of children below a cut-off point (-2.0 or -3.0 Z-score)
in a population can be compared with the proportion of the NCHS reference
population. The study attempts to explore how the distributions of HAZ, WHZ
and WAZ for the Bangladeshi children were far from a normal distribution on the
basis of area property. Figure 6 shows that the proportion of children between
the range ±1.0 of HAZ was found to be only about 25 per cent while in normal
distribution this proportion should be 68.3 per cent. About 95 per cent of children
should lie within the range ±2.0 Z-score but in case of HAZ for the Bangladeshi
children the proportion was found to be only 72 per cent. These findings indicate
that the distribution of HAZ for Bangladeshi children was far from the normal
distribution.
Figure 5. Comparison of median weight-for-age with NCHS median
and -2 SD level for girls, Bangladesh, 2004
0
2
4
6
8
10
12
14
16
18
20
0 3 6 9 12 15 18 21 24 27 30 33 36 39 42 45 48 51 54 57
BDHS, 2004 NCHS Reference Median -2 SD
Age of Child
Weig
ht
(in
Kg
)
60 Asia-Pacific Population Journal, Vol. 24, No. 2
A clearer picture of Bangladeshi children’s nutritional status was found from
the distribution of WHZ (figure 7). The proportion of children having WHZ within
±2.0 was found to be about 87 per cent, which is closer to 95 per cent. However
about 45 per cent of children had WHZ within the range ±1.0 that was much lower
than the expected 68.3 per cent. From figure 7 it is also observed that less than
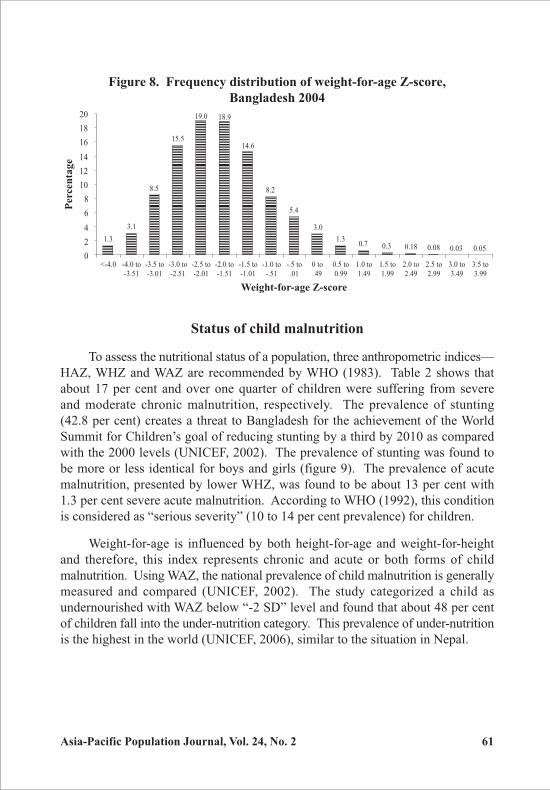
1 per cent of children were overweight and obese (WHZ ≥2.0). Figure 8 shows
that only half of children had WAZ within the range ±2.0 and about 13 per cent
children had WAZ below -3.0 which indicate that the distribution of WAZ failed
to satisfy the area property of normal distribution.
Figure 6. Frequency distribution of height-for-age Z-score,
Bangladesh 2004
Figure 7. Frequency distribution of weight-for-height Z-score,
Bangladesh 2004
4.4 4.4
7.6
11.8
14.6
15.8
14.4
10.8
7.5
4.6
2.2
1.0 0.5 0.3 0.1 0.1 0.03
0
2
4
6
8
10
12
14
16
18
<-4.0 -4.0 to
-3.51
-3.5 to
-3.01
-3.0 to
-2-51
-2.5 to
-2.01
-2.0 to
-1.51
-1.5 to
-1.01
-1.0 to
-.51
-.50 to
.01
0 to
.49
0.5 to
.99
1.0 to
1.49
1.5 to
1.99
2.0 to
2.49
2.5 to
2.99
3.0 to
3.49
>3.5
Perc
en
tag
e
Height-for-age Z-score
0.4 0.9
2.9
8.7
17.2
22.6
20.0
13.7
7.5
3.4
1.40.5 0.4 0.2 0.1 0.05 0.1
0
5
10
15
20
25
-4.0 to
-3.51
-3.5 to
-3.01
-3.0 to
-2.51
-2.5 to
-2.01
-2.0 to
-1.51
-1.5 to
-1.01
-1.0 to
-.51
-.5 to
.01
0 to
.49
.5 to
.99
1.0 to
1.49
1.5 to
1.99
2.0 to
2.49
2.50 to
2.99
3.0 to
3.49
3.5 to
3.99
>4.0
Perc
en
tag
e
Weight-for-height Z-score
Asia-Pacific Population Journal, Vol. 24, No. 2 61
Status of child malnutrition
To assess the nutritional status of a population, three anthropometric indices—
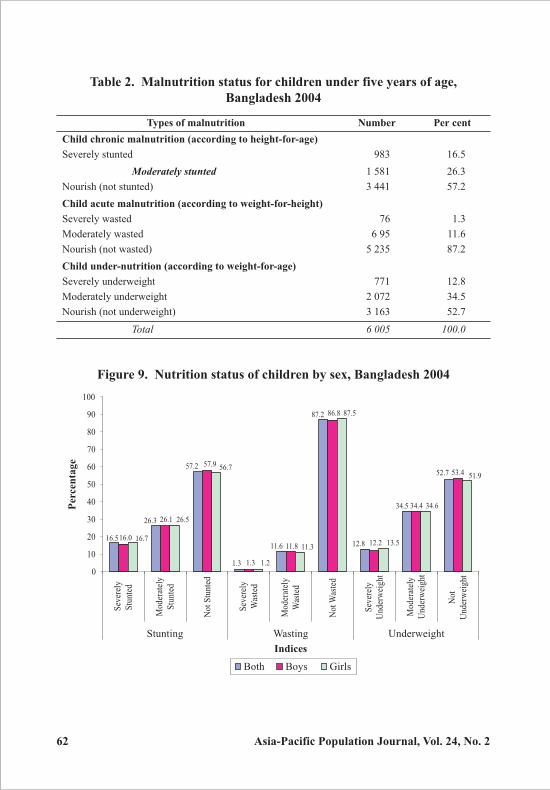
HAZ, WHZ and WAZ are recommended by WHO (1983). Table 2 shows that
about 17 per cent and over one quarter of children were suffering from severe
and moderate chronic malnutrition, respectively. The prevalence of stunting
(42.8 per cent) creates a threat to Bangladesh for the achievement of the World
Summit for Children’s goal of reducing stunting by a third by 2010 as compared
with the 2000 levels (UNICEF, 2002). The prevalence of stunting was found to
be more or less identical for boys and girls (figure 9). The prevalence of acute
malnutrition, presented by lower WHZ, was found to be about 13 per cent with
1.3 per cent severe acute malnutrition. According to WHO (1992), this condition
is considered as “serious severity” (10 to 14 per cent prevalence) for children.
Weight-for-age is influenced by both height-for-age and weight-for-height
and therefore, this index represents chronic and acute or both forms of child
malnutrition. Using WAZ, the national prevalence of child malnutrition is generally
measured and compared (UNICEF, 2002). The study categorized a child as
undernourished with WAZ below “-2 SD” level and found that about 48 per cent
of children fall into the under-nutrition category. This prevalence of under-nutrition
is the highest in the world (UNICEF, 2006), similar to the situation in Nepal.
Figure 8. Frequency distribution of weight-for-age Z-score,
Bangladesh 2004
1.3
3.1
8.5
15.514.6
8.2
5.4
3.0
1.30.7 0.3 0.18 0.08 0.03 0.05
19.0 18.9
0
2
4
6
8
10
12
14
16
18
20
<-4.0 -4.0 to
-3.51
-3.5 to
-3.01
-3.0 to
-2.51
-2.5 to
-2.01
-2.0 to
-1.51
-1.5 to
-1.01
-1.0 to
-.51
-.5 to
.01
0 to
.49
0.5 to
0.99
1.0 to
1.49
1.5 to
1.99
2.0 to
2.49
2.5 to
2.99
3.0 to
3.49
3.5 to
3.99
Perc
en
tag
e
Weight-for-age Z-score
62 Asia-Pacific Population Journal, Vol. 24, No. 2
Figure 9. Nutrition status of children by sex, Bangladesh 2004
Table 2. Malnutrition status for children under five years of age,
Bangladesh 2004
Types of malnutrition Number Per cent
Child chronic malnutrition (according to height-for-age)
Severely stunted 983 16.5
Moderately stunted 1 581 26.3
Nourish (not stunted) 3 441 57.2
Child acute malnutrition (according to weight-for-height)
Severely wasted 76 1.3
Moderately wasted 6 95 11.6
Nourish (not wasted) 5 235 87.2
Child under-nutrition (according to weight-for-age)
Severely underweight 771 12.8
Moderately underweight 2 072 34.5
Nourish (not underweight) 3 163 52.7
Total 6 005 100.0
1.31.3
11.616.5
52.7
34.5
12.8
87.2
57.2
26.3
12.211.8
53.4
34.4
86.8
57.9
26.1
16.0
1.2
11.3
51.9
34.6
13.5
87.5
56.7
26.5
16.7
0
10
20
30
40
50
60
70
80
90
100
Sev
erel
y
Stu
nted
Mod
erat
ely
Stu
nted
Not
Stu
nted
Sev
erel
y
Was
ted
Mod
erat
ely
Was
ted
Not
Was
ted
Sev
erel
y
Und
erw
eigh
t
Mod
erat
ely
Und
erw
eigh
t
Not
Und
erw
eigh
t
Both Boys Girls
Perc
en
tag
e
Stunting Wasting
Indices
Underweight
Asia-Pacific Population Journal, Vol. 24, No. 2 63
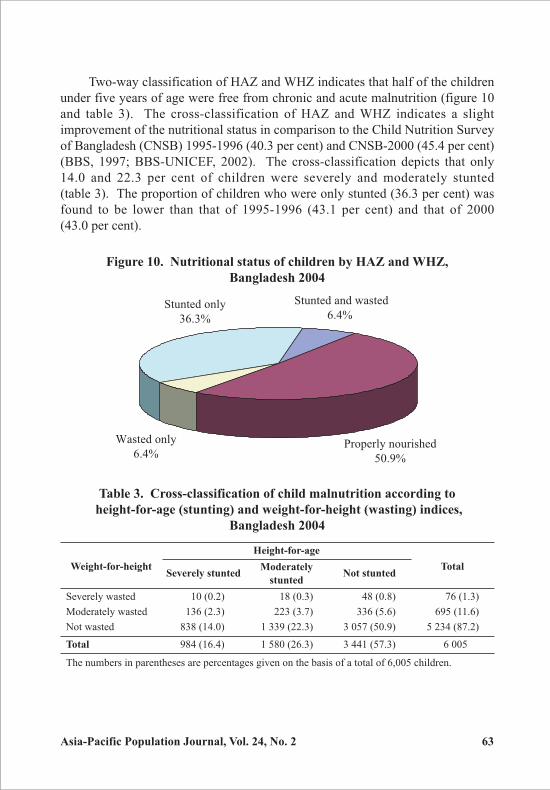
Two-way classification of HAZ and WHZ indicates that half of the children
under five years of age were free from chronic and acute malnutrition (figure 10
and table 3). The cross-classification of HAZ and WHZ indicates a slight
improvement of the nutritional status in comparison to the Child Nutrition Survey
of Bangladesh (CNSB) 1995-1996 (40.3 per cent) and CNSB-2000 (45.4 per cent)
(BBS, 1997; BBS-UNICEF, 2002). The cross-classification depicts that only
14.0 and 22.3 per cent of children were severely and moderately stunted
(table 3). The proportion of children who were only stunted (36.3 per cent) was
found to be lower than that of 1995-1996 (43.1 per cent) and that of 2000
(43.0 per cent).
Figure 10. Nutritional status of children by HAZ and WHZ,
Bangladesh 2004
Table 3. Cross-classification of child malnutrition according to
height-for-age (stunting) and weight-for-height (wasting) indices,
Bangladesh 2004
Weight-for-height
Height-for-age
TotalSeverely stunted
ModeratelyNot stunted
stunted
Severely wasted 10 (0.2) 18 (0.3) 48 (0.8) 76 (1.3)
Moderately wasted 136 (2.3) 223 (3.7) 336 (5.6) 695 (11.6)
Not wasted 838 (14.0) 1 339 (22.3) 3 057 (50.9) 5 234 (87.2)
Total 984 (16.4) 1 580 (26.3) 3 441 (57.3) 6 005
The numbers in parentheses are percentages given on the basis of a total of 6,005 children.
Stunted and wasted
6.4%
Properly nourished
50.9%
Wasted only
6.4%
Stunted only
36.3%
64 Asia-Pacific Population Journal, Vol. 24, No. 2
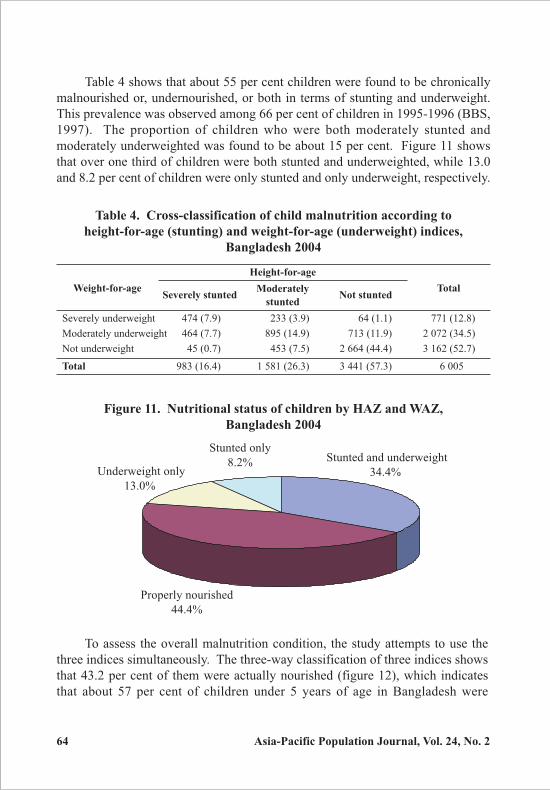
Table 4 shows that about 55 per cent children were found to be chronically
malnourished or, undernourished, or both in terms of stunting and underweight.
This prevalence was observed among 66 per cent of children in 1995-1996 (BBS,
1997). The proportion of children who were both moderately stunted and
moderately underweighted was found to be about 15 per cent. Figure 11 shows
that over one third of children were both stunted and underweighted, while 13.0
and 8.2 per cent of children were only stunted and only underweight, respectively.
Table 4. Cross-classification of child malnutrition according to
height-for-age (stunting) and weight-for-age (underweight) indices,
Bangladesh 2004
Weight-for-age
Height-for-age
TotalSeverely stunted
ModeratelyNot stunted
stunted
Severely underweight 474 (7.9) 233 (3.9) 64 (1.1) 771 (12.8)
Moderately underweight 464 (7.7) 895 (14.9) 713 (11.9) 2 072 (34.5)
Not underweight 45 (0.7) 453 (7.5) 2 664 (44.4) 3 162 (52.7)
Total 983 (16.4) 1 581 (26.3) 3 441 (57.3) 6 005
Figure 11. Nutritional status of children by HAZ and WAZ,
Bangladesh 2004
Stunted and underweight
34.4%
Properly nourished
44.4%
Underweight only
13.0%
Stunted only
8.2%
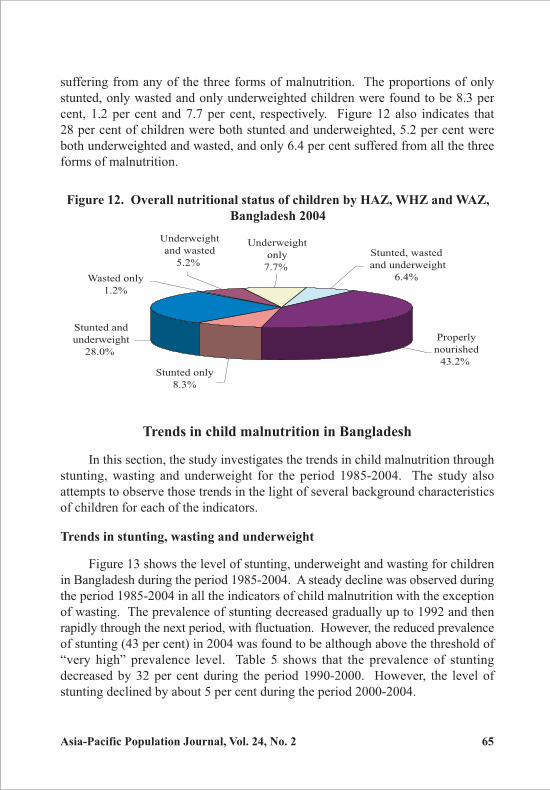
To assess the overall malnutrition condition, the study attempts to use the
three indices simultaneously. The three-way classification of three indices shows
that 43.2 per cent of them were actually nourished (figure 12), which indicates
that about 57 per cent of children under 5 years of age in Bangladesh were
Asia-Pacific Population Journal, Vol. 24, No. 2 65
suffering from any of the three forms of malnutrition. The proportions of only
stunted, only wasted and only underweighted children were found to be 8.3 per
cent, 1.2 per cent and 7.7 per cent, respectively. Figure 12 also indicates that
28 per cent of children were both stunted and underweighted, 5.2 per cent were
both underweighted and wasted, and only 6.4 per cent suffered from all the three
forms of malnutrition.
Figure 12. Overall nutritional status of children by HAZ, WHZ and WAZ,
Bangladesh 2004
Stunted only
8.3%
Stunted and
underweight
28.0%
Properly
nourished
43.2%
Stunted, wasted
and underweight
6.4%
Underweight
only
7.7%
Underweight
and wasted
5.2%
Wasted only
1.2%
Trends in child malnutrition in Bangladesh
In this section, the study investigates the trends in child malnutrition through
stunting, wasting and underweight for the period 1985-2004. The study also
attempts to observe those trends in the light of several background characteristics
of children for each of the indicators.
Trends in stunting, wasting and underweight
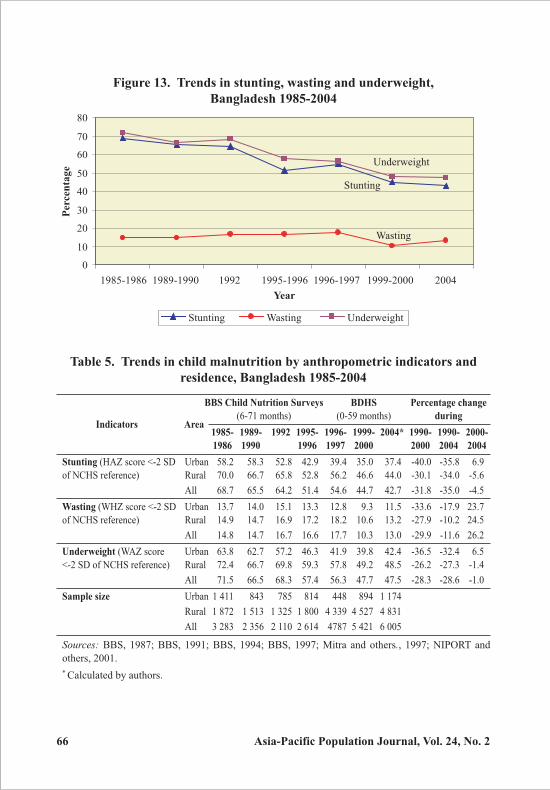
Figure 13 shows the level of stunting, underweight and wasting for children
in Bangladesh during the period 1985-2004. A steady decline was observed during
the period 1985-2004 in all the indicators of child malnutrition with the exception
of wasting. The prevalence of stunting decreased gradually up to 1992 and then
rapidly through the next period, with fluctuation. However, the reduced prevalence
of stunting (43 per cent) in 2004 was found to be although above the threshold of
“very high” prevalence level. Table 5 shows that the prevalence of stunting
decreased by 32 per cent during the period 1990-2000. However, the level of
stunting declined by about 5 per cent during the period 2000-2004.
66 Asia-Pacific Population Journal, Vol. 24, No. 2
Figure 13. Trends in stunting, wasting and underweight,
Bangladesh 1985-2004
Table 5. Trends in child malnutrition by anthropometric indicators and
residence, Bangladesh 1985-2004
BBS Child Nutrition Surveys BDHS Percentage change
Indicators Area(6-71 months) (0-59 months) during
1985- 1989- 1992 1995- 1996- 1999- 2004* 1990- 1990- 2000-
1986 1990 1996 1997 2000 2000 2004 2004
Stunting (HAZ score <-2 SD Urban 58.2 58.3 52.8 42.9 39.4 35.0 37.4 -40.0 -35.8 6.9
of NCHS reference) Rural 70.0 66.7 65.8 52.8 56.2 46.6 44.0 -30.1 -34.0 -5.6
All 68.7 65.5 64.2 51.4 54.6 44.7 42.7 -31.8 -35.0 -4.5
Wasting (WHZ score <-2 SD Urban 13.7 14.0 15.1 13.3 12.8 9.3 11.5 -33.6 -17.9 23.7
of NCHS reference) Rural 14.9 14.7 16.9 17.2 18.2 10.6 13.2 -27.9 -10.2 24.5
All 14.8 14.7 16.7 16.6 17.7 10.3 13.0 -29.9 -11.6 26.2
Underweight (WAZ score Urban 63.8 62.7 57.2 46.3 41.9 39.8 42.4 -36.5 -32.4 6.5
<-2 SD of NCHS reference) Rural 72.4 66.7 69.8 59.3 57.8 49.2 48.5 -26.2 -27.3 -1.4
All 71.5 66.5 68.3 57.4 56.3 47.7 47.5 -28.3 -28.6 -1.0
Sample size Urban 1 411 843 785 814 448 894 1 174
Rural 1 872 1 513 1 325 1 800 4 339 4 527 4 831
All 3 283 2 356 2 110 2 614 4787 5 421 6 005
Sources: BBS, 1987; BBS, 1991; BBS, 1994; BBS, 1997; Mitra and others., 1997; NIPORT and
others, 2001.
* Calculated by authors.
Stunting
Wasting
Underweight
0
10
20
30
40
50
60
70
80
1985-1986 1989-1990 1992 1995-1996 1996-1997 1999-2000 2004
Stunting Wasting Underweight
Perc
en
tag
e
Year
Asia-Pacific Population Journal, Vol. 24, No. 2 67
The prevalence of child underweight decreased from 66.5 per cent in
1989-1990 (the base year for the MDGs) to 47.5 per cent in 2004, representing
a 29 per cent change during the period. These results suggest that current
interventions should be pursued if the MDG target of a 50 per cent decline in child
underweight are to be achieved by the year 2015. In comparison to 2000, the
level of underweight was found to be stable during the period 2000-2004.
Although Bangladesh has shown a significant reduction in malnutrition over the
past 15 years (1990-2004), the magnitude of the problem is still a great concern
for the country since the prevalence of underweight and stunting were found above
the threshold of “very high” prevalence as indicated by WHO.
A dissimilar pattern of trend in the prevalence of wasting was found from
1985-1986 (14.8 per cent) to 1996-1997 (17.7 per cent). According to WHO, this
prevalence of wasting indicates “critical severity” of malnutrition (WHO, 1992).
After a huge decline in the prevalence of wasting (about 8 per cent) during
1996-2000, it increased up to 13.2 per cent in 2004, which indicates that the
children were in “serious severity”. Over the last two decades, the prevalence of
wasting in Bangladesh has never fallen below 10 per cent.
Trends in child malnutrition by background characteristics
Although the level of child malnutrition decreased, the trends of decline
should be observed according to several backgrounds characteristics. The national
declining trends of child malnutrition mask both interregional differences and
differences in socio-economic status (HKI/IPHN, 2006). The study considers
several important variables viz., place of residence, regional settings (division),
sex and age of child, and mother’s education status as background characteristics
in order to investigate the differences in trends and better identify the vulnerable
group.
Residence
Over the whole period 1985-2004, the prevalence of chronic malnutrition
was found to be higher among rural children compared with their urban
counterparts. Over two thirds of rural children were found to suffer from chronic
malnutrition during the period 1985-1992. The proportion then started to decline
rapidly, though it remained over the threshold of “very high” prevalence until 2004
(table 5). By contrast, in urban area the level of stunting dropped to the stage of
“high” prevalence after 1995-1996 (varying from 35 per cent to 39 per cent) from
the stage of “very high” prevalence (more than 42 per cent) during the period
68 Asia-Pacific Population Journal, Vol. 24, No. 2
1985-1995. In urban areas, highest percentage of decline (40 per cent) was
recorded during the period 1990-2000. Surprisingly, the prevalence of stunting
was found to increase (7 per cent) for children living in urban areas during 2000-
2004.
In case of acute malnutrition, the prevalence rate fluctuated over the whole
period 1985-2004 both in rural and urban areas. In rural areas, the trend in acute
malnutrition was found to be identical to that prevailing at the national level. Over
the whole period 1985-2004, the prevalence of child underweight was found to
be higher in rural than in urban areas. Over three fifths of rural children were
found to be underweight during the period 1985-1996. Like stunting, the decline
in under-nutrition was found to be higher in urban areas in both the period
1990-2000 (36.5 per cent) and 1990-2004 (32.4 per cent); however, it increased
by 6.5 per cent during 2000-2004. By contrast, though the prevalence of
underweight in rural areas declined steadily over the whole period, nearly half
the children were still found to be undernourished. These findings indicate the
necessity to undertake proper food and nutrition interventions for children in rural
areas to overcome the situation.
Regional settings
The study considers six divisions to examine the trends and differences in
child malnutrition across some of the country’s regions during the period
1996-2004. Significant differences were found in the malnutrition status by
division. Figure 14 shows that the greatest improvement in reducing stunting was
found in Khulna division, where the level of stunting declined to 31.3 per cent in
2004 from 56.5 per cent in 1996-1997, the current prevalence being below the
cut-off point of “very high” prevalence recommended by WHO. In Rajshahi
division, the prevalence of stunting was found to be just below the threshold point
in 2004. Though Dhaka and Chittagong division have improved communication
and infrastructure, chronic malnutrition was found to be over the threshold level.
The reason may be the high urbanization rate in the two industrialized divisions,
which relegate most of the children to unhealthy settings such as slums. In Sylhet
division, a rapid and steady decline was observed in the prevalence of stunting
between the periods 1996-1997 (61.4 per cent) and 2004 (46 per cent), although
the prevalence remained above the threshold.
In all the divisions, the prevalence of acute malnutrition decreased
tremendously in 1999-2000 (ranges from 9.3 per cent to 13.0 per cent) from 1996-
1997 (ranges from 13.5 per cent to 21.3 per cent) but increased slightly in 2004
Asia-Pacific Population Journal, Vol. 24, No. 2 69
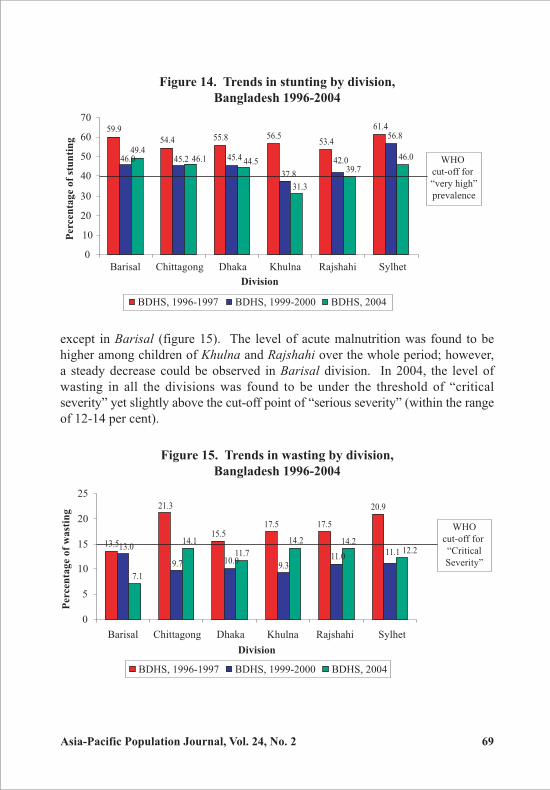
except in Barisal (figure 15). The level of acute malnutrition was found to be
higher among children of Khulna and Rajshahi over the whole period; however,
a steady decrease could be observed in Barisal division. In 2004, the level of
wasting in all the divisions was found to be under the threshold of “critical
severity” yet slightly above the cut-off point of “serious severity” (within the range
of 12-14 per cent).
Figure 14. Trends in stunting by division,
Bangladesh 1996-2004
Figure 15. Trends in wasting by division,
Bangladesh 1996-2004
59.9
54.4 55.8 56.553.4
61.4
46.0 42.049.4
46.045.2 45.4
56.8
37.8
46.139.7
31.3
44.5
0
10
20
30
40
50
60
70
Barisal Chittagong Dhaka Khulna Rajshahi Sylhet
Perc
en
tag
e o
f st
un
tin
g
BDHS, 1996-1997 BDHS, 1999-2000 BDHS, 2004
Division
WHO
cut-off for
“very high”
prevalence
13.5
21.3
15.517.5 17.5
20.9
9.7 10.09.3
11.0
14.1
11.7
14.2 14.2
11.113.0
7.1
12.2
0
5
10
15
20
25
Barisal Chittagong Dhaka Khulna Rajshahi Sylhet
Division
Perc
en
tag
e o
f w
ast
ing
BDHS, 1996-1997 BDHS, 1999-2000 BDHS, 2004
WHO
cut-off for
“Critical
Severity”
70 Asia-Pacific Population Journal, Vol. 24, No. 2
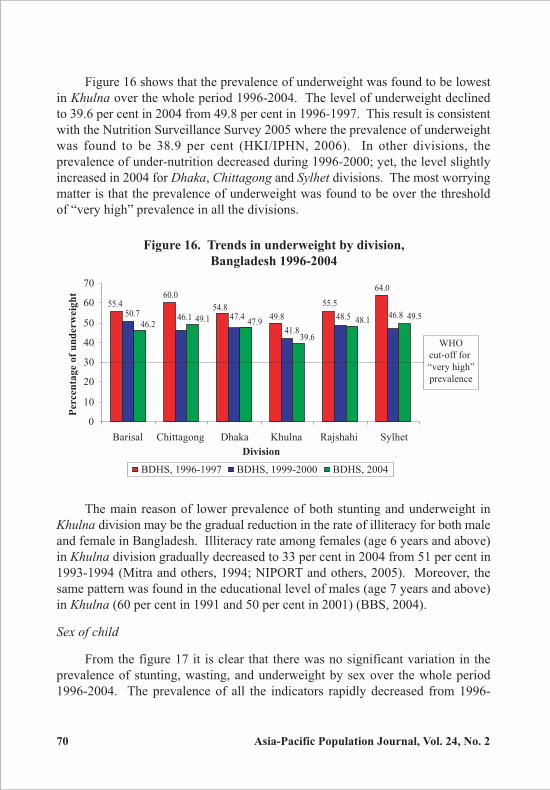
Figure 16 shows that the prevalence of underweight was found to be lowest
in Khulna over the whole period 1996-2004. The level of underweight declined
to 39.6 per cent in 2004 from 49.8 per cent in 1996-1997. This result is consistent
with the Nutrition Surveillance Survey 2005 where the prevalence of underweight
was found to be 38.9 per cent (HKI/IPHN, 2006). In other divisions, the
prevalence of under-nutrition decreased during 1996-2000; yet, the level slightly
increased in 2004 for Dhaka, Chittagong and Sylhet divisions. The most worrying
matter is that the prevalence of underweight was found to be over the threshold
of “very high” prevalence in all the divisions.
Figure 16. Trends in underweight by division,
Bangladesh 1996-2004
60.0
49.8
55.5
64.0
55.4 54.846.848.550.7 46.1 47.4
41.8
49.548.146.249.1 47.9
39.6
0
10
20
30
40
50
60
70
Barisal Chittagong Dhaka Khulna Rajshahi Sylhet
Division
Perc
en
tag
e o
f u
nd
erw
eig
ht
BDHS, 1996-1997 BDHS, 1999-2000 BDHS, 2004
WHO
cut-off for
“very high”
prevalence
The main reason of lower prevalence of both stunting and underweight in
Khulna division may be the gradual reduction in the rate of illiteracy for both male
and female in Bangladesh. Illiteracy rate among females (age 6 years and above)
in Khulna division gradually decreased to 33 per cent in 2004 from 51 per cent in
1993-1994 (Mitra and others, 1994; NIPORT and others, 2005). Moreover, the
same pattern was found in the educational level of males (age 7 years and above)
in Khulna (60 per cent in 1991 and 50 per cent in 2001) (BBS, 2004).
Sex of child
From the figure 17 it is clear that there was no significant variation in the
prevalence of stunting, wasting, and underweight by sex over the whole period
1996-2004. The prevalence of all the indicators rapidly decreased from 1996-
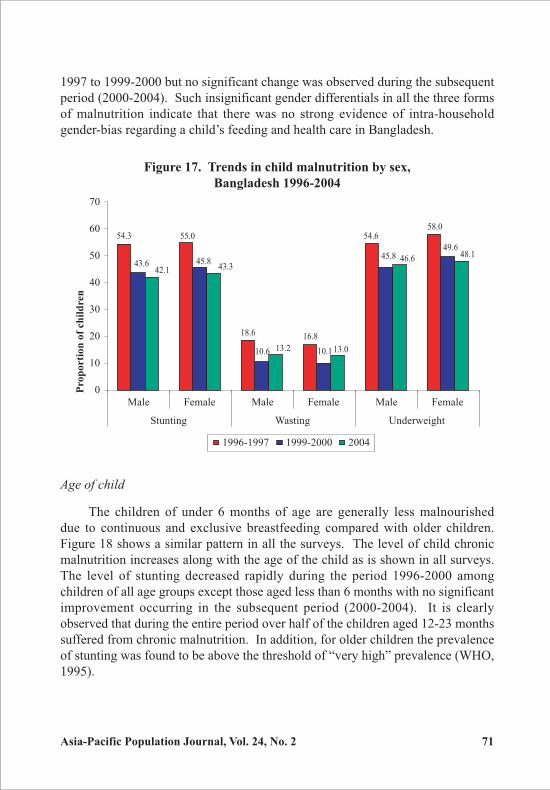
Asia-Pacific Population Journal, Vol. 24, No. 2 71
1997 to 1999-2000 but no significant change was observed during the subsequent
period (2000-2004). Such insignificant gender differentials in all the three forms
of malnutrition indicate that there was no strong evidence of intra-household
gender-bias regarding a child’s feeding and health care in Bangladesh.
Figure 17. Trends in child malnutrition by sex,
Bangladesh 1996-2004
54.3
18.6 16.8
54.658.0
55.0
43.6 45.8
49.645.8
10.110.6
42.1 43.3
48.146.6
13.013.2
0
10
20
30
40
50
60
70
Male Female Male Female Male Female
Stunting Wasting Underweight
Pro
po
rti
on
of
ch
ild
ren
1996-1997 1999-2000 2004
Age of child
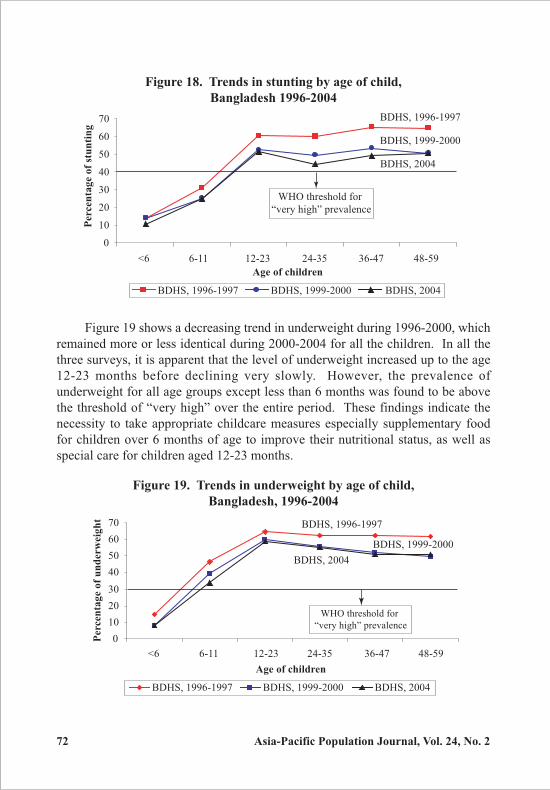
The children of under 6 months of age are generally less malnourished
due to continuous and exclusive breastfeeding compared with older children.
Figure 18 shows a similar pattern in all the surveys. The level of child chronic
malnutrition increases along with the age of the child as is shown in all surveys.
The level of stunting decreased rapidly during the period 1996-2000 among
children of all age groups except those aged less than 6 months with no significant
improvement occurring in the subsequent period (2000-2004). It is clearly
observed that during the entire period over half of the children aged 12-23 months
suffered from chronic malnutrition. In addition, for older children the prevalence
of stunting was found to be above the threshold of “very high” prevalence (WHO,
1995).
72 Asia-Pacific Population Journal, Vol. 24, No. 2
Figure 19 shows a decreasing trend in underweight during 1996-2000, which
remained more or less identical during 2000-2004 for all the children. In all the
three surveys, it is apparent that the level of underweight increased up to the age
12-23 months before declining very slowly. However, the prevalence of
underweight for all age groups except less than 6 months was found to be above
the threshold of “very high” over the entire period. These findings indicate the
necessity to take appropriate childcare measures especially supplementary food
for children over 6 months of age to improve their nutritional status, as well as
special care for children aged 12-23 months.
Figure 18. Trends in stunting by age of child,
Bangladesh 1996-2004
Figure 19. Trends in underweight by age of child,
Bangladesh, 1996-2004
BDHS, 1996-1997
BDHS, 1999-2000
BDHS, 2004
0
10
20
30
40
50
60
70
<6 6-11 12-23 24-35 36-47 48-59
Age of children
Perc
en
tag
e o
f u
nd
erw
eig
ht
BDHS, 1996-1997 BDHS, 1999-2000 BDHS, 2004
WHO threshold for
“very high” prevalence
BDHS, 1996-1997
BDHS, 1999-2000
BDHS, 2004
0
10
20
30
40
50
60
70
<6 6-11 12-23 24-35 36-47 48-59
Age of children
Perc
en
tag
e o
f st
un
tin
g
BDHS, 1996-1997 BDHS, 1999-2000 BDHS, 2004
WHO threshold for
“very high” prevalence
Asia-Pacific Population Journal, Vol. 24, No. 2 73
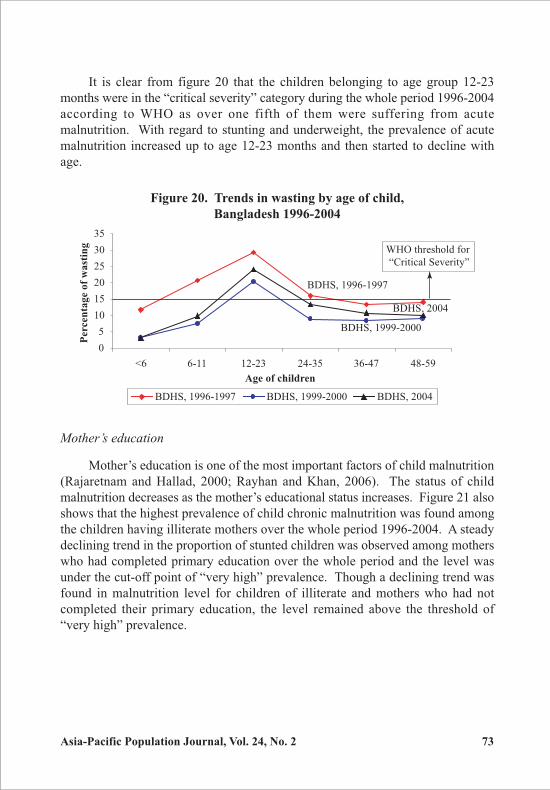
It is clear from figure 20 that the children belonging to age group 12-23
months were in the “critical severity” category during the whole period 1996-2004
according to WHO as over one fifth of them were suffering from acute
malnutrition. With regard to stunting and underweight, the prevalence of acute
malnutrition increased up to age 12-23 months and then started to decline with
age.
Figure 20. Trends in wasting by age of child,
Bangladesh 1996-2004
BDHS, 1996-1997
BDHS, 1999-2000
BDHS, 2004
0
5
10
15
20
25
30
35
<6 6-11 12-23 24-35 36-47 48-59
Age of children
Perc
en
tag
e o
f w
ast
ing
BDHS, 1996-1997 BDHS, 1999-2000 BDHS, 2004
WHO threshold for
“Critical Severity”
Mother’s education
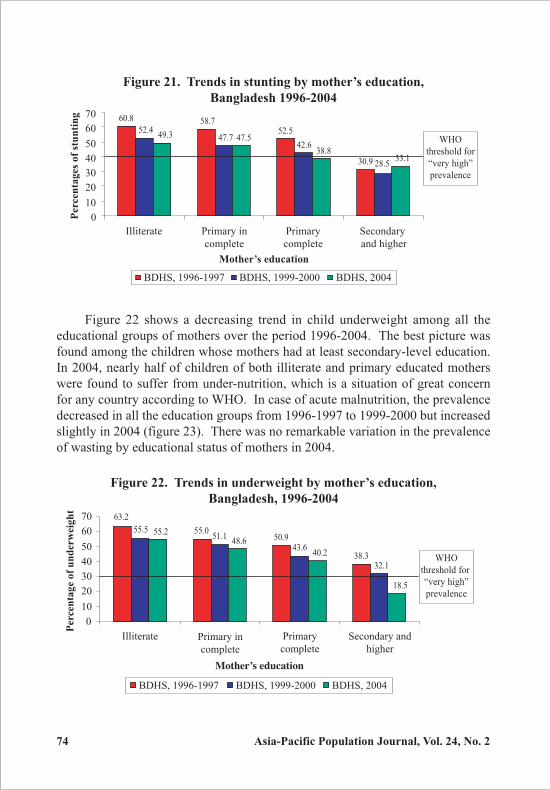
Mother’s education is one of the most important factors of child malnutrition
(Rajaretnam and Hallad, 2000; Rayhan and Khan, 2006). The status of child
malnutrition decreases as the mother’s educational status increases. Figure 21 also
shows that the highest prevalence of child chronic malnutrition was found among
the children having illiterate mothers over the whole period 1996-2004. A steady
declining trend in the proportion of stunted children was observed among mothers
who had completed primary education over the whole period and the level was
under the cut-off point of “very high” prevalence. Though a declining trend was
found in malnutrition level for children of illiterate and mothers who had not
completed their primary education, the level remained above the threshold of
“very high” prevalence.
74 Asia-Pacific Population Journal, Vol. 24, No. 2
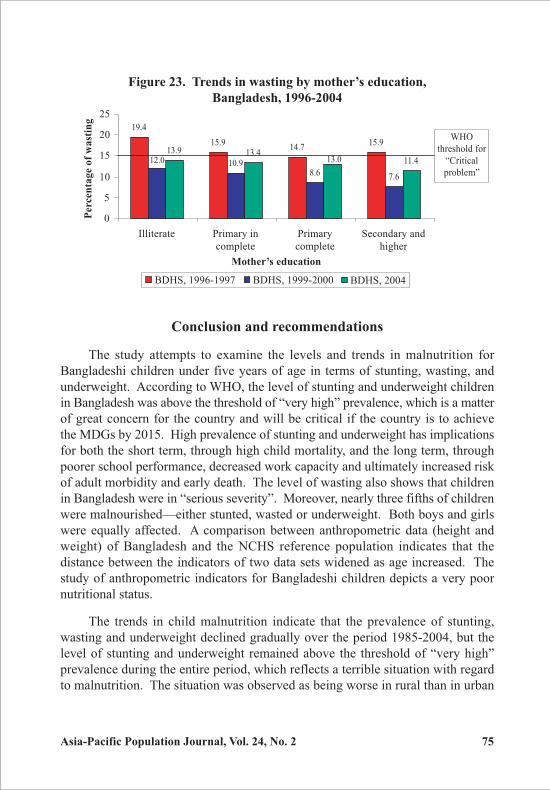
Figure 22 shows a decreasing trend in child underweight among all the
educational groups of mothers over the period 1996-2004. The best picture was
found among the children whose mothers had at least secondary-level education.
In 2004, nearly half of children of both illiterate and primary educated mothers
were found to suffer from under-nutrition, which is a situation of great concern
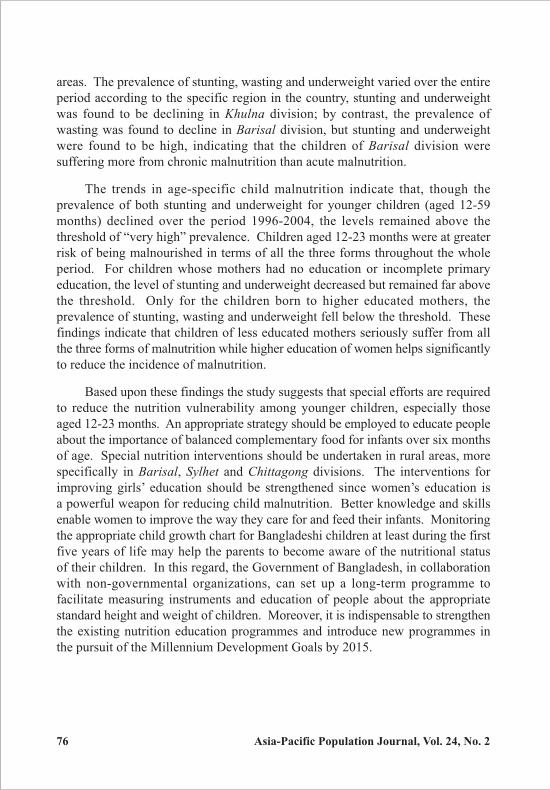
for any country according to WHO. In case of acute malnutrition, the prevalence
decreased in all the education groups from 1996-1997 to 1999-2000 but increased
slightly in 2004 (figure 23). There was no remarkable variation in the prevalence
of wasting by educational status of mothers in 2004.
Figure 21. Trends in stunting by mother’s education,
Bangladesh 1996-2004
60.8 58.752.5
30.9
52.4
42.6
28.5
49.3
33.1
47.7
38.8
47.5
0
10
20
30
40
50
60
70
Illiterate Primary in
complete
Primary
complete
Secondary
and higher
Mother’s education
Perc
en
tag
es
of
stu
nti
ng
BDHS, 1996-1997 BDHS, 1999-2000 BDHS, 2004
WHO
threshold for
“very high”
prevalence
Figure 22. Trends in underweight by mother’s education,
Bangladesh, 1996-2004
63.2
55.050.9
38.3
55.551.1
43.6
32.1
48.6
40.2
18.5
55.2
0
10
20
30
40
50
60
70
Illiterate Primary in
complete
Primary
complete
Secondary and
higher
Mother’s education
Per
cen
tag
e o
f u
nd
erw
eig
ht
BDHS, 1996-1997 BDHS, 1999-2000 BDHS, 2004
WHO
threshold for
“very high”
prevalence
Asia-Pacific Population Journal, Vol. 24, No. 2 75
Conclusion and recommendations
The study attempts to examine the levels and trends in malnutrition for
Bangladeshi children under five years of age in terms of stunting, wasting, and
underweight. According to WHO, the level of stunting and underweight children
in Bangladesh was above the threshold of “very high” prevalence, which is a matter
of great concern for the country and will be critical if the country is to achieve
the MDGs by 2015. High prevalence of stunting and underweight has implications
for both the short term, through high child mortality, and the long term, through
poorer school performance, decreased work capacity and ultimately increased risk
of adult morbidity and early death. The level of wasting also shows that children
in Bangladesh were in “serious severity”. Moreover, nearly three fifths of children
were malnourished—either stunted, wasted or underweight. Both boys and girls
were equally affected. A comparison between anthropometric data (height and
weight) of Bangladesh and the NCHS reference population indicates that the
distance between the indicators of two data sets widened as age increased. The
study of anthropometric indicators for Bangladeshi children depicts a very poor
nutritional status.
The trends in child malnutrition indicate that the prevalence of stunting,
wasting and underweight declined gradually over the period 1985-2004, but the
level of stunting and underweight remained above the threshold of “very high”
prevalence during the entire period, which reflects a terrible situation with regard
to malnutrition. The situation was observed as being worse in rural than in urban
Figure 23. Trends in wasting by mother’s education,
Bangladesh, 1996-2004
19.4
15.914.7
15.9
12.0 10.98.6 7.6
13.9 13.413.0 11.4
0
5
10
15
20
25
Illiterate Primary in
complete
Primary
complete
Secondary and
higher
Mother’s education
Perc
en
tag
e o
f w
ast
ing
BDHS, 1996-1997 BDHS, 1999-2000 BDHS, 2004
WHO
threshold for
“Critical
problem”
76 Asia-Pacific Population Journal, Vol. 24, No. 2
areas. The prevalence of stunting, wasting and underweight varied over the entire
period according to the specific region in the country, stunting and underweight
was found to be declining in Khulna division; by contrast, the prevalence of
wasting was found to decline in Barisal division, but stunting and underweight
were found to be high, indicating that the children of Barisal division were
suffering more from chronic malnutrition than acute malnutrition.
The trends in age-specific child malnutrition indicate that, though the
prevalence of both stunting and underweight for younger children (aged 12-59
months) declined over the period 1996-2004, the levels remained above the
threshold of “very high” prevalence. Children aged 12-23 months were at greater
risk of being malnourished in terms of all the three forms throughout the whole
period. For children whose mothers had no education or incomplete primary
education, the level of stunting and underweight decreased but remained far above
the threshold. Only for the children born to higher educated mothers, the
prevalence of stunting, wasting and underweight fell below the threshold. These
findings indicate that children of less educated mothers seriously suffer from all
the three forms of malnutrition while higher education of women helps significantly
to reduce the incidence of malnutrition.
Based upon these findings the study suggests that special efforts are required
to reduce the nutrition vulnerability among younger children, especially those
aged 12-23 months. An appropriate strategy should be employed to educate people
about the importance of balanced complementary food for infants over six months
of age. Special nutrition interventions should be undertaken in rural areas, more
specifically in Barisal, Sylhet and Chittagong divisions. The interventions for
improving girls’ education should be strengthened since women’s education is
a powerful weapon for reducing child malnutrition. Better knowledge and skills
enable women to improve the way they care for and feed their infants. Monitoring
the appropriate child growth chart for Bangladeshi children at least during the first
five years of life may help the parents to become aware of the nutritional status
of their children. In this regard, the Government of Bangladesh, in collaboration
with non-governmental organizations, can set up a long-term programme to
facilitate measuring instruments and education of people about the appropriate
standard height and weight of children. Moreover, it is indispensable to strengthen
the existing nutrition education programmes and introduce new programmes in
the pursuit of the Millennium Development Goals by 2015.
Asia-Pacific Population Journal, Vol. 24, No. 2 77
References
Bangladesh Bureau of Statistics (BBS) (1987). Report of Child Nutrition Status Module, in Bangladesh
Household Expenditure Survey 1985-86, BBS, Government of the People’s Republic of
Bangladesh, Dhaka.
________ (1991). Child Nutrition Status Survey, in Bangladesh Household Expenditure Survey
1989-90, BBS, Government of the People’s Republic of Bangladesh, Dhaka.
________ (1994). Child Nutrition Survey of Bangladesh 1992, BBS, Statistics Division, Ministry of
Planning, Government of the People’s Republic of Bangladesh, Dhaka and UNICEF.
________ (1997). Child Nutrition Survey of Bangladesh 1995-1996, BBS, Statistics Division, Ministry
of Planning, Government of the People’s Republic of Bangladesh, Dhaka and UNICEF.
________ (2004). Statistical Pocketbook of Bangladesh 2002, BBS, Statistics Division, Ministry of
Planning, Government of the People’s Republic of Bangladesh, Dhaka and UNICEF.
BBS-UNICEF (2002). Child Nutrition Survey of Bangladesh 2000, Dhaka, BBS, Statistics Division,
Ministry of Planning, Government of the People’s Republic of Bangladesh and United
Nations Children’s Fund.
de Onis, M., E.A. Frongillo, and M. Blossner (2000). “Is Malnutrition Declining? An analysis of
changes in levels of child malnutrition since 1980”, Bulletin of the World Health
Organization, vol. 78, No. 10, pp. 1222-1233.
Food and Agriculture Organization (FAO) (1999). FAO–Nutrition Country Profile of Bangladesh,
Rome, Italy.
Gibson, S.R. (1990). Anthropometric Assessment, in Principles of Nutritional Assessment, pp. 155-
207, Oxford University Press, New York, Oxford.
Graitcher, P.L. and E.M. Gentry (1981). “Measuring children: one reference for all”, Lancet, No. ii,
pp. 297-299.
Grummer-Strawn, L.M. (2002). The use of NCHS and CDC growth charts in nutritional assessment
of young infants: A white paper prepared for the Food Advisory Committee on Infant
Formula Food and Drug Administration, Atlanta, Georgia: Maternal and Child Nutrition
Branch, Centers for Disease Control and Prevention, CDC Growth Chart Working Group.
Helen Keller International/Institute of Public Health Nutrition (HKI/IPHN) (2006). “Trends in child
malnutrition, 1990 to 2005: Declining rates at national level mask inter-regional and
socioeconomic differences”, Nutrition Surveillance Project Bulletin No. 19, Dhaka,
Bangladesh.
Mitra, S.N., M. Nawab Ali, S. Islam, A.R. Cross, T. Shaha (1994). Bangladesh Demographic and
Health Survey 1993-94, Calverton, Maryland and Dhaka, Bangladesh; NIPORT, Mitra and
Associates, and Macro International.
Mitra, S.N., A. Al-Sabir, A.R. Cross, and K. Jamil (1997). Bangladesh Demographic and Health Survey
1996-97, Calverton, Maryland and Dhaka, Bangladesh; NIPORT, Mitra and Associates, and
Macro International.
Ministry of Women and Children Affairs (MWCA) (2005). National Plan of Action for Children—
Bangladesh for 2004-2009, Dhaka, Government of the People’s Republic of Bangladesh.
78 Asia-Pacific Population Journal, Vol. 24, No. 2
Martorell, R. (1985). “Child growth retardation: A discussion of its causes and of its relationship to
health”, in K.L. Blaxter, J.C.Waterlow, eds., Nutritional Adaptation in Man, London, John
Libbey, pp. 13-30.
National Institute of Population Research and Training (NIPORT, Bangladesh), Mitra and Associates,
and ORC Macro (2001). Bangladesh Demographic and Health Survey 1999-2000,
Calverton, Maryland and Dhaka Bangladesh, NIPORT, Mitra and Associates, and ORC
Macro.
________ (2005). Bangladesh Demographic and Health Survey 2004, Calverton, Maryland and Dhaka
Bangladesh, NIPORT, Mitra and Associates, and ORC Macro.
Pelletier, D.L., E.A. Frongillo, D.G. Schroeder, J.P. Habicht (1995). “The effects of malnutrition on
child mortality in developing countries”, Bulletin of the World Health Organization,
vol. 73, pp. 443-448.
Rajaretnam, T. and J.S. Hallad (2000). “Determinant of nutritional status of young children India:
Analysis of 1992-93 NFHS Data”, Demography India, vol. 29, No. 2, pp. 179-200.
Rayhan, M.I., and M.S.H. Khan (2006). “Factors causing malnutrition among under five children in
Bangladesh”, Pakistan Journal of Nutrition, vol. 5, No. 6, pp. 558-562.
Stephenson, L.S., M.C. Latham, and A. Jansen (1983). “A comparison of growth standards: Similarities
between NCHS, Harvard, Denver and privileged African children and difference with
Kenyan rural children”, Cornell International Nutrition Monograph Series Number 12.
United Nations (UN) (2001). A World fit for Children, Revised draft outcome, Preparatory Committee
for the Special Session of the General Assembly on Children, New York.
________ (1990). Strategy for Improved Nutrition of Children and Women in Developing Countries,
New York.
________ (1998). The State of the World’s Children 1998, Malnutrition: Causes, Consequences and
Solutions, New York.
________ (2002). The State of the World’s Children 2002: Leadership, New York.
________ (2003). Strategy to Reduce Maternal and Child Under-nutrition, Health and Nutrition
Working Paper, Bangkok, UNICEF East Asia & Pacific Regional Office.
________ (2006). The State of the World’s Children 2006: Excluded and Invisible, New York.
________ (2008). www.childinfo.org: Malnutrition, accessed on April 2008 from <http://www.
childinfo.org/areas/malnutrition/>.
World Health Organization (WHO) (1983). Measuring Change in Nutritional Status: Guidelines for
Assessing the Nutritional Impact of Supplementary Feeding Programmes, (Geneva, WHO).
________ (1992). Report on the Consultation on Rapid Nutrition Assessment in Emergencies,
Alexandria, World Health Organization Eastern Mediterranean Regional Office
(Unpublished document WHO-EM/NUT/114-E/L, available on request for Nutrition).
________ (1995). Physical Status: The Use and Interpretation of Anthropometry, WHO technical
report series 854, Geneva.
Related Documents