Lessons Learned from PPP Project Preparation and Implementation Ed Farquharson April 2008

Welcome message from author
This document is posted to help you gain knowledge. Please leave a comment to let me know what you think about it! Share it to your friends and learn new things together.
Transcript
Lessons Learned from PPP Project Preparation and Implementation
Ed FarquharsonApril 2008
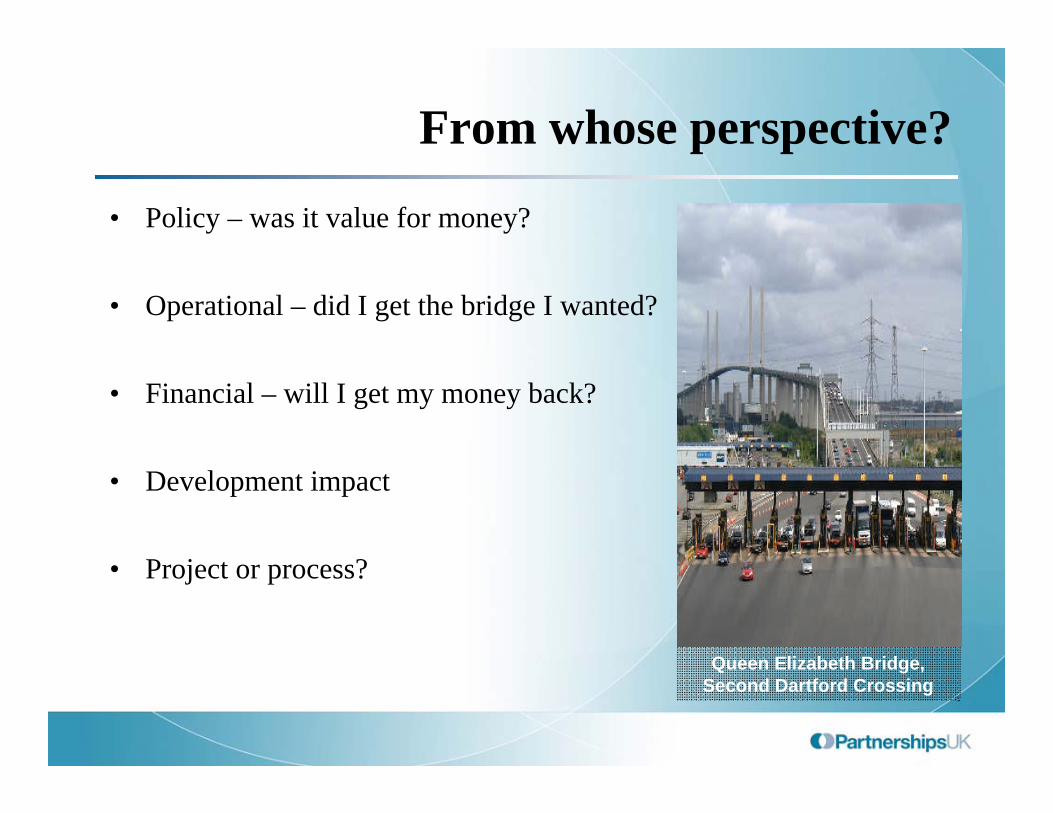
From whose perspective?
• Policy – was it value for money?
• Operational – did I get the bridge I wanted?
• Financial – will I get my money back?
• Development impact
• Project or process?
Queen Elizabeth Bridge, Second Dartford Crossing

Content
• Background: Example of a PPP programme - UK
• Evaluation Tools and Processes
• Evidence and Lessons learned

Background
M6 Toll

OGC
Auditing bodiese.g. National Audit Office
Department Private Finance Units
UK PPP policy & implementation bodies
HM Treasury
PPP PolicyOther key support bodies
e.g. 4psPPP support to Local
AuthoritiesPartnerships UK
PPP Implementation
Partnerships for SchoolsPDO
Scottish GovtFinancial Partnerships Unit

Snapshot
• Delivered £50bn + of capital investment in the UK
• 860 projects, 675 operational• PPPs now a global market• PPP models evolving over
time
HM Treasury

** excl London Underground
UK PPP Sector analysis
111
213
5135
269
21
82
13 7
63
0
50
100
150
200
250
300
Number of projects
Acco
mm
odat
ion
Educ
atio
nEn
viron
men
t
Equi
pmen
t
Hea
lth
Hou
sing ICT
Leisu
re S
ervic
es
Prop
erty
Tran
spor
t**
Sectors
Number of Deals Grouped By Sector

Signed Projects and Capital Value by Financial Year
Source: HM Treasury
Evaluation Tools and Processes
Nottingham Trams
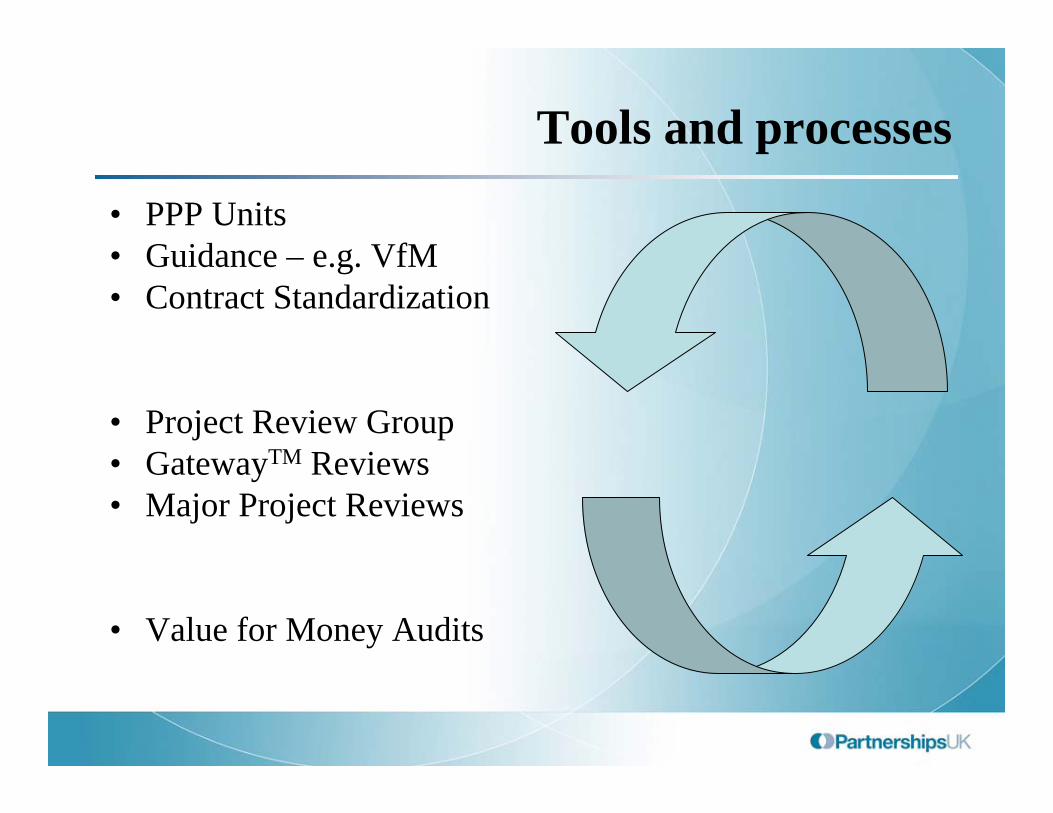
Tools and processes
• PPP Units• Guidance – e.g. VfM• Contract Standardization
• Project Review Group• GatewayTM Reviews• Major Project Reviews
• Value for Money Audits

Outline Business Case
1. Programme, project, procurement level review (scope, term)
2. Clarity of requirements3. Design Quality4. Risk Allocation5. Key Terms and Conditions6. Indication of commercial interest7. Affordability8. Suitability of Proposed Advisers9. Indicative Timetable10. Project Team11. Commitment of Sponsors/Users12. Statutory Processes
Value for MoneyAssessment
Commercial Interest Assessment
Project Management Assessment
Affordability Assessment
Can the project be delivered?
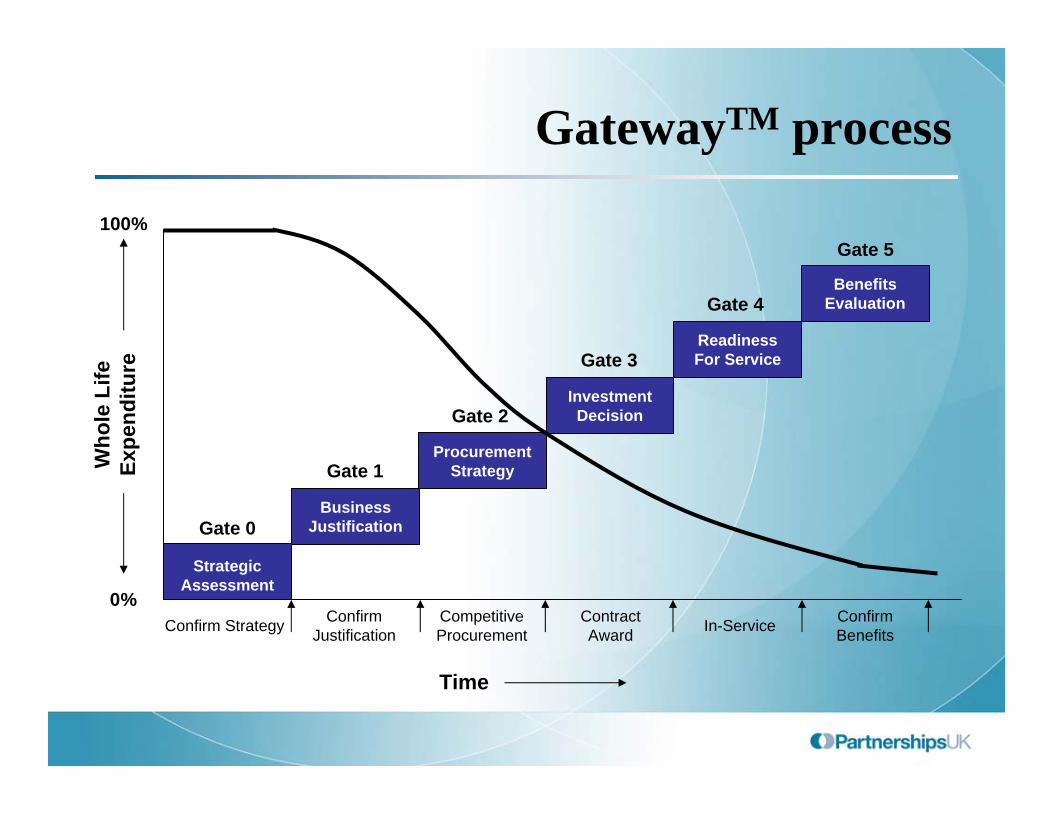
GatewayTM process
100%
Who
le L
ife
Expe
nditu
re
Confirm Strategy Confirm Justification
Competitive Procurement In-Service Confirm
Benefits
Time
Strategic Assessment
Contract Award
0%
Gate 0
Gate 1
Gate 2
Gate 3
Gate 4
Gate 5
ProcurementStrategy
InvestmentDecision
ReadinessFor Service
BenefitsEvaluation
BusinessJustification

Evaluation matrix: Key management themes
• Fitting business requirements• PFI is the appropriate delivery mechanism• Stakeholder support• Good quality project management• Optimal balance between cost, quality and flexibility• Effective risk allocation and management
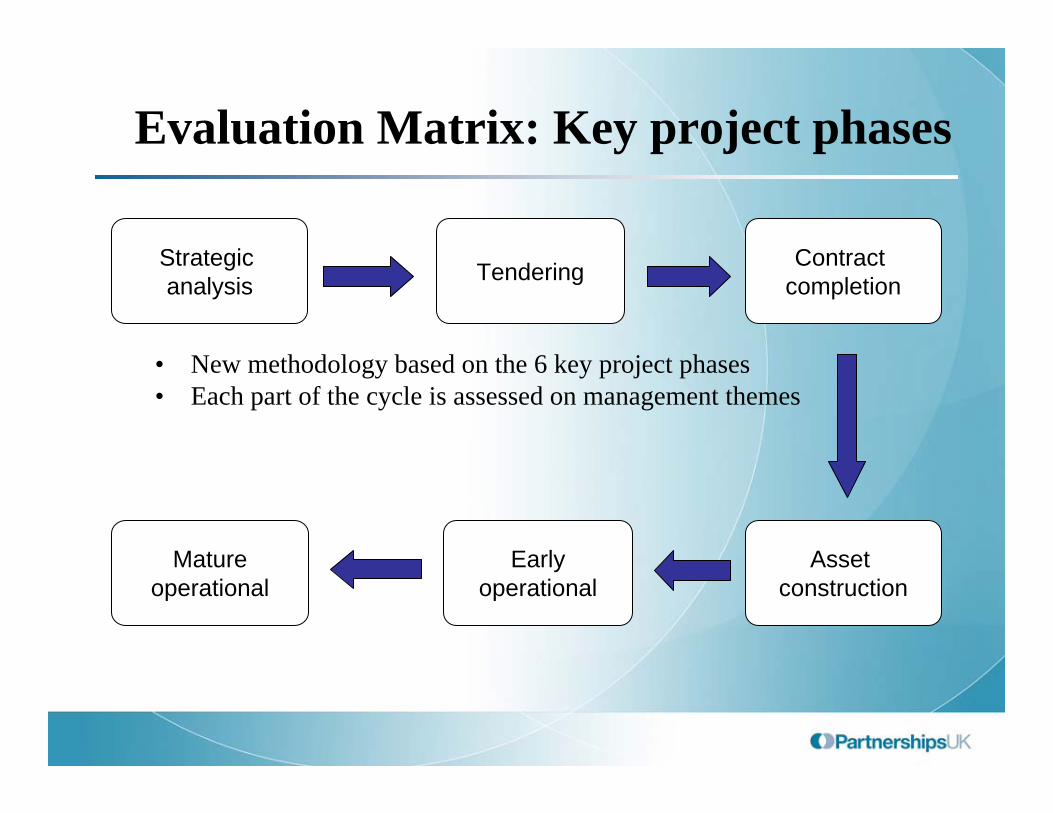
Evaluation Matrix: Key project phases
• New methodology based on the 6 key project phases• Each part of the cycle is assessed on management themes
Strategic analysis Tendering
Earlyoperational
Asset construction
Contract completion
Matureoperational

The Evaluation Matrix – a shortened version
ProceduresUpdated
Risk Transfer Sticks
Mitigation and Updating
Risk TransferAgreed
Optimum transfer of risk
Risks AssessedRiskManagement
Good Quality but Affordable
Deal remains affordable
Changes made are VFM
Price quality & finance good
Good quality bids received
Groundwork for Solution
Cost, Quality& Flexibility
Right skills & Relationships
Governance & Relationships
Evaluate pastPlan future
Getting thebest deal
Structures areEffective
Project structuresGood qualityManagement
Continue to review Review level of satisfaction
Kept informed of progress
Support for agreed deal
Key partiescommitted
A Strategy to Communicate
StakeholderSupport
Assess if deal is delivering
Consider termination if poor delivery
Continue baselining
Review that PFI is right
Performance is baselined, Bids innovate
Clear case forPFI in OBC
PFI the rightMechanism
Services meet Core Business Requirements
Contract met, Asset is fit for purpose
Asset delivery as specified
Right contract reflects the requirements
Bidders given rigorous specifications
The right project has been selected
Fit withBusiness Requirement
MatureOperational
EarlyOperational
ImplementContractcompletion
TenderingStrategicAnalysis
Source: NAO www.nao.org.uk/publications/nao_reports/05-06/Framework_PFI_Projects_i.pdf

British Embassy, Berlin
Evidence and Lessons Learned

Evidence of delivery - construction
PPP can deliver projects effectively (right time and right cost)
Construction IndustryPPP
n/an/a8%Over 2 months late
37%70%24%Late to public sector
45%73%22%Exceeds price agreed in the contract
(2005)(2001)(2003)
Source: National Audit Office

• Public sector managers report 96% of projects performing at least satisfactorily, with 66% at a very good/good standard.
• Users believe service standards being delivered always or almost always in 80% of projects
• 97% of managers rated the relation with their private sector counterpart as satisfactory or better with 72% rating it very good/good
Source: PUK Operational Projects Report 2006
Operational performance has been good

Benefits achieved
• Delivered tangible improvement in public services
• Introduced a more strategic approach to infrastructure investment
• Made people think about whole life cost• Developed greater capacity and
competition in the supply markets• Developed efficient capital markets• Improved the public sector client
capability• Improved the quality of procurements Brentside School
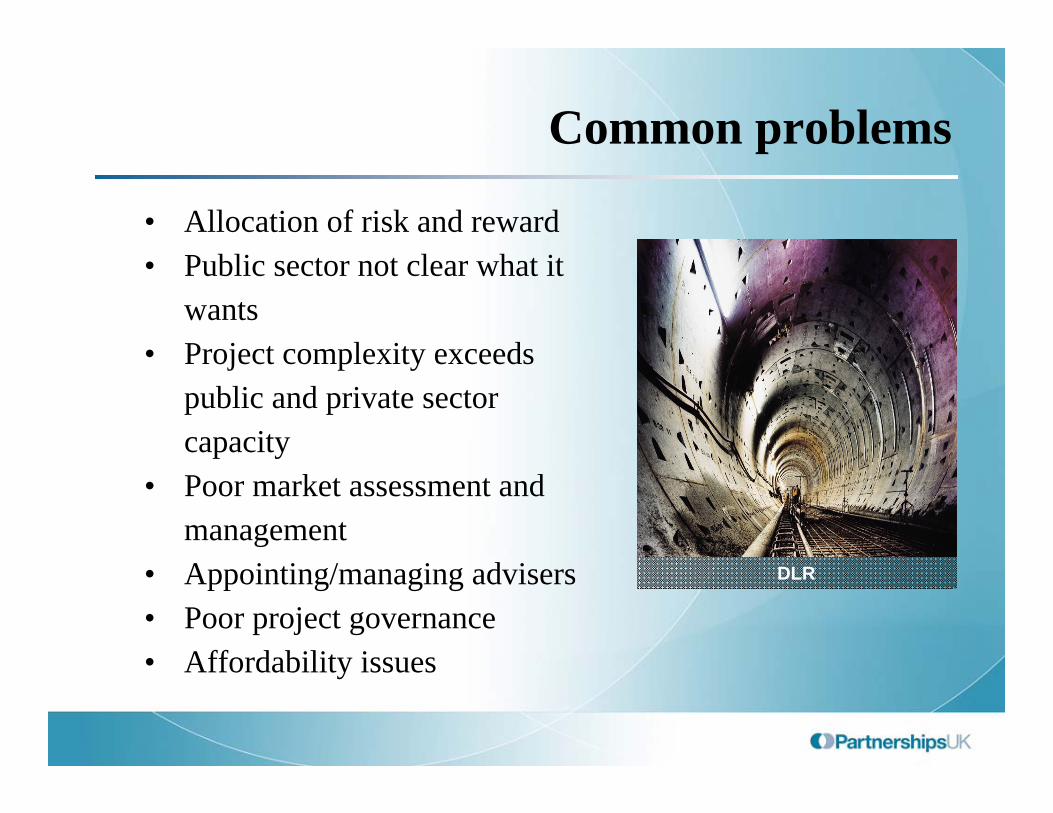
Common problems
• Allocation of risk and reward• Public sector not clear what it
wants• Project complexity exceeds
public and private sector capacity
• Poor market assessment and management
• Appointing/managing advisers• Poor project governance• Affordability issues
DLR
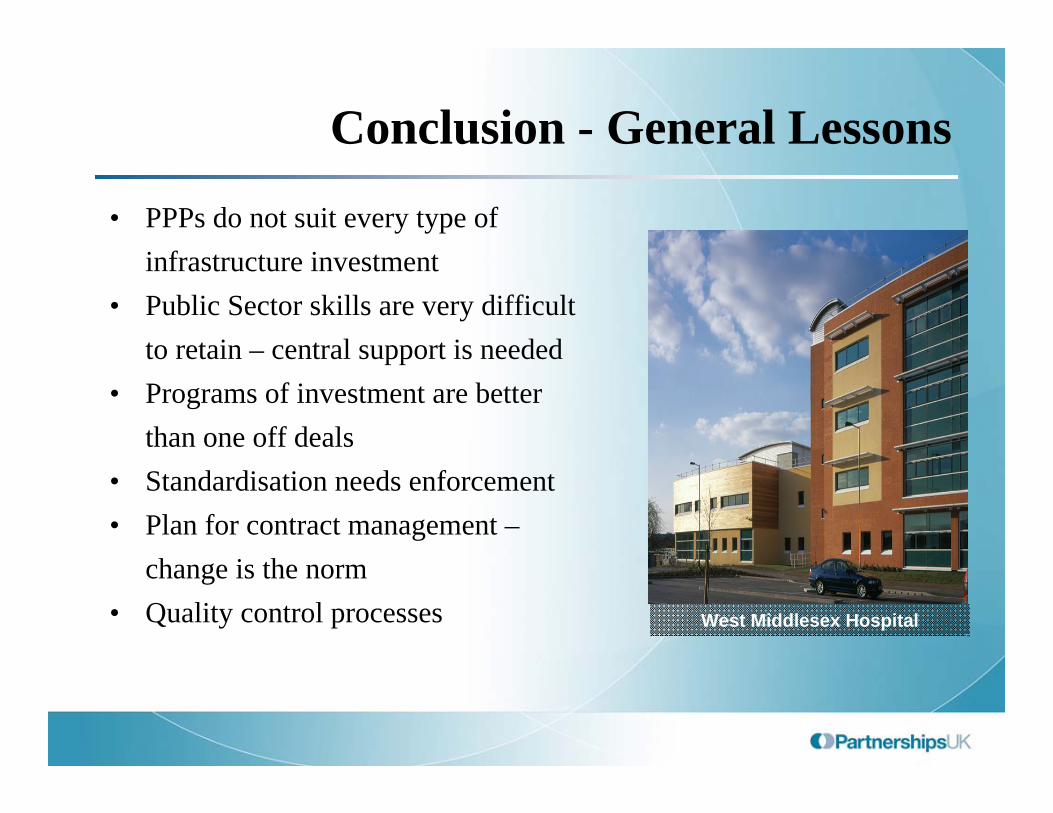
Conclusion - General Lessons
• PPPs do not suit every type of infrastructure investment
• Public Sector skills are very difficult to retain – central support is needed
• Programs of investment are better than one off deals
• Standardisation needs enforcement• Plan for contract management –
change is the norm• Quality control processes West Middlesex Hospital
Related Documents