ONLIN ONLINE ONLINE ONLINE ONLINE ONLINE ONLINE ONLINE OPEN ACCESS EN ACCESS OPEN ACCESS R-REVIEWD PEER-REVIEWD PEER-REVIEW PEER-REVIEWD -REVIEWD P PEER-REVIEW PEER-REVIEWD PEER-REVIEWD PEER-REVIEWD DS JOURNAL HIV/AIDS JOURNAL HIV/AIDS JOURNAL HIV/AIDS JOURNAL AIDS JOURNAL ONLINE E ONLIN O ACCESS OPEN ACCESS OPEN ACCESS N ACCESS OPEN A CCE OPEN ACCESS O OPEN ACCESS OPEN A C PEE PEER-REVIEWD PEER-REVIEWD URNAL HIV/AIDS JOURNAL HIV/AIDS JOURNAL HIV/AIDS JOURN HIV/AIDS JOURNAL HIV/AIDS JOURNAL HIV/A HIV/AIDS JOUR HIV/AIDS JOURNAL HIV/AIDS JOURNAL HIV/AIDS JOURN Volume 19, Supplement 4 July 2016 Scan this QR code with your mobile device to view the special issue online Lessons learned and study results from HIVCore, an HIV implementation science initiative Guest Editors: Naomi Rutenberg and Waimar Tun Supplement Editors: Iryna Zablotska and Marlène Bras 2014 35% 2015 55% 2016 82% AIDS OPERATIONS RESEARCH INTERVENTION HEALTH INFORMATION PMTCT TREATMENT CASCADE RETENTION IN CARE ADHERENCE CONTINUUM OF CARE PEPFAR RETENTION IN CARE ADHERENCE 40 % 7% 5% 9% 39%

Welcome message from author
This document is posted to help you gain knowledge. Please leave a comment to let me know what you think about it! Share it to your friends and learn new things together.
Transcript
ONLINE
ONLINE ONLINE
ONLINEONLINE
ONLINE
ON
LINE
ONLINE
ON
LINE
ONLINE
OPEN ACCESS
OPEN
AC
CESS
OPEN ACCESS
OPEN ACCESS
OPEN ACCESS
OPEN
AC
CESS
OPEN
AC
CESS
PEER-R
EVIEW
D
PEER-REVIEWDPEER-REVIEWD
PEER-REVIEWD
PEER-REVIEWD PEER-REVIEWDPEER-REVIEWD
PEER-R
EVIEW
D
PEER
-REV
IEW
D
PEER-REVIEWD
PEER-REVIEWD
PEER
-REV
IEW
D
PEER-REVIEWD
PEER-R
EVIEW
D
PEER-REVIEWD
PEER-REVIEWD
PEER-REVIEWDPEER-REVIEWD
PEER-REVIEWD
PEER
-REV
IEW
D
PEER-REVIEWD
PEER-REVIEWD
PEER
-REV
IEW
D
PEER-REVIEWD
PEER-REVIEWD
PEER-REVIEWDPEER-REVIEWD
PEER-REVIEWD
PEER-REVIEWD
PEER-REVIEWD
PEER-REVIEWD
HIV/AIDS JOURNAL
HIV/AIDS JOURNALHIV/AIDS JOURNAL
HIV/AIDS JOURNAL
HIV/AIDS JOURNAL
HIV/AIDS JOURNAL
HIV/AIDS JOURNAL ONLINEONLINE
ON
LINEO
NLI
NE
ONLINE
ONLINE
ON
LINEONLINEONLINE
ONLINE
ON
LINE
ONLINEONLINEONLINE
ONLINE ONLINE
ON
LIN
E
ONLINE
ON
LIN
E
ONLINE OPEN ACCESS
OPE
N A
CC
ESS
OPEN ACCESSOPEN ACCESS
OPEN ACCESSOPEN ACCESS
OPEN ACCESSOPEN ACCESS OPEN ACCESS
OPEN ACCESS
OPE
N A
CC
ESS
OPEN
AC
CESS
OPEN ACCESS
OPEN ACCESS
OPEN ACCESS
OPEN
AC
CESS
OPEN ACCESS
OPE
N A
CC
ESS
OPEN ACCESS
PEER
-REV
IEW
D
PEER-REVIEWDPEER-REVIEWD
HIV/AIDS JOURNALPEER-REVIEWD
HIV/AIDS JOURNAL
HIV/AIDS JOURNAL
HIV/AIDS JOURNAL
HIV
/AID
S JO
UR
NA
LHIV/AIDS JOURNAL HIV/AIDS JOURNAL
HIV/AIDS JOURNAL
HIV/AIDS JOURNAL
HIV/AIDS JOURNAL
HIV/AIDS JOURNAL
HIV/AIDS JOURNALHIV/AIDS JOURNAL
HIV/AIDS JOURNAL
HIV/AIDS JOURNAL
HIV/AIDS JOURNAL
HIV/AIDS JOURNALHIV/AIDS JOURNAL
HIV/AIDS JOURNAL
HIV/AIDS JOURNAL
HIV/AIDS JOURNAL
HIV/AIDS JOURNAL
HIV/AIDS JOURNAL
Volume 19, Supplement 4July 2016
Scan this QR code with your mobile device to view the special issue online
Lessons learned and study results from HIVCore, an HIV implementation science initiativeGuest Editors: Naomi Rutenberg and Waimar Tun Supplement Editors: Iryna Zablotska and Marlène Bras
2014
35%
2015
55%
2016
82%
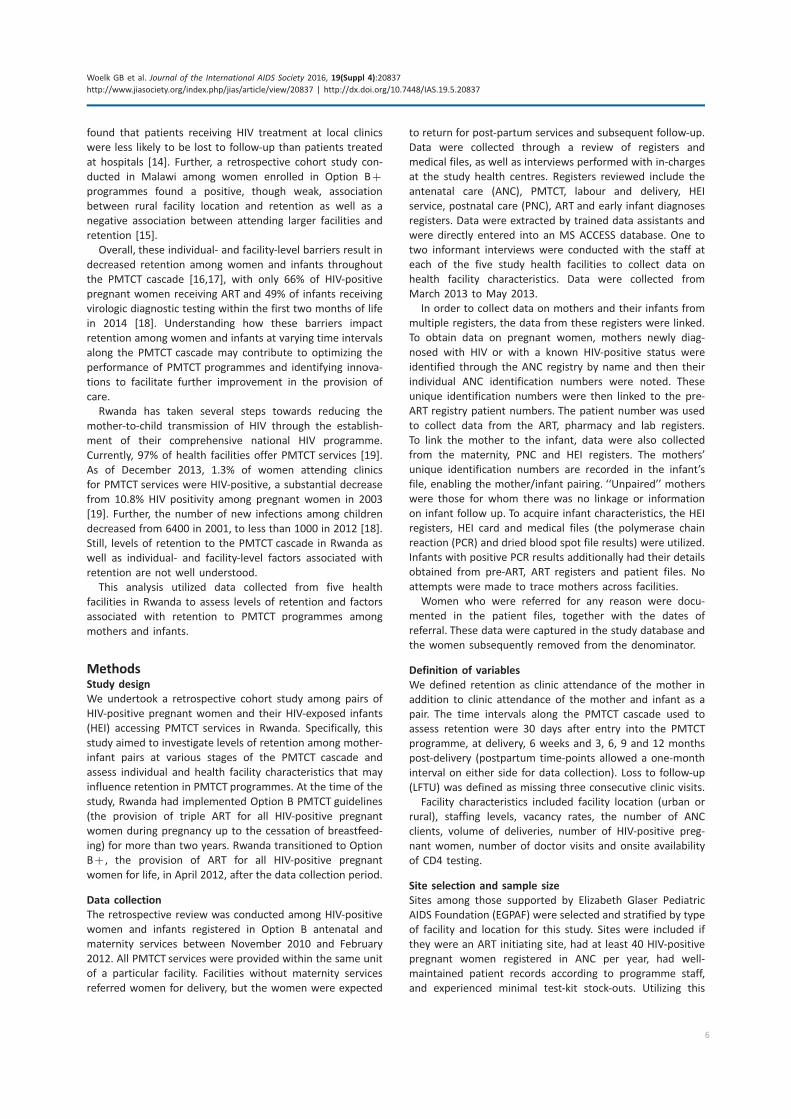
AIDSOPERATIONS RESEARCHINTERVENTIONHEALTH INFORMATIONPMTCTTREATMENT CASCADERETENTION IN CAREADHERENCECONTINUUM
OF CAREPEPFAR
RETENTION IN CARE
ADHERENCE
Lessons learned and study results from HIVCore, an HIV implementation science initiativeGuest Editors: Naomi Rutenberg and Waimar Tun Supplement Editors: Iryna Zablotska and Marlène Bras
40%7%
5%
9%
39%
Volume 19, Supplement 4July 2016
Scan this QR code with your mobile device to view the special issue online

SupportThis supplement was made possible through support provided by the President’s Emergency Plan for AIDS Relief and the U.S. Agency for International Development (USAID) via HIVCore, a Task Order funded by USAID under the Project SEARCH indefinite quantity contract (Contract No. AID-OAA-TO-11-00060). The authors’ views expressed in this report do not necessarily reflect the views of USAID or the United States Government.
Volume 19, Supplement 4 July 2016
http://www.jiasociety.org/index.php/jias/issue/view/1482
Lessons learned and study results from HIVCore, an HIV implementation science initiativeGuest Editors: Naomi Rutenberg and Waimar Tun Supplement Editors: Iryna Zablotska and Marlène Bras
ContentsEditorial: Lessons learned and study results from HIVCore: an HIV implementation science initiativeNaomi Rutenberg, Waimar Tun and Nagesh N Borse 1
Retention of mothers and infants in the prevention of mother-to-child transmission of HIV programme is associated with individual and facility-level factors in RwandaGodfrey B Woelk, Dieudonne Ndatimana, Sally Behan, Martha Mukaminega, Epiphanie Nyirabahizi, Heather J Hoffman, Placidie Mugwaneza, Muhayimpundu Ribakare, Anouk Amzel and B Ryan Phelps 5
Factors associated with long-term antiretroviral therapy attrition among adolescents in rural Uganda: a retrospective studyStephen Okoboi, Livingstone Ssali, Aisha I Yansaneh, Celestin Bakanda, Josephine Birungi, Sophie Nantume, Joanne Lyavala Okullu, Alana R Sharp, David M Moore and Samuel Kalibala 16
Limited accessibility to HIV services for persons with disabilities living with HIV in Ghana, Uganda and ZambiaWaimar Tun, Jerry Okal, Katie Schenk, Selina Esantsi, Felix Mutale, Rita Kusi Kyeremaa, Edson Ngirabakunzi, Hilary Asiah, Charlotte McClain-Nhlapo and Grimond Moono 23
Reducing HIV-related risk and mental health problems through a client-centred psychosocial intervention for vulnerable adolescents in Addis Ababa, EthiopiaNrupa Jani, Lung Vu, Lynnette Kay, Kassahun Habtamu and Samuel Kalibala 30
Results from a rapid national assessment of services for the prevention of mother-to-child transmission of HIV in Côte d’IvoireS Adam Granato, Stephen Gloyd, Julia Robinson, Serge A Dali, Irma Ahoba, David Aka, Seydou Kouyaté, Doroux A Billy, Samuel Kalibala and Ahoua Koné 37
Assessment of linkages from HIV testing to enrolment and retention in HIV care in Central MozambiqueCelso Azarias Inguane, Stephen Gloyd, João Luis Manuel, Charlene Brown, Vincent Wong, Orvalho Augusto, Wisal Mustafa Hassan, Lúcia Vieira, Pires Afonso, Mehol Jamnadás, Jama Joy Bernard, James Cowan, Samuel Kalibala and James Pfeiffer 45
Annual cost of antiretroviral therapy among three service delivery models in UgandaLung Vu, Samuel Waliggo, Brady Zieman, Nrupa Jani, Lydia Buzaalirwa, Stephen Okoboi, Jerry Okal, Nagesh N Borse and Samuel Kalibala 53
Opportunities and challenges in conducting secondary analysis of HIV programmes using data from routine health information systems and personal health informationStephen Gloyd, Bradley H Wagenaar, Godfrey B Woelk and Samuel Kalibala 60
Experiences in implementation and publication of operations research interventions: gaps and a way forwardSamuel Kalibala, Godfrey B Woelk, Stephen Gloyd, Nrupa Jani, Lynnette Kay, Avina Sarna, Jerry Okal, Charity Ndwiga, Nicole Haberland and Irit Sinai 66

Editorial
Lessons learned and study results from HIVCore:
an HIV implementation science initiative
Naomi Rutenberg*,1, Waimar Tun§,*,1 and Nagesh N Borse*,2
§Corresponding author: Waimar Tun, HIV and AIDS Program, Population Council, 4301 Connecticut Avenue, NW Suite 280, Washington, DC 20008, USA. Tel: �1 202
237 9400. ([email protected])
*These authors have contributed equally to the work.
Received 2 May 2016; Accepted 13 May 2016; Published 20 July 2016
Copyright: – 2016 Rutenberg N et al; licensee International AIDS Society. This is an Open Access article distributed under the terms of the Creative Commons
Attribution 3.0 Unported (CC BY 3.0) License (http://creativecommons.org/licenses/by/3.0/), which permits unrestricted use, distribution, and reproduction in any
medium, provided the original work is properly cited.
The global community has made substantial progress to-
wards halting and beginning to reverse the HIV epidemic. We
have seen a 35% decrease in new HIV infections since 2000
and a 42% decrease in AIDS-related deaths since the peak in
2004 [1]. We have effective interventions such as HIV testing
and counselling (HTC), prevention of mother-to-child trans-
mission (PMTCT) and voluntary male medical circumcision
(VMMC) as part of our tools for curbing the epidemic [2�4].In addition, scientific results established the effectiveness of
antiretrovirals (ARV) to not only treat but also to prevent HIV
infections [5�7]. Together these have given us the much
needed tools and knowledge to bring the goal of achieving an
AIDS-free generation within our reach [8].
Despite great progress, there is a large unfinished agenda
in addressing HIV infection and AIDS-related morbidity and
mortality [9]. UNAIDS has set forth a goal of 90�90�90 � an
ambitious treatment target to help end the AIDS epidemic
[10]. By 2020, 90% of all people living with HIV will know
their HIV status, 90% of all people with diagnosed HIV
infection will receive sustained antiretroviral therapy and
90% of all people receiving antiretroviral therapy will have
viral suppression. However, achieving these targets will
require unprecedented action to scale up access to the
available tools and interventions.
As of June 2015, UNAIDS estimated that globally only 43%
of people living with HIV were on antiretroviral treatment
(ART), leaving nearly 22 million people living with HIV with-
out treatment [1]. The factors that contribute to the large
unmet need for HIV treatment include demand and supply
barriers as well as stigma and discrimination against people
living with HIV and select sub-populations at high risk of
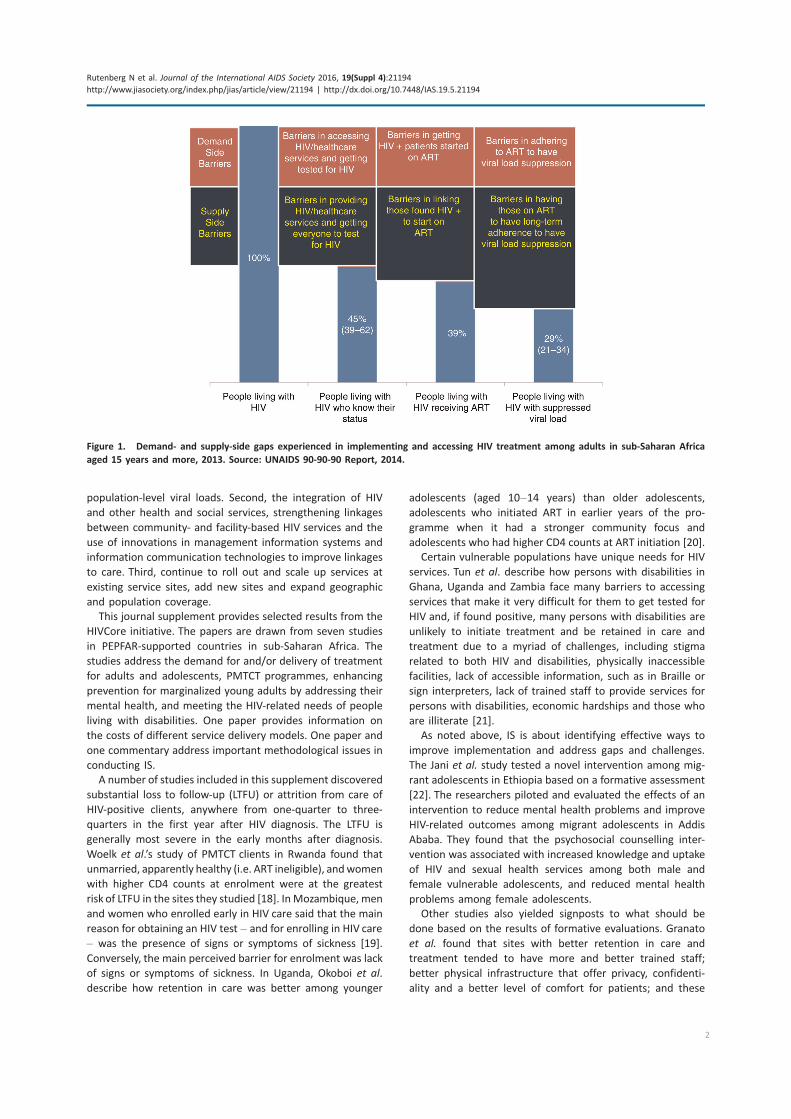
HIV [10,11]. Demand-side barriers include gaps in accessing
HIV/healthcare services and getting tested for HIV, in timely
initiation of ARV treatment by HIV-positive patients and in
adherence to ART and achieving viral suppression. On the
supply side, there are major gaps in the provision of HIV
testing services, in linkages to HIV treatment and in support
to patients to initiate and adhere to ART (Figure 1).
In addition to general supply and demand gaps, contextual
factors also create barriers. Rural areas tend to have a
smaller number of people living with HIV; however, health
facilities in rural areas often face severe health systems
constraints in human resources, laboratory equipment, and
supply of drugs. Although urban areas tend to have better
health systems and less infrastructure challenges, they are
challenged by a higher demand for HIV services. Compared
with the general population, HIV infection rates are sub-
stantially higher among men who have sex with men (3�25times), sex workers (13.5 times) and people who inject drugs
(22�50 times) [12�15]. Although the overall prevalence of
HIV is falling, epidemics in these key groups are expanding in
many places worldwide. Adolescents and people living with
disabilities are two more examples of sub-populations that
have specific risks of HIV and needs for tailored services
[9,13,16]. Prevention and treatment of HIV in these mar-
ginalized groups is difficult to address because of stigma,
discrimination and their sequelae.
Addressing these barriers requires knowledge about what
strategies are effective for the delivery of HIV testing and
treatment for the different settings and sub-populations.
We know what to do but not always how to do it. The US
President’s Emergency Plan for AIDS Relief (PEPFAR) imple-
mentation science (IS) framework describes IS as the study of
methods to improve the uptake, implementation and transla-
tion of research findings into routine and common practices
[17]. Since 2005, PEPFAR has been working with implementing
partners and national governments in many HIV-affected
countries and has contributed to the rapid acceleration of
HIV treatment access, availability of care and support services
and HIV prevention interventions. IS addresses the gaps in the
90�90�90 coverage and is critical for building upon the
progress already achieved with PEPFAR funding.
The Population Council and partners from Elizabeth Glaser
Pediatric AIDS Foundation, Palladium, and the University of
Washington with funding from the US Agency for Interna-
tional Development (USAID), launched HIVCore, which is a
five-year operations research/IS initiative, addressing critical
service delivery issues in global HIV and AIDS PMTCT and
treatment, care and support programmes.
HIVCore addressed three priorities through IS. First, re-
tention in care, that is, meeting current commitments to
patients on treatment and promoting prevention by lowering
Rutenberg N et al. Journal of the International AIDS Society 2016, 19(Suppl 4):21194
http://www.jiasociety.org/index.php/jias/article/view/21194 | http://dx.doi.org/10.7448/IAS.19.5.21194
1
population-level viral loads. Second, the integration of HIV
and other health and social services, strengthening linkages
between community- and facility-based HIV services and the
use of innovations in management information systems and
information communication technologies to improve linkages
to care. Third, continue to roll out and scale up services at
existing service sites, add new sites and expand geographic
and population coverage.
This journal supplement provides selected results from the
HIVCore initiative. The papers are drawn from seven studies
in PEPFAR-supported countries in sub-Saharan Africa. The
studies address the demand for and/or delivery of treatment
for adults and adolescents, PMTCT programmes, enhancing
prevention for marginalized young adults by addressing their
mental health, and meeting the HIV-related needs of people
living with disabilities. One paper provides information on
the costs of different service delivery models. One paper and
one commentary address important methodological issues in
conducting IS.
A number of studies included in this supplement discovered
substantial loss to follow-up (LTFU) or attrition from care of
HIV-positive clients, anywhere from one-quarter to three-
quarters in the first year after HIV diagnosis. The LTFU is
generally most severe in the early months after diagnosis.
Woelk et al.’s study of PMTCT clients in Rwanda found that
unmarried, apparently healthy (i.e. ART ineligible), andwomen
with higher CD4 counts at enrolment were at the greatest
risk of LTFU in the sites they studied [18]. In Mozambique, men
and women who enrolled early in HIV care said that the main
reason for obtaining an HIV test � and for enrolling in HIV care
� was the presence of signs or symptoms of sickness [19].
Conversely, the main perceived barrier for enrolment was lack
of signs or symptoms of sickness. In Uganda, Okoboi et al.
describe how retention in care was better among younger
adolescents (aged 10�14 years) than older adolescents,
adolescents who initiated ART in earlier years of the pro-
gramme when it had a stronger community focus and
adolescents who had higher CD4 counts at ART initiation [20].
Certain vulnerable populations have unique needs for HIV
services. Tun et al. describe how persons with disabilities in
Ghana, Uganda and Zambia face many barriers to accessing
services that make it very difficult for them to get tested for
HIV and, if found positive, many persons with disabilities are
unlikely to initiate treatment and be retained in care and
treatment due to a myriad of challenges, including stigma
related to both HIV and disabilities, physically inaccessible
facilities, lack of accessible information, such as in Braille or
sign interpreters, lack of trained staff to provide services for
persons with disabilities, economic hardships and those who
are illiterate [21].
As noted above, IS is about identifying effective ways to
improve implementation and address gaps and challenges.
The Jani et al. study tested a novel intervention among mig-
rant adolescents in Ethiopia based on a formative assessment
[22]. The researchers piloted and evaluated the effects of an
intervention to reduce mental health problems and improve
HIV-related outcomes among migrant adolescents in Addis
Ababa. They found that the psychosocial counselling inter-
vention was associated with increased knowledge and uptake
of HIV and sexual health services among both male and
female vulnerable adolescents, and reduced mental health
problems among female adolescents.
Other studies also yielded signposts to what should be
done based on the results of formative evaluations. Granato
et al. found that sites with better retention in care and
treatment tended to have more and better trained staff;
better physical infrastructure that offer privacy, confidenti-
ality and a better level of comfort for patients; and these
Figure 1. Demand- and supply-side gaps experienced in implementing and accessing HIV treatment among adults in sub-Saharan Africa
aged 15 years and more, 2013. Source: UNAIDS 90-90-90 Report, 2014.
Rutenberg N et al. Journal of the International AIDS Society 2016, 19(Suppl 4):21194
http://www.jiasociety.org/index.php/jias/article/view/21194 | http://dx.doi.org/10.7448/IAS.19.5.21194
2
sites actively followed-up HIV-positive patients who missed
visits [23]. Activities to promote social support were also
associated with higher retention in the Inguane et al. study in
Mozambique [19]. Other important factors were patients’
perceptions that they would get good care, the financial costs
of travel and wait time at clinics. Finally, linkage to care
and ‘‘re-linkage,’’ that is re-connecting patients who have
dropped out of care, may require different strategies.
A paper by Vu et al. provides a description of the cost per
ART visit and annual ART-related costs per patient for three
different task-shifting models of ART service delivery in
Uganda [24]. Unit costs, the distribution of costs and resource
utilization varied widely across the three sites and models,
suggesting the potential for efficiency gains in ART service
delivery. In particular, HIV programmes in Uganda may save
costs by reducing the number of annual ARTvisits to match the
national standard (four ART visits a year on average). Further,
non-government organizations providing ART services, similar
to these three organizations, Kitovu Mobile, The AIDS Support
Organisation (TASO), and Uganda Cares may benefit from
collaborating with the government and using government
facilities to reduce operational costs.
A major challenge for all these studies was the quality of the
national data systems. Many of the studies presented in this
supplement encountered significant amounts of missing data
in the routinely collected national data sets accessed for these
studies. They also encountered a significant amount of
variation in the number of services reportedly delivered or
patients attended, depending on which data source was
consulted. In addition, considerable error was introduced as
data were aggregated from the clinic to district or provincial to
national level. Gloyd et al. detail various types of shortcomings
in the data, which is a useful checklist for both evaluating the
quality of data and considering investments to improve data
quality [25]. Researchers would like to think that secondary
data analysis will be the ‘‘low hanging fruit’’ and be more
efficient and faster given the availability of the data; however,
the reality is that the data are often so incomplete and of poor
quality that use of these data are highly complex and
demanding. While the sheer amount of data that health
providers are asked to collect is one source of poor data
quality, the silver lining for research is that the volume of data
provides the opportunity to compare and triangulate. The
authors of the paper describe a variety of approaches,
including imputation and sensitivity analysis, for assembling
a decent picture of services despite the incomplete data.
The commentary by Kalibala et al. highlights the impor-
tance of and challenges to paying the same attention to
measuring the implementation � that is, the dose, coverage,
fidelity and quality � of the interventions as is paid to the
outcomes in the target beneficiaries [26]. They remind us
that since the purpose of IS is to identify and increase the
use of effective service delivery approaches, it is incumbent
upon IS studies to evaluate and document these critical
elements and publish the processes and materials used in
implementation.
Apart from conducting IS to expand the evidence base of
effective service delivery approaches at the global, country
and programme levels, the HIVCore initiative also focused its
efforts on promoting utilization of IS results to enhance
decision-making and building local capacity for IS. As an
outcome of the engagement of local stakeholders in Ghana in
the study on persons with disabilities [21], the Ghana AIDS
Commission announced that the new National Strategic
Plan (NSP) would be revised to better address the needs of
persons with disabilities, as prior to this study Ghana’s NSP
did not include disability as a challenge in HIV programming,
and that disability-accessible educational materials will be
developed. Upon completion of the first studies in the
initiative, HIVCore convened an international writing work-
shop to enable sharing of experiences in data analysis and
to highlight policy and programmatic implications of study
findings. Through the use of experienced investigators and
technical advisors, this workshop focused on mentoring less
experienced investigators to build their capacity in scientific
writing, including writing the first drafts of many of the
manuscripts in this supplement.
These IS studies, and others like them, call for attention to
the necessary improvements at service delivery points and in
sub-national and national systems to expand coverage of HIV
care while also strengthening healthcare systems, including
data systems, human resources and infrastructure. IS is an
iterative process. You ‘‘fix’’ one problem, and it is time to exa-
mine the next; you expand uptake of HIV care, and you need
to do more follow-up; you follow-up and bring more patients
back, and you need to expand your adherence support, and
so on.
The HIVCore initiative has contributed in many ways to the
current HIV implementation agenda as well as sharing of dif-
ferent approaches for research utilization and capacity build-
ing for IS. The challenges with the implementation of newer
tools and approaches to address the gaps in 90-90-90
coverage are critical for building upon the progress already
achieved under the HIVCore initiative.
Authors’ affiliations1HIV and AIDS Program, Population Council, Washington, DC, USA; 2Research
Division, Office of HIV and AIDS, US Agency for International Development
(USAID), Washington, DC, USA
Competing interests
The authors declare that they have no competing interests.
Authors’ contributions
NR and NNB contributed sections to the first draft of the manuscript.
WT contributed to the synopsis of the studies introduced in the manuscript.
All authors read and approved the final manuscript.
Acknowledgements
Our special thanks go to the HIVCore management team at USAID/Washington
for their leadership: Sarah Sandison and Glenn Post.We also thank Sam Kalibala
(HIVCore/Population Council, director), Nrupa Jani (HIVCore/Population Council,
research coordinator) and Sherry Hutchinson (HIVCore/Population Council,
knowledge management specialist) for their review of the editorial.
Funding
This manuscript was made possible through the support provided by the
President’s Emergency Plan for AIDS Relief and the U.S. Agency for
International Development (USAID) through a Task Order funded by USAID
under the Project SEARCH indefinite quantity contract (Contract No. AID-OAA-
TO-11-00060). The Task Order is led by the Population Council in partnership
with the Elizabeth Glaser Pediatric AIDS Foundation, Palladium, and the
University of Washington. The authors’ views expressed in this manuscript do
not necessarily reflect the views of USAID or the United States government.
Rutenberg N et al. Journal of the International AIDS Society 2016, 19(Suppl 4):21194
http://www.jiasociety.org/index.php/jias/article/view/21194 | http://dx.doi.org/10.7448/IAS.19.5.21194
3
References
1. UNAIDS. AIDS by the numbers. Geneva, Switzerland: UNAIDS; 2015.
2. UNAIDS. New data on male circumcision and HIV prevention: policy and
programme implications. Geneva, Switzerland: UNAIDS; 2007.
3. UNAIDS. Global plan towards the elimination of new HIV infections among
children by 2015 and keeping their mothers alive (2011�2015). Geneva,
Switzerland: UNAIDS; 2011.
4. World Health Organization. Consolidated guidelines on HIV testing services-5Cs:
consent, confidentiality, counselling, correct results and connection. Geneva,
Switzerland: WHO; 2015.
5. Dieffenbach CW. Preventing HIV transmission through antiretroviral treatment-
mediated virologic suppression: aspects of an emerging scientific agenda. Curr
Opin HIV AIDS. 2012;7(2):106�10.6. Dabis F, Newell ML, Hirschel B. HIV drugs for treatment, and for prevention.
Lancet. 2010;375(9731):2056�7.7. World Health Organization. Consolidated guidelines on the use of
antiretroviral drugs for treating and preventing HIV infection: recommenda-
tions for a public health approach. Geneva, Switzerland: WHO; 2013.
8. Office of the Global AIDS Coordinator. PEPFAR Blueprint: creating an AIDS-
free Generation. Washington, DC: Global AIDS Coordinator; 2012.
9. UNAIDS. The gap report. Geneva, Switzerland: UNAIDS; 2014.
10. UNAIDS. 90-90-90: an ambitious treatment target to help end the AIDS
epidemic. Geneva, Switzerland: UNAIDS; 2014.
11. Pulerwitz J, Bongaarts J. Tackling stigma: fundamental to an AIDS-free
future. Lancet Glob Health. 2014;2(6):e311�2.12. Baral S, Beyrer C, Muessig K, Poteat T, Wirtz AL, Decker MR, et al. Burden
of HIV among female sex workers in low-income and middle-income countries:
a systematic review and meta-analysis. Lancet Infect Dis. 2012;12(7):538�49.13. UNAIDS. Global report: UNAIDS report on the global AIDS epidemic
2013.Geneva, Switzerland: UNAIDS; 2013.
14. United Nations Office on Drugs and Crime. World Drug Report 2014.
Vienna, Austria: UNODC; 2014.
15. Beyrer C, Baral SD, van Griensven F, Goodreau SM, Chariyalertsak S, Wirtz
AL, et al. Global epidemiology of HIV infection in men who have sex with men.
Lancet. 2012;380(9839):367�77.16. Dellar RC, Dlamini S, Karim QA. Adolescent girls and young women: key
populations for HIV epidemic control. J Int AIDS Soc. 2015;18(Suppl 1):19408,
doi: http://dx.doi.org/10.7448/IAS.18.2.19408
17. Padian NS, Holmes CB, McCoy SI, Lyerla R, Bouey PD, Goosby EP.
Implementation science for the US President’s Emergency Plan for AIDS Relief
(PEPFAR). J Acquir Immune Defic Syndr. 2011;56(3):199�203.18. Woelk GB, Ndatimana D, Behan S, Mukaminega M, Nyirabahzi E, Hoffman
HJ, et al. Retention of mothers and infants in the prevention of mother-to-child
transmission of HIV program is associated with individual and facility-level
factors in Rwanda. J Int AIDS Soc. 2016, 20837, doi: http://dx.doi.org/10.7448/
IAS.19.5.20837
19. Inguane CA, Gloyd S, Manuel JL, Brown C, Wong V, Augusto O, et al.
Assessment of linkages from HIV testing to enrolment and retention in HIV care
in central Mozambique. J Int AIDS Soc. 2016, 20846, doi: http://dx.doi.org/10.
7448/IAS.19.5.20846
20. Okoboi S, Ssali L, Yansaneh AI, Bakanda C, Birungi J, Nantume S, et al.
Factors associated with long-term antiretroviral therapy retention among
adolescents in rural Uganda: a retrospective study. J Int AIDS Soc. 2016, 20841,
doi: http://dx.doi.org/10.7448/IAS.19.5.20841
21. Tun W, Okal J, Schenk K, Esantsi S, Mutale F, Kyermaa RK, et al. Limited
accessibility to HIV services for persons with disabilities living with HIV in
Ghana, Uganda, and Zambia. J Int AIDS Soc. 2016, 20829, doi: http://dx.doi.
org/10.7448/IAS.19.5.20829
22. Jani N, Vu L, Habtamu K, Kalibala S. Reducing HIV-related risk and
mental health problems through a client-centered psychosocial intervention
for vulnerable adolescents in Addis Ababa, Ethiopia. J Int AIDS Soc. 2016,
20832, doi: http://dx.doi.org/10.7448/IAS.19.5.20832
23. Granato SA, Gloyd S, Robinson J, Dali SA, Ahoba I, Aka D, et al. Results from
a rapid national assessment of services for the prevention of mother-to-child
transmission of HIV in Cote d’Ivoire. J Int AIDS Soc. 2016, 20838, doi: http://dx.
doi.org/10.7448/IAS.19.5.20838
24. Vu L,Waliggo S, Zieman B, Jani N, Buzaalirwa L, Okoboi S, et al. Annual cost
of antiretroviral therapy among three service delivery models in Uganda. J Int
AIDS Soc. 2016, 20840, doi: http://dx.doi.org/10.7448/IAS.19.5.20840
25. Gloyd S, Wagenaar BH, Woelk GB, Kalibala S. Opportunities and challenges
conducting secondary analysis of HIV programs using data from routine health
information systems and personal health information. J Int AIDS Soc. 2016,
20847, doi: http://dx.doi.org/10.7448/IAS.19.5.20847
26. Kalibala S, Woelk GB, Gloyd S, Jani N, Kay L, Sarna A, et al. Experiences in
implementation and publication of operations research interventions: gaps and
way forward. J Int AIDS Soc. 2016, 20842, doi: http://dx.doi.org/10.7448/IAS.
19.5.20842
Rutenberg N et al. Journal of the International AIDS Society 2016, 19(Suppl 4):21194
http://www.jiasociety.org/index.php/jias/article/view/21194 | http://dx.doi.org/10.7448/IAS.19.5.21194
4
Research article
Retention of mothers and infants in the prevention of mother-to-
child transmission of HIV programme is associated with individual
and facility-level factors in Rwanda
Godfrey B Woelk§,1, Dieudonne Ndatimana2, Sally Behan3, Martha Mukaminega2, Epiphanie Nyirabahizi1,
Heather J Hoffman3, Placidie Mugwaneza4, Muhayimpundu Ribakare4, Anouk Amzel5 and B Ryan Phelps5
§Corresponding author: Godfrey B Woelk, 1140 Connecticut Avenue NW, Washington, DC 20036, USA. Tel: �202 448 8485. ([email protected])
Abstract
Objectives: Investigate levels of retention at specified time periods along the prevention of mother-to-child transmission
(PMTCT) cascade among mother-infant pairs as well as individual- and facility-level factors associated with retention.
Methods: A retrospective cohort of HIV-positive pregnant women and their infants attending five health centres from November
2010 to February 2012 in the Option B programme in Rwanda was established. Data were collected from several health registers
and patient follow-up files. Additionally, informant interviews were conducted to ascertain health facility characteristics.
Generalized estimating equation methods and modelling were utilized to estimate the number of mothers attending each
antenatal care visit and assess factors associated with retention.
Results: Data from 457 pregnant women and 462 infants were collected at five different health centres (three urban and two rural
facilities). Retention at 30 days after registration and retention at 6 weeks, 3, 6, 9 and 12 months post-delivery were analyzed.
Based on an analytical sample of 348, we found that 58% of women and 81% of infants were retained in care within the same
health facility at 12 months post-delivery, respectively. However, for mother-infant paired mothers, retention at 12 months was
74% and 79% for their infants. Loss to facility occurred early, with 26% to 33% being lost within 30 days post-registration. In a
multivariable model retention was associated with being married, adjusted relative risk (ARR): 1.26, (95% confidence intervals:
1.11, 1.43); antiretroviral therapy eligible, ARR: 1.39, (1.12, 1.73) and CD4 count per 50 mm3, ARR: 1.02, (1.01, 1.03).
Conclusions: These findings demonstrate varying retention levels among mother-infant pairs along the PMTCTcascade in addition
to potential determinants of retention to such programmes. Unmarried, apparently healthy, HIV-positive pregnant women need
additional support for programme retention. With the significantly increased workload resulting from lifelong antiretroviral
treatment for all HIV-positive pregnant women, strategies need to be developed to identify, provide support and trace these
women at risk of loss to follow-up. This study provides further evidence for the need for such a targeted supportive approach.
Keywords: PMTCT; retention; health facilities; sub-Sahara Africa; Rwanda; mother-infant pairs.
Received 24 November 2015; Revised 2 May 2016; Accepted 13 May 2016; Published 20 July 2016
Copyright: – 2016 Woelk GB et al; licensee International AIDS Society. This is an Open Access article distributed under the terms of the Creative Commons
Attribution 3.0 Unported (CC BY 3.0) License (http://creativecommons.org/licenses/by/3.0/), which permits unrestricted use, distribution, and reproduction in any
medium, provided the original work is properly cited.
IntroductionThere has been significant progress in the prevention of
mother-to-child transmission (PMTCT) of HIV globally. The
number of new infections among children decreased by 58%
between 2000 and 2014; from 520,000 to 220,000 [1].
The continued success of efforts to combat mother-to-child
transmission supports our ultimate goal of being able to
eliminate new infections among children globally [2]. This
ambitious goal appears feasible if existing resources are
used wisely and obstacles are anticipated and overcome. In
particular, the PMTCT programme retention of mothers
during pregnancy and mothers and infants post-delivery
will be vital to achieving this goal. Women and infants who
are retained in care have better health outcomes, and
women who are retained and adhere to their antiretroviral
therapy (ART) are less likely to transmit HIV to others [3,4].
However, HIV-positive pregnant women are less likely to
be retained in care than HIV-positive non-pregnant women
and men [5�7].There are several barriers to retention among women and
infants in PMTCT programmes. Data suggest that transporta-
tion costs, stigma and discrimination and fear of HIV status
disclosure, comprise some of the major impediments to
an individual continuing in care [8�12]. It is important to
understand both individual and facility factors affecting
retention along the PMTCT cascade.
Health facility characteristics that may influence retention
include both the structural and operational aspects of a faci-
lity such as capacity, location, staffing and services provided.
One cross-sectional study among HIV-positive post-partum
women in Ethiopia found that the likelihood of receiving
PMTCT services increased by 7.2 times with every additional
nurse per 1500 patients, indicating patient load may be
associated with retention [13]. Another study in South Africa
Woelk GB et al. Journal of the International AIDS Society 2016, 19(Suppl 4):20837
http://www.jiasociety.org/index.php/jias/article/view/20837 | http://dx.doi.org/10.7448/IAS.19.5.20837
5
found that patients receiving HIV treatment at local clinics
were less likely to be lost to follow-up than patients treated
at hospitals [14]. Further, a retrospective cohort study con-
ducted in Malawi among women enrolled in Option B�programmes found a positive, though weak, association
between rural facility location and retention as well as a
negative association between attending larger facilities and
retention [15].
Overall, these individual- and facility-level barriers result in
decreased retention among women and infants throughout
the PMTCT cascade [16,17], with only 66% of HIV-positive
pregnant women receiving ART and 49% of infants receiving
virologic diagnostic testing within the first two months of life
in 2014 [18]. Understanding how these barriers impact
retention among women and infants at varying time intervals
along the PMTCT cascade may contribute to optimizing the
performance of PMTCT programmes and identifying innova-
tions to facilitate further improvement in the provision of
care.
Rwanda has taken several steps towards reducing the
mother-to-child transmission of HIV through the establish-
ment of their comprehensive national HIV programme.
Currently, 97% of health facilities offer PMTCT services [19].
As of December 2013, 1.3% of women attending clinics
for PMTCT services were HIV-positive, a substantial decrease
from 10.8% HIV positivity among pregnant women in 2003
[19]. Further, the number of new infections among children
decreased from 6400 in 2001, to less than 1000 in 2012 [18].
Still, levels of retention to the PMTCT cascade in Rwanda as
well as individual- and facility-level factors associated with
retention are not well understood.
This analysis utilized data collected from five health
facilities in Rwanda to assess levels of retention and factors
associated with retention to PMTCT programmes among
mothers and infants.
MethodsStudy design
We undertook a retrospective cohort study among pairs of
HIV-positive pregnant women and their HIV-exposed infants
(HEI) accessing PMTCT services in Rwanda. Specifically, this
study aimed to investigate levels of retention among mother-
infant pairs at various stages of the PMTCT cascade and
assess individual and health facility characteristics that may
influence retention in PMTCT programmes. At the time of the
study, Rwanda had implemented Option B PMTCT guidelines
(the provision of triple ART for all HIV-positive pregnant
women during pregnancy up to the cessation of breastfeed-
ing) for more than two years. Rwanda transitioned to Option
B�, the provision of ART for all HIV-positive pregnant
women for life, in April 2012, after the data collection period.
Data collection
The retrospective review was conducted among HIV-positive
women and infants registered in Option B antenatal and
maternity services between November 2010 and February
2012. All PMTCT services were provided within the same unit
of a particular facility. Facilities without maternity services
referred women for delivery, but the women were expected
to return for post-partum services and subsequent follow-up.
Data were collected through a review of registers and
medical files, as well as interviews performed with in-charges
at the study health centres. Registers reviewed include the
antenatal care (ANC), PMTCT, labour and delivery, HEI
service, postnatal care (PNC), ART and early infant diagnoses
registers. Data were extracted by trained data assistants and
were directly entered into an MS ACCESS database. One to
two informant interviews were conducted with the staff at
each of the five study health facilities to collect data on
health facility characteristics. Data were collected from
March 2013 to May 2013.
In order to collect data on mothers and their infants from
multiple registers, the data from these registers were linked.
To obtain data on pregnant women, mothers newly diag-
nosed with HIV or with a known HIV-positive status were
identified through the ANC registry by name and then their
individual ANC identification numbers were noted. These
unique identification numbers were then linked to the pre-
ART registry patient numbers. The patient number was used
to collect data from the ART, pharmacy and lab registers.
To link the mother to the infant, data were also collected
from the maternity, PNC and HEI registers. The mothers’
unique identification numbers are recorded in the infant’s
file, enabling the mother/infant pairing. ‘‘Unpaired’’ mothers
were those for whom there was no linkage or information
on infant follow up. To acquire infant characteristics, the HEI
registers, HEI card and medical files (the polymerase chain
reaction (PCR) and dried blood spot file results) were utilized.
Infants with positive PCR results additionally had their details
obtained from pre-ART, ART registers and patient files. No
attempts were made to trace mothers across facilities.
Women who were referred for any reason were docu-
mented in the patient files, together with the dates of
referral. These data were captured in the study database and
the women subsequently removed from the denominator.
Definition of variables
We defined retention as clinic attendance of the mother in
addition to clinic attendance of the mother and infant as a
pair. The time intervals along the PMTCT cascade used to
assess retention were 30 days after entry into the PMTCT
programme, at delivery, 6 weeks and 3, 6, 9 and 12 months
post-delivery (postpartum time-points allowed a one-month
interval on either side for data collection). Loss to follow-up
(LFTU) was defined as missing three consecutive clinic visits.
Facility characteristics included facility location (urban or
rural), staffing levels, vacancy rates, the number of ANC
clients, volume of deliveries, number of HIV-positive preg-
nant women, number of doctor visits and onsite availability
of CD4 testing.
Site selection and sample size
Sites among those supported by Elizabeth Glaser Pediatric
AIDS Foundation (EGPAF) were selected and stratified by type
of facility and location for this study. Sites were included if
they were an ART initiating site, had at least 40 HIV-positive
pregnant women registered in ANC per year, had well-
maintained patient records according to programme staff,
and experienced minimal test-kit stock-outs. Utilizing this
Woelk GB et al. Journal of the International AIDS Society 2016, 19(Suppl 4):20837
http://www.jiasociety.org/index.php/jias/article/view/20837 | http://dx.doi.org/10.7448/IAS.19.5.20837
6
criterion, five health centres � two urban, three rural � were
selected. We estimated a sample size of 474 pregnant
women who were either newly diagnosed with HIV or had
a known HIV-positive status. The sample size was based on
an expectation of 50% (94%) of the women attending the
12-month post-delivery visit.
Endpoint derivation
To develop the time intervals along the PMTCT cascade, the
time period from registration date to the end of the obser-
vation period was divided into six segments: 30 days after
registration, delivery date, 6 weeks and 3, 6, 9 and 12 months
post-delivery (postpartum time-points allowed a one month
interval on either side for data collection). A mother/infant
was considered retained at each time interval if there was at
least one health centre visit or pharmacy pick-up at any time
during that time interval. Retention at each time interval was
measured dichotomously: a mother/infant received a ‘‘1’’ if
there was at least one visit, or a ‘‘0’’ if there was none. For
each mother-infant pair, retention was measured as a count
outcome of how many visits out of a possible six visits were
accomplished. Thus, the endpoint was the total number of
visits (each with a value of one) accomplished out of the six
expected.
To estimate retention 30 days after registration, the ART
initiation date was utilized. For women who were already on
ART, if their initiation date or the first ART refill date since
their registration in PMTCT was either within 30 days or
within two weeks of the 30 days after registration, respec-
tively, the mother was considered retained. For retention at
delivery (health facility or home), all available records were
utilized that suggested that the delivery took place including
place of delivery, delivery date (if available) and child date of
birth (if available). If any one of these records was available,
the mother was retained at delivery. With respect to reten-
tion post-delivery (6 weeks and 3, 6, 9 and 12 months), if
there was any indication of receipt of ART at that time (91
month), the mother was deemed retained. A similar process
was used to estimate infant retention.
Analysis
We estimated the proportion of mothers attending each
study health centre visit by comparing the records of those
found with the number that should have been seen at that
particular visit. For mothers, at 30 days post-registration and
at delivery, the denominator was the total number of regi-
stered mothers. For mothers at 6 weeks, and 3, 6, 9 and 12
months post-delivery, the denominator was the number of
mothers retained at delivery. ‘‘Retention’’ was the proportion
of the number of visits a mother attended to the total
expected visits depending on gestational age at first visit. For
infants, the initial denominator was the number of infants
born alive, and then the number expected at each assessed
time point, excluding known events such as death.
To assess factors associated with retention, we used gen-
eralized estimating equations (GEE) Poisson regression to
calculate relative risks and the corresponding 95% confidence
intervals (CIs) and p-values. We used GEE to account for the
potential correlation of outcomes between women from the
same health facility, assuming an exchangeable correlation
structure. We also estimated robust standard errors, adjust-
ing for the clustering within facilities. We included the
following demographic, clinical and health facility variables
in this analysis: age, parity, marital status, education, employ-
ment status, ART eligibility, CD4 count, urban or rural location
of facility, facility deliveries, number of HIV-positive pregnant
women per facility, HIV-trained nurses and number of doctor
visits. Age, defined as a woman’s age at registration or delivery,
was estimated from the date of birth and the date of regi-
stration or delivery, and was scaled into 10 year increments
in the analysis. Mother’s parity was similarly retained as a
continuous variable. Marital status was grouped into mar-
ried/living as married versus not; education level � primary
or less/secondary or more; and employment status � farmer,
trader and other, including housewife. CD4 count was
grouped into levels of 50 cells/mm3 and run as this grouped
variable; ART eligibility was a dichotomous variable � ART for
the mother’s own health versus not (e.g. used solely for
PMTCT). The health facility variables were based on annual
(the preceding year’s) data and were included in the analyses
as continuous variables, while the total number of HIV-
positive pregnant women was scaled into increments of
20 women.
In regression models, we analyzed the demographic, clinical
and health facility factors associated with retention, with
retention as a variable, the number of visits a mother made
out of an expected number of six. This analysis utilized all the
available data leading to a more robust estimate of retention.
In the univariate (unadjusted) model, we included age in
10-year increments (years at registration), marital status (not
married/married), education (primary or less/secondary or
more), employment status (farmer, trader, other), parity (0�2,3� ), CD4 count categorized 50 mm3, known HIV status, ART
eligibility, number of HIV-positive pregnant women (incre-
ments of 20 women) per facility, number of deliveries per
facility, number of HIV-trained nurses, number of doctor visits
and facility location (urban/rural). The number of doctor visits
was omitted from the model because of collinearity. In the
final multivariate (adjusted) model, we excluded education
and the number of deliveries because they were not found to
be significant in the univariate analysis.
Statistical analyses were conducted using Stata software
(Version 12.1, StataCorp LP, College Station, Texas, USA).
Ethical considerations
We obtained study approval from the Population Council
Institutional Review Board and the Rwandan National Ethics
Committee. Informed consent was waived, as the study was
deemed minimal risk to study participants, the research
could not practically be carried out if consent was required
and the waiver of consent did not adversely affect the rights
and welfare of the participants. All study personnel received
training and certification in research ethics. Additionally, data
assistants signed confidentiality agreements before interact-
ing with the facility in-charges or working with data. All
data were entered on password-protected computers into a
password-protected database. When conducting the ana-
lyses, all personal identifiers were removed to ensure the
confidentiality of the participants.
Woelk GB et al. Journal of the International AIDS Society 2016, 19(Suppl 4):20837
http://www.jiasociety.org/index.php/jias/article/view/20837 | http://dx.doi.org/10.7448/IAS.19.5.20837
7
ResultsParticipant and health centre characteristics
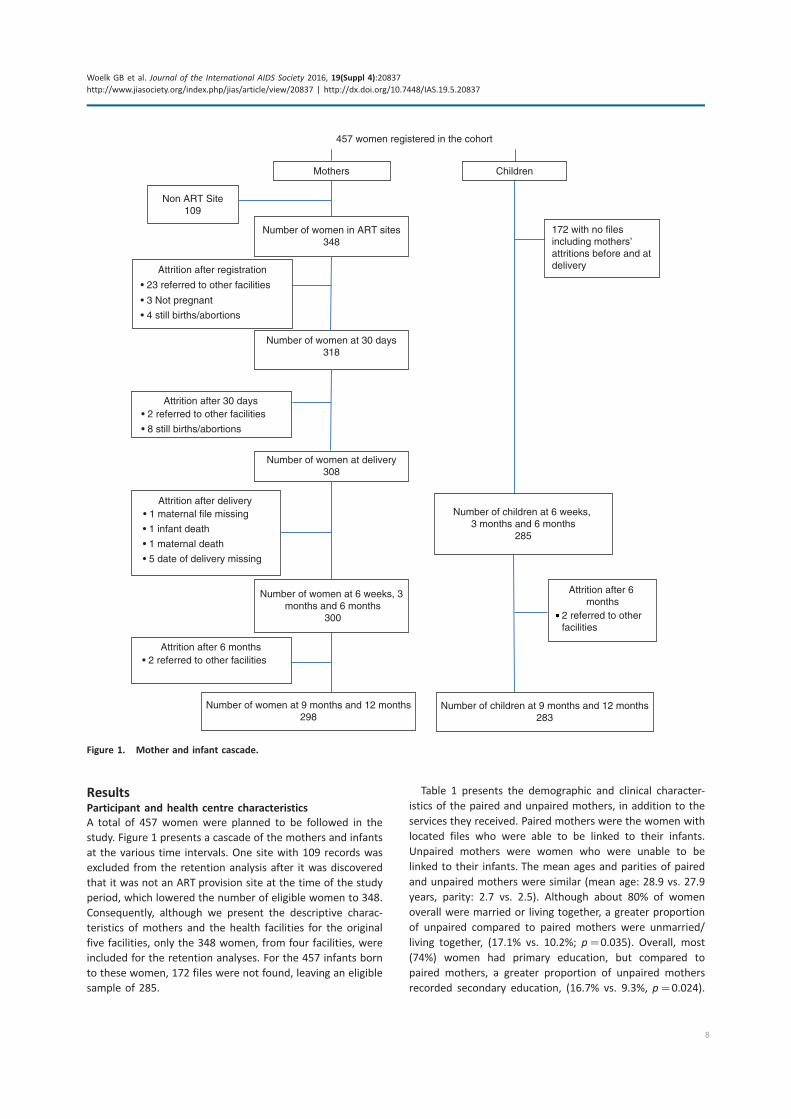
A total of 457 women were planned to be followed in the
study. Figure 1 presents a cascade of the mothers and infants
at the various time intervals. One site with 109 records was
excluded from the retention analysis after it was discovered
that it was not an ART provision site at the time of the study
period, which lowered the number of eligible women to 348.
Consequently, although we present the descriptive charac-
teristics of mothers and the health facilities for the original
five facilities, only the 348 women, from four facilities, were
included for the retention analyses. For the 457 infants born
to these women, 172 files were not found, leaving an eligible
sample of 285.
Table 1 presents the demographic and clinical character-
istics of the paired and unpaired mothers, in addition to the
services they received. Paired mothers were the women with
located files who were able to be linked to their infants.
Unpaired mothers were women who were unable to be
linked to their infants. The mean ages and parities of paired
and unpaired mothers were similar (mean age: 28.9 vs. 27.9
years, parity: 2.7 vs. 2.5). Although about 80% of women
overall were married or living together, a greater proportion
of unpaired compared to paired mothers were unmarried/
living together, (17.1% vs. 10.2%; p�0.035). Overall, most
(74%) women had primary education, but compared to
paired mothers, a greater proportion of unpaired mothers
recorded secondary education, (16.7% vs. 9.3%, p�0.024).
457 women registered in the cohort
Number of women at 6 weeks, 3 months and 6 months
300
Non ART Site109
Number of women in ART sites348
Attrition after registration
• 23 referred to other facilities
• 3 Not pregnant
Number of women at 30 days318
Attrition after 30 days• 2 referred to other facilities
• 8 still births/abortions
Number of women at delivery308
Attrition after delivery• 1 maternal file missing
• 1 infant death
• 1 maternal death
• 5 date of delivery missing
Attrition after 6 months• 2 referred to other facilities
Number of women at 9 months and 12 months298
Children
172 with no files including mothers’ attritions before and at delivery
Number of children at 6 weeks, 3 months and 6 months
285
Attrition after 6 months
2 referred to other facilities
Number of children at 9 months and 12 months283
• 4 still births/abortions
Mothers
Figure 1. Mother and infant cascade.
Woelk GB et al. Journal of the International AIDS Society 2016, 19(Suppl 4):20837
http://www.jiasociety.org/index.php/jias/article/view/20837 | http://dx.doi.org/10.7448/IAS.19.5.20837
8
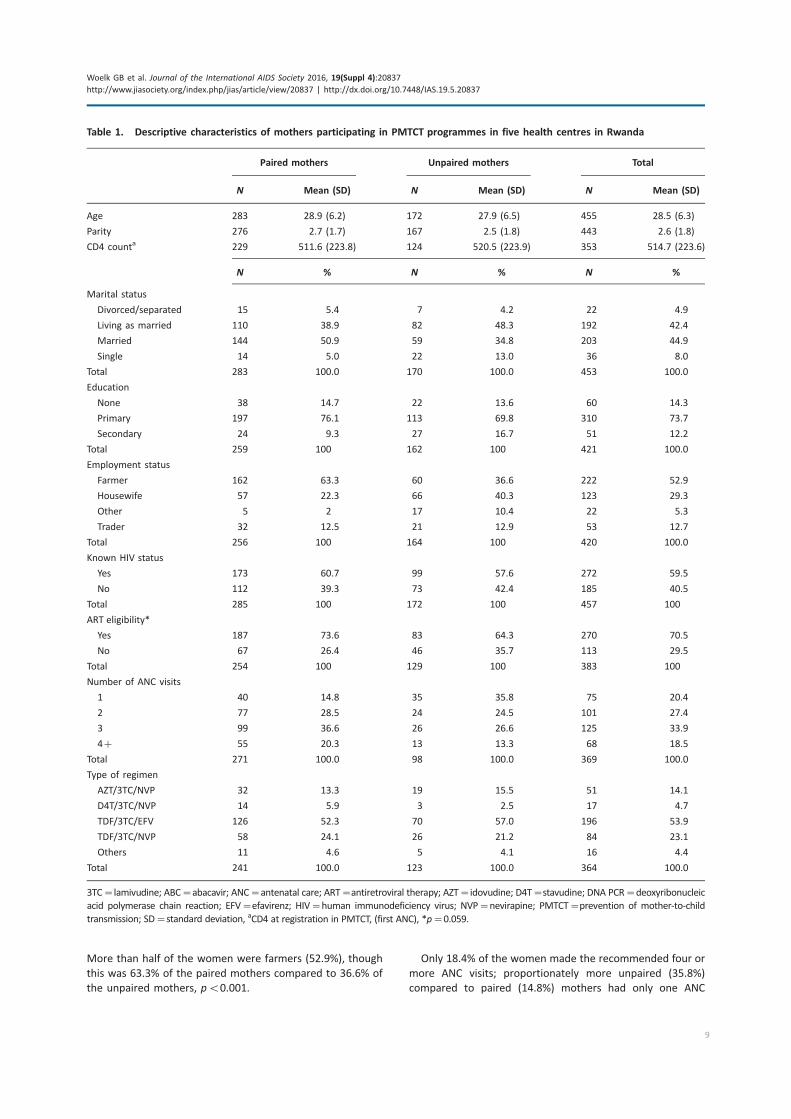
More than half of the women were farmers (52.9%), though
this was 63.3% of the paired mothers compared to 36.6% of
the unpaired mothers, pB0.001.
Only 18.4% of the women made the recommended four or
more ANC visits; proportionately more unpaired (35.8%)
compared to paired (14.8%) mothers had only one ANC
Table 1. Descriptive characteristics of mothers participating in PMTCT programmes in five health centres in Rwanda
Paired mothers Unpaired mothers Total
N Mean (SD) N Mean (SD) N Mean (SD)
Age 283 28.9 (6.2) 172 27.9 (6.5) 455 28.5 (6.3)
Parity 276 2.7 (1.7) 167 2.5 (1.8) 443 2.6 (1.8)
CD4 counta 229 511.6 (223.8) 124 520.5 (223.9) 353 514.7 (223.6)
N % N % N %
Marital status
Divorced/separated 15 5.4 7 4.2 22 4.9
Living as married 110 38.9 82 48.3 192 42.4
Married 144 50.9 59 34.8 203 44.9
Single 14 5.0 22 13.0 36 8.0
Total 283 100.0 170 100.0 453 100.0
Education
None 38 14.7 22 13.6 60 14.3
Primary 197 76.1 113 69.8 310 73.7
Secondary 24 9.3 27 16.7 51 12.2
Total 259 100 162 100 421 100.0
Employment status
Farmer 162 63.3 60 36.6 222 52.9
Housewife 57 22.3 66 40.3 123 29.3
Other 5 2 17 10.4 22 5.3
Trader 32 12.5 21 12.9 53 12.7
Total 256 100 164 100 420 100.0
Known HIV status
Yes 173 60.7 99 57.6 272 59.5
No 112 39.3 73 42.4 185 40.5
Total 285 100 172 100 457 100
ART eligibility*
Yes 187 73.6 83 64.3 270 70.5
No 67 26.4 46 35.7 113 29.5
Total 254 100 129 100 383 100
Number of ANC visits
1 40 14.8 35 35.8 75 20.4
2 77 28.5 24 24.5 101 27.4
3 99 36.6 26 26.6 125 33.9
4� 55 20.3 13 13.3 68 18.5
Total 271 100.0 98 100.0 369 100.0
Type of regimen
AZT/3TC/NVP 32 13.3 19 15.5 51 14.1
D4T/3TC/NVP 14 5.9 3 2.5 17 4.7
TDF/3TC/EFV 126 52.3 70 57.0 196 53.9
TDF/3TC/NVP 58 24.1 26 21.2 84 23.1
Others 11 4.6 5 4.1 16 4.4
Total 241 100.0 123 100.0 364 100.0
3TC�lamivudine; ABC�abacavir; ANC�antenatal care; ART�antiretroviral therapy; AZT�idovudine; D4T�stavudine; DNA PCR�deoxyribonucleic
acid polymerase chain reaction; EFV�efavirenz; HIV�human immunodeficiency virus; NVP�nevirapine; PMTCT�prevention of mother-to-child
transmission; SD�standard deviation, aCD4 at registration in PMTCT, (first ANC), *p�0.059.
Woelk GB et al. Journal of the International AIDS Society 2016, 19(Suppl 4):20837
http://www.jiasociety.org/index.php/jias/article/view/20837 | http://dx.doi.org/10.7448/IAS.19.5.20837
9
visit, pB0.001. The most common treatment regimens among
the women were tenofovir combination regimens (77%),
while an additional 14% were on AZT combination regimens,
with similar proportions among the paired and unpaired
mothers.
Description of health facilities
Five health centres were selected (three urban and two rural
centres) for sampling. Using data collected in 2011, the
average number of ANC clients among the five centres was
approximately 1499, ranging from 880 to 2254 patients per
centre (Table 2). There were roughly 70 HIV-positive pregnant
women at each centre. In addition, an average of 647
deliveries took place at each facility. There was an average of
approximately 29 health staffers and 10 HIV-trained nurses at
each facility. Doctors visited the health centres approximately
seven times each in 2011. Overall, the rural facilities had
more staff per patient than the urban facilities.
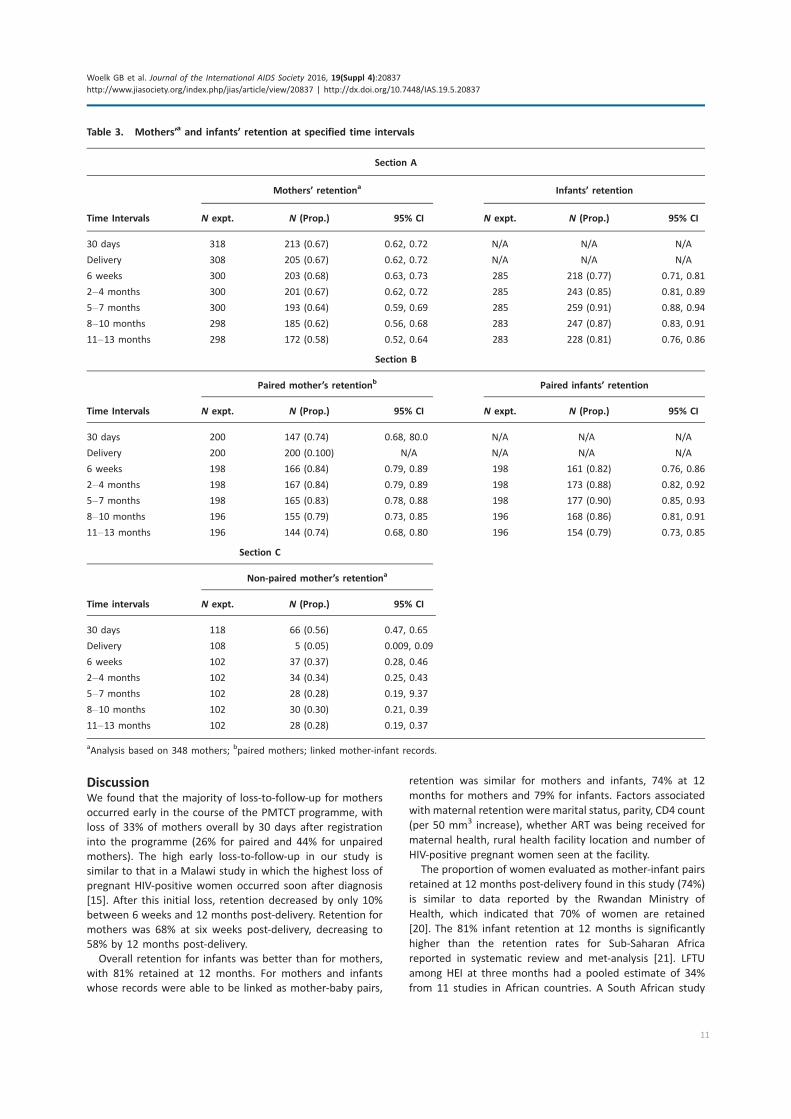
Programme retention
Table 3 shows the retention among women and infants
across the PMTCT cascade with 95% CIs. Among all the
women 58% (95% CI: 52%, 64%) were retained 12 months
post-delivery, while the infants’ 12-month retention was 81%
(76%, 86%). Retention for mothers paired with their infant
(i.e. infant’s file attached to mother’s file) was 74% (68%,
80%), similar to the retention for their paired infant of 79%
(73%, 85%) at 12 months. Analysis of retention of women
without linked infant files shows a lower retention compared
to the paired mothers; only 5% of unpaired women delivered
at the clinic site, and about 30% were retained over the
subsequent time periods. Overall, the majority of loss to
retention was observed in the 30 days after antenatal
registration. During this period, 33% of mothers overall and
25% of paired mothers were lost-to-follow-up. Losses tended
to be minimal at the other time points.
Factors associated with retention
Table 4 presents retention at specified time intervals by
selected demographic and clinical factors. Single mothers had
the lowest retention at delivery (48%; 95% CI: 30%, 66%),
9 (41%; CI: 23%, 59%) and 12 months (41%; CI: 23%, 59%).
Divorced/separated mothers had the lowest retention at six
weeks (43%; CI: 17%, 69%), three (36%; CI: 11%, 61%) and
six months (36%; CI: 11%, 61%). Retention across the time
periods was similar by education levels, while women whose
occupation was listed as ‘‘other’’ (than farmer, housewife or
trader), had the lowest retention across all the time periods
from delivery compared to other occupations: 35% at deli-
very, 53% at 6 weeks and 3, 6 and 9 months, and 47% at
12 months. There was little difference in the proportions
retained between mothers with known HIV status and those
newly diagnosed across the specified time intervals, with 59%
(CI: 52%, 66%) of the mothers of known status retained at 12
months, against 56% (CI: 47%, 65%) of newly diagnosed
mothers. Mothers eligible for ART for their own health were
better retained across all the time periods, compared with
those not eligible and receiving ART solely for PMTCT, 66%
(CI: 59%, 73%), were retained at 12 months versus 47% (CI:
37%, 57%), respectively, pB0.001. There was little difference
in retention between mothers who attended the recom-
mended four or more ANC visits, versus those who attended
three or fewer, 66% (CI: 51%, 80%), versus 65% (CI: 53%,
78%) at 12 months.
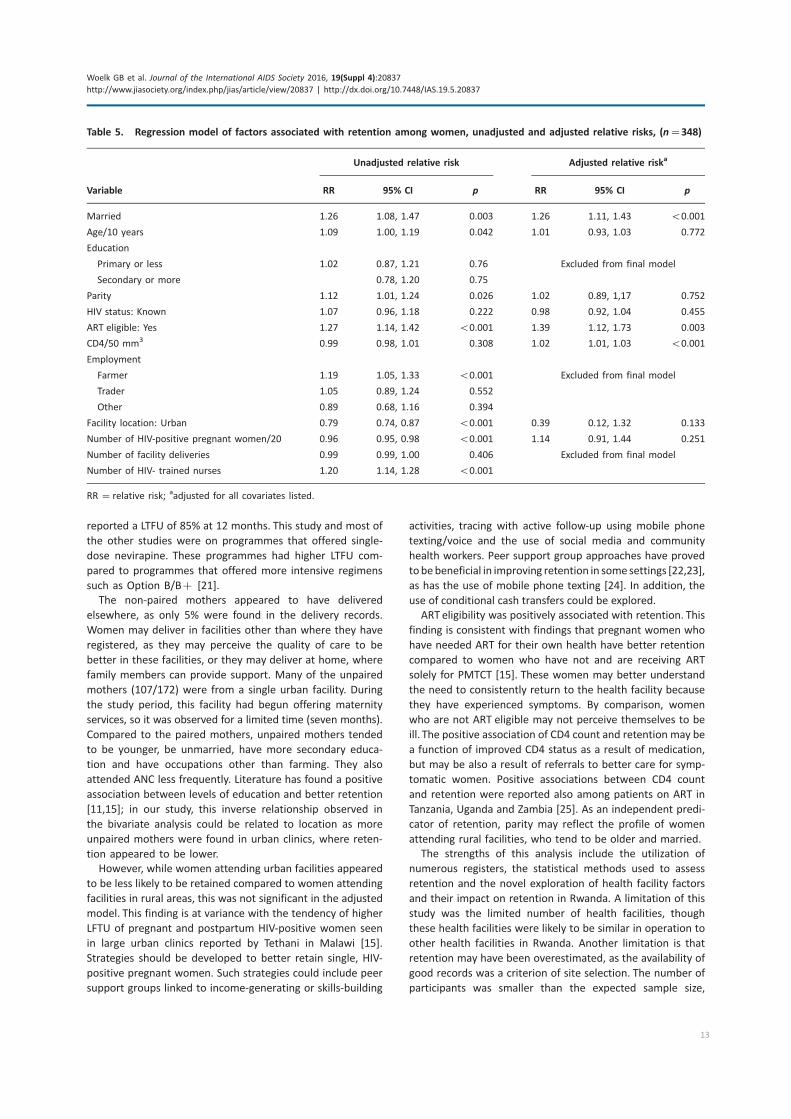
In the final model, employment (defined as farmer versus
non-farmer) was excluded as it failed to reach significance in
an earlier multivariate model. The number of HIV-trained
nurses was also dropped as the model did not converge.
Table 5 presents the univariate and final multivariate models.
In the final model, mothers who were married/living as
married were 1.26 (95% CI: 1.11, 1.43) times more likely to
be retained than mothers who were single or divorced/
separated. Mothers who were eligible for ART for their own
health were 1.39 (95% CI: 1.12, 1.73) times more likely to
be retained than those who were receiving ART solely for
PMTCT. CD4 count was independently and positively asso-
ciated with retention (ARR: 1.02 per 50 mm3 increase in CD4;
95% CI: 1.01, 1.03). Mother’s parity and age, HIV status at the
time of registration, number of HIV-positive pregnant women
seen at a facility and facility location (urban/rural) were not
significantly associated with retention.
Table 2. Description of the health facilities (N�5)
VariableaUrban (Monthly
Min�Max)
Urban (Monthly
Min�Max)
Urban (Monthly
Min�Max)
Rural (Monthly
Min�Max)
Rural (Monthly
Min�Max) Mean (SD)
Number of ANC clients 880 (39�102) 1885 (121�192) 2254 (154�219) 1124 (72�119) 1350 (79�149) 1498.6 (562.4)
Number of HIV� pregnant
women
50 (2�9) 156 (7�19) 81 (3�9) 34 (2�7) 31 (1�5) 70.4 (51.8)
Number of deliveries 403 (19�63) 393 (54�93) 713 (65�130) 640 (38�74) 1086 (54�131) 647.0 (283.4)
Number of health staff 31 35 38 24 18 29.2 (8.2)
Number of HIV- trained
nurses
11 10 8 12 10 10.2 (1.5)
Number of doctor visitsb last
quarter
� 9 0 12 8 7.3 (5.1)
aData for 2011; bdoctors normally visit health facilities for consultation, supervision and support purposes.
Woelk GB et al. Journal of the International AIDS Society 2016, 19(Suppl 4):20837
http://www.jiasociety.org/index.php/jias/article/view/20837 | http://dx.doi.org/10.7448/IAS.19.5.20837
10
DiscussionWe found that the majority of loss-to-follow-up for mothers
occurred early in the course of the PMTCT programme, with
loss of 33% of mothers overall by 30 days after registration
into the programme (26% for paired and 44% for unpaired
mothers). The high early loss-to-follow-up in our study is
similar to that in a Malawi study in which the highest loss of
pregnant HIV-positive women occurred soon after diagnosis
[15]. After this initial loss, retention decreased by only 10%
between 6 weeks and 12 months post-delivery. Retention for
mothers was 68% at six weeks post-delivery, decreasing to
58% by 12 months post-delivery.
Overall retention for infants was better than for mothers,
with 81% retained at 12 months. For mothers and infants
whose records were able to be linked as mother-baby pairs,
retention was similar for mothers and infants, 74% at 12
months for mothers and 79% for infants. Factors associated
with maternal retention were marital status, parity, CD4 count
(per 50 mm3 increase), whether ART was being received for
maternal health, rural health facility location and number of
HIV-positive pregnant women seen at the facility.
The proportion of women evaluated as mother-infant pairs
retained at 12 months post-delivery found in this study (74%)
is similar to data reported by the Rwandan Ministry of
Health, which indicated that 70% of women are retained
[20]. The 81% infant retention at 12 months is significantly
higher than the retention rates for Sub-Saharan Africa
reported in systematic review and met-analysis [21]. LFTU
among HEI at three months had a pooled estimate of 34%
from 11 studies in African countries. A South African study
Table 3. Mothers’a and infants’ retention at specified time intervals
Section A
Mothers’ retentiona Infants’ retention
Time Intervals N expt. N (Prop.) 95% CI N expt. N (Prop.) 95% CI
30 days 318 213 (0.67) 0.62, 0.72 N/A N/A N/A
Delivery 308 205 (0.67) 0.62, 0.72 N/A N/A N/A
6 weeks 300 203 (0.68) 0.63, 0.73 285 218 (0.77) 0.71, 0.81
2�4 months 300 201 (0.67) 0.62, 0.72 285 243 (0.85) 0.81, 0.89
5�7 months 300 193 (0.64) 0.59, 0.69 285 259 (0.91) 0.88, 0.94
8�10 months 298 185 (0.62) 0.56, 0.68 283 247 (0.87) 0.83, 0.91
11�13 months 298 172 (0.58) 0.52, 0.64 283 228 (0.81) 0.76, 0.86
Section B
Paired mother’s retentionb Paired infants’ retention
Time Intervals N expt. N (Prop.) 95% CI N expt. N (Prop.) 95% CI
30 days 200 147 (0.74) 0.68, 80.0 N/A N/A N/A
Delivery 200 200 (0.100) N/A N/A N/A N/A
6 weeks 198 166 (0.84) 0.79, 0.89 198 161 (0.82) 0.76, 0.86
2�4 months 198 167 (0.84) 0.79, 0.89 198 173 (0.88) 0.82, 0.92
5�7 months 198 165 (0.83) 0.78, 0.88 198 177 (0.90) 0.85, 0.93
8�10 months 196 155 (0.79) 0.73, 0.85 196 168 (0.86) 0.81, 0.91
11�13 months 196 144 (0.74) 0.68, 0.80 196 154 (0.79) 0.73, 0.85
Section C
Non-paired mother’s retentiona
Time intervals N expt. N (Prop.) 95% CI
30 days 118 66 (0.56) 0.47, 0.65
Delivery 108 5 (0.05) 0.009, 0.09
6 weeks 102 37 (0.37) 0.28, 0.46
2�4 months 102 34 (0.34) 0.25, 0.43
5�7 months 102 28 (0.28) 0.19, 9.37
8�10 months 102 30 (0.30) 0.21, 0.39
11�13 months 102 28 (0.28) 0.19, 0.37
aAnalysis based on 348 mothers; bpaired mothers; linked mother-infant records.
Woelk GB et al. Journal of the International AIDS Society 2016, 19(Suppl 4):20837
http://www.jiasociety.org/index.php/jias/article/view/20837 | http://dx.doi.org/10.7448/IAS.19.5.20837
11
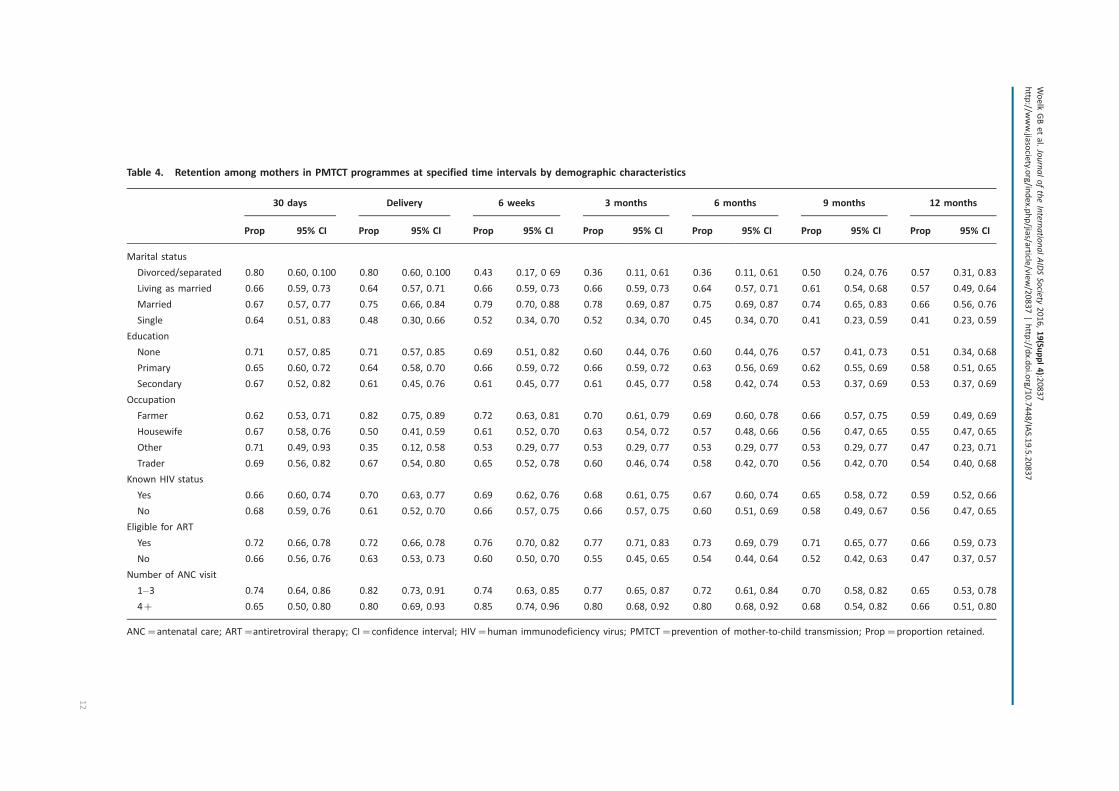
Table 4. Retention among mothers in PMTCT programmes at specified time intervals by demographic characteristics
30 days Delivery 6 weeks 3 months 6 months 9 months 12 months
Prop 95% CI Prop 95% CI Prop 95% CI Prop 95% CI Prop 95% CI Prop 95% CI Prop 95% CI
Marital status
Divorced/separated 0.80 0.60, 0.100 0.80 0.60, 0.100 0.43 0.17, 0 69 0.36 0.11, 0.61 0.36 0.11, 0.61 0.50 0.24, 0.76 0.57 0.31, 0.83
Living as married 0.66 0.59, 0.73 0.64 0.57, 0.71 0.66 0.59, 0.73 0.66 0.59, 0.73 0.64 0.57, 0.71 0.61 0.54, 0.68 0.57 0.49, 0.64
Married 0.67 0.57, 0.77 0.75 0.66, 0.84 0.79 0.70, 0.88 0.78 0.69, 0.87 0.75 0.69, 0.87 0.74 0.65, 0.83 0.66 0.56, 0.76
Single 0.64 0.51, 0.83 0.48 0.30, 0.66 0.52 0.34, 0.70 0.52 0.34, 0.70 0.45 0.34, 0.70 0.41 0.23, 0.59 0.41 0.23, 0.59
Education
None 0.71 0.57, 0.85 0.71 0.57, 0.85 0.69 0.51, 0.82 0.60 0.44, 0.76 0.60 0.44, 0,76 0.57 0.41, 0.73 0.51 0.34, 0.68
Primary 0.65 0.60, 0.72 0.64 0.58, 0.70 0.66 0.59, 0.72 0.66 0.59, 0.72 0.63 0.56, 0.69 0.62 0.55, 0.69 0.58 0.51, 0.65
Secondary 0.67 0.52, 0.82 0.61 0.45, 0.76 0.61 0.45, 0.77 0.61 0.45, 0.77 0.58 0.42, 0.74 0.53 0.37, 0.69 0.53 0.37, 0.69
Occupation
Farmer 0.62 0.53, 0.71 0.82 0.75, 0.89 0.72 0.63, 0.81 0.70 0.61, 0.79 0.69 0.60, 0.78 0.66 0.57, 0.75 0.59 0.49, 0.69
Housewife 0.67 0.58, 0.76 0.50 0.41, 0.59 0.61 0.52, 0.70 0.63 0.54, 0.72 0.57 0.48, 0.66 0.56 0.47, 0.65 0.55 0.47, 0.65
Other 0.71 0.49, 0.93 0.35 0.12, 0.58 0.53 0.29, 0.77 0.53 0.29, 0.77 0.53 0.29, 0.77 0.53 0.29, 0.77 0.47 0.23, 0.71
Trader 0.69 0.56, 0.82 0.67 0.54, 0.80 0.65 0.52, 0.78 0.60 0.46, 0.74 0.58 0.42, 0.70 0.56 0.42, 0.70 0.54 0.40, 0.68
Known HIV status
Yes 0.66 0.60, 0.74 0.70 0.63, 0.77 0.69 0.62, 0.76 0.68 0.61, 0.75 0.67 0.60, 0.74 0.65 0.58, 0.72 0.59 0.52, 0.66
No 0.68 0.59, 0.76 0.61 0.52, 0.70 0.66 0.57, 0.75 0.66 0.57, 0.75 0.60 0.51, 0.69 0.58 0.49, 0.67 0.56 0.47, 0.65
Eligible for ART
Yes 0.72 0.66, 0.78 0.72 0.66, 0.78 0.76 0.70, 0.82 0.77 0.71, 0.83 0.73 0.69, 0.79 0.71 0.65, 0.77 0.66 0.59, 0.73
No 0.66 0.56, 0.76 0.63 0.53, 0.73 0.60 0.50, 0.70 0.55 0.45, 0.65 0.54 0.44, 0.64 0.52 0.42, 0.63 0.47 0.37, 0.57
Number of ANC visit
1�3 0.74 0.64, 0.86 0.82 0.73, 0.91 0.74 0.63, 0.85 0.77 0.65, 0.87 0.72 0.61, 0.84 0.70 0.58, 0.82 0.65 0.53, 0.78
4� 0.65 0.50, 0.80 0.80 0.69, 0.93 0.85 0.74, 0.96 0.80 0.68, 0.92 0.80 0.68, 0.92 0.68 0.54, 0.82 0.66 0.51, 0.80
ANC�antenatal care; ART�antiretroviral therapy; CI�confidence interval; HIV�human immunodeficiency virus; PMTCT�prevention of mother-to-child transmission; Prop�proportion retained.
Woelk
GBetal.JournaloftheInternatio
nalAIDSSocie
ty2016,19(Suppl4):2
0837
http
://www.jia
socie
ty.org/in
dex.p
hp/jia
s/article
/view/20837|http
://dx.d
oi.org/10.7448/IA
S.19.5.20837
12
reported a LTFU of 85% at 12 months. This study and most of
the other studies were on programmes that offered single-
dose nevirapine. These programmes had higher LTFU com-
pared to programmes that offered more intensive regimens
such as Option B/B� [21].
The non-paired mothers appeared to have delivered
elsewhere, as only 5% were found in the delivery records.
Women may deliver in facilities other than where they have
registered, as they may perceive the quality of care to be
better in these facilities, or they may deliver at home, where
family members can provide support. Many of the unpaired
mothers (107/172) were from a single urban facility. During
the study period, this facility had begun offering maternity
services, so it was observed for a limited time (seven months).
Compared to the paired mothers, unpaired mothers tended
to be younger, be unmarried, have more secondary educa-
tion and have occupations other than farming. They also
attended ANC less frequently. Literature has found a positive
association between levels of education and better retention
[11,15]; in our study, this inverse relationship observed in
the bivariate analysis could be related to location as more
unpaired mothers were found in urban clinics, where reten-
tion appeared to be lower.
However, while women attending urban facilities appeared
to be less likely to be retained compared to women attending
facilities in rural areas, this was not significant in the adjusted
model. This finding is at variance with the tendency of higher
LFTU of pregnant and postpartum HIV-positive women seen
in large urban clinics reported by Tethani in Malawi [15].
Strategies should be developed to better retain single, HIV-
positive pregnant women. Such strategies could include peer
support groups linked to income-generating or skills-building
activities, tracing with active follow-up using mobile phone
texting/voice and the use of social media and community
health workers. Peer support group approaches have proved
tobe beneficial in improving retention in some settings [22,23],
as has the use of mobile phone texting [24]. In addition, the
use of conditional cash transfers could be explored.
ART eligibility was positively associated with retention. This
finding is consistent with findings that pregnant women who
have needed ART for their own health have better retention
compared to women who have not and are receiving ART
solely for PMTCT [15]. These women may better understand
the need to consistently return to the health facility because
they have experienced symptoms. By comparison, women
who are not ART eligible may not perceive themselves to be
ill. The positive association of CD4 count and retention may be
a function of improved CD4 status as a result of medication,
but may be also a result of referrals to better care for symp-
tomatic women. Positive associations between CD4 count
and retention were reported also among patients on ART in
Tanzania, Uganda and Zambia [25]. As an independent predi-
cator of retention, parity may reflect the profile of women
attending rural facilities, who tend to be older and married.
The strengths of this analysis include the utilization of
numerous registers, the statistical methods used to assess
retention and the novel exploration of health facility factors
and their impact on retention in Rwanda. A limitation of this
study was the limited number of health facilities, though
these health facilities were likely to be similar in operation to
other health facilities in Rwanda. Another limitation is that
retention may have been overestimated, as the availability of
good records was a criterion of site selection. The number of
participants was smaller than the expected sample size,
Table 5. Regression model of factors associated with retention among women, unadjusted and adjusted relative risks, (n�348)
Unadjusted relative risk Adjusted relative riska
Variable RR 95% CI p RR 95% CI p
Married 1.26 1.08, 1.47 0.003 1.26 1.11, 1.43 B0.001
Age/10 years 1.09 1.00, 1.19 0.042 1.01 0.93, 1.03 0.772
Education
Primary or less 1.02 0.87, 1.21 0.76 Excluded from final model
Secondary or more 0.78, 1.20 0.75
Parity 1.12 1.01, 1.24 0.026 1.02 0.89, 1,17 0.752
HIV status: Known 1.07 0.96, 1.18 0.222 0.98 0.92, 1.04 0.455
ART eligible: Yes 1.27 1.14, 1.42 B0.001 1.39 1.12, 1.73 0.003
CD4/50 mm3 0.99 0.98, 1.01 0.308 1.02 1.01, 1.03 B0.001
Employment
Farmer 1.19 1.05, 1.33 B0.001 Excluded from final model
Trader 1.05 0.89, 1.24 0.552
Other 0.89 0.68, 1.16 0.394
Facility location: Urban 0.79 0.74, 0.87 B0.001 0.39 0.12, 1.32 0.133
Number of HIV-positive pregnant women/20 0.96 0.95, 0.98 B0.001 1.14 0.91, 1.44 0.251
Number of facility deliveries 0.99 0.99, 1.00 0.406 Excluded from final model
Number of HIV- trained nurses 1.20 1.14, 1.28 B0.001
RR � relative risk; aadjusted for all covariates listed.
Woelk GB et al. Journal of the International AIDS Society 2016, 19(Suppl 4):20837
http://www.jiasociety.org/index.php/jias/article/view/20837 | http://dx.doi.org/10.7448/IAS.19.5.20837
13
which reduced the power to detect differences in retention
by the study variables. Finally, the data collection methods
were comprehensive, but complicated because of the number
of paper-based registers, and the lack of an electronic linkage
mechanism among the registers and between mother and
infant records.
ConclusionsOur data suggest that unmarried, apparently healthy, HIV-
positive pregnant women are at the greatest risk of being
lost-to-follow-up and may require additional support for pro-
gramme retention. With new recommendations that lifelong
ART should be started in all HIV-positive individuals, including
pregnant women, strategies are needed to identify, provide
support and trace those women at highest risk of LFTU. These
strategies could include risk profiling and support groups for
these women. Our study provides further evidence that a
targeted supportive approach, allowing a focus of additional
resources to the group of women at the highest risk of being
lost, would be appropriate. Areas for further research include
closer examination of the factors that could improve reten-
tion in urban areas, such as the use of mobile phones/texting
and social media, peer groups linked to income generating/
skills building activities. Research on facility-level factors
could include enhanced counselling, and the optimization of
patient tracking, staffing levels and configuration.
Authors’ affiliations1Elizabeth Glaser Pediatric AIDS Foundation, Washington, DC, USA; 2Elizabeth
Glaser Pediatric AIDS Foundation, Kigali, Rwanda; 3Department of Epidemiol-
ogy and Biostatistics, Milken Institute School of Public Health, George
Washington University, Washington, DC, USA; 4Rwanda Biomedical Center,
Ministry of Health, Kigali, Rwanda; 5Office of HIV/AIDS, United States Agency
for International Development, Washington, DC, USA
Competing interests
The authors declare that they have no competing interests.
Authors’ contributions
GW was responsible for developing the study protocol as well as conducting
the analysis and interpretation of data. DN was responsible for data collection,
study coordination, analysis and interpretation of the findings. SB was
responsible for drafting the manuscript as well as interpretation of the data.
EN and HH were responsible for statistical modelling and analyses PM and MR
contributed to protocol development and review of the manuscript. AA and RP
contributed to protocol and manuscript development. All authors have read
and approved the final manuscript.
Acknowledgements and funding
This study was made possible through support provided by the President’s
Emergency Plan for AIDS Relief and the United States Agency for International
Development (USAID) via HIVCore, a Task Order funded by USAID under the
Project SEARCH indefinite quantity contract (Contract No. AID-OAA-TO-11-
00060). The Task Order is led by the Population Council in partnership with the
Elizabeth Glaser Pediatric AIDS Foundation, Palladium, and the University
of Washington. The authors’ views expressed in this manuscript do not
necessarily reflect the views of USAID or the United States Government.
References
1. UNAIDS Fact Sheet 2015 [Internet]. [cited 2016 Mar 24]. Available from:
http://www.unaids.org/en/resources/campaigns/HowAIDSchangedeverything/
factsheet
2. UNAIDS. Countdown to zero: global plan towards the elimination of new
HIV infections among children by 2015 and keeping their mothers alive
[Internet]. 2011. [cited 2014 Jun 6]. Available from: http://www.unaids.org/
sites/default/files/media_asset/20110609_JC2137_Global-Plan-Elimination-HIV-
Children_en_1.pdf
3. Horstmann E, Brown J, Islam F, Buck J. Retaining patients in HIV-care: where
are we? Where do we go from here? Clin Infect Dis. 2010;50(5):752�61. doi:http://dx.doi.org/10.1086/649933
4. World Health Organization, PMTCT strategic vision 2010�2015. Preventingmother-to-child transmission of HIV to reach the UNGASS and Millennium
Development Goals 2010 [Internet]. [cited 2014 Jul 7]. Available from: http://
www.who.int/hiv/pub/mtct/strategic_vision/en/
5. Pati R, Lahuerta M, Elul B, Okamura M, Alvim MF, Schackman B, et al.
Factors associated with loss to clinic among HIV patients not yet known to be
eligible for antiretroviral therapy (ART) in Mozambique. J Int AIDS Soc.
2013;16:18490, doi: http://dx.doi.org/10.7448/IAS.16.1.18490
6. Boyles TH, Wilkinson LS, Leisegang R, Maartens G. Factors influencing
retention in care after starting antiretroviral therapy in a rural South African
programme. PLoS One. 2011;6(5):e19201. doi: http://dx.doi.org/10.1371/
journal.pone.0019201
7. Clouse K, Pettifor A, Maskew M, Bassett J, Van Rie A, Gay C, et al. Initiating
antiretroviral therapy when presenting with higher CD4 cell counts results in
reduced loss to follow-up in a resource-limited setting. AIDS. 2013;27(4):
645�50. doi: http://dx.doi.org/10.1097/QAD.0b013e32835c12f98. Hiarlaithe M, Grede N, Pee S, Bloem M. Economic and social factors
are some of the most common barriers preventing women from accessing
maternal and newborn child health (MNCH) and prevention of mother-to-child
transmission (PMTCT) services: a literature review. AIDS Behav. 2014;S516�30.doi: http://dx.doi.org/10.007/s10461-014-07560-5
9. Ferguson L, Grant AD, Lewis J, Kielmann K, Watson-Jones D, Vusha S, et al.
Linking women who test HIV-positive in pregnancy-related services to HIV
care and treatment services in Kenya: a missed methods prospective cohort
study. PLoS One. 2014;9(3):E89764. doi: http://dx.doi.org/10.1371/journal.
pone.0089764
10. Gourlay A, Birdthistle I, Gitau M, Iorpenda K, Wringe A. Barriers and
facilitating factors to the uptake of antiretroviral drugs for prevention of
mother-to-child-transmission of HIV in sub-Saharan Africa: a systematic review.
J Int AIDS Soc. 2013;16(1):18588, doi: http://dx.doi.org/10.7448/IAS.16.1.
18588
11. Kalembo F, Zgambo M. Loss to follow up: a major challenge to successful
implementation of prevention of mother-to-child transmission of HIV-1 pro-
grams in sub-Saharan Africa. ISRN AIDS. 2012;2012:589817. doi: http://dx.doi.
org/10.5402/2012/589817
12. Ngarina M, Popenoe R, Kilewo C, Biberfeld G, Ekstrom AM. Reasons for
poor adherence to antiretroviral therapy postnatally in HIV-1 infected women
treated for their own health: experiences from the Mitra Plus study in Tanzania.
BMC Public Health. 2013;13:450. doi: http://dx.doi.org/10.1186/1471-2458-
13-450
13. Lerebo W, Callens S, Jackson D, Zarowsky C, Temmerman M. Identifying
factors associated with the uptake of prevention of mother-to-child transmis-
sion programme in Tigray region, Ethiopia: a multilevel modeling approach.
BMC Health Serv Res. 2014;14(1):181.
14. Bedelu M, Ford N, Hilderbrand K, Reuter H. Implementing antiretroviral
therapy in rural communities: the Lusikisiki model of decentralized HIV/AIDS
care. J Infect Dis. 2007;196 Suppl 3:S464�8. doi: http://dx.doi.org/10.1086/521114
15. Tenthani L, Haas AD, Tweya H, Jahn A, van Oosterhout JJ, Chimbwandira F,
et al. Retention in care under universal antiretroviral therapy for HIV-infected
pregnant and breastfeeding women (‘‘Option B� ’’) in Malawi. AIDS.
2014;28(4):589�98. doi: http://dx.doi.org/10.1097/QAD.000000000000014316. Panditrao M, Darak S, Kulkarni V, Kulkarni S, Parchure R. Socio-
demographic factors associated with lost to follow-up of HIV-infected women
attending a private sector PMTCT program in Maharashtra, India. AIDS Care.
2011;23(5):593�600. doi: http://dx.doi.org/10.080/09540121.2010.51634817. Kurewa N, Gumbo F, Mapingure P, Munjoma M, Chirenje M, Rusakaniko S,
et al. Predictors of attrition among children born in PMTCT programme in
Zimbabwe follow up over 5 years. J Trop Pediatr. 2012;58(5):360�9. doi: http://dx.doi.org/10.1093/tropej/fmr112
18. UNAIDS. 2015 Progress Report on the Global Plan towards the elimination
of new HIV infections among children and keeping their mothers alive.
[Internet]. [cited 2016 Mar 24]. Available from: http://www.unaids.org/sites/
default/files/media_asset/JC2774_2015ProgressReport_GlobalPlan_en.pdf
19. Rwanda Ministry of Health, Rwanda Biomedical Center. Global
AIDS Response Progress Report (GAPR) 2014 [Internet]. [cited 2015 Nov 4].
Woelk GB et al. Journal of the International AIDS Society 2016, 19(Suppl 4):20837
http://www.jiasociety.org/index.php/jias/article/view/20837 | http://dx.doi.org/10.7448/IAS.19.5.20837
14

Available from: http://www.unaids.org/sites/default/files/country/documents/
RWA_narrative_report_2014.pdf
20. Government of Rwanda. Ministry of Health Report. Rwanda, Kigali:
Government of Rwanda; 2012.
21. Sibanda EL, Weller IVD, Hakim JG, Cowan FM. The magnitude of loss to
follow-up of HIV-exposed infants along the prevention of mother-to-child HIV
transmission continuum of care: a systematic review and meta-analysis. AIDS.
2013;27:2787�97.22. Futterman D, Shea J, Besser M, Stafford S, Desmond K, Comulada WS,
et al. Mamekhaya: a pilot study combining a cognitive-behavioral interven-
tion and mentor mothers with PMTCT services in South Africa. AIDS Care.
2010;22:1093�100.
23. Rotheram-Borus M-J, Richter L, Van Rooyen H, van Heerden A, Tomlinson
M, Stein A, et al. Project Masihambisane: a cluster randomised controlled trial
with peer mentors to improve outcomes for pregnant mothers living with HIV.
Trials. 2011;12:2.
24. Odeny TA, Bukusi EA, Cohen CR, Yuhas K, Camlin CS, McClelland RS. Texting
improves testing: a randomized trial of two-way SMS to increase postpartum
prevention of mother-to-child transmission retention and infant HIV testing.
AIDS. 2014;28(15):2307�12.25. Koole O, Tsui S, Wabwire-Mangen F, Kwesigabo G, Menten J, Mulenga M,
et al. Retention and risk factors for attrition among adults in antiretroviral
treatment programmes in Tanzania, Uganda and Zambia. Trop Med Int Health.
2014;19(12):1397�410.
Woelk GB et al. Journal of the International AIDS Society 2016, 19(Suppl 4):20837
http://www.jiasociety.org/index.php/jias/article/view/20837 | http://dx.doi.org/10.7448/IAS.19.5.20837
15
Research article
Factors associated with long-term antiretroviral therapy attrition
among adolescents in rural Uganda: a retrospective study
Stephen Okoboi§,1, Livingstone Ssali1, Aisha I Yansaneh2, Celestin Bakanda1, Josephine Birungi1, Sophie Nantume1,
Joanne Lyavala Okullu1, Alana R Sharp3, David M Moore4,5 and Samuel Kalibala6
§Corresponding author: Stephen Okoboi, The AIDS Support Organization-TASO, Headquarters, Mulago Hospital Complex, P.O. BOX 10443, Kampala-Uganda.
Tel: �256414532580/1. Fax: �256414541288. ([email protected] or [email protected])
Abstract
Introduction: As access to antiretroviral therapy (ART) increases, the success of treatment programmes depends on ensuring
high patient retention in HIV care. We examined retention and attrition among adolescents in ART programmes across clinics
operated by The AIDS Support Organization (TASO) in Uganda, which has operated both facility- and community-based
distribution models of ART delivery since 2004.
Methods: Using a retrospective cohort analysis of patient-level clinical data, we examined attrition and retention in HIV care and
factors associated with attrition among HIV-positive adolescents aged 10�19 years who initiated ART at 10 TASO clinics between
January 2006 and December 2011. Retention in care was defined as the proportion of adolescents who had had at least one
facility visit within the six months prior to 1 June 2013, and attrition was defined as the proportion of adolescents who died,
were lost to follow-up, or stopped treatment. Descriptive statistics and Cox proportional hazards regression models were used to
determine the levels of retention in HIV care and the factors associated with attrition following ART initiation.
Results: A total of 1228 adolescents began ART between 2006 and 2011, of whom 57% were female. The median duration in HIV
care was four years (IQR�3�6 years). A total of 792 (65%) adolescents were retained in care over the five-year period; 36 (3%)
had died or transferred out and 400 (32%) were classified as loss to follow-up. Factors associated with attrition included being
older (adjusted hazard ratio (AHR)�1.38, 95% confidence interval (CI) 1.02�1.86), having a higher CD4 count (250� cells/mm3)
at treatment initiation (AHR�0.49, 95% CI 0.34�0.69) and HIV care site with a higher risk of attrition among adolescents in Gulu
(AHR�2.26; 95% CI 1.27�4.02) and Masindi (AHR�3.30, 95% CI 1.87�5.84) and a lower risk of attrition in Jinja (AHR�0.24,
95% CI 0.08�0.70). Having an advanced WHO clinical stage at initiation was not associated with attrition.
Conclusions: We found an overall retention rate of 65%, which is comparable to rates achieved by TASO’s adult patients and
adolescents in other studies in Africa. Variations in the risk of attrition by TASO treatment site and by clinical and demographic
characteristics suggest the need for early diagnosis of HIV infection, use of innovative approaches to reach and retain
adolescents living with HIV in treatment and identifying specific groups, such as older adolescents, that are at high risk of
dropping out of treatment for targeted care and support.
Keywords: adolescents; HIV treatment; antiretroviral therapy; retention; attrition; community-based delivery; Uganda.
Received 25 November 2015; Revised 27 April 2016; Accepted 9 May 2016; Published 20 July 2016
Copyright:– 2016 Okoboi S et al; licensee International AIDS Society. This is an Open Access article distributed under the terms of the Creative Commons Attribution
3.0 Unported (CC BY 3.0) License (http://creativecommons.org/licenses/by/3.0/), which permits unrestricted use, distribution, and reproduction in any medium,
provided the original work is properly cited.
IntroductionThe burden of HIV in Africa is increasingly on adolescents and
young adults. Worldwide, adolescents represent 41% of new
HIV infections and are the only age group with increasing
death rates due to AIDS [1]. Most of the adolescents living
with HIV in sub-Saharan Africa (SSA) are girls and young
women, who are particularly vulnerable due to such factors as
early sexual debut, age disparate sexual partnerships, gender
inequality and biological susceptibility [2]. Also of concern are
adolescent members of key populations, including adoles-
cents involved in sex work or using drugs, and young males
who have sex with males [2].
Despite early successes in the HIV response in Uganda,
HIV prevalence among the general population has steadily
increased from 6.4% in 2005 to 7.3% in 2011. Risky sexual
behaviours, inconsistent condom use, multiple sexual partner-
ships and low levels of male circumcision contribute to HIV
acquisition and transmission in the country [3]. Like elsewhere
in SSA, the HIV epidemic in Uganda continues to disproportio-
nately affect young women [3,4]. Among adolescents aged 15
to 19 years, HIV prevalence is estimated at 2.4%, with a higher
prevalence among females (3.0%) than males (1.7%) [4].
As antiretroviral therapy (ART) programmes are rolled
out, the retention of adolescent patients in HIV care has
gained more attention in recent years [5,6]. Yet adolescents
face unique barriers to care and treatment, including being
unaware of their sero-status due to a lack of disclosure, diffi-
culties in transitioning frompaediatric care to self-management,
and family structural factors, in addition to the common
psychosocial, economic, health systems and medical barriers
Okoboi S et al. Journal of the International AIDS Society 2016, 19(Suppl 4):20841
http://www.jiasociety.org/index.php/jias/article/view/20841 | http://dx.doi.org/10.7448/IAS.19.5.20841
16
faced by adult patients on ART [5,7]. Adolescents and young
adults have significantly higher rates of loss to follow-up from
HIV care and treatment than adults, which also contribute to
their comparatively poorer outcomes [8,9].
Several strategies have been proposed for better engaging
this population, including removing age-related barriers to
care [10], developing new HIV testing modalities [11,12]
and improving management of the transition from paediatric
to adult care [13,14]. However, the evidence on retention
and reducing loss to follow-up in HIV care programmes is
limited for adolescents and targeted research is critical for
improving treatment outcomes and reducing morbidity and
mortality in this group 18 [6,15�18].As one of the largest non-governmental ART programmes
in Uganda, The AIDS Support Organization (TASO) was
founded in 1987 with the aim of providing patient support
for people living with HIV. In 2005, TASO started implementing
a family-centred testing, treatment and counselling approach
if there was a suspicion that any family member was HIV
positive, after noticing that patients were sharing drugs with
their family members, including parents sharing drugs with
their children, and parents sharing drugs among themselves.
TASO’s family-centred approach involved conducting home-
based HIV counselling and testing to family members of
the index patients. Those who tested positive within the
family were assessed for ART eligibility using CD4 cell count
and World Health Organization (WHO) staging, and if eligible,
were linked to TASO’s centre for treatment. Those not eligible
were linked to TASO for appropriate care and support services
and those who tested negative were counselled on risk
reduction. TASO used the household-based approach in order
to enhance access to testing, counselling and treatment
services for all family members including their children and
adolescents.
This paper examines the extent of retention in HIV care and
the factors associated with attrition of adolescents aged 10 to
19 years in TASO’s HIV treatment programmes in Uganda.
MethodsStudy design
The study involved a retrospective secondary analysis of
clinical data of adolescents aged 10�19 years collected from
10 of the 11 clinics operated by TASO. We excluded TASO
Mulago because the site was not providing ART to adoles-
cents during the study period (all adolescents from this
site were linked for specialized ART care to Baylor Uganda).
Data were extracted on HIV-positive adolescents from a
central electronic database at TASO headquarters in Kampala.
Study setting and data collection
As one of the largest non-governmental ART programmes in
the country, TASO operates 11 ART service centres across all
the regions of Uganda with funding from the United States
President’s Emergency Plan for AIDS Relief (PEPFAR). These
centres are located in mainly rural parts of Uganda and serve
a mean catchment area with a 75-km radius. As of 2015, the
organization had provided treatment to over 68,020 clients,
of whom more than 6% were children and adolescents.
TASO has implemented and revised several service delivery
models over the past 10 years, including home-based care,
satellite clinics, community drug distribution, as well as more
conventional clinic-based approaches. Starting in late 2015,
annual routine viral load monitoring is performed as part
of TASO’s ART programme. Adolescents who have been on
ART for more than one year, and are aware of their HIV
sero-status, are evaluated by clinicians and counsellors for
downward referral to community drug distribution points
(CDDPs). Community-drug distribution is a care model for
stable patients designed to make ART delivery more efficient
for the health system and provide appropriate support
to encourage the long-term retention of patients. ART is
provided at the community level by trained lay workers who
are supervised by a clinical services supervisor. Adherence to
drug regimens is evaluated by staff at the time of pill refill
by asking patients to self-report the number of pills missed.
Adolescents who have difficulty coping with decentralized ART
care service at CDDPs are referred back up to the facility-based
care delivery model.
Data were extracted from the pre-ART register, ART case
evaluation forms, laboratory registry, death registry, ART
commencement forms and drug refill forms. Each dataset
contains a unique client identification number that merges
information pertaining to the same individual from the
different datasets. Information was collected on a total of
1228 HIV-positive adolescents aged 10�19 years who enrolledin ART between January 2006 and December 2011 from 10
TASO centres. Data extracted included clients’ socio-demo-
graphic characteristics, ARTstart date, treatment regimen, CD4
cell count at enrolment, WHO clinical staging and pharmacy
refill data. The datasets also contained information on known
deaths and patients who transferred out of the programme.
Patient charts were used to supplement the information from
the clinical datasets as necessary.
Data analysis
The study outcomes of interest are HIV care retention and
attrition. The indicators for retention; mortality, reported as
death at TASO and attrition, were generated by identifying
adolescents who enrolled in ART between 2006 and 2011 and
had at least one clinic visit within the six months before 1 June
2013. Retention was defined as any patient who had at least
one clinic visit in the six months before June 2013; was still
alive at the end of June 2013, excluding those deaths reported
to TASO stopped ART; or was lost to follow-up (LTFU) [19].
Attrition was defined as the number of adolescents whose
deaths that were reported to TASO, who were LTFU or who
stopped treatment by the end of June 2013. Patients were
defined as LTFU if the last contact was more than three
months before the end date of the observation period and
they were censored at their last contact date with a TASO
service. Married was defined as an adolescent who is married
or co-habiting with a sexual partner during the review period.
Data were analyzed using descriptive statistics and multi-
variable regression models in Stata version 12 [20]. Multi-
variable Cox proportional hazards regression models was used
to examine the factors associated with attrition. The results of
the analysis are presented as adjusted hazard ratio (AHR) with
Okoboi S et al. Journal of the International AIDS Society 2016, 19(Suppl 4):20841
http://www.jiasociety.org/index.php/jias/article/view/20841 | http://dx.doi.org/10.7448/IAS.19.5.20841
17
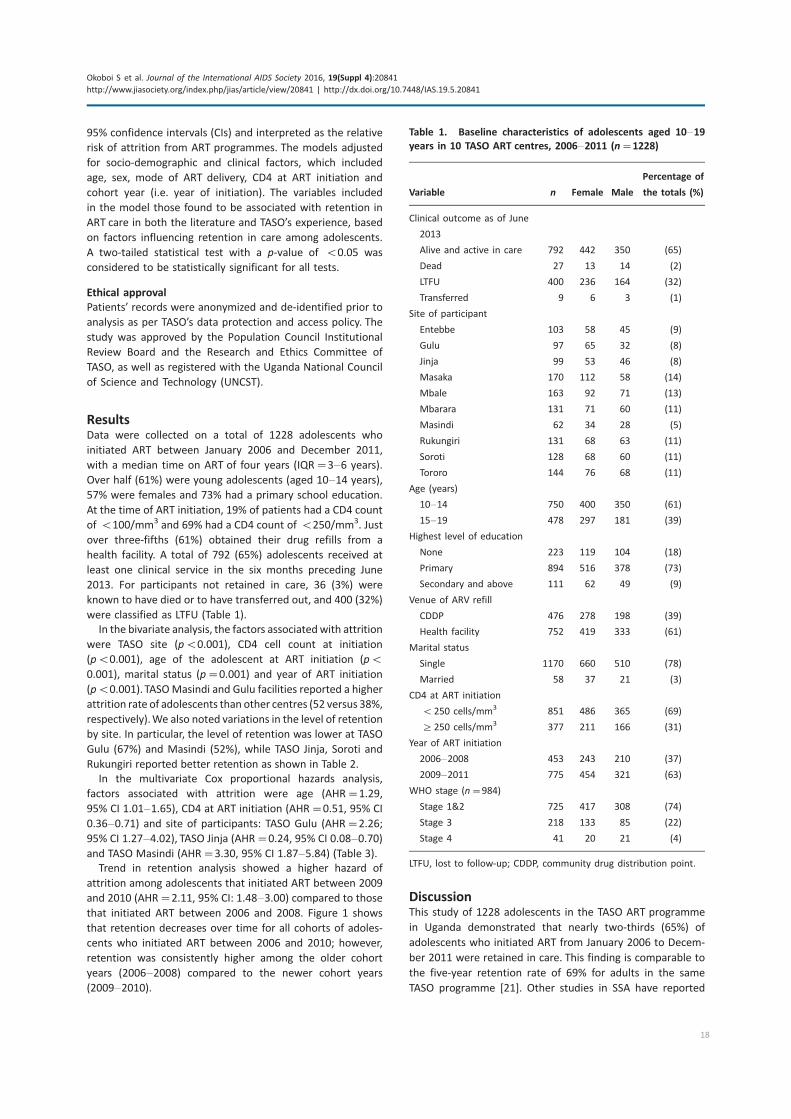
95% confidence intervals (CIs) and interpreted as the relative
risk of attrition from ART programmes. The models adjusted
for socio-demographic and clinical factors, which included
age, sex, mode of ART delivery, CD4 at ART initiation and
cohort year (i.e. year of initiation). The variables included
in the model those found to be associated with retention in
ART care in both the literature and TASO’s experience, based
on factors influencing retention in care among adolescents.
A two-tailed statistical test with a p-value of B0.05 was
considered to be statistically significant for all tests.
Ethical approval
Patients’ records were anonymized and de-identified prior to
analysis as per TASO’s data protection and access policy. The
study was approved by the Population Council Institutional
Review Board and the Research and Ethics Committee of
TASO, as well as registered with the Uganda National Council
of Science and Technology (UNCST).
ResultsData were collected on a total of 1228 adolescents who
initiated ART between January 2006 and December 2011,
with a median time on ART of four years (IQR�3�6 years).
Over half (61%) were young adolescents (aged 10�14 years),
57% were females and 73% had a primary school education.
At the time of ART initiation, 19% of patients had a CD4 count
of B100/mm3 and 69% had a CD4 count of B250/mm3. Just
over three-fifths (61%) obtained their drug refills from a
health facility. A total of 792 (65%) adolescents received at
least one clinical service in the six months preceding June
2013. For participants not retained in care, 36 (3%) were
known to have died or to have transferred out, and 400 (32%)
were classified as LTFU (Table 1).
In the bivariate analysis, the factors associatedwith attrition
were TASO site (pB0.001), CD4 cell count at initiation
(pB0.001), age of the adolescent at ART initiation (pB
0.001), marital status (p�0.001) and year of ART initiation
(pB0.001). TASOMasindi and Gulu facilities reported a higher
attrition rate of adolescents than other centres (52 versus 38%,
respectively).We also noted variations in the level of retention
by site. In particular, the level of retention was lower at TASO
Gulu (67%) and Masindi (52%), while TASO Jinja, Soroti and
Rukungiri reported better retention as shown in Table 2.
In the multivariate Cox proportional hazards analysis,
factors associated with attrition were age (AHR�1.29,
95% CI 1.01�1.65), CD4 at ART initiation (AHR�0.51, 95% CI
0.36�0.71) and site of participants: TASO Gulu (AHR�2.26;
95% CI 1.27�4.02), TASO Jinja (AHR�0.24, 95% CI 0.08�0.70)and TASO Masindi (AHR�3.30, 95% CI 1.87�5.84) (Table 3).Trend in retention analysis showed a higher hazard of
attrition among adolescents that initiated ART between 2009
and 2010 (AHR�2.11, 95% CI: 1.48�3.00) compared to those
that initiated ART between 2006 and 2008. Figure 1 shows
that retention decreases over time for all cohorts of adoles-
cents who initiated ART between 2006 and 2010; however,
retention was consistently higher among the older cohort
years (2006�2008) compared to the newer cohort years
(2009�2010).
DiscussionThis study of 1228 adolescents in the TASO ART programme
in Uganda demonstrated that nearly two-thirds (65%) of
adolescents who initiated ART from January 2006 to Decem-
ber 2011 were retained in care. This finding is comparable to
the five-year retention rate of 69% for adults in the same
TASO programme [21]. Other studies in SSA have reported
Table 1. Baseline characteristics of adolescents aged 10�19years in 10 TASO ART centres, 2006�2011 (n�1228)
Variable n Female Male
Percentage of
the totals (%)
Clinical outcome as of June
2013
Alive and active in care 792 442 350 (65)
Dead 27 13 14 (2)
LTFU 400 236 164 (32)
Transferred 9 6 3 (1)
Site of participant
Entebbe 103 58 45 (9)
Gulu 97 65 32 (8)
Jinja 99 53 46 (8)
Masaka 170 112 58 (14)
Mbale 163 92 71 (13)
Mbarara 131 71 60 (11)
Masindi 62 34 28 (5)
Rukungiri 131 68 63 (11)
Soroti 128 68 60 (11)
Tororo 144 76 68 (11)
Age (years)
10�14 750 400 350 (61)
15�19 478 297 181 (39)
Highest level of education
None 223 119 104 (18)
Primary 894 516 378 (73)
Secondary and above 111 62 49 (9)
Venue of ARV refill
CDDP 476 278 198 (39)
Health facility 752 419 333 (61)
Marital status
Single 1170 660 510 (78)
Married 58 37 21 (3)
CD4 at ART initiation
B250 cells/mm3 851 486 365 (69)
]250 cells/mm3 377 211 166 (31)
Year of ART initiation
2006�2008 453 243 210 (37)
2009�2011 775 454 321 (63)
WHO stage (n�984)
Stage 1&2 725 417 308 (74)
Stage 3 218 133 85 (22)
Stage 4 41 20 21 (4)
LTFU, lost to follow-up; CDDP, community drug distribution point.
Okoboi S et al. Journal of the International AIDS Society 2016, 19(Suppl 4):20841
http://www.jiasociety.org/index.php/jias/article/view/20841 | http://dx.doi.org/10.7448/IAS.19.5.20841
18
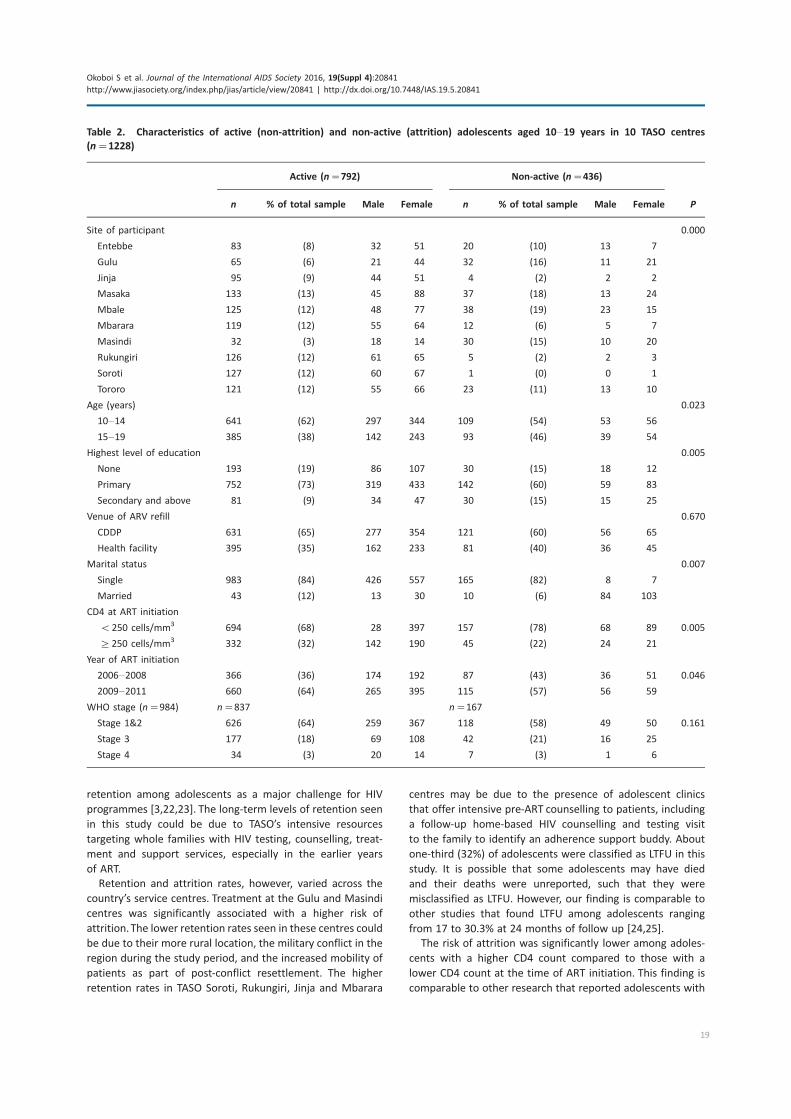
retention among adolescents as a major challenge for HIV
programmes [3,22,23]. The long-term levels of retention seen
in this study could be due to TASO’s intensive resources
targeting whole families with HIV testing, counselling, treat-
ment and support services, especially in the earlier years
of ART.
Retention and attrition rates, however, varied across the
country’s service centres. Treatment at the Gulu and Masindi
centres was significantly associated with a higher risk of
attrition.The lower retention rates seen in these centres could
be due to their more rural location, the military conflict in the
region during the study period, and the increased mobility of
patients as part of post-conflict resettlement. The higher
retention rates in TASO Soroti, Rukungiri, Jinja and Mbarara
centres may be due to the presence of adolescent clinics
that offer intensive pre-ART counselling to patients, including
a follow-up home-based HIV counselling and testing visit
to the family to identify an adherence support buddy. About
one-third (32%) of adolescents were classified as LTFU in this
study. It is possible that some adolescents may have died
and their deaths were unreported, such that they were
misclassified as LTFU. However, our finding is comparable to
other studies that found LTFU among adolescents ranging
from 17 to 30.3% at 24 months of follow up [24,25].
The risk of attrition was significantly lower among adoles-
cents with a higher CD4 count compared to those with a
lower CD4 count at the time of ART initiation. This finding is
comparable to other research that reported adolescents with
Table 2. Characteristics of active (non-attrition) and non-active (attrition) adolescents aged 10�19 years in 10 TASO centres
(n�1228)
Active (n�792) Non-active (n�436)
n % of total sample Male Female n % of total sample Male Female P
Site of participant 0.000
Entebbe 83 (8) 32 51 20 (10) 13 7
Gulu 65 (6) 21 44 32 (16) 11 21
Jinja 95 (9) 44 51 4 (2) 2 2
Masaka 133 (13) 45 88 37 (18) 13 24
Mbale 125 (12) 48 77 38 (19) 23 15
Mbarara 119 (12) 55 64 12 (6) 5 7
Masindi 32 (3) 18 14 30 (15) 10 20
Rukungiri 126 (12) 61 65 5 (2) 2 3
Soroti 127 (12) 60 67 1 (0) 0 1
Tororo 121 (12) 55 66 23 (11) 13 10
Age (years) 0.023
10�14 641 (62) 297 344 109 (54) 53 56
15�19 385 (38) 142 243 93 (46) 39 54
Highest level of education 0.005
None 193 (19) 86 107 30 (15) 18 12
Primary 752 (73) 319 433 142 (60) 59 83
Secondary and above 81 (9) 34 47 30 (15) 15 25
Venue of ARV refill 0.670
CDDP 631 (65) 277 354 121 (60) 56 65
Health facility 395 (35) 162 233 81 (40) 36 45
Marital status 0.007
Single 983 (84) 426 557 165 (82) 8 7
Married 43 (12) 13 30 10 (6) 84 103
CD4 at ART initiation
B250 cells/mm3 694 (68) 28 397 157 (78) 68 89 0.005
]250 cells/mm3 332 (32) 142 190 45 (22) 24 21
Year of ART initiation
2006�2008 366 (36) 174 192 87 (43) 36 51 0.046
2009�2011 660 (64) 265 395 115 (57) 56 59
WHO stage (n�984) n�837 n�167
Stage 1&2 626 (64) 259 367 118 (58) 49 50 0.161
Stage 3 177 (18) 69 108 42 (21) 16 25
Stage 4 34 (3) 20 14 7 (3) 1 6
Okoboi S et al. Journal of the International AIDS Society 2016, 19(Suppl 4):20841
http://www.jiasociety.org/index.php/jias/article/view/20841 | http://dx.doi.org/10.7448/IAS.19.5.20841
19
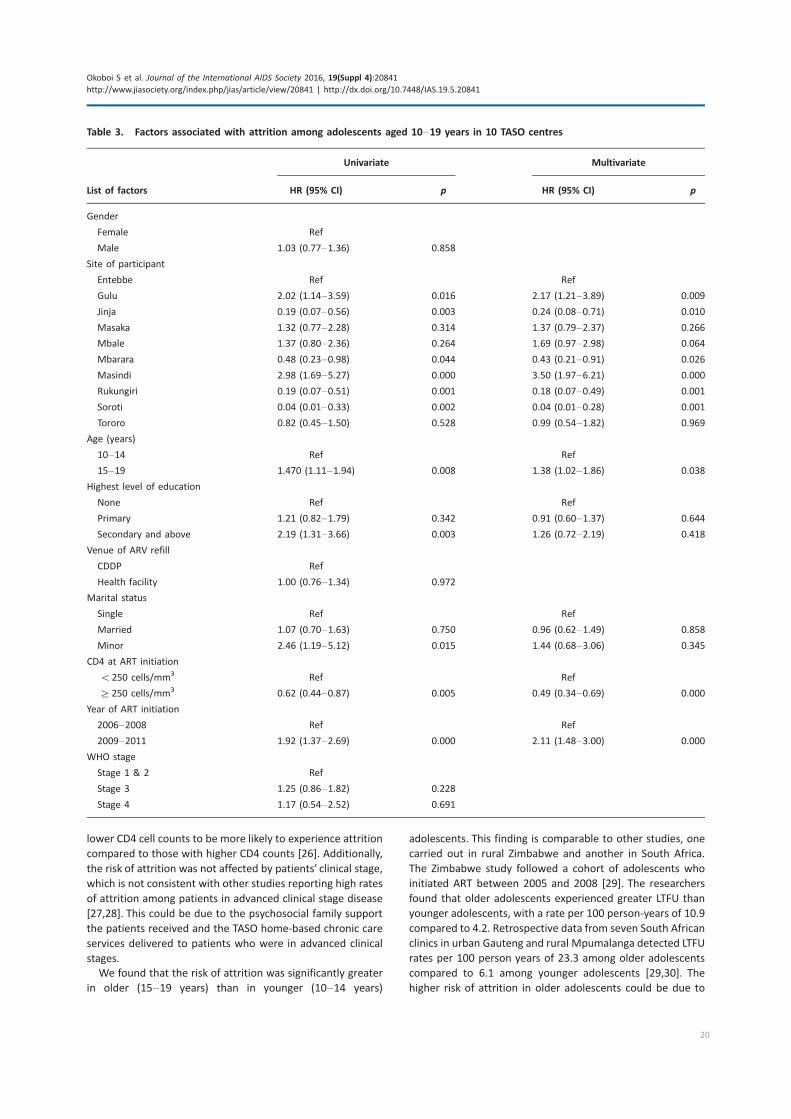
lower CD4 cell counts to be more likely to experience attrition
compared to those with higher CD4 counts [26]. Additionally,
the risk of attrition was not affected by patients’ clinical stage,
which is not consistent with other studies reporting high rates
of attrition among patients in advanced clinical stage disease
[27,28]. This could be due to the psychosocial family support
the patients received and the TASO home-based chronic care
services delivered to patients who were in advanced clinical
stages.
We found that the risk of attrition was significantly greater
in older (15�19 years) than in younger (10�14 years)
adolescents. This finding is comparable to other studies, one
carried out in rural Zimbabwe and another in South Africa.
The Zimbabwe study followed a cohort of adolescents who
initiated ART between 2005 and 2008 [29]. The researchers
found that older adolescents experienced greater LTFU than
younger adolescents, with a rate per 100 person-years of 10.9
compared to 4.2. Retrospective data from seven South African
clinics in urban Gauteng and rural Mpumalanga detected LTFU
rates per 100 person years of 23.3 among older adolescents
compared to 6.1 among younger adolescents [29,30]. The
higher risk of attrition in older adolescents could be due to
Table 3. Factors associated with attrition among adolescents aged 10�19 years in 10 TASO centres
Univariate Multivariate
List of factors HR (95% CI) p HR (95% CI) p
Gender
Female Ref
Male 1.03 (0.77�1.36) 0.858
Site of participant
Entebbe Ref Ref
Gulu 2.02 (1.14�3.59) 0.016 2.17 (1.21�3.89) 0.009
Jinja 0.19 (0.07�0.56) 0.003 0.24 (0.08�0.71) 0.010
Masaka 1.32 (0.77�2.28) 0.314 1.37 (0.79�2.37) 0.266
Mbale 1.37 (0.80�2.36) 0.264 1.69 (0.97�2.98) 0.064
Mbarara 0.48 (0.23�0.98) 0.044 0.43 (0.21�0.91) 0.026
Masindi 2.98 (1.69�5.27) 0.000 3.50 (1.97�6.21) 0.000
Rukungiri 0.19 (0.07�0.51) 0.001 0.18 (0.07�0.49) 0.001
Soroti 0.04 (0.01�0.33) 0.002 0.04 (0.01�0.28) 0.001
Tororo 0.82 (0.45�1.50) 0.528 0.99 (0.54�1.82) 0.969
Age (years)
10�14 Ref Ref
15�19 1.470 (1.11�1.94) 0.008 1.38 (1.02�1.86) 0.038
Highest level of education
None Ref Ref
Primary 1.21 (0.82�1.79) 0.342 0.91 (0.60�1.37) 0.644
Secondary and above 2.19 (1.31�3.66) 0.003 1.26 (0.72�2.19) 0.418
Venue of ARV refill
CDDP Ref
Health facility 1.00 (0.76�1.34) 0.972
Marital status
Single Ref Ref
Married 1.07 (0.70�1.63) 0.750 0.96 (0.62�1.49) 0.858
Minor 2.46 (1.19�5.12) 0.015 1.44 (0.68�3.06) 0.345
CD4 at ART initiation
B250 cells/mm3 Ref Ref
]250 cells/mm3 0.62 (0.44�0.87) 0.005 0.49 (0.34�0.69) 0.000
Year of ART initiation
2006�2008 Ref Ref
2009�2011 1.92 (1.37�2.69) 0.000 2.11 (1.48�3.00) 0.000
WHO stage
Stage 1 & 2 Ref
Stage 3 1.25 (0.86�1.82) 0.228
Stage 4 1.17 (0.54�2.52) 0.691
Okoboi S et al. Journal of the International AIDS Society 2016, 19(Suppl 4):20841
http://www.jiasociety.org/index.php/jias/article/view/20841 | http://dx.doi.org/10.7448/IAS.19.5.20841
20
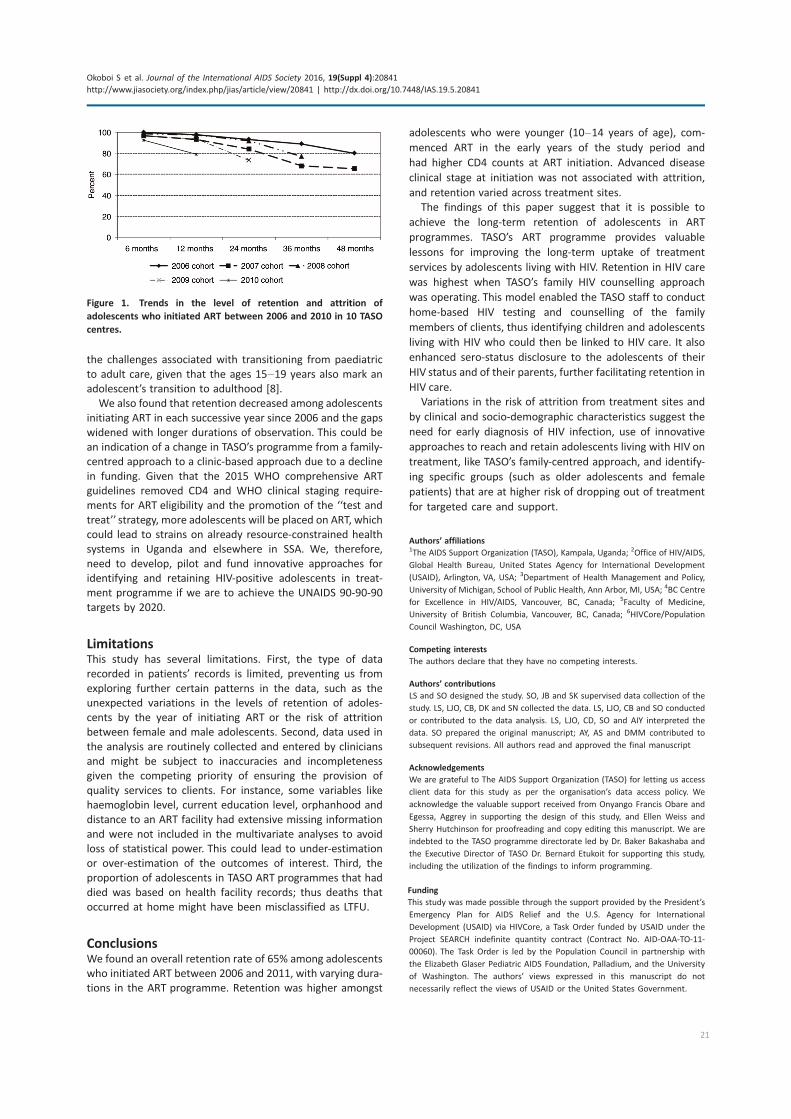
the challenges associated with transitioning from paediatric
to adult care, given that the ages 15�19 years also mark an
adolescent’s transition to adulthood [8].
We also found that retention decreased among adolescents
initiating ART in each successive year since 2006 and the gaps
widened with longer durations of observation. This could be
an indication of a change in TASO’s programme from a family-
centred approach to a clinic-based approach due to a decline
in funding. Given that the 2015 WHO comprehensive ART
guidelines removed CD4 and WHO clinical staging require-
ments for ART eligibility and the promotion of the ‘‘test and
treat’’ strategy, more adolescents will be placed on ART, which
could lead to strains on already resource-constrained health
systems in Uganda and elsewhere in SSA. We, therefore,
need to develop, pilot and fund innovative approaches for
identifying and retaining HIV-positive adolescents in treat-
ment programme if we are to achieve the UNAIDS 90-90-90
targets by 2020.
LimitationsThis study has several limitations. First, the type of data
recorded in patients’ records is limited, preventing us from
exploring further certain patterns in the data, such as the
unexpected variations in the levels of retention of adoles-
cents by the year of initiating ART or the risk of attrition
between female and male adolescents. Second, data used in
the analysis are routinely collected and entered by clinicians
and might be subject to inaccuracies and incompleteness
given the competing priority of ensuring the provision of
quality services to clients. For instance, some variables like
haemoglobin level, current education level, orphanhood and
distance to an ART facility had extensive missing information
and were not included in the multivariate analyses to avoid
loss of statistical power. This could lead to under-estimation
or over-estimation of the outcomes of interest. Third, the
proportion of adolescents in TASO ART programmes that had
died was based on health facility records; thus deaths that
occurred at home might have been misclassified as LTFU.
ConclusionsWe found an overall retention rate of 65% among adolescents
who initiated ART between 2006 and 2011, with varying dura-
tions in the ART programme. Retention was higher amongst
adolescents who were younger (10�14 years of age), com-
menced ART in the early years of the study period and
had higher CD4 counts at ART initiation. Advanced disease
clinical stage at initiation was not associated with attrition,
and retention varied across treatment sites.
The findings of this paper suggest that it is possible to
achieve the long-term retention of adolescents in ART
programmes. TASO’s ART programme provides valuable
lessons for improving the long-term uptake of treatment
services by adolescents living with HIV. Retention in HIV care
was highest when TASO’s family HIV counselling approach
was operating. This model enabled the TASO staff to conduct
home-based HIV testing and counselling of the family
members of clients, thus identifying children and adolescents
living with HIV who could then be linked to HIV care. It also
enhanced sero-status disclosure to the adolescents of their
HIV status and of their parents, further facilitating retention in
HIV care.
Variations in the risk of attrition from treatment sites and
by clinical and socio-demographic characteristics suggest the
need for early diagnosis of HIV infection, use of innovative
approaches to reach and retain adolescents living with HIV on
treatment, like TASO’s family-centred approach, and identify-
ing specific groups (such as older adolescents and female
patients) that are at higher risk of dropping out of treatment
for targeted care and support.
Authors’ affiliations1The AIDS Support Organization (TASO), Kampala, Uganda; 2Office of HIV/AIDS,
Global Health Bureau, United States Agency for International Development
(USAID), Arlington, VA, USA; 3Department of Health Management and Policy,
University of Michigan, School of Public Health, Ann Arbor, MI, USA; 4BC Centre
for Excellence in HIV/AIDS, Vancouver, BC, Canada; 5Faculty of Medicine,
University of British Columbia, Vancouver, BC, Canada; 6HIVCore/Population
Council Washington, DC, USA
Competing interests
The authors declare that they have no competing interests.
Authors’ contributions
LS and SO designed the study. SO, JB and SK supervised data collection of the
study. LS, LJO, CB, DK and SN collected the data. LS, LJO, CB and SO conducted
or contributed to the data analysis. LS, LJO, CD, SO and AIY interpreted the
data. SO prepared the original manuscript; AY, AS and DMM contributed to
subsequent revisions. All authors read and approved the final manuscript
Acknowledgements
We are grateful to The AIDS Support Organization (TASO) for letting us access
client data for this study as per the organisation’s data access policy. We
acknowledge the valuable support received from Onyango Francis Obare and
Egessa, Aggrey in supporting the design of this study, and Ellen Weiss and
Sherry Hutchinson for proofreading and copy editing this manuscript. We are
indebted to the TASO programme directorate led by Dr. Baker Bakashaba and
the Executive Director of TASO Dr. Bernard Etukoit for supporting this study,
including the utilization of the findings to inform programming.
Funding
This study was made possible through the support provided by the President’s
Emergency Plan for AIDS Relief and the U.S. Agency for International
Development (USAID) via HIVCore, a Task Order funded by USAID under the
Project SEARCH indefinite quantity contract (Contract No. AID-OAA-TO-11-
00060). The Task Order is led by the Population Council in partnership with
the Elizabeth Glaser Pediatric AIDS Foundation, Palladium, and the University
of Washington. The authors’ views expressed in this manuscript do not
necessarily reflect the views of USAID or the United States Government.
Figure 1. Trends in the level of retention and attrition of
adolescents who initiated ART between 2006 and 2010 in 10 TASO
centres.
Okoboi S et al. Journal of the International AIDS Society 2016, 19(Suppl 4):20841
http://www.jiasociety.org/index.php/jias/article/view/20841 | http://dx.doi.org/10.7448/IAS.19.5.20841
21
References
1. World Health Organization. HIV and adolescents: guidance for HIV testing
and counselling and care for adolescents living with HIV. Geneva, Switzerland:
WHO; 2013.
2. Kasedde S, Luo C, McClure C, Chandan U. Reducing HIV and AIDS in
adolescents: opportunities and challenges. Curr HIV/AIDS Rep. 2013;10:
159�68.3. Uganda Ministry of Health, ICF International, Centers for Disease Control
and Prevention (CDC), United States Agency for International Development
(USAID), WHO. Uganda AIDS Indicator Survey 2011. Calverton, MD: Uganda
Ministry of Health; 2012.
4. Uganda Bureau of Statistics, ICF Macro. Uganda AIDS Indicator Survey 2011.
Calverton, MD: ICF International Inc.; 2012.
5. Hudelson C, Cluver L. Factors associated with adherence to antiretroviral
therapy among adolescents living with HIV/AIDS in low- and middle-income
countries: a systematic review. AIDS Care. 2015;27:805�16.6. MacPherson P, Munthali C, Ferguson J, Armstrong A, Kranzer K, Ferrand RA,
et al. Service delivery interventions to improve adolescents’ linkage, retention
and adherence to antiretroviral therapy and HIV care. Trop Med Int Health.
2015;20:1015�32.7. Foster C, Fidler S. Optimizing antiretroviral therapy in adolescents with
perinatally acquired HIV-1 infection. Expert Rev Anti Infect Ther. 2010;8:
1403�16.8. Auld AF, Agolory SG, Shiraishi RW, Wabwire-Mangen F, Kwesigabo G,
Mulenga M, et al. Antiretroviral therapy enrollment characteristics and
outcomes among HIV-infected adolescents and young adults compared with
older adults�seven African countries, 2004�2013. MMWR Morb Mortal Wkly
Rep. 2014;63:1097�103.9. Shroufi A, Gunguwo H, Dixon M, Nyathi M, Ndebele W, Saint-Sauveur JF,
et al. HIV-infected adolescents in southern Africa can achieve good treatment
outcomes: results from a retrospective cohort study. AIDS. 2013;27:1971�8.10. Ferrand RA, Lowe S, Whande B, Munajwa L, Langhaug L, Cowan F, et al.
Survey of children accessing HIV services in a high prevalence setting: time for
adolescents to count? Bull World Health Organ. 2010;88:428�34.11. Ferrand RA, Trigg C, Bandason T, Ndhlovu C, Mungofa S, Nathoo K, et al.
Perception of risk of vertically acquired HIV infection and acceptability of
provider initiated testing and counselling among adolescents in Zimbabwe.
Am J Public Health. 2011;101:2325�32.12. Ramirez-Avila L, Nixon K, Noubary F, Giddy J, Losina E, Walensky RP, et al.
Routine HIV testing in adolescents and young adults presenting to an out-
patient clinic in Durban, South Africa. PLoS One. 2012;7:e45507.
13. Dowshen N, D’Angelo L. Health care transition for youth living with
HIV/AIDS. Pediatrics. 2011;128:762�71.14. Hodgson I, Ross J, Haamujompa C, Gitau-Mburu D. Living as an adolescent
with HIV in Zambia*lived experiences, sexual health and reproductive needs.
AIDS Care. 2012;24:1204�10.15. Koenig LJ, Nesheim S, Abramovitz S. Adolescents with perinatally acquired
HIV: emerging behavioral and health needs for long-term survivors. Curr Opin
Obstet Gynecol. 2011;23:321�7.
16. UNAIDS. HIV and AIDS Uganda progress report. Geneva, Switzerland: Joint
United Nations Programme on HIV/AIDS; 2013.
17. Govindasamy D, Meghjj J, Negussi EK, Baggaley RC, Ford N, Kranzer K.
Interventions to improve or facilitate linkage to or retention in pre-ART (HIV)
care and initiation of ART in low- and middle-income settings�a systematic
review. J Int AIDS Soc. 2014;17(1):19032, doi: http://dx.doi.org/10.7448/IAS.
17.1.19032
18. Rosen S, Fox MP, Gill CJ. Patient retention in antiretroviral therapy
programs in sub-Saharan Africa: a systematic review. PLoS Med. 2007;4:e298.
19. Giordarno TP. How should we measure retention in HIV care? New York:
WebMD LLC; 2012.
20. StataCorp. Stata Statistical Software: release 12. College Station, TX:
StataCorp LP; 2011.
21. Okoboi S, Ding E, Persuad S, Wangisi J, Birungi J, Shurgold S, et al.
Community-based ART distribution system can effectively facilitate long-term
program retention and low-rates of death and virologic failure in rural Uganda.
AIDS Res Ther. 2015;12(1):37.
22. WHO. Retention in HIV programmes: defining the challenges and
identifying solutions: meeting report, 13�15 September 2011. WHO, editor.
Geneva, Switzerland: World Health Organization; 2012.
23. WHO, UNAIDS, UNICEF. Towards universal access: scaling up priority
interventions in the health sector. Edited by World Health Organization
JUNPoHA, United Nations Children’s Fund. Geneva, Switzerland: World Health
Organization, Joint United Nations Programme on HIV/AIDS, United Nations
Children’s Fund; 2010.
24. Koach E, Teasdale CA, Wang C, Fayorsey R, Alwar T, Mukui IN, et al.
Characteristics and outcomes of HIV-infected youth and adolescents enrolled
in HIV care in Kenya. AIDS. 2014;28(18):2729�38.25. Lamb K, Fayorsey R, Nuwagaba-Biribonwoha H, Viola V, Mutabazi V, Alwar
T, et al. High attrition before and after ART initiation among 15�24 years of ageenrolled in HIV care. AIDS. 2015;28(4):559�68.26. Ditekemena J, Luhata C, Bonane W, Kiumbu M, Tshefu A, Colebunders R,
et al. Antiretroviral treatment program retention among HIV-infected children
in the Democratic Republic of Congo. PLoS One. 2014;9(12):e113877. doi:
http://dx.doi.org/10.1371/journal.pone.0113877
27. Violari A, Cotton MF, Gibb DM, Babiker AG, Steyn J, Madhi SA, et al. Early
antiretroviral therapy and mortality among HIV-infected infants. N Engl J Med.
2008;359(21):2233�44.28. McNairy ML, Lamb MR, Carter RJ, Fayorsey R, Tene G, Mutabazi V, et al.
Retention of HIV-infected children on antiretroviral treatment in HIV care and
treatment programs in Kenya, Mozambique, Rwanda, and Tanzania. J Acquir
Immune Defic Syndr. 2013;62(3):e70�81.29. Bygrave H, Mtangirwa J, Ncube K, Ford N, Kranzer K, Munyaradzi D.
Antiretroviral therapy outcomes among adolescents and youth in rural
Zimbabwe[Internet]. Understanding the HIV care continuum CDC; 2014. [cited
2016 Feb 17]. Available from: http://www.cdc.gov/hiv/pdf/dhap continum.pdf
30. Evans D, Menezes C, Mahomed K, Macdonald P, Untiedt S, Levin L, et al.
Treatment outcomes of HIV-Infected adolescents attending public-sector
HIV clinics across Gauteng and Mpumalanga, South Africa. AIDS Res Hum
Retroviruses. 2013;29(6):892�900.
Okoboi S et al. Journal of the International AIDS Society 2016, 19(Suppl 4):20841
http://www.jiasociety.org/index.php/jias/article/view/20841 | http://dx.doi.org/10.7448/IAS.19.5.20841
22
Research article
Limited accessibility to HIV services for persons with disabilities
living with HIV in Ghana, Uganda and Zambia
Waimar Tun§,1, Jerry Okal2, Katie Schenk3, Selina Esantsi4, Felix Mutale5, Rita Kusi Kyeremaa6, Edson Ngirabakunzi7,
Hilary Asiah4, Charlotte McClain-Nhlapo8 and Grimond Moono9
§Corresponding author: Waimar Tun, HIV and AIDS Program, Population Council, 4301 Connecticut Avenue, NW, Suite 280,Washington, DC 20008, USA. Tel: �1-202-
237-9400. ([email protected])
Abstract
Introduction: Knowledge about experiences in accessing HIV services among persons with disabilities who are living with
HIV in sub-Saharan Africa is limited. Although HIV transmission among persons with disabilities in Africa is increasingly
acknowledged, there is a need to bring to life the experiences and voices from persons with disabilities living with HIV to raise
awareness of programme implementers and policy makers about their barriers in accessing HIV services. This paper explores
how the barriers faced by persons with disabilities living with HIV impede their ability to access HIV-related services and manage
their disease.
Methods: We conducted focus group discussions with 76 persons (41 females; 35 males) with physical, visual and/or hearing
impairments who were living with HIV in Ghana, Uganda and Zambia (2012�2013). We explored challenges and facilitators at
different levels (individual, psychosocial and structural) of access to HIV services. Transcripts were analyzed using a framework
analysis approach.
Results: Persons with disabilities living with HIVencountered awide variety of challenges in accessing HIV services. Delays in testing
for HIV were common, with most waiting until they were sick to be tested. Reasons for delayed testing included challenges in
getting to the health facilities, lack of information about HIV and testing, and HIV- and disability-related stigma. Barriers to HIV-
related services, including care and treatment, at health facilities included lack of disability-friendly educational materials and sign
interpreters, stigmatizing treatment by providers and other patients, lack of skills to provide tailored services to persons with
disabilities living with HIV and physically inaccessible infrastructure, all of which make it extremely difficult for persons with
disabilities to initiate and adhere to HIV treatment. Accessibility challenges were greater for women than men due to gender-
related roles. Challenges were similar across the three countries. Favourable experiences in accessing HIV services were reported in
Uganda and Zambia, where disability-tailored services were offered by non-governmental organizations and government facilities
(Uganda only).
Conclusions: Persons with disabilities living with HIV encounter many challenges in accessing HIV testing and continued
care and treatment services. Changes are needed at every level to ensure accessibility of HIV services for persons with
disabilities.
Keywords: disability; persons with disabilities; PLHIV; HIV positive; accessibility.
Received 23 November 2015; Revised 1 April 2016; Accepted 2 May 2016; Published 20 July 2016
Copyright: – 2016 Tun W et al; licensee International AIDS Society. This is an Open Access article distributed under the terms of the Creative Commons Attribution
3.0 Unported (CC BY 3.0) License (http://creativecommons.org/licenses/by/3.0/), which permits unrestricted use, distribution, and reproduction in any medium,
provided the original work is properly cited.
IntroductionPersons with disabilities represent approximately 15% of
the world’s population with 80% living in low- and middle-
income countries [1]. Further, evidence indicates that persons
with disabilities are at the same or elevated risk of HIV
because of the many vulnerabilities they face, including
poverty, lack of education, lack of sex education, lack of
knowledge about HIV and safe sex practices, sexual violence,
substance abuse, poor access to health services and stigma
and discrimination [2�11]. A systematic review by De
Beaudrap et al. found that persons with disabilities do not
have a lower risk of HIV infection compared with the general
population [12].
To address the needs of persons with disabilities living with
HIV, HIV services must be inclusive, addressing their specific
needs to ensure early diagnosis and timely initiation of HIV
treatment, and promote retention and adherence in care and
treatment. While research on the challenges encountered
by persons with disabilities in accessing health services in
sub-Saharan Africa is growing [2,4,9,11,13�18], crucial prac-tical information on their specific challenges and facilitators
remains limited, particularly based on data collection directly
from persons with disabilities living with HIV [15,18]. Under-
standing the unique experiences of persons with disabilities
living with HIV from their own perspectives and experiences
in accessing HIV services will help programmes to address their
Tun W et al. Journal of the International AIDS Society 2016, 19(Suppl 4):20829
http://www.jiasociety.org/index.php/jias/article/view/20829 | http://dx.doi.org/10.7448/IAS.19.5.20829
23
specific needs. The objective of this paper is to understand
how the barriers faced by persons with disabilities living with
HIV impede their ability to access HIV-related services and
manage their disease.
MethodsWe conducted a three-country study (Ghana, Uganda and
Zambia), representing settings of different stages of the HIV
epidemic and the degree to which the needs of persons with
disabilities are recognized in the National Strategic Plan for
HIV and AIDS (Uganda: high; Zambia: moderate; Ghana:
low) [19�22]. In order to explore factors affecting access
to and use of HIV services, we conducted focus group dis-
cussions (FGD) with persons with disabilities living with HIV
(2012�2013). Study activities were conducted in the capital
city (Accra, Kampala and Lusaka) and one peri-urban or rural
site (Amasaman, Jinja and Solwezi) in each country. We
established and sought advice from an advisory board in
each country, which consisted of leaders from local disabled
persons organizations (DPOs) and country AIDS Commissions
to provide guidance on study design, implementation and
results interpretation. We conducted FGDs to generate richer
discussions based on people’s potentially differing experi-
ences; feedback from the advisory board indicated it would be
acceptable and appropriate.
A total of 17 FGDs were conducted (median: six per group;
IQR: 2.5�6). Participants were 18 years or older, HIV positive
and had visual, hearing or physical disabilities. Disability and
HIV status were self-reported. Participants were recruited as
a convenience sample through DPOs and peer referrals.
Designated DPO staff recruited candidates in a private and
confidential manner providing information about the study
including the eligibility criteria. DPO staff instructed inter-
ested candidates to attend the FGD at the specified time and
place, where the candidates were screened and consented by
a study staff. Participants were also asked to invite potentially
interested and eligible peers with disabilities to contact the
DPO staff. We recruited individuals accessing and those
not accessing services at the DPOs. Persons with intellectual
or developmental disabilities were not included as it would
have required special procedures for appropriate consent,
which the ethical review boards were not comfortable with.
Participants and their assistants received reimbursement
for time and transport. Assistants waited in another room
to maintain confidentiality of participants during the FGD.
Trained moderators sensitized in working with persons with
disabilities conducted the FGD using a semi-structured guide
designed to elicit information about barriers and facilitators
to access HIV services. Sign interpreters were used for FGDs
with hearing-impaired persons. Before each FGD, a researcher
(along with a sign interpreter for deaf participants) sought
informed consent individually with each potential participant
in private and obtained signature or finger/toe print. Inter-
views were recorded, transcribed and translated.
FGD transcripts were imported into ATLAS.ti v5.2 (ATLAS.ti
GmbH, Berlin, Germany). The research team reviewed tran-
scripts and conducted analysis using a framework analysis
approach [23�25], which is appropriate for applied research
in order to describe and interpret what is happening in a
specific setting to provide recommendations as opposed to
generating theory to be tested. Codes were developed using
key domains outlined a priori during research design; during
data analysis, three researchers reviewed the transcripts
and added codes based on emergent themes. Themes were
assessed and compared to determine how often the same
concept emerged within and across countries and by disability
type. Analysts double coded 30% of the transcripts to ensure
quality.
The study was approved by the ethical review boards
of the Population Council, University of Zambia, Ghana
Health Services, The AIDS Support Organization-Uganda and
the Uganda National Council for Science and Technology.
ResultsWe recruited a total of 76 persons with disabilities living with
HIV (41 females; 35 males). Table 1 shows the characteristics
of the FGD participants. All but two participants had their
disabilities prior to their HIV diagnosis.
Barriers to HIV testing
Most participants indicated that they did not test for HIV until
they became sick; hence, late HIV diagnosis was common
among this population, regardless of sex, disability type or
country. Most participants reported that they were aware of
persons with disabilities who delayed HIV testing until they
were critically ill.
Table 1. Characteristics of focus group participants
Ghana
(N�14)
Uganda
(N�28)
Zambia
(N�34)
Type of impairment
Hearing 4 1 8
Visual 1 14 9
Physical 9 12 17
Physical and visual 0 1 0
Sex
Female 10 16 15
Male 4 12 19
Median age, years (IQR) 43 (36, 48) 40 (34, 50) 39 (30, 47)
Education
BPrimary or none 2 6 3
Completed primary 2 3 6
Completed secondary 8 5 24
Completed high school 1 13 1
�High school 1 1 0
Marital status
Single 7 7 14
Married 3 14 10
Divorced/widowed/
separated
4 7 10
IQR: interquartile range.
Tun W et al. Journal of the International AIDS Society 2016, 19(Suppl 4):20829
http://www.jiasociety.org/index.php/jias/article/view/20829 | http://dx.doi.org/10.7448/IAS.19.5.20829
24
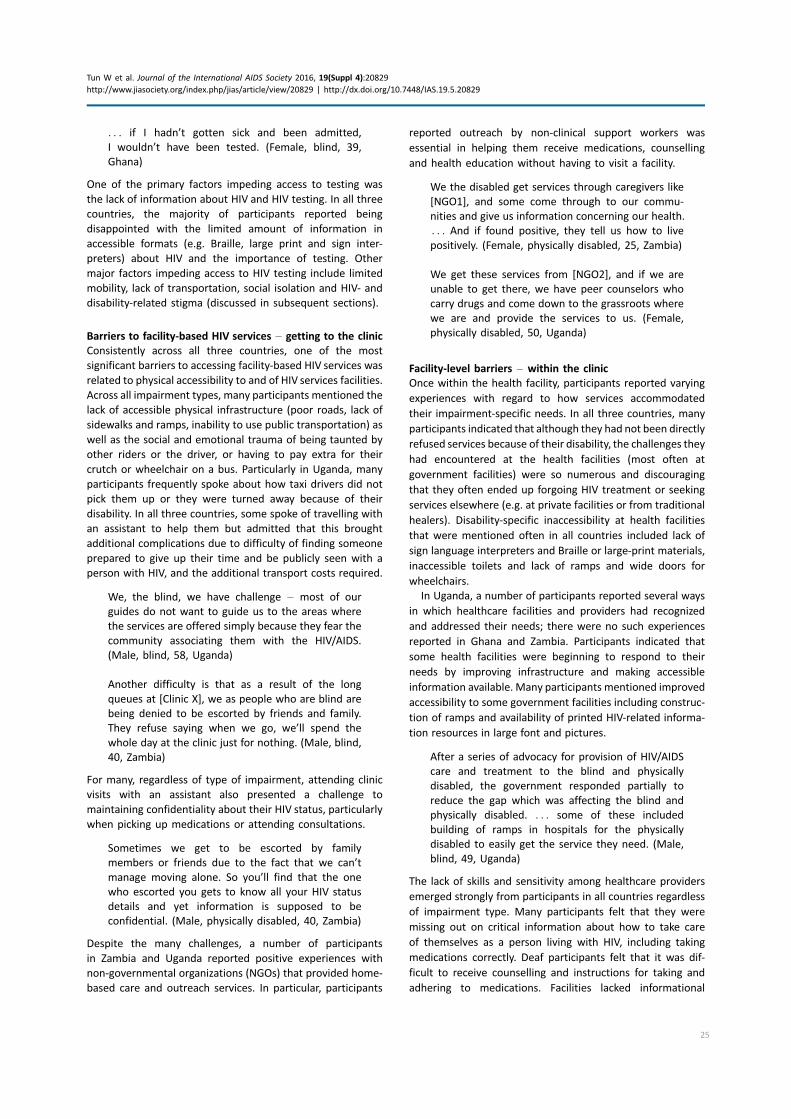
. . . if I hadn’t gotten sick and been admitted,
I wouldn’t have been tested. (Female, blind, 39,
Ghana)
One of the primary factors impeding access to testing was
the lack of information about HIV and HIV testing. In all three
countries, the majority of participants reported being
disappointed with the limited amount of information in
accessible formats (e.g. Braille, large print and sign inter-
preters) about HIV and the importance of testing. Other
major factors impeding access to HIV testing include limited
mobility, lack of transportation, social isolation and HIV- and
disability-related stigma (discussed in subsequent sections).
Barriers to facility-based HIV services � getting to the clinic
Consistently across all three countries, one of the most
significant barriers to accessing facility-based HIV services was
related to physical accessibility to and of HIV services facilities.
Across all impairment types, many participants mentioned the
lack of accessible physical infrastructure (poor roads, lack of
sidewalks and ramps, inability to use public transportation) as
well as the social and emotional trauma of being taunted by
other riders or the driver, or having to pay extra for their
crutch or wheelchair on a bus. Particularly in Uganda, many
participants frequently spoke about how taxi drivers did not
pick them up or they were turned away because of their
disability. In all three countries, some spoke of travelling with
an assistant to help them but admitted that this brought
additional complications due to difficulty of finding someone
prepared to give up their time and be publicly seen with a
person with HIV, and the additional transport costs required.
We, the blind, we have challenge � most of our
guides do not want to guide us to the areas where
the services are offered simply because they fear the
community associating them with the HIV/AIDS.
(Male, blind, 58, Uganda)
Another difficulty is that as a result of the long
queues at [Clinic X], we as people who are blind are
being denied to be escorted by friends and family.
They refuse saying when we go, we’ll spend the
whole day at the clinic just for nothing. (Male, blind,
40, Zambia)
For many, regardless of type of impairment, attending clinic
visits with an assistant also presented a challenge to
maintaining confidentiality about their HIV status, particularly
when picking up medications or attending consultations.
Sometimes we get to be escorted by family
members or friends due to the fact that we can’t
manage moving alone. So you’ll find that the one
who escorted you gets to know all your HIV status
details and yet information is supposed to be
confidential. (Male, physically disabled, 40, Zambia)
Despite the many challenges, a number of participants
in Zambia and Uganda reported positive experiences with
non-governmental organizations (NGOs) that provided home-
based care and outreach services. In particular, participants
reported outreach by non-clinical support workers was
essential in helping them receive medications, counselling
and health education without having to visit a facility.
We the disabled get services through caregivers like
[NGO1], and some come through to our commu-
nities and give us information concerning our health.
. . . And if found positive, they tell us how to live
positively. (Female, physically disabled, 25, Zambia)
We get these services from [NGO2], and if we are
unable to get there, we have peer counselors who
carry drugs and come down to the grassroots where
we are and provide the services to us. (Female,
physically disabled, 50, Uganda)
Facility-level barriers � within the clinic
Once within the health facility, participants reported varying
experiences with regard to how services accommodated
their impairment-specific needs. In all three countries, many
participants indicated that although they had not been directly
refused services because of their disability, the challenges they
had encountered at the health facilities (most often at
government facilities) were so numerous and discouraging
that they often ended up forgoing HIV treatment or seeking
services elsewhere (e.g. at private facilities or from traditional
healers). Disability-specific inaccessibility at health facilities
that were mentioned often in all countries included lack of
sign language interpreters and Braille or large-print materials,
inaccessible toilets and lack of ramps and wide doors for
wheelchairs.
In Uganda, a number of participants reported several ways
in which healthcare facilities and providers had recognized
and addressed their needs; there were no such experiences
reported in Ghana and Zambia. Participants indicated that
some health facilities were beginning to respond to their
needs by improving infrastructure and making accessible
information available. Many participants mentioned improved
accessibility to some government facilities including construc-
tion of ramps and availability of printed HIV-related informa-
tion resources in large font and pictures.
After a series of advocacy for provision of HIV/AIDS
care and treatment to the blind and physically
disabled, the government responded partially to
reduce the gap which was affecting the blind and
physically disabled. . . . some of these included
building of ramps in hospitals for the physically
disabled to easily get the service they need. (Male,
blind, 49, Uganda)
The lack of skills and sensitivity among healthcare providers
emerged strongly from participants in all countries regardless
of impairment type. Many participants felt that they were
missing out on critical information about how to take care
of themselves as a person living with HIV, including taking
medications correctly. Deaf participants felt that it was dif-
ficult to receive counselling and instructions for taking and
adhering to medications. Facilities lacked informational
Tun W et al. Journal of the International AIDS Society 2016, 19(Suppl 4):20829
http://www.jiasociety.org/index.php/jias/article/view/20829 | http://dx.doi.org/10.7448/IAS.19.5.20829
25
materials in accessible format, and several participants spoke
about their desire for more information on living positively.
As positive deaf, services are problematic because
there are no interpreters, so it makes us miss
important information instructions on how to take
medication which is a health risk. (Male, deaf, 48,
Zambia)
While some deaf persons were able to receive healthcare
information through written resources (e.g. leaflets, posters),
they acknowledged that this was not possible for illiterate
persons, which is common among persons with disabilities
due to barriers accessing education.
Participants commonly reported that healthcare providers,
anticipating communication challenges, frequently gave
priority to people without disabilities, leading to extended
wait times and consequently medication stock-outs by the
end of the day.
For us the blind people when we go to those
hospitals, they make us sit down and wait and at the
end day they don’t provide you with any services,
eventually they tell you there is no medicine.
(Female, blind, 50, Uganda)
When doctors see a deaf person approaching, there
is communication breakdown and therefore do not
attend to us. Instead they call hearing people and
attend to them. . . . so we are turned down. We feel
depressed and demoralized so we just go home and
sleep. (Male, deaf, 48, Zambia)
Economic barriers
Many participants pointed out that they face excessive
economic challenges due to costs associated with travel to
clinics, clinical services and food to support the increased
nutritional needs of people on ART.
We have only one challenge of being poor. . . . themedicine requires us to eat something, so you see
that many will become reluctant and not take the
medicine simply because they do not have the
money to buy the food to accompany the medicine.
So they end up not taking the medicine at a regular
basis as prescribed by the doctors. (Male, physically
disabled, 38, Uganda)
Challenges associated with limited financial resources is
especially hard for persons with disabilities; many participants
talked about how persons with disabilities are more often
unemployed, less educated and live in poverty compared
with those without a disability. Many participants, particularly
from Ghana, frequently discussed the interconnected linkages
between disability and lack of education and illiteracy.
Lacking education, they are at an extreme disadvan-
tage in comprehending existing HIV prevention
messages. I think the main issue is most of us are
not mainly educated, so these words [about HIV]
when they are mentioned, if you don’t get someone
to explain it to you, then you are lost. (Female, 30,
deaf, HIV positive, Accra, Ghana)
However, there were instances mentioned of economic
support, all of which were from Uganda and Zambia. Some
participants in Uganda, through local NGOs and community-
based organizations (CBOs), reported receiving additional
supportive services that help them improve their own
livelihoods such as the formation of income-generating
activities.
We as HIV positive and physically disabled people
often get groups through which we can access
services such as counseling, medicines, and knowl-
edge. For example, here in Jinja, we have [CBO]; . . .we may engage in poultry farming starting from
2 chickens to find means of how to help ourselves.
That is why we are thankful to [CBO], and other
NGOs which have given us pigs, seedlings for
agricultural farming which we rear and gain money
and also get food for our personal nutrition in the
long run. Hence these groups help us collectively
advocate for the services we need. (Male, physically
disabled, 58, Uganda)
Stigma related to HIV and disabilities
In all three countries, participants reported experiencing
multiple dimensions of stigma from multiple sources, com-
pounding each other to result in social isolation and being cut
off from sources of critical information and services. The
findings from this study related to the multiple sources
of stigma among persons with disabilities, including those
living with HIV, have been reported elsewhere [26]. Briefly,
the dual stigma of HIV and disability as well as the internalized
stigma (i.e. feeling ashamed because of their disability and
HIV status) discouraged people from HIV testing due to fear
of judgment from others and concern about who will take
care of them. This was pervasive in all three countries. These
overlapping stigmas are the paramount underlying reason for
late HIV diagnosis, sub-optimal attendance at health clinics for
ART services and lack of family and community support.
Stigmatizing attitudes were rampant in the community as
well as at health facilities. Many participants reported that
they experienced stigmatizing attitudes from other patients
and even healthcare providers when accessing HIV-related
services.
[We] are neglected and segregated by the medical
people. Some say we smell. You try very much to
seek for his or her attention; the medical person just
passes by you so when you go back, you fail to the
guts or energy to go back to the hospital because of
the way you were treated the day before. . . . [we]lose the morale of getting treatment from the
facilities. (Male, physically disabled, 38, Uganda)
To alleviate some of the issues around stigma, some
participants in Uganda talked about how instrumental social
support from other persons with disabilities living with HIV
was in allowing them to deal more effectively with stressors
related to living with HIV because there was a sense that
Tun W et al. Journal of the International AIDS Society 2016, 19(Suppl 4):20829
http://www.jiasociety.org/index.php/jias/article/view/20829 | http://dx.doi.org/10.7448/IAS.19.5.20829
26
others face similar challenges or will be there to help them if
necessary.
We form our groups as we [people with disabilities]
who are HIV positive such that other persons like us
cannot think they are alone and this helps to build
their spirits and motivate them to living healthy
lives. (Female, physically disabled, 50, Uganda)
Access to services by sex
Most female participants felt they had more challenges
accessing services compared with males because of their
gender roles. Across all three countries, female participants
mentioned household and childcare responsibilities and
having less money than men as the challenges in seeking
healthcare.
For a man it is easier because we women have a lot
to take care of at the home and would not have
enough time to go get services. (Female, physically
disabled, 25, Zambia)
While there was evidence of differential access to healthcare,
most participants felt that men and women with disabilities
were not treated differently by providers based on their sex:
‘‘We are treated equally. They don’t say you are a man or a
woman’’ (Female, deaf, 30, Ghana). However, a few female
participants in Zambia mentioned longer wait times for
women: ‘‘Men are treated first. Women wait in a queue until
they are done with them [men], then they start calling names
of women’’ (Female, deaf, 54, Zambia).
DiscussionThrough the voices of persons with disabilities living with
HIV, this study highlighted specific challenges and facilitators
for persons with disabilities living with HIV in accessing
HIV services. They encounter many challenges in accessing
HIV testing and continued care and treatment services. These
barriers exist at many levels: individual (e.g. lack of accessible
HIV information), psychosocial (e.g. stigma), economic (e.g.
poverty) and health systems (e.g. provider attitudes and
skills, inaccessible physical infrastructure). While some of the
barriers are similar to those experienced by HIV-positive
persons without disabilities (e.g. HIV-related stigma, long
queues at health facilities), these barriers are amplified for
persons with disabilities.
The barriers discussed in this paper mirror findings from
other studies on persons with disabilities in sub-Saharan
Africa [2,4,9,11,13�18]. However, this study emphasizes
the struggles faced specifically by persons with disabilities
living with HIV in accessing HIV testing and obtaining HIV
care and treatment services, which may ultimately have a
negative impact on HIV treatment outcomes. We found that
the ‘‘double burden’’ of being HIV positive and having a
disability and the associated stigma lead to delays in accessing
essential services such as HIV testing due to fear of results and
potential consequences of a positive result. In addition, many
delayed HIV diagnosis until they felt sick and upon diagnosis,
they did not want to seek care and treatment due to the many
challenges they faced getting to the facilities as well as within
the facilities. Challenges at point of care highlighted in this
study include lack of sensitization and skills among healthcare
workers to work with this population and lack of accessible
infrastructure which significantly inhibited persons with disa-
bilities living with HIV from obtaining the services they need
including information on correct medication usage, adher-
ence and how to live positively. This has major implication for
HIV treatment outcomes for persons with disabilities living
with HIV as late HIV diagnosis and late initiation (or lack of
use) of ART is associated with greater morbidity and mortality.
There is a need to make services accessible to the disabled
and sensitize health workers to provide services to persons
with disabilities. Further, programmes need to reach out
to personswith disabilities for testing and treatment initiation.
For example, testing as well as ART can be provided through
DPOs or at home through home-based services as shown by
some programmes in Zambia and Uganda. Such interventions
are part of a compendium of best practices in HIV program-
ming for persons with disabilities [27]. In addition, interven-
tions should not only be targeted at improving services
and infrastructure such as provision of sign interpreters and
accessible materials or provision of outreach services, pro-
grammes must also address stigma reduction and gender
equity within the larger community to reduce the stigma
associated with HIV and disability and the harmful gender
norms that impede the access of women with disabilities to
access health services.
Despite the evidence of many challenges in accessing HIV
services, this study also found favourable experiences emer-
ging from Uganda and Zambia, resulting from actions initiated
by NGOs and DPOs and supportive national policies. Although
progress may be relatively slow, Zambia and in particular
Uganda serve as examples in supporting and implementing
policies and programmes to provide persons with disabilities
living with HIV with tailored HIV services. Reports of positive
experiences from persons with disabilities living with HIV in
Uganda, even within government facilities, are not surprising
given that Uganda has one of the most progressive National
Strategic Plan for HIV/AIDS with regard to persons with
disabilities with specific guidelines for operationalization
[19,21]. Supportive policies at the national level as in the
case of Uganda and Zambia where there has been systematic
inclusion of persons with disabilities in the national HIV
planning efforts are likely the reason for the evidence of
favourable programming for persons with disabilities in these
countries. Such policies pave the way for inclusive services
within mainstream health facilities and other efforts by
DPOs and NGOs (e.g. home-based care, income generation
activities and support groups).
LimitationsAlthough selection of participants according to different
impairments enabled us to capture a range of experiences,
the study sample was small and may not be representative of
persons with disabilities living with HIV in sub-Saharan Africa.
However, the remarkable similarities in the barriers across the
three countries despite the different stages of HIV response to
persons with disabilities suggest that there are some common
challenges across sub-Saharan African settings. Further, the
Tun W et al. Journal of the International AIDS Society 2016, 19(Suppl 4):20829
http://www.jiasociety.org/index.php/jias/article/view/20829 | http://dx.doi.org/10.7448/IAS.19.5.20829
27
sample comprised persons with disabilities who were linked
in some way to DPOs and many had basic schooling. Thus, the
sample may be more resourced and connected than others
with disabilities. This may potentially have biased the results
to more favourable reports as those not linked to services may
likely experience and report negative experience to a greater
degree than what is reported here. However, the participants
in this study spoke not only about their own experiences as a
person with disabilities living with HIV but also about others
in similar circumstances. In addition, the use of FGDs, as
opposed to in-depth interviews, may have biased the findings
as the sample consisted of those who were comfortable with
openly discussing their experiences as an HIV-positive person.
Those not comfortable being part of a group discussion
may represent a subset with greater challenges to accessing
services given their discomfort with disclosure. Finally, this
study did not include persons with intellectual or develop-
mental disabilities due to ethical concerns. However, this does
not indicate that they are free from HIV risk. There is evidence
that it is a population at risk for HIV [12,28].
ConclusionsThe barriers reported in this study have major implications
for the HIV treatment outcomes of persons with disabilities
living with HIV and for reaching the UNAIDS 90-90-90 HIV
treatment targets [29]. Changes are needed at every level to
ensure persons with disabilities have access to HIV services
including provision of accessible services, infrastructure and
information; formation of support groups for persons with
disabilities; changing harmful attitudes around disabilities;
HIV and gender norms within the community and in health
facilities; and outreach and home-based interventions to
mitigate accessibility barriers.
Authors’ affiliations1HIV and AIDS Program, Population Council, Washington, DC, USA; 2HIV and
AIDS Program, Population Council, Nairobi, Kenya; 3Department of Global and
Community Health, George Mason University, Fairfax, VA, USA; 4Reproductive
Health Program, Population Council, Accra, Ghana; 5Development Consultant,
Formerly with Zambia Agency for Persons with Disabilities, Lusaka,
Zambia; 6Ghana Federation of Disability Organisations, Accra, Ghana; 7National
Union of Disabled Persons of Uganda, Kampala, Uganda; 8The World Bank,
Washington, DC, USA; 9HIV and AIDS Program, Population Council, Lusaka,
Zambia
Competing interests
None.
Authors’ contributions
WT was the principal investigator of the study and led the writing of the
manuscript. JO was co-investigator, conducted analysis and wrote portions
of the manuscript. KS was co-investigator, led the analysis and helped draft
the manuscript. SE (Ghana), HA (Ghana) and GM (Zambia) coordinated
data collection activities in their respective countries. FM, RK and EN were
co-investigators and served on the advisory board. CMN provided technical
input in the conception of the study and contributed to interpretation. All
authors have read and approved the final version.
Acknowledgements
We thank all the study participants for their contribution. We are grateful for
the guidance of the Advisory Board members: Rita Kyeremaa Kusi (Ghana
Federation of Disability Organisations); Yaw Ofori-Debrah (Ghana Association of
the Blind); Lilian Bruce-Lyle (Ghana Society of the Physically Disabled); Kofie
Humphrey (Mental Health Society of Ghana); Emmanuel Larbi (Ghana AIDS
Commission); Rose Acayo, Atwijukire Justus, Edson Ngirabakunzi (National
Union of Disabled Persons of Uganda); Robinah Alamboi (Mental Health
Uganda); Felix Mutale (formerly with Zambia Agency for Persons with
Disabilities); Sylverster Katontoka (Mental Health Users Network of Zambia);
and Malika Sakala (Zambia Federation of Disability Organisation).We appreciate
the work of Steven Teguzibirwa, who coordinated the data collection efforts in
Uganda. We also thank Sam Kalibala (HIVCore/Population Council, Director)
for his technical input on all aspects of the study. Our special thanks also go
to the technical advisors from USAID: Ugochukwu Amanyeiwe and Suzanne
Leclerc-Madlala.
Funding
This study was made possible through support provided by the President’s
Emergency Plan for AIDS Relief and the US Agency for International Develop-
ment (USAID) via HIVCore, a Task Order funded by USAID under the Project
SEARCH indefinite quantity contract (Contract No. AID-OAA-TO-11-00060).
The Task Order is led by the population council in partnership with the
Elizabeth Glaser Pediatric AIDS Foundation, Palladium, and the University of
Washington. The authors’ views expressed in this manuscript do not necessarily
reflect the views of USAID or the US government.
References
1. WHO and The World Bank. World Report on Disability. Geneva, Switzerland:
World Health Organization; 2011.
2. Rohleder P, Braathen SH, Swartz L, Eide AH. HIV/AIDS and disability in
Southern Africa: a review of relevant literature. Disabil Rehabil. 2009;31:51�9.3. Rohleder P, Eide AH, Swartz L, Ranchod C, Schneider M, Schur C. Gender
differences in HIV knowledge and unsafe sexual behaviours among disabled
people in South Africa. Disabil Rehabil. 2012;34:605�10.4. Hanass-Hancock J. Disability and HIV/AIDS � a systematic review of
literature on Africa. J Int AIDS Soc. 2009;12:9.
5. Hanass-Hancock J, Nixon SA. The fields of HIV and disability: past, present
and future. J Int AIDS Soc. 2009;12:3.
6. Touko A, Mboua CP, Tohmuntain PM, Perrot AB. Sexual vulnerability and HIV
seroprevalence among the deaf and hearing impaired in Cameroon. J Int AIDS
Soc. 2010;13:5.
7. Olaleye AO. Sexual behaviours and reproductive health knowledge among
in-school young people with disabilities in Ibadan, Nigeria. Health Educ. 2007;
107:208�18.8. Aderemi TJ, Pillay BJ, Esterhuizen TM. Differences in HIV knowledge and
sexual practices of learners with intellectual disabilities and non-disabled
learners in Nigeria. J Int AIDS Soc. 2013;16:17331.
9. Groce NE, Yousafzai AK, van der Maas F. HIV/AIDS and disability: differences
in HIV/AIDS knowledge between deaf and hearing people in Nigeria. Disabil
Rehabil. 2007;29:367�71.10. Kvam MH, Braathen SH. ‘‘I thought . . . maybe this is my chance’’:
sexual abuse against girls and women with disabilities in Malawi. Sex Abuse.
2008;20:5�24.11. Philander JH, Swartz L. Needs, barriers, and concerns regarding HIV
prevention among South Africans with visual impairments: a key informant
study. J Vis Impair Blind. 2006;100:111�4.12. De Beaudrap P, Mac-Seing M, Pasquier E. Disability and HIV: a systematic
review and a meta-analysis of the risk of HIV infection among adults with
disabilities in Sub-Saharan Africa. AIDS Care. 2014;26:1467�76.13. Trani JF, Browne J, Kett M, Bah O, Morlai T, Bailey N, et al. Access to health
care, reproductive health and disability: a large scale survey in Sierra Leone.
Soc Sci Med. 2011;73:1477�89.14. Yousafzai AK, Edwards K, D’Allesandro C, Lindstrom L. HIV/AIDS information
and services: the situation experienced by adolescents with disabilities in
Rwanda and Uganda. Disabil Rehabil. 2005;27:1357�63.15. Nixon SA, Cameron C, Hanass-Hancock J, Simwaba P, Solomon PE, Bond
VA, et al. Perceptions of HIV-related health services in Zambia for people with
disabilities who are HIV-positive. J Int AIDS Soc. 2014;17:18806, doi: http://dx.
doi.org/10.7448/IAS.17.1.18806
16. Chireshe R, Rutondoki EN, Ojwang P. Perceptions of the availability and
effectiveness of HIVAIDS awareness and intervention programmes by people
with disabilities in Uganda. SAHARA J. 2010;7:17�23.17. Human Rights Watch. ‘‘We are also dying of AIDS’’: barriers to HIV services
and treatment for persons with disabilities in Zambia. New York, U.S: Human
Rights Watch; 2014.
18. Parsons JA, Bond VA, Nixon SA. ‘‘Are We Not Human?’’ Stories of stigma,
disability and HIV from Lusaka, Zambia and their implications for access to
health services. PLoS One. 2015;10:e0127392.
Tun W et al. Journal of the International AIDS Society 2016, 19(Suppl 4):20829
http://www.jiasociety.org/index.php/jias/article/view/20829 | http://dx.doi.org/10.7448/IAS.19.5.20829
28

19. Hanass-Hancock J, Strode A, Grant C. Inclusion of disability within national
strategic responses to HIV and AIDS in Eastern and Southern Africa. Disabil
Rehabil. 2011;33:2389�96.20. National HIV/AIDS Council, Government of Zambia. Republic of Zambia
National HIV and AIDS Strategic Plan. Lusaka, Zambia: National AIDS Council
(NAC); 2006�2010.21. Uganda AIDS Commission, Government of the Republic of Uganda.
National Strategic Plan for HIV & AIDS 2007/08�2011/12. Kampala, Uganda:
Uganda AIDS Commission.
22. Ghana AIDS Commission, Government of the Republic of Ghana. National
HIV/AIDS Strategic Framework for Ghana. Accra, Ghana: Ghana AIDS Commission
2006�2010.23. Corbin J, Strauss A. Basics of qualitative research: techniques and
procedures for developing grounded theory. 3rd ed. Thousand Oaks, CA: Sage;
2008.
24. Green J, Thorogood N. Qualitative methods for health research. 3rd ed.
London: Sage; 2013.
25. Richie J, Spencer L. Qualitative data analysis for applied policy research. In:
Bryman A, Burgess R, editors. Analysing qualitative data. London: Routledge;
1994. p 173�94.26. Schenk K, Tun W, Sheehy M, Okal J, Kuffour E, Moono G, et al. ‘‘Even the
fowl has feelings’’: attitudes towards and among persons with disabilities
accessing HIV information and services in Ghana, Uganda, and Zambia.
27. Liverpool VCT Care and Treatment and VSO Jitolee. A handbook on best
practices regarding HIV and AIDS for people with disabilities. Nairobi, Kenya:
LVCT; 2010.
28. Merrick J, Talnir R, Gross S, Chemtob D, Aspler S, Kandel I, et al.
Human Immunodeficiency Virus (HIV) and persons with disability/intellectual
disability: a review. Int J Public Health. 2010;2:285�8.29. UNAIDS. 90-90-90: an ambitious treatment target to help end the AIDS
epidemic. Geneva, Switzerland: UNAIDS; 2014.
Tun W et al. Journal of the International AIDS Society 2016, 19(Suppl 4):20829
http://www.jiasociety.org/index.php/jias/article/view/20829 | http://dx.doi.org/10.7448/IAS.19.5.20829
29
Research article
Reducing HIV-related risk and mental health problems through a
client-centred psychosocial intervention for vulnerable
adolescents in Addis Ababa, Ethiopia
Nrupa Jani§,1, Lung Vu1, Lynnette Kay2, Kassahun Habtamu3 and Samuel Kalibala1
§Corresponding author: Nrupa Jani, 4301 Connecticut Avenue NW, Suite 280, Washington, DC 20008, USA. Tel: �1 202 237 9400. ([email protected])
Abstract
Introduction: Ethiopia is experiencing an increasingly urban HIV epidemic, alongside a rise in urban adolescent migration.
Adolescent migrants are often confronted by unique social challenges, including living in a difficult environment, abuse and
mental health problems. These issues can increase adolescents’ vulnerability to HIV and compromise their capacity to protect
themselves and others from HIV. We piloted and assessed the effects of a targeted psychosocial intervention to reduce mental
health problems and improve HIV-related outcomes among migrant adolescents in Addis Ababa.
Methods: A pre- and post-comparison design was used in a cohort of 576 female and 154 male migrant adolescents aged 15 to
18 years in Addis Ababa receiving services from two service delivery organizations, Biruh Tesfa and Retrak. We implemented a
three-month client-centred, counsellor-delivered psychosocial intervention, based on findings from formative research among
the same target population, to address participants’ increased vulnerability to HIV. The intervention package comprised
individual, group and creative arts therapy counselling sessions. Key outcome indicators included anxiety, depression, aggressive
behaviour, attention problems, social problems, knowledge of HIV, safer sex practices and use of sexual health services.
Longitudinal data analysis (McNemar test and random effects regression) was used to assess changes over time in key indicators
by gender.
Results: For females, aggressive behaviour decreased by 60% (adjusted odds ratio (AOR): 0.4 (0.25 to 0.65)) and any mental
health problem decreased by 50% (AOR: 0.5 (0.36 to 0.81)) from baseline to end line. In addition, knowledge of HIV increased by
60% (AOR: 1.6 (1.08 to 2.47)), knowledge of a place to test for HIV increased by 70% (AOR: 1.7 (1.12 to 2.51)) and HIV testing
increased by 80% (AOR: 1.8 (1.13 to 2.97)). For males, HIV knowledge increased by 110% (AOR: 2.1 (1.1 to 3.94)), knowledge of a
place to test for HIV increased by 290% (AOR: 3.9 (1.02 to 14.9)), HIV testing increased by 630% (AOR: 7.3 (2.6 to 20.7)) and use
of sexual health services increased by 220% (AOR: 3.2 (1.62 to 6.27)). We did not find any significant reduction in mental health
problems among male adolescents.
Conclusions: Our findings suggest that a psychosocial intervention was associated with increased knowledge and uptake of HIV
and sexual health services among both male and female migrant adolescents and with reduced mental health problems among
female adolescents. Mental health problems varied significantly for male and female adolescents, suggesting that future
interventions should be tailored to address their different needs and would benefit from intensive follow-up efforts.
Keywords: Ethiopia; mental health; vulnerable adolescents; HIV risk; psychosocial intervention.
Received 23 November 2015; Revised 22 April 2016; Accepted 4 May 2016; Published 20 July 2016
Copyright: – 2016 Jani N et al; licensee International AIDS Society. This is an Open Access article distributed under the terms of the Creative Commons Attribution
3.0 Unported (CC BY 3.0) License (http://creativecommons.org/licenses/by/3.0/), which permits unrestricted use, distribution, and reproduction in any medium,
provided the original work is properly cited.
IntroductionIn 2011, HIV prevalence in Ethiopia was 1.0% for men and 1.9%
for women aged 15 to 49 years in the general population [1].
Although Ethiopia has a relatively low national HIV prevalence
of 1% among young adults aged 15 to 24 years [2], it is
experiencing an increasingly urban and female-centred HIV
epidemic [3]. Risk of infection is higher among young people
living in urban settings, especially young women (1.7% female;
0.2% male) [2]. Urban HIV prevalence is also higher at 7.7%
compared with 0.9% in rural areas [4]. UNAIDS 2013 data
estimated that 74% of new adolescent HIV infections in
Ethiopia occur among young women [5].
Additionally, Ethiopia is experiencing a surge in rural-to-
urban migration, with an increase in young people migrating
to urban areas in search of educational and economic
advancement opportunities [6]. Young migrants are often
confronted by unique social challenges such as: abuse; lack of
education, parental guidance and social networks; inadequate
housing and access to health services; and unstable employ-
ment conditions [3,7]. However, the experiences of young
female andmale adolescent migrants differ in important ways.
Female migrants are often at a greater disadvantage than
males due to lower educational levels and gender norms that
allow for subjugation of females [6]. A 2006 population-based
Jani N et al. Journal of the International AIDS Society 2016, 19(Suppl 4):20832
http://www.jiasociety.org/index.php/jias/article/view/20832 | http://dx.doi.org/10.7448/IAS.19.5.20832
30
survey of 1000 adolescents aged 10 to 19 in Addis Ababa found
that nearly 25% of migrant females had moved in order to
avoid family-mandated early marriages [3]. It has been shown
that 77% of working girls in low-income areas of Addis Ababa
were domestic helpers, a job associated with low, if any, pay,
extreme social isolation and poor working conditions � all
factors that can contribute to an elevated HIV risk [8]. Young
women are particularly vulnerable to physical and sexual
abuse in their homes, places of work or in transit during
migration, increasing their susceptibility to HIV [9].
Male migrant adolescents, too, are vulnerable. A 2009
study found that 29% of male street children in the Merkato
area of Addis Ababa had been sexually assaulted [10].
A recent study by Habtamu and Adamu [7] found that
among male street adolescents and children, nearly all
participants reported having heard about cases of sexual
exploitation of their male peers. The authors wrote, ‘‘Sexual
abuse and exploitation of male migrant adolescents is also
one of the emerging social problems affecting the physical,
social and psychological wellbeing of children in Addis
Ababa’’ [7]. Furthermore, highly mobile adolescents are
particularly vulnerable to sexually transmitted diseases,
such as HIV, and circular migration patterns that can facilitate
the spread of HIV between high-prevalence urban centres
and low-prevalence rural areas [11]. There is also a wide-
spread belief in Ethiopia that men who have sex with men
and male sexual abuse are not ‘‘Ethiopian’’ [10], so it can be
assumed that male sexual abuse cases go unreported,
underreported or misreported.
Resultant negative psychosocial outcomes, such as feelings
of guilt, stress, self-blame, anxiety and depression, are
common and associated with sexual and HIV-related risks
[12,13]. Reasons for increased risk include low self-esteem and
self-efficacy, vulnerability to sexual abuse, limited educational
opportunities and communication skills, and inability to
negotiate safer sex [14]. Nearly 50% of all adult mental health
problems begin during adolescence [15], even though they
may not be diagnosed until well into adulthood. Research has
shown a strong bidirectional link between HIV vulnerability
and mental health illnesses [16]. Among adolescents, aggres-
sive discipline, family violence, poor interpersonal relation-
ships and compromised mental health status can increase HIV
risk [17], further supporting the need for mental health
interventions to halt the spread of the virus.
To date, there is no evidence about the effects of targeted
psychosocial interventions on mental health and HIV-related
outcomes of young migrant adolescents in Ethiopia. This is
the first operations research study aiming to pilot and
assess the effects of a targeted psychosocial intervention
among this target population in Ethiopia. The intervention
was designed to reduce mental health problems, such as
anxiety and aggressive behaviour, and to improve HIV-
related outcomes, including knowledge of HIV, safer sex
practices and use of sexual and reproductive health (SRH)
services. The findings will serve as an evidence base for
future interventions targeting migrant and vulnerable
adolescents in Ethiopia and similar contexts.
MethodsStudy design and sample size
The study used a pre- and post-comparison design with the
same individuals being followed up over time. Participants
included consenting male and female adolescents aged 15 to
18 years in Addis Ababa, Ethiopia, receiving services for the
previous three months from two service delivery organiza-
tions, Biruh Tesfa and Retrak. Biruh Tesfa works with female
migrant adolescents who are predominantly employed as
domestic workers, whereas Retrak works with male migrant
adolescents who are often engaged in street labour activities,
such as petty trade and as bus station porters. Based on client
volume at both organizations, we recruited all eligible youth
who consented to participate in the study.We recruited a total
of 576 eligible females at Biruh Tesfa and 154 eligible males at
Retrak in June and July 2013. Following the three-month
intervention period, we re-interviewed 315 female partici-
pants (56.6%) and 102 male participants (68.5%) at end line.
Description of the intervention
We piloted a client-centred, psychosocial counselling inter-
vention package that was delivered by study counsellors for
three months. The intervention package comprised various
counselling modalities, including individual, group and crea-
tive therapies, such as music, art and drama. All enrolled
participants received a minimum of one initial, individual
counselling session. Afterwards, each participant was assessed
again by his/her counsellor and referred for further group or
individual counselling. If after the first session the counsellor
deemed that the participant would benefit from further
counselling to discuss deeper rooted emotional issues, then
he/she was referred for group counselling in the format of art,
music or drama therapy.
Counsellors maintained a counselling record book to
document issues discussed and enable follow-up in subse-
quent sessions, as needed. This package of intervention
components was modelled on problem-solving therapy, which
has been shown to be effective in helping young people
deal with a wide range of difficulties and problems that occur
in everyday living [19�21].Counsellors were trained using a standard training curri-
culum developed by the study team with inputs from both
service delivery organizations. Counselling training topics
included: adolescent health and development; psychological
wellbeing and mental health problems; factors increasing
vulnerability of marginalized adolescents; concepts of and
ethical issues in counselling; counselling theories, skills and
processes; group counselling; and creative therapies and
music and drama therapies.
The five-day counsellor training included a practicum day
and a one-day refresher training held midway (1.5 months)
through the intervention. Counsellors used a client-centred
approach, addressing the following: 1) main issues brought
forth by the client; 2) possible options and solutions to address
the issues and the pros and cons of each option; and 3) plan
of action selected by the client to address the problem.
Counsellors were also trained to cover topics of sexual health
and HIVand AIDS (knowledge, risks and prevention strategies),
Jani N et al. Journal of the International AIDS Society 2016, 19(Suppl 4):20832
http://www.jiasociety.org/index.php/jias/article/view/20832 | http://dx.doi.org/10.7448/IAS.19.5.20832
31
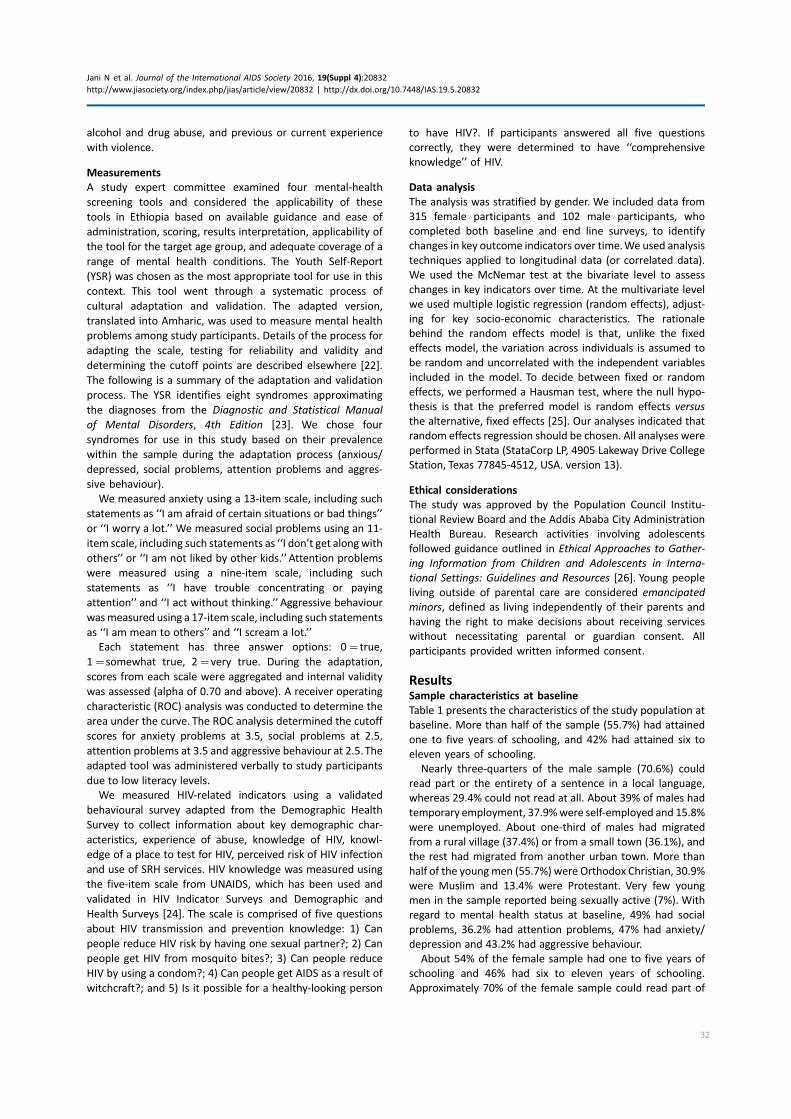
alcohol and drug abuse, and previous or current experience
with violence.
Measurements
A study expert committee examined four mental-health
screening tools and considered the applicability of these
tools in Ethiopia based on available guidance and ease of
administration, scoring, results interpretation, applicability of
the tool for the target age group, and adequate coverage of a
range of mental health conditions. The Youth Self-Report
(YSR) was chosen as the most appropriate tool for use in this
context. This tool went through a systematic process of
cultural adaptation and validation. The adapted version,
translated into Amharic, was used to measure mental health
problems among study participants. Details of the process for
adapting the scale, testing for reliability and validity and
determining the cutoff points are described elsewhere [22].
The following is a summary of the adaptation and validation
process. The YSR identifies eight syndromes approximating
the diagnoses from the Diagnostic and Statistical Manual
of Mental Disorders, 4th Edition [23]. We chose four
syndromes for use in this study based on their prevalence
within the sample during the adaptation process (anxious/
depressed, social problems, attention problems and aggres-
sive behaviour).
We measured anxiety using a 13-item scale, including such
statements as ‘‘I am afraid of certain situations or bad things’’
or ‘‘I worry a lot.’’ We measured social problems using an 11-
item scale, including such statements as ‘‘I don’t get along with
others’’ or ‘‘I am not liked by other kids.’’ Attention problems
were measured using a nine-item scale, including such
statements as ‘‘I have trouble concentrating or paying
attention’’ and ‘‘I act without thinking.’’ Aggressive behaviour
wasmeasured using a 17-item scale, including such statements
as ‘‘I am mean to others’’ and ‘‘I scream a lot.’’
Each statement has three answer options: 0�true,
1�somewhat true, 2�very true. During the adaptation,
scores from each scale were aggregated and internal validity
was assessed (alpha of 0.70 and above). A receiver operating
characteristic (ROC) analysis was conducted to determine the
area under the curve. The ROC analysis determined the cutoff
scores for anxiety problems at 3.5, social problems at 2.5,
attention problems at 3.5 and aggressive behaviour at 2.5. The
adapted tool was administered verbally to study participants
due to low literacy levels.
We measured HIV-related indicators using a validated
behavioural survey adapted from the Demographic Health
Survey to collect information about key demographic char-
acteristics, experience of abuse, knowledge of HIV, knowl-
edge of a place to test for HIV, perceived risk of HIV infection
and use of SRH services. HIV knowledge was measured using
the five-item scale from UNAIDS, which has been used and
validated in HIV Indicator Surveys and Demographic and
Health Surveys [24]. The scale is comprised of five questions
about HIV transmission and prevention knowledge: 1) Can
people reduce HIV risk by having one sexual partner?; 2) Can
people get HIV from mosquito bites?; 3) Can people reduce
HIV by using a condom?; 4) Can people get AIDS as a result of
witchcraft?; and 5) Is it possible for a healthy-looking person
to have HIV?. If participants answered all five questions
correctly, they were determined to have ‘‘comprehensive
knowledge’’ of HIV.
Data analysis
The analysis was stratified by gender. We included data from
315 female participants and 102 male participants, who
completed both baseline and end line surveys, to identify
changes in key outcome indicators over time.We used analysis
techniques applied to longitudinal data (or correlated data).
We used the McNemar test at the bivariate level to assess
changes in key indicators over time. At the multivariate level
we used multiple logistic regression (random effects), adjust-
ing for key socio-economic characteristics. The rationale
behind the random effects model is that, unlike the fixed
effects model, the variation across individuals is assumed to
be random and uncorrelated with the independent variables
included in the model. To decide between fixed or random
effects, we performed a Hausman test, where the null hypo-
thesis is that the preferred model is random effects versus
the alternative, fixed effects [25]. Our analyses indicated that
random effects regression should be chosen. All analyses were
performed in Stata (StataCorp LP, 4905 Lakeway Drive College
Station, Texas 77845-4512, USA. version 13).
Ethical considerations
The study was approved by the Population Council Institu-
tional Review Board and the Addis Ababa City Administration
Health Bureau. Research activities involving adolescents
followed guidance outlined in Ethical Approaches to Gather-
ing Information from Children and Adolescents in Interna-
tional Settings: Guidelines and Resources [26]. Young people
living outside of parental care are considered emancipated
minors, defined as living independently of their parents and
having the right to make decisions about receiving services
without necessitating parental or guardian consent. All
participants provided written informed consent.
ResultsSample characteristics at baseline
Table 1 presents the characteristics of the study population at
baseline. More than half of the sample (55.7%) had attained
one to five years of schooling, and 42% had attained six to
eleven years of schooling.
Nearly three-quarters of the male sample (70.6%) could
read part or the entirety of a sentence in a local language,
whereas 29.4% could not read at all. About 39% of males had
temporary employment, 37.9%were self-employed and 15.8%
were unemployed. About one-third of males had migrated
from a rural village (37.4%) or from a small town (36.1%), and
the rest had migrated from another urban town. More than
half of the youngmen (55.7%) were Orthodox Christian, 30.9%
were Muslim and 13.4% were Protestant. Very few young
men in the sample reported being sexually active (7%). With
regard to mental health status at baseline, 49% had social
problems, 36.2% had attention problems, 47% had anxiety/
depression and 43.2% had aggressive behaviour.
About 54% of the female sample had one to five years of
schooling and 46% had six to eleven years of schooling.
Approximately 70% of the female sample could read part of
Jani N et al. Journal of the International AIDS Society 2016, 19(Suppl 4):20832
http://www.jiasociety.org/index.php/jias/article/view/20832 | http://dx.doi.org/10.7448/IAS.19.5.20832
32
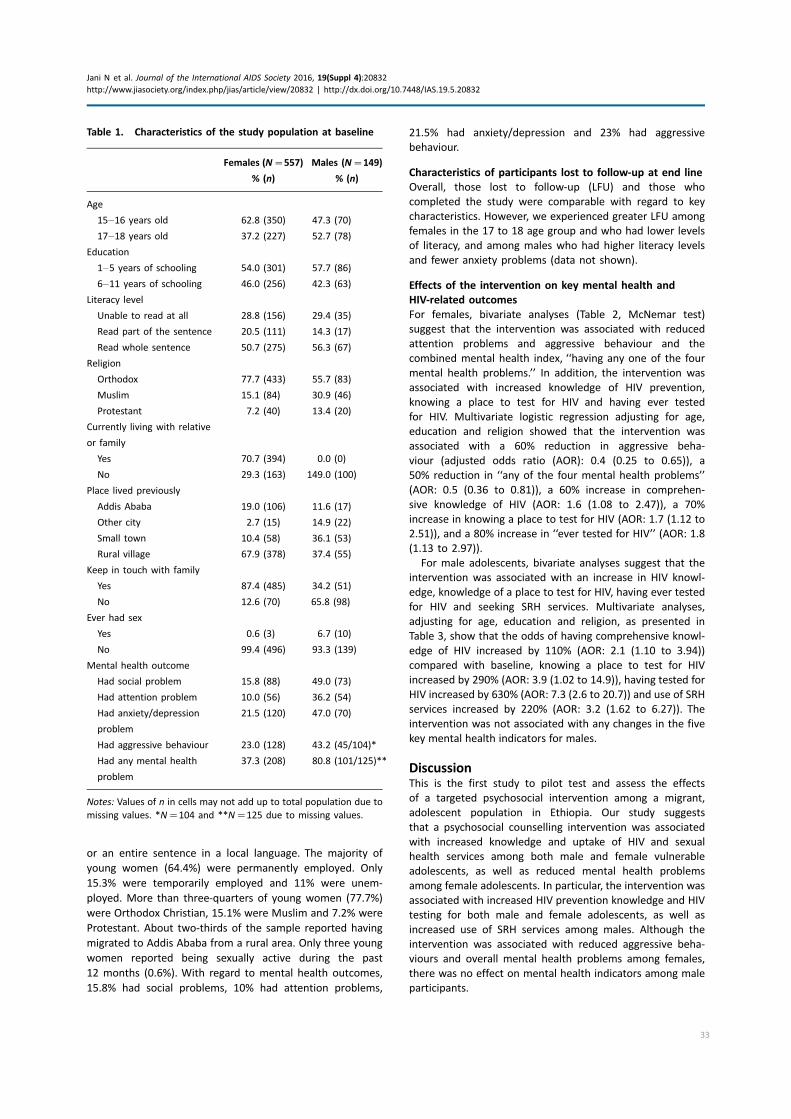
or an entire sentence in a local language. The majority of
young women (64.4%) were permanently employed. Only
15.3% were temporarily employed and 11% were unem-
ployed. More than three-quarters of young women (77.7%)
were Orthodox Christian, 15.1% were Muslim and 7.2% were
Protestant. About two-thirds of the sample reported having
migrated to Addis Ababa from a rural area. Only three young
women reported being sexually active during the past
12 months (0.6%). With regard to mental health outcomes,
15.8% had social problems, 10% had attention problems,
21.5% had anxiety/depression and 23% had aggressive
behaviour.
Characteristics of participants lost to follow-up at end line
Overall, those lost to follow-up (LFU) and those who
completed the study were comparable with regard to key
characteristics. However, we experienced greater LFU among
females in the 17 to 18 age group and who had lower levels
of literacy, and among males who had higher literacy levels
and fewer anxiety problems (data not shown).
Effects of the intervention on key mental health and
HIV-related outcomes
For females, bivariate analyses (Table 2, McNemar test)
suggest that the intervention was associated with reduced
attention problems and aggressive behaviour and the
combined mental health index, ‘‘having any one of the four
mental health problems.’’ In addition, the intervention was
associated with increased knowledge of HIV prevention,
knowing a place to test for HIV and having ever tested
for HIV. Multivariate logistic regression adjusting for age,
education and religion showed that the intervention was
associated with a 60% reduction in aggressive beha-
viour (adjusted odds ratio (AOR): 0.4 (0.25 to 0.65)), a
50% reduction in ‘‘any of the four mental health problems’’
(AOR: 0.5 (0.36 to 0.81)), a 60% increase in comprehen-
sive knowledge of HIV (AOR: 1.6 (1.08 to 2.47)), a 70%
increase in knowing a place to test for HIV (AOR: 1.7 (1.12 to
2.51)), and a 80% increase in ‘‘ever tested for HIV’’ (AOR: 1.8
(1.13 to 2.97)).
For male adolescents, bivariate analyses suggest that the
intervention was associated with an increase in HIV knowl-
edge, knowledge of a place to test for HIV, having ever tested
for HIV and seeking SRH services. Multivariate analyses,
adjusting for age, education and religion, as presented in
Table 3, show that the odds of having comprehensive knowl-
edge of HIV increased by 110% (AOR: 2.1 (1.10 to 3.94))
compared with baseline, knowing a place to test for HIV
increased by 290% (AOR: 3.9 (1.02 to 14.9)), having tested for
HIV increased by 630% (AOR: 7.3 (2.6 to 20.7)) and use of SRH
services increased by 220% (AOR: 3.2 (1.62 to 6.27)). The
intervention was not associated with any changes in the five
key mental health indicators for males.
DiscussionThis is the first study to pilot test and assess the effects
of a targeted psychosocial intervention among a migrant,
adolescent population in Ethiopia. Our study suggests
that a psychosocial counselling intervention was associated
with increased knowledge and uptake of HIV and sexual
health services among both male and female vulnerable
adolescents, as well as reduced mental health problems
among female adolescents. In particular, the intervention was
associated with increased HIV prevention knowledge and HIV
testing for both male and female adolescents, as well as
increased use of SRH services among males. Although the
intervention was associated with reduced aggressive beha-
viours and overall mental health problems among females,
there was no effect on mental health indicators among male
participants.
Table 1. Characteristics of the study population at baseline
Females (N�557)
% (n)
Males (N�149)
% (n)
Age
15�16 years old 62.8 (350) 47.3 (70)
17�18 years old 37.2 (227) 52.7 (78)
Education
1�5 years of schooling 54.0 (301) 57.7 (86)
6�11 years of schooling 46.0 (256) 42.3 (63)
Literacy level
Unable to read at all 28.8 (156) 29.4 (35)
Read part of the sentence 20.5 (111) 14.3 (17)
Read whole sentence 50.7 (275) 56.3 (67)
Religion
Orthodox 77.7 (433) 55.7 (83)
Muslim 15.1 (84) 30.9 (46)
Protestant 7.2 (40) 13.4 (20)
Currently living with relative
or family
Yes 70.7 (394) 0.0 (0)
No 29.3 (163) 149.0 (100)
Place lived previously
Addis Ababa 19.0 (106) 11.6 (17)
Other city 2.7 (15) 14.9 (22)
Small town 10.4 (58) 36.1 (53)
Rural village 67.9 (378) 37.4 (55)
Keep in touch with family
Yes 87.4 (485) 34.2 (51)
No 12.6 (70) 65.8 (98)
Ever had sex
Yes 0.6 (3) 6.7 (10)
No 99.4 (496) 93.3 (139)
Mental health outcome
Had social problem 15.8 (88) 49.0 (73)
Had attention problem 10.0 (56) 36.2 (54)
Had anxiety/depression
problem
21.5 (120) 47.0 (70)
Had aggressive behaviour 23.0 (128) 43.2 (45/104)*
Had any mental health
problem
37.3 (208) 80.8 (101/125)**
Notes: Values of n in cells may not add up to total population due to
missing values. *N�104 and **N�125 due to missing values.
Jani N et al. Journal of the International AIDS Society 2016, 19(Suppl 4):20832
http://www.jiasociety.org/index.php/jias/article/view/20832 | http://dx.doi.org/10.7448/IAS.19.5.20832
33
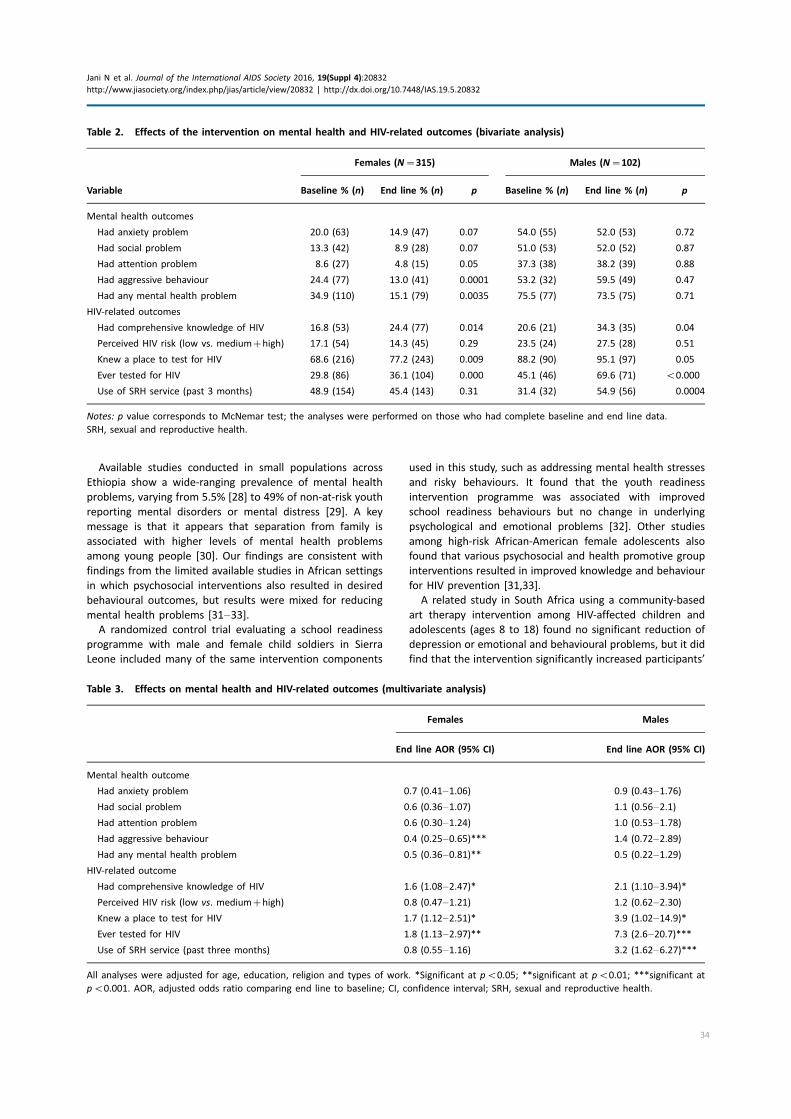
Available studies conducted in small populations across
Ethiopia show a wide-ranging prevalence of mental health
problems, varying from 5.5% [28] to 49% of non-at-risk youth
reporting mental disorders or mental distress [29]. A key
message is that it appears that separation from family is
associated with higher levels of mental health problems
among young people [30]. Our findings are consistent with
findings from the limited available studies in African settings
in which psychosocial interventions also resulted in desired
behavioural outcomes, but results were mixed for reducing
mental health problems [31�33].A randomized control trial evaluating a school readiness
programme with male and female child soldiers in Sierra
Leone included many of the same intervention components
used in this study, such as addressing mental health stresses
and risky behaviours. It found that the youth readiness
intervention programme was associated with improved
school readiness behaviours but no change in underlying
psychological and emotional problems [32]. Other studies
among high-risk African-American female adolescents also
found that various psychosocial and health promotive group
interventions resulted in improved knowledge and behaviour
for HIV prevention [31,33].
A related study in South Africa using a community-based
art therapy intervention among HIV-affected children and
adolescents (ages 8 to 18) found no significant reduction of
depression or emotional and behavioural problems, but it did
find that the intervention significantly increased participants’
Table 2. Effects of the intervention on mental health and HIV-related outcomes (bivariate analysis)
Females (N�315) Males (N�102)
Variable Baseline % (n) End line % (n) p Baseline % (n) End line % (n) p
Mental health outcomes
Had anxiety problem 20.0 (63) 14.9 (47) 0.07 54.0 (55) 52.0 (53) 0.72
Had social problem 13.3 (42) 8.9 (28) 0.07 51.0 (53) 52.0 (52) 0.87
Had attention problem 8.6 (27) 4.8 (15) 0.05 37.3 (38) 38.2 (39) 0.88
Had aggressive behaviour 24.4 (77) 13.0 (41) 0.0001 53.2 (32) 59.5 (49) 0.47
Had any mental health problem 34.9 (110) 15.1 (79) 0.0035 75.5 (77) 73.5 (75) 0.71
HIV-related outcomes
Had comprehensive knowledge of HIV 16.8 (53) 24.4 (77) 0.014 20.6 (21) 34.3 (35) 0.04
Perceived HIV risk (low vs. medium�high) 17.1 (54) 14.3 (45) 0.29 23.5 (24) 27.5 (28) 0.51
Knew a place to test for HIV 68.6 (216) 77.2 (243) 0.009 88.2 (90) 95.1 (97) 0.05
Ever tested for HIV 29.8 (86) 36.1 (104) 0.000 45.1 (46) 69.6 (71) B0.000
Use of SRH service (past 3 months) 48.9 (154) 45.4 (143) 0.31 31.4 (32) 54.9 (56) 0.0004
Notes: p value corresponds to McNemar test; the analyses were performed on those who had complete baseline and end line data.
SRH, sexual and reproductive health.
Table 3. Effects on mental health and HIV-related outcomes (multivariate analysis)
Females Males
End line AOR (95% CI) End line AOR (95% CI)
Mental health outcome
Had anxiety problem 0.7 (0.41�1.06) 0.9 (0.43�1.76)
Had social problem 0.6 (0.36�1.07) 1.1 (0.56�2.1)
Had attention problem 0.6 (0.30�1.24) 1.0 (0.53�1.78)
Had aggressive behaviour 0.4 (0.25�0.65)*** 1.4 (0.72�2.89)
Had any mental health problem 0.5 (0.36�0.81)** 0.5 (0.22�1.29)
HIV-related outcome
Had comprehensive knowledge of HIV 1.6 (1.08�2.47)* 2.1 (1.10�3.94)*
Perceived HIV risk (low vs. medium�high) 0.8 (0.47�1.21) 1.2 (0.62�2.30)
Knew a place to test for HIV 1.7 (1.12�2.51)* 3.9 (1.02�14.9)*
Ever tested for HIV 1.8 (1.13�2.97)** 7.3 (2.6�20.7)***
Use of SRH service (past three months) 0.8 (0.55�1.16) 3.2 (1.62�6.27)***
All analyses were adjusted for age, education, religion and types of work. *Significant at pB0.05; **significant at pB0.01; ***significant at
pB0.001. AOR, adjusted odds ratio comparing end line to baseline; CI, confidence interval; SRH, sexual and reproductive health.
Jani N et al. Journal of the International AIDS Society 2016, 19(Suppl 4):20832
http://www.jiasociety.org/index.php/jias/article/view/20832 | http://dx.doi.org/10.7448/IAS.19.5.20832
34
sense of self-worth and self-efficacy for decision making and
dealing with a difficult environment [34]. Furthermore,
a trauma-focused cognitive behaviour therapy intervention
implemented with female adolescents in the Democratic
Republic of Congo, who had been sexually exploited and war
affected, found significant reduction in psychological distress
and psychosocial difficulties [35].
Taken together, these findings suggest that, although
behavioural changes may be detected after a short duration
of intervention, changes in psychosocial and mental health
problems will likely require an intervention period longer
than three months to show any detectable changes.
The differences in use of sexual health services (including
seeking counselling for safer sex and HIV-prevention methods)
between females and males could be attributed to the
accessibility of HIV testing and health education services.
Biruh Tesfa mentored females were referred to government-
run clinics for health information and services, including HIV
testing, whereas males accessed HIV testing and SRH services
on site at Retrak with a staff nurse who was known to them.
This familiarity of the staff and ease of access may have
accounted for an increased use of SRH services among males.
Our findings indicate that a psychosocial intervention
addressing underlying mental health issues might foster
vulnerable adolescents’ capacity to benefit from HIV risk-
reduction education and use of HIV-related services. Using a
client-centred approach in a targeted psychosocial interven-
tion may improve the psychosocial wellbeing and self-efficacy
of participants, ultimately facilitating behaviour change.
The reduction in mental health problems seen only among
female adolescents may be explained as follows. First, there
were important differences in the groups of male and female
adolescents. For example, the prevalence of mental health
problems of all four indicators was much higher among males
than among females at baseline, suggesting that the inter-
vention might have to be gender specific to see a significant
impact.
Second, males were living in more difficult situations � all
had previously lived or worked on the street, possibly making
their mental health problems more sustained or difficult to
change. In addition, they may have required a more intensive,
tailored or lengthier psychosocial intervention in order to see a
significant change in mental health outcomes.
Finally, Retrak staff reported that when male adolescents
first joined the programme, they were quiet and withdrawn,
but as they developed trust in Retrak staff and felt safe, they
expressed their anger and frustration and became much
more demanding and aggressive, which often lasted until
they were reintegrated with their families or society. This
could partially explain the insignificant mental health findings
among male participants.
Limitations
It is possible that sexual activity and/or sexual abuse data
were underreported among this population due to social
desirability or recall bias, especially in the context of a face-
to-face interview.
In addition, the studydid not have a control group due to the
inability to recruit a larger population for an experimental
study design. This limited our ability to tease out the true
impact of the intervention on key outcomes. However, this
approach is particularly acceptable because the study was
designed as operational research with the aim of pilot testing
the intervention and measuring changes in outcomes among
participants. Resources permitting, a follow-up controlled
study would be ideal for examining the impact of the
intervention.
Moreover, the study had a high rate of LFU, especially
among female participants. LFU could have reduced the
statistical power in detecting significant changes in key
outcomes. The high LFU rate was due to the mobility of this
population and time and financial constraints, which impacted
the number of mentors who remained available to assist study
counsellors to follow upwith study participants for subsequent
counselling sessions. Lastly, due to financial and logistical
constraints and the high mobility of this migrant population,
the intervention could not be delivered for longer than a three-
month period.
ConclusionsThe findings suggest that a psychosocial intervention
is associated with increased knowledge and uptake of HIV
and sexual health services among both male and female
migrant adolescents, and with reduced mental health
problems among female adolescents. The mental health
problems of male and female adolescents varied significantly,
suggesting that future interventions should be tailored to
address their different needs. Furthermore, future opera-
tional research using a controlled design among migrant
adolescents is needed and would benefit from intensive
follow-up efforts to reduce LFU or from a larger sample size.
Authors’ affiliations1HIVCore/Population Council, Washington, DC, USA; 2Retrak Ethiopia, Addis
Ababa, Ethiopia; 3School of Psychology, Addis Ababa University, Addis Ababa,
Ethiopia
Competing interests
The authors declare that they have no conflicts of interest.
Authors’ contributions
SK and NJ conceived the study. LK contributed to the intervention design. SK,
NJ, LK and KH oversaw the data collection. LV and KH conducted the data
analysis. LV and NJ drafted the manuscript. All authors provided critical review
and comments and approved the final manuscript.
Acknowledgements
First and foremost, we thank all the Biruh Tesfa and Retrak participants of this
study. This study would not have been possible without the Population Council
Ethiopia research team, including Annabel Erulkar, Habtamu Demele, Lemi
Negeri, Tigest Tamrat, Selamawit Gidey, and our Council New York and DC
colleagues Meredith Sheehy and Nanlesta Pilgrim. We greatly appreciate the
work of our Retrak colleague Julyata Shibru, who assisted with both the design
and implementation of the study. We are grateful to all the Biruh Tesfa
mentors and Zelalem Belay for their assistance in implementing the study and
coordinating the data collection efforts; all of the counsellors, counsellor
supervisors and clinical nurses; the government of Ethiopia and the community
members at large who support the implementation of both these programmes.
Funding
This study was made possible through support provided by the US President’s
Emergency Plan for AIDS Relief and the US Agency for International
Development (USAID) via HIVCore, a Task Order funded by USAID under the
Project SEARCH indefinite quantity contract (contract no. AID-OAA-TO-11-00060).
Jani N et al. Journal of the International AIDS Society 2016, 19(Suppl 4):20832
http://www.jiasociety.org/index.php/jias/article/view/20832 | http://dx.doi.org/10.7448/IAS.19.5.20832
35
The Task Order is led by the Population Council in partnership with the
Elizabeth Glaser Pediatric AIDS Foundation, Palladium and the University of
Washington.
Disclaimer
The authors’ views expressed in this manuscript do not necessarily reflect the
views of USAID or the US government.
References
1. ICF International. HIV/AIDS in Ethiopia: data from the 2011 Ethiopia
demographic and health survey. Calverton, MD: ICF International; 2012.
2. Central Statistical Agency [Ethiopia] and ICF International. Ethiopia demo-
graphic and health survey 2011. Addis Ababa, Ethiopia: Central Statistical
Agency and ICF International; 2012.
3. Erulkar A, Mekbib T, Simie N, Gulema T. Migration and vulnerability among
adolescents in slum areas of Addis Ababa, Ethiopia. J Youth Stud. 2006;
9(3):361�74.4. Democratic Republic of Ethiopia, MoH. HIV/AIDS and the health-related
Millennium Development Goals: the experience in Ethiopia. 2010; [cited 2015
sep 27]. Available from: http://data.unaids.org/pub/Report/2010/20100917_
ethiopia_aids_plus_mdgs_en.pdf
5. Joint United Nations Programme on HIV/AIDS (UNAIDS). Ethiopia HIV
estimates. Geneva, Switzerland: Joint United Nations Programme on HIV/AIDS
(UNAIDS); 2013.
6. Temin M, Montgomery M, Engebretsen S, Barker K. Girls on the move:
adolescent girls and migration in the developing world. New York: Population
Council; 2013.
7. Habtamu D, Adamu A. Assessment of sexual and reproductive health status
of street children in Addis Ababa. J Sex Transm Dis. 2013;2013:524076.
8. Erulkar A, Mekbib TA. Invisible and vulnerable: adolescent domestic workers
in Addis Ababa, Ethiopia. Vulnerable Child Youth Stud. 2007;2(3):246�56.9. United Nations (UN). The gap report. Geneva, Switzerland: Joint United
Nations Programme on HIV/AIDS (UNAIDS); 2014.
10. Tadele G. ‘Unrecognized victims’: sexual abuse against male street children
in Merkato area, Addis Ababa. Ethiop J Health Dev. 2009;23(3):174�82.11. Lurie MN, Williams BG, Zuma K, Mkaya-Mwamburi D, Garnett G, Sturm
AW, et al. The impact of migration on HIV-1 transmission in South Africa: a
study of migrant and nonmigrant men and their partners. Sex Transm Dis.
2003;30(2):149�56.12. Ashenafi Y, Kebede D, Desta M, Alem A. Socio-demographic correlates of
mental and behavioural disorders of children in southern Ethiopia. East Afr
Med J. 2000;77(10):565�9.13. Wondie Y, Zemene W, Reschke K, Schroder H. Early marriage, rape, child
prostitution, and related factors determining the psychosocial effects severity
of child sexual abuse in Ethiopia. J Child Sex Abus. 2011;20(3):305�21.14. Patel V, Flisher AJ, Hetrick S, McGorry P. Mental health of young people: a
global public-health challenge. Lancet. 2007;14(369):11.
15. Belfer ML. Child and adolescent mental disorders: the magnitude of the
problem across the globe. J Child Psychol Psychiatry. 2008;49(3):226�36.16. Cluver LD, Orkin M, Gardner F, Boyes ME. Persisting mental health
problems among AIDS-orphaned children in South Africa. J Child Psychol
Psychiatry. 2012;53(4):363�70.17. Betancourt TS, Meyers-Ohiki SE, Charrow A, Hansen N. Mental health and
resilience in HIV/AIDS-affected children: a review of the literature and
recommendations for future research. J Child Psychol Psychiatry. 2013;54(4):
423�44.18. Cournos F, McKinnon K, Wainberg M. What can mental health interven-
tions contribute to the global struggle against HIV/AIDS? World Psychiatry.
2005;4(3):135�41.
19. Nezu AM, Nezu CM, Perri MG. Problem solving therapy for depression:
theory, research, and clinical guidelines. Hoboken: John Wiley and Sons,
Corporate Headquarters; 1989.
20. Palermo TM, Law EF, Essner B, Jessen-Fiddick T, Eccleston C. Adaptation of
problem-solving skills training (PSST) for parent caregivers of youth with
chronic pain. Clin Pract Pediatr Psychol. 2014;2(3):212�23.21. Azrin NH, Donohue B, Teichner GA, Crum T, Howell J, DeCato LA. A
controlled evaluation and description of individual-cognitive problem solving
and family-behavior therapies in dually-diagnosed conduct-disordered and
substance-dependent youth. J Child Adolesc Subst Abuse. 2001;11(1):1�43.22. Geibel S, Habtamu K, Mekonnen G, Jani N, Kay L, Shibru L, et al. Reliability
and validity of an interviewer-administered adaptation of the youth self-report
for mental health screening of vulnerable young people in Ethiopia. PLoS One.
2016;11(2):e0147267.
23. American Psychiatric Association. Diagnostic and statistical manual of
mental disorders: DSM-IV. Washington, DC: American Psychiatric Association;
2000.
24. ICF International. Demographic and health surveys: AIDS indicator survey.
Rockville, MD: ICF International; 2016.
25. Greene WH. Econometric analysis. 6th ed. London: Pearson International;
2008.
26. Schenk KD, Williamson J. Ethical approaches to gathering information
among children and adolescents in international settings: guidelines and
resources. Washington, DC: Horizons/Population Council, Family Health
International/Impact, United States Agency for International Development;
2005.
27. Santelli JS, Smith Rogers A, Rosenfeld WD, DuRant RH, Dubler N, Morreale
M, et al. Guidelines for adolescent health research. A position paper of the
Society for Adolescent Medicine. J Adolesc Health. 2003;33(5):396�409.28. Alem AA, Zergaw A, Kebede D, Araya M, Desta M, Muche T, et al. Child
labor and childhood behavioral and mental health problems in Ethiopia. Ethiop
J Health Sci. 2006;20(2):119�26.29. Tesfaye A. Prevalence and correlates of mental distress among regular
undergraduate students of Hawassa University: a cross sectional survey. East
Afr J Public Health. 2009;6(1):85�94.30. Shiferaw S, Fantahun M, Bekele A. Psychosocial problems among students
in preparatory school, in Dessie town, north east Ethiopia. Ethiop J Health Dev.
2006;20(1):47�55.31. Bangi A, Dolcini MM, Harper GW, Boyer CB, Pollack LM. Psychosocial
outcomes of sexual risk reduction in a brief intervention for urban African
American female adolescents. J HIV AIDS Soc Serv. 2013;12(2):146�59.32. Betancourt TS, McBain R, Newnham EA, Akinsulure-Smith AM, Brennan RT,
Weisz JR, et al. A behavioral intervention for war-affected youth in Sierra
Leone: a randomized control trial. J Am Acad Child Adolesc Psychiatry.
2014;53(12):1288�97.33. DiClemente RJ, Wingood GM, Harrington KF, Lang DL, Davies SL, Hook EW
3rd, et al. Efficacy of an HIV prevention intervention for African American
adolescent girls: a randomized controlled trial. JAMA. 2004;292(2):171�9.34. Mueller J, Alie C, Jonas B, Brown E, Sherr L. A quasi-experimental
evaluation of a community-based art therapy intervention exploring the
psychosocial health of children affected by HIV in South Africa. Trop Med Int
Health. 2011;16(1):57�66.35. O’Callaghan P, McMullen J, Shannon C, Rafferty H, Black A. A randomized
controlled trial of trauma-focused cognitive behavioral therapy for sexually
exploited, war-affected Congolese girls. J Am Acad Child Adolesc Psychiatry.
2013;52(4):331�448.
Jani N et al. Journal of the International AIDS Society 2016, 19(Suppl 4):20832
http://www.jiasociety.org/index.php/jias/article/view/20832 | http://dx.doi.org/10.7448/IAS.19.5.20832
36
Research article
Results from a rapid national assessment of services for the
prevention of mother-to-child transmission of HIV in Cote d’Ivoire
S Adam Granato§,*,1,2, Stephen Gloyd*,1,2, Julia Robinson1,2,3, Serge A Dali2,4, Irma Ahoba5, David Aka5,
Seydou Kouyate1,2, Doroux A Billy1,2, Samuel Kalibala6 and Ahoua Kone1,2
§Corresponding author: S Adam Granasto, 1107 NE 45th St, Seattle, WA, 98105, USA, Tel: �001 206 543 8382. ([email protected])
*These authors have contributed equally to the work.
Abstract
Introduction: Loss-to-follow-up (LTFU) in the prevention of mother-to-child HIV transmission (PMTCT) programmes can occur at
multiple stages of antenatal and follow-up care. This paper presents findings from a national assessment aimed at identifying
major bottlenecks in Cote d’Ivoire’s PMTCT cascade, and to distinguish characteristics of high- and low-performing health
facilities.
Methods: This cross-sectional study, based on a nationally representative sample of 30 health facilities in Cote d’Ivoire used
multiple data sources (registries, patient charts, patient booklets, interviews) to determine the magnitude of LTFU in PMTCT
services. A composite measure of retention � based on child prophylaxis, maternal treatment and infant testing � was used to
identify high- and low-performing sites and determine significant differences using Student’s t-tests.
Results: Among 1,741 pregnant women newly recorded as HIV-positive between June 2011 and May 2012, 43% had a CD4 count
taken, 77% received appropriate prophylaxis and 70% received prophylaxis intended for their infant. During that time, 1,054 first
infant HIV tests were recorded. A conservative rate of adherence to antiretroviral therapy was estimated at 50% (n�219 patient
charts). Significant differences between high- and low-performing sites included: duration of time elapsed between HIV testing
and CD4 results (29.5 versus 56.3 days, p�0.001); and density (number per 100 first antenatal care visits) of full-time physicians
(6.7 versus 1.7, p�0.04), laboratory technicians (2.3 versus 0.7, p�0.046), staff trained in PMTCT (10.7 versus 4.7, p�0.01),
and staff performing patient follow-up activities (7.9 versus 2.5, p�0.02). Key informants highlighted staff presence and
training, the availability of medical supplies and equipment (i.e., on-site CD4 machine), and the adequacy of infrastructure
(i.e., space and ventilation) as perceived key factors positively and negatively impacting retention in care.
Conclusions: Patient LTFU occurred throughout the PMTCT cascade from maternal to infant testing, with retention scores
ranging from 0.10 to 0.83. Sites that scored higher had more dedicated and trained frontline health workers, and emphasised
patient follow-up through outreach and the reduction of delays in care. Strategies to improve patient retention and decrease
transmission should emphasise patient tracking systems that utilise critical human resources to both improve data quality and
increase direct patient follow-up.
Keywords: PMTCT Cascade; prevention of mother-to-child transmission of HIV; health systems factors; Cote d’Ivoire; health
workforce; patient retention.
To access the supplementary material to this article please see Supplementary Files under Article Tools online.
Received 24 November 2015; Revised 9 May 2016; Accepted 13 May 2016; Published 20 July 2016
Copyright: – 2016 Granato SA et al; licensee International AIDS Society. This is an Open Access article distributed under the terms of the Creative Commons
Attribution 3.0 Unported (CC BY 3.0) License (http://creativecommons.org/licenses/by/3.0/), which permits unrestricted use, distribution, and reproduction in any
medium, provided the original work is properly cited.
IntroductionIn much of Africa, programmes for the prevention of mother-
to-child transmission of HIV (PMTCT) have performed less
than optimally [1�4]. Health systems factors cause bottle-
necks that impede patient flow through health care
services, contribute to inconsistent data quality, and cause
patient loss-to-follow-up (LTFU) in various stages of the
PMTCT cascade [5,6]. Understanding how pregnant women
navigate PMTCT health services and the role of health system
factors in disrupting (or facilitating) patient flow helps iden-
tify key obstacles to health outcomes and should inform
PMTCT programme implementation [7,8]. This approach, at
the national scale, is especially pertinent, given that all 21
African priority countries of the Interagency Task Team for
PMTCT have adopted one of the World Health Organization’s
(WHO’s) PMTCT Option B/B� strategies, which include the
universal treatment of all HIV-positive pregnant women with
combination antiretroviral therapy (cART) [9].
Cote d’Ivoire’sMinistere de la Sante et de l’Hygiene Publique
(MSHP), the Ministry of Health and Public Hygiene, introduced
its first nationwide PMTCTprogramme in 2007, with the goal of
lowering the national MTCT rate to 3% by 2015. Despite
Granato SA et al. Journal of the International AIDS Society 2016, 19(Suppl 4):20838
http://www.jiasociety.org/index.php/jias/article/view/20838 | http://dx.doi.org/10.7448/IAS.19.5.20838
37
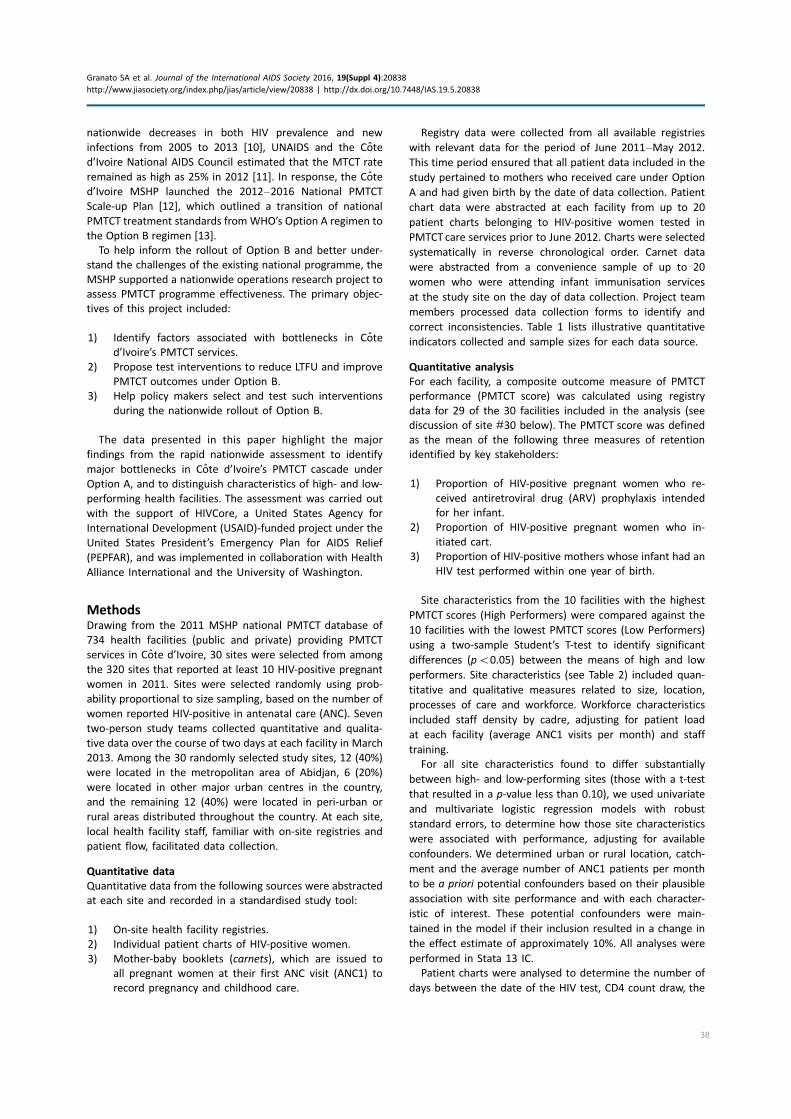
nationwide decreases in both HIV prevalence and new
infections from 2005 to 2013 [10], UNAIDS and the Cote
d’Ivoire National AIDS Council estimated that the MTCT rate
remained as high as 25% in 2012 [11]. In response, the Cote
d’Ivoire MSHP launched the 2012�2016 National PMTCT
Scale-up Plan [12], which outlined a transition of national
PMTCT treatment standards from WHO’s Option A regimen to
the Option B regimen [13].
To help inform the rollout of Option B and better under-
stand the challenges of the existing national programme, the
MSHP supported a nationwide operations research project to
assess PMTCT programme effectiveness. The primary objec-
tives of this project included:
1) Identify factors associated with bottlenecks in Cote
d’Ivoire’s PMTCT services.
2) Propose test interventions to reduce LTFU and improve
PMTCT outcomes under Option B.
3) Help policy makers select and test such interventions
during the nationwide rollout of Option B.
The data presented in this paper highlight the major
findings from the rapid nationwide assessment to identify
major bottlenecks in Cote d’Ivoire’s PMTCT cascade under
Option A, and to distinguish characteristics of high- and low-
performing health facilities. The assessment was carried out
with the support of HIVCore, a United States Agency for
International Development (USAID)-funded project under the
United States President’s Emergency Plan for AIDS Relief
(PEPFAR), and was implemented in collaboration with Health
Alliance International and the University of Washington.
MethodsDrawing from the 2011 MSHP national PMTCT database of
734 health facilities (public and private) providing PMTCT
services in Cote d’Ivoire, 30 sites were selected from among
the 320 sites that reported at least 10 HIV-positive pregnant
women in 2011. Sites were selected randomly using prob-
ability proportional to size sampling, based on the number of
women reported HIV-positive in antenatal care (ANC). Seven
two-person study teams collected quantitative and qualita-
tive data over the course of two days at each facility in March
2013. Among the 30 randomly selected study sites, 12 (40%)
were located in the metropolitan area of Abidjan, 6 (20%)
were located in other major urban centres in the country,
and the remaining 12 (40%) were located in peri-urban or
rural areas distributed throughout the country. At each site,
local health facility staff, familiar with on-site registries and
patient flow, facilitated data collection.
Quantitative data
Quantitative data from the following sources were abstracted
at each site and recorded in a standardised study tool:
1) On-site health facility registries.
2) Individual patient charts of HIV-positive women.
3) Mother-baby booklets (carnets), which are issued to
all pregnant women at their first ANC visit (ANC1) to
record pregnancy and childhood care.
Registry data were collected from all available registries
with relevant data for the period of June 2011�May 2012.
This time period ensured that all patient data included in the
study pertained to mothers who received care under Option
A and had given birth by the date of data collection. Patient
chart data were abstracted at each facility from up to 20
patient charts belonging to HIV-positive women tested in
PMTCT care services prior to June 2012. Charts were selected
systematically in reverse chronological order. Carnet data
were abstracted from a convenience sample of up to 20
women who were attending infant immunisation services
at the study site on the day of data collection. Project team
members processed data collection forms to identify and
correct inconsistencies. Table 1 lists illustrative quantitative
indicators collected and sample sizes for each data source.
Quantitative analysis
For each facility, a composite outcome measure of PMTCT
performance (PMTCT score) was calculated using registry
data for 29 of the 30 facilities included in the analysis (see
discussion of site #30 below). The PMTCT score was defined
as the mean of the following three measures of retention
identified by key stakeholders:
1) Proportion of HIV-positive pregnant women who re-
ceived antiretroviral drug (ARV) prophylaxis intended
for her infant.
2) Proportion of HIV-positive pregnant women who in-
itiated cart.
3) Proportion of HIV-positive mothers whose infant had an
HIV test performed within one year of birth.
Site characteristics from the 10 facilities with the highest
PMTCT scores (High Performers) were compared against the
10 facilities with the lowest PMTCT scores (Low Performers)
using a two-sample Student’s T-test to identify significant
differences (pB0.05) between the means of high and low
performers. Site characteristics (see Table 2) included quan-
titative and qualitative measures related to size, location,
processes of care and workforce. Workforce characteristics
included staff density by cadre, adjusting for patient load
at each facility (average ANC1 visits per month) and staff
training.
For all site characteristics found to differ substantially
between high- and low-performing sites (those with a t-test
that resulted in a p-value less than 0.10), we used univariate
and multivariate logistic regression models with robust
standard errors, to determine how those site characteristics
were associated with performance, adjusting for available
confounders. We determined urban or rural location, catch-
ment and the average number of ANC1 patients per month
to be a priori potential confounders based on their plausible
association with site performance and with each character-
istic of interest. These potential confounders were main-
tained in the model if their inclusion resulted in a change in
the effect estimate of approximately 10%. All analyses were
performed in Stata 13 IC.
Patient charts were analysed to determine the number of
days between the date of the HIV test, CD4 count draw, the
Granato SA et al. Journal of the International AIDS Society 2016, 19(Suppl 4):20838
http://www.jiasociety.org/index.php/jias/article/view/20838 | http://dx.doi.org/10.7448/IAS.19.5.20838
38
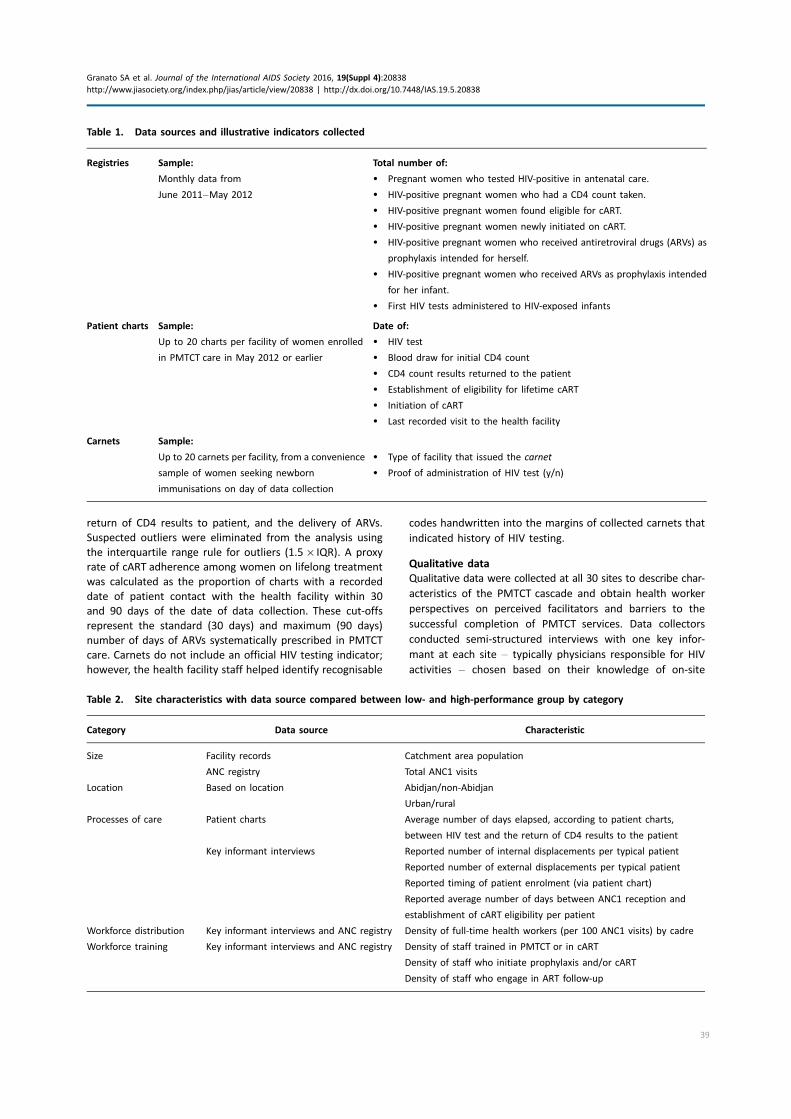
return of CD4 results to patient, and the delivery of ARVs.
Suspected outliers were eliminated from the analysis using
the interquartile range rule for outliers (1.5�IQR). A proxy
rate of cART adherence among women on lifelong treatment
was calculated as the proportion of charts with a recorded
date of patient contact with the health facility within 30
and 90 days of the date of data collection. These cut-offs
represent the standard (30 days) and maximum (90 days)
number of days of ARVs systematically prescribed in PMTCT
care. Carnets do not include an official HIV testing indicator;
however, the health facility staff helped identify recognisable
codes handwritten into the margins of collected carnets that
indicated history of HIV testing.
Qualitative data
Qualitative data were collected at all 30 sites to describe char-
acteristics of the PMTCT cascade and obtain health worker
perspectives on perceived facilitators and barriers to the
successful completion of PMTCT services. Data collectors
conducted semi-structured interviews with one key infor-
mant at each site � typically physicians responsible for HIV
activities � chosen based on their knowledge of on-site
Table 1. Data sources and illustrative indicators collected
Registries Sample:
Monthly data from
June 2011�May 2012
Total number of:
� Pregnant women who tested HIV-positive in antenatal care.
� HIV-positive pregnant women who had a CD4 count taken.
� HIV-positive pregnant women found eligible for cART.
� HIV-positive pregnant women newly initiated on cART.
� HIV-positive pregnant women who received antiretroviral drugs (ARVs) as
prophylaxis intended for herself.
� HIV-positive pregnant women who received ARVs as prophylaxis intended
for her infant.
� First HIV tests administered to HIV-exposed infants
Patient charts Sample:
Up to 20 charts per facility of women enrolled
in PMTCT care in May 2012 or earlier
Date of:
� HIV test
� Blood draw for initial CD4 count
� CD4 count results returned to the patient
� Establishment of eligibility for lifetime cART
� Initiation of cART
� Last recorded visit to the health facility
Carnets Sample:
Up to 20 carnets per facility, from a convenience
sample of women seeking newborn
immunisations on day of data collection
� Type of facility that issued the carnet
� Proof of administration of HIV test (y/n)
Table 2. Site characteristics with data source compared between low- and high-performance group by category
Category Data source Characteristic
Size Facility records Catchment area population
ANC registry Total ANC1 visits
Location Based on location Abidjan/non-Abidjan
Urban/rural
Processes of care Patient charts Average number of days elapsed, according to patient charts,
between HIV test and the return of CD4 results to the patient
Key informant interviews Reported number of internal displacements per typical patient
Reported number of external displacements per typical patient
Reported timing of patient enrolment (via patient chart)
Reported average number of days between ANC1 reception and
establishment of cART eligibility per patient
Workforce distribution Key informant interviews and ANC registry Density of full-time health workers (per 100 ANC1 visits) by cadre
Workforce training Key informant interviews and ANC registry Density of staff trained in PMTCT or in cART
Density of staff who initiate prophylaxis and/or cART
Density of staff who engage in ART follow-up
Granato SA et al. Journal of the International AIDS Society 2016, 19(Suppl 4):20838
http://www.jiasociety.org/index.php/jias/article/view/20838 | http://dx.doi.org/10.7448/IAS.19.5.20838
39
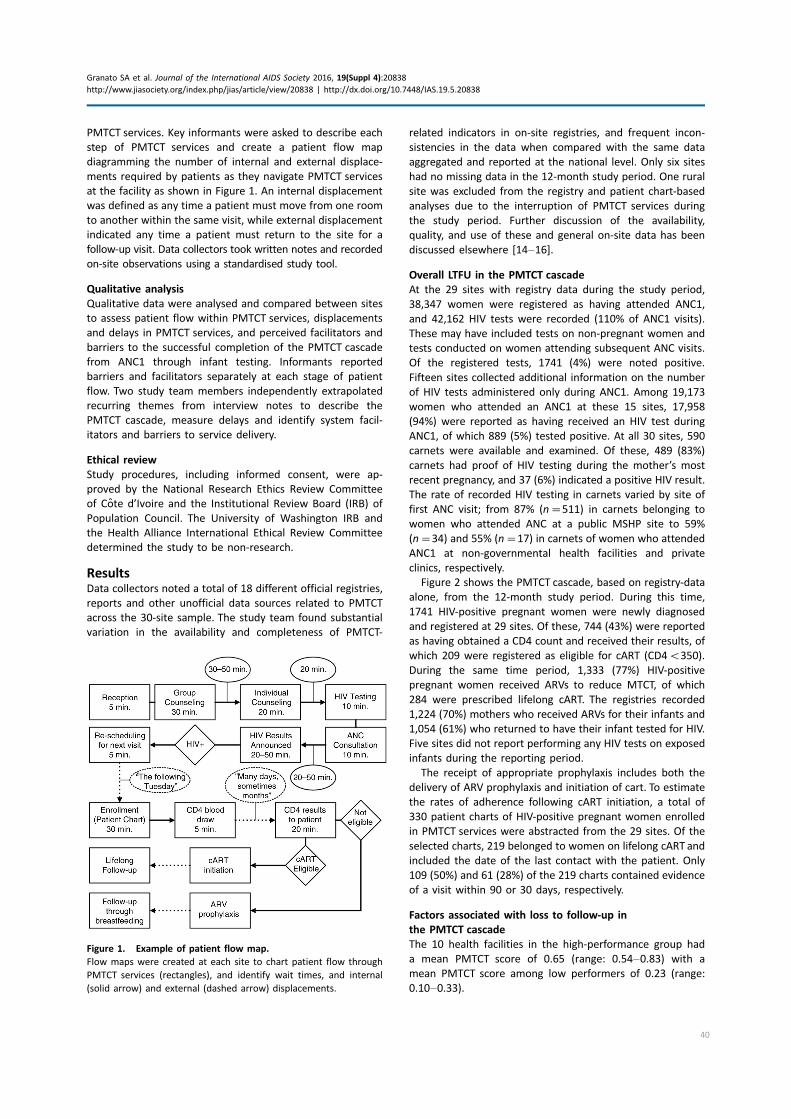
PMTCT services. Key informants were asked to describe each
step of PMTCT services and create a patient flow map
diagramming the number of internal and external displace-
ments required by patients as they navigate PMTCT services
at the facility as shown in Figure 1. An internal displacement
was defined as any time a patient must move from one room
to another within the same visit, while external displacement
indicated any time a patient must return to the site for a
follow-up visit. Data collectors took written notes and recorded
on-site observations using a standardised study tool.
Qualitative analysis
Qualitative data were analysed and compared between sites
to assess patient flow within PMTCT services, displacements
and delays in PMTCT services, and perceived facilitators and
barriers to the successful completion of the PMTCT cascade
from ANC1 through infant testing. Informants reported
barriers and facilitators separately at each stage of patient
flow. Two study team members independently extrapolated
recurring themes from interview notes to describe the
PMTCT cascade, measure delays and identify system facil-
itators and barriers to service delivery.
Ethical review
Study procedures, including informed consent, were ap-
proved by the National Research Ethics Review Committee
of Cote d’Ivoire and the Institutional Review Board (IRB) of
Population Council. The University of Washington IRB and
the Health Alliance International Ethical Review Committee
determined the study to be non-research.
ResultsData collectors noted a total of 18 different official registries,
reports and other unofficial data sources related to PMTCT
across the 30-site sample. The study team found substantial
variation in the availability and completeness of PMTCT-
related indicators in on-site registries, and frequent incon-
sistencies in the data when compared with the same data
aggregated and reported at the national level. Only six sites
had no missing data in the 12-month study period. One rural
site was excluded from the registry and patient chart-based
analyses due to the interruption of PMTCT services during
the study period. Further discussion of the availability,
quality, and use of these and general on-site data has been
discussed elsewhere [14�16].
Overall LTFU in the PMTCT cascade
At the 29 sites with registry data during the study period,
38,347 women were registered as having attended ANC1,
and 42,162 HIV tests were recorded (110% of ANC1 visits).
These may have included tests on non-pregnant women and
tests conducted on women attending subsequent ANC visits.
Of the registered tests, 1741 (4%) were noted positive.
Fifteen sites collected additional information on the number
of HIV tests administered only during ANC1. Among 19,173
women who attended an ANC1 at these 15 sites, 17,958
(94%) were reported as having received an HIV test during
ANC1, of which 889 (5%) tested positive. At all 30 sites, 590
carnets were available and examined. Of these, 489 (83%)
carnets had proof of HIV testing during the mother’s most
recent pregnancy, and 37 (6%) indicated a positive HIV result.
The rate of recorded HIV testing in carnets varied by site of
first ANC visit; from 87% (n�511) in carnets belonging to
women who attended ANC at a public MSHP site to 59%
(n�34) and 55% (n�17) in carnets of women who attended
ANC1 at non-governmental health facilities and private
clinics, respectively.
Figure 2 shows the PMTCT cascade, based on registry-data
alone, from the 12-month study period. During this time,
1741 HIV-positive pregnant women were newly diagnosed
and registered at 29 sites. Of these, 744 (43%) were reported
as having obtained a CD4 count and received their results, of
which 209 were registered as eligible for cART (CD4B350).
During the same time period, 1,333 (77%) HIV-positive
pregnant women received ARVs to reduce MTCT, of which
284 were prescribed lifelong cART. The registries recorded
1,224 (70%) mothers who received ARVs for their infants and
1,054 (61%) who returned to have their infant tested for HIV.
Five sites did not report performing any HIV tests on exposed
infants during the reporting period.
The receipt of appropriate prophylaxis includes both the
delivery of ARV prophylaxis and initiation of cart. To estimate
the rates of adherence following cART initiation, a total of
330 patient charts of HIV-positive pregnant women enrolled
in PMTCT services were abstracted from the 29 sites. Of the
selected charts, 219 belonged to women on lifelong cART and
included the date of the last contact with the patient. Only
109 (50%) and 61 (28%) of the 219 charts contained evidence
of a visit within 90 or 30 days, respectively.
Factors associated with loss to follow-up in
the PMTCT cascade
The 10 health facilities in the high-performance group had
a mean PMTCT score of 0.65 (range: 0.54�0.83) with a
mean PMTCT score among low performers of 0.23 (range:
0.10�0.33).
Figure 1. Example of patient flow map.
Flow maps were created at each site to chart patient flow through
PMTCT services (rectangles), and identify wait times, and internal
(solid arrow) and external (dashed arrow) displacements.
Granato SA et al. Journal of the International AIDS Society 2016, 19(Suppl 4):20838
http://www.jiasociety.org/index.php/jias/article/view/20838 | http://dx.doi.org/10.7448/IAS.19.5.20838
40
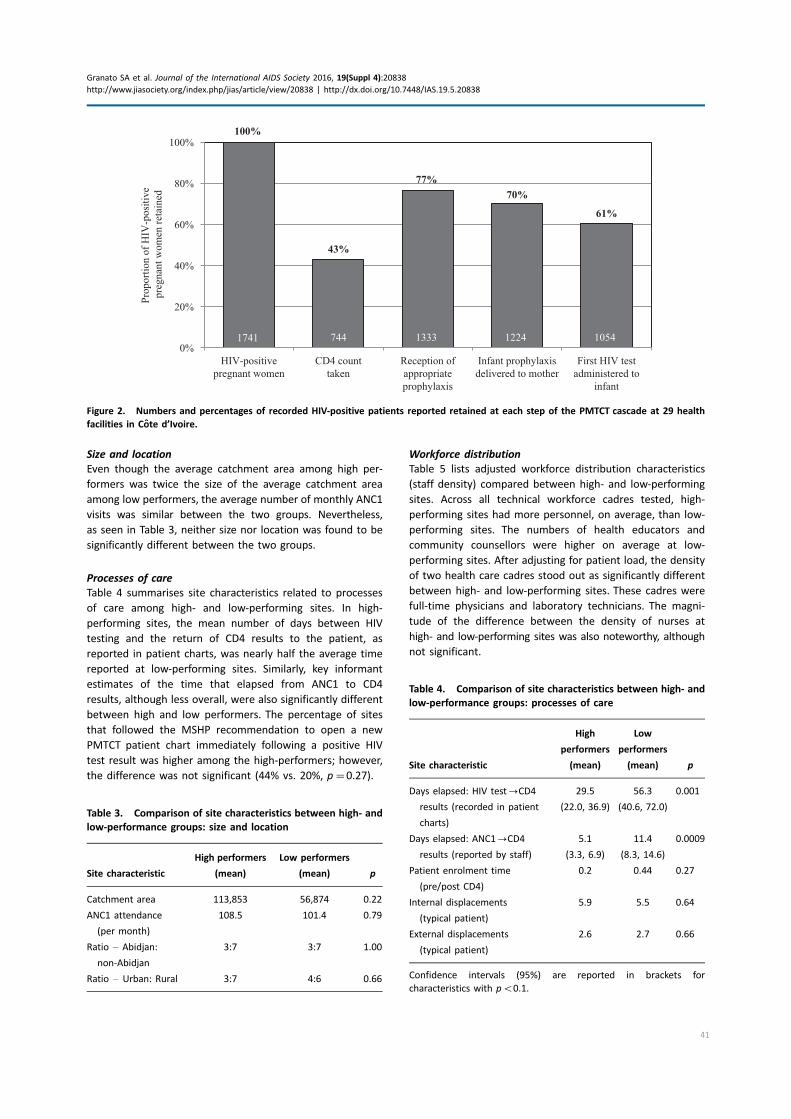
Size and location
Even though the average catchment area among high per-
formers was twice the size of the average catchment area
among low performers, the average number of monthly ANC1
visits was similar between the two groups. Nevertheless,
as seen in Table 3, neither size nor location was found to be
significantly different between the two groups.
Processes of care
Table 4 summarises site characteristics related to processes
of care among high- and low-performing sites. In high-
performing sites, the mean number of days between HIV
testing and the return of CD4 results to the patient, as
reported in patient charts, was nearly half the average time
reported at low-performing sites. Similarly, key informant
estimates of the time that elapsed from ANC1 to CD4
results, although less overall, were also significantly different
between high and low performers. The percentage of sites
that followed the MSHP recommendation to open a new
PMTCT patient chart immediately following a positive HIV
test result was higher among the high-performers; however,
the difference was not significant (44% vs. 20%, p�0.27).
Workforce distribution
Table 5 lists adjusted workforce distribution characteristics
(staff density) compared between high- and low-performing
sites. Across all technical workforce cadres tested, high-
performing sites had more personnel, on average, than low-
performing sites. The numbers of health educators and
community counsellors were higher on average at low-
performing sites. After adjusting for patient load, the density
of two health care cadres stood out as significantly different
between high- and low-performing sites. These cadres were
full-time physicians and laboratory technicians. The magni-
tude of the difference between the density of nurses at
high- and low-performing sites was also noteworthy, although
not significant.
100%
43%
77%70%
61%
0%
20%
40%
60%
80%
100%
HIV-positivepregnant women
CD4 counttaken
Reception ofappropriateprophylaxis
Infant prophylaxisdelivered to mother
First HIV testadministered to
infant
Prop
ortio
n of
HIV
-pos
itive
pr
egna
nt w
omen
reta
ined
1741 744 1333 1224 1054
Figure 2. Numbers and percentages of recorded HIV-positive patients reported retained at each step of the PMTCT cascade at 29 health
facilities in Cote d’Ivoire.
Table 3. Comparison of site characteristics between high- and
low-performance groups: size and location
Site characteristic
High performers
(mean)
Low performers
(mean) p
Catchment area 113,853 56,874 0.22
ANC1 attendance
(per month)
108.5 101.4 0.79
Ratio � Abidjan:
non-Abidjan
3:7 3:7 1.00
Ratio � Urban: Rural 3:7 4:6 0.66
Table 4. Comparison of site characteristics between high- and
low-performance groups: processes of care
Site characteristic
High
performers
(mean)
Low
performers
(mean) p
Days elapsed: HIV test0CD4
results (recorded in patient
charts)
29.5
(22.0, 36.9)
56.3
(40.6, 72.0)
0.001
Days elapsed: ANC10CD4
results (reported by staff)
5.1
(3.3, 6.9)
11.4
(8.3, 14.6)
0.0009
Patient enrolment time
(pre/post CD4)
0.2 0.44 0.27
Internal displacements
(typical patient)
5.9 5.5 0.64
External displacements
(typical patient)
2.6 2.7 0.66
Confidence intervals (95%) are reported in brackets for
characteristics with pB0.1.
Granato SA et al. Journal of the International AIDS Society 2016, 19(Suppl 4):20838
http://www.jiasociety.org/index.php/jias/article/view/20838 | http://dx.doi.org/10.7448/IAS.19.5.20838
41
Workforce training
As shown in Table 6, on average, more staff had received
training or performed specific follow-up tasks in high-
performing sites than in low-performing sites. PMTCT training
and staff engagement in patient follow-up activities stood
out as characteristics differing significantly between high-
and low-performing sites.
The inclusion of potential confounders in multivariate
logistic regression models did not alter the overall signifi-
cance of the results observed using the t-test for any of the
site characteristics evaluated. Although some of the esti-
mated adjusted odds ratios were notably different than
unadjusted estimates, these changes were likely due to over-
fitting models with a small sample size. Therefore adjusted
estimates are not presented in this paper, but can be found in
the supplementary files.
Perceived facilitators and barriers
Interviews with health workers and observations by the
study teams showed varied patterns of PMTCT services with
substantial variance in facilitators and barriers to care. When
data from interviews and observations were analysed by
performance group, three of the top five facilitators cited at
high-performing sites also appeared in the top five barriers
cited at low-performing sites. These included adequate space
(high/facilitator � 8 sites; low/barrier � 8 sites); ventilation
(high/facilitator � 8 sites; low/barrier � 6 sites) and the
availability of trained staff (high/facilitator � 7 sites; low/
barrier � 4 sites). Thus, the presence or absence of these
three factors was perceived to have a high impact on overall
PMTCT performance. Other perceived factors influencing
patient retention included the availability of medicines, tests,
supplies, and equipment and conditions for confidentiality.
Although patient flow generally followed MSHP guidelines
for PMTCT at all sites, the level of the integration of the
HIV services into ANC and timing of enrolment in care varied
substantially among sites. Fourteen sites conducted HIV
testing in the ANC room (as in Figure 1), while others referred
women to another room in a different part of the health
facility for the rapid test. Some health workers preferred a
separate room for testing for perceived greater confidentiality
and efficiency. Other respondents expressed concerns that a
separate testing room added to the total time a woman spent
receiving overall ANC and PMTCT services.
Patient flow and wait times were frequently cited as both
perceived facilitators and barriers to care. Long wait
times were often reported in conjunction with insufficient
staffing levels and/or appropriate training. For example, a
doctor at one urban site noted: ‘‘There is only one antenatal
consultation room at this health facility. This means that
there is only one health provider who delivers ANC services
each day. When there are busy days, wait times can be very
long.’’ Inversely, some respondents noted low wait times as a
result of the availability and training of staff. At one rural site,
a key informant noted the impact of having a ‘‘PEPFAR-
supported laboratory with qualified personnel’’ on reducing
wait times and consequently LTFU during the CD4 testing
stage.
DiscussionThis nationally representative, random sample of antenatal
clinics providing PMTCTservices in Cote d’Ivoire demonstrated
significant losses and delays throughout the PMTCT cascade,
from the identification and delivery of appropriate prophylaxis
to infant testing and likely adherence to lifelong treatment.
These findings are consistent with previous studies that have
demonstrated LTFU in the PMTCTcascade in African countries
at similar levels [17].
Table 5. Comparison of site characteristics between high- and
low-performance groups: workforce distribution
Site characteristic
High
performers
(mean)
Low
performers
(mean) p
Full-time physicians
per 100 ANC1 patients
6.5
(0.02, 0.11)
1.8
(0.01, 0.02)
0.04
Laboratory technicians
per 100 ANC1 patients
1.9
(0.9, 3.0)
0.7
(�0.2, 1.5)
0.046
Nurses
per 100 ANC1 patients
6.1
(1.1, 11.1)
1.9
(0.8, 3.0)
0.09
Midwives 5.7 3.3 0.38
per 100 ANC1 patients
Nurses aids 4.2 3.4 0.65
per 100 ANC1 patients
Pharmacy staff 1.3 0.7 0.24
per 100 ANC1 patients
Health educators 0.2 0.4 0.62
per 100 ANC1 patients
Community counsellors
per 100 ANC1 patients
2.7 6.1 0.50
Data are adjusted for patient load based on the mean number of
ANC1 visits per month at each health facility. Confidence intervals
(95%) are reported in brackets for characteristics with pB0.1.
Table 6. Comparison of site characteristics between high- and
low-performance groups: workforce training
Site characteristic
High performers
(mean)
Low performers
(mean) p
Staff trained in PMTCT
per 100 ANC1 patients
10.7
(6.3, 15.1)
4.7
(2.6, 6.7)
0.01
Staff Trained in cART
per 100 ANC1 patients
5.8 2.0 0.16
Staff who Initiate cART
per 100 ANC1 patients
5.2 2.1 0.18
Staff who conduct follow up
per 100 ANC1 patients
7.9
(3.4, 12.4)
2.5
(0.5, 4.4)0.02
Staff who initiate prophylaxis
per 100 ANC1 patients
6.8 4.2 0.22
Data are adjusted for patient load based on the mean number of
ANC1 visits per month at each health facility. Confidence intervals
(95%) are reported in brackets for characteristics with pB0.1.
Granato SA et al. Journal of the International AIDS Society 2016, 19(Suppl 4):20838
http://www.jiasociety.org/index.php/jias/article/view/20838 | http://dx.doi.org/10.7448/IAS.19.5.20838
42
The multiplicity of registries and other data sources likely
contributed to inconsistent record keeping and reported
data. These inconsistencies � especially with respect to the
lower proportion of women tested for HIV reported in the
carnets than in registries � raised concerns about the validity
of data from standard sources. In the long term, the authors
support the improvement of indicator sensitivity and redu-
cing redundancies of data collection. However, in the short
term, the use of data from multiple sources can help identify
areas for improvement within the existing health information
system and note possible undocumented loss � such as
the 17% of women lacking documentation of HIV testing in
their carnet.
Despite WHO guidelines requiring CD4 testing to deter-
mine appropriate prophylaxis under Option A, this study
showed that many women received ARVs without under-
going CD4 testing. This suggests that the CD4 test require-
ment was not the principal barrier to prophylaxis delivery,
and that its elimination under Option B/B� will need to be
supplemented with additional strategies to encourage the
uptake of ARVs. Further research on specific systems-level
interventions will be required following the transition to
the option B/B� regimens to reduce LTFU at this stage in
the cascade.
Another finding with implications for Option B/B� was
the low level of adherence to lifelong treatment approxi-
mated by using patient chart data. It is likely that actual cART
adherence rates may have been higher than the proxy
indicator used in this study suggested, as interviewers at
several sites noted that many patient visits or transfers were
not recorded in patient charts. Patient tracking systems
should be highlighted under Option B/B� to better under-
stand retention following initiation of cART. Such systems
would serve to both improve data quality for decision-
making, and identify patients at high risk for LTFU [18].
The wide variability of PMTCT scores among sampled clinics
suggests that major improvements in PMTCT service effec-
tiveness are possible with attention to the factors noted
in this study, such as the training and availability of key
human resources and delays in processes of care. Interviews
with frontline health workers reinforced these findings and
suggested that human resource factors do more to facilitate
service delivery, while infrastructural and material deficien-
cies serve as the most tangible barriers to care. These findings
are consistent with previous studies of PMTCT programmes
in Sub-Saharan Africa [19,20]. At the policy level, staffing
and training should be prioritised. At the facility level,
implementable systems-based interventions are needed,
such as improvement of physical conditions (space, ventila-
tion, cleanliness) and ensuring the systematic enrolment,
documentation and tracking of patients in care.
Limitations
Although this mixed-method assessment was done with a
robust national sample of 30 PMTCT sites, the assessment
was limited by several factors. Registry analyses were cross-
sectional, limiting inferences of causality. When adjusted
models were used to attempt to control for confounding in
the analysis of correlates of high and low performance, the
resulting estimates were imprecise. This was likely due to
over-fitting models in a small sample. The continued presence
of confounders means that our results must be interpreted
cautiously, but this caution should be weighed against the
strong scientific plausibility of the likelihood that staffing and
training levels influence PMTCT outcomes.
Estimates of LTFU assumed that patients continue to seek
PMTCT services at the same health facility. If health facilities
had referred out for certain services due to lack of equipment
or periodic stock shortages, those patients would not
have been accounted for in retention rates. Additionally, key
informants were health care facility staff; no patient perspec-
tives were elicited regarding barriers and facilitators to care.
As mentioned above, poor data quality and availability
served as both a limitation and opportunity for analysis.
Missing data, such as proof of testing in carnets, may have
represented non-reporting rather than the failure to provide
care. Similarly, the patient chart sample, which likely over-
represented HIV-positive women on lifelong cART, may
include non-reporting (missing clinical visits; missing charts)
or the failure to provide care. This impacted the extent to
which carnet and chart-based inferences could be extended
to all women in PMTCT care.
Last, though the use of a composite PMTCT score to
identify high- and low-performing sites helped to inform
areas for intervention, using different measures of retention
in the calculation of the PMTCT score would have changed
the distribution of sites into low- and high-performance
categories. Various combinations of retention indicators and
scoring methodologies were tested with the final methodol-
ogy based on advice from MSHP officials.
ConclusionsThis study provided a rapid method to assess national PMTCT
programme performance at the health facility level and
identify factors associated with high and low performance.
In less than two weeks, the study team was able to capture
both quantitative and qualitative data from multiple data
sources that demonstrated strengths and weaknesses of the
PMTCT programme not typically apparent from routine
reporting. Despite inconsistencies in both the quality and
availability of data across the sample, the combination of
multiple existing data sources helped to identify key char-
acteristics of high- and low-performing sites, which should
inform interventions to reduce LTFU in the PMTCT cascade.
This study suggests that strategies to improve patient
retention and decrease MTCT under Option B/B� should
combine efforts to increase the availability and training of
key frontline health workers, improve physical conditions at
ANC clinics to enhance patient care and confidentiality and
simplify and strengthen data collection systems. A systems
focus on patient follow-up with adequate charting and
communication with patients is a critical starting point for
improving patient retention.
Authors’ affiliations1Health Alliance International, Seattle,WA, USA; 2Department of Global Health,
University of Washington, Seattle, WA, USA; 3School of Social Work, University
of Washington, Seattle, WA, USA; 4Insitut National de la Sante Publique,
Abidjan, Cote d’Ivoire; 5Programme National de Lutte contre le SIDA, Ministere
Granato SA et al. Journal of the International AIDS Society 2016, 19(Suppl 4):20838
http://www.jiasociety.org/index.php/jias/article/view/20838 | http://dx.doi.org/10.7448/IAS.19.5.20838
43
de la Sante et de l’Hygiene Publique, Abidjan, Cote d’Ivoire; 6Population
Council, Washington, DC, USA
Competing interests
IA and DA work for the Cote d’Ivoire national HIV/AIDS programme which
funds, regulates, and implements PMTCT services in Cote d’Ivoire. SAG, JR, AK,
DA, SK and SG work for Health Alliance International, which receives funding to
support PMTCT programmes in northern Cote d’Ivoire.
Authors’ contributions
SG, JR, SD, SKo, DB, SKa and AK contributed to project conception, protocol
development and project implementation planning. IA and DA also contributed
to project implementation planning. SD, SKo and DA contributed to data
collection. SAG, SG and JR contributed to data analysis. SAG and SG drafted
and finalized the article with review from all authors. All authors have read and
approved the final manuscript.
Acknowledgements
The authors very much appreciate the technical, administrative and financial
support of the following agencies and people, without which this assessment
could not have been carried out:
The Cote d’Ivoire Ministere de la Sante et de l’Hygiene Publique, including
the Institut National de la Sante Publique, the Direction Generale de la Lutte
Contre le SIDA, the Programme National de Prise en Charge, and the Direction
de l’Information, de la Planification, et de l’Evaluation. Within these agencies,
we are grateful for the individual support of Professor Dinard Kouassi, Dr. Te
Bonle Marguerite, Dr. Virginie Traore-Ettienge, and the study supervisors,
including Kone Mamadou and Dr. Tape Jocelyn. Also, we owe a huge thank you
to the Regional and District Directors, the Directors of all the 30 health
facilities, their health facility staff, including the providers and data collectors
who contributed to the assessment.
These include the University of Bouake (now Universite Allasane Ouattara),
including Professor N’dhatz Melanie and Dr. Stephane Kondji. In addition,
support came from the University of Washington (Seattle, WA, USA), including
King Holmes, James Hughes, Matt Merkes, Sally Weatherford and Josh Apfel.
In addition, thanks to the Health Alliance International (Cote d’Ivoire),
including Dr. Jean Pierre Amonou, Djeneba Toure, Kouadio Ouanda, Stephane
Koudougnon (Seattle HQ) James Pfeiffer, Kenny Sherr, Sarah Gimbel, Susan
Thompson, George Monagan, Marnie Chinn, Peggy Riehle, Tiffany Scharn,
Andrea Chateaubriand, Catie Henley and Kristjana Asbjornsdottir.
United States Agency for International Development (Washington, DC) also
contributed, including Sarah Sandison, Glenn Post, Anouk Amzel, Ryan Phelps,
Delivette Castor and the thoughtful reviewers of the protocol and report;
(Abidjan), Valerie Koscelnik, Dr. Etien Koua and the Centers for Disease Control
(Abidjan), Drs. Ekra Kunomboa Alexandre, Gueye Abdou Salam, Teri Wingate,
Jennifer Walsh and Nobah Marie Therese.
The Population Council and the HIVCore Project, including Sam Kalibala,
Karen Foreit, Godfrey Woelk, Debbie Weiss, Nrupa Jani, Naomi Rutenberg,
Sherry Hutchinson and Joseph Williams, also gave assistance.
A very special thanks to Kirkby Tickell and Rebecca Brander for their
technical support, feedback and contribution to the analyses.
Funding
This study was made possible through support provided by the President’s
Emergency Plan for AIDS Relief and the U.S. Agency for International
Development (USAID) via HIVCore, a Task Order funded by USAID under the
Project SEARCH indefinite quantity contract (Contract No. AID-OAA-TO-11-
00060). The Task Order is led by the Population Council in partnership with
the Elizabeth Glaser Pediatric AIDS Foundation, Palladium, and the University
of Washington. The authors’ views expressed in this manuscript do not
necessarily reflect the views of USAID or the United States Government.
References
1. Stringer EM, Ekouevi DK, Coetzee D, Tih PM, Creek TL, Stinson K, et al.
Coverage of nevirapine-based services to prevent mother-to-child HIV
transmission in 4 African countries. JAMA. 2010;304(3):293�302.
2. Bisio F, Masini G, Vaca EB, Calzi A, Cardinale F, Bruzzone B, et al.
Effectiveness of a project to prevent HIV vertical transmission in the Republic
of Congo. J Antimicrob Chimother. 2013;68:1862�71.3. Sinunu MA, Schouten EJ, Wadonda-Kabondo N, Kajawo E, Eliya M, Moyo K,
et al. Evaluating the impact of prevention of mother-to-child transmission of
HIV in Malawi through immunization clinic-based surveillance. PLoS One.
2014;9(6):e100741.
4. UN Joint Programme on HIV/AIDS (UNAIDS). 2015 Progress report on the
global plan [Internet]. 2015 [cited 2016 Mar 20]. Available from: http://
www.unaids.org/sites/default/files/media_asset/JC2774_2015ProgressReport_
GlobalPlan_en.pdf
5. Turan JM, Onono M, Steinfeld RL, Shade SB, Owuor K, Washington S, et al.
Implementation and operational research: effects of antenatal care and
HIV treatment integration on elements of the PMTCT cascade: results from
the SHAIP cluster-randomized controlled trial in Kenya. J Acq Immun Def.
2015;69(5):e172�81.6. Colvin CJ, Konopka S, Chalker JC, Jonas E, Albertini J, Amzel A, et al.
A systematic review of health system barriers and enablers for antiretroviral
therapy (ART) for HIV-infected pregnant and postpartum women. PLoS One.
2014;9(10):e108150.
7. Mate KS, Bennett B, Mphatswe W, Barker P, Rollins N. Challenges for routine
health system data management in a large public programme to prevent
mother-to-child HIV transmission in South Africa. PLoS One. 2009;4(5):e5483.
8. Barker PM, Mphatswe W, Rollins N. Antiretroviral drugs in the cupboard are
not enough: the impact of health systems’ performance on mother-to-child
transmission of HIV. J Acq Immun Def. 2011;56(2):e45�8.9. Option B� countries and PMTCT Regimen [Internet]. New York: The
Interagency Task Team on the Prevention and Treatment of HIV Infection in
Pregnant Women, Mothers and Children; 2015 [cited 2015 Oct 29]. Available
from: http://www.emtct-iatt.org/b-countries-and-pmtct-regimen/
10. UN Joint Programme on HIV/AIDS (UNAIDS). The gap report [Internet].
2014 [cited 2016 Mar 20]. Available from: http://www.unaids.org/sites/
default/files/media_asset/UNAIDS_Gap_report_en.pdf
11. Cote d’Ivoire. Conseil National de Lutte Contre le SIDA. Suivi de la
declaration de politique sur le SIDA de Juin 2011. Abidjan: Ministry of Health;
2014.
12. Cote d’Ivoire Ministere de la Sante et de la Lutte contre le SIDA. Plan
d’elimination de la transmission mere-enfant du VIH (2012�2015). Abidjan:Ministry of Health; 2012.
13. World Health Organization HIV/AIDS Programme. Programmatic update:
use of antiretroviral drugs for treating pregnant women and preventing HIV
infection in infants. 2012. [cited 2016 Mar 20]. Available from: http://www.
who.int/hiv/PMTCT_update.pdf
14. Gloyd SS, Robinson J, Dali SA, Granato SA, Bartlein R, Kouyate S, et al.
PMTCT cascade analysis in Cote d’Ivoire: results from a national representative
sample. HIVCore Final Report. Washington, DC: USAID j Project Search:
HIVCore; 2014.
15. Granato SA. Quality of health facility data in the PMTCT cascade in Cote
d’Ivoire. Paper presented at: World Congress for Public Health; 2015 February
14, Kolkata [Internet]. PowerPoint presentation. [cited 2016 Mar 20]. Available
from: http://www.hivcore.org/Presentations/Granato_WCPH2015_CIPhaseI_
DataQuality.pdf
16. Wagenaar BH, Sherr K, Fernandes Q, Wagenaar AC. Using routine health
information systems for well-designed health evaluations in low- and middle-
income countries. Health Policy Plann. 2016;31(1):129�35.17. Wettstein C, Mugglin C, Egger M, Blaser N, Salazar L, Bender N, et al.
Missed opportunities to prevent mother-to-child-transmission in sub-Saharan
Africa: systematic review and meta-analysis. AIDS. 2012;26(18):2361�73.18. Berheto TM, Haile DB, Mohammed S. Predictors of loss to follow-up in
patients living with HIV/AIDS after initiation of antiretroviral therapy. N Am J
Med Sci. 2014;6(9):453�9.19. Gourlay A, Birdthistle I, Mburu G, Iorpenda K, Wringe A. Barriers and
facilitating factors to the uptake of antiretroviral drugs for prevention of
mother-to-child transmission of HIV in sub-Saharan Africa: a systematic review.
J Int AIDS Soc. 2013;16(1):18588, doi: http://dx.doi.org/10.7448/IAS.16.1.18588
20. Sprague C, Chersich M, Black V. Health system weaknesses constrain
access to PMTCT and maternal HIV services in South Africa: a qualitative
enquiry. AIDS Res Ther. 2011;8:10.
Granato SA et al. Journal of the International AIDS Society 2016, 19(Suppl 4):20838
http://www.jiasociety.org/index.php/jias/article/view/20838 | http://dx.doi.org/10.7448/IAS.19.5.20838
44
Research article
Assessment of linkages from HIV testing to enrolment and
retention in HIV care in Central Mozambique
Celso Azarias Inguane§,*,1,2, Stephen Gloyd*,2,3, Joao Luis Manuel4, Charlene Brown5, Vincent Wong5,
Orvalho Augusto2,3,6,7, Wisal Mustafa Hassan2,3, Lucia Vieira4, Pires Afonso2, Mehol Jamnadas4, Jama Joy Bernard2,
James Cowan2, Samuel Kalibala8 and James Pfeiffer2,3
§Corresponding author: Celso Azarias Inguane, University of Washington, Box 353100, Seattle, WA 98195, USA. Tel: �001 206 596 1634. ([email protected])
*These authors have contributed equally to the work.
Abstract
Introduction: Effectiveness of the rapid expansion of antiretroviral therapy (ART) throughout sub-Saharan Africa is highly
dependent on adequate enrolment and retention in HIV care. However, the measurement of both has been challenging in these
settings. This study aimed to assess enrolment and retention in HIV care (pre-ART and ART) among HIV-positive adults in Central
Mozambique, including identification of barriers and facilitators.
Methods: We assessed linkages to and retention in HIV care using a mixed quantitative and qualitative approach in six districts
of Manica and Sofala provinces. We analyzed routine district and health facility monthly reports and HIV care registries from
April 2012 to March 2013 and used single imputation and trimmed means to adjust for missing values. In eight health facilities in
the same districts and period, we assessed retention in HIV care among 795 randomly selected adult patient charts (15 years and
older). We also conducted 25 focus group discussions and 53 in-depth interviews with HIV-positive adults, healthcare providers
and community members to identify facilitators and barriers to enrolment and retention in HIV care.
Results: Overall, 46% of the monthly HIV testing reports expected at the district level were missing, compared to 6.4% of the
pre-ART registry reports. After adjustment for missing values, we estimated that the aggregate numbers of adults registered in
pre-ART was 75% of the number of persons tested HIV-positive in the six districts. In the eight health facilities, 40% of the patient
charts for adults enrolled in pre-ART and 44% in ART were missing. Of those on ART for whom charts were found, retention in
treatment within 90 and 60 days prior to the study team visit was 34 and 25%, respectively. Combining these multiple data
sources, the overall estimated retention was 18% in our sample. Individual-level factors were perceived to be key influences to
enrolment in HIV care, while health facility and structural-level factors were perceived to be key influences of retention.
Conclusions: Efforts to increase linkages to and retention in HIV care should address individual, health facility, and structural-
level factors in Central Mozambique. However, their outcomes cannot be reliably assessed without improving the quality of
routine health information systems.
Keywords: linkages; retention; HIV care; treatment; Mozambique.
To access the supplementary material to this article please see Supplementary Files under Article Tools online.
Received 27 November 2015; Revised 22 April 2016; Accepted 2 May 2016; Published 20 July 2016
Copyright: – 2016 Inguane CA et al; licensee International AIDS Society. This is an Open Access article distributed under the terms of the Creative Commons
Attribution 3.0 Unported (CC BY 3.0) License (http://creativecommons.org/licenses/by/3.0/), which permits unrestricted use, distribution, and reproduction in any
medium, provided the original work is properly cited.
IntroductionIn the past decade, Mozambique has expanded access to
HIV testing services and antiretroviral therapy (ART) and has
integrated them into the primary healthcare system [1�4].Still, the proportion of people with an HIV-positive diagnosis
who have been linked to and retained in HIV care has been
reported to be low [5,6], similar to much of sub-Saharan
Africa [7,8]. The Mozambique Ministry of Health reported
in 2015 that ART coverage was only 59% of the estimated
treatment needs [9], and, as in other countries in the region,
the proportion of those retained in pre-ART care and ART in
Mozambique tends to decrease over time [8�10]. This poseschallenges to reaching the ambitious 90-90-90 goals of the
Joint United Nations Programme on HIV/AIDS’ (UNAIDS)
[11,12]. The new WHO guidelines on early initiation of ART
[13] may contribute to achieving those goals, but only if
people who are diagnosed HIV-positive are enrolled and
retained in care. Moreover, accurate monitoring of enrol-
ment and retention with reliable information about the
HIV cascade [14] is critical for making progress in HIV care.
Nevertheless, poor HIV data quality from both routine sources
and international implementing partners [9,15] remains a
challenge to understanding the cascade.
A study aimed to identify and measure loss to follow-up in
the HIV care cascade in Manica and Sofala provinces, Central
Mozambique, using adjusted routine health systems data and
Inguane CA et al. Journal of the International AIDS Society 2016, 19(Suppl 4):20846
http://www.jiasociety.org/index.php/jias/article/view/20846 | http://dx.doi.org/10.7448/IAS.19.5.20846
45
patient charts to estimate the proportion of people with an
HIV-positive diagnosis who were linked to and retained in
pre-ART care and ART. The study also aimed to identify
perceived barriers and facilitators of enrolment and retention
in pre-ART care and ART.
MethodsStudy setting and design
We conducted this mixed methods study in six districts: Beira,
Buzi and Dondo in Sofala Province; and Barue, Chimoio and
Manica in Manica Province. Beira and Chimoio are the capital
cities of Sofala and Manica provinces, respectively. The other
four districts are rural. We selected these six districts because
of their rural-urban mix, their mix of different levels of health
services, and their security. These districts are mostly con-
tiguous and cover most of the major health facilities in Central
Mozambique. Self-referral to health facilities inside or outside
this six-district regionwould likely have been infrequent. At the
time of the study, HIV testing, pre-ARTcare and ART were free
and widely available throughout the country.
To obtain an overview of HIV testing and HIV care
enrolment at the district level, we examined routine monthly
reports from all (87) health facilities that provided HIV testing
or treatment in those districts. To obtain an in-depth assess-
ment of enrolment, patient flow and retention in pre-ART
care and ART at the health facility level, we selected eight of
the 87 facilities for further study. The eight facilities were
among the 34 facilities that provided ART during the study
period; four were the main referral health facilities in rural
districts and four were moderate to large patient volume
facilities in urban areas.
District overview assessment
We collected and analyzed routine district and health facility
monthly reports of HIV testing and HIV testing registries (pre-
ART, ART) in each of the six districts from April 2012 to March
2013 (the study period). The study start date corresponds
with a major revision of HIV data collection and monitoring
registries, including new patient forms, registry books and
reporting templates, that had been introduced in Mozambi-
que in early 2012. We also collected data directly from HIV
registries at district-level health offices, from pharmacy
records of tests distributed and reported positive and from
the national electronic health information system, locally
known as the Modulo Basico.
We conducted descriptive analyses such as frequency for
HIV tests, pre-ART and ART registrants, and for missing values
in the routine data set. We examined missing value patterns
over time and by health facility, and tested several imputation
methods to substitute missing values: (1) single imputation
using mean, trimmed means (replacing values above 50% of
the mean for facilities that had less than five months data) and
median, (2) Poisson generalized linear modelling and (3)
iterative singular value decomposition (SVD) method (speci-
fically rank-1 SVD approximation). None of these methods
yielded consistently higher or lower imputed values than the
other methods.We finally used the single imputation method
because it gave the most conservative values. We performed
the imputations in R (version 3.2) and analysis in Stata 13.1.
Health facility quantitative assessment
At each of the eight health facilities, we abstracted enrol-
ment data from the pre-ART and ART registry books and
retention data from patient charts and pharmacy records.
Mozambique Ministry of Health policy stipulates that (1) all
newly diagnosed HIV-positive patients be first registered in
pre-ART registry books (even those who are eligible for ART)
and (2) patient charts be created for all pre-ART and ART
patients. The pre-ART and ART registry books included dates
of HIV-positive and CD4 tests and the dates of ART initiation.
We conducted a stratified random sample of registrants from
the pre-ART and ART registries separately (using random.org)
to obtain 100 charts of patients older than 15 years from
each facility, excluding women in prevention of mother-
to-child transmission of HIV (PMTCT) programmes. We
searched for the selected patient charts in archives, con-
sultation rooms and other parts of the health facilities. Data
abstracted from patient charts included demographic
characteristics, site of testing, and dates for ordering CD4
tests, receipt of CD4 results, enrolment into care, ART
initiation, consultations, ART pickups, and the date of the
study team visit. Data were entered into study computers
using EPIDATA 3.2 and exported for cleaning and analysis in
Stata 13.1.
To construct the overall HIV cascade, we used different
data sources for enrolment and retention. Enrolment propor-
tions were measured in two steps: first, by the number of
people, district-wide, registered in pre-ART divided by the
estimated (adjusted) number of newly diagnosed HIV positive
in each district during the study period; and second, by the
proportion of charts found among the selected people
registered on pre-ART and ART at each of the eight health
facilities. Retention rates were measured by the proportion
of patient charts with evidence of an ART clinic visit or
antiretroviral (ARV) pickup by patient charts or individual
pharmacy records within 30, 60 or 90 days prior to the study
team visit to the facility. Retention was examined separately
for pre-ART and ART patients.
Health facility qualitative assessment
At each of the eight facilities and their surrounding areas,
we conducted in-depth interviews (IDIs) with health facility
directors and with people living with HIV who (1) enrolled in
pre-ART care within 30 days of their HIV-positive test result,
(2) enrolled after 30 days from their HIV-positive test result,
(3) enrolled but eventually dropped out of pre-ART care and
(4) never enrolled in HIV care. In each facility, we had aimed
to include at least one person living with HIV from each of
the four categories, and adolescents (18�19 years old).
Participants were at least 18 years old. Study interviewers
contacted and obtained informed consent directly from
facility directors before conducting an IDI. During health
facility visits, healthcare providers informed people living
with HIV eligible for study participation about the study and
gave them the option of contacting study interviewers for
informed consent if they were interested in participating in
the study. In health facility surrounding areas, facility-based
outreach workers provided information about the study to
people who had dropped out of care or who had never
Inguane CA et al. Journal of the International AIDS Society 2016, 19(Suppl 4):20846
http://www.jiasociety.org/index.php/jias/article/view/20846 | http://dx.doi.org/10.7448/IAS.19.5.20846
46
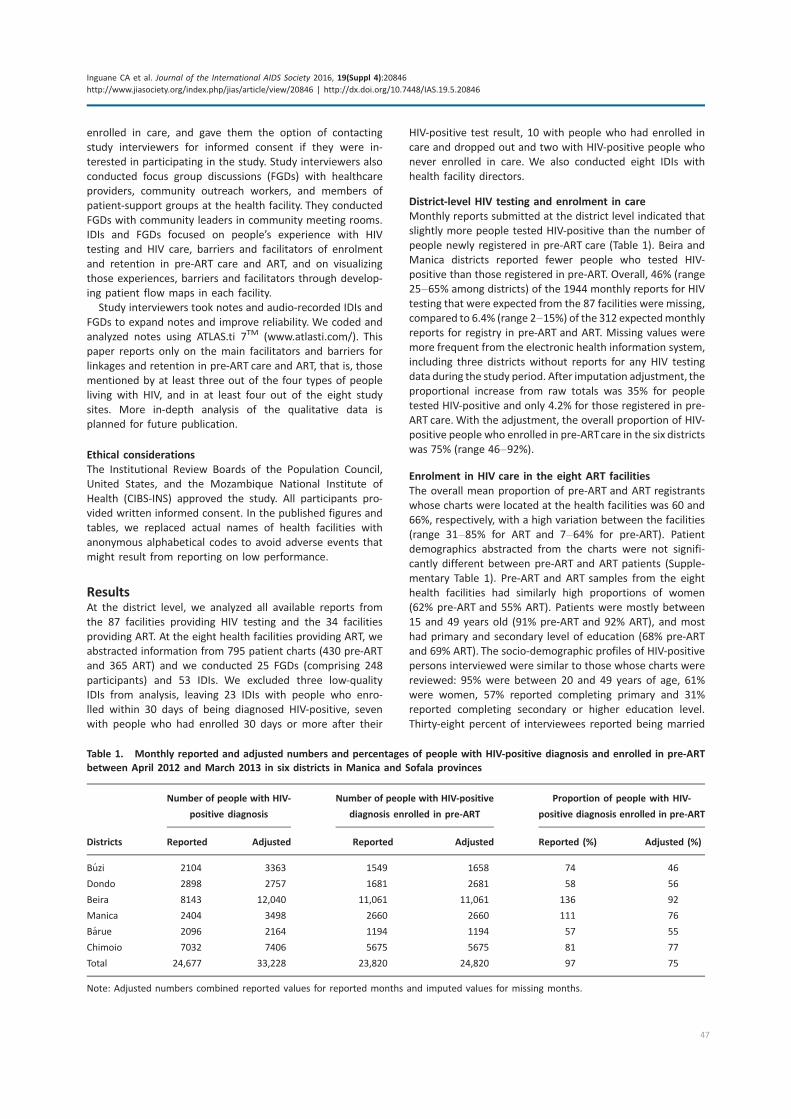
enrolled in care, and gave them the option of contacting
study interviewers for informed consent if they were in-
terested in participating in the study. Study interviewers also
conducted focus group discussions (FGDs) with healthcare
providers, community outreach workers, and members of
patient-support groups at the health facility. They conducted
FGDs with community leaders in community meeting rooms.
IDIs and FGDs focused on people’s experience with HIV
testing and HIV care, barriers and facilitators of enrolment
and retention in pre-ART care and ART, and on visualizing
those experiences, barriers and facilitators through develop-
ing patient flow maps in each facility.
Study interviewers took notes and audio-recorded IDIs and
FGDs to expand notes and improve reliability. We coded and
analyzed notes using ATLAS.ti 7TM (www.atlasti.com/). This
paper reports only on the main facilitators and barriers for
linkages and retention in pre-ART care and ART, that is, those
mentioned by at least three out of the four types of people
living with HIV, and in at least four out of the eight study
sites. More in-depth analysis of the qualitative data is
planned for future publication.
Ethical considerations
The Institutional Review Boards of the Population Council,
United States, and the Mozambique National Institute of
Health (CIBS-INS) approved the study. All participants pro-
vided written informed consent. In the published figures and
tables, we replaced actual names of health facilities with
anonymous alphabetical codes to avoid adverse events that
might result from reporting on low performance.
ResultsAt the district level, we analyzed all available reports from
the 87 facilities providing HIV testing and the 34 facilities
providing ART. At the eight health facilities providing ART, we
abstracted information from 795 patient charts (430 pre-ART
and 365 ART) and we conducted 25 FGDs (comprising 248
participants) and 53 IDIs. We excluded three low-quality
IDIs from analysis, leaving 23 IDIs with people who enro-
lled within 30 days of being diagnosed HIV-positive, seven
with people who had enrolled 30 days or more after their
HIV-positive test result, 10 with people who had enrolled in
care and dropped out and two with HIV-positive people who
never enrolled in care. We also conducted eight IDIs with
health facility directors.
District-level HIV testing and enrolment in care
Monthly reports submitted at the district level indicated that
slightly more people tested HIV-positive than the number of
people newly registered in pre-ART care (Table 1). Beira and
Manica districts reported fewer people who tested HIV-
positive than those registered in pre-ART. Overall, 46% (range
25�65% among districts) of the 1944 monthly reports for HIV
testing that were expected from the 87 facilities were missing,
compared to 6.4% (range 2�15%) of the 312 expectedmonthly
reports for registry in pre-ART and ART. Missing values were
more frequent from the electronic health information system,
including three districts without reports for any HIV testing
data during the study period. After imputation adjustment, the
proportional increase from raw totals was 35% for people
tested HIV-positive and only 4.2% for those registered in pre-
ART care. With the adjustment, the overall proportion of HIV-
positive people who enrolled in pre-ARTcare in the six districts
was 75% (range 46�92%).
Enrolment in HIV care in the eight ART facilities
The overall mean proportion of pre-ART and ART registrants
whose charts were located at the health facilities was 60 and
66%, respectively, with a high variation between the facilities
(range 31�85% for ART and 7�64% for pre-ART). Patient
demographics abstracted from the charts were not signifi-
cantly different between pre-ART and ART patients (Supple-
mentary Table 1). Pre-ART and ART samples from the eight
health facilities had similarly high proportions of women
(62% pre-ART and 55% ART). Patients were mostly between
15 and 49 years old (91% pre-ART and 92% ART), and most
had primary and secondary level of education (68% pre-ART
and 69% ART). The socio-demographic profiles of HIV-positive
persons interviewed were similar to those whose charts were
reviewed: 95% were between 20 and 49 years of age, 61%
were women, 57% reported completing primary and 31%
reported completing secondary or higher education level.
Thirty-eight percent of interviewees reported being married
Table 1. Monthly reported and adjusted numbers and percentages of people with HIV-positive diagnosis and enrolled in pre-ART
between April 2012 and March 2013 in six districts in Manica and Sofala provinces
Number of people with HIV-
positive diagnosis
Number of people with HIV-positive
diagnosis enrolled in pre-ART
Proportion of people with HIV-
positive diagnosis enrolled in pre-ART
Districts Reported Adjusted Reported Adjusted Reported (%) Adjusted (%)
Buzi 2104 3363 1549 1658 74 46
Dondo 2898 2757 1681 2681 58 56
Beira 8143 12,040 11,061 11,061 136 92
Manica 2404 3498 2660 2660 111 76
Barue 2096 2164 1194 1194 57 55
Chimoio 7032 7406 5675 5675 81 77
Total 24,677 33,228 23,820 24,820 97 75
Note: Adjusted numbers combined reported values for reported months and imputed values for missing months.
Inguane CA et al. Journal of the International AIDS Society 2016, 19(Suppl 4):20846
http://www.jiasociety.org/index.php/jias/article/view/20846 | http://dx.doi.org/10.7448/IAS.19.5.20846
47
or in marital union, 21% widowed and 77% reported having
children. Regarding occupations, 33% reported being domes-
tic workers, 24% small business owners and 15% workers in
agriculture/fishing.
Patient chart data demonstrated a large variation between
the health facilities in time from HIV-positive test to first
clinical consultation (overall mean 13.3 days; IQR 0.0�12.0days; range 0.0�13.3 months) and in time from HIV diagnosis
to ART initiation (overall mean 1.8 months; IQR 0.7�2.1months; range 0.1�12.2 months) (Figure 1).
Retention in ART in the eight ART facilities
Among the 346 ART charts found, the median time from the
initiation of treatment until study team visit was 18.6
months. Overall, 34, 27 and 8% of these ART charts had
evidence of a clinic visit or ARV pickup within 90, 60 or 30
days of the study team visit, with a wide variation among the
eight health facilities (Figure 2). We found that the number of
days for which ARVs were dispensed was frequently missing.
However, during IDIs and FGDs, health providers consistently
reported that ARVs were usually dispensed for 60 days or
occasionally for 90 days when patients were clinically stable.
Crude and adjusted logistic regression did not show
differences in retention rates between males and females.
However, retention (evidence of ARV pickup within 90 days
of study visit) in Manica Province was significantly greater
than in Sofala Province (Supplementary Table 2).
Overall HIV care cascade
We constructed an overall HIV care cascade (Figure 3) using
the following sources of data: (1) district-level proportions of
estimated HIV-positive people who were registered in pre-
ART, (2) proportions of patients registered in ART in the eight
health facilities whose charts were found and (3) proportions
of those patient charts with any evidence of clinic visit or ARV
pick up within 90 days of our study team review visit. The
calculations suggest that, in aggregate, 18% of the HIV-positive
patients diagnosed in health facilities during the study period
were retained in treatment one to two years later.
Figure 1. Months from HIV-positive diagnosis to first consultation
among pre-ART patients (a), and time from HIV-positive diagnosis
to ART initiation among ART patients (b), in eight health facilities in
Manica and Sofala provinces.
Figure 2. Proportion of ART patient charts with evidence of
clinical visit or ARV pickup, 30, 60 and 90 days before study visit in
eight health facilities of Manica and Sofala provinces.
Figure 3. Overall HIV cascade � from HIV testing to enrolment to
charts located to retention � aggregate data from eight health
facilities in Manica and Sofala provinces. Note: Each bar represents
the proportion of the original total of people tested HIV-positive,
for example, 50% of HIV-positive charts found �66% charts found
times 75% registered. Adjusted numbers combined reported values
with imputed values for missing months.
Inguane CA et al. Journal of the International AIDS Society 2016, 19(Suppl 4):20846
http://www.jiasociety.org/index.php/jias/article/view/20846 | http://dx.doi.org/10.7448/IAS.19.5.20846
48
Perceived facilitators and barriers to HIV testing, enrolment
and retention
Most respondents from both the IDIs and FGDs said that
they preferred to be tested at sites that provided ART and
near their places of residence. Both men and women who
enrolled early in HIV care said that the main reason for
obtaining an HIV test � and for enrolling in HIV care � was
the presence of symptoms of sickness. Conversely, the main
perceived barrier for enrolment was lack of symptoms of
sickness. Some women who enrolled early mentioned their
desire to protect their children from vertical transmission and
wishing to live longer to raise their children.
Only early enrollers in HIV care mentioned a facilitator of
retention, living near the health facility where one receives
HIV care. Perceived barriers for retention included: (1) the
perception of poor and disrespectful service at the health
facility, especially for people on ART who were late to their
ARV pickup appointments and (2) lack of money for food and
for transportation.
Table 2 summarizes facilitators and barriers to enrolment
and retention in HIV care that were mentioned during IDIs and
FGDs.
Healthcare providers described how HIV-positive patients
could be lost at different steps along the HIV continuum of care
through a variety of delays and loss to follow-up in patient flow
that varied by site. For example, losses were especially common
in the intervals between patients receiving their HIV-positive
result and creating the chart, or between having their blood
drawn for laboratory tests and receiving those results. Inter-
viewees also mentioned that, at all eight health facilities, charts
were not created in the same room where HIV tests were done
and results disclosed. In some health facilities, patients were
sent to queue at the health facility reception to have their charts
created when frequently charts were not created at all. At other
facilities, providers said they took the patient’s test results and
went to create the chart themselves at the reception. When
blood samples were sent to other health facilities to obtain CD4
counts, the results often took several weeks to be returned to
patients.
We constructed Figure 4 that shows an idealized flow map
for HIV-positive patients in ART, based on the Mozambique
2014 national ART guidelines. The information gathered from
our eight FGDs with 74 healthcare providers at the eight
study health facilities suggested specific points in the flowmap
where patients were typically lost to follow-up (LTFU), noted
with black downward-pointing arrows with an LTFU label.
DiscussionThis study demonstrated substantial losses to follow-up of
HIV-positive persons at all points along the HIV care
and treatment cascade in Central Mozambique. Moreover,
our findings suggest that the routine HIV information, as
reported, grossly overestimates both the true enrolment and
retention in HIV care. Our findings also suggest that HIV-positive
patients experienced major facilitators and barriers for
enrolment and retention in HIV care, including individual,
health system and structural factors.
Our estimate of the proportion of people diagnosed with
HIV who are registered in pre-ART care was slightly
higher than other estimates in sub-Saharan Africa [8]. Our
overall retention estimates are much lower than nationally
reported retention estimates in Mozambique for 2014
(67% at 12 months after ART initiation, and 56% at 24 months)
[9,12]. Our low retention estimates are, however, not sub-
stantially different than other carefully conducted studies in
sub-Saharan Africa [7,11,12]. Our facilitators for enrolment in
pre-ART and ART care (e.g. proximity to ART services and
severity of illness) were similar to studies elsewhere [16,17].
Yet, in contrast to those studies, facilitators for enrolment and
retention in our study seemed to only help those who enrolled
early in care (within 30 days of their HIV diagnosis). Our
barriers for retention (e.g., lack of symptoms, perceived poor
quality of healthcare) were consistent with other studies in
sub-Saharan Africa [16�18].The large variations in patient flow patterns, in observance
of national norms, and LTFU found among the eight ART faci-
lities suggest that targeted health systems change, including
simplification of patient flow, improved patient information
and improving health worker behaviour, might substantially
improve performance. The data also suggest that there is an
urgent need for strategies to re-link patients into HIV care in
Mozambique, using lessons learned from the country and
other low-resource settings [19]. Strategies might include
having healthcare workers, with whom many patients have
developed close relationships, contact patients who have
dropped out and understand reasons why they dropped out
[19]. Judgemental attitudes or threatening patients is not
helpful, as has been reported in other sub-Saharan African
Table 2. Perceived facilitators and barriers to enrolment and retention in HIV care in eight health facilities in Manic and Sofala
provinces
Facilitators Mentioned by Barriers Mentioned by
Enrolment in
HIV care
Presence of
symptoms
Early enrollers
Community leaders
Lack of symptoms Late enrolment, never enrolled, dropouts, patient-
support group and healthcare providers
Retention in
HIV care
Proximity to
health facility
Early enrollers Disrespect by health workers,
poor quality of healthcare
Lack of money for food and
transport
Early enrolment, late enrolment, dropouts, patient-
support group, healthcare providers and outreach
workers
Early enrolment, late enrolment and dropouts
Inguane CA et al. Journal of the International AIDS Society 2016, 19(Suppl 4):20846
http://www.jiasociety.org/index.php/jias/article/view/20846 | http://dx.doi.org/10.7448/IAS.19.5.20846
49
contexts [20]. However, in Mozambique, many of these health-
care workers battle with work overload [21,22] or lack of
motivation because they feel ‘‘exploited and ultimately
abandoned’’ by the nature of global HIV interventions [23].
Working conditions need to be addressed to complement
training. Improving workforce morale, understanding indivi-
dual patient circumstances (including reasons beyond their
control) and bearing in mind that missing visits are inevitable
over the lifelong course of HIV care can help in the process of
re-linking patients into care [20]. Another strategy, based on
our results, would be to simplify algorithms of patient care
and confusing patient flow patterns, and to address chal-
lenges with patient chart management.
Our finding that a large proportion of those who register in
pre-ART (who are thus considered ‘‘linked’’ to HIV care) have
no evidence of subsequent encounters with the health
system is disturbing. The finding raises serious concerns
about using registration at ART facilities as an indicator for
effective enrolment. Measuring retention is also a challenge.
If retention is measured only among those with patient
charts or pharmacy records, the results will overestimate the
true retention of the people originally tested HIV-positive in
the health system. On the other hand, incomplete recording
of visits or ARV pickup in patient charts may underestimate
true retention of those in care with charts. Follow-up of
pharmacy records can complement data on patient retention
if the pharmacy records are adequately filled out. All
enrolment and retention estimates, however, will be mean-
ingful only when they are based on an accurate denominator
of the total numbers of people tested HIV-positive in the
health system.
TheMozambiqueMinistry of Health has acknowledged poor
HIV data quality nationally [9,15] and data concerns have been
well documented through ethnographic research in Mozam-
bique [21]. Authors concerned about data quality in other
countries have called for the use of multiple measures of
linkages to HIV care and retention in HIV care and treatment
[24�26]. Other lower resolution proxy measures (e.g. viral
load) may provide broader generalizability for the measure-
ment of trends in linkage to care over time [27].We hope that
our research will contribute to a deeper understanding of how
to use proxy measures of linkage to HIV care and treatment to
match the desired programmatic or clinical outcomes.
LimitationsThe poor quality of reported data was both a principal find-
ing of the study and a limitation. Although our imputation
methods were designed to supplement routine data to
obtain more accurate estimates, we cannot be certain that
the adjusted estimates reflect the true picture of registry and
enrolment in care. Patients may have received effective ART
without adequate evidence of their treatment in patient
charts. We noted earlier that the data systems in Mozambi-
que did not allow for analysis of individual linkages of people
tested HIV-positive to HIV care, since no codes were used
Counseling roomVCT/PICT
Results disclosure
Create patient chartPsychosocial assessment
HIV+
HIV-
Clinical consult. 1Staging, lab, CTZ
Psychosocial assessment
ART eligible
Clinical consult.2ARV prescription
Counseling
Assessment:Prepared to start ART ?
No
ARV pickupAdherence counseling
Clinical consult. 3ARV pickup
Adhere. counseling
Yes
Non-ART eligible
PRE-ART
Clinical consult.4
ARV pickup ARV pickup
Clinical consult.6
ARV pickup
ARV pickup
Clinical consult.7
ARV pickup
Clinical consult.8Clinical consult.9
Every 6 months thereafter
ARV pickup
AZT+3TC+NVP
30thday60thday
3rd month
6th month9th month12th month
15th day after
starting ART
Adhere. counselling
ARV pickupEvery 3 months thereafter
Adhere. counselling Adhere. counselling Adhere. counselling
Thereafter -whenever needed
ARV pickup
5th month
4th month
Referral to support groups
LTF
U
LTF
U
LTF
U
LTF
U
LTF
U
Figure 4. Patient flow map showing loss to follow up along the HIV continuum of care in eight health facilities of Manica and Sofala
provinces. ART: antiretroviral therapy; AZT�3TC�NVP: zidovudine� stavudine�niverapine; CTZ: cotrimoxazole; HIV+: HIV-positive; PICT:
provider initiated counselling and testing; LTFU: lost to follow-up; VCT: voluntary counselling and testing.
Inguane CA et al. Journal of the International AIDS Society 2016, 19(Suppl 4):20846
http://www.jiasociety.org/index.php/jias/article/view/20846 | http://dx.doi.org/10.7448/IAS.19.5.20846
50
for testing, and as a result testing could not be linked to
registries in the ART sites. Thus, it was not possible to
ascertain the extent to which people tested HIV-positive
might be obtaining care from elsewhere, including outside
the study districts. Since transfers of patients were rarely
registered, our estimates of retention likely underestimated
the true retention of our sample HIV-positive registrants.
The qualitative assessment was limited by the small
numbers of HIV-positive people who enrolled late, dropped
out or never enrolled in care that we were able to interview.
Moreover, the findings related to health systems barriers can
only represent the practices at these eight facilities. Other
facilities might have presented substantially different quali-
tative (and quantitative) findings. Nevertheless, our diverse
sample that included perspectives of people living with
HIV, health providers, and community outreach workers and
members provided wide-ranging perceptions.
ConclusionsOur findings suggest that these districts in Central Mozambique
face serious challenges to effectively enrol and retain people
who are tested HIV-positive in the health system. The poor
quality of routine reported data, especially regarding HIV
testing, is a major barrier to identifying these bottlenecks.
More attention needs to be focused on improving the
quality and analysis of routine data regarding all steps of
the HIV cascade at each health facility. We think that our
careful utilization of routine health system information, which
included data quality assessment, triangulation of data from
other sources, adjustment by imputation for missing data, and
patient chart review, provided a reasonably high-resolution
measure of linkage to care. The HIV care cascade model that
we constructed provided health facility-specific detail on
critical bottlenecks from which tailored interventions can be
developed. Our study results also suggest that health system,
individual and structural factors were important perceived
barriers to enrolment and retention in care. Modifying these
factors and assessing their impact with reliable data should
substantially improve linkages to enrolment and retention in
HIV care and enhance global efforts to address HIV.
Authors’ affiliations1Department of Anthropology, University of Washington, Seattle, WA,
USA; 2Health Alliance International, Seattle, WA, USA; 3Department of Global
Health, University of Washington, Seattle, WA, USA; 4Centro de Investigacao
Operacional de Beira (CIOB), Ministry of Health, Beira, Mozambique; 5Office
of HIV/AIDS, USA, Agency for International Development, Washington,
DC, USA; 6Faculdade de Medicina, Universidade Eduardo Mondlane, Maputo,
Mozambique; 7Manhica Research Center (CISM), Manhica, Mozambique;8HIVCore/Population Council, Washington, DC, USA
Competing interests
None.
Authors’ contributions
CI, SG, JM, CB, JB, SC and JP conceived the study and contributed to the study
design. CI, SG, OA, LV and WM analysed the data. CI and SG drafted the
manuscript. JM, CB, VW, OA, LV, PA, MJ, WM, JB, JC, SC and JP revised the
manuscript. All authors read and approved the final draft.
Acknowledgements and funding
This study was made possible through support provided by the President’s
Emergency Plan for AIDS Relief and theU.S. Agency for International Development
(USAID) via HIVCore, a Task Order funded by USAID under the Project SEARCH
indefinite quantity contract (Contract No. AID-OAA-TO-11-00060). The Task Order
is led by the Population Council in partnership with the Elizabeth Glaser Pediatric
AIDS Foundation, Palladium and the University of Washington. The research was
also supported by NIAID, NCI, NIMH, NIDA, NICHD, NHLBI, NIA, NIGMS and NIDDK
of the National Institutes of Health under award number AI027757.
Disclaimer
The authors’ views expressed in this manuscript do not necessarily reflect the
views of USAID, NIH or the US government.
References
1. Pfeiffer J, Montoya P, Baptista AJ, Karagianis M, de Morais Pugas M, Micek
M, et al. Integration of HIV/AIDS services into African primary health care:
lessons learned for health system strengthening in Mozambique � A case
study. J Int AIDS Soc. 2010;13(1):3.
2. Lambdin BH, Micek M, Sherr K, Gimbel S, Karagianis M, Lara J, et al.
Integration of HIV care and treatment in primary health care centers and
patient retention in central Mozambique: a retrospective cohort study. J Acquir
Immune Defic Syndr. 2013;62(5):e146�52.3. MISAU, DNAM. Directriz Nacional para Implementacao do Aconselhamento
e Testagem em Saude. Maputo City, Mozambique: MISAU; 2015.
4. MISAU, DNAM. Guia de Tratamento Antiretroviral e Infeccoes Oportunistas
no Adulto, Crianca, Adolescente e Gravida, 2013. Maputo City, Mozambique:
MISAU; 2014.
5. Micek MA, Gimbel-Sherr K, Baptista AJ, Matediana E, Montoya P, Pfeiffer J,
et al. Loss to follow-up of adults in public HIV care systems in Mozambique:
identifying obstacles to treatment. J Acquir Immune Defic Syndr. 2009;52(3):
397�405.6. Pearson CR, Micek MA, Pfeiffer J, Montoya P, Matediane E, Jonasse T, et al.
One year after ART initiation: psychosocial factors associated with stigma
among HIV-positive Mozambicans. AIDS Behav. 2009;13(6):1189�96.7. Brennan A, Browne JP, Horgan M. A systematic review of health service
interventions to improve linkage with or retention in HIV care. AIDS Care.
2014;26(7):804�12.8. Rosen S, Fox MP. Retention in HIV care between testing and treatment in
sub-Saharan Africa: a systematic review. PLoS Med. 2011;8(7):e1001056.
9. MISAU. Relatorio Anual. Relatorio anual das actividades referentes ao HIV/
SIDA. Maputo, Mozambique: MISAU; 2015.
10. Auld AF, Mbofana F, Shiraishi RW, Sanchez M, Alfredo C, Nelson LJ, et al.
Four-year treatment outcomes of adult patients enrolled in Mozambique’s
rapidly expanding antiretroviral therapy program. PLoS One. 2011;6(4):e18453.
11. UNAIDS. Ambitious treatment targets: writing the final chapter of the AIDS
epidemic [Internet]. Geneva, Switzerland: UNAIDS; 2014. [cited 2015 Nov 1].
Available from: http://www.unaids.org/en/resources/documents/2014/90-90-90
12. US Department of State office of the US Global AIDS Coordinator.
PEPFAR 3.0: controlling the epidemic: delivering on the promise of an AIDS-
free generation. [Internet]. 2014 [cited 2015 Nov 1]. Available from: http://
www.pepfar.gov/documents/organization/234744.pdf
13. World Health Organization, Department of HIV/AIDS. Guideline on when to
start antiretroviral therapy and on pre-exposure prophylaxis for HIV. [Internet].
2015. [cited 2015 Nov 6]. Available from: http://apps.who.int/iris/bitstream/
10665/186275/1/9789241509565_eng.pdf
14. World Health Organization, Department of HIV/AIDS. Consolidated strate-
gic information guidelines for HIV in the health sector: HIV strategic informa-
tion for impact. [Internet]. 2015 [cited 2015 Nov 6]. Available from: http://
www.ncbi.nlm.nih.gov/books/NBK299486/
15. MISAU. Relatorio AQD-HIV 2014 Relatorio da Ronda Piloto Nacional da
Avaliacao da Qualidade de Dados. Cidade de Maputo: MISAU; 2015. p. 53.
16. Govindasamy D, Ford N, Kranzer K. Risk factors, barriers and facilitators for
linkage to antiretroviral therapy care: a systematic review. AIDS. 2012;26(16):
2059�67.17. Tomori C, Kennedy CE, Brahmbhatt H, Wagman JA, Mbwambo JK,
Likindikoki S, et al. Barriers and facilitators of retention in HIV care and
treatment services in Iringa, Tanzania: the importance of socioeconomic and
sociocultural factors. AIDS Care. 2014;26(7):907�13.18. Roura M, Busza J, Wringe A, Mbata D, Urassa M, Zaba B. Barriers to
sustaining antiretroviral treatment in Kisesa, Tanzania: a follow-up study to
understand attrition from the antiretroviral program. AIDS Patient Care STDS.
2009;23(3):203�10.19. Raper JL. Going the extra mile for retention and re-engagement in care:
nurses make a difference. J Assoc Nurses AIDS Care. 2014;25(2):108�11.
Inguane CA et al. Journal of the International AIDS Society 2016, 19(Suppl 4):20846
http://www.jiasociety.org/index.php/jias/article/view/20846 | http://dx.doi.org/10.7448/IAS.19.5.20846
51

20. Ware NC, Wyatt MA, Geng EH, Kaaya SF, Agbaji OO, Muyindike WR, et al.
Toward an understanding of disengagement from HIV treatment and care in
sub-Saharan Africa: a qualitative study. PLoS Med. 2013;10(1):e1001369.
21. McKay R. Documentary disorders: managing medical multiplicity in
Maputo, Mozambique. Am Ethnol. 2012;39(3):545�61.22. Pfeiffer J, Chapman R. An anthropology of aid in Africa. Lancet. 2015;
385(9983):2144�5.23. Kalofonos I. ‘‘All they do is pray’’: community labour and the narrowing of
‘‘care’’ during Mozambique’s HIV scale-up. Glob Public Health. 2014;9(1�2):7�24.24. Firth CL, Schafer SD, Greene K. Monitoring retention in care: using multiple
laboratory tests as an indicator for HIV medical care. AIDS Care. 2014;26(12):
1546�9.
25. Kelly JD, Hartman C, Graham J, Kallen MA, Giordano TP. Social support
as a predictor of early diagnosis, linkage, retention, and adherence to HIV
care: results from the steps study. J Assoc Nurses AIDS Care. 2014;25(5):
405�13.26. Mugavero MJ, Westfall AO, Zinski A, Davila J, Drainoni M-L, Gardner L,
et al. Measuring retention in HIV care: the elusive gold standard. J Acquir
Immune Defic Syndr. 2012;61(5):574�80.27. Das M, Christopoulos KA, Geckeler D, Huriaux E, Cohen SE, Philip S, et al.
Linkage to HIV care in San Francisco: implications of measure selection.
J Acquir Immune Defic Syndr. 2013;64(1):S27.
Inguane CA et al. Journal of the International AIDS Society 2016, 19(Suppl 4):20846
http://www.jiasociety.org/index.php/jias/article/view/20846 | http://dx.doi.org/10.7448/IAS.19.5.20846
52
Research article
Annual cost of antiretroviral therapy among three service delivery
models in Uganda
Lung Vu§,1, Samuel Waliggo2, Brady Zieman1, Nrupa Jani1, Lydia Buzaalirwa3, Stephen Okoboi4, Jerry Okal5,
Nagesh N Borse6 and Samuel Kalibala1
§Corresponding author: Lung Vu, 4301 Connecticut Ave NW, Ste 280, Washington, DC 20008, USA. Tel: �1 202 237 9421. ([email protected])
Abstract
Introduction: In response to the increasing burden of HIV, the Ugandan government has employed different service delivery
models since 2004 that aim to reduce costs and remove barriers to accessing HIV care. These models include community-based
approaches to delivering antiretroviral therapy (ART) and delegating tasks to lower-level health workers. This study aimed to
provide data on annual ART cost per client among three different service delivery models in Uganda.
Methods: Costing data for the entire year 2012 were retrospectively collected as part of a larger task-shifting study conducted in
three organizations in Uganda: Kitovu Mobile (KM), the AIDS Support Organisation (TASO) and Uganda Cares (UC). A standard
cost data capture tool was developed and used to retrospectively collect cost information regarding antiretroviral (ARV) drugs
and non-ARV drugs, ART-related lab tests, personnel and administrative costs. A random sample of four TASO centres (out of 11),
four UC clinics (out of 29) and all KM outreach units were selected for the study.
Results: Cost varied across sites within each organization as well as across the three organizations. In addition, the number of
annual ART visits was more frequent in rural areas and through KM (the community distribution model), which played a major
part in the overall annual ART cost. The annual cost per client (in USD) was $404 for KM, $332 for TASO and $257 for UC. These
estimates were lower than previous analyses in Uganda or the region compared to data from 2001 to 2009, but comparable with
recent estimates using data from 2010 to 2013. ARVs accounted for the majority of the total cost, followed by personnel and
operational costs.
Conclusions: The study provides updated data on annual cost per ART visit for three service delivery models in Uganda. These
data will be vital for in-country budgetary efforts to ensure that universal access to ART, as called for in the 2015 World Health
Organization (WHO) guidelines, is achievable. The lower annual ART cost found in this study indicates that we may be able to
treat all people with HIV as laid out in the 2015 WHO guidelines. The variation of costs across sites and the three models
indicates the potential for efficiency gains.
Keywords: ART; cost; efficiency; task-shifting; community-based ART; Uganda.
Received 25 November 2015; Revised 3 May 2016; Accepted 4 May 2016; Published 20 July 2016
Copyright: – 2016 Vu L et al; licensee International AIDS Society. This is an Open Access article distributed under the terms of the Creative Commons Attribution 3.0
Unported (CC BY 3.0) License (http://creativecommons.org/licenses/by/3.0/), which permits unrestricted use, distribution, and reproduction in any medium,
provided the original work is properly cited.
IntroductionAlthough notable progress has been made in the provision of
HIV and AIDS services, the need for HIV and AIDS services
continues to expand faster than the available resources in low-
and middle-income countries. In the case of Uganda, coverage
of the population in need of antiretroviral therapy (ART) was
estimated at 331,000 in 2014, representing only half of the
total number of people living with HIV (PLHIV) [1]. ART offers
PLHIV a chance to live a normal lifespan. Consequently, HIV is
increasingly seen as a chronic illness rather than an acute
epidemic [2�4]. In addition, new HIV infections continue
to occur, contributing to an increased cumulative number of
PLHIV [4]. Furthermore, ART has been increasingly seen as an
important prevention strategy (treatment as prevention). The
World Health Organization (WHO) has recently recommended
HIV treatment to all PLHIV regardless of their CD4 count, and
many countries are planning on adopting this recommenda-
tion [3]. All of these factors are contributing to an increased
demand on human and financial resources to deliver ART, thus
careful planning and budgeting are needed to ensure universal
access to ART [4,5].
The increased demand on human and financial resources
to scale up ART presents a problem as many low income
countries have historically experienced severe health worker
shortages [5]. For example, in Uganda the ratio of doctors to
patients is 1:22,000, suggesting an 80% overall health worker
deficit compared to the WHO standard [6]. In response to the
health workforce shortage and the increased demand for HIV
treatment, in 2004 the Ugandan government developed and
pilot tested community-based ART delivery and task-shifting
models [6,7]. This effort included use of community distribu-
tion points and mobile units, or mixed models of community-
based and facility-based service provision, to bring HIV care
and treatment closer to the community with the delegation
of tasks to less specialized health workers and laypersons.
With a health worker shortage, these models are critical in
Vu L et al. Journal of the International AIDS Society 2016, 19(Suppl 4):20840
http://www.jiasociety.org/index.php/jias/article/view/20840 | http://dx.doi.org/10.7448/IAS.19.5.20840
53
removing barriers to accessing ART care and reducing
associated costs.
Although projections of resources needed to deliver ART
following the 2015 WHO guidelines have been made at
the global level, such projections have not been made
frequently in Uganda due to the lack of comprehensive costing
data [8,9]. Several initiatives providing ART have been imple-
mented in Uganda; however, there is little information available
about the costs of providing ART across these service delivery
models [10]. In addition, the available costing studies have had a
broader focus on public sector health facilities or were solely
based on budgeting data (projected data), without necessarily
providing actual costing data [11].To help fill this gap, we aimed
to provide the descriptive annual ART cost per ART client at the
three largest non-profit organizations serving PLHIV in Uganda �The AIDS Support Organization (TASO), Kitovu Mobile (KM) and
Uganda Cares (UC) � using a retrospective review of routine
data. The service delivery models provide free outpatient ART
services and serve mainly rural and semi-urban populations
[12]. The findings from this study will be valuable for budgetary
efforts to ensure universal access to ART in Uganda, following
the 2015 WHO guidelines. In addition, costing data is an
important input for modelling cost-effectiveness and cost-
efficiency analyses to promote long-term sustainability of ART
in Uganda and similar contexts [13,14].
MethodsDescription of the three service delivery models
Data were collected as part of a larger study assessing
the three task-shifting and community-based ART support
programmes in Uganda (Table 1) [12]. The three participating
organizations serving PLHIV in Uganda included the following:
TASO, which comprises 11 centres in four regions and serves
nearly 100,000 PLHIV annually; KM, which operates in 10
districts in southwestern Uganda and serves about 2000 PLHIV
annually; and UC, which operates 29 clinics in four regions of
Uganda and serves nearly 50,000 PLHIV annually.
TASO delivers HIV care through its 11 service delivery
centres in four regions across Uganda. Each TASO centre has
two types of service delivery models: 1) TASO-Central and
2) TASO outreach clinics, called community-based drug
distribution points (TASO-CDDPs). TASO-Central clinics provide
ARTservices to clients recently initiated to ART, or complicated
cases, as well as CD4 and viral load testing.TASO-CDDPsmainly
dispense antiretroviral (ARV) drugs and provide counselling
and health exams to stable clients at the community level.
At TASO, doctors take on critical and complicated cases and
supervise lower-level staff, including nurses and expert clients.
Expert clients are PLHIV who have been trained to provide ART
adherence counselling, monitor clients lost to follow-up and
dispense ARVs. Nurses and expert clients mainly dispense
ARVs to stable clients at the community level. In 2012, TASO
served a total of 68,584 HIV patients, of whom 33.3% (22,814)
were on ART.
HIV care and treatment services at KM are delivered at 111
non-facility-based community locations in 10 districts of the
south-western region in Uganda. The organization employs
15 health professionals (doctors and nurses) and 177 expert
clients. KM is a task-shifted model where a limited number of
doctors undertake the overall management or supervisory
roles and provide care to critically ill clients. Expert clients
dispense ARVs and provide adherence counselling. In 2012,
KM served 2007 clients, of whom 69.1% (1387) were on ART.
Table 1. Characteristics of the three ART delivery models (2012)
Characteristics
Kitovu
Mobile
TASO
Entebbe
TASO
Gulu
TASO
Jinja
TASO
Rukungiri
UC
Balikudembe
UC Nakawa
Market
UC
Lyantonde UC Kalisizo
HIV prevalence
(adults aged
15 to 49)
10.6% 7.1% 5.8% 5.8% 8.3% 7.1% 7.1% 8.0% 10.6%
Geography Rural Semi-urban Rural Semi-urban Rural Urban Urban Rural Rural
Personnel
Doctors 1 3 3 3 3 1 1 0 0.5 from MOH
Clinical officers 2 2 2 1 1 1 0 1 from MOH 0.5 from MOH
Nurses 10 5 5 5 5 6 2 1.5 from MOH 1 UC 1.5 from MOH
Lab technicians 1 3 3 2 2 0.5 shared
with Nakawa
0.5 shared
with St.
Balikudembe
1 1
Data managers 1 3 3 3 3 0.8 1 1 1
Total 15 16 16 14 14 9.3 4.5 4.5 5.5
Number of
ART clients
1387 6329 6969 5454 4062 2498 530 1250 1669
Number of ART
visits
12,510 23,461 28,654 32,233 27,693 12,636 6076 10,345 11,420
Notes: Kitovu Mobile operates in one region, UC operates in four regions and TASO operates in 10 regions. HIV prevalence from Uganda DHS,
Demographic and Health Survey, 2012. Personnel and ART client visits are from the organizational structure and records. ART, antiretroviral
therapy; MOH, Ministry of Health; TASO, the AIDS Support Organisation; UC, Uganda Cares.
Vu L et al. Journal of the International AIDS Society 2016, 19(Suppl 4):20840
http://www.jiasociety.org/index.php/jias/article/view/20840 | http://dx.doi.org/10.7448/IAS.19.5.20840
54
Both CD4 and viral load testing were done at government
laboratories.
UC is a collaborative partnership with the Ministry of Health
(MOH) and the AIDS Health Care Foundation.The organization
has been providing ART at no cost in Uganda since 2001 in
29 clinics across four regions. UC operates two types of service
delivery models: 1) UC stand-alone (UC-S) clinics, which are
located at UC centres; and 2) UC-MOH, which provides drugs
and other supplies to MOH health facilities for HIV care. UC
also practises task-shifting as a limited number of doctors take
on critical cases or cases referred by nurses, whereas nurses
dispense ARVs and conduct routine health assessments for
stable clients. In 2012 UC served a total of 3495 HIV clients, of
whom 80.3% (2807) were on ART. CD4 count was performed
on site whereas viral load tests were sent to government
laboratories for analysis.
Site selection
Four TASO centres out of 11 total centres were purposively
selected to ensure fair regional representation: Entebbe
(Central-1), Jinja (East-Central), Gulu (Mid-North) and Rukungiri
(South-West).
KM operates in only one region and all of its 111 outreach
mobile units were selected. Currently, UC operates 29 clinics
in four regions: North-East, Mid-East, Central-1 and Central-2.
Among the four regions of operation, the study team pur-
posively selected the following clinics to ensure a reasonably
fair distribution across the regions of Uganda: 1) Soroti,
2) Nakawa, 3) Balikuddembe; 4) Maddu, 5) Rakai, 6) Lyantonde,
7) Kalisizo, 8) Mulanda and 9) Nagongera. Five UC clinics had
excessive missing data and they were therefore removed from
the analysis.
Costing approach
The costing analysis was undertaken from the provider’s
perspective.The analysis only included costs that were directly
incurred by the provider and excluded costs covered by
clients. Ancillary and opportunity costs incurred by patients,
such as transportation and time, were not collected.
Data collection period
We chose to collect 2012 data in order to analyze the most
recent cost data available (as the study protocol was devel-
oped in 2013). Data collection was completed between June
and September 2013. The original costing data were recorded
in Ugandan shillings (UGX) and converted to US dollars (USD)
using 2012 historical exchange rates from OANDA.com.
Monthly 2012 data from the sampled facilities were collected
and then aggregated for the entire year. The total number of
visits for 12 months and the total number of clients at mid-
year were used in the analysis.
Data collection methods
The ART drug costs, number of clients, number of visits and
operational costs were collected retrospectively using routine
monitoring and evaluation (M&E) data from the organiza-
tions. In addition, other costs related to service delivery �accounting records, client visit logs, ART distribution logs,
equipment inventories and routine reports � were collected.
Salaries and benefits of staff directly providing ART services
were collected from payroll records. Time spent on ART
service delivery was determined based on interviews with
staff and their managers, as well as reviews of staff levels of
effort in ART services. For staff not working full-time on ART-
related services, the time spent on ART was calculated as a
ratio of the total number of hours spent on ARTdivided by the
total working hours (eight) per day. The percentage of office
rent and operational costs attributed to ART was calculated
based on the number of ART clients in relation to the total
number of clients for the organization.
Costing data were collected from a programmatic per-
spective, which included all site-level costs of outpatient ART
and supportive care. In addition to direct service provision
costs, the study examined site administration, management
and operational costs at each site.
A cost data capture tool was developed � according
to the US President’s Emergency Plan for AIDS Relief
(PEPFAR) guidelines on cost elements to be collected for ART
programmes � and administered at all three organizations [15].
The tool captured the following: 1) personnel costs, including
salaries and allowances of staff who provide ART services as
well as administrative staff who manage and support the
clinics; 2) ARV costs; 3) other non-ARTdrugs and supplements,
including drugs to prevent opportunistic infections, vitamins,
TB drugs and nutrition support; 4) laboratory services related
to ART delivery, such as CD4 count and viral load testing, TB
testing and basic blood testing; and 5) operational costs, for
example equipment, furniture, office rental, car rental, fuel,
insurance, travel and office utilities.
Apportionment of shared costs
Apportioning costs for staff not full-time on ART service
delivery was estimated based on the number of ART patients
versus total patients. For TASO, which has a regional structure,
personnel costs at the national level were equally shared
among the four TASO centres. At UC and KM, headquarter
operational costs attributed to ART were equally distributed
among all the service delivery points of the organization.
Missing data
Missing data on office space rental and office expenses for UC
and KM were replaced with data from the months available.
This approach is considered acceptable because office and
rental expenses are fairly stable from month to month.
Missing data on ARVs and staff time were excessive (30%
and above) at five of the nine UC sites; therefore they
were excluded from this analysis to ensure accuracy. ARV
cost data were complete for all sites. Staff time spent on ART
services were calculated for all sites based on accounting
records, project records, payroll data and interviews. TASO
had complete costing data across all five cost components.
Data analysis
Data from the data capture tool were entered into Microsoft
Excel and organized into the five different cost components as
described above. Direct costs of ARVs and other ART-specific
commodities were captured and analyzed at face value. The
total ART-related costs were divided by the total number of
annual visits and total number of annual patients to estimate
cost per ART visit and annual cost per ART patient.
Vu L et al. Journal of the International AIDS Society 2016, 19(Suppl 4):20840
http://www.jiasociety.org/index.php/jias/article/view/20840 | http://dx.doi.org/10.7448/IAS.19.5.20840
55
Ethical considerations
The study was reviewed and approved by the Population
Council and the Ugandan National Council for Science and
Technology IRBs. All of the costing data were extracted from
accounting records that did not contain any patient-specific
data or personal identifiers. The total number of patient
visits in 2012 was collected from clinic records. No personal
information of patients was recorded in the data capture tool.
ResultsEstimation of ART cost per visit and annual ART cost per
client
Table 2 summarizes the 2012 total annual ART-related
expenditure, the cost per client visit and annual cost per
client in USD. Table 2 also shows the average number of visits
per client across the three models. In particular, clients at KM
made an average of nine visits to the KM outreach locations
for ART care, whereas TASO clients averaged five visits and UC
clients averaged seven visits annually. The average cost per
visit was $38 for UC, $45 for KM and $74 for TASO clients. The
average annual cost per client was $404 for KM, $332 for TASO
and $257 for UC clients. The average cost per client for all
three organizations was $331 and varied across the four TASO
centres and four UC clinics (data not shown).
Cost distribution across the five components of each model
Table 3 summarizes cost distributions across the five cost
components at all three organizations.
ARV costs: ARVs accounted for a significant portion of the
total ART-related costs. In particular, ARVs comprised 47% of
the total cost among KM clients, compared to 44% among
TASO and 66% among UC clients. However, the annual
ARV cost per client across these three organizations was
comparable ($188 among KM, $149 among TASO and $170
among UC clients). It is important to note that in 2012,
95% of TASO clients and 98% of KM and UC clients were on
first-line drugs.
Personnel costs: There are significant variations in person-
nel and other costs across the three organizations. Personnel
costs accounted for 25% (KM), 21% (TASO) and 9% (UC) of
the total costs. The strikingly lower personnel costs within
the UC model were likely due to the fact that some
government staff providing services at UC clinics were not
captured. This was one limitation regarding personnel costs
Table 2. Average cost per visit and annual cost per client across the three models (2012)
Model Location
Total
expenditure
(USD)
Total ART
clients
Total ART
visits
Average
annual
visits/client
Average cost
per ART visit
(USD)
Annual cost
per ART client
(USD)
Kitovu Mobile Rural (Southwestern Region) $560,756 1387 12,510 9.0 $45 $404
TASO Rural (Gulu) $2,094,695 6969 28,654 4.1 $73 $301
Rural (Rukungiri) $1,944,096 4602 27,693 6.0 $70 $422
Semi-urban (Jinja) $1,969,940 5454 32,233 5.9 $61 $361
Semi-urban (Entebbe) $1,744,231 6329 23,461 3.7 $74 $276
Overall cost $7,752,962 22,814 112,041 4.8 $69 $332
Uganda Cares Urban (St. Balikudembe) $791,009 2498 12,636 5.1 $63 $317
Urban (Nakawa Market) $190,222 530 6076 11.5 $31 $359
Rural (Lyantonde) $272,841 1250 10,345 8.3 $26 $218
Rural (Kalisizo) $274,717 1669 11,420 6.8 $24 $165
Overall cost $1,528,789 5947 40,477 6.8 $38 $257
ART, antiretroviral therapy; TASO, The AIDS Support Organisation; USD, US dollars.
Table 3. Cost distribution across five cost components (2012)
Model Personnel ARV drugs Other drugs Laboratory Administrative costs Total USD
Kitovu Mobile Total $140,529 $260,641 $59,439 $13,150 $86,996 $560,756
Distribution 25.1% 46.5% 10.6% 2.3% 15.5% 100%
Per client $101.32 $187.92 $42.85 $9.48 $62.72 $404.29
TASO Total $1,655,930 $3,399,418 $1,145,544 $477,737 $1,074,333 $7,752,962
Distribution 21.4% 43.8% 14.8% 6.2% 13.9% 100%
Per client $72.58 $149.01 $50.21 $20.94 $47.09 $339.83
Uganda Cares Total $135,106 $1,007,376 $65,441 $199,366 $121,500 $1,528,789
Distribution 8.8% 65.9% 4.3% 13.0% 7.9% 100%
Per client $22.72 $169.39 $11.00 $33.52 $20.43 $257.07
ARV, antiretroviral; TASO, The AIDS Support Organisation; USD, US dollars.
Vu L et al. Journal of the International AIDS Society 2016, 19(Suppl 4):20840
http://www.jiasociety.org/index.php/jias/article/view/20840 | http://dx.doi.org/10.7448/IAS.19.5.20840
56
within the UC models and thus comparisons should be
made with caution.
Other (laboratory, administrative and non-ART drugs)
costs: KM spent about 15% of their total expenses on
operations and overhead, 11% on non-ARV drugs and 2% on
lab services. TASO’s distribution of other costs was fairly
similar to KM, with 15% attributed to non-ARV drugs, 14% to
administrative expenses and 6% spent on lab tests. UC’s
distribution of other costs was much lower, with 13% of the
total expenses spent on labs, 8% on operations and 4% on
non-ART drugs. The differences in total ART-related costs per
client per year in the three organizations are due to the
differences in personnel and these other costs.
DiscussionThis study generated data on ART-related costs and resources
expended to provide ART to PLHIV in Uganda. We estimated
cost per outpatient ART visit and average outpatient annual
ART costs using routine health service data from three non-
profit AIDS service organizations representing three different
ART service delivery models in Uganda. These models are
considered decentralized and task-shifted. Doctors or trained
clinical nurses are responsible for newly initiated ART clients
and critically ill cases; other tasks including drug dispensing
and routine health exams are performed by nurses and expert
clients. In addition, KM provides services at the community
level, TASO provides services at both the facility and commu-
nity level and UC provides services mainly at the facility level.
Consistent with previous costing analyses [8,10,16�20], wefound that ARV-related expenses accounted for a significant
portion of the total ART-related cost, followed by personnel
and administrative costs. In particular, ARVs accounted for
nearly 50% of the total expenses for the KM and TASO models
and for nearly 70% for the UC model.
Overall, the average annual cost per ART client among the
three organizations ($331) was lower than previous analyses
conducted in 2008 to 2009 among five PEPFAR countries
(Ethiopia, Uganda, Botswana, Nigeria and Vietnam; 2009
data), in which the median annual ART cost was $800 [10].
Another systematic review of studies conducted between
2001 and 2009 found a median ART-related cost of $792 for
low-income countries [21]. However, our estimated ART costs
were slightly higher than a recent study using 2010 to 2011
data that showed an average cost of $208 per client (Ethiopia,
Malawi, Rwanda and Zambia) [20]. Another analysis of 8500
patients from an urban ART centre in Kampala using even
more recent data (2012 to 2013) showed a comparable
average annual cost per client: $218 among clients on ART for
the first year, $284 for clients on ART for more than one year
and $431 for patients with TB co-infection [22]. The cost of
ARVs has decreased since 2010 [10,13], which is likely the
largest contributing factor for the lower annual ART cost in
our study and a few other recent studies [13,14]. In addition,
these three participating organizations have matured and
may be more efficient in serving an increased number of ART
clients, as suggested by previous research [13,14]. Lower ART
costs suggest that future ART programmes may become even
less expensive, especially with the continuing reduction of
drug costs.
Another notable finding was the variety in unit costs
across sites within each model and across the three models,
particularly personnel and operational costs. This finding
indicates that there may be potential for cost savings for
future ART programmes in Uganda. The variation reflects
the differences across the service delivery models as well as
the different package of services provided to patients. In
particular, the cost per visit was lowest at UC and KM but
significantly higher at TASO. However, cost per client was
lowest for UC, followed by TASO and then KM. It is important to
note that KM was found to be the most expensive model
regarding annual ARTcost per client. It is surprising that amore
decentralized model like KM costs more than less decentra-
lized models like UC and TASO. However, this finding is likely
because KM employed a large number of expert clients and
had to pay for the ARTmobile units to move around rural areas
where KM implements its activities. In addition, on average,
KM clients made 2 and 1.5 times the total number of visits
made by TASO and UC clients, respectively. It is noteworthy
that the convenient access and the flexibility of ART visits
(evenwithout appointments) might explain the higher number
of annual visits per client at KM. In order to achieve efficiency
among community-based ART models, such as KM, the
number of visits per client per year need to be reduced to
four times or fewer.
The distribution of costs was quite comparable between
KM and TASO, which is consistent with previous study findings
[8,10,13,18,20,23]. KM employed a large number of expert
clients (177) for their outreach activities, resulting in person-
nel costs comparable to that of TASO and higher than
UC’s personnel costs. However, interpretation of this finding
should be made cautiously because UC employs a number of
staff from the government and their salary data were not
fully captured in this costing data. In addition, UC also used
facilities offered by the government free of charge, resulting
in a much lower operational cost compared to KM and TASO
and contributing to the overall lower ART cost per client for
the UC model. This ultimately affects the cost distribution
within the UC model. Further, even though ART expenses
for UC accounted for nearly 70% of the total cost, the total
UC ART cost in terms of absolute dollar value was quite
comparable with KM and TASO.
LimitationsFirst, data for this study were collected retrospectively using
routine accounting data, client visit logs, ART dispensing logs,
staff payroll data and interviews; thus they were likely to
have been subject to recall bias and other types of errors.
Second, missing data is likely another threat to the accuracy
of our estimate, particularly for the UC model. However, we
excluded data from five of the nine UC clinics with excessive
missing data. Recall bias and missing data are common
limitations of routine programme data, especially data from
local and grass-roots-level organizations. Third, although the
percentage of clients on second-line ARV drugs was small
(2% for KM, 2% for UC and 5% for TASO), we were not able
to separate first-line and second-line ARV costs. Fourth,
data were collected from only three non-profit HIV service
organizations and therefore our cost estimates are likely not
Vu L et al. Journal of the International AIDS Society 2016, 19(Suppl 4):20840
http://www.jiasociety.org/index.php/jias/article/view/20840 | http://dx.doi.org/10.7448/IAS.19.5.20840
57
representative of ART costs among patients receiving services
from other health sectors or living in other parts of Uganda.
Nonetheless, these data are vital for future programming,
budgeting and costing analysis and will enrich the pool of
available ART costing data, which will likely improve the
validity of future systematic analysis.
Although ascertaining clients’ ancillary and opportunity
costs would have been important to complement the financial
data, we were not able to collect information on costs such as
time spent waiting at the clinic, transportation and other out-
of-pocket payments. Because of data limitations, we did not
focus on comparing the annual ART cost per client across the
three organizations. Our main goal was to provide estimated
ART-related costs per client and to enrich the pool of limited
costing data available in Uganda and similar contexts. Never-
theless, these ART costing data yield valuable information for
these three organizations and other AIDS organizations in
Uganda and other low- and middle-income countries, to assist
with future programme planning and budgeting. As we move
towards treating everyone with HIV regardless of their CD4
count, careful budgeting is critical to ensure universal access
to ART. In addition, despite these limitations, the study has
demonstrated the feasibility of using existing routine data to
estimate the cost per ART patient visit, while highlighting the
need to strengthen the capacities of local organizations to
better collect, document and use routine data.
ConclusionsOur study provides the most recent available costing data
from the three largest HIV service organizations, representing
three different ARTservice delivery models in Uganda [7]. Unit
costs, cost distribution and resource utilization varied widely
across the three sites and models, suggesting the potential
for efficiency gains in ART service delivery. In particular, HIV
programmes in Uganda may save costs by reducing the
number of annual ART visits to the national standard (four
ART visits a year on average). Further, non-profit organizations
providing ART services, similar to these three organizations,
may benefit from collaboratingwith the government and using
government facilities to reduce operational costs. Additionally,
ART is evolving rapidly with lower ARV costs and the 2015
WHO guidelines recommending treatment for all PLHIV [3].
Our findings of lower annual ART costs compared to previous
analyses in Uganda and the region add value to several recent
estimated ART costs, suggesting that we may be able to treat
more people with the same or even fewer resources. Lastly,
the collection of costing data to measure unit costs, cost-
effectiveness and cost-efficiency remains critical [2,4]. ART
service delivery sites in country would benefit from imple-
menting a standardized cost data-capture tool or M&E system
that allows for comparison across sites. In addition, supportive
supervision is critical to ensure data quality.
Authors’ affiliations1Population Council, Washington, DC, USA; 2Kitovu Mobile AIDS Organisation,
Masaka, Uganda; 3Uganda Cares, Kampala, Uganda; 4The AIDS Support
Organisation, Kampala, Uganda; 5Population Council, Nairobi, Kenya; 6US
Agency for International Development, Washington, DC, USA
Competing interests
The authors declare that they have no conflict of interests.
Authors’ contributions
LV conceived the study and had overall responsibility for writing the manu-
script. SK and NJ led the larger task-shifting study that provided the costing
data for this paper. LV and BZ led the data analysis. SW, LB and SO contributed
to Table 2; SW and JO contributed to part of the introduction. NB drafted the
abstract and provided input for Tables 2 and 3. NJ reviewed the first draft and
was responsible for copy-editing. All authors reviewed and approved the final
version.
Acknowledgements
We thank the staff at TASO, Uganda Cares and Kitovu Mobile for supporting
the study. We especially thank David Kisitu and Doreen Asaba for support with
the data collection.
Funding
This study was made possible through support provided by PEPFAR and the US
Agency for International Development (USAID) via HIVCore, a task order
funded by USAID under the Project SEARCH indefinite quantity contract
(contract no. AID-OAA-TO-11-00060). The task order is led by the Population
Council in partnership with the Elizabeth Glaser Pediatric AIDS Foundation,
Palladium and the University of Washington. The authors’ views expressed in
this manuscript do not necessarily reflect the views of USAID or the United
States government.
References
1. Joint Programme on AIDS in Uganda (JUPSA) 2011�2014. Narrative ProgressReport. [Internet]. [cited 2016 May 21]. Available from: http://mptf.undp.org/
document/download/1447
2. WHO. Global HIV Response. Epidemic updates and health sector progress
towards universal access [Internet]. Progress Report 2011. 2011. [cited 2016 May
21]. Available from: http://www.who.int/hiv/pub/progress_report2011/en/
3. World Health Organization. Guideline on when to start antiretroviral
therapy and on pre-exposure prophylaxis for HIV. Geneva: WHO; 2015.
4. UNAIDS & The Henry J. Kaiser Family Foundation. Financing the response to
HIV in low- and middle-income countries: international assistance from donor
governments in 2013. Menlo Park, CA: Henry J. Kaiser Family Foundation;
2014.
5. Izazola-Licea JA,Wiegelmann J, Aran C, Guthrie T, De Lay P, Avila-Figueroa C.
Financing the response to HIV in low-income and middle-income countries.
J Acquir Immune Defic Syndr. 2009;52(Suppl 2):S119�26.6. World Health Organization. Task shifting: rational redistribution of tasks
among health workforce teams: global recommendations and guidelines.
Geneva: World Health Organization; 2008.
7. Babigumira JB, Castelnuovo B, Lamorde M, Kambugu A, Stergachis A,
Easterbrook P, et al. Potential impact of task-shifting on costs of antiretroviral
therapy and physician supply in Uganda. BMC Health Serv Res. 2009;9:192.
8. Mdege ND, Chindove S, Ali S. The effectiveness and cost implications of
task-shifting in the delivery of antiretroviral therapy to HIV-infected patients: a
systematic review. Health Policy Plan. 2013;28(3):223�36.9. WHO. Task shifting: global recommendations and guidelines. Geneva: WHO;
2008.
10. Menzies NA, Berruti AA, Berzon R, Filler S, Ferris R, Ellerbrock TV, et al.
The cost of providing comprehensive HIV treatment in PEPFAR-supported
programs. AIDS. 2011;25(14):1753�60.11. Moreland S, Namisango E, Paxton A, Powell RA. The costs of HIV
treatment, care, and support services in Uganda, MEASURE Evaluation
Technical Report. Chapel Hill, NC: MEASURE Evaluation; 2013.
12. HIVCore Project. Retrospective review of task-shifting community-based
programs supporting ARV treatment and retention in Uganda, HIVCore Final
Report. Washington, DC: USAID j Project Search: HIVCore; 2016.13. Harling G, Wood R. The evolving cost of HIV in South Africa: changes in
health care cost with duration on antiretroviral therapy for public sector
patients. J Acquir Immune Defic Syndr. 2007;45(3):348�54.14. Menzies NA, Berruti AA, Blandford JM. The determinants of HIV treatment
costs in resource limited settings. PLoS One. 2012;7(11):e48726.
15. Sanders R. ART unit cost spreadsheet user guide. Washington, DC: Futures
Group, Health Policy Initiative, Costing Task Order; 2013.
16. McCoy K, Kiragga D, Addy B, Feeley FG. Costs and outcomes of delivering
antiretroviral therapy (ART) in the private and public sectors in Uganda: final
report. Health Initiatives for the Private Sector (HIPS) Project. United States
Agency for International Development (USAID); 2011.
Vu L et al. Journal of the International AIDS Society 2016, 19(Suppl 4):20840
http://www.jiasociety.org/index.php/jias/article/view/20840 | http://dx.doi.org/10.7448/IAS.19.5.20840
58

17. Bikilla AD, Jerene D, Robberstad B, Lindtjorn B. Cost estimates of HIV care
and treatment with and without anti-retroviral therapy at Arba Minch Hospital
in southern Ethiopia. Cost Eff Resour Alloc. 2009;7:6.
18. Martinson N, Mohapi L, Bakos D, Gray GE, McIntyre JA, Holmes CB.
Costs of providing care for HIV-infected adults in an urban HIV clinic in Soweto,
South Africa. J Acquir Immune Defic Syndr. 2009;50(3):327�30.19. Rosen S, Long L, Sanne I. The outcomes and outpatient costs of different
models of antiretroviral treatment delivery in South Africa. Trop Med Int
Health. 2008;13(8):1005�15.20. Tagar E, Sundaram M, Condliffe K, Matatiyo B, Chimbwandira F, Chilima B,
et al. Multi-country analysis of treatment costs for HIV/AIDS (MATCH): facility-
level ART unit cost analysis in Ethiopia, Malawi, Rwanda, South Africa and
Zambia. PLoS One. 2014;9(11):e108304.
21. Galarraga O, Wirtz VJ, Figueroa-Lara A, Santa-Ana-Tellez Y, Coulibaly I,
Viisainen K, et al. Unit costs for delivery of antiretroviral treatment and
prevention of mother-to-child transmission of HIV: a systematic review for
low- and middle-income countries. Pharmacoeconomics. 2011;29(7):579�99.22. Parkes-Ratanshi RM, Kakaire T, Sempa J, Musiime B, Castelnuovo B, Kuznik
A, et al. Cost of patient care at different stages of treatment within the public
model of HIV care: analysis from an urban HIV care centre in Uganda. Poster
presented at ISPOR Annual Meeting. Philadelphia, USA; 2015.
23. Larson BA, Bii M, Henly-Thomas S, McCoy K, Sawe F, Shaffer D, et al.
ART treatment costs and retention in care in Kenya: a cohort study in three
rural outpatient clinics. J Int AIDS Soc. 2013;16:18026.
Vu L et al. Journal of the International AIDS Society 2016, 19(Suppl 4):20840
http://www.jiasociety.org/index.php/jias/article/view/20840 | http://dx.doi.org/10.7448/IAS.19.5.20840
59
Review
Opportunities and challenges in conducting secondary analysis of
HIV programmes using data from routine health information
systems and personal health information
Stephen Gloyd§,1,2, Bradley H Wagenaar1,2, Godfrey B Woelk3 and Samuel Kalibala4
§Corresponding author: Stephen Gloyd, Department of Global Health, University of Washington, Box 357965, Seattle, WA 98195, USA. Tel: �1 206 5438382.
Abstract
Introduction: HIV programme data from routine health information systems (RHIS) and personal health information (PHI)
provide ample opportunities for secondary data analysis. However, these data pose unique opportunities and challenges for use
in health system monitoring, along with process and impact evaluations.
Methods: Analyses focused on retrospective case reviews of four of the HIV-related studies published in this JIAS supplement.
We identify specific opportunities and challenges with respect to the secondary analysis of RHIS and PHI data.
Results: Challenges working with both HIV-related RHIS and PHI included missing, inconsistent and implausible data; rapidly
changing indicators; systematic differences in the utilization of services; and patient linkages over time and different
data sources. Specific challenges among RHIS data included numerous registries and indicators, inconsistent data entry, gaps in
data transmission, duplicate registry of information, numerator-denominator incompatibility and infrequent use of data for
decision-making. Challenges specific to PHI included the time burden for busy providers, the culture of lax charting, overflowing
archives for paper charts and infrequent chart review.
Conclusions: Many of the challenges that undermine effective use of RHIS and PHI data for analyses are related to the processes
and context of collecting the data, excessive data requirements, lack of knowledge of the purpose of data and the limited use of
data among those generating the data. Recommendations include simplifying data sources, analysis and reporting; conducting
systematic data quality audits; enhancing the use of data for decision-making; promoting routine chart review linked with simple
patient tracking systems; and encouraging open access to RHIS and PHI data for increased use.
Keywords: secondary data analysis; health information systems; personal health information; electronic medical records; data
accuracy; missing data; data analysis.
Received 27 November 2015; Revised 22 April 2016; Accepted 2 May 2016; Published 20 July 2016
Copyright: – 2016 Gloyd S et al; licensee International AIDS Society. This is an Open Access article distributed under the terms of the Creative Commons Attribution
3.0 Unported (CC BY 3.0) License (http://creativecommons.org/licenses/by/3.0/), which permits unrestricted use, distribution, and reproduction in any medium,
provided the original work is properly cited.
IntroductionMassive amounts of data have been collected in low- and
middle-income countries for HIV programmes over the past
several decades. Complex data collection requirements have
come from donors, multilateral organizations and ministries
of health to monitor their substantial HIV investments [1,2].
To calculate an array of HIV-related tracking indicators, groups
have used data from routine health information systems
(RHIS), personal health information (PHI), community sample
surveys, demographic surveillance sites and special studies.
In this context, RHIS and PHI data provide ample opportu-
nities for secondary data analysis. RHIS data typically come
from monthly reports generated at health facilities derived
from service-specific registry books. These data are capable
of providing accurate, reliable, timely, representative and
continuous information on the health system and patients in
the system [3�5]. They can be real-time indicators of service
coverage and quality, and the numerous repeated observa-
tions over extended periods of time can provide robust data
for secondary analysis, including quasi-experimental designs,
such as controlled interrupted time-series analysis, which
provide strong inferences of causality in measuring the impact
of programme and policy changes. These facility-level data can
also provide knowledge of geographic variation � highlighted
as important for focusing on the UNAIDS agenda to ‘‘leave
no-one behind’’ [6], the World Health Organization (WHO)
guidelines for the expansion of antiretroviral therapy (ART) [7]
and the PEPFAR 3.0 objectives of doing the ‘‘right thing, right
place right time’’ [8].
PHI typically includes facility-based patient charts that are
either paper-based or electronic medical records (EMR),
personal pharmacy pick-up records and/or home-based book-
lets (e.g. mother-child health booklets). Paper charts remain
the mainstay for most patient information; EMR systems are
usually managed by international implementing partners and
harmonized across countries in which a partner works [9].
EMR data are increasingly used for longitudinal studies that
examine enrolment and retention in HIV care [10].
Gloyd S et al. Journal of the International AIDS Society 2016, 19(Suppl 4):20847
http://www.jiasociety.org/index.php/jias/article/view/20847 | http://dx.doi.org/10.7448/IAS.19.5.20847
60
Secondary data represent the low hanging fruit for cost-
effective programme evaluation for improving the quality of
HIV services. When RHIS and PHI are available and accurate,
expensive data collection to assess health system perfor-
mance can be avoided [11�13]. Furthermore, RHIS and PHI
can enable making inferences at the health facility level, in
contrast to most intermittent sample surveys, special studies
or demographic surveillance sites which most often are not
powered to be actionable below the provincial level. RHIS
and PHI can be used to guide decision-making at national
and sub-national levels, yet problems with accuracy and
completeness of the data often undermine their usefulness
[14]. Case studies of poor RHIS data are widespread and
the use of RHIS is frequently disparaged [15�17]. However,many studies have shown that rapid and relatively low-cost
methods of improving data completeness and reliability are
highly effective [3,4,18�23].The aim of this paper is to review the accuracy of RHIS and
PHI data collected and used in four studies of the HIVCore
project, all published in this JIAS supplement. We believe
that these studies, each carried out in a different country,
provide a broad spectrum of experiences using RHIS and PHI
for secondary data analysis. Our objective is to identify key
challenges regarding their use and to identify ways to address
those challenges going forward, contextualized in the broader
literature [24�28].
MethodsThe studies reviewed in this article were conducted across
four countries between 2012 and 2015. All of the countries
have a substantive PEPFAR presence that includes large
international NGO implementing partners and heavy data
reporting requirements � a situation that is common in PEFAR-
supported countries in sub-Saharan Africa. Each of the studies
was conducted with support of the implementing partners.
The authors independently reviewed each of the studies
and used consensus decision-making to identify themes to
achieve a unifying analysis of the studies. Communication was
carried out through iterative phone calls, emails and sharing of
manuscript drafts.
1) Prevention of mother-to-child transmission (PMTCT)
cascade assessment in Cote d’Ivoire [24] identified loss
to follow-up and associated factors in the Cote d’Ivoire
PMTCT programme, using a nationally representative,
cross-sectional sample of 30 randomly selected health
facilities providing PMTCT.The quantitative aspect of the
study assessed 13 indicators from PMTCT-related regis-
tries and patient charts to determine the magnitude of
loss to follow-up among 1741 HIV-positive women at
multiple steps in the PMTCTcascade and compared high-
and low-performing sites to identify factors associated
with differences in PMTCT performance.
2) PMTCT retention assessment in Rwanda [25] investi-
gated levels of retention along the PMTCT cascade
among HIV-positive pregnant women and their infants
attending EGPAF-supported health facilities using a
retrospective cohort analysis among 474 women in 12
health facilities. Data were linked from ANC, PMTCT,
labor and delivery, HIV Exposed Infants, postnatal care,
ART and Exposed Infant Diagnosis registers.
3) Task shifting and ART retention in Uganda � cost
analyses [26,27] analyzed annual ART-related costs
among the three large AIDS organizations, each repre-
senting a task-shifting model. The study team collected
cost information regarding ARV drugs, non-ARV drugs,
ART-related lab tests, personnel and administrative
costs. Data for the analysis came from patient charts
and included the client’s date of initiation of ART and
ARV refill visits to determine attendance and retention.
4) Assessment of linkages from HIV testing to enrolment
and retention in care in central Mozambique [28]
assessed enrolment and retention of HIV-positive in-
dividuals through assessment of HIV registries at 87
health facilities in Central Mozambique, and review of
795 patient charts of HIV patients conducted at eight
health facilities offering ART. Quantitative data were
abstracted from facility monthly reports, HIV registries
and patient charts, and adjusted to account for missing
and inconsistent values to measure losses to follow-up.
ART registries were linked to patient charts via unique
patient codes. No unique patient codes were used for
HIV testing.
ResultsThe authors identified several general themes during the
analysis of the studies, including missing, inconsistent and
implausible data; changing indicators; differential utilization
of services; and data linkages.
Incomplete, missing and implausible data
This was by far the most common challenge encountered in all
of these studies, both in RHIS and PHI. Incomplete RHIS
included missing monthly reports or implausible data in the
submitted reports or in the registries on which the monthly
reports were based. Incomplete PHI included key information
regarding demographics, initiation of treatment, clinic visits,
CD4 counts, date of birth and infant information among
PMTCT patients. Examples of incomplete, missing and im-
plausible data are described for each study as follows:
The Cote d’Ivoire PMTCT study noted that missing data
were widespread in the entire national reported sample. For
the 11 registry indicators that were assessed to evaluate the
PMTCT cascade, 24 of the 30 study sites had one or more
months with no data during the 12-month study period. In
addition, PMTCT registries, ART registries and patient charts
were incorrectly filled out at 10, 9 and 14 sites, respectively,
out of the 30 total sites. The study team found large variability
in data completeness from different sites. Moreover, there
were major inconsistencies in similar indicators from different
sources. For example, the recorded proportion of women
tested for HIV was much less in the mother-child vaccination
booklets (84%) than in PMTCT testing registries (95%) at
the same sites. In addition, at every site, on-site registry
indicators were inconsistent with the same indicators in the
national database. On average, more than half of all indicators
compared had a discrepancy of larger than 5% between on-
site data and the same data in the national database. The data
Gloyd S et al. Journal of the International AIDS Society 2016, 19(Suppl 4):20847
http://www.jiasociety.org/index.php/jias/article/view/20847 | http://dx.doi.org/10.7448/IAS.19.5.20847
61
quality and burden of having too many indicators in multiple
registries was highlighted as a key finding of the study. In spite
of the data weaknesses, authors were able to triangulate data
from multiple sources to attain usable estimates for the study
analysis.
The Rwanda PMTCT study demonstrated similar challenges
with missing key data. The type of regimen was unknown for
20% of the women on ARV. For the infants, 38% of infant files
were not found. Among the patient charts, the type of
regimen was unknown for nearly half of the women who were
reported to be on lifelong ART. In the maternity, postnatal
care and HIV-exposed infant registries were used to link the
mother-baby pairs. Many of the infant records were missing
information, including place of delivery (40% missing), mode
of delivery (70% missing) and gender (58% missing).
The Uganda study excluded four of 29 health facilities
from one of the three samples because of missing and
implausible data. Two additional AIDS service organizations
were excluded whose data were inadequate for comparison
after data cleaning. Study teams noted frequent duplicate
entries of data, dates entered in incorrect formats, including
visits falling outside the eligible enrolment period and
mismatched site codes. Implausible client histories showed
that clients received, in the aggregate, over 125% of ARTdrugs
based on their follow-up period. Many errors necessitated the
exclusion of records from the final analysis. In two sites, 78%
of all collected client histories failed to meet one of four
essential criteria for adherence and only 67 of 304 patient
histories were sufficiently complete for analysis for the study.
As with other studies, missing data were highly variable
among indicators: 64% of all unique client histories were
missing drug delivery numbers, regimen information or both;
and 92% of all unique client histories were missing one or
more scheduled appointment dates. Moreover, large varia-
bility in missingness was found between sites.
The Mozambique HIV linkages study demonstrated that
missing data and data inconsistencies were common in all
stages of the treatment cascade, including testing, enrolment
and retention in treatment. Over 46% of the 1944 monthly
HIV testing reports expected from the health facilities were
missing from the national RHIS. Most HIV testing reports
submitted did not report from more than several of the 13
clinical programmes where HIV testing might have occurred.
Registration in pre-ART care was more reliably reported; less
than 5% of these monthly reports were missing. The much
lower missingness among numerators (pre-ART registration)
than denominators (HIV testing) caused a large overestimate
of the likely true proportion of people tested HIV positive
who were enrolled in pre-ART. After the authors imputed
data from non-missing months to estimate the missing
months, the overall estimated proportion of people tested
HIV positive registered in pre-ART dropped from 97 to 75%.
Another challenge from the Mozambique HIV linkages
study was that registration in pre-ART care did not necessarily
imply enrolment in HIV care. Although patient charts were
required for all people that tested HIV positive who registered
in care, charts were found in only 66 and 60%, respectively, of
patients who had been registered in ARTand pre-ART � with a
large variation among facilities (41�92% of ART charts found).
Patient charts and pharmacy records inconsistently recorded
individual patient visits. Only 37% of patient charts that were
found demonstrated evidence of active retention. Given the
losses in all steps of the ART cascade, the total retention of
people tested HIV positive identified in the system was only
18% in a sample whose mean time in treatment was
18 months � when the published national 12-month reten-
tion rate over the same period was 67% [29].
Changing measurements and indicators
HIV indicators have frequently evolved to align with changing
norms of prevention, diagnosis and treatment. These chang-
ing indicators have made conducting time-series analyses
difficult. For example, in both the Mozambique and Cote
d’Ivoire studies, the proportion of infants who received
polymerase chain reaction (PCR) testing had been measured
against the number of infants of HIV-positivemothers who had
been registered in care.When PEPFAR changed denominators
to measure infant PCR testing against all HIV-positive mothers,
the proportion of infants PCR tested dropped by nearly
half. Different numerator variables for HIV testing in antenatal
care gave quite different results when measured against
the same denominator (first antenatal visits). When the
numerator included all HIV tests in antenatal care, the agg-
regate reported proportion of women tested exceeded 105%.
When the numerator was limited to HIV tests done among
women attending first or second antenatal visits, the reported
proportion of women tested dropped to 89%.
The proportion of patients retained in ART has been
especially difficult to assess due to constantly changing
criteria for retention. Different sources of data (patient charts,
pharmacy records and/or community outreach registries)
change frequently � and different recording systems report
different retention rates. Since 2013, PEPFAR partners have
measured retention in ART by calculating the percent of
adults and children known to be alive and on treatment
12 months after initiation of ART. In both Mozambique and
Cote d’Ivoire, the number of people who initiated ART in the
12 months prior to the beginning of the reporting period
frequently does not correspond to the reports of the same
indicator in the previous year report, usually increasing the
reported proportion of people retained in ART.
Differential utilization and patterns of services
The Mozambique linkages study reported two urban districts
with a high proportion of patients lost to ART follow-up,
some of whom might have simply changed their care to one
of the other ART facilities in the same city. Such unrecorded
transfers are more likely in urban than in rural areas; thus,
the divergence of reported retention from true retention
may be greater in urban areas. Transfer rates were reported
to be as high as 20% in one urban facility in the Mozambique
study, but rare in rural facilities. When transfers are not
accounted for in ART retention calculations, reported reten-
tion rates may underestimate the true retention.
The Cote d’Ivoire PMTCT study data suggested that
proportions of women who were tested for HIV in private
health facilities were substantially lower than in government
facilities. Although some of the larger private facilities report
to the national system, many of the smaller private facilities
Gloyd S et al. Journal of the International AIDS Society 2016, 19(Suppl 4):20847
http://www.jiasociety.org/index.php/jias/article/view/20847 | http://dx.doi.org/10.7448/IAS.19.5.20847
62
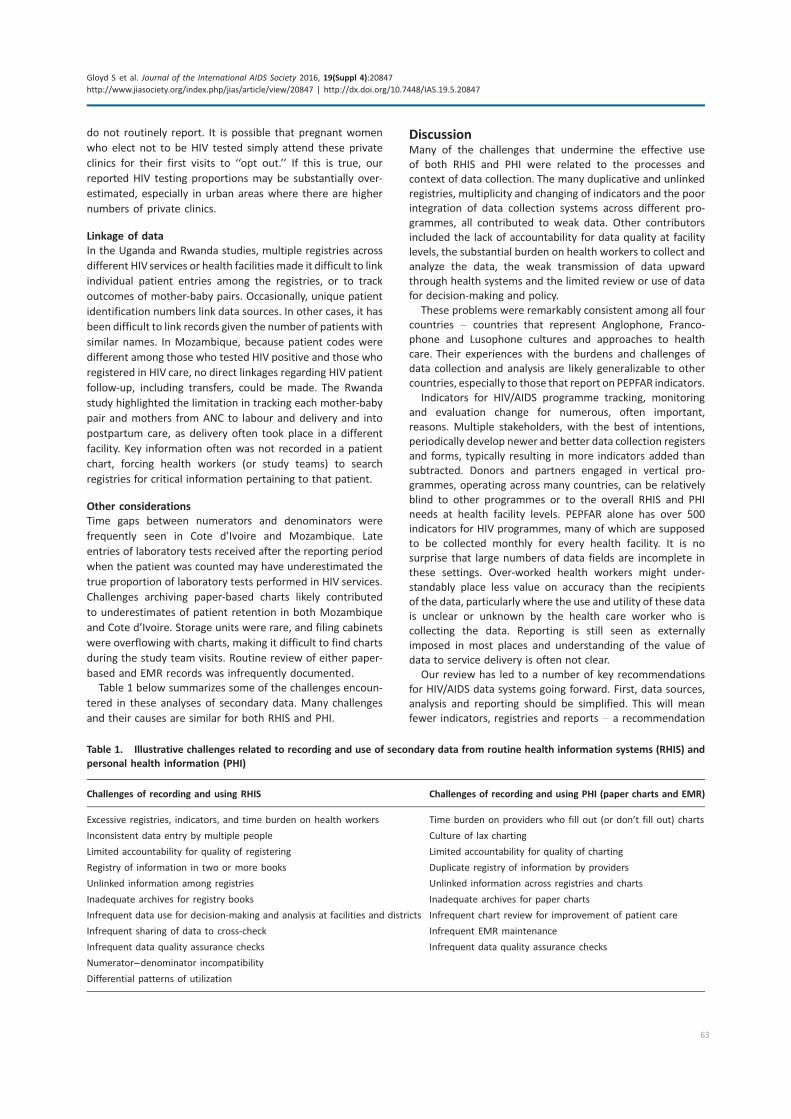
do not routinely report. It is possible that pregnant women
who elect not to be HIV tested simply attend these private
clinics for their first visits to ‘‘opt out.’’ If this is true, our
reported HIV testing proportions may be substantially over-
estimated, especially in urban areas where there are higher
numbers of private clinics.
Linkage of data
In the Uganda and Rwanda studies, multiple registries across
different HIV services or health facilitiesmade it difficult to link
individual patient entries among the registries, or to track
outcomes of mother-baby pairs. Occasionally, unique patient
identification numbers link data sources. In other cases, it has
been difficult to link records given the number of patients with
similar names. In Mozambique, because patient codes were
different among those who tested HIV positive and those who
registered in HIV care, no direct linkages regarding HIV patient
follow-up, including transfers, could be made. The Rwanda
study highlighted the limitation in tracking each mother-baby
pair and mothers from ANC to labour and delivery and into
postpartum care, as delivery often took place in a different
facility. Key information often was not recorded in a patient
chart, forcing health workers (or study teams) to search
registries for critical information pertaining to that patient.
Other considerations
Time gaps between numerators and denominators were
frequently seen in Cote d’Ivoire and Mozambique. Late
entries of laboratory tests received after the reporting period
when the patient was counted may have underestimated the
true proportion of laboratory tests performed in HIV services.
Challenges archiving paper-based charts likely contributed
to underestimates of patient retention in both Mozambique
and Cote d’Ivoire. Storage units were rare, and filing cabinets
were overflowing with charts, making it difficult to find charts
during the study team visits. Routine review of either paper-
based and EMR records was infrequently documented.
Table 1 below summarizes some of the challenges encoun-
tered in these analyses of secondary data. Many challenges
and their causes are similar for both RHIS and PHI.
DiscussionMany of the challenges that undermine the effective use
of both RHIS and PHI were related to the processes and
context of data collection. The many duplicative and unlinked
registries, multiplicity and changing of indicators and the poor
integration of data collection systems across different pro-
grammes, all contributed to weak data. Other contributors
included the lack of accountability for data quality at facility
levels, the substantial burden on health workers to collect and
analyze the data, the weak transmission of data upward
through health systems and the limited review or use of data
for decision-making and policy.
These problems were remarkably consistent among all four
countries � countries that represent Anglophone, Franco-
phone and Lusophone cultures and approaches to health
care. Their experiences with the burdens and challenges of
data collection and analysis are likely generalizable to other
countries, especially to those that report on PEPFAR indicators.
Indicators for HIV/AIDS programme tracking, monitoring
and evaluation change for numerous, often important,
reasons. Multiple stakeholders, with the best of intentions,
periodically develop newer and better data collection registers
and forms, typically resulting in more indicators added than
subtracted. Donors and partners engaged in vertical pro-
grammes, operating across many countries, can be relatively
blind to other programmes or to the overall RHIS and PHI
needs at health facility levels. PEPFAR alone has over 500
indicators for HIV programmes, many of which are supposed
to be collected monthly for every health facility. It is no
surprise that large numbers of data fields are incomplete in
these settings. Over-worked health workers might under-
standably place less value on accuracy than the recipients
of the data, particularly where the use and utility of these data
is unclear or unknown by the health care worker who is
collecting the data. Reporting is still seen as externally
imposed in most places and understanding of the value of
data to service delivery is often not clear.
Our review has led to a number of key recommendations
for HIV/AIDS data systems going forward. First, data sources,
analysis and reporting should be simplified. This will mean
fewer indicators, registries and reports � a recommendation
Table 1. Illustrative challenges related to recording and use of secondary data from routine health information systems (RHIS) and
personal health information (PHI)
Challenges of recording and using RHIS Challenges of recording and using PHI (paper charts and EMR)
Excessive registries, indicators, and time burden on health workers
Inconsistent data entry by multiple people
Limited accountability for quality of registering
Registry of information in two or more books
Unlinked information among registries
Inadequate archives for registry books
Infrequent data use for decision-making and analysis at facilities and districts
Infrequent sharing of data to cross-check
Infrequent data quality assurance checks
Numerator�denominator incompatibility
Differential patterns of utilization
Time burden on providers who fill out (or don’t fill out) charts
Culture of lax charting
Limited accountability for quality of charting
Duplicate registry of information by providers
Unlinked information across registries and charts
Inadequate archives for paper charts
Infrequent chart review for improvement of patient care
Infrequent EMR maintenance
Infrequent data quality assurance checks
Gloyd S et al. Journal of the International AIDS Society 2016, 19(Suppl 4):20847
http://www.jiasociety.org/index.php/jias/article/view/20847 | http://dx.doi.org/10.7448/IAS.19.5.20847
63
that the WHO highlighted in their 2015 Consolidated
Strategic Information Guidelines for HIV in the Health Sector
[30]. The WHO has advocated for only 10 global indicators
and a total of 50 targeted indicators at the national level.
Achieving this would require stakeholders involved in
different programmes to spend substantial time together
coordinating indicators, with an eye on the diverse demands
of health facility staff, and to work out broad-based RHIS
and EMR that can function across programmes and settings.
Furthermore, all stakeholders should work to minimize fre-
quent changes to established indicators. When indicators
are changed, those enacting changes should clearly describe
how these changes might impact the continuity of tracking
key indicators over time � or provide guidance on how to
maintain optimal indicator continuity.
Second, collaborative RHIS data audits should be built into
the overall system to determine the magnitude of data
reporting failure, guide site-specific improvements in data
management and involve those who generate facility-level
data in understanding their own data. Data quality audits
and participatory data-use interventions have been carried out
across many countries with proven success � not only
improving accuracy and completeness of RHIS and PHI, but
also enhancing the value and use of data for quality improve-
ment [31,32]. Routine data review meetings, patient chart
review and use of data dashboards have been shown to be
effective to increase data quality, ownership and use of data
for decision-making [33,34]. Major efforts have been carried
out in many countries to improve district- and facility-level
data, including implanting open source software for district
health information systems (DHIS2) [35�39]. However, sys-tems such as DHIS2 have only been effectively nationalized in a
few countries [40]. More often, DHIS2 has been implemented
at sub-national levels with the support of donors and NGOs,
without strong support from the central Ministry level [41].
It is unclear if innovative approaches that are primarily
implemented by external entities will solve the fundamental
issues we identified, especially the excessive indicators, ability
to link data, lack of involvement of health staff in data use
and quality assurance data generated at the facility level.
Without central Ministry of Health coordination, the issues we
highlighted above around linkages of data may only be
exacerbated by a patchwork of data systems and indicators
across clinics or districts. All stakeholders � national policy-
makers, facility staff, district and provincial managers, funders
and implementing partners � should ensure substantial
HIV-related funds are dedicated to ensuring that these data-
related activities are seen as an essential element of the
overall Primary Health Care system.
Last, RHIS and PHI generated by government, donors and
partners should be widely accessible, and where possible,
open source, to ensure that the data are consistent, reviewed
and appropriately analyzed by all stakeholders to drive data-
driven decision-making. As these data are often the only data
sources which are actionable at the district and health facility
levels, increased investments in these systems are necessary
for quality improvement. The current situation, whereby RHIS
and PHI are not openly available for secondary analyses, limits
their use and continues the status quo whereby most analyses
use infrequent community surveys, which fail to provide
health facility or district data where action is needed. It has
been demonstrated that RHIS data can be paired with
community surveys or other HIV-related data sources to
estimate who is currently being missed by targeted facility-
based ART delivery [30]. Innovative efforts to improve health
facility catchment area estimation can also help target
investments to areas with high HIV burden and low ART
coverage [31]. With increased access, such methods to pair
RHIS and PHI data with community sample surveys and/or
census data could also help understand which areas of the
health system are failing to reach a representative sample of
those testing HIV positive.
ConclusionsRHIS and PHI data provide substantial opportunities for
investigators, health workers and policymakers to understand
health service coverage and use data for real-time health
system decision-making. However, the poor and/or variable
data quality of RHIS and PHI, along with frequent changes
in indicators, difficulties in linking individual-level data over
time and data sources, and differential service utilization, all
present considerable challenges for analysis and use of these
data to improve HIV programmes. Based on our review, we
recommend concerted efforts by all stakeholders to simplify
indicators, routine reporting and data collection efforts along
with focused efforts to maintain key indicators unchanged
over time to allow easy monitoring of programme success or
failure. These simplified data sources should undergo routine
data quality audits and chart reviews, paired with the explicit
engagement of health workers and managers in the use of
data for analysis and decision-making. With these invest-
ments, and the continued expansion of data availability
through the open-access movement, RHIS and PHI data will
be more widely available and useful for high-quality monitor-
ing and evaluation of HIV-related programmes at the health
facility, district, national, and international policymaker levels.
Authors’ affiliations1Department of Global Health, University of Washington, Seattle, WA,
USA; 2Health Alliance International, Seattle, WA, USA; 3Elizabeth Glaser
Pediatric AIDS Foundation, Washington, DC, USA; 4HIVCore/Population Council,
Washington, DC, USA
Competing interests
None
Authors’ contributions
SG conceived and wrote the first draft of the manuscript. SG and BHW revised
and finalized this manuscript. SK and GW contributed data, reviewed and
commented on this manuscript. All authors have read and approved the final
version.
Acknowledgements and funding
This study was made possible through support provided by the President’s
Emergency Plan for AIDS Relief and the U.S. Agency for International
Development (USAID) via HIVCore, a Task Order funded by USAID under the
Project SEARCH indefinite quantity contract (Contract No. AID-OAA-TO-11-
00060). The Task Order is led by the Population Council in partnership with the
Elizabeth Glaser Pediatric AIDS Foundation, Palladium and the University of
Washington. The research was also supported by NIAID, NCI, NIMH, NIDA,
NICHD, NHLBI, NIA, NIGMS and NIDDK of the National Institutes of Health
under award number AI027757.
Disclaimer
The authors’ views expressed in this manuscript do not necessarily reflect the
views of USAID, NIH or the US government.
Gloyd S et al. Journal of the International AIDS Society 2016, 19(Suppl 4):20847
http://www.jiasociety.org/index.php/jias/article/view/20847 | http://dx.doi.org/10.7448/IAS.19.5.20847
64
References
1. World Health Organization. Progress report of the implementation of the
global strategy for prevention and control of sexually transmitted infections:
2006�2015. Geneva: World Health Assembly; 2015.
2. World Health Organization. Framework and standards for country health
information systems. 2nd ed. Geneva, Switzerland: Health Metrics Network
and the World Health Organization; 2008.
3. Wagenaar BH, Kenneth Sherr K, Fernandes Q, Wagenaar AC. Using routine
health information systems for well-designed health evaluations in low-
and middle-income countries. Methodological musings. Health Policy Plann.
2015;1:1�7. doi: http://dx.doi.org/10.1093/heapol/czv0294. Mutale W, Chintu N, Amoroso C, Awoonor-Williams K, Phillips J, Baynes C,
et al. Improving health information systems for decision making across five
sub-Saharan African countries: implementation strategies from the African
Health Initiative. BMC Health Serv Res. 2013;13(Suppl 2):S9.
5. AbouZahr C, Boerma T. Health information systems: the foundations of
public health. Bull World Health Organ. 2005;83:578�83.6. UNAIDS. 90-90-90-An ambitious treatment target to help end the AIDS
epidemic. UNAIDS/JC26 84 (English original, October 2014) [Internet]. Avail-
able from: http://www.unaids.org/en/resources/documents/2014/90-90-90
7. WHO, Department of HIV/AIDS. Guideline on when to start antiretroviral
therapy and on pre-exposure prophylaxis for HIV [Internet]. 2015 [cited 2015
Nov 6]. Available from: http://apps.who.int/iris/bitstream/10665/186275/1/
9789241509565_eng.pdf
8. Office of the U.S. Global AIDS Coordinator. PEPFAR 3.0. � controlling the epi-
demic and delivering on the promise of an AIDS free generation [Internet]. 2014
Dec. Available from: http://www.pepfar.gov/documents/organization/234744.pdf
9. Mamlin BW, Biondich PG. AMPATH Medical Record System (AMRS):
collaborating Toward an EMR for developing countries. AMIA 2005 Symposium
Proceedings; 2005 Nov 14�18. p. 490�4.10. Oluoch T, Santas X, Kwaro D, Were M, Biondich P, Bailey C, et al. The
effect of electronic medical record-based clinical decision support on HIV care
in resource-constrained settings: a systematic review. Int J Med Inform.
2012;81(10):83�92.11. Chanda E, Coleman M, Kleinschmidt I, Hemingway J, Hamainza B,
Masaninga F, et al. Impact assessment of malaria vector control using routine
surveillance data in Zambia: implications for monitoring and evaluation. Malar
J. 2012;11:437.
12. Verguet S, Jassat W, Bertram M, Tollman SM, Murray CJL, Jamison DT, et al.
Impact of supplemental immunization activity (SIA) campaigns on health systems:
findings from South Africa. J Epidemiol Community Health. 2013;67:947�52.13. The Global Fund to Fight AIDS, Tuberculosis, and Malaria. Global Fund
five-year evaluation: study area 3 � the impact of collective efforts on the
reduction of the disease burden of AIDS, tuberculosis, and malaria. Calverton,
MD: Macro International; 2009.
14. Hazel E, Requeko J, David J, Bryce J. Measuring coverage in MNCH:
evaluation of community-based treatment of childhood illness through
household surveys. PLoS Med. 2013;10:e1001384.
15. Ronveaux O, Rickert D, Hadler S, Groom H, Lloyd J, Bchir A, et al. The
immunization data quality audit: verifying the quality and consistency of
immunization monitoring systems. Bull World Health Organ. 2005;83:503�10.16. Lim SS, David SB, Charrow A, Murray CJL. Tracking progress towards
universal childhood immunisation and the impact of global initiatives: a
systematic analyses of three-dose diphtheria, tetanus, and pertussis immunisa-
tion coverage. Lancet. 2008;372:2031�46.17. Bosch-Capblanch X, Ronveau O, Doyle V, Remedios V, Bchir A. Accuracy
and quality of immunization information systems in forty-one low income
countries. Trop Med Int Health. 2009;14:2�10.18. Wagenaar BH, Gimbel S, Hoek R, Pfeiffer J, Michel C, Manuel J, et al. Effects
of a health information system data quality intervention on concordance in
Mozambique: time-series analyses from 2009�2012. Popul Health Metr.
2015;13:9. doi: http://dx.doi.org/10.1186/s12963-015-0043-3
19. Ledikwe J, Gringnon J, Lebelonyane R, Ludick S, Matshediso E, Sento BW, et al.
Improving the quality of health information: a qualitative assessment of data man-
agement and reporting systems in Botswana. Health Res Policy Syst. 2014;12:7.
20. Cibulskis RE, Hiawalyer G. Information systems for health sector monitor-
ing in Papua New Guinea. Bull World Health Organ. 2002;80:752�8.21. Braa J, Heywood A, Sahay S. Improving quality and use of data through
data-use workshops: Zanzibar, United Republic of Tanzania. Bull World Health
Organ. 2012;90:379�84.
22. Mphatswe W, Mate KS, Bennett B, Ngidi H, Reddy J, Barker PM, et al.
Improving public health information: a data quality intervention in
KwaZulu-Natal, South Africa. Bull World Health Organ. 2012;90:176�82.23. Admon AJ, Bazile J, Makungwa H, Chingoli MA, Hirschhorn LR, Peckarsky
M, et al. Assessing and improving data quality from community health workers:
a successful intervention in Neno, Malawi. Public Health Action. 2013;3:56�9.24. Granato SA, Gloyd S, Robinson J, Dali SA, Ahoba I, Aka D, et al. Results from
a rapid national assessment of services for the prevention of mother-to-child
transmission of HIV in Cote d’Ivoire. J Int AIDS Soc. 2016;19:20838, doi: http://
dx.doi.org/10.7448/IAS.19.5.20838
25. Woelk G, Ndatimana D, Behan S, Mukaminega M, Nyirabahizi E, Hoffman
HJ, et al. Retention of mothers and infants in the prevention of mother-to-child
transmission of HIV program is associated with individual and facility-level
factors in Rwanda. J Int AIDS Soc. 2016;19:20837, doi: http://dx.doi.org/10.
7448/IAS.19.1.20837
26. Vu L,Waliggo S, Zieman B, Jani N, Buzaalirwa L, Okoboi S, et al. Annual cost
of antiretroviral therapy (ART) across three service delivery models in Uganda:
implications for the 2015 WHO guidelines on treating all people with HIV. J Int
AIDS Soc. 2016;19:20840, doi: http://dx.doi.org/10.7448/IAS.19.1.20840
27. Kalibala S, Okal J, Zieman B, Jani N, Vu L, Ssali L, et al. Retrospective review
of task-shifting community-based programs supporting ARV treatment and
retention in Uganda. HIVCore Final Report. Washington, DC: USAIDjProjectSearch: HIVCore; 2016.
28. Inguane CA, Gloyd S, Manuel JL, Brown C, Wong V, Augusto O, et al.
Assessment of linkages from HIV testing to enrollment and retention in HIV
care in central Mozambique. J Int AIDS Soc. 2016;19:20846, doi: http://dx.doi.
org/10.7448/IAS.19.5.20846
29. PEPFAR. Mozambique Country Operational Plan FY [Internet]. 2014. [cited
2015 Mar 3]. Available from: http://www.pepfar.gov/documents/organization/
240261.pdf
30. WHO. Consolidated strategic information guidelines for HIV in the
health sector [Internet]. ISBN 978 92 4 150875 9. World Health Organization.
2015. Available from: http://apps.who.int/iris/bitstream/10665/164716/1/
9789241508759_eng.pdf?ua.�1&ua�;1
31. Gimbel S, Micek M, Lambdin B, Lara J, Karagianis M, Cuembelo F, et al.
An assessment of routine primary care health information system data quality
in Sofala Province, Mozambique. Popul Health Metr. 2011;9:12.
32. Adaletey DL, Jolliffe B, Braa J, Ofosu A. Peer-performance review as a
strategy for strengthening health in-formation systems: a case study from
Ghana. J Health Inform Afr. 2015;2(2):21�7.33. Sherr K, Cuembelo F, Michel C, Gimbel S, Micek M, Kariaganis M, et al.
Strengthening integrated primary health care in Sofala, Mozambique. BMC
Health Serv Res. 2013;13(Suppl 2):S4.
34. Lambdin BH, Micek MA, Sherr K, Gimbel S, Karagianis M, Lara J, et al.
Integration of HIV care and treatment in primary health care centers and
patient retention in central Mozambique: a retrospective cohort study. J Acquir
Immune Defic Syndr. 2013;62(5):e146�52.35. Mate KS, Bennett B, MphatsweW, Barker P, Rollins N. Challenges for routine
health system data management in a large public programme to prevent
mother-to-child HIV transmission in South Africa. PLoS One. 2009;4:e5483.
36. Iyer HS, Kamanzi E, Mugunga JC, Finnegan K, Uwingabiye A, Shyaka E, et al.
Improving district facility readiness: a 12-month evaluation of a data-driven
health systems strengthening intervention in rural Rwanda. Glob Health Action.
2015;8:28365, doi: http://dx.doi.org/10.3402/gha.v8.28365
37. Mutemwa RI. HMIS and decision-making in Zambia: re-thinking informa-
tion solutions for district health management in decentralized health systems.
Health Policy Plann. 2006;21(1):40�52.38. Nutley T, Gnassou L, Traore M, Bosso AE, Mullen S. Moving data off the
shelf and into action: an intervention to improve data-informed decision
making in Cote d’Ivoire. Glob Health Action. 2014;7:25035, doi: http://dx.doi.
org/10.3402/gha.v7.25035
39. Doherty T, Chopra M, Nsibande D, Mngoma D. Improving the coverage of
the PMTCT programme through a participatory quality improvement interven-
tion in South Africa. BMC Public Health. 2009;9(1):406.
40. Ishijima H, Mapunda M, Mndeme M, Sukums F, Mlay VS. Challenges and
opportunities for effective adoption of HRH information systems in developing
countries: national rollout of HRHIS and TIIS in Tanzania. Hum Resour Health.
2015;13(1):48.
41. Staring K, Titlestad O. Networks of open source health care action. In: In
Open Source Systems. Springer; 2006. p. 135�141. Produced by ‘‘Networks of
Open Source Health Care Action.’’ University of Oslo, Department of
Informatics.
Gloyd S et al. Journal of the International AIDS Society 2016, 19(Suppl 4):20847
http://www.jiasociety.org/index.php/jias/article/view/20847 | http://dx.doi.org/10.7448/IAS.19.5.20847
65
Commentary
Experiences in implementation and publication of operations
research interventions: gaps and a way forward
Samuel Kalibala§,1, Godfrey B Woelk2, Stephen Gloyd3, Nrupa Jani1, Lynnette Kay4, Avina Sarna1, Jerry Okal1,
Charity Ndwiga1, Nicole Haberland1 and Irit Sinai5
§Corresponding author: Samuel Kalibala, HIVCore/Population Council, 4301 Connecticut Avenue, NW, Suite 280, Washington, DC 20008, USA. Tel: �202 237 9406.
Abstract
Introduction: According to UNAIDS, the world currently has an adequate collection of proven HIV prevention, treatment and
diagnostic tools, which, if scaled up, can lay the foundation for ending the AIDS epidemic. HIV operations research (OR) tests and
promotes the use of interventions that can increase the demand for and supply of these tools. However, current publications of
OR mainly focus on outcomes, leaving gaps in reporting of intervention characteristics, which are essential to address for the
utilization of OR findings. This has prompted WHO and other international public health agencies to issue reporting requirements
for OR studies. The objective of this commentary is to review experiences in HIV OR intervention design, implementation, process
data collection and publication in order to identify gaps, contribute to the body of knowledge and propose a way forward to
improve the focus on ‘‘implementation’’ in implementation research.
Discussion: Interventions in OR, like ordinary service delivery programmes, are subject to the programme cycle, which continually
uses insights from implementation and the local context to modify service delivery modalities. Given that some of these
modifications in the interventionmay influence study outcomes, the documentation of process data becomes vital in OR. However,
a key challenge is that study resources tend to be skewed towards documentation and the reporting of study outcomes to the
detriment of process data, even though process data is vital for understanding factors influencing the outcomes.
Conclusions: Interventions in OR should be viewed using the lens of programme evaluation, which includes formative assessment
(to determine concept and design), followed by process evaluation (tomonitor inputs and outputs) and effectiveness evaluation (to
assess outcomes and effectiveness). Study resources should be equitably used between process evaluation and outcome
measurement to facilitate inclusion of data about fidelity and dose in publications in order to enable explanation of the relationship
between dosing and study outcomes for purposes of scaling up and further refinement through research.
Keywords: operations research; implementation research; intervention fidelity; process evaluation; intervention publication.
Received 25 November 2015; Revised 29 April 2016; Accepted 9 May 2016; Published 20 July 2016
Copyright: – 2016 Kalibala S et al; licensee International AIDS Society. This is an Open Access article distributed under the terms of the Creative Commons
Attribution 3.0 Unported (CC BY 3.0) License (http://creativecommons.org/licenses/by/3.0/), which permits unrestricted use, distribution, and reproduction in any
medium, provided the original work is properly cited.
IntroductionHIV operations research (OR) has been defined as a process of
identifying and solving programme problems with the goal of
increasing the efficiency, effectiveness, quality, availability,
accessibility and acceptability of services [1]. In 2008, The
Global Fund to Fight AIDS, Tuberculosis and Malaria, United
States Agency for International Development (USAID), World
Health Organization (WHO), Joint United Nations Programme
on HIV/AIDS (UNAIDS) and the World Bank published a
framework for HIV operations and implementation research
[2].That publication states that OR represents implementation
research and is defined as any research producing practically
usable knowledge that can improve programme implementa-
tion regardless of the type of research design, methodology or
approach.
Building on this definition, PEPFAR’s implementation
science (IS) framework describes IS as the study of methods
to improve the uptake, implementation and translation of
research findings into routine and common practices [3]. Thus,
although terminology referring to implementation or OR
may vary depending on the context, the main intent is to
examine health systems management and sociocultural,
economic and behavioural factors that either exist as bottle-
necks or that could be tested to improve service delivery and
uptake [2].
According to UNAIDS, the world currently has a good
collection of proven HIV prevention, treatment and diagnostic
tools, which, if scaled up, can lay the foundation for ending the
AIDS epidemic [4]. The effectiveness of these tools is often
dependent on a number of operational issues on the demand
side (e.g., the health care-seeking behaviour of the target
audience and sociocultural and contextual barriers) and the
supply side (e.g., setting, providers and supplies) [5]. For
example, to ensure the efficient use of HIV-testing, operational
issues can be addressed by evaluating various HIV-testing
approaches, such as routine testing versus voluntary testing,
and the outcomes can vary according to purpose and target
population [6,7].
Kalibala S et al. Journal of the International AIDS Society 2016, 19(Suppl 4):20842
http://www.jiasociety.org/index.php/jias/article/view/20842 | http://dx.doi.org/10.7448/IAS.19.5.20842
66
Given the need to enhance effectiveness of a broad range of
tools in a variety of contexts, OR uses a wide range of
methodologies, often making it difficult to have uniform
reporting in publications. As away of addressing this challenge,
the Bulletin of the World Health Organization established
guidelines for reporting on OR, which include intervention
frequency, duration and intensity [8]. Similarly, the UKMedical
Research Council recently published guidance on conducting
and reporting on studies testing public health interventions,
recommending that studies provide data on intervention
implementation, including provider training, fidelity, dose
and adaptation [9].
However, the collection and reporting of process data may
sometimes be seen as being in conflict with or a duplication
of efforts to measure outcomes [9]. One approach that can
ensure that the focus owed to intervention implementation
is not lost is to view the study using the lens of programme
evaluation, which includes formative assessment (to deter-
mine concept and design), followed by process evaluation
(to monitor inputs and outputs) and effectiveness evaluation
(to assess outcomes and effectiveness) [10]. Indeed, if
researchers anticipate analyzing outcome data stratified by
intervention exposure, they should pay more attention
to how intervention process data is collected and reported
[11].
The objective of this commentary is to review experiences
in HIV OR intervention design, implementation, process data
collection and publication in order to identify gaps, con-
tribute to the body of knowledge and propose a way forward
for improving the focus on ‘‘implementation’’ in implementa-
tion research. The purpose is to emphasize the need to
devote as much time and resources to the intervention as are
given to outcome measurement.
DiscussionFormative research
Given the diversity of the context in which real-life public
health interventions are applied, it is important not to
transfer interventions from one setting to another without
adaptation based on formative research [12]. Formative
research is usually carried out using qualitative methodolo-
gies among potential service recipients, potential providers
and other stakeholders, as well as a review of retrospective
statistics and epidemiological and behavioural data.
Formative research enables understanding of the nature of
the problem and the programme responses to address it
[1,13,14] and determination of the priority target population
[15,16], as well as assessing their needs and perceptions
regarding the problem and the proposed intervention.
Formative research also fosters an understanding of how the
new intervention will be introduced into existing services
[6,17,18], the potential role of various actors in delivering
the intervention and additional elements required for the
intervention [19].
Piloting the intervention
Pilot testing is a key component of intervention design in HIV
OR because it enables the determination of the feasibility of
the intervention and its acceptability to providers and clients,
thus facilitating adaptation.
To start, a cross-section of providers and clients can be asked
to comment on the intervention materials. Next, the service
should be offered on a small scale to obtain provider and client
feedback [14]. There is also a need to be flexible and open-
minded to accommodate contextual issues, including resource
constraints while, at the same time, ensuring that the core
elements of the intervention are retained [17]. Although the
retention of core elements is vital to ensure that the
intervention can be replicated and scaled up in other settings
[20], there is always a tension between the need for
standardization of the intervention versus the need to be
flexible and adapt the intervention based on findings from
pilot testing [17].
Integration and training
When conducting OR, systematic efforts are required to
ensure that new interventions are tailored to the realities of
local settings [21] and ensure acceptance by existing providers
[22]. This process could involve meetings with government
authorities, managers, providers and other stakeholders to
create awareness and ownership of the planned OR, work
out operational issues and clarify roles among the providers
[3,23�25].In addition, the integration of a new intervention must
involve training the existing providers in the delivery of the
intervention according to procedures and curricula devel-
oped or adapted using formative findings [21,26]. After the
study is completed, intervention training manuals, as well as
videos and other written materials, should be finalized and
made accessible to policy makers, programme developers
and researchers [27].
In a systematic review of integration of sexual and
reproductive health and HIV services, it was reported that
integration showed positive effects on HIV incidence, sexually
transmitted infections incidence, condom use, the uptake of
HIV testing and quality of services. Facilitating factors included
stakeholder involvement, capacity building and positive staff
attitudes. Inhibiting factors included lack of stakeholder
commitment and inadequate staff training, thus highlighting
gaps in stakeholder engagement and staff training [28].
Intervention dose
Using inputs from formative research, pilot testing and the
process of integration, the ‘‘dose’’ of the intervention, such as
the number of counselling sessions, may be developed or
refined. In addition, standard operating procedures (SOPs) of
service delivery are developed to ensure that the intervention
is delivered as planned [14,19,29]. Low-intervention exposure
has been proposed as one of the reasons for ‘‘flat’’ results in
intervention trials despite a strong theoretical basis for the
potential impact of an intervention [3,29,30]. Thus, it becomes
important that studies accurately report intervention expo-
sure. Owing to inconsistency in the reporting of intervention
doses, a group of authors have proposed a standardized
terminology for intervention dosing, including duration,
frequency and amount, that should be used for reporting [27].
In a meta-analytic review of 19 studies of highly active
antiretroviral therapy (HAART) adherence interventions, the
Kalibala S et al. Journal of the International AIDS Society 2016, 19(Suppl 4):20842
http://www.jiasociety.org/index.php/jias/article/view/20842 | http://dx.doi.org/10.7448/IAS.19.5.20842
67
number of intervention sessions and their durations varied
widely. However, even though overall the interventions were
effective in increasing adherence and reducing viral load, there
was no difference in outcome by dose [31]. A review of
24 antiretroviral therapy (ART) adherence studies of the
interventions also showed an overall positive effect on self-
reported adherence, but no variation by duration of exposure.
These reviewers were disappointed that the authors did not
publish sufficient information about intervention character-
istics to enable further exploration of factors beyond duration
of exposure [32].
A similar finding was observable in a meta-analysis evaluat-
ing the efficacy of HIV behavioural interventions among
African-American women, in which it was noted that the
efficacy did not differ by the number of sessions. The authors
suggested that the success of such interventions may depend
more on the intervention components and quality than on the
number of sessions [33]. However, in one study among
HIV-positive women, it was observed that women who
attended eight or more sessions of the intervention reported
higher ART adherence [34]. Thus, gaps in reporting of
intervention characteristics make it difficult to meaningfully
assess the role of the intervention dose and other factors in the
outcomes observed. Such an assessment requires detailed
process data because the intervention dosemay be affected by
a multiplicity of aspects. This includes internal factors, such as
fidelity, as well as external factors in the target community and
beyond, among them an enabling environment and such issues
as the weather, politics or population migrations [35].
Uptake and coverage
Though the ultimate purpose of OR may be to determine the
outcome of the intervention, it is important that process data
is collected to determine the proportion of the targeted
population that used the intervention. If the study is measur-
ing outcomes of the intervention among clients receiving a
clinic service, the proportion of clients who partook of the
intervention among those who attended the clinic could serve
as a good measure of intervention uptake and reach [19].
However, if the study is interested in community-level impact,
coverage would be a more appropriate measure, and it could
be assessed against a denominator of the estimated size of the
target population, such as the number of drug users in a city
[36] or the number of HIV-positive pregnant women in a
district [6].
Fidelity
Fidelity is the extent to which the provider delivers the
intervention according to the set SOPs. Fidelity can be
measured using client interaction forms[31,32], observation
of selected client provider interaction sessions [14], inter-
views of providers and clients and the use of mystery clients.
In a behavioural programme targeting young people, fidelity
was measured using a telephone survey of providers.
The results showed varying levels of fidelity. Time constraints
were commonly cited as reasons for dropping core elements
[37]. In one study of a clinician-delivered HIV risk-reduction
intervention, fidelity was measured through clinician self-
reports and client exit interviews; it was observed that there
was a convergence of opinion between clinicians and patients
that only 73% of the intervention was delivered. Other
pressing medical priorities are the main explanation for the
failure to deliver 100% of the intervention. In spite of the less-
than-perfect fidelity, the intervention was effective in reducing
high-risk sexual behaviour [22].
In a systematic review of HIV-prevention interventions for
young people, most of which were delivered by either
teachers, peers or media, no positive effects of the interven-
tion were observed. This was attributed to implemen-
tation barriers, including disorganized school schedules and
the reluctance of teachers to discuss condoms. The authors
recommended devoting more effort to studying imple-
mentation difficulties and the determinants of exposure to
intervention [11].
Indeed, positive attitudes of providers are important to
ensure fidelity. In an evaluation of the factors affecting
fidelity in a school HIV education intervention, it was
observed that teachers’ comfort with the HIV curriculum
was the most important predictor of fidelity to the pro-
gramme [38]. When assessing the rollout of evidence-based
HIV prevention interventions, it was observed that the main
factors hindering fidelity were a lack of adequate funding,
staff and other resources [35,39]. In one study evaluating
antenatal care counselling, 203 counselling sessions were
observed, and it was reported that counselling sessions were
shorter and conveyed fewer messages than required in the
SOPs of the intervention [24], emphasizing the need to assess
what was delivered versus what was supposed to be
delivered [27].
ConclusionsInterventions in OR, like ordinary service delivery programmes,
are subject to the programme cycle, which continually uses
insights from implementation and from the local context to
modify service delivery modalities. Given that some of these
modifications in the intervention may influence study out-
comes, the documentation of process data becomes vital for
understanding factors influencing the outcomes. However, a
key issue is that study resources appear to be skewed towards
the measurement of baseline and end-line, often relying on
the use of routine service delivery statistics for process data
[17]. It is also a reality that service delivery in low-resourced
settings is plagued by the endemic lack of adequate funding,
staff and other resources [5,39,35], resulting in serious gaps in
routine data making the data difficult to use in research [40].
OR study protocols should include plans and budgets for
process data collection, in addition to baseline and end-line
surveys, and not rely only on service delivery statistics [16].
Since the purpose of OR is to test and roll out interventions
that enhance the efficient use of proven tools for HIV
prevention (e.g., condoms), treatment (e.g., ARVs) and
diagnosis (e.g., HIV tests), it is incumbent upon the research
team to document and publish the processes and materials
used in implementation. This will help answer the questions:
‘‘If it worked, what worked?’’ and ‘‘How can it be replicated?’’
Intervention materials are an important legacy of a good OR
study. Mechanisms for accessing these materials, preferably
via the Internet, should be clearly stated in the outcome
publication of such a study.
Kalibala S et al. Journal of the International AIDS Society 2016, 19(Suppl 4):20842
http://www.jiasociety.org/index.php/jias/article/view/20842 | http://dx.doi.org/10.7448/IAS.19.5.20842
68
Authors’ affiliations1HIVCore/Population Council, Washington, DC, USA; 2Elizabeth Glaser Pediatric
AIDS Foundation, Washington, DC, USA; 3Department of Global Health,
University of Washington, Seattle, WA, USA; 4Retrak Ethiopia, Addis Ababa,
Ethiopia; 5Palladium, Washington DC, USA
Competing interests
All the authors are investigators on various operations research and
programme evaluation studies under the USAID-funded HIVCore project. All
the authors declare interest in ensuring that operations research studies have
well-documented intervention development processes.
Authors’ contributions
SK wrote the first draft of the paper. The rest of the authors reviewed the
various drafts and gave inputs, and SK collated their inputs and produced
subsequent drafts of the paper. All authors have read and approved the final
version.
Acknowledgements
The following people are acknowledged for the role they played in reviewing
the study protocol and the paper: S. Sandison and G. Post from USAID; and
N. Rutenberg and W. Tun from the Population Council. We are also thankful to
S. Hutchinson of the Population Council, who had the unenviable task of
coordinating the comments of various reviewers and responses of the authors
throughout the various drafts of this paper.
Funding
This study was made possible through support provided by the President’s
Emergency Plan for AIDS Relief (PEPFAR) and USAID via HIVCore, a Task Order
funded by USAID under the Project SEARCH indefinite quantity contract
(Contract No. AID-OAA-TO-11-00060). The Task Order is led by the Population
Council in partnership with the Elizabeth Glaser Pediatric AIDS Foundation,
Palladium, and the University of Washington. The authors’ views expressed in
this manuscript do not necessarily reflect the views of USAID or the United
States Government.
References
1. Fisher AA, Foreit JR, Laing J, Stoeckel J, Townsend J. Designing HIV/AIDS
intervention studies: an operations research handbook. Washington, DC:
Population Council; 2002.
2. The Global Fund to Fight AIDS, Tuberculosis and Malaria, United States
Agency for International Development (USAID), World Health Organization
(WHO), Special Program for Research and Training in Tropical Diseases, Joint
United Nations Program on HIV/AIDS (UNAIDS), The World Bank. Framework
for operations and implementation research in health and disease control
programs. Geneva, Switzerland: The Global Fund to Fight Aids, Tuberculosis
and Malaria, 2008.
3. Padian NS, Holmes CB, McCoy SI, Lyerla R, Bouey PD, Goosby EP.
Implementation science for the US President’s Emergency Plan for AIDS Relief
(PEPFAR). J Acquir Immune Defic Syndr. 2011;56(3):199�203.4. UNAIDS report on the global AIDS epidemic 2013. Joint United Nations
Programme on HIV/AIDS (UNAIDS) Geneva, Switzerland; 2013.
5. Plotkin M, Besana GVR, Yuma S, Kim YM, Kulindwa Y, Kabole F, et al.
Integrating HIV testing into cervical cancer screening in Tanzania: an analysis of
routine service delivery statistics. BMC Women’s Health. 2014;14:120.
6. Creek TL, Ntumy R, Seipone K, Smith M, Mogodi M, Smit M, et al. Successful
introduction of routine opt-out HIV testing in antenatal care in Botswana.
J Acquir Immune Defic Syndr. 2007;45(1):102�7.7. Bakari JP, McKenna S, Myrick A, Mwinga K, Bhat JG, Allen S. Rapid voluntary
testing and counseling for HIV: acceptability and feasibility in Zambian
antenatal care clinics. Ann N Y Acad Sci. 2000;918:64�76.8. Hales S, Lesher-Trevino A, Ford N, Maher D, Ramsay A, Tran N. Reporting
guidelines for implementation and operational research. Bull World Health
Organ. 2016;94:58�64.9. Moore GF, Audrey S, Barker M, Bond L, Bonell C, Hardeman W, et al. Process
evaluation of complex interventions: Medical Research Council guidance. BMJ
2015;350:h1258. doi: http://dx.doi.org/10.1136/bmj.h1258
10. Rehle T, Saidel T, Mills S, Magnani R, Rodgers AB. Evaluating programs for
HIV/AIDS prevention and care in developing countries. FHI: Family Health
International (FHI). Washington DC, USA; 2001.
11. Michielsen K, Chersicha MF, Luchtersa S, De Kokera P, Van Rossemb R,
Temmerman M. Effectiveness of HIV prevention for youth in sub-Saharan
Africa: systematic review and meta-analysis of randomized and nonrandomized
trials. AIDS. 2010;24:1193�202.12. Wingood GM, DiClemente RJ. The ADAPT-ITT model: a novel method of
adapting evidence-based HIV interventions. J Acquir Immune Defic Syndr.
2008;47:S40�6.13. Jani N, Schenk K. Formative research to develop an intervention for
addressing mental health/psychosocial issues and HIV vulnerability of
marginalized adolescents in Addis Ababa, Ethiopia. HIVCore Formative Report.
Washington, DC: USAID j Project Search: HIVCore; 2014.14. Baptiste D, Bhana A, Petersen I, McKay M, Voisin D, Bell C, et al.
Community collaborative youth-focused HIV/AIDS prevention in South Africa
and Trinidad: preliminary findings. J Pediatr Psychol. 2006;31(9):905�16.15. Idoko J, Folayan MO, Dadem NY, Kolawole GO, Anenih J, Alhassan E.
‘‘Why should I take drugs for your infection?’’: outcomes of formative research
on the use of HIV pre-exposure prophylaxis in Nigeria. BMC Public Health.
2015;15:349.
16. Higgins D, O’Reilly K, Tashima N, Crain C, Beeker C, Galdbaum G, et al.
Using formative research to lay the foundation for community level HIV
prevention efforts: an example from the AIDS Community Demonstration
Projects. Public Health Rep. 1996;111(Suppl 1):28�35.17. Kim J, Gear J, Hargreaves J, Makhubele BM, Mashaba K, Morison L, et al.
Social interventions for HIV/AIDS intervention with microfinance for AIDS and
gender equity. IMAGE study monograph no. 2. Acornhoek, South Africa: Rural
AIDS and Development Action Research Program; 2002.
18. Rhodes SD, Malow R, Jolly C. Community-Based Participatory Research
(CBPR): a new and not-so-new approach to HIV/AIDS prevention, care, and
treatment. AIDS Educ Prev. 2010;22(3):173�83.19. Bhana A, Mellins CA, Petersen I, Alicea S, Myeza N, Holst H, et al. The VUKA
family program: piloting a family-based psychosocial intervention to promote
health and mental health among HIV infected early adolescents in South
Africa. AIDS Care. 2014;26(1):1�11. doi: http://dx.doi.org/10.1080/09540121.2013.806770
20. Kalichman SC, Hudd K, DiBerto G. Operational fidelity to an evidence-
based HIV prevention intervention for people living with HIV/AIDS. J Prim Prev.
2010;31(4):235�45.21. Howard AA, El-Sadr WM. Integration of tuberculosis and HIV services in
sub-Saharan Africa: lessons learned. Clin Infect Dis. 2010;50(Suppl 3):S238�44.22. Fisher JD, Fisher WA, Cornman DH, Amico RK, Bryan A, Friedland GH.
Clinician-delivered intervention during routine clinical care reduces unpro-
tected sexual behavior among HIV-infected patients. J Acquir Immune Defic
Syndr. 2006;41(1):44�52.23. Horwood C, Haskins L, Vermaak K, Phakathi S, Subbaye R, Doherty T.
Prevention of mother to child transmission of HIV (PMTCT) programme in
KwaZulu-Natal, South Africa: an evaluation of PMTCT implementation and
integration into routine maternal, child and women’s health services. Trop Med
Int Health. 2010;15(9):992�9.24. An SJ, George AS, LeFevre AE, Mpembeni R, Mosha I, Mohan D, et al.
Supply-side dimensions and dynamics of integrating HIV testing and counsel-
ling into routine antenatal care: a facility assessment from Morogoro Region,
Tanzania. BMC Health Serv Res. 2015;15:451.
25. Bindoria SV, Devkar R, Gupta I, Ranebennur V, Saggurti N, Ramesh S, et al.
Development and pilot testing of HIV screening program integration
within public/primary health centers providing antenatal care services in
Maharashtra, India. BMC Res Notes. 2014;7:177.
26. McCleary-Sills J, Douglas Z, Mabala R. Using participatory research and
action to address the HIV-related vulnerabilities of adolescent girls in Tanzania.
International Center for Research on Women (ICRW). Washington DC, USA;
2011.
27. Voils CI, Chang YK, Crandell J, Leeman J, Sandelowski M, Maciejewski ML.
Informing the dosing of interventions in randomized trials. Contemp Clin Trials.
2012;33(6):1225�30.28. Kennedy CE, Spaulding AB, Brickley DB, Almers L, Mirjahangir J, Packel L,
et al. Linking sexual and reproductive health and HIV interventions: a
systematic review. J Int AIDS Soc. 2010;13:26.
29. Rotheram-Borus MJ, Swendeman D, Chovnick G. The past, present, and
future of HIV prevention: integrating behavioral, biomedical, and structural
intervention strategies for the next generation of HIV prevention. Annu Rev
Clin Psychol. 2009;5:143�67.30. Padian NS, Buve N, Balkus J, Serwadda D, Cates W Jr. Biomedical
interventions to prevent HIV infection: evidence, challenges, and way forward.
Lancet. 2008;372(9638):585�99. doi: http://dx.doi.org/10.1016/S0140-6736(08)60885-5
Kalibala S et al. Journal of the International AIDS Society 2016, 19(Suppl 4):20842
http://www.jiasociety.org/index.php/jias/article/view/20842 | http://dx.doi.org/10.7448/IAS.19.5.20842
69
31. Simoni JM, Pearson CR, Pantalone DW, Marks G, Crepaz N. Efficacy of
interventions in improving highly active antiretroviral therapy adherence and
HIV-1 RNA viral load: a meta-analytic review of randomized controlled trials.
J Acquir Immune Defic Syndr. 2006;43(Suppl 1): S23�35.32. Amico KR, Harman JJ, Johnson BT. Efficacy of antiretroviral therapy
adherence interventions: a research synthesis of trials, 1996 to 2004. J Acquir
Immune Defic Syndr. 2006;41(3):285�97.33. Crepaz N, Marshall KJ, Aupont LW, Jacobs ED, Mizuno Y, Kay LS, et al. The
efficacy of HIV/STI behavioral interventions for African American females in the
United States: a meta-analysis. Am J Publ Health. 2009;99(11):2069�78.34. Wyatt GE, Longshore D, Chin D, Carmona VJ, Loeb TB, Myers HF, et al. The
efficacy of an integrated risk reduction intervention for HIV-positive women
with child sexual abuse histories. AIDS Behav. 2004;8(4):453�62.35. Kegeles SM, Rebchook G, Tebbetts S, Arnold E. Facilitators and barriers to
effective scale-up of an evidence-based multilevel HIV prevention intervention.
Implement Sci. 2015;10:50.
36. Khan AA, Khan A. Performance and coverage of HIV interventions for
injection drug users: insights from triangulation of programme, field and
surveillance data from Pakistan. Int J Drug Policy. 2011;22(3):219�25.
37. Galbraith JS, Stanton B, Boekeloo B, King W, Desmond S, Howard D, et al.
Exploring implementation and fidelity of evidence-based behavioral interven-
tions for HIV prevention: lessons learned from the focus on kids diffusion case
study. Health Educ Behav. 2009;36(3):532�49.38. Wang B, Deveaux L, Knowles V, Koci V, Rolle G, Lunn S, et al. Fidelity of
implementation of an evidence-based HIV prevention program among
Bahamian sixth grade students. Prev Sci. 2015;16:110�21.39. Cunningham SD, Card JJ. Realities of replication: implementation of
evidence-based interventions for HIV prevention in real-world settings.
Implement Sci. 2014;9:5.
40. HIVCore. Routine health care service statistics: low-hanging fruit for
program evaluation? [Internet]. 2014. [cited 2014 Jul]. Available from: http://
www.hivcore.org/Pubs/HIVCoreNL_JUL2014.pdf
Kalibala S et al. Journal of the International AIDS Society 2016, 19(Suppl 4):20842
http://www.jiasociety.org/index.php/jias/article/view/20842 | http://dx.doi.org/10.7448/IAS.19.5.20842
70
AUTHOR INDEX
A
Afonso, P 45
Ahoba, I 37
Aka, D 37
Amzel, A 5
Asiah, H 23
Augusto, O 45
B
Bakanda, C 16
Behan, S 5
Bernard, JJ 45
Billy, DA 37
Birungi, J 16
Borse, NN 1, 53
Brown, C 45
Buzaalirwa, L 53
C
Cowan, J 45
D
Dali, SA 37
E
Esantsi, S 23
G
Gloyd, S 37, 45, 60, 66
Granato, SA 37
H
Haberland, N 66
Habtamu, K 30
Hassan, WM 45
Hoffman, HJ 5
I
Inguane, CA 45
J
Jamnadas, M 45
Jani, N 30, 53, 66
K
Kalibala, S 16, 30, 37, 45, 53, 60, 66
Kay, L 30, 66
Kone, A 37
Kouyate, S 37
Kyeremaa, RK 23
M
Manuel, JL 45
McClain-Nhlapo, C 23
Moono, G 23
Moore, DM 16
Mugwaneza, P 5
Mukaminega, M 5
Mutale, F 23
N
Nantume, S 16
Ndatimana, D 5
Ndwiga, C 66
Ngirabakunzi, E 23
Nyirabahizi, E 5
O
Okal, J 23, 53, 66
Okoboi, S 16, 53
Okullu, JL 16
P
Pfeiffer, J 45
Phelps, BR 5
R
Ribakare, M 5
Robinson, J 37
Rutenberg, N 1
S
Sarna, A 66
Schenk, K 23
Sharp, AR 16
Sinai, I 66
Ssali, L 16
T
Tun, W 1, 23
V
Vieira, L 45
Vu, L 30, 53
W
Wagenaar, BH 60
Waliggo, S 53
Woelk, GB 5, 60, 66
Wong, V 45
Y
Yansaneh, AI 16
Z
Zieman, B 53
71
Lessons learned and study results from HIVCore 2016
Journal of the International AIDS Society 2016, 19(Suppl 4)
Journal InformationAbout the journalThe Journal of the International AIDS Society, an official journal of the Society, provides a peer-reviewed, open access forum for essential and innovative HIV research, across all disciplines.
All articles published by the Journal of the International AIDS Society are freely accessible online. The editorial decisions are made independently by the journal’s editors-in-chief.
Email: [email protected]: http://www.jiasociety.orgeISSN: 1758-2652
PublisherInternational AIDS SocietyAvenue de France 231202 Geneva, SwitzerlandTel: +41 (0) 22 710 0800Email: [email protected]: http://www.iasociety.org
Indexing/abstractingThe Journal of the International AIDS Society is indexed in a variety of databases including PubMed, PubMed Central, MEDLINE, Science Citation Index Expanded and Google Scholar. The journal’s impact factor is 6.256 (*2015 Journal Citation Report® Science Edition - a Thomson Reuters product).
Advertising, sponsorship and donationsPlease contact the editorial office if you are interested in advertising on our journal’s website. We also gladly receive inquiries on sponsorship and donations to support open access publications from authors in low- and middle-income countries.
SupplementsThe Journal of the International AIDS Society publishes supplements, special issues and thematic series on own initiative or based on proposals by external organizations or authors. Inquiries can be sent to the editorial office at [email protected]. All articles submitted for publication in supplements are subject to peer review. Published supplements are fully searchable and freely accessible online and can also be produced in print.
DisclaimerThe authors of the articles in this supplement carry the responsibility for the content and opinions expressed therein. The editors have made every effort to ensure that no inaccurate or misleading content or statements appear in this supplement. However, in all cases, the publisher, the editors and editorial board, and employees involved accept no liability for the consequences of any inaccurate or misleading content or statement.
CopyrightThe content in this supplement is published under the Creative Commons Attribution 3.0 Unported (http:// creativecommons.org/licenses/by/3.0/) license. The license allows third parties to share the published work (copy, distribute, transmit) and to adapt it under the condition that the authors are given credit, and that in the event of reuse or distribution, the terms of this license are made clear. Authors retain the copyright of their articles, with first publication rights granted to the Journal of the International AIDS Society.
EditorsEditors-in-Chief: Susan Kippax (Australia), Papa Salif Sow (Senegal), Mark Wainberg (Canada)
Deputy Editors: Morna Cornell (South Africa)Anna Grimsrud (South Africa)Martin Holt (Australia)Kayvon Modjarrad (USA)Luis Soto-Ramirez (Mexico)Iryna Zablotska (Australia)
Managing Editor: Marlène Bras (Switzerland)
Editorial Assistant: Helen Etya’ale (Switzerland)
Editorial Board Laith J Abu-Raddad (Qatar) Joseph Amon (United States) Jintanat Ananworanich (Thailand) Judith Auerbach (United States) Françoise Barré-Sinoussi (France) Linda-Gail Bekker (South Africa) Chris Beyrer (United States) Andrew Boulle (South Africa) Carlos Cáceres (Peru) Pedro Cahn (Argentina) Elizabeth Connick (United States) Mark Cotton (South Africa) Jocelyn DeJong (Lebanon) Diana Dickinson (Botswana) Sergii Dvoriak (Ukraine) Paul Flowers (United Kingdom) Nathan Ford (South Africa) Omar Galárraga (Mexico) Beatriz Grinsztejn (Brazil) Huldrych Günthard (Switzerland) Diane Havlir (United States) Adeeba Kamarulzaman (Malaysia) Rami Kantor (United States) Sukhontha Kongsin (Thailand) Kathleen MacQueen (United States) Navid Madani (United States) Kenneth Mayer (United States) Nelly Mugo (Kenya) Paula Munderi (Uganda) Christy Newman (Australia) Richard Parker (United States) Linda Richter (South Africa) Jürgen Rockstroh (Germany) Sean Rourke (Canada) Naomi Rutenberg (United States) Gabriella Scarlatti (Italy) Mauro Schechter (Brazil) Lorraine Sherr (United Kingdom) Colette Smith (United Kingdom) Tim Spelman (Australia) Ndèye Coumba Touré-Kane (Senegal) Sten Vermund (United States) Ian Weller (United Kingdom) Alan Whiteside (Canada) David Wilson (Australia) Iryna Zablotska (Australia)

Related Documents